Underwater Helmholtz- Resonator Transducers · NUSC Technical Report 5633 Underwater...
48
NUSC Technical Report 5633 Underwater Helmholtz- Resonator Transducers: General Design Principles SRalph S. Woolleft Special Projects Department D D C 5 July 1977 D:AUG CZ26 19I 7 7' CLW NUSC ,----) NAVAL UNDERWATER SYSTEMS CENTER SNewportRhode Island * New London.Connectlcut WL- Approved for pUbitc relcase. ,lmtribu~tron tu'emited. "_ICmD
Transcript of Underwater Helmholtz- Resonator Transducers · NUSC Technical Report 5633 Underwater...
NUSC Technical Report 5633
Underwater Helmholtz-Resonator Transducers:
General Design Principles
SRalph S. WoolleftSpecial Projects Department
D D C 5 July 1977
D:AUG CZ26 19I 7 7'
CLW NUSC,----) NAVAL UNDERWATER SYSTEMS CENTERSNewportRhode Island * New London.Connectlcut
WL- Approved for pUbitc relcase. ,lmtribu~tron tu'emited.
"_ICmD
PREFACE
This study was conducted under N1JSC ProjectNo. A-720-01, "Transduction Techniques for NavySonar Transducers," Principal Investigator, C. L.LeBlanc (Code 316), and Navy Subproject and TaskNo. SF11 121 603, Program Manager, C. C. Walker(Code NAVSEA 06HI-2).
The Technical Reviewer for this report wasL. C. Maples (Code 313).
REVIEWED AND APPROVED: 5 July 1977
"so Speca pFC18ct Deab~
The author of this report is located at the New LondonLaboratory, Naval Underwater Systems Center,
New London, Connecticut 06320.
R MT KUETTMPAGE RElUAD INSRiUCT-IONS '
R OO--TO AGBEFORE COMPLETING FORM
T R-5633aUNDERWATER HELUOLTZ-RESONATOR TRANSDUCERS:,
7ENR ERAL •PESI G. RINC IhEFS, .. "I�.�--S*G--RI'C'a. LSl PERFORMING OnG. REPORT N1UN01ER
- .4 -L TRACT ORW RAo O• UNM? •CO)..Ra lph S..,Wool lett
t. PEgFORMoN4 ORGANIZATION N"AM AND AMDRESS '9. PROGRAM E.EMENT. PR0OJET. TASK
Naial Underwater Systems Center ARA Wi UoNT NUM
New London Laboratory A72001New London, CT 06320 SF11 121 603
I1. CONTROL.LING OFFICE NAME AND ADDRESS I.
Naval Sea Systems Command (06H1-2) /l S iul*:&77Washington, DC 20362 * 44
"14. MONITOINGO AGENCY NAME I AODRES$( dEarent hm CoMta*UU O00*) tI. SECUfITY CLWS. (of OiRle* Rep
UNICLASSTFIED
I19Z .SIICATIONW/OOWMGR1ASNG
LOIs. RRIT 0STATEMEN4T (.1 Mel RepwuQ
Approved for public relea elAjsazibution unlimited.
17. DISTRInUTION STATIEMET (o abetmf e la,4 In Sh- a . .. Of -VOOMM AVOW ....O)
IS. SUPLEMENTARY NOTES
It. Key WORTS (Couubue mT.. abl# e bid&eaw ME .MY S it O ba .b)
Acoustical Compliant Tubes Piezoelectric Ring StacksAcoustoelectrical Feedback Sonar TransducersHelmholtz-Resonator Transducers Very Low Frequency Sound SourcesPiezoelectric Flexural Disks
No l!-•c•,,- - "•,Z0. A"%RACT (Contbue an my9~4. able it mee"aa mEleetb byo 1lea fs"Wa
Un. erwater ilelmholtz resonators excited by piezoelectric drivers showpromise as compact sound sources for very low frequencies. Since 1969, Grovesand Henriquez of the Naval Research Laboratory have been using small sphericalshells of iiezueLLCt;ii ceramic as Iielmholtz-resonator transducers. The objectof the present study was to investigate more general configurations forHelmholtz resonators and to evolve optimum designs. Primary interest was indeveloping a new approach to generating sound at frequencies below 100 Hz,where existing capabilities were very limited.
to I 1473
%ont I d
Some of the principal avenues of development were (1) application offlexural disks to drive the resonators and comparative evaluation of diskand ring drivers, (2) introduction of compliant tubes into the compliancechamber to decrease its size, and (3) application of acoustoelectricalfeedback to broaden the response at resonance. The study was conductedusing a lumped-parameter approach and electroacoustical circuit analysis.Experiments with small-size models confirmed the general validity of thisapproach.
A design procedure for disk-driven Helmholtz resonators is outlined.A numerical example illustrating the procedure indicates that a flexuraldisk 1-meter in diameter driving a Helmholtz resonator resonant at 40 Hzshould be capable of producing a narrowband source level of 196 dB//lpPa.m.It would also be useful as a broadband source, producing 18S dB source levelover a band 37-100 Hz. The transducer would have a maximum depth capabilityof 4S0 m and a required minimum depth of 11 m to suppress internalcavitation.
i~w. .
TR 5633
TABLE OF CONTENTS
Page
LIST OF ILLUSTRATIONS ........ ..................... . . ...
INTRODUCTION ......................... .................... .. 1
OPERATING PRINCIPLES AND ANALYSIS METHODS ........ ............ 6
GENERAL DESIGN PRINCIPLES ................ .................... 9
CERAMIC DRIVER CHARACTEk1STICS ................ .17
Ring Stack ............................................. .. 17Trilaminar Disk ............... ...................... ... 20Comparison of Ring With Disk ............ ................ 21
NARROWBAND DESIGN ................ ......................... 22
BROADBAND DESIGN ...................... .. 25
EFFECTS OF TRANSDUCER SIZE ........... ................. ... 27
EFFECTS OF DEPTH REqUIREMENTS .................. ................ 30
DESIGN PROCEDURE FOR THE DISK-DRIVEN HELMHOLTZ RESONATOR .... 31
STATUS OF HELIMIOLTZ-RESONATOR INVESTIGATIONS ... ......... ... 37
FUTURE WORK ........................ .......................... 39
REFERENCES. . ................. ........................... ... 40
ACCESSIOEft of _!Nils while ,See-let
IuNAMNOUNCrD B,usI;ICIK-G , IN .. -.-.....
By--
0 iSt. A :' AIL ;AdII ^
TR 5633
LIST OF ILLUSTRATIONS
Figure Page
1 Three Approaches to Cavity Compliance ...... .......... 2
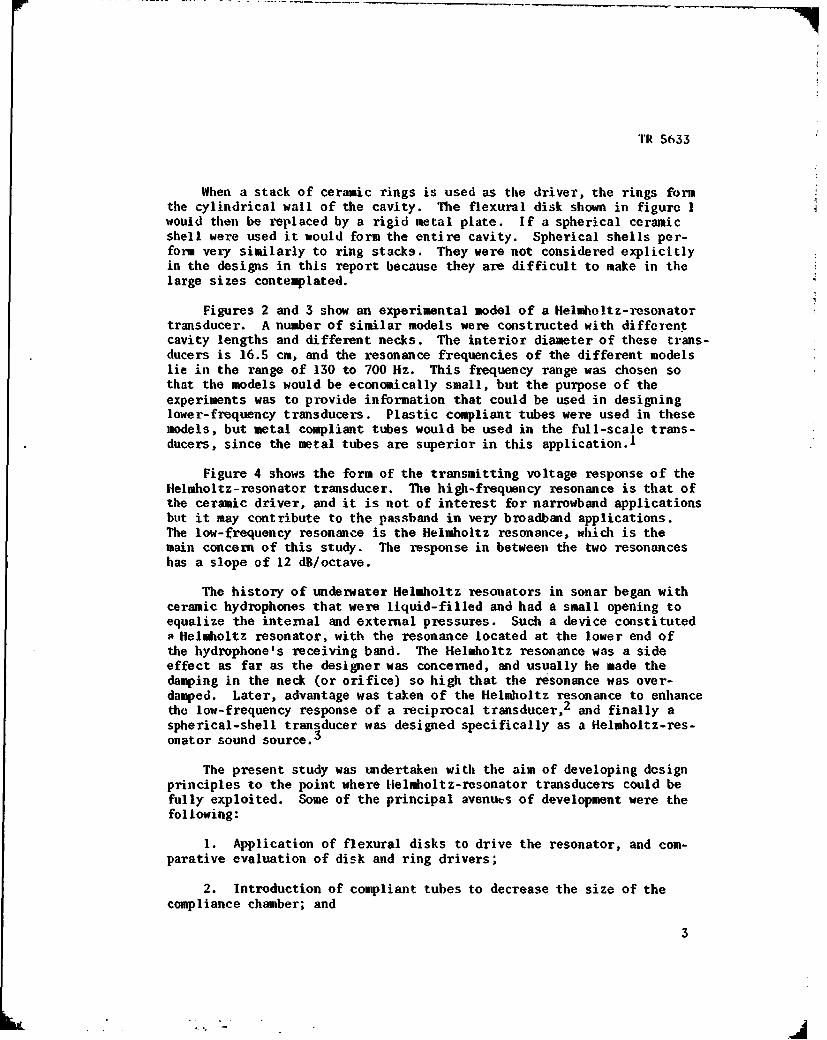
2 Helmholtz-Resonator Transducer Parts Ready for Assembly,With Compliant-Tube Pack in Foreground ............. 4
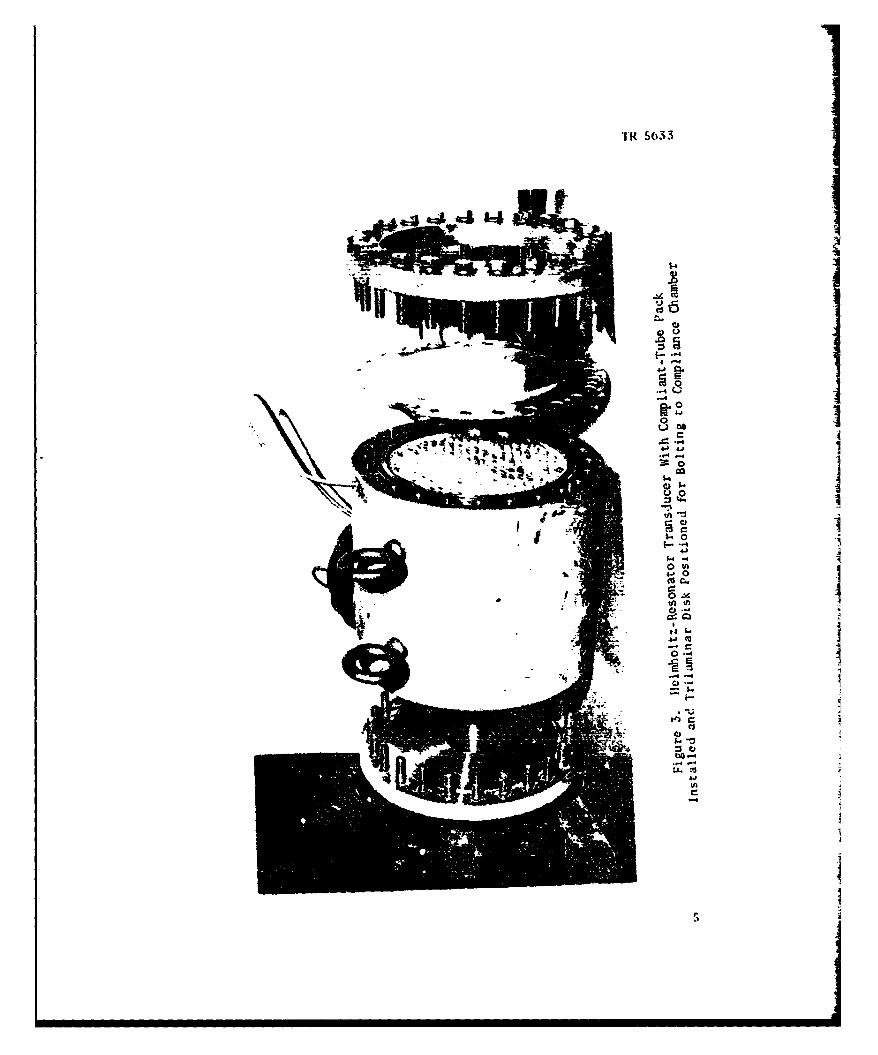
3 Helmholtz-Resonator Transducer With Compliant-Tube PackInstalled and Trilaminar Disk Positioned for Boltingto Compliance Chamber ............. ................ S
4 Transmitting Voltage Response of a Helmholtz-ResonatorTransducer ............... ...................... 6
5 Electroacoustical Circuit of the Helmholtz-ResonatorTransducer .......... ................... ...... 7
6 Source Level Curve of a Helmholtz Resonator, ShowingVoltage and Stress Limits ........... .............. 11
7 Maximum Source Level Envelope. The Broadband Power PBBIs Determined by the Level of the Curve at the Saddle,at a Frequency of About 1.4 fr ..... ............ ... 12
8 Shaping of the Source-Level Curve for Narrowband Applica-tions . ................................... ..... 14
9 Shaping of the Source-Level Curve for Broadband Applica-
tions .................. ........................ 15
10 Circuitry for Shaping the Source-Level Curve ........ ... 16
11 Piezoelectric Ceramic Drivers ........ .............. 18
12 Double-Disk Helmholtz Resonator With Radial-Flow Ports 22
13 Predicted Source Level and Stress Level for a 40 HzHelmholtz-Resonator Transducer Driven by a 1-mDisk .............. ....................... .... 36
14 Measured ind Calculated Source Levels for an ExperimentalModel .............. ........................ ... 38
ii
TR 5633
UNDERWATER HELMHOLTZ-RESONATOR TRANSDUCERS:GENERAL DESIGN PRINCIPLES
INTRODUCTION
In 1972 a study began that was directed at establishing the capabil-ities of underwater sound sources based on the Helmholtz-resoteator con-figuration. The primary interest was in developing a new approach togenerating sound at frequencies below 100 Hz, where existing capabilitieswere very limited. In this report the general principles governing thedesign of Ilelmholtz-resonator transducers will be presented. Designequations will be introduced as needed, but in order to keep attentionfocused on the physical aspects of design, the detailed derivation ofthe equations will not be included. This area will be covered in a sub-sequent report. Similarly, only a brief summary of the experimentalresults will be included. A measurement program on small-size ilelmholtz-resonator transducers has been underway for two years, and a number ofpublications will be needed to present the results obtained on the dif-ferent models.
The Helmholtz resonators in this study are excited by piezoelectricceramic drivers. The Helmholtz resonator introduces a resonance muchlower in frequency than that of the ceramic driver by itself and henceextends the useful range of piezoceramic transducers to lower frequen-cies. Although interest is primarily in the frequency range below 100Hz, the techniques explored here might be found useful at frequenciesup to 1000 11z, or more, when compact transducers are desired.
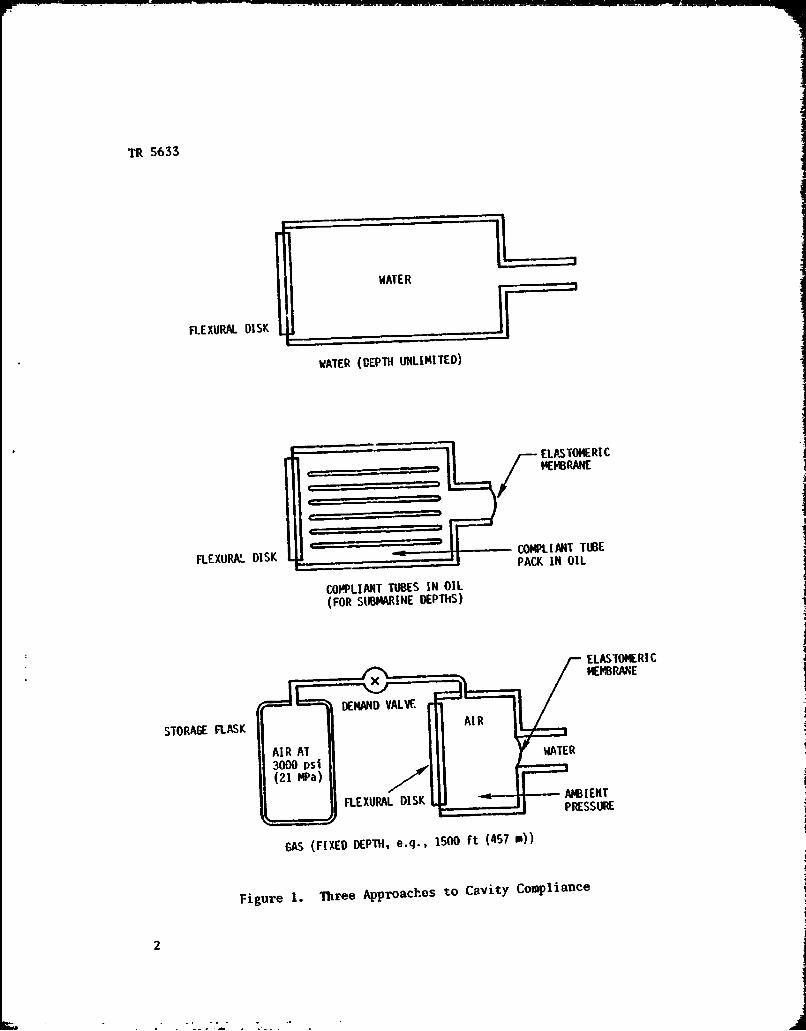
The ceramic driver can be in the form of a spherical shell, a stackof ceramic rings, or a flexural-mode disk. The cavity of the Helmholtzresonator can be filled with liquid only, liquid plus compliant tubes,or compressed gas. Figure 1 shows transducers with these three typesof compliance cavities. A flexural-disk driver is used in each case forillustrative purposes. The transducer with purely liquid fill hasunlimited depth capability. The transducer with compliant tubes issuitable for operation to depths of about 600 meters; its depth limi-tation is determined by the strength of the compliant tubes. The trans-ducer with compressed gas is limited to operation at a relatively fixeddepth since its resonance frequency varies with depth. The interiorcompressibility of the three models in figure 1 increases from one modelto the next in descending order in the figure. High compressibility isdesirable because it leads to small cavity size and, therefore, lowtransducer weight. Most of the attention in this report will be devotedto designs using compliant tubes.
TR 5633
--- IWATER
FI.EXURAL DISK
WATER (DEPTH UNLIMITED)
ELASTOMERIC________________ MEMBRANE
S: IICOMPLIANT TUBEFLEXURAL DISK .l1PACK IN OIL
COPPLIANT TUBES IN OIL(FOR SUBMARINE DEPTHS)
ELASTOMERI C
x MEMBRANE
DEMAND VALVE.
STORAGE FLASK AIR
AIR AT WATER
(21 MPa)FLEXURAL-DI- AMBIENT
FLXUAL-iK PRESSURE
GAS (FIXED DEPTH, e.q., 1500 ft (457 0))
Figure 1. Three Approaches to Cavity Compliance
2
TR s633
When a stack of ceramic rings is used as the driver, the rings formthe cylindrical wall of the cavity. The flexural disk shown in figure 1would then be replaced by a rigid metal plate. If a spherical ceramicshell were used it would form the entire cavity. Spherical shells per-form very similarly to ring stacks. They were not considered explicitlyin the designs in this report because they are difficult to make in thelarge sizes contemplated.
Figures 2 and 3 show an experimental model of a Helmholtz-resonatortransducer. A number of similar models were constructed with differentcavity lengths and different necks. The interior diameter of these trans-ducers is 16.5 cm, and the resonance frequencies of the different modelslie in the range of 130 to 700 Hz. This frequency range was chosen sothat the models would be economically small, but the purpose of theexperiments was to provide information that could be used in designinglower-frequency transducers. Plastic compliant tubes were used in thesemodels, but metal compliant tubes would be used in the full-scale trans-ducers, since the metal tubes are superior in this application. 1
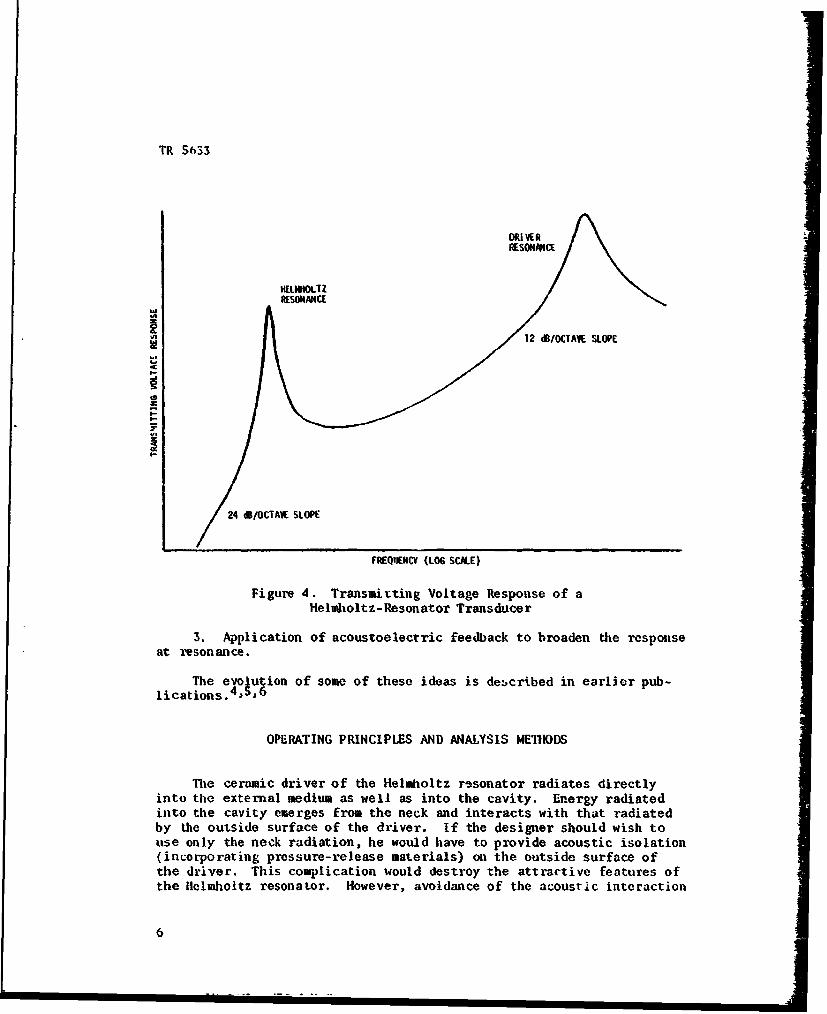
Figure 4 shows the form of the transmitting voltage response of theHelmholtz-resonator transducer. The high-frequency resonance is that ofthe ceramic driver, and it is not of interest for narrowband applicationsbut it may contribute to the passband in very broadband applications.The low-frequency resonance is the Helmholtz resonance, which is themain concern of this study. The response in between the two resonanceshas a slope of 12 dB/octave.
The history of underwater Helmholtz resonators in sonar began withceramic hydrophones that were liquid-filled and had a small opening toequalize the internal and external pressures. Such a device constituteda Helmholtz resonator, with the resonance located at the lower end ofthe hydrophone's receiving band. The Helmholtz resonance was a sideeffect as far as the designer was concerned, and usually he made thedamping in the neck (or orifice) so high that the resonance was over-damped. Later, advantage was taken of the Helmholtz resonance to enhancethe low-frequency response of a reciprocal transducer, 2 and finally aspherical-shell transducer was designed specifically as a Helmholtz-res-onator sound source. 3
The present study was undertaken with the aim of developing designprinciples to the point where Helmholtz-resonator transducers could befully exploited. Some of the principal avenuts of development were thefollowing:
1. Application of flexural disks to drive the resonator, and com-parative evaluation of disk and ring drivers;
2. Introduction of compliant tubes to decrease the size of thecompliance chamber; and
.3
TR 5b 33
S.. 0ILP
0
m4J
0..0
S..
-1
in-
U))0
Tf4 5t33
'4ý
.0
40
4-4
.0 1
TR 5633
D~iUVERIRSONANCE
HELHIOLTZRESONANCE
UN
12 dB/OCTAVE SLOPE
2 BOCTAVE SLOPE
FREQUENCY (LOG SCALE)
Figure 4. Transmitting Voltage Response of ai
I-I
Helmholt z- Resonator Transducer
3. Application of acoustoelectric feedback to broaden the responseat resontance.
The evolution of some of these ideas is described in earlier pub-lications.4,5,6
OPERATING PRINCIPLES AND ANALYSIS MElTHODS
The ceramic driver of the Helmholtz resonator radiates directlyinto the external medium as well as into the cavity. Energy radiatedinto the cavity emerges from the neck and interacts with that radiatedby the outside surface of the driver. If the designer should wish touse only the neck radiation, he would have to provide acoustic isolation(incorporating pressure-re lease materials) on the outside surface ofthe driver. This comlplication would destroy the attractive features ofthe Helmholtz resonator. However, avoidance of the acoustic interaction
6
S. . . . .• I II-I I I
TR 5633
is not necessarily a desideratum; the interaction is destructive onlybelow resonance. At resonance the two radiations sae in phase quad-rature, and the neck radiation predominates. Above resonance the two
radiations are in phase, and the neck radiation falls off rapidly withincreasing frequency. In this region the response essentially is thatwhich the driver would have if it were used in the conventional way witha pressure-release interior.
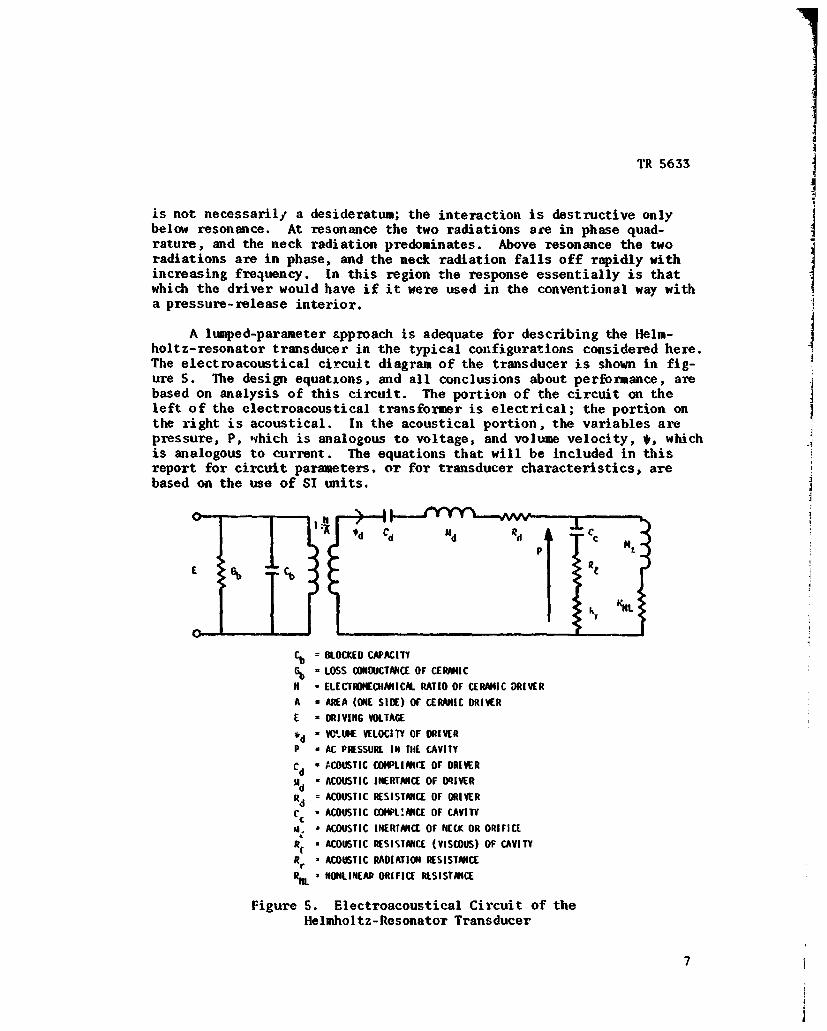
A lumped-parameter approach is adequate for describing the Helm-holtz-resonator transducer in the typical configurations considered here.The electroacoustical circuit diagram of the transducer is shown in fig-ure S. The design equations, and all conclusions about performance, are jbased on analysis of this circuit. The portion of the circuit on theleft of the electroacoustical transformer is electrical; the portion onthe right is acoustical. In the acoustical portion, the variables arepressure, P, ,which is analogous to voltage, and volume velocity, *, whichis analogous to current. The equations that will be included in thisreport for circuit parameters, or for transducer characteristics, arebased on the use of SI units.
0- #d Cd Nd Rd A TCc
> I
C Ci
0-UC. = BLOCKED CAPACIY
Gb - LOSS CONDUCTANCE OF CERAMIC
N - ELECTIROECHEICM. RATIO OF CERAMIC DRIVERA - AREA (ONE SIDE) OF CERMIC DRIVER
E - DRIVING VOLTAGE*'d . OAI VELOCITY OF DRIVER
P - AC PRESSURE IN TilE CAVITY
Cd - ACOUSTIC COWLIANrE OF DRIVER
=4d - ACOUSTIC INERTANCE OF DRIVER
Rd ACOUSTIC RESISTANCE OF DRIVERcc . ACOUSTIC COMPL!N4CE OF CAVITY
Ai, a ACOUSTIC INERTANCE OF NECK OR ORIFICE
RIt ACOUSTIC RESISTANCE (VISCOUS) OF CAVITY
Rr * ACOUSTIC RADIATION RESISTANCERil NONLINEAR ORIFICE RESISTANCE
Figure S. Electroacoustical Circuit of theHelmholtz- Resonator Transducer
7
TR 5633
In the circuit, the output power is the power dissipated in theradiation resistance Rr. Radiation is due to the net-volume velocity(#m - *d) of the transducer, and in the circuit this net-volume velocityflows through the branch containing Cc; hence, the radiation resistancebelongs in this branch. 7 Mutual radiation resistance between the neckand the outside of the driver is then automatically taken care of. Theequation for the acoustical radiation resistance is remarkably simple:
R = 2.16f 2 (1)r
where f is the frequency.
When the transducers are compact (very small compared with thewavelength), 1R will be small compared with the loss resistance RX andthe reactance I/wCc. Then the Q of the Helmholtz resonance will be con-trolled by the losses and will be very high when the losses are carefullyminimized.
The pressure, P, is the ac pressure in the cavity, and it peaks atthe resonance frequency. The internal pressure is higher than the near-field external pressure; so when cavitation occurs because of inadequatedepth, it will occur internally. Even in the absence of cavitation, thebuildup of cavity pressure at resonance must be kept under controlbecause it can go high enough to fracture the ceramic driver. The oper-ating resonance frequency depends on Cd as well as Cc and is given bythe equation
fr (2)
In describing, the ceramic driver, two properties that are indicativeof its capability are the free-volume displacement, AVf, and the blockedpressure, Pb" The relation tetween the two is given by the equation
AVf.pe.N E.C (3)AVf =PbCd A d (
The properties of the flexural-disk driver are given with sufficientaccuracy for initial design studies by available approximate formulas. 8
The final disk parameters may be obtained with refined accuracy from anexisting computer program.9, 1 0 , 1 1
The loss resistances, Rt and Rd, cannot be calculated from theory,and one of the principal aims of the experimental program was to obtaininformation on them. The neck inertance, M4t, can be calculated with fairaccuracy, but an interior-end correction is involved that is uncertainfor these designs; so this subject is being investigated experimentally.At high-driving levels a nonlinear-loss resistance will appear in serieswith Mx on the circuit diagram. Formulas for this resistance are only
8
I
TR 5633
approximate; so, again, improved information on this effect is beingsought from the experiments.
In the region of the Helmholtz resonance, the ceramic driver isstiffness controlled, and its inertance, Md, and resistance, R , may beneglected. This assumption is incorporated in the equations oN thisreport. When performance data well above resonance are required, 1 d andRd must be included in the circuit. Then the circuit computations arecarried out on the HP-9820 calculator. This calculator is very wellsuited to this problem and will plot very rapidly any response curvesthat may be desired.
GENERAL DESIGN PRINCIPLES
Given a set of performance goals, the designer's task is centeredaround choosing the optimum ceramic driver and the optimum compliancecavity for the Helmholtz resonator.
The ceramic driver operates well below its self-resonance whendriving che Helmoltz resonance, and its internal impedance reduces sim-ply to its quasi-static compliance, Cd. Tlte driver is judged primarilyby the power capability it imparts to the Helmholtz source. The chiefproperty which determines this is the volume displacement, AVf, that thedriver is able to produce in an adjoining medium in the absence of anyback pressure. To maximize this free-volume displacement, one of courseoperates the ceramic at maximum-allowable electric-field intensity,which in this study is taken to be 4 kV/cm rms.
Another property of the driver that influences power capability(but only in the resonance region) is Pmax, the maximum pressure thatthe driver can withstand safely without firacturing. This pressure isrelated through geometrical factors to the fracture stress of theceramic, T ma, which in this study is toeen to be 14 NPa (2000 psi).
The compliance chamber is characterized by its acoustic compliance,C, and its viscous loss resistance, R The compliance, Cc, increasesas the chamber volume is increased and as the packing of the chamberwith compliant tubes is increased. It also depends on the elastic prop-erties of the compliant tubes, on the stiffness of the chamber walls,and on the compressibility of the enclosed liquid. The loss resistance,R , decreases as the volume of the chamber is increased, but increasesat the tube-packing factor is increased. It depends also on the kine-matic viscosity of the enclosed liquid.
The relatiorn of the cavity compliance, Cc, to the driver compliance,Cd, is an important consideration in design; so a parameter, a, that
9
TR 5633
specifies this relation is introduced:
CdSd < .(4)Cd÷ Cc
In the designs under consideration, a is considerably less than 1.Thus the net compliance of the resonator is mainly that of the cavity.
The compliance cavity constitutes the biggest (and heaviest) sec-tion of the resonator structure. Hence, one is motivated to try toreduce its size (thereby reducing C c). Such a reduction has the follow-ing effects:
1. Raises cavity pressure, P, at resonance;
2. Increases the loss resistance;
3. Increases neck length (to maintain resonance); and
4. Increases a.
For the most part these effects are undesirable, although increas-ing a increases the electroacoustical coupling factor, which is benefi-cial. Balancing these effects against the benefits of size reductionwill constitute a considerable part of the design process. The procedurewill be illustrated in the following sections of this report.
The maximum source-level curve of the Helmholtz-resonator trans-ducer is illustrated in figure 6. Away from resonance, the source levelis limited by the maximum-allowable voltage, which for a given driverdetermines the achievable volume displacement, AVf. The equation forthe power output is
Pu 42.6f4(l - a)2 - " A f r f (5)
c k.;f ]2 r 5
Normally, a < 0.3; then the off-resonance source level is deter-mined within 3 dB as soon as the driver is chosen, since AVf is aproperty of the driver. Thus, the off-resonance source level is essen-tially established before the compliance C is chosen.
cWhen the frequency is swept through resonance, the ac pressure in
the cavity rises, and if maximum voltage is maintained the ceramic isliable to fracture as a result of excessive pressure. Therefore, thevoltage may have to be reduced in the resonance region, with a
10
I
TR 5633
MAX. STRESS, HIGH Cc
MAX. VOLTAGE
-II
C-)
0#
fr r•REQuEHCY (LOG SCALE)
Figure 6. Source Level Curve of a HelmholtzResonator, Showing Voltage and Stress Limits
corresponding reduction in source level. This source-level limit,determined by ceramic fracture, is indicated in figure 6, and is labeledmaximum stress. The equation for the stress limit lines is
P a 42.6f4 C2 P2 . (6)
max c max
The stress-limited power depends not only on the pressure limit,Pmax, of the driver, but also on the cavity compliance, C . Choice ofCc will therefore depend, among other things, on how high a source-levelrise around resonance is desired. The height of the stress-limit linerelative to the voltage-limit curve above resonance, when expressed indecibels, is 20 log [((/a)(Pmax/Pb)] (figure 7). In this expression,Pmax/Pb is the ratio of fracture pressure to the maximum electricallygenerated pressure, and is of the order of unity. The blocked pressure,Pb, is related to AVf as indicated in equation (3).
11j
TR 5633
.20 LOG --- x-
#I\ Pb I *
uJ-j -
P88•
-: I
fr 1.4 f r FREQUENCY (LOG SCALE)
Figure 7. Maximum Source-Level Envelope. The BroadbandPower PBB Is Determined by the Level of the Curve at the
Saddle, at a Frequency of About 1.4 fr
The dependence of the cavity pressure on C is evident from inspec-tion of the right-hand portion of the circuit iA figure 5. For a givenpower output (given volume velocity through Rr), a rise in cavity pres-sure, P, will occur when C is decreased; that is, when the impedancelevel of the parallel resonant circuit is raised. But C must be keptlarge enough so that the cavity pressure remains safely Below the ceramicfracture pressure, Pmax" Internal cavitation also limits the allowablecavity pressure. In a shallow-depth transducer, this limit may bereached before the fracture limit, in which case the choice of C wouldbe based on keeping P below the cavitation level.
12
TR 5633
When both the voltage limit and the stress limit are taken intoaccount, the result is a maximum source-level envelope, as shown infigure 7. Any desired response curve can be synthesized, by means ofshaping filters or feedback networks, as long as it remains within theconfines of this envelope. Figure 8 shows such a shaped source-levelcurve for narrowband operation, and figure 9 shows a shaped source-levelcurve for broadband operation. It is assumed that a more than adequateresonance rise is available to fill out the chosen envelope, whichrequires that both Rr and Rt be sufficiently low. It is preferable toomit damping in computing the source-level envelope, but to include itwhen computing the shaped-response curves. Figure 10 indicates circuitrythat could be used to achieve maximum control over the response shape.
In the narrowband case, good efficiency becomes a possibility andhence is normally desired. Note that the term "good efficiency" is rela-tive. Even a few percent efficiency may be considered good in a trans-ducer whose dimensions are less than 1/50 of a wavelength. With carefulattention devoted to minimizing losses, resonator Q's 1,f the order of100 may be achieved in favorable circumstances. While the high Q's areimportant for efficiency, they tend to make the bandwidth too narrow.This would be true even for single-frequency operation, since slightdrifting of the resonance frequency (due, for instance, to temperaturechange) must be expected. This problem can be overcome by use ofacoustoelectrical feedback.
The fed-back signal is derived from a hydrophone that may be eitherinside the compliance cavity or mounted on the outside of the transducerstructure. The phase of the hydrophone signal is adjusted for negativefeedback at resonance, and the signal is then mixed with the input tothe driving amplifier, as shown in figure 10. The negative feedbackeffectively damps the resonance but does not add any real losses andhence does not affect the efficiency. In figure 8, the effective Q hasbeen brought down to about 15 by the acoustoelectrical feedback, and thetransducer has been designed so that the resulting response curve fillsout the maximum source-level envelope to good advantage.
Suppose that the response peak is still considered to be too sharp,even with the Q reduced to 15. The negative feedback could be increa:•,dto reduce t!.e effective Q further, say to 10. This would give a flatterpeak, but would also lower the level of the peak. The driving voltagecould then be increased to bring the response at resonance again up tothe stre.s-limit line, and about 5 percent bandwidth would be availableinside the maximum source-level envelope. All of the response curveexcept for this 5 percent portion would lie outside of the maximumsource-level envelope, because of the raised voltage. Hence, to protectthe transducer from overvoltage, the signal frequency would have to beconfined carefully to the S percent passband region. This requiredcontrol over the signal should be feasible in a narrowband system.
13
i L
I
TR S633
U-cl 0 fn
zNaI
'1) LI: I'I- 4--- 40
ool
-- I-- t* 3: a
I.-: RU~ ýic .
n ~ w R, es°•
1.4
LL.
14
TR 5633
-"'
ILI-4ý4
N \N
.-4
0
LI) 0%-two
Z .0
.01
33.3
15
'4-
13A31 Th3flOS
- - -- - - - - - - -
TR 5633
'• • HIELHOWTZ-
INPT SHING POWER INNETWORK N4PLIFI R RES UMMTOR OTU
11Y1FEEDBACK(
NETWfORK NLI F
Figure 10. Circuitry for Shaping theSource-Level Curve
For intermediate bandwidth, say 20 percent, the procedure would besimilar. One would lower the effective Q with feedback to around 4,
.* and in this case the transducer would be designed to have a lower stress-* limit line, since a high narrow top in the source-level envelope could* not be utilized.
The rising response above resonance, shown in figure 4, is a poten-tial source of trouble. If the signal from the power amplifier containsany harmonics, or other high-frequency distortion products, they willbe greatly emphasized in the transducer output because of this risingresponse. If the acoustoelectrical feedback could be usod to pull downthis rising response, in addition to accomplishing its primary functionof damping the Hlelmholtz resonance, this would be desirable. However,the phase margin required for stability cannot be maintained over thisrising response region, so this acoustic feedback approach fails.Instead, one could add a feedback loop just over the power amplifier,as shown in figure 10. This would be used to produce a rapid fall-offin the power amplifier's response, which would overcome the risingresponse of the transducer. The expectation is that the negative feed-back in this loop would suppress amplifier distortion to the point whereit would no longer be a problem.
16
i
TR 5633
The remaining network, shown in figure 10 to the left of the sum-ming point, would be used for final tailoring of the system's response.Since it is outside the feedback loops, its phase shift causes no prob-lems and hence the network could be designed for a rather elaborateshaping function.
In the broadband case, depicted in figure 9, the effective Q canbe low (e.g., 4) without destroying the benefits of resonance. Thesebenefits include a boost in the source level at the low end (fl) ofabout 12 dB over the source level that the ceramic driver could produceif the Helmholtz neck were plugged. An alternate way of describing thebenefit of the resonance is to say that the low-frequency response isextended about an octave. Since the resonance rise is low, the stress-limit line can be set quite low, and this means that the cavity compli-ance, Cc, can be low. The crucial problem in the design is to obtainthe required output at the lower cutoff frequency, fl. The requirementsat this frequency determine the size of the ceramic driver.
The effective Q of the resonance can be brought down by acousto-electrical feedback as in the narrowband case. However, since theefficiency over the broadband is bound to be low, little would be lostby allowing high dissipative damping of the resonance, and the feedbackapproach might not be needed. Flattening of the response above reso-nance could best be done by introducing a 12 dB/octave falloff in theoutput of the power amplifier, by means of its local feedback loop.
CERAMIC DRIVER CHARACTERISTICS
The two types of drivers under consideration are shown in figure11. They are the stack of segmented ceramic rings, and the trilaminarflexural disk. The capabilities of the rings are simpler to describethan those of the disk. However, the disk is usually more advantageousin meeting typical design objectives. PXT-4 ceramic will be used inboth drivers.
RING STACK
The free volume displacement is
AV f = 1.81 X 10⁻⁹a2tE 3 , (7)
where E3 = 4 x 10⁵ V/M.
17
TR 5633
a = MEAN RADIUSb - WALL THICKNESS
= LENGTH
CEA11 R---INGS OUINCERMICLAYERS
a = DISK RADIUSh = TOTAL THICKNESS
Figure 11. Piezoelectric Ceramic Drivers
18
TR 5633
The maximum cavity pressure is
p = k T (8)max a max
where the ceramic stress limit Tmax = 2000 psi (1.4 x 10⁷ Pa).
Other parameters of interest are the acoustical compliance,
C =9.73 x 10 a21 (9)
d b
and the ratio of fracture pressure to blocked pressure,
Pmax/Pb = 1.31 , (10)
which is fixed by the chosen values of E3 and Tmax given above.
The free-volume displacement, and thus the power, depends only onthe envelope volume, wa2t, of the ring stack, not on its aspect ratio,t/a, or wal. thickness, b. The fracture pressure, Pmax, is determinedby the wall thickness; thus it may be specified independently of AVf.However, it is not practical to choose the wall thickness solely on thebasis of the desiredbPmax. To avoid unacceptable fragility it is prob-ably necessary that k > 1/10; then P > 1.4 MPa.
a ms"To make full use of the high-strength capability of the rings would
require:
1. Deep operation (at least 140 m) to avoid cavitation at anacoustic pressure equal to Pmax;
2. Operation high on the resonance curve, which means narrow band-width; and
3. Small cavity compliance, C , which has some undesirable effects,as listed in General Design Principles.
A minor inconvenience sometimes encountered is that the volumerequired for C may be less than the available volume inside the ringstack, which is approximately va 2t. In such a case, the volume of the-ransducer is not used to best advantage.
The technology for making large segmented-ceramic rings is welldeveloped. Rings up to 2 meters in diameter have been constructed inthe past. 1 2
19
TR 5633
TRILAMINAR DISK
If the three layers of the disk are of equal thickness (a commoncondition), the free-volume displacement is
AVf = 1.94 x 10⁻¹⁰(t)a3E 3 (11)
where E 3 - 4 x 10⁵ V/rn.
The maximum cavity pressure is
ao. 8(!1.Pmax = 0 )TMax , (12,
with Tax = 2000 psi (1.4 x 10⁷ Pa).
The acoustical compliance is
C d = 1.38 X 10-(.)a (13)
The chosen values of E3 and Tmax determine the ratio
Pmax/Pb = 1.40 . (14)
The two parameters OVf and Pmax are no longer independent as theywere for the ring; both depend on the thickness-to-radius ratio, h/a.For constant h/a, the output power goes up as the 6th power of the diskdiameter, as may be seen from equationq (5) and (11). Hence, primaryemphasis is always on using as large a disk as possible. Equation (11)
t h -2also shows that the power is proportional to . In other words, thethinner the disk the more volume displacement il will produce at maximumdriving field, E3. However, the thin disk has low strei-th, as shown byequation (12). Therefore, a compromise must be struck between the con-flicting requirements of AVf and Piax-
The practical range for the thickness-to-radius ratio is judged tocover
from h/a - 0.05, with Pmax = 0.028 MPa (4.1 psi):
to h/a = 0.3, with Prax = 1.02 Wa (14S psi)
20
TR 5633
The largest trilaminar disks built to date have been under O.S min diameter. However, there is no technological barrier limiting themto that size. In looking for a practical size limit, one may startwith the limitation that the ceramic plates used (in the manner oftiles) to constrmict the ceramic layers of the trilaminar disk are avail-able in thicknesses only up to 2 cm. Tihis is a basic limitation of theceramic art to date. Pieces of greater thickness cannot be effectivelypoled. Also, thicker ceramic might lead to problems with high voltage;even with 2 cm plates the maximm transducer voltage will have reached8000 Vrms. The ceramic layers must constitute a sizeable fraction ofthe total thickpess, h. Therefore, with 4 cm of the thickness devotedto ceraaic, a maximum value of h of about 12 cm might be appropriate.Then if h/a were chosen to be 0.15, the disk diameter would be 1.6 m.Such a disk seems technologically feasible, but cost experience islacking.
Since limits on disk diameter can be foreseen, the possibility ofusing a number of disk drivers in a single Helmholtz resonator shouldbe considered. Practical configurations appear to be limited to twodisks. Such a double-disk Helmholtz resonator is sketched in figure12. A number of radial necks are used, and they have been placed
RADIAL-FLOWORIFICE
RI g, Ij I, . . .
DRIVING INTERIOR DRIVINGDISK /NECKS DISK
I - -- _I, -
RADIAL- .OW-"
ORIFICE
Figure 12. Double-Disk Helmholtz ResonatorWith Radial-Flow Ports
21
"TR 5633
inside the cavity in order to keep down the overall diameter of thetransducer. Doubling the number of disks will give twice the volumedisplacement, or four times the power. The double-disk transducer isequivalent to a single-disk transducer whose diameter is 21/3, or 1.26times, greater.
COMPARISON OF RING WITH DISK
Since the primary function of the driver is to produce volume dis-placement, the ring and disk capabilities should be compared on thatbasis. The discussion above shows that disk drivers appear to bestadvantage in large-diameter squat resonators. The performance of ringdrivers, on the other hand, is indifferent to resonator shape. If theresonator were constrained by available space to be a long small-diam-eter cylinder, the ring driver would probably be preferable.
When there are no constraints on resonator shape, a meaningfulcomparison can be obtained by letting each driver have the same radia-ting area and the same diameter (2a). From equations (7) and (11), itcan be determined chat if h/a < 0.21 (thin disks) the disk will havethe greater volume displacement, but if h/a > 0.21 the ring stack willhave the greater volume displacement. Thus, when the design calls foruse of a thick disk, consideration should be given to using ringsinstead. But thick disks or rings will be called for only if theresonator is designed for high ac cavity pressure. For the disk withh/a = 0.21, Pmax = 0.50 tWa. If the ring driver is used instead, Pmaxwill jump to about 1.4 W4a. Such high cavity pressures are usually notdesired because of the large operating depths required to suppresscavitation. Hence thin large-diameter disks are usually the preferreddrivers.
NARROWBAND DESIG
The desired source-level envelope (figure 7) for this case willhave 5 percent bandwidth at the top of the truncated resonance curve.This condition is imposed because it is believed that trying to workwith bandwidths less than 5 percent would be unwise, since slight driftin the resonance frequency is to be expected. Specifying this featureof the source-level envelope determines a value for the complianceratio, a, if the type of driver also has been specified (detetminingPmax/Pb). For a disk driver and the 5 percent envelope top, a = 0.072.This value appears satisfactory. The factor (1 - 0)2 in equation (5)will be 0.86, indicating close to ideal power capacity. The electro-acoustical coupling factor will be low but not disastrously so. It isgiven by the equation
22
TR 5633
k =V kd = 0.1 (15)
where kd is the electromechanical coupling factor of the disk operatingalone.
The remaining design considerations will be dominated by the desireto obtain good efficiency over the narrow band. The electroacousticalcircuit in figure 5 shows three dissipative elements: Co Rd, and R1.In addition there are the nonlinear losses associated with high-velocityflow through the resonator neck. The conductance Gb represents dielec-tric loss in the ceramic, and it cannot be reduced, but its effect or.the efficiency is low if the coupling factor k is reasonably high. Theresistance Rd, which is associated with the driver, represents lossesin the potting compound or other waterproofing materials that may beused. Minimization of these losses is done by borrowing current artfrom other trapsducer developments.
The viscous loss in the cavity, represented by Rt, is a major con-tributor to low efficiency, so its minimization has to be consideredcarefully. The relation between Rt and the Q of the cavity, Qt, is
1
-(I - 1)wCQ (16)
Obviously a high Qt is desired, but equation (16) shows that Rtalso can be reduced by making the cavity compliance Cc large. For highQt (low-loss cavity), one should use a liquid of low viscosity, makesure that it is well degassed, and keep the packing factor (of complianttubes) low. Once the packing factor and liquid have been chosen, QZ ata given frequency is assumed to become independent of cavity volume (anintensive parameter). When the next step in reducing R1, namelyincreasing the cavity volume to increase Cc, is undertaken, Qt remainsconstant in equation (16).
Water is satisfactory as the cavity liquid and has been used inthe models to date. Its corrosive tendency is a disadvantaIe- so,other liquids of equally low kinematic viscosity (about 10 m /s, or 1centistoke) will be tried. No mathematical method for calculating Qtfor a given liquid and tube pack has been found; so, this informationis being obtained by experiment. Measurement of the resonator Q doesnot give Ot directly, as the result contains a contribution from Rd aswell as from R * The present methods for separating these losses arecrude but hopefully will be improved. In designing for respectableefficiency, one starts with a reasonably low packing factor (e.g. 20percent). Then, using the empirically determined Qt for that packing
23
TR 5633
factor, the value of Cc required to meet the efficiency objective canbe calculated from equation (16). This result, in turn, determines thecavity volume.
The cavity compliance called for by this procedure usually turnsout to be relatively large. This implies that the ac cavity pressurewill be low, and that ring drivers cannot be used advantageously. Theremaining design discussion will be predicated on the use of a diskdriver. Because Pmax and OVf are not independent for the disk, designchanges to increase the efficiency also will affect the power capabil-ity. Specifically, if Cc is increased to reduce RZ , the ac cavitypressure will go down. Thon the disk should be made thinner (lowerh/a) in order to maintain an optimum S percent bandwidth design (main-tain a = 0.072). A thinner disk has increased AVf, so the power willgo up. Eveiything is now better except that the cavity is larger, andits size may well be the controlling constraint. In following thisprocedure one may encounter the practical lower limit on thickness(h/a = 0.05). Any further increases in Cc would have to be made with-out the accompanying disk optimization (i.e., Pmax would remain largerthan necessary). Another limit on increasing Cc comes about becausea lower Mt is required to maintain resonance, and Mt cannot be madeindefinitely small. Even after the neck length has been reduced tozero, substantial inertance remains, associated with the orifice alone.
As Cc is increased to reduce Rt, the deleterious effect of thepotting resistance Rd on efficiency will increase, and this sets stillanother limit on how far the increase in Cc should be carried. Anoptimization procedure, taking all the factors that have been describedinto account, readily can be accomplished on the calculator mathemati-cal model. Tle basic problem is not computational, but rather thephysical problem of finding valid mathematical expressions, empiricalor otherwise, for Rd and RZ which give their dependence on frequency,material properties, and relevant geometries.
in addition to controlling the losses in Rd and Rt, the designermust control the nonlinear losses originating in the neck. Besides itsadverse effect on efficiency, the nonlinearity will cause distortionand a tendency towards saturation (nonproportional response) in theoutput. The latter two effects presumably could be alleviated byacoustoelectric feedback, if the feedback hydrophone is mounted outsidethe cavity. However, the distortion is small even without this remedy.
A semiempirical formula for neck resistance is available.1 3 It
can be expressed asRN p (17)
24
I
TR 5633
where
P is the output power,
p is the liquid density,
Wr is the qngular resonance frequency, and
An is the cross-sectional area of the neck.
In the circuit of figure 5 this resistance is inserted in serieswith Mt. The numerical factor in this equation is subject to adjust-ment as experience is gained. It is expected that the factor will berelatable to such neck properties as aspect ratio and corner sharpness.
Clearly a wide neck (large Am) is needed to.keep RNL low. How-ever, as the neck is made wider, it must also be made longer to main-tain the inertance Mt at the value required for resonance. Once morethe conclusion is reached that low loss requires large size (thoughthe neck is not as space-consuming as the cavity). A high cavity com-pliance, Cc, which is desirable for high efficiency as discussedearlier, also helps here. As Cc is increased, a lower M, will berequired for resonance and a shorter neck will suffice. Multiplenecks, such as indicated in figure 12, do not change the situation asfar as nonlinearities go. T'he net resistance, RNL, for a set of necksacoustically in parallel is the same as for a single neck with the samenet inertance, the same total area, and the same total power flow.
BROADBAND DESIGN
When multi-octave bandwidth is required, as illustrated in figure9, the Q of the resonance can be low (e.g., 4), and little benefitwould accrue from having good efficiency at resonance. Hence, the pro-cedures described in the previous section for minimizing losses arenot of prime importance here.
The electrical input to the transducer over the broadband ismainly reactive power, and the required size and rating of the drivingamplifier is determined by this reactive power rather than by the realpower. Only near resonance can the real power be comparable to thereactive power; hence maximizing efficiency, which minivizes realpower, is of little benefit when the band as a whole is considered. Afigure of merit to replace efficiency in the broadband case is the ratioof output power (real) to reactive input power.
25
TR 5633
In forming an expression for this ratio, the approximation will bemade that the electrical reactance is simply that of the free capaci-tance, Cf. This approximation is good, except at resonance, and eventhere is not bad when the resonance is highly damped. The reactivepower is then hWCfE2 , where E is the ac driving voltage, and the objec-tive is to maximize
v-fEZ ,1 or w C(l - m)
For simplicity, the compliance ratio is considered to be chosen(with a << 1). Then. at any given frequency the problem is ro maximize
(,&Vf) 2
dd
The coupling factor kd is for the driver alone, and it has theapproximate values of 0.4 for the disk and 0.7 for the ring.
Maximizing equation (18) calls for high driver compliance, Cd, andthis means making the driver as thin as possible, whether it be a diskor a ring. However, the disk basically is capable of being much morecompliant than the ring. To establish a quantitative basis for com-parison of the two types of drivers, it seems best to let their volumedisplacements, (AVf), be equal. That is, set the right-hand side ofequation (7) equal to that of equation (11). This condition impo§es ageometrical relation between the two drivers, namely alt = O.107aa(ad/h),where ar is the radius of the ring and ad is the radius of the disk.When this relation is combined with equations (9) and (13), the compari-son between the disk and the ring, on the basis of equation (18), maybe formulated as
(KdCd) disk =0 .43 (adLh)2 (19)(kdCd) ring = .5(at/b) 19
If the ring and the disk are both made as thin as practical (b/arf 0.1, h/ad = 0.5), equation (19) shows that the disk is better by afactor of 17. If the disk is made thicker but the ring is kept unchanged(b/ar = 0.1), the disk will lose its superiority when h/ad = 0.21.
Once again the thin disk appears to be better than the ring. Thelimits on how thLn a disk can be used are the practical limit (h/a =0.05) and the need to keep a from becoming too high. High a will reducethe power, as shown by equation (5); keeping a < 0.3 seems like areasonable goal. To keep a low for a thin disk requires large Cc and
26
TR S633
therefore a big compliance cavity.
The conclusions for the broadband case are similar qualitativelyto those for the narrowband case. They are (1) use a disk driver ratherthan a ring, (2) make the disk thin, and (3) provide a large compliancecavity for best performance. Quantitatively the designs for these twocases will be different because of the difference in performance empha-sis and because the limiting physical phenomena are different.
EFFECTS OF TRANSDUCER SIZE
The elementary theory of a Hlelmholtz resonator yields a formula
for resonance frequency, wy =,1/ci • but does not determine what thesize of the resonator will be. According to this formula, the resona-tor could be made indefinitely small by using a small cavity (small Cc)and a very narrow neck (large M9 .), with the product CcM? kept :onstant.However, as soon as the resonator is made into a transducer that mustdeliver significant power, size becomes all-important. As shown in theprevious sections, high power requires large size, and low losses (bothlinear and nonlinear) do likewise. Moreover, performance (at a givenfrequency) improves rapidly with size.
A transducer parameter which is size-dependent and is an indicator(inverse) of potential performance is the lossless Q. With no internallosses in the transducer, this Q is determined solely by the radiationresistance. Its formula is
0.0738=(1- - ct~ (20)
The lower the value of Qo, the better will be the expected perfor-mance. In particular, the transducer efficiency will be less sensitiveto internal loss when Qo is low. To put this statement into quantita-tive form an acoustic efficiency, na, may be defined:
- Rr Q1(21)
Z- r r Q + Qo
which shows the benefits of low Qo. While na is but one factor in theoverall efficiency, it is often the most important factor.
Equation (20) shows that high Cc is required to achieve low Qo.Normally, high Cc implies large volume; a large-volume transducer would
27
TR 5633
have a large ceramic driver (high AVf) and hence high power. Thus lowQo is usually associated with transducers that are relatively large interms of wavelength and have good power capability as well as goodefficiency.
When the transducer size is changed in a design study, a should bekept constant in order to keep the shape of the source-level envelopeunchanged. Thus, if the driver size is increased, leading to anincrease in Cd, the cavity compliance Cc must be increased proportion-ally with Cd, leading to an increase in cavity volume.
The quantitative relation between transducer size and power isrevealed readily from consideration of the ring-driven transducer.Since the free-voli.me displacement AVf depends on the envelope volumeof the ring stack (equation (7)), and since power is proportional to(aVf) 2 , the output power is proportional to the square of the trans-ducer volume (on the assumption that the overall volume is mainly thatof the ring stack, or is proportional to the latter volume).
For a similar examination of the disk-driven transducer, it isconvenient to hold h/a constant and consider increasing the diameter2a. Then to keep a constant requires that the length of the cavitybe made proportional to a. Both the transducex volume and AVf (equa-tion (11)) will be proportional to a 3 , and thus proportional to eachother. Power, being proportional to (AVf) 2 , will be proportional tothe square of the volume. The scaling principle is thus the same asfor the ring-driven transducer.
Additional assumptions that seem reasonable are: (1) transducerweight is proportional to volume; and (2) cavity compliance Cc is pro-portional to volume. Then the scaling laws that apply when thefrequency and a are kept constant can be summarized as
Power: P - (volume) 2
Power/weight: W/kg- volume
Lossless-Q: Qo - I/volume
An upper limit on Cc exists. As Cc is made large, M, must be madesmall to maintain resonance, and geometric constraints are encounteredin reducing M . The equation for M is
1 + ) , (22)1 Wa T• Oii +nn w w
n
where
28
TR 5633
an is the radius of the neck,
En is the length of the neck,
Li is the interior end correction for the neck, and
Zw is the exterior end correction.
The densities pi, Pn, Pw are for the fluids in the interior cavity,neck, and exterior medium, respectively. To achieve the lowest possibleM£, Ln would be made zero, but a residual effective neck length, Li +tL, would remain. The neck diameter, 2 an, would be made as large aspossible, but a limit would be reached when it became equal to thechamber diameter, 2a. Use of radial-flow ports (as in figure 12),would perhaps permit Muo to be reduced by a further factor of 2. For aringstack driver, use of ports at both ends could effect a similar
reduction in Mi.
It is also instructive to consider the effects of changing thefrequency of a design. As an example, let the resonance frequency bechanged from 20 Hz to 60 Hz; a will be kept constant. Two possibleapproaches to this problem are
1. Linear scaling - dimensions proportional to wavelength. Thelinear size of the transducer would be decreased by a factor of 3, butthe power would be reduced by a factor of 9. Qo would be invariant.
2. Constant size - resonance raised by decreasing the neck iner-tance. The power would be increased by a factor of 81. Qo would bereduced by a factor of 27.
The second approach clearly demonstrates the benefits obtainableby increasing the ratio of transducer dimensions to wavelength (e.g.,increasing 2a/X, with 2a being constant in this case).
For disk-driven transducers resonant well below 100 Hz, Qo istypically in the range 100 to 1000. However, at frequencies approach-ing or exceeding 100 Hz, it may be feasible to achieve much lowervalues of %o if the designer strives for a large dimension-to-wavelengthratio. When Qo falls below about 30, the design procedures describedso far have to be modified. In those procedures it was assumed thatthe transducer Q (which is always lower than Qo) would be so high thatit would be no limitation in synthesizing a response curve to fill outthe source-level envelope shown in figure 6. However, when Qo is low,the rise in response at resonance can no longer be set at the designer'spreferred level by electroacoustical feedback, but rather is determinedby the transducer Q.
29
I'
TR 5633
In the low-Q% case, optimum design calls for P = Pmax at resonance,as it did in the previous cases. The stress-limit line in figure 5 is Ithus set to be tangent to the peak of the resonance curve. Now, how-ever, when the transducer dimensions are varied, the stress-limit linemust be moved up and down to maintain tangency; that is, a no longer Iis held constant. Instead of the bandwidth being chosen arbitrarily
as in the previous procedures, it now has a lower limit determined byQ. The modifications to the design procedures for this case are rela-tively straightforward. The efficiency is markedly improved when Q0is low, and in general the performance is free of many of the inferiorqualities that are normally associated with true VLF transducers.
In the higher frequency designs, the self-resonance frequency ofthe disk tends to be relatively close to the lielmholtz-resonancefrequency. The transducer then becomes categorized as a coupled-reso-nance system and is in fact the underwater equivalent of the bass-reflex loudspeaker. Proper exploitation of the coupled resonancepossibly could lead to broad bandwidth at good efficiency.
rhe considerations, above, of higher frequency designs lead tothe conclusion that Helmholtz-resonator transducers can have advantagesat frequencies well above 100 Hz as well as at the lower frequencies.However, the emphasis in this project to date is on transducers forfrequencies below 100 Hz.
EFFECTS OF DEPTH REQUIREMENTS
Compliant tubes that are designed for large depths are less com-pressible than those designed for shallow depths. In fact, the com-pressibility is roughly inversely proportional to design depth.Consequently the deep transducer will require a larger compliancecavity to realize the specified Cc.
The tendency is thus for the transducer to become larger as thedepth requirement is increased. For depths of more than a thousandmeters the compliant tubes would be omitted and the cavity filledwith liquid only. The required cavity size would then be very large.The cavity walls would have to be made thicker in order for theirstiffness to remain high relative to the stiffness of the liquidinterior. Hence, very deep transducers are inevitably large and heavy.
For transducers that are to be operated at fixed depth, the cavitycould be filled with pressure-equalized gas in place of the liquid andcompliant tubes. The cavity would then be much smaller for the sameCc and would also have low losses. The saving in transducer size would
30
TR 5633
be partially offset by the auxiliary gas storage bottles that would berequired.
DESIGN PROCEDURE FOR THE DISK-DRIVEN HELMHOLTZ RESONATOR
In this section a detailed design procedure will be presented,based on the general principles discussed above. Since the flexuraldisk is usually the preferred driver, its use will be assumed.
It is convenient to choose the neck inertance as one of the pri-mary design variables because it has a strong influence on the perfor-mance that can be achieved. In most cases, minimizing the inertanceleads to the highest power output. An inertance ratio, K., is definedas follows:
K EM 1 actual inertance- p•/2a e full-orifice inertance (23)
Full-orifice inertance means the inertance which obtains when thelength of the neck is reduced to zero and the diameter is expandeduntil it equals that of the compliance chamber, 2a. The cavity liquidassociated with this reference orifice is taken to be water. Toevaluate this inertance from equation (22), it will be assumed thatthe combined end corrections are represented approximately by:
II + Lw = O.5%an , (24)
which is slightly less than twice Rayleigh's end correction for aflanged pipe radiating from one end. Then, with Ln 0 and an = 0,equation (22) reduces to Pw/ 2 a, the expression used in equation (23).In designing necks to realize the actual inertance, Mt, it is plannedto use end corrections that are being obtained from the experimentalprogram. In the interim, equation (24) will serve as a useful firstapproximation for this purpose, as well as for defining the referenceinertance above.
Another ratio that will be found convenient is the compressibilityratio for the cavity, y.
cavity compressibility (I - FPc2 (25)liquid compressibility Fpk) Ppk ,
with
31
TR S633
pc 2 tube compressibility8 liquid compressibility
where pc 2 is the bulk stiffness modulus of the interior liquid, B is theeffective bulk stiffness modulus of the compliant tubes, and Fpk is thepacking factor, which is the fraction of the cavity volume occupied bythe tubes.
The cavity compliance is then,
C Vc (26)
where Vc - va 2 tc is the volume of the cavity.
The design process invariably requires iteration in order toachieve a suitable compromise among all the conflicting requirements.Normally the resonance frequency, required bandwidth, and maximum opera-ting depth are specified. In the procedure presented here, these dataare taken as basic and the disk diameter is chosen as the starting pointfor the design. The power and weight are left open, but will be broughtinto line with requirements, to the extent possible, by iteration ofthe design.
The procedure involves the following steps:
1. Choose y (equation 25). The depth requirement determines thetube compressibility, which is determined by the ratio pc 2 /B. Thepacking factor should be high to keep the cavity size down, but it islimited by the need to keep the viscous losses, RI, from becomingexcessive.
2. Choose a, which is chosen to make the stress limit consistentwith the desired bandwidth (see figure 7). Suitable choices are: 5 per-cent BW, a = 0.072; and, broadband a = 0.20.
3. Choose K.. Geometrical constraints require Km > 1 (unlessradial-flow ports are used). For maximum power, K, shcutld not exceedunity by any greater margin than is required to keep the cavity length,Ic, within acceptable bounds. The cavity length is found from thefollowing equation, which gives the ratio of cavity length to diameter:
Le 1. 817 x 104 (1 - a) (72a a2frYKm
32
TR S633
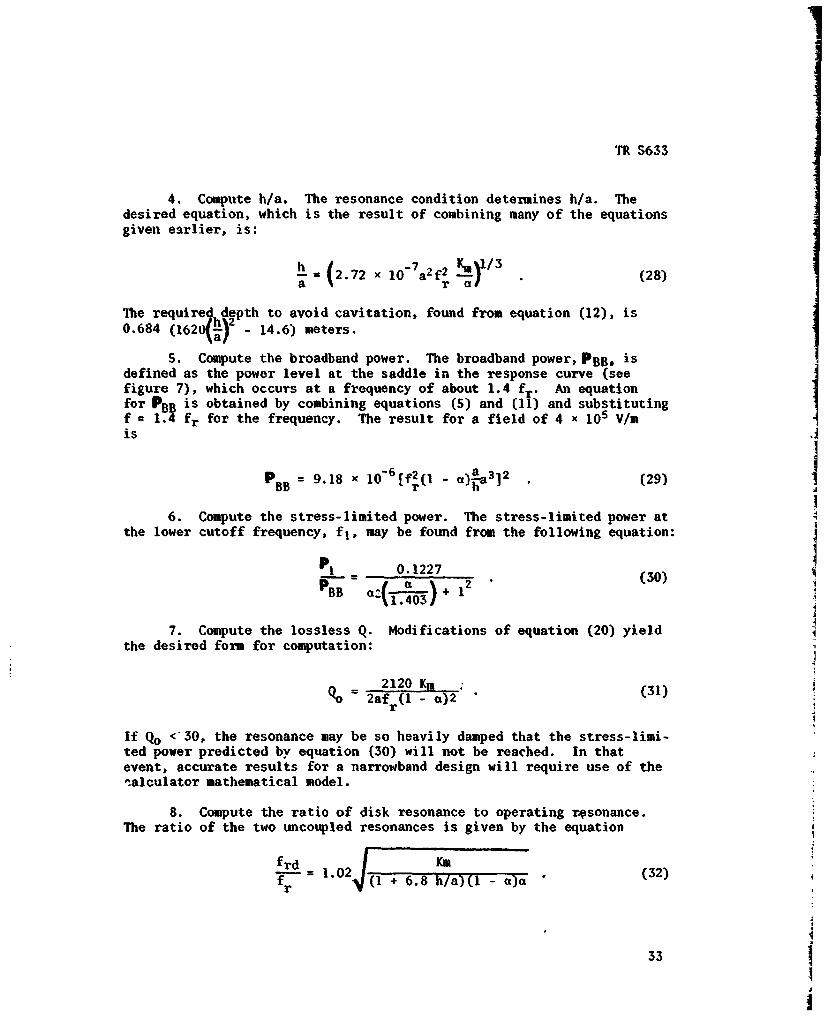
4. Compute h/a. The resonance condition determines h/a. Thedesired equation, which is the result of combining many of the equationsgiven earlier, is:
h (2.72. 1O-7a2f2 !R 1/3 (28)a r a
The required-depth to avoid cavitation, found from equation (12), is0.684 (1624A) - 14.6) meters.
S. Compute the broadband power. The broadband power, PBB, isdefined as the power level at the saddle in the response curve (seefigure 7), which occurs at a frequency of about 1.4 fr" An equationfor PBB is obtained by combining equations (5) and (11) and substitutingf = 1.4 fr for the frequency. The result for a field of 4 x 10⁵ V/mis
P = 9.18 x lO 6 [fr(1 - 1;•a3]2 (29)
6. Compute the stress-limited power. The stress-limited power atthe lower cutoff frequency, fl, may be found from the following equation:
P1 0.1227PBB a:(- )+ 12 (30)
~1.403,
7. Compute the lossless Q, Modifications of equation (20) yieldthe desired form for computation:
2120 Km (31)Qo%2afr(1- a)2 (1
If Qo <30, the resonance may be so heavily damped that the stress-limi-ted power predicted by equation (30) will not be reached. In thatevent, accurate results for a narrowband design will require use of the'-alculator mathematical model.
8. Compute the ratio of disk resonance to operating r@sonance.
The ratio of the two uncoupled resonances is given by the equation
frd Kmfr= 1.02 (l+6 h/a)(l - aa (32)
33 :+ 6.8--
I
TR 5633
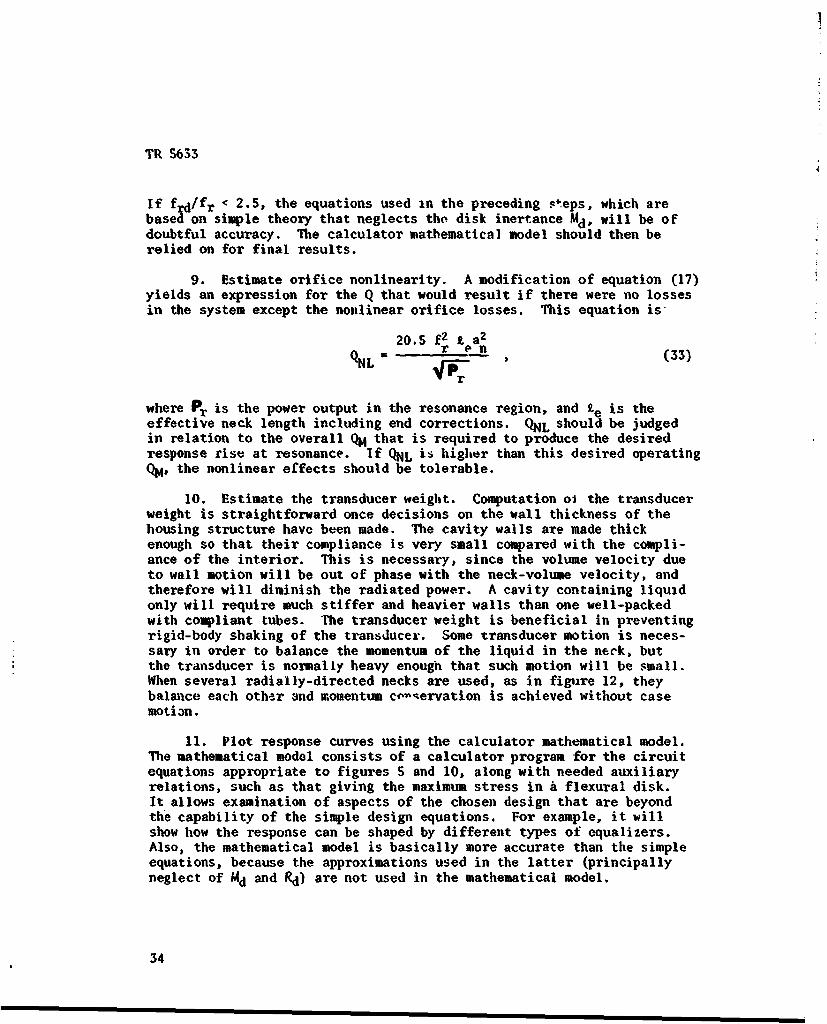
If frd/fr < 2.5, the equations used in the preceding steps, which arebased on simple theory that neglects the disk inertance Md, will be ofdoubtful accuracy. The calculator mathematical model should then berelied on for final results.
9. Estimate orifice nonlinearity. A modification of equation (17)yields an expression for the Q that would result if there were no lossesin the system except the nonlinear orifice losses. This equation is.
20.5 f 2 t a2r P n
QNL - r ,n (33)
where Pr is the power output in the resonance region, and le is theeffective neck length including end corrections. QNL should be judgedin relation to the overall QM that is required to produce the desiredresponse rise at resonance. If QNL is higher than this desired operatingQM, the nonlinear effects should be tolerable.
10. Estimate the transducer weight. Computation o! the transducerweight is straightforward once decisions on the wall thickness of thehousing structure have been made. The cavity walls are made thickenough so that their compliance is very small compared with the compli-ance of the interior. This is necessary, since the volume velocity dueto wall motion will be out of phase with the neck-volume velocity, andtherefore will diminish the radiated power. A cavity containing liquidonly will require much stiffer and heavier walls than one well-packedwith compliant tubes. The transducer weight is beneficial in preventingrigid-body shaking of the transducer. Some transducer motion is neces-sary in order to balance the momentum of the liquid in the neck, butthe transducer is normally heavy enough that such motion will be small.When several radially-directed necks are used, as in figure 12, theybalmace each other and momentum co-qervation is achieved without casemotion.
11. Plot response curves using the calculator mathematical model.The mathematical model consists of a calculator program for the circuitequations appropriate to figures 5 and 10, along with needed auxiliaryrelations, such as that giving the maximum stress in a flexural disk.It allows examination of aspects of the chosen design that are beyondthe capability of the simple design equations. For example, it willshow how the response can be shaped by different types of equalizers.Also, the mathematical model is basically more accurate than the simpleequations, because the approximations used in the latter (principallyneglect of Md and Rd) are not used in the mathematical model.
34
TR 5633
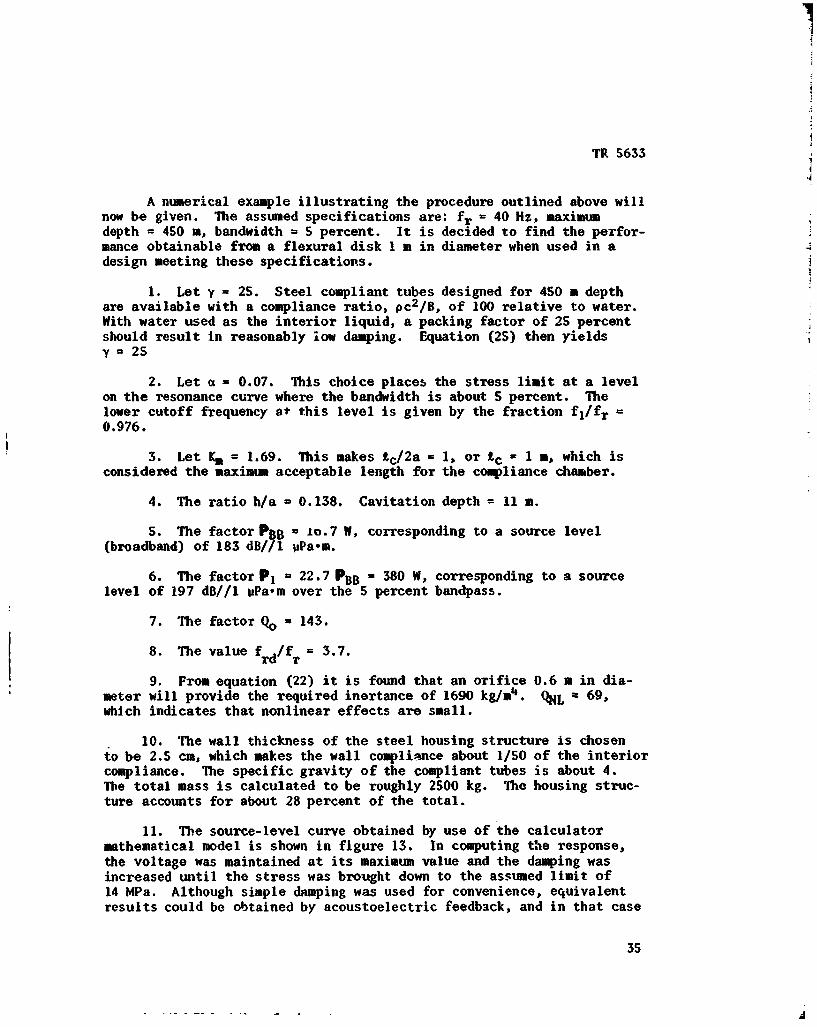
A numerical example illustrating the procedure outlined above willnow be given. The assumed specifications are: fr = 40 Hz, maximumdepth = 450 m, bandwidth = 5 percent. It is decided to find the perfor-mance obtainable from a flexural disk 1 m in diameter when used in adesign meeting these specifications.
1. Let y = 25. Steel compliant tubes designed for 450 m depthare available with a compliance ratio, pc 2 /B, of 100 relative to water.With water used as the interior liquid, a packing factor of 25 percentshould result in reasonably low damping. Equation (25) then yieldsy a 25
2. Let a - 0.07. This choice places the stress limit at a levelon the resonance curve where the bandwidth is about 5 percent. Thelower cutoff frequency at this level is given by the fraction fl/fr =0.976.
3. Let K. = 1.69. This makes £c/ 2 a = 1, or Ic - I m, which isconsidered the maximum acceptable length for the compliance chamber.
4. The ratio h/a = 0.138. Cavitation depth = 11 m.
S. The factor P B = io.7 W, corresponding to a source level(broadband) of 183 dB//l UPa-m.
6. The factor P1 = 22.7 PBB - 380 W, corresponding to a sourcelevel of 197 dB//1 PPa-m over the 5 percent bandpass.
7. The factor Qo a 143.
8. The value frd/fr = 3.7.
9. From equation (22) it is found that an orifice 0.6 m in dia-meter will provide the required inertance of 1690 kg/m4. QNL = 69,which indicates that nonlinear effects are small.
10. 'Ihe wall thickness of the steel housing structure is chosento be 2.5 cm, which makes the wall compliance about 1/50 of the interiorcompliance. The specific gravity of the compliant tubes is about 4.The total mass is calculated to be roughly 2500 kg. The housing struc-ture accounts for about 28 percent of the total.
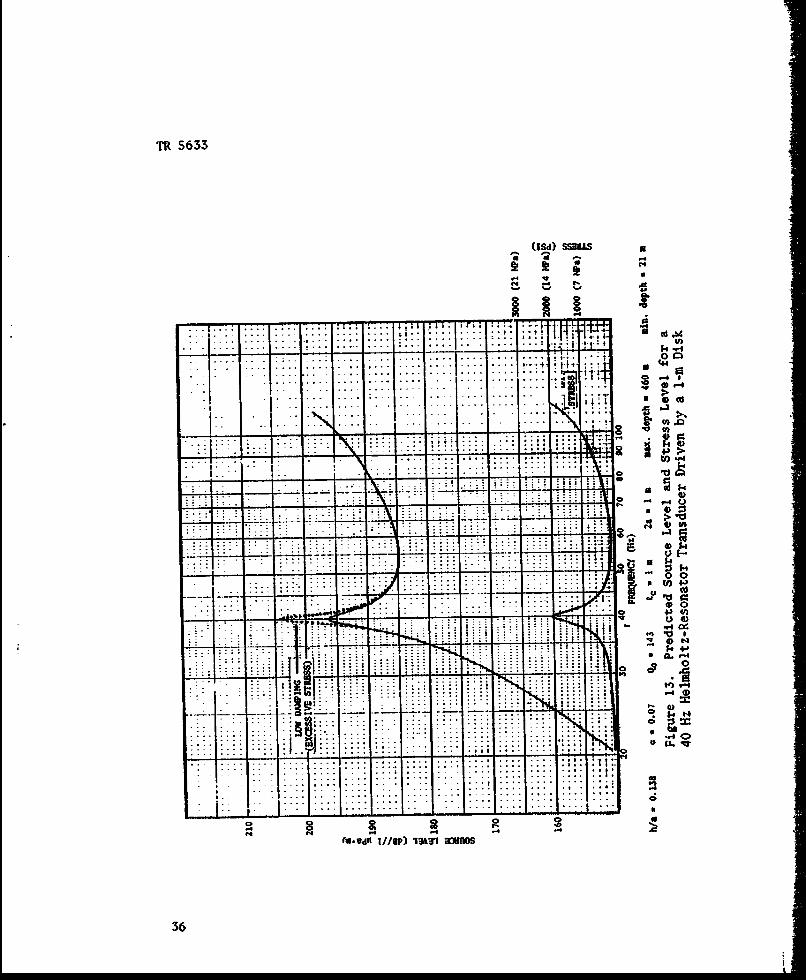
11. The source-level curve obtained by use of the calculatormathematical model is shown in figure 13. In computing the response,the voltage was maintained at its maximum value and the damping wasincreased until the stress was brought down to the assumed limit of14 MPa. Although simple damping was used for convenience, equivalentresults could be obtained by acoustoelectric feedback, and in that case
35
1?, 5633
(ISd) SSUJS
S .. . . .. .. . .-... . - . .. .. . . .. . . ...*
.....,-, ..... ... -. ... .. . ... .
.. . . . : .....
I.. . . . . .f •l
~t - '- 1:. ,>
. .U
.i . . .. ..-
P - l
i!-
- -- - - - - s-. -.... ..
~~.... .... ....11111! .I4J
IF .
!'-,
i::~~. . .. ..... ... " : :' -tt
C 40O. IdII 7//W) 1 ,Mrl tMrnOS
36
TR 5633
the efficiency would be higher than it is when the damping is deliber-ately made high as was done mathematically. Equalizers could be usedto flatten the top of the resonance curve to fill out the region betweenthe dotted lines at a level of 196 dB, thereby obtaining the desired Spercent bandwidth. The mathematical model results are seen to confirmreasonably well the results obtained from the simple formulas. Thesource level at the saddle is about 2 dB higher than the broadbandsource calculated by equation (29). This shows the influence of thehigher resonance (associated with Md), which pulls up the saddle.
Several other examples of designs based on a 1-meter driving diskare given in a separate report. 1 4 Also given are comparisons of thedisks used in Helmholtz-resonator configurations with disks of the samediameter used as direct radiators.
The calculator mathematical model is capable of producing otheruseful results besides source-level curves such as shown in figure 13.These include efficiency as a function of frequency, equalized responseswhich are adjusted on the mathematical model, and integrated power ofbroadband random signals appiied to the transducer. Examples will begiven in subsequent reports.
STATUS OF HELI 4"LTZ-RESONATOR INVESTIGATIONS
Model measurements have progressed far enough to generate confi-dence in the validity of the theory and design procedures given here.Figure 14 shows measured source-level curvesI$ for a model such asillustrated in figure 2, except that the packing of compliant tubes hasbeen reduced to 16 percent for this model. The calculated curves incor-porate empirical data obtained from bench measurements; that is, thedamping resistances and interior distributed inertance (end correction)were derived from measurements rather than theory. For curve A, thedisk was driven at full voltage in the saddle region of the response,but the drive level was rolled off at higher frequencies by a simpleequalizer. Acoustoelectrical feedback from a probe hydrophone in thecavity was used to flatten the resonance, in order to demonstrate howa broadband response curve might be achieved.
Many useful data are being obtained from bench measurements, withthe liquid-filled transducer in air. From the resonance frequency theinterior end correction is derived, and from the Q of the resonance thedamping resistances are obtained. In the studies to date (which arefar from complete) Q's in the range 10 to 40 have been obtained inmodels employing compliant tubes. For models that are liquid filledwithout tubes, Q's as high as 100 have been achieved. Microbubblesincrease the damping significantly and are often difficult to eliminate;
37
TR 5633
W1IC2 ..
0L 0
0i 0
z U..P 0 t0
08
00
(OP) 13A3133H-O
38S
TR 5633
so, optimum degassing procedures are being investigated.
On the theoretical front, mathematical studies have been made, byNaval Undersea Center (NUC) 1 6 using finite element methods, which pro-vide a highly rigorous approach to performance calculation (except thatviscosity has not yet been included).
FUTURE WORK
Much further work remains to be done with present model hardwareto establish empirical rules for estimating the loss resistances of thetransducer. Specifically, extensive information is required on how thecavity resistance, Rt, depends on tube size and orientation, packingfactor, frequency, and viscosity. The dependence of the interior endcorrection on these variables is also needed, though it is of lesserimportance since the neck can be adjusted to compensate for an error inthe predicted end correction.
Construction o0 a new model is needed, to have radial-flow necksand double-disk drivers, arranged as in figure 12. The object is toverify the expected capabilities of this new approach and to get empiri-cal data on radial-flow orificies.
Fatigue tests on metal compliant tubes are required to establishthat the tubes will survive the high alternating-pressure environmentof the resonator cavity.
Additional reports will be written to present the theory and com-putational techniques for Helmholtz-resonator transducers in greaterdetail.
39
TR 5633
REFERENCES
1. R. W. Dunham, "Static Compliance of Lexan Plastic Compliant Tubesfrom 0 to 500 psi," NUSC Technical Memorandum TD12-142-75, 23 April1975.
2. I. D. Groves, Jr., and T. A. Henriquez, Electroacoustic Transducersfor a lO,00-psig Underwater Sound Transducer Calibration Facilityfor the.Frequency Range 10 to 4000 Hz, NRL Report 6967, 15 August1969 (AD-693,051).
3. T. A. Henriques, The USRD) Type F39A l-kHz Underwater HelmholtzResonator NRL Report 7740, 10 April 1974 (AD-778,3377HH).
4. R. S. Woollett, "Very Low Frequency Broadband Transducers forTransmitting Red Noise," NUSC Technical Memorandum TD12-294-73,5 July 1973.
S. R. S. Woollett, "Current Approaches to the Miniaturization andPressure-Release Problems of VLF Transducers," Proceedings of theWorkshop on Low-Frequency Sound Sources, NUC TP 404, September 1974(AD/AO03,894/OWH).
6. R. S. Woollett, "Piezoelectric Helmholtz Resonators," Proceedingsof the Workshop on Low-Frequency Sound Sources, NUC TP 404,September 1974 (AD/A-003,894/OWH).
7. R. H. Lyon, "On the Low-Frequency Radiation Load of a Bass-ReflexSpeaker," Journal of the Acoustical Society of America, vol 29,p. 654, May 19S7.
8. R. S. Woollett, TheorY of the Piezoelectric Flexural Disk Trans-ducer with Applications to 1d~erwater Sound,- USL Research-ReportNo. 490, 5 December 1960 (A-7249,731).
9. R. F. De La Croix and E. M. Cliffel, Jr., Performance PredictionModel for Radially Symmetric Flexural Disk Transducer, GeneralDynamics/Electro-Dynamic Div., Report No. HL 101-72, February 1972(Contract N00140-71-C-0081).
10. E. M. Cliffel and R. F. De La Croix, Stress Computations in theGeneral Flexural Disk Model, Hydroacoustics, Inc., Report No.HA108-73, April 1973 (Contract N00024-72-C-1295).
40
TR 5633
11. R. W. Dunham, "Control and Plotting Programs for the General Dyna-mics Composite Flexural Disc Analysis Routines," NUSC TechnicalMemorandum TD-12-208-72, 18 May 1972.
12. "Final Development Report for High-Power, Low-Frequency Transducerfor RS-212," General Electric Co. (HNED), 12 June 1964.
13. G. B. Thurston, L. E. Hargrove, and B. D. Cook, "Nonlinear Proper-ties of Circular Orifices," Journal of the Acoustical Society ofAmerr;ca, vol. 29, pp. 992-1001, September 1957.
14. R. S. Woollett, VLF Flexural Disk Transducers Using DisIs 1 Meterin Diameter, NUSC Technical Report 5509, 3 December 1976.
15. R. S. Woollett, "Underwater Helmholtz Resonator Transducers," NUSCTechnical Memorandum TD12-388-75, 10 November 1975.
16. S. Spratt, "Finite Element Analysis of Low Frequency Helmholtz-Resonator Transducers," NUC TN 1614, November 1975.
41/42Reverse Blank
TR 5633
INITIAL DISTRIBIUFION LIST
Addressee No. of Copies
ONR, Code 412-3 1CNN, MAT-03, -03L 2NRL, Underwater Sound Reference Division 2NAVELEX, PNE-124 1NAVSEA, SEA-03C, -06H1, -06H1-2, -661T, -09G3 (4)DTNSRDC 1NAVCOASTSYS LAB INAVSURiWPNCEN 1NOSC, Code 601 2NAVPGSCOL 2ARL/PENN STATE, STATE COLLEGE 1DOC, ALEXANDRIA 12ARL/U. TEXAS, AUSTIN 1MAAG, ARGENTINA 1MAAG, BRAZIL 1AUWE, PORTLAND, DORSET, U.K. 1DREA, DARTMOUTH, N.S., CANADA 1HONEYWELL, INC, 5303 Shilshole Ave. N.W., Seattle,
Washington 98107 (Mr. Leon Jones) 1HYDROACOUSTICS INC., 321 Northland Ave., P.O. Box 3818,
Rochester, N.Y. 14610 (Dr. J. V. Bouyoucos) 1WESTINGHOUSE CORP., Baltimore-Washington International
Airport, P.O. Box 1897, Baltimore, Maryland 21203(Mr. T. B. Pederson) 1
BENDIX ELECTRODYNAMICS DIVISION, 15825 Roxford St.,Sylmar, California 91342 1
INTERNATIONAL TRANSDUCER CORP., 646 McCloskey Place,Goleta, California 93017 1
MARINE RESOURCES, INC., 755 Highway 17-92,Fern Park, Florida 32730 1
MAGNAVOX CO., Fort Wayne, Indiana 46804 (Mr. E. L. Fabian) 1RAYTHEON SUBMARINE SIGNAL DIVISION, P.O. Box 360,
Portsmouth, R.I. 02871 (Mr. S. L. Ehrlich) 1HAZELTINE CORP., Harrison Blvd., Avon, Massachusetts 02322
(Mr. Don Ricketts) 1AEROJET ELECTROSYSTEMS CO., 1100 W. Hollyvale St.,
Azusa, California 91702 (Mr. Theron Lambert) 1SPARTON ELECTRONICS, Jackson, Michigan 49202
(Mr. Alton E. Knoll) 1AMETEK STRAZA, 790 Greenfield Dr., El Cajon,
California 92022 (Mr. Glen Liddiard) 1GENERAl. ELECTRIC, Farrell Road Plant, Syracuse, N.Y. 13201 1OCEAN & ATMOSPHERIC SCIENCE, 145 Palisade St. 1
Dobbs Ferry, N.Y. 10522