Understanding Small Business Activity at the State Level · Understanding Small Business Activity...
37
Understanding Small Business Activity at the State Level by John Deskins Creighton University Tami Gurley-Calvez West Virginia University Eric Thompson University of Nebraska-Lincoln for under contract number SBAHQ-10-M-0267 Release Date: February 2012 This report was developed under a contract with the Small Business Administration, Office of Advocacy, and contains information and analysis that was reviewed by officials of the Office of Advocacy. However, the final conclusions of the report do not necessarily reflect the views of the Office of Advocacy.
Transcript of Understanding Small Business Activity at the State Level · Understanding Small Business Activity...

Understanding Small Business Activity at the State Level
by
John Deskins
Creighton University
Tami Gurley-Calvez West Virginia University
Eric Thompson
University of Nebraska-Lincoln
for
under contract number SBAHQ-10-M-0267
Release Date: February 2012
This report was developed under a contract with the Small Business Administration, Office of Advocacy, and contains information and analysis that was reviewed by officials of the Office of Advocacy. However, the final conclusions of the report do not necessarily reflect the views of the Office of Advocacy.

1
Contents
Contents .............................................................................................................................. 1
Tables .................................................................................................................................. 2
Executive Summary ............................................................................................................ 3
Introduction ......................................................................................................................... 5
A Review of Related Literature .......................................................................................... 6
Testable Hypotheses ........................................................................................................... 8
Econometric Strategy .......................................................................................................... 8
Data ................................................................................................................................... 10
Economic Activity Measures ..................................................................................... 10
Small Business Activity Measures ............................................................................ 11
Other Control Variables ............................................................................................. 13
Econometric Results ......................................................................................................... 15
Results for Later Years .............................................................................................. 15
Results for Earlier Years ............................................................................................ 16
Results for Small Business Births and Deaths ........................................................... 18
Discussion and Policy Implications ........................................................................... 18
Robustness Checks .................................................................................................... 19
Conclusions ....................................................................................................................... 20
References ......................................................................................................................... 28

2
Tables
Table 1: Regression Results: GSP Growth on Small Business Activity, Later Years ................... 22
Table 2: Regression Results: Employment Growth on Small Business Activity, Later Years ...... 23
Table 3: Regression Results: GSP Growth on Small Business Activity, Early Years ................... 24
Table 4: Regression Results: Employment Growth on Small Business Activity, Early Years ..... 25
Table 5: Regression Results: Economic Growth on Business Births and Deaths, Later Years .... 26
Appendix Table 1: Data Descriptions and Source Notes ............................................................... 30
Appendix Table 2: Average Small and Large Business Measures Across States, Later Years ..... 31
Appendix Table 3: Average Small and Large Business Measures Across States, Early Years ..... 32
Appendix Table 4: Average Small and Large Business Births and Deaths Across States, Later Years .................................................................................................................................. 33
Appendix Table 5: Average Small and Large Business Births and Deaths Across States, Early Years .................................................................................................................................. 34
Appendix Table 6: Summary Statistics for Other Regression Variables ....................................... 35
Appendix Table 7: GSP, Employment, and Small Business Births, by State ................................ 36

3
Executive Summary
Only a small number of studies have examined the economic importance of small businesses to economic growth at the state level, and none have been identified that provide an industry-specific examination. The current study addresses this gap using a panel of U.S. state data spanning the years 1988 through 2007 to examine the impact of small business activity by industry on overall state economic growth. O ur small business measures include annual counts of small business firms, establishments, employees, the dollar value of small business payroll, as well as annual counts of births and deaths of small firm establishments. Small business data are drawn from the U.S. Census Bureau’s Statistics of U.S. Businesses program, created from the annual County Business Patterns files with cooperation and partial funding from the Office of Advocacy of the U.S. Small Business Administration. For overall growth measures, we focus on G ross State Product (GSP), employment, and State Personal Income (SPI), as well as per capita versions of these measures. Growth data are drawn from Census or Bureau of Economic Analysis sources.
Our econometric approach accounts for the simultaneous nature of small business activity and overall growth. We control for a variety of other determinants of economic growth, including a broad menu of state-level tax policy measures. We also consider potential spatial influences of small business activity by including a measure of small business activity in neighboring states to account for possibility that small business activity in one state affects growth in a neighboring state.
Key findings include the following: 1. Small business activity in neighboring states is found to have either a
positive or a statistically insignificant impact on a state’s own rate of economic growth with rare exceptions.
2. We find evidence that greater small business activity in manufacturing, transportation/communications/public utilities, and finance/insurance/real estate typically led to stronger state GSP and employment growth during the 1988 to 1997 period. Less consistent evidence suggests that small business activity in the real estate, health care, and professional services industries positively impacted state economic growth from 1998 to 2007. The erosion of early relationships may reflect the relative weakness of the U.S. economy during the 2000s relative to the 1990s.
3. Results indicate that most of the positive economic growth effects of small business activity in the industries identified above are larger than the effects of various state policy parameters.
4. Results from models in which economic growth is measured in per capita terms most often indicate a smaller (in absolute value terms) relationship between small business activity and state economic growth, compared to our baseline results. This result suggests that the effect of small business

4
activity on state economic growth is due to changes in productivity as well as from population/labor inflows/outflows.
In terms of the options available to state policymakers, we found consistent evidence during the 1988 to 1997 period that small business activity in the manufacturing, transportation/communications/public utilities, and finance/insurance/real estate industries encouraged economic growth. These patterns, however, were not as evident during the 1998 to 2007 period. The dissipation of these results during the last decade may reflect the general weakness of the economy over that time period. From that perspective, it is possible to postulate that the observed relationships between small business activity, tax policy, and economic growth from the 1988 to 1997 period may return in the years to come, but additional research is needed to verify this possibility.
Such research may be particularly important given the large growth effects of small businesses in the identified industries. In particular, the positive economic growth effects of small business activity in these industries are larger than the growth effect of the various state policy parameters in our model.

5
Introduction
Despite a large and growing literature on the economic importance of small businesses in a national or i nternational context, only a small number of papers have examined the contributions of small businesses to economic growth at the subnational level. The U.S. Small Business Administration (SBA) reports indicate that small businesses are the vast majority of employers, and they create the lion’s share of new jobs each year and more than half of all net new jobs in recessionary periods. Looking at the last three recessions, the smallest firms created more jobs following the 2001 r ecession, larger small firms lead the expansion following the 1991 downturn, and a combination of the two followed the most recent recession (Headd, 2010). This evidence has resulted in numerous efforts at the federal, state, and local levels to foster small business development.
Bruce et al (2009)1 is a recent study that considers the effect of small business activity on U.S. state economic growth.2 Using U.S. state-level data for the years 1988 through 2002, the authors estimate various models that explore the effect of several small business activity measures on alternate measures of state economic growth. After accounting for several key estimation issues, the authors find that small business activities by several measures are important contributing factors to state economic growth. However, Bruce et al (2009) examine only aggregate small business data, without any attention to the specific industry in which small businesses operate. Our analysis follows the empirical framework of Bruce et al (2009) but we extend this framework to allow us to draw industry-specific conclusions.
More specifically, we explore the intricate relationships between small business activities and economic activity at the U.S. state level using state data spanning the years 1988 to 2007. We examine a wide variety of indicators of state small business activity, including counts of small business firms and establishments as well as employment, payroll, and the number of small firm establishment births and deaths. Small business data are drawn from the U.S. Census Bureau’s Statistics of U.S. Businesses program, created from the annual County Business Patterns files with cooperation and partial funding from the SBA Office of Advocacy.3 For economic activity, we focus on two of the most prominent indicators of state economic health: Gross State Product and total state employment; we also examine per capita measures of each of these variables. Growth data are drawn from Census or Bure au of Economic Analysis sources.
To isolate the impact of small business activities on state economies, we account for other determinants of economic growth by including them as control variables in our estimation. We include standard economic controls such as education levels and price indicators for inputs to production (namely energy prices and wage rates). We also include a broad array of state policy variables in order to identify available policy instruments for state governments. In controlling for as many other possible determinants of economic growth as possible, we isolate the true impact of small business activity. 1 Bruce et al (2009) is a slightly modified version of Bruce et al (2007). 2 Acs and Armington (2004) is a key contribution that examines the relationship between small business activity and economic growth in labor markets. 3 Full source information for all data used in this study can be found in Appendix Table 1.
6
Our estimation strategy accounts for the possibility that small business activity and economic growth might be determined simultaneously by using data small business activity data from the previous year to predict economic growth in the next year. We also lag all control variables in a panel regression framework. This enables us to more clearly determine the extent to which any relationships between small business activities and state economic growth are causal. Further, we account for the possibility that state economic growth is affected by small business activity in neighboring states.
The combination of these estimation techniques and a rich set of information for each state over time permits us to make important research contributions that are highly relevant to state and federal policy discussions. Most importantly, our results shed light on the impact of small business activity by industry on key measures of state economic health after controlling for a variety of other factors. We begin by summarizing key findings from the previous economic literature. We then lay out our s pecific testable hypotheses before describing our econometric model and estimation strategy in detail. Following a discussion of our data set, we present our results and discuss policy implications.
A Review of Related Literature
Many different factors are critical to the growth and development of an economy. As a result, there has been extensive research on factors, including policy efforts such as tax incentives and spending programs, contributing to economic growth among states in the U.S. Even though the contributions of small businesses to economic development have received increasing attention by development officials in the states, little research has been conducted measuring the empirical relationships between the dynamics of entrepreneurship and economic growth at the state level.
Dating back to Schumpeter (1911), K night (1921), and Baumol (1968), e conomic theorists have recognized the importance of entrepreneurship to economic development. From these theoretical models, a literature has developed to explain the relationship between entrepreneurial activity and economic growth, primarily at the national level. T he Global Entrepreneurship Monitor (GEM) recently conducted surveys in 37 countries in 2002 intended to collect data on the level of entrepreneurial activity. Subsequent research indicates that the effects of entrepreneurial activity on economic growth vary across countries based on income level. Developed countries display a positive relationship between entrepreneurial activity and GDP growth (van Stel et al, 2005).
The issue has recently received increasing interest as evidenced by a special issue of the journal Regional Studies devoted to empirical studies of entrepreneurship and economic development. This issue contains four articles on the effects of entrepreneurship, measured as new firm formation, on varying measures of economic development, ranging from employment growth to productivity increases. I n a key article, Acs and Armington (2004) f ind that entrepreneurship increases employment growth rates in labor market areas in the U.S. While these papers are important in increasing the understanding of how entrepreneurial activities might affect economic development, none of the studies are conducted at the state level.
One recent empirical study by Lowrey (2005) examines the relationship between state-

7
level business activity and economic growth by focusing on the concept of business density, or the number of firms per capita.4 Her analysis of a 1997 cross section of state data reveals that state business density is positively correlated with GSP and GSP growth and negatively associated with poverty and income inequality. F urthermore, her data show that states with higher business density tend to have more business start-ups and establishment births.
Bruce et al (2009) i s most closely associated with the present analysis. The authors examine the effect of small business activity on U.S. state economic growth. Using a panel of U.S. state-level data for the years 1988 through 2002, the authors estimate various models that explore the effects of several small business activity measures on alternative measures of state economic growth. The authors also account for several potential estimation problems. First, both small business activity and state economic growth have many common elements which must be controlled for in order to reduce the chance of omitted variable bias. That is, one must include factors in the estimation that are expected to be related to both small business activity and state economic growth. Perhaps most importantly, models must account for the simultaneity of small business activity and economic growth, in order to identify causality rather than simple correlation between the variables.
Bruce et al (2009) only consider small business activity measures in the aggregate, without attention to industry specifics. This lack of specificity may not be problematic in many instances, such as when policymakers manipulate large policy parameters that may affect many or most small businesses. However, as many policies are focused towards specific industries, policymakers may have opportunities to promote entrepreneurship most actively in selected industries. For example, states often have revolving loan funds or investment pools to support small business. Such funds may implicitly or e xplicitly focus on i ndustries such as manufacturing or information technology. States also regulate industry to varying degrees. A policymaker may make a different trade-off between regulation and business start-ups if it is understood that entrepreneurship in that industry is critical for economic growth.
The literature described above, which guides our analysis, is informative and provides a number of key results for policymakers at all levels of government. It is important to note, for example, that the existing evidence suggests that entrepreneurial activity is an important contributor to economic growth at the national, state, and city levels. However, given increasing attention by development officials in the states, additional research is needed to provide industry specific information on the relationship between small business activities and economic growth.
We also direct the reader to the broader literature on the effects of variables other than small business activity on state economic growth. We reference this literature heavily below since in our econometric analysis we must control for other variables that may also influence state economic growth and may be correlated with small business activity. In this area, a substantial literature exists that explains the effects of state tax and expenditure policy on the location of economic activity, as summarized by Wasylenko (1997) and Fisher (1997) and as discussed more recently by authors such as Reed (2008) and Deskins and Hill (2010). Further, the theoretical literature on e conomic growth has long recognized the importance of such
4 Lowrey’s (2005) analysis of density as business activity (e.g., the number of firms) per 1,000 residents extends the spatial density concepts (economic activity per square mile) analyzed by Ciccone and Hall (1996).

8
factors as physical and human capital. A number of empirical studies have examined these factors. For example, human capital (measured by some measure of educational attainment), public and private investments, cost factors, industry mix and national trends are all found to influence state economic growth (Barro and Sala-i-Martin, 1991; Goetz et al, 1996; Munnell, 1990; and Terkla and Doeringer, 1991).
Testable Hypotheses
Our primary goal is to determine the importance of small business activity for state economic growth in an empirical framework. To this end, we test the following specific hypotheses:
I. The number of small businesses in a given major industry, as measured by firms or establishments in that industry, has a significant positive effect on state GSP, employment, and SPI.
II. Small business employment and payroll by specific major industry have a significant positive effect on state GSP, employment, and SPI.
III. Small business birth and death rates by industry have significant positive effects on state GSP, employment, and SPI.
IV. Small business activity by industry influences state GSP and employment not only through population inflows/outflows, but also through GSP per capita and employment to population ratios.
V. Small business activity in neighboring states affects state GSP, employment, and SPI in a given state.
Econometric Strategy
Our empirical structure follows fundamentally from Bruce et al (2009) and consists of panel regressions of state economic variables (GSP, employment, SPI, as well as GSP per capita and employment-population ratios) on measures of industry-specific small business activities and other controls using annual data for the 48 contiguous U.S. states.
The first crucial issue that must be properly addressed econometrically is the likely dual causality between economic activity and small business activity. Specifically, it is likely that small business activity and state GSP, employment, or SPI are simultaneously determined. In this case, the estimation suffers from the problem of simultaneity and the estimated effects from regression analyses will fail to capture true causal effects. To address this simultaneity we follow the method of Bruce et al (2009) and lag all independent variables by one year, expressing economic activity each year as a function of control variables (including small

9
business measures) from the previous year’s data.5 A related issue in using data for multiple states and years is the extent to which
observations in the data from one state are related to observations from another state or group of states. While small business activity in a s tate can be posited to have a direct effect on economic growth within that state, this activity may have an additional indirect effect on other states that must be controlled for in the estimation. Such an indirect effect is often called a “spillover” as changes in one state’s small business activity affect growth in other states. For example, a burst of small business activity in Tennessee may impact the economic growth of Alabama, if Tennessee businesses draw on labor from Alabama or use inputs that are produced in Alabama. Failing to account for this possibility could cause us to underestimate the total impact of entrepreneurial activity on economic growth.
In order to properly model the interstate spillovers, we need to determine the geographic extent to which we believe the spillover will be contained. In other words, we must identify each state’s neighbor group. Because we envision the spillovers to be local in nature, we limit our definition of neighbor to be those states sharing a geo-political border. Thus, in the case of Tennessee’s economic growth, neighbors are the states of Alabama, Arkansas, Georgia, Kentucky, Mississippi, Missouri, North Carolina and Virginia.
Having identified neighbors, we assign weights in order to capture the relative importance one state may wield over another. We experiment with three different weighting schemes, following Bruce et al (2009). The first is contiguity, in which all neighboring states are considered to wield equal influence. For our Tennessee example, observations from each of the eight states listed above would be given equal weights, whereas observations from California (and all other non-border states) would be assigned a weight of z ero. Because Virginia has a larger population than Mississippi, it may be the case that Tennessee would be more concerned with what occurred in Virginia than Mississippi. T o account for this, our second weight is population-contiguity, in which the weights are based on the populations of the bordering states. Thus, Virginia would be given a higher weight than Mississippi. A third weighting scheme, center, depends on the physical distances between bordering states. Laborers from Memphis may be willing to drive to Arkansas for employment, but North Carolina is likely too far away. Center measures the distance from the center of one state to the center of a n eighboring state. I t effectively measures the average distance a r esident of the home state would need to travel to cross borders.
It is common in the spatial literature to use row-standardized weights, meaning the sum of weights equals one. In the case of the contiguity weights for Tennessee, each competitor would be given a weight of one-eighth (or 0. 125), since eight states border Tennessee. I n creating population-contiguity weights, we take the bordering state’s population and divide it by the population of all bordering states. F or center, we want to ensure that states closer together receive higher weights. We therefore assign the inverse of the distance as the weight 5 Another method involves the use of contemporaneous (rather than lagged) data while instrumenting for the endogenous variable in a first-stage regression. For example, if small business activity is endogenous in the GSP regression, we would need to estimate a first-stage regression of small business activity on (a) at least one instrumental variable (IV) and (b) all of the other exogenous variables in the GSP regression. The IV would be some factor that significantly affects small business activity but that does not have an independent influence on GSP. Given the obvious difficulty with finding suitable instrumental variables, we prefer the lag structure.

10
for each state prior to row-standardization. Our estimating equation takes the following form: (1) 1,1
50
11,,1,1,, )( −−
=−−− ++++= ∑ tit
jtjjitititi xwZy ελθβαγ
In equation (1), γιτ represents the rate of economic growth for each of our measures of economic activity of state i at time t, Z is our set of small business and control variables, and the λ terms are controls for year to account for broader economic conditions that affect state economic growth. We include the initial value of either GSP, employment, or SPI (or their per capita versions), denoted yi,t-1 in equation (1), to account for the convergence hypothesis6 which is included in growth models. Note that by including the lag of the dependent variable on the right hand side, the state-level fixed effect is captured in both the dependent variable and the
lag, hence its exclusion from equation (1). The term )(50
11,,∑
=−
jtjji xwθ measures the combined
spillover effects that the small business activity (x) in each of the U.S. states has on observation i. The term wij represents the weight applied to neighboring state j and is assigned as described above depending on the weighting scheme utilized. Regression coefficients are denoted above by α, β, and θ. Finally, εi,t represents a mean-zero disturbance with finite variance and the usual econometric assumptions.
Data
Our data are drawn from publicly available economic data, along with a detailed portfolio of tax policy variables gathered from various tax-related publications and contacts with state government officials. We supplement these data sources with measures of small business activity as described in detail below, and other variables as needed. Data descriptions and source notes are provided in Appendix Table 1.
Economic Activity Measures
We examine several alternate measures of economic activity to provide a broad perspective as well as maximum robustness and reliability of our results. Our baseline measures of economic activity are Gross State Product (GSP) and total state employment. Further, we examine state personal income (SPI) as a check on t he robustness of our ba seline models. Each of these variables enters our analyses in annual growth terms.7 For further analysis, we also examine economic growth in GSP and employment on a per capita basis. This second set of measures may help isolate whether results for the first two measures reflect a growing standard of living, or simply a population/labor inflow/outflow. 6 The convergence hypothesis is the idea that wealthier states will grow more slowly than poorer states. The convergence hypothesis manifests itself as a negative coefficient on the initial level of economic activity. 7 Specifically, we calculate year-to-year growth as the natural log of (yt+1/yt).

11
Small Business Activity Measures
Since the effects of small business activity on s tate economic growth constitute the focus of this study, we consider several alternative measures of small business activity, again, to provide for maximum robustness in our re sults and for a b road perspective. Th ese measures were developed by the U.S. Small Business Administration Office of Advocacy in cooperation with the US Bureau of the Census. The first measure is the number of small business firms in a state. S econd, we consider the number of small business establishments in a state, i.e., the number of physical business locations that are associated with small businesses. T hird, we examine the employment of small businesses and, fourth, the payroll of small businesses. Finally, we study the numbers of small business establishment births and deaths.8 We follow the SBA standard by defining a small business as any business with less than 500 employees.
As previously discussed, the key element of this study is our focus on s pecific industries in which small businesses operate. An important issue is the fact that within the time frame of our a nalysis industry definitions were converted from the Standard Industrial Classification (SIC) system to the North American Industrial Classification System (NAICS), changing the way in which industries are defined. This reclassification forces us to separate our analysis into two parts: we estimate our model with data for the years 1998 through 2007 under the NAICS system and we separately estimate the model using data for the years 1988 through 1997 under the SIC system.
Under the NAICS system (1998 through 2007 in our da ta) we consider small businesses in the following industries (with 2-digit NAICS code in parentheses): construction (23), manufacturing (31), re tail trade (44), transportation (48), information (51), finance and insurance (52), real estate (53), professional (54), and health care (62). We also combine several other smaller service categories into one category we deem “various services.”9 In addition, we include the count of all of the other small businesses not included in one of the categories outlined above.
The level of industry detail that we are able to examine for the SIC years (1998-1997 in our data) is less specific than for the NAICS years. Specifically, in the SIC years we examine the following industries (with 2-digit SIC code in parentheses): construction (15), manufacturing (20), transportation, communication, and utilities (40), retail trade (52), finance, insurance, and real estate (60), and services (70). As with the NAICS years, we include the count of all of the other small businesses not included in one of these categories.
In addition to the small business measures that constitute our focus, in all of our models it is also important to control for non-small-business activity factors that affect growth and may be correlated with measures of small business activity. In particular, we include the number of firms with 500 or more employees as a separate variable. This allows us to assess the impact
8 The Census defines births as establishments that have zero employment in the first quarter of the initial year and positive employment in the first quarter of the subsequent year. Similarly, deaths are establishments that have positive employment in the first quarter of the initial year and zero employment in the first quarter of the subsequent year. We prefer to enter births and deaths as two separate variables in our models such that effects of births may differ from the effects of deaths. A single measure of net births would be too restrictive in this sense. 9 This group consists of management (55), administrative support (56), educational services (61), arts, entertainment, and leisure (71).

12
of an additional small firm while holding the number of large firms constant.10 To be sure, our inclusion of large firm counts is also based on the notion that large firms contribute significantly to state economic growth, much more so than small firms in terms of percentages of output produced. I n all models, the large business measures parallel the small business measures (e.g., counts of large firm establishments are included in models with counts of small firm establishments, and so on). H owever, our large business control variable is not industry specific.
Mean values and standard deviations for our small (and large) business variables are provided in Appendix Table 2 for the first and last years of our dataset during the NAICS years. A few findings from Appendix Table 2 are worth noting. As detailed, the largest industry category for the firm counts are various services, construction, professional, and retail trade, and these largely hold true for the establishments, employment, and payroll measures as well. Second, note that nearly all variables grow over the period of analysis, with a few exceptions. For instance, the number of manufacturing firms, establishments, and employment falls over the period of analysis. A lso note that the number of small businesses firms and establishments far exceeds the number of large business firms and establishments at both the beginning and end of the period of analysis. However, total small business employment (not totaled in the table) is only slightly larger than large business employment and total small business payroll is actually smaller than large business payroll. Last, note that the small business categories that we specifically examine account for around 83 percent of small business firms in 2007 and 85 percent of small business employment in 2007 (these statistics can be gleaned from the second and sixth columns of the Table, respectively).
Summary statistics for SIC years (1988 – 1997) are provided in Appendix Table 3. In the robust economy of the late 1980s and 1990s, all measures of economic activity expanded in nearly every industry. All measures of activity grew for construction, manufacturing, transportation, communications, and utilities, and finance, insurance, and real estate, and all but one measure expanded for the retail trade industry. Even large businesses grew according to all four measures. But, the most rapid rate of expansion was in the services industry, particularly for measures of payroll growth. High wage portions of the services industry focused on producer services grew very rapidly in the late 1980s and 1990s. The only exception to this growth pattern is the other small business category, which was dominated by smaller industries such as mining and wholesale trade.
Summary statistics for small business births and deaths for NAICS years and SIC years are provided in Appendix Tables 4 and 5, respectively. Note that data availability is slightly different for births and deaths data, as we have access to data for the NAICS period for births and deaths occurring for the 1998/1999 period up through the 2005/2006 period, and for the SIC years, for the 1989/1990 period up through the 1997/1998 period.
10 Without controlling for the number of large firms, the measured impact of a new small firm would not be the same as the likely impact of a new small firm. In this sense, the measured impact would not be able to distinguish between the effect of a truly new small firm and a formerly large firm that shrinks in size into the small firm category.

13
Other Control Variables
To accurately assess the impact of small business activity on state economic growth, we must control for other determinants of economic growth that may be correlated with small business activity. Our list of determinants of economic growth includes a set of variables that represent key determinants of business production decisions. W e account for input price effects by including an index of the price of energy in the state and the average wage for manufacturing workers in a state, as high input prices may suppress economic growth.11 A measure of the state’s human capital stock (measured as the share of the state’s population that has a bachelor’s degree or higher) is included as a control variable for a few reasons. First, human capital is generally considered to be a key determinant of an economy’s productivity, and should therefore have a positive effect on growth. Moreover, firms generally are more likely to locate in states with an educated workforce. Further, a human capital control is important since policymakers may work to attract human capital as part of their economic development efforts or they may try to enhance their human capital stock through education expenditures, and these efforts could be correlated with the state’s efforts to promote small business activity. State unemployment rates are used to proxy the general economic health of the state, whereas population density (residents per square mile of land area) helps capture in-state market density. Further, because different parts of the population may have differing impacts on state growth, we account for the age distribution of a state’s population by including three variables to denote the share of a state’s population that is a) between the ages of 25 and 44, b) between the ages of 45 and 64, and c) age 65 and over.
Our regressions also include several measures of state tax structures. First we control for the overall size of the state government (and the local governments within the state) with total state and local taxes per capita. Higher taxes could reduce economic growth if economic agents adjust their behavior to avoid higher taxes or, conversely, higher taxes could enhance economic growth if they translate into more public goods and services that are valued. We further control for several specific tax rates, in particular the state sales tax rate and the top statutory tax rates for each state’s corporate income tax (CIT) and personal income tax (PIT). Higher tax rates have potentially conflicting effects on e conomic growth. First, they may increase business costs and, thus, drive economic activity out of a state. However, while higher income tax rates reduce the returns to risky ventures, they also insure against risk if rates are progressive and if a loss offset component is available, and might therefore be attractive to risky business start-ups.12
We consider four additional aspects of state tax policies that may also affect economic growth and have received significant attention in the policymaking arena. Beginning with state CIT structures, we go beyond statutory tax rates and also include the sales factor weight in each state’s CIT apportionment formula, and dummies for the presence of a combined reporting requirement and a throwback rule. Each of these is discussed in greater detail below.
Corporate profits for multi-state firms are apportioned for tax purposes to the states in 11 The energy price index represents the cost of producing one million BTUs of energy based on a weighted average of the cost of energy from different sources such as coal, natural gas, nuclear, etc., in each state. 12 Our inclusion of taxes that are not normally associated with businesses is supported by Cline et al (2003a and 2003b), who show that many state and local taxes, including the sales tax, are very important business taxes.

14
which they have nexus. The apportionment formulas used by states typically consider the share of the firm’s payroll, property, and sales. Equal weights were traditionally placed on the three factors, but many states have opted to increase the weight on sales in order to shift the CIT burden from multi-state businesses that manufacture within a state to those that manufacture out-of-state. Thus, higher sales factor weights may bring more economic activity within a state’s borders (see Edmiston, 2002).
Combined reporting requirements are set up t o force multi-unit firms to file a single CIT return rather than separate returns for each unit of the firm. These rules are intended to keep multi-unit firms from shifting taxable profits out of a state. Similarly, throwback rules are designed to ensure that all income is taxed somewhere. If a multi-state firm is able to locate profits in a state that does not tax corporate income or in which the firm does not have nexus, income which is not taxed (known as “nowhere income”) is “thrown back” to the home state if that state has a throwback rule. Both of these rules have become popular as states have attempted to restore shrinking CIT bases in recent years. Both of these rules could have the undesirable effect of driving economic activity away from states because they raise effective tax rates for many businesses.
The imposition of an inheritance, estate, or gift tax above the federal tax in a given year might affect economic growth in a state since these taxes affect the overall tax burden that individuals face, and thus, may raise the overall cost of doing business in a state.13 Furthermore, an inheritance, estate, or gift tax may reduce economic growth by reducing the size of small businesses upon pa ssage from an owner to an heir. W ith this, we include a dummy variable for the presence of a state-level inheritance, estate, or gift tax above the federal tax.
All panel regressions include year fixed effects to account for unobserved heterogeneity within time periods across states (these also account for inflationary growth within the relevant variables in our model).14 The year effects account for economic conditions that affect all states, such as high gasoline prices or a national recession. All of the explanatory variables in our regression models (with the exception of all tax variables) are entered as natural logs.
Summary statistics for the dependent variables and control variables are provided in Appendix Table 6 for the first and last years of our d ataset. To no s urprise, GSP, and employment, and SPI were all growing faster at the beginning of our panel (a time of robust economic expansion) than toward the end of the panel (during the recent recession). Per capita measures suggest a similar story as both GSP and employment growth per capita were positive in 1998. GSP growth per capita was slower by about half in 2007 and employment per capita declined as a result of the recent recession. Population density, share of the population with a college degree, energy prices, and wages have all increased noticeably over the panel. Changes in the age distribution of the population reflect the aging of the baby boom generation. While the tax rate variables remained relatively stable over the period of analysis, the sales factor 13 By 2001, most states had eliminated their inheritance, estate, and gift taxes. Instead, they rely on a “pick-up” tax, which captures a portion of federal tax liability and does not affect the overall tax liability on the estate. See Conway and Rork (2004) for an excellent discussion of these taxes. 14 Bruce et al (2009) control for state agricultural and manufacturing intensity by including the share of a state’s GSP that is in the manufacturing or agricultural sectors. However, we exclude these measures since our focus relates to industry specific small business activity measures, the effects of which could be blurred by these measures.

15
apportionment weight increased significantly and there were noticeable shifts in combined reporting requirements and inheritance, estate, and gift taxes. For motivational purposes we provide a comparison of the GSP growth rate, the employment growth rate, and the total small business birth growth rate for each state in Appendix Table 7.15 Growth rates are shown for the second year of our dataset, over the previous year, and for the last year of our dataset, again over the previous year. Generally, states with higher growth in small business births appear to have higher rates of economic growth. In the section below we test whether this relationship is robust to the inclusion of the control variables discussed above.
Econometric Results
Regression results are presented in Tables 1 through 6. We begin by presenting results from models estimated with data from the later years (the NAICS period), first for the GSP measure of economic growth in Table 1, then with the employment growth measure in Table 2. We repeat this pattern with results from data from the earlier (SIC) years in Tables 3 and 4. Next we present results from our dynamic models in which we consider small business births and deaths in Tables 5 and 6. We then discuss our results and the associated policy implications and we close with a discussion of various robustness checks.
Results for Later Years
According to results presented in Table 1, we observe that several industry-specific measures of small business activity have statistically significant impacts on GSP growth. We find that states with more small business firms and establishments in the construction, retail trade, or finance/information industries exhibit lower rates of GSP growth, holding all of the other factors in the model constant (this result also holds for small business employment in finance/insurance). In contrast, however, results indicate that states with more small business establishments, employment and payroll in the real estate industry exhibit higher rates of GSP growth, and states with more small business firms and employment in the health care industry exhibit higher rates of GSP growth. Results do not identify a statistically significant relationship between the number of large businesses in a state and GSP growth, consistent with Bruce et al (2009). Also, results do not identify a statistically significant relationship between small business activity in neighboring states and GSP growth, thus helping to alleviate any concern that small business activity in neighboring states could draw economic activity away from a state.
In Table 2 we present results for the employment growth models, again using data from the later years. As with the GSP growth models, results indicate that small business activity in the real estate industry is associated with higher employment growth in all four models and small business activity in health care has a positive effect on employment growth in one of the four models. In addition, we find evidence of a positive relationship between small business
15 Alaska and Hawaii are included in this table but they are excluded from the econometric analysis below.

16
activity in transportation, professional services, health care, and various services and employment growth in several of the models. Also similar to the GSP growth models, we again find evidence of a negative relationship between small business activity in construction, retail trade, finance/insurance and employment growth in several of the models. Further, results indicate that states with more large business employment and payroll exhibit lower rates of employment growth. Also, results indicate that more small business activity in neighboring states leads to higher employment growth rates in three of the four models, providing evidence of positive spillover benefits of small business activity to employment growth in other states.
Turning to the various control variables in both Tables 1 and 2, we find several consistent determinants of GSP growth and a few surprising results. Inconsistent with expectations, we do not find evidence of a “catch-up” effect given the statistically insignificant coefficient on the natural log of GSP and employment in the previous year in seven of the eight models. Results indicate that higher population densities, higher unemployment rates, higher energy prices, and higher wages are associated with lower GSP or employment growth in the majority of cases. P erhaps surprisingly, the results do not identify a statistically significant relationship between any of the tax parameters and GSP growth. However, results indicate a negative relationship between the top personal income tax rate and employment growth in three of the four models and there is scattered evidence of a statistically significant relationship between the sales tax rate and a throwback rule with employment growth. F urther, results consistently indicate that the population share in the age 25-44 category is positively related to employment growth while the population share in the age 45-64 category is negatively related to employment growth. This result makes sense given that the younger age cohort has greater potential for labor force growth.
Results for Earlier Years
Results for our models from the early (SIC) years are presented in Tables 3 and 4. As noted above, the SIC coding system entails a smaller number of major industry groups, but there is some comparability with industry groups in the NAICS coding system. Generally speaking, in this earlier period we find more consistent evidence of a statistically significant and positive relationship between small business activity and measures of economic growth. This may reflect the more robust national economy that was present in the United States during the late 1980s and 1990s.
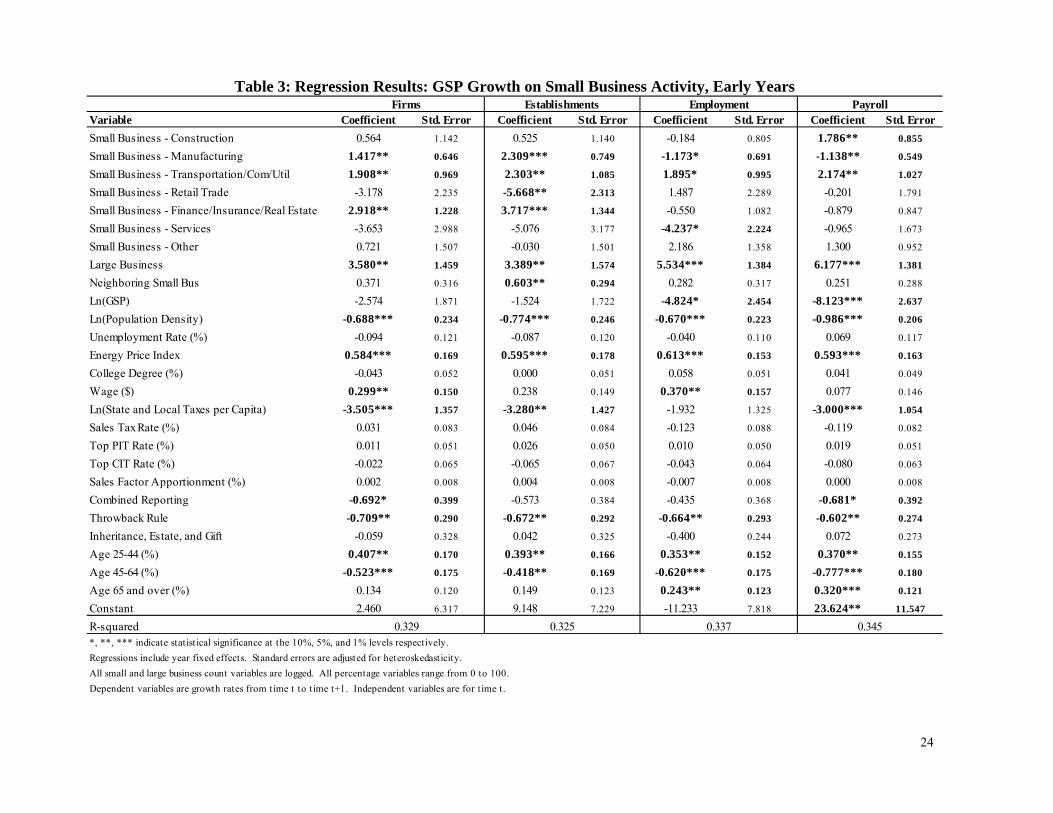
As reported in Table 3, results again indicate that industry-specific small business activities, at least by some measures, have an influence on GSP growth. As with our results from the later period reported above, we find evidence of a negative relationship between small business retail establishments and GSP growth. In addition, we also find evidence of a negative relationship between small business employment in the service sector and GSP growth (this particular result is not comparable to the analysis for later years given a relatively large difference in industry definition in this category). The influence of other small business sectors, however, is generally positive. Small business activity in the finance, insurance, and real estate industry is associated with faster GSP growth in two of the models (finance/insurance and real estate were separate in the NAICS years, as reported earlier, and tended to have opposing effects on GSP growth in those years). Small business activity in the transportation, communication, and public utilities industry by all measures has a positive and
17
significant effect on GSP growth. Small business activity in the construction industry has a positive and statistically significant impact on GSP growth in one case in the early years, which stands in contrast to the negative impacts found in later years. The influence of manufacturing business activity had a mixed effect on GSP growth. The number of manufacturing firms and establishments had a positive and significant effect but manufacturing employment and payroll had a n egative effect. These results may be consistent with the role of small firm agglomeration in state growth.
Large businesses had a consistent and significant positive effect on G SP growth. Further, as in the later years, small business activity in neighboring states had a positive impact on growth in one model and is statistically insignificant otherwise. This finding again provides some support for the idea of a positive spillover from neighboring states and more strongly opposes the idea of a negative spillover.
Results are similar in Table 4 where we present results from the employment growth model. Small business activity in the retail trade sector again has a negative impact on economic growth in two of the models. As was found for GSP growth, small business activity in transportation/communications/public utilities consistently have a positive and statistically significant impact on employment growth. Further, small businesses activity in the manufacturing sector has a positive and statistically significant impact on employment growth in two of the models. Large business activity also has a consistent and positive impact on employment growth and small business activity in neighboring states has a positive impact on employment growth in one model and a statistically insignificant impact in the remaining models.
Turning to the various control variables in Tables 3 and 4, we now a find negative and statistically significant effect on the lagged dependent variable in three of the eight models. Similar to the results from later years above, we find a negative effect of population density on GSP or employment growth in the early years. This result was not necessarily anticipated but is reasonable given that the model has multiple measures of business agglomeration captured in its small business (and large business) variables. After controlling for the growth benefits of business agglomeration, the main impact of population density could be congestion costs that reduce growth. In contrast to the results from the later years, average wages and energy prices have a p ositive effect on state GSP and employment growth. T hese are curious results. However, the finding for energy prices may make sense given the relatively low energy prices that prevailed during the late 1980s and 1990s. Prices only spiked during the first Gulf War, which also coincided with a recession. F urther, in a low energy price regime, the positive impact of higher prices on growth in energy states may outweigh the negative impacts on other states. The positive influence of wages on g rowth may indicate returns to education in the 1990s characterized by the expansion of high-wage, high-technology businesses in selected regions of the country. In addition, a larger state and local government (as measured by the log of total state and local tax revenues per capita) reduces GSP and employment growth in nearly all of the eight models.16 The throwback rule and combined reporting requirement have negative effects on GSP and employment growth in most of the models, and the top corporate
16 The finding of a negative GSP and employment growth effect on state and local taxes per capita in the late-1980s through the mid-to-late-1990s combined with the finding of a statistically insignificant effect in the late-1990s through the late-2000s is consistent with the result of Deskins and Hill (2010).

18
income tax rate also has a negative influence on employment growth. Finally, the top personal income tax rate has a positive impact on employment. Recall that, since we control for overall state and local taxes per capita, this effect is not due to a higher overall tax burden, but rather it is due to a) the distribution of a given tax burden across tax types or b) the progressivity of the state tax system.
Results for Small Business Births and Deaths
Next we examine results from our dynamic models in which business establishment births and deaths are used in place of static business counts. Looking at the 1999 to 2005 (NAICS) period reported in Table 5, we find that births in the professional services industry have a positive influence on bo th employment and GSP growth while deaths in professional services negatively impact GSP growth. Births in the information industry have a positive effect on GSP growth while deaths in that industry negatively impact both economic growth measures. Small business births and deaths in other industries are not found to influence growth consistently. However, deaths in construction are found to reduce employment growth, but, oddly, births in construction are found to reduce GSP growth. There is evidence that large business births positively influence both measures of economic growth while small business births (and deaths) in neighboring states increased (decreased) employment growth.
Results from the dynamic births and deaths model from the early years (SIC) are reported in Table 6. Here results indicate that births in the transportation/ communications/utilities and finance/insurance/real estate industries have positive effects on GSP growth while deaths in construction and transportation/communications/utilities have negative effects on G SP growth. Bi rths in finance/insurance/real estate, manufacturing, and services are found to positively affect employment growth while deaths in construction and finance/insurance/real estate negatively affect employment growth. Last, in contrast to every other specification in this study, in the dynamic model from the early years, small business births in neighboring states are found to negatively affect employment growth, while small business deaths in neighboring states are found to enhance employment growth. Looking to the remaining control variables in Tables 5 and 6, we find several consistent determinants of employment and GSP growth. States with higher initial levels of employment (or GSP) were found have slower economic growth in most models, as were states with a higher population density. As in Tables 1 through 4, energy prices were found to have a positive influence on growth in the 1990s and a negative influence on growth during the 2000s. Also similar to the earlier tables, higher state and local taxes are found to reduce employment growth during the early years but not during the later years. A younger working age population (25-44) is found to encourage growth in three of the four models while a larger population share in the 45-64 category is found to discourage economic growth in all models.
Discussion and Policy Implications
Several important results can be drawn from our analysis. First, we find strong evidence that the effect of small business activity on economic growth differs significantly by industry. This finding is vital for policymakers who must decide how to target limited resources toward the

19
highest value activities. In the later years of our analysis, results suggest that the count of small businesses in the real estate and health care industries have the greatest impact on economic growth while births in the professional and information services industries have the largest positive impact on economic growth. Further, results indicate that a concentration of small business activity in the construction, retail trade, and finance/insurance industries are not conducive to strong economic growth in the later years.
Second, however, an important finding is that our results vary significantly across time periods. In the early years of our da ta, small business activity in manufacturing, transportation/communications/utilities, and finance/insurance/real estate typically exhibit the strongest positive influence on economic growth.
An important theme overall from this research is that there is no one optimal industry to target across growth measures or time. It is not safe to assume that the relationships that were found to be the case in the later years of our a nalysis will persist into the future since the deterioration of the relationships found in the earlier years could be due to the relative weakness of the U.S. in the 2000s compared to the 1990s. In other words, the relationships between small business activity and state economic growth that were found in the earlier years could return as the U.S. economy improves, but more research is needed to investigate this possibility.
A third theme across our baseline models is the relative importance of small business activity compared to state policy control variables. In particular, the economic growth effects of our v arious policy tools, when they are statistically significant, are relatively small in magnitude when compared with the effect of small business activity in specific industries. This finding reveals that state efforts to promote small business formation in the optimal industries will be more fruitful in terms of generating economic growth than virtually any other policy option in our models, including such things as tax rates and rules.
One additional key theme from our baseline results is that small business activity in neighboring states is rarely found (in only one case) to reduce a state’s own rate of economic growth. And in several cases neighboring small business counts are found to positively impact a state’s own economic growth rate. This finding is consistent with Bruce et al (2009), and suggests that small business activity in a state has either no effect, or a positive spillover on growth in neighboring states.
Robustness Checks
To assess the sensitivity of our findings, we estimate a number of alternative versions of the baseline models reported above. Our first check considers SPI growth as an alternative to GSP and employment growth. Re sults from the SPI growth models are very similar to the GSP growth results; indeed none of our s ignificant conclusions change in these models relative to the GSP growth results. Therefore, we do not report the SPI growth results for brevity but they are available from the authors upon request.
In a second series of robustness checks, we experiment with alternative weighting schemes (population-contiguity and center as discussed above) for the neighbor-state small business variables. Recall that our baseline models use a contiguity weighting scheme where each neighboring state is equally weighted. Consequently, this robustness check amounts to the estimation of two new regressions for every one of our ba seline regressions. W hile

20
different weighting methods yield slightly different findings in some cases, the general themes from our baseline results remain. Specifically, we continue to find that small business activity in neighboring states leads to stronger economic growth in some specifications, and small business activity in neighboring states almost never leads to a reduction in economic growth.
In a third set of robustness checks we re-estimate our baseline models using per capita GSP and employment growth measures as the dependent variables. Our motivation here is the possibility that the effects that we have identified above of small business activities on state economic growth could be a) due to changes in population/labor, b) due to changes in productivity and, correspondingly, the standard of living, or c) a combination of the two. For instance, if small business activity in a given industry is found to increase GSP growth in our baseline specification, but if small business activity in that industry results in no change in GSP per capita growth, we would conclude that the former effect is purely due to a population/labor inflow.
The most common finding with this robustness check is expected: the direction of the effect of small business activities on economic growth remains, but the magnitude of the effect is smaller (in absolute value). This result implies that the effects identified above are derived from a combination of population/labor inflows/outflows and changes in the standard of living. However, we must note that there are a few cases in which the effect that is identified above disappears completely, indicating that such effect was entirely driven by population/labor inflows/outflows.
Conclusions
Using a 48-state panel of data spanning the years from 1988 through 2007, we find that small business activity can have very important effects on state economic growth, but that these effects vary significantly by industry. In particular, when examining data from the late-1990s through the late-2000s, results indicate that small business counts in the real estate and health care industries and small business births in the transportation/communications/utilities and finance insurance industries are most closely associated with stronger state economic growth, while small business activity in other industries is not conducive to economic growth. And while results always identify significant variation among industries in terms of economic growth impact, results vary by time period of analysis as well. When examining data from the late-1980s through the mid-to-late-1990s, results provide evidence that small business activity in the manufacturing, transportation/communications/utilities, and finance/insurance/real estate industries was most closely associated with faster state economic growth. A key issue regarding policy implications is the question of the appropriate industry to target for small business development incentives given the deterioration in the relationships identified from the earlier data. From our r esults we cannot be certain whether the most recent pattern will continue, whether state economies will return to the pattern experienced in the late-1980s through the mid-to-late 1990s, or whether a new pattern will emerge. Additional research is needed to address this question.
Our models also account for a broad menu of policy variables, including such high-profile policy parameters as tax rates and other features of state tax structures that are often

21
manipulated with the stated intent of encouraging economic growth. Our results indicate that in the large majority of cases the positive economic growth effects of small business activity in the identified industries is larger than the growth effects of these state policy parameters. This general finding indicates that the most fruitful policy option available to state governments is likely the establishment and maintenance of a fertile environment for new small business formation in the optimal industries.
Our estimation procedure accounts for cross-border spillover effects of small business activity by controlling for small business activity in neighboring states. While one might think that a greater amount of small business activity in neighboring states might detract from a state’s own rate of economic growth, our results reveal the opposite. In the large majority of cases our re sults indicate that neighbor-state small business activity has either a positive or statistically insignificant effect on economic growth. Given these potential positive spillovers, states need not worry about losing small business activity to other states because it does not appear that small business activity is a zero-sum game between neighboring states.

22
Table 1: Regression Results: GSP Growth on Small Business Activity, Later Years
Variable Coefficient Std. Error Coefficient Std. Error Coefficient Std. Error Coefficient Std. ErrorSmall Business - Construction -2.163* 1.178 -2.306** 1.136 -1.250 1.168 -1.248 1.266
Small Business - Manufacturing -0.16 0.623 -0.170 0.642 -1.182 0.748 -0.118 0.642
Small Business - Retail Trade -4.552*** 1.539 -3.884** 1.556 -2.099 1.761 -1.803 1.558
Small Business - Transportation 0.315 0.784 0.544 0.788 1.185 0.761 0.956 0.826
Small Business - Information -0.09 0.943 0.219 1.015 0.349 0.852 0.135 0.627
Small Business - Finance/Insurance -1.836* 1.088 -2.233** 1.079 -2.214** 0.971 -0.206 0.642
Small Business - Real Estate 1.401 0.872 1.666* 0.884 2.122* 1.179 2.554* 1.425
Small Business - Professional 0.517 1.374 0.367 1.338 -0.479 1.240 0.414 0.846
Small Business - Various Services 0.874 1.603 0.998 1.564 1.913 1.614 -0.080 1.383Small Business - Health Care 3.327** 1.602 2.800 1.761 3.064** 1.301 -0.051 1.574Small Business - Other 2.003 1.792 1.418 1.671 -1.710 1.814 -0.757 1.320Large Business 0.492 1.758 1.568 1.554 0.705 1.208 -1.037 1.394Neighboring Small Bus 0.057 0.284 0.200 0.286 0.419 0.357 0.269 0.293Ln(GSP) -0.481 1.873 -1.511 1.880 -0.470 1.841 0.782 2.571Ln(Population Density) -0.494** 0.241 -0.489** 0.247 -0.260 0.259 -0.408* 0.226Unemployment Rate (%) -0.386** 0.152 -0.374** 0.149 -0.320** 0.154 -0.232 0.154
Energy Price Index -0.219** 0.108 -0.239** 0.108 -0.161 0.118 -0.103 0.120
College Degree (%) 0.043 0.051 0.055 0.049 0.078* 0.046 0.060 0.048
Wage ($) -0.291*** 0.090 -0.303*** 0.090 -0.263*** 0.084 -0.173** 0.087
Ln(State and Local Taxes per Capita) 2.099 1.433 2.565 1.610 -0.727 1.429 -0.707 1.211
Sales Tax Rate (%) -0.067 0.091 -0.043 0.092 0.079 0.081 0.092 0.080
Top PIT Rate (%) -0.022 0.043 -0.025 0.044 0.014 0.041 0.001 0.043
Top CIT Rate (%) -0.063 0.073 -0.082 0.078 -0.105 0.064 -0.052 0.068
Sales Factor Apportionment (%) 0.001 0.005 0.0004 0.005 0.003 0.005 0.002 0.005Combined Reporting -0.226 0.321 -0.206 0.320 0.230 0.366 0.096 0.355Throwback Rule -0.276 0.270 -0.168 0.273 0.301 0.276 -0.013 0.246Inheritance, Estate, and Gift -0.063 0.297 -0.063 0.296 0.182 0.261 0.094 0.288Age 25-44 (%) 0.042 0.121 0.021 0.114 0.084 0.124 0.142 0.129Age 45-64 (%) -0.106 0.112 -0.126 0.109 -0.144 0.092 -0.092 0.104Age 65 and over (%) 0.073 0.123 0.04 0.136 0.040 0.134 0.162 0.140Constant 18.256*** 6.931 21.504*** 7.592 7.605 8.964 12.551 11.942R-squared*, **, *** indicate statistical significance at the 10%, 5%, and 1% levels respectively.Regressions include year fixed effects. Standard errors are adjusted for heteroskedasticity.All small and large business count variables are logged. All percentage variables range from 0 to 100.Dependent variables are growth rates from time t to time t+1. Independent variables are for t ime t.
0.408 0.407 0.379 0.372
Firms Establishments Employment Payroll

23
Table 2: Regression Results: Employment Growth on Small Business Activity, Later Years
Variable Coefficient Std. Error Coefficient Std. Error Coefficient Std. Error Coefficient Std. ErrorSmall Business - Construction -0.336 0.504 -0.313 0.487 -1.020* 0.535 -0.075 0.477
Small Business - Manufacturing -0.260 0.241 -0.262 0.262 -0.164 0.285 0.032 0.247
Small Business - Retail Trade -1.289** 0.628 -0.718 0.648 -2.257*** 0.768 -0.356 0.720
Small Business - Transportation -0.406 0.351 -0.310 0.369 0.873*** 0.339 0.436 0.361
Small Business - Information -0.189 0.388 -0.022 0.414 0.135 0.344 0.109 0.231
Small Business - Finance/Insurance -1.074** 0.450 -1.232*** 0.430 -1.648*** 0.398 -0.120 0.273
Small Business - Real Estate 0.897** 0.370 0.865** 0.367 0.923** 0.465 1.122** 0.506
Small Business - Professional 0.660 0.587 0.874 0.601 0.689 0.586 1.004** 0.410
Small Business - Various Services 1.248** 0.544 1.266** 0.550 0.947 0.754 0.073 0.619
Small Business - Health Care 1.243* 0.679 0.669 0.757 0.373 0.604 -0.103 0.730
Small Business - Other -0.681 0.748 -1.057 0.707 -2.352*** 0.760 -1.116** 0.556
Large Business 0.076 0.588 0.208 0.764 -1.152* 0.619 -0.885** 0.432
Neighboring Small Bus 0.173 0.109 0.195* 0.103 0.288** 0.142 0.259** 0.123
Ln(Employment) 0.013 0.814 -0.067 1.342 4.455** 1.778 -0.308 1.036
Ln(Population Density) -0.334*** 0.105 -0.348*** 0.107 -0.234* 0.127 -0.319*** 0.114
Unemployment Rate (%) -0.148** 0.064 -0.114** 0.064 -0.131* 0.061 -0.053 0.057
Energy Price Index -0.098** 0.047 -0.112** 0.048 -0.044 0.051 -0.012 0.057
College Degree (%) 0.018 0.021 0.016 0.022 0.024 0.021 0.001 0.023
Wage ($) -0.152*** 0.035 -0.146*** 0.037 -0.111*** 0.038 -0.106*** 0.037
Ln(State and Local Taxes per Capita) 0.088 0.471 0.027 0.479 -0.262 0.566 -0.542 0.653
Sales Tax Rate (%) 0.019 0.034 0.037 0.035 0.051 0.031 0.054* 0.029
Top PIT Rate (%) -0.033** 0.016 -0.029* 0.016 -0.039** 0.016 -0.020 0.018
Top CIT Rate (%) -0.012 0.029 -0.020 0.030 -0.022 0.027 -0.021 0.027
Sales Factor Apportionment (%) 0.000 0.002 0.001 0.002 0.001 0.002 -0.004 0.002
Combined Reporting 0.056 0.137 0.057 0.137 0.151 0.167 0.122 0.166
Throwback Rule -0.164 0.104 -0.112 0.104 -0.038 0.108 -0.224** 0.105
Inheritance, Estate, and Gift 0.012 0.116 0.051 0.114 0.003 0.114 0.056 0.127
Age 25-44 (%) 0.110*** 0.042 0.103** 0.042 0.104** 0.043 0.157*** 0.048
Age 45-64 (%) -0.088* 0.046 -0.094** 0.046 -0.091** 0.042 -0.078* 0.045
Age 65 and over (%) 0.068 0.051 0.075 0.057 0.066 0.055 0.064 0.056
Constant 2.335 4.562 3.111 7.577 -9.176 6.548 7.704 8.166
R-squared*, **, *** indicate statistical significance at the 10%, 5%, and 1% levels respectively.Regressions include year fixed effects. Standard errors are adjusted for heteroskedasticity.All small and large business count variables are logged. All percentage variables range from 0 to 100.Dependent variables are growth rates from time t to time t+1. Independent variables are for t ime t.
0.699 0.697 0.693 0.677
Firms Establishments Employment Payroll
24
Table 3: Regression Results: GSP Growth on Small Business Activity, Early Years
Variable Coefficient Std. Error Coefficient Std. Error Coefficient Std. Error Coefficient Std. ErrorSmall Business - Construction 0.564 1.142 0.525 1.140 -0.184 0.805 1.786** 0.855
Small Business - Manufacturing 1.417** 0.646 2.309*** 0.749 -1.173* 0.691 -1.138** 0.549
Small Business - Transportation/Com/Util 1.908** 0.969 2.303** 1.085 1.895* 0.995 2.174** 1.027
Small Business - Retail Trade -3.178 2.235 -5.668** 2.313 1.487 2.289 -0.201 1.791
Small Business - Finance/Insurance/Real Estate 2.918** 1.228 3.717*** 1.344 -0.550 1.082 -0.879 0.847
Small Business - Services -3.653 2.988 -5.076 3.177 -4.237* 2.224 -0.965 1.673
Small Business - Other 0.721 1.507 -0.030 1.501 2.186 1.358 1.300 0.952
Large Business 3.580** 1.459 3.389** 1.574 5.534*** 1.384 6.177*** 1.381
Neighboring Small Bus 0.371 0.316 0.603** 0.294 0.282 0.317 0.251 0.288
Ln(GSP) -2.574 1.871 -1.524 1.722 -4.824* 2.454 -8.123*** 2.637
Ln(Population Density) -0.688*** 0.234 -0.774*** 0.246 -0.670*** 0.223 -0.986*** 0.206
Unemployment Rate (%) -0.094 0.121 -0.087 0.120 -0.040 0.110 0.069 0.117
Energy Price Index 0.584*** 0.169 0.595*** 0.178 0.613*** 0.153 0.593*** 0.163
College Degree (%) -0.043 0.052 0.000 0.051 0.058 0.051 0.041 0.049
Wage ($) 0.299** 0.150 0.238 0.149 0.370** 0.157 0.077 0.146
Ln(State and Local Taxes per Capita) -3.505*** 1.357 -3.280** 1.427 -1.932 1.325 -3.000*** 1.054
Sales Tax Rate (%) 0.031 0.083 0.046 0.084 -0.123 0.088 -0.119 0.082
Top PIT Rate (%) 0.011 0.051 0.026 0.050 0.010 0.050 0.019 0.051
Top CIT Rate (%) -0.022 0.065 -0.065 0.067 -0.043 0.064 -0.080 0.063
Sales Factor Apportionment (%) 0.002 0.008 0.004 0.008 -0.007 0.008 0.000 0.008
Combined Reporting -0.692* 0.399 -0.573 0.384 -0.435 0.368 -0.681* 0.392
Throwback Rule -0.709** 0.290 -0.672** 0.292 -0.664** 0.293 -0.602** 0.274
Inheritance, Estate, and Gift -0.059 0.328 0.042 0.325 -0.400 0.244 0.072 0.273
Age 25-44 (%) 0.407** 0.170 0.393** 0.166 0.353** 0.152 0.370** 0.155
Age 45-64 (%) -0.523*** 0.175 -0.418** 0.169 -0.620*** 0.175 -0.777*** 0.180
Age 65 and over (%) 0.134 0.120 0.149 0.123 0.243** 0.123 0.320*** 0.121
Constant 2.460 6.317 9.148 7.229 -11.233 7.818 23.624** 11.547
R-squared*, **, *** indicate statistical significance at the 10%, 5%, and 1% levels respectively.Regressions include year fixed effects. Standard errors are adjusted for heteroskedasticity.All small and large business count variables are logged. All percentage variables range from 0 to 100.Dependent variables are growth rates from time t to time t+1. Independent variables are for t ime t.
0.329 0.325 0.3450.337
Firms Establishments Employment Payroll

25
Table 4: Regression Results: Employment Growth on Small Business Activity, Early Years
Variable Coefficient Std. Error Coefficient Std. Error Coefficient Std. Error Coefficient Std. ErrorSmall Business - Construction -0.857* 0.487 -0.862* 0.495 -0.056 0.440 0.717 0.526
Small Business - Manufacturing 0.986*** 0.332 1.355*** 0.360 -0.482 0.330 -0.309 0.276
Small Business - Transportation/Com/Util 1.500*** 0.479 1.768*** 0.539 0.549 0.435 0.746* 0.430
Small Business - Retail Trade -3.911*** 1.224 -5.197*** 1.297 -0.817 1.107 -1.097 1.023
Small Business - Finance/Insurance/Real Estate 0.559 0.537 0.851 0.539 -0.867 0.587 -0.878** 0.437
Small Business - Services 1.844 1.220 0.757 1.193 -0.926 1.060 0.317 0.803
Small Business - Other -0.086 0.635 -0.316 0.651 1.666*** 0.639 0.766 0.468
Large Business 1.838** 0.741 1.928** 0.840 2.592*** 0.736 2.172*** 0.520
Neighboring Small Bus 0.147 0.152 0.291** 0.137 0.075 0.155 0.106 0.129
Ln(Employment) -1.118 1.249 -0.400 1.390 -1.610 2.119 -2.319* 1.337
Ln(Population Density) -0.710*** 0.104 -0.743*** 0.108 -0.801*** 0.136 -0.920*** 0.148
Unemployment Rate (%) -0.088 0.061 -0.071 0.064 -0.051 0.053 0.000 0.061
Energy Price Index 0.389*** 0.074 0.408*** 0.076 0.389*** 0.074 0.389*** 0.084
College Degree (%) -0.062** 0.024 -0.037 0.025 -0.003 0.024 -0.006 0.025
Wage ($) 0.205*** 0.068 0.018*** 0.066 0.287*** 0.072 0.138* 0.073
Ln(State and Local Taxes per Capita) -2.250*** 0.650 -1.986*** 0.671 -2.485*** 0.575 -3.284*** 0.726
Sales Tax Rate (%) 0.022 0.042 0.022 0.046 -0.034 0.039 -0.009 0.043
Top PIT Rate (%) 0.056* 0.028 0.056* 0.029 0.044* 0.027 0.055* 0.029
Top CIT Rate (%) -0.076** 0.034 -0.097*** 0.035 -0.068** 0.033 -0.084** 0.033
Sales Factor Apportionment (%) 0.000 0.003 0.001 0.003 -0.003 0.004 0.000 0.003
Combined Reporting -0.309* 0.178 -0.244 0.174 -0.202 0.187 -0.253 0.202
Throwback Rule -0.460*** 0.141 -0.435*** 0.140 -0.309* 0.162 -0.304** 0.148
Inheritance, Estate, and Gift -0.083 0.164 -0.060 0.161 -0.247* 0.133 -0.048 0.153
Age 25-44 (%) 0.096 0.074 0.077 0.074 0.130** 0.065 0.141** 0.067
Age 45-64 (%) -0.239*** 0.080 -0.184** 0.075 -0.305*** 0.068 -0.329*** 0.070
Age 65 and over (%) 0.030 0.049 0.020 0.050 0.120** 0.052 0.140*** 0.052
Constant 8.308 6.468 9.365 8.015 3.049 7.400 14.968 10.256
R-squared*, **, *** indicate statistical significance at the 10%, 5%, and 1% levels respectively.Regressions include year fixed effects. Standard errors are adjusted for heteroskedasticity.All small and large business count variables are logged. All percentage variables range from 0 to 100.Dependent variables are growth rates from time t to time t+1. Independent variables are for t ime t.
0.618 0.615 0.616 0.607
Firms Establishments Employment Payroll

26
Table 5: Regression Results: Economic Growth on Business Births and Deaths, Later Years
Variable Coefficient Standard Error Coefficient Standard ErrorSmall Business Births - Construction -2.086* 1.174 0.568 0.424Small Business Births - Manufacturing 0.048 0.903 0.337 0.314Small Business Births - Retail Trade 1.601 1.806 -0.495 0.631Small Business Births - Transportation 0.157 1.121 -0.016 0.356Small Business Births - Information 1.133* 0.602 0.245 0.270Small Business Births - Finance/Insurance -0.560 0.780 -0.423 0.285Small Business Births - Real Estate 0.758 0.820 0.189 0.325Small Business Births - Professional 3.442** 1.472 1.425** 0.559Small Business Births - Various Services 1.395 1.813 0.305 0.667Small Business Births - Health Care -0.514 1.055 0.482 0.371Small Business Births - Other 0.491 1.044 -0.139 0.432Small Business Deaths - Construction -0.529 1.219 -1.165*** 0.423Small Business Deaths - Manufacturing -0.069 0.857 -0.142 0.332Small Business Deaths - Retail Trade -2.747 1.666 0.342 0.634Small Business Deaths - Transportation -0.313 1.034 -0.416 0.357Small Business Deaths - Information -2.395*** 0.687 -0.494** 0.224Small Business Deaths - Finance/Insurance -0.450 0.783 -0.415 0.321Small Business Deaths - Real Estate 0.450 0.894 0.111 0.340Small Business Deaths - Professional -3.147** 1.474 -0.631 0.512Small Business Deaths - Various Services 0.111 1.799 1.514** 0.726Small Business Deaths - Health Care 2.795** 1.358 0.295 0.485Small Business Deaths - Other 1.317 1.195 0.098 0.534Large Business Births 2.228** 1.031 0.812** 0.368Large Business Deaths -1.438 0.948 0.127 0.340Neighboring Small Business Births 2.197 1.975 1.833** 0.784Neighboring Small Business Deaths -1.816 2.004 -1.559* 0.797Ln(GSP) or Ln(Employment) -2.171 1.430 -2.651*** 0.606Ln(Population Density) -0.331 0.202 -0.345*** 0.086Unemployment Rate (%) -0.151 0.161 -0.054 0.059Energy Price Index -0.230** 0.107 -0.071* 0.042College Degree (%) 0.126*** 0.045 0.037* 0.021Wage ($) -0.233** 0.094 -0.087** 0.039Ln(State and Local Taxes per Capita) 3.032** 1.272 -0.266 0.444Sales Tax Rate (%) -0.108 0.086 0.066** 0.033Top CIT Rate (%) -0.043 0.072 0.008 0.027Top PIT Rate (%) -0.055 0.043 -0.041** 0.017Sales Factor Apportionment (%) 0.004 0.006 0.002 0.002Combined Reporting -0.038 0.348 0.031 0.147Throwback Rule -0.426 0.314 -0.245** 0.114Inheritance, Estate, and Gift 0.008 0.291 0.024 0.127Age 25-44 (%) -0.040 0.146 0.093* 0.053Age 45-64 (%) -0.242** 0.108 -0.120** 0.047Age 65 and over (%) 0.045 0.129 0.034 0.050Constant 22.442*** 7.864 22.121*** 4.696R-squared*, **, *** indicate statistical significance at the 10%, 5%, and 1% levels respectively.Regressions include year fixed effects. Standard errors are adjusted for heteroskedasticity.All small and large business count variables are logged. All percentage variables range from 0 to 100.Dependent variables are growth rates from time t to time t+1. Independent variables are for t ime t.
GSP Employment
0.490 0.773

27
Table 6: Regression Results: Economic Growth on Business Births and Deaths, Early Years
Variable Coefficient Standard Error Coefficient Standard ErrorSmall Business Births - Construction 1.480 1.193 0.419 0.509Small Business Births - Manufacturing -0.233 1.385 1.359** 0.576Small Business Births - Transportation/Com/Util 2.450** 1.020 0.232 0.553Small Business Births - Retail Trade 2.326 2.731 -0.243 1.036Small Business Births - Finance/Insurance/Real Estate 1.998* 1.058 1.160*** 0.392Small Business Births - Services 2.261 2.491 1.715* 0.961Small Business Births - Other -1.723 1.297 0.463 0.624Small Business Deaths - Construction -1.932** 0.934 -1.330*** 0.422Small Business Deaths - Manufacturing 1.376 1.259 -0.505 0.555Small Business Deaths - Transportation/Com/Util -2.318** 1.008 0.011 0.519Small Business Deaths - Retail Trade -2.615 2.205 -1.361 1.093Small Business Deaths - Finance/Insurance/Real Estate -0.473 1.261 -0.957** 0.477Small Business Deaths - Services -2.267 2.736 0.124 1.098Small Business Deaths - Other 0.526 1.201 -0.453 0.646Large Business Births 1.480 1.537 0.108 0.387Large Business Deaths 0.783 1.628 1.365** 0.472Neighboring Small Business Births -2.751 2.135 -2.392** 1.214Neighboring Small Business Deaths 3.295 2.076 2.632** 1.193Ln(GSP) or Ln(Employment) -2.782** 1.378 -2.039*** 0.701Ln(Population Density) -0.595** 0.265 -0.638*** 0.118Unemployment Rate (%) -0.080 0.137 -0.014 0.063Energy Price Index 0.372** 0.164 0.224*** 0.069College Degree (%) -0.009 0.046 -0.016 0.023Wage ($) 0.175 0.151 0.078 0.064Ln(State and Local Taxes per Capita) -2.165 1.409 -1.968*** 0.594Sales Tax Rate (%) 0.086 0.087 0.072 0.041Top CIT Rate (%) -0.002 0.077 -0.023 0.039Top PIT Rate (%) -0.015 0.060 0.015 0.028Sales Factor Apportionment (%) 0.004 0.009 0.003 0.003Combined Reporting -0.251 0.417 -0.285* 0.164Throwback Rule -0.294 0.319 -0.130 0.137Inheritance, Estate, and Gift 0.060 0.336 0.134 0.148Age 25-44 (%) 0.368** 0.165 0.122* 0.071Age 45-64 (%) -0.417** 0.175 -0.225*** 0.078Age 65 and over (%) 0.149 0.120 0.057 0.050Constant 8.259 9.077 17.112*** 5.998R-squared*, **, *** indicate statistical significance at the 10%, 5%, and 1% levels respectively.Entries are regression coefficients followed by standard errors in parentheses.Regressions include year fixed effects. Standard errors are adjusted for heteroskedasticity.All small and large business count variables are logged. All percentage variables range from 0 to 100.Dependent variables are growth rates from time t to time t+1. Independent variables are for t ime t.
GSP Employment
0.379 0.676

28
References
Acs, Zoltan and Catherine Armington. 2004. “Employment Growth and Entrepreneurial Activity in
Cities.” Regional Studies 38: 911-927. Barro, Robert and Xavier Sala-i-Martin. 19 91. “ Convergence Across States and Regions.”
Brookings Papers on Economic Activity 1: 107-182. Baumol, William. 1968. “ Entrepreneurship and Economic Activity.” American Economic Review
Paper and Proceedings 58: 64-71. Bruce, Donald, and John Deskins. 2005. “State Tax Policy and Entrepreneurial Activity.” Small Business Economics, Forthcoming. Bruce, Donald, John Deskins, Brian Hill, and Jonathan Rork. 2009. “(Small) Business Activity and State Growth: Does Size Matter?” Regional Studies, 43(2), March. Bruce, Donald, John Deskins, Brian Hill, and Jonathan Rork. 2007. “Small Business and State Growth: An Econometric Investigation.” Washington, DC: U.S. Small Business Administration, Report Number 292, February. Deskins, John, and Brian Hill. 2010. “State Taxes and Economic Activity Revisited: Have Distortions Changed?” The Annals of Regional Science, 44(2), April. Gurley-Calvez, Tami, and Donald Bruce. 2008. “Do Tax Cuts Promote Entrepreneurial Longevity?” National Tax Journal, 61(2), June. Ciccone, Antonio, and Robert E. Hall. 1996. “Productivity and the Density of Economic Activity.” American Economic Review 86(1): 54-70. Cline, Robert, William Fox, Thomas S. Neubig, and Andrew Phillips. 2003a. “A Closer
Examination of the Total State and Local Business Tax Burden.” State Tax Notes, January 27: 295-303. Cline, Robert, William Fox, Thomas S. Neubig, and Andrew Phillips. 2003b. “Total State and Local Business Taxes: Fiscal Year 2003 Update.” State Tax Notes, October 20: 205-210. Conway, Karen and Jonathan Rork. 2004. “Diagnosis Murder: The Death of State ‘Death’ Taxes.”
Economic Inquiry 42(4):537-559. Edmiston, Kelly. 2002. “Strategic Apportionment of the State Corporate Income Tax.” National Tax Journal 60(2): 239-262. Fisher, Ronald. 1997. “The Effects of State and Local Public Services on Economic Development.”

29
New England Economic Review March/April: 53-67. Gentry, William M. and R. Glenn Hubbard. 2000. “Tax Policy and Entrepreneurial Entry.” American Economic Review 90: 283-287. Goetz, Stephan J., Richard C. Ready and Brad Stone. 1996. “U.S. Economic Growth vs.
Environmental Conditions.” Growth and Change 27: 97-110. Headd, Brian. 2010. “An Analysis of Small Business and Jobs.” Washington, DC: U.S. Small Business Administration, March. Knight, Frank H. 1921. Risk, Uncertainty and Profit. Boston: Hart, Schaffner & Marx; Houghton
Mifflin Company. Lowrey, Ying. 2005. “ Business Density, Entrepreneurship and Economic Well-Being.” Paper
presented at the 2005 M eetings of the American Economic Association. A vailable at http://www.aeaweb.org/annual_mtg_papers/2005papers.html.
Munnell, Alicia H. 1990. “How Does Public Infrastructure Affect Regional Economic
Performance?” New England Economic Review Sept/Oct: 11-32. Reed, W. Robert. 2008. “The Robust Relationship between Taxes and U.S. State Income Growth.” National Tax Journal, 61(1), March. Schumpeter, Joseph A. 1911. The Theory of Economic Development: An Inquiry into Profits,
Capital, Credit, Interest, and the Business Cycle. Cambridge: Harvard University Press. Terkla, David G. and Peter B. Doeringer. 1991. “Explaining Variations in Employment Growth:
Structural and Cyclical Change Among States and Local Areas.” Journal of Urban Economics 29: 329-348.
Van Stel, Andre, Martin Carree and Roy Thurik. 2005. “The Effect of Entrepreneurial Activity on
National Economic Growth.” Small Business Economics 24: 311-321. Wasylenko, Michael. 1997. “Taxation and Economic Development: The State of the Economic
Literature.” New England Economic Review March/April: 37-52.

30
Appendix Table 1: Data Descriptions and Source Notes Variable DefinitionSmall Business Firms… Number of firms with less than 500 employees, by industry. (1)Small Business Establishments… Number of physical locations associated with firms that have less than 500 employees, by industry. (1)Small Business Employment… Total employment of firms that have less than 500 employees, by industry. (1)Small Business Payroll… Totally payroll of firms that have less than 500 employees, by industry. (1)Small Business Births… Number of establishment births associated with firms that have less than 500 employees, by industry. (1)Small Business Deaths… Number of establishment deaths associated with firms that have less than 500 employees, by industry. (1)Neighboring Small Business… Equivalent small business measures for neighboring states. (1)Large Business… Equivalent measures for firms with more than 500 employees. (1)Gross State Product Growth Annual growth rate of Gross State Product. (2)State Personal Income Growth Annual growth rate of total State personal income. (3) Employment Growth Annual growth of total state employment. (2)Population Density Population/square miles in a state. (3)Unemployment Rate (%) State unemployment rate. (4) Energy Price Index Index of energy costs for all forms of energy. (5)College Degree (%) Share of state population with a bachelor's degree or higher. (3)Wage ($) Average hourly wage for manufacturing workers. (6)State and Local Taxes per Capita Total state and local tax collections divided by population. (3)Sales Tax Rate (%) General sales tax rate. (7)Top CIT Rate (%) Highest marginal corporate income tax rate. (7)Top PIT Rate (%) Highest marginal personal income tax rate. (7)Sales Factor Apportionment (%) Weight given to sales factor in the corporate income tax apportionment formula. (7)Combined Reporting 1 if a state has a combined reporting requirement. (8)Throwback Rule 1 if a state has a throwback rule. (8)Inheritance, Estate, and Gift Taxes 1 if a state has an inheritance, estate, or gift tax. (9)Age 25-44 (%) Share of state population between the ages of 25-44. (3)Age 45-64 (%) Share of state population between the ages of 45-64. (3)Age 65 and over (%) Share of state population over the age of 64. (3)
Notes:1. Author's calculations based on data from the U.S. Small Business Administration in conjunction with the U.S. Census Bureau, various years.2. Authors' calculations based on data from Regional Economic Accounts , Bureau of Economic Analysis, various years.3. Authors' calculations based on data from U.S. Census Bureau, various years.4. U.S. Census Bureau, various years.5. Energy Price Estimates by Source , U.S. Department of Energy, various years.6. Employemnt and Wages , U.S. Bureau of Labor Statistics, various years.7. State Tax Handbook , Commerce Clearing House, various years.8. State Tax Handbook , Commerce Clearing House, various years and various state revenue departments.9. Conway and Rork (2004) and State Tax Handbook , Commerce Clearing House, various years.

31
Appendix Table 2: Average Small and Large Business Measures Across States, Later Years
Variable 1998 2007 1998 2007 1998 2007 1998 2007Small Bus - Construction 13,714 15,995 13,745 16,052 104,013 123,706 3,443 5,456
(12,305) (15,169) (12,338) (15,233) (101,324) (134,635) (3,493) (6,096)Small Bus - Manufacturing 6,387 5,765 6,554 5,920 140,247 118,321 4,280 4,741
(7,724) (6,708) (7,898) (6,856) (169,962) (134,271) (5,393) (5,643)Small Bus - Retail Trade 14,882 14,350 16,741 16,041 127,611 122,612 2,716 3,366
(14,339) (14,650) (15,989) (16,128) (117,524) (118,697) (2,704) (3,532)Small Bus - Transportation 3,154 3,536 3,266 3,659 30,107 32,331 800 1,148
(2,865) (3,367) (3,004) (3,521) (31,399) (32,489) (865) (1,215)Small Bus - Information 1,526 1,539 1,604 1,629 17,926 17,437 730 978
(2,151) (2,296) (2,227) (2,377) (23,242) (23,073) (1,364) (1,744)Small Bus - Finance/Insurance 4,500 5,377 5,309 6,455 37,520 42,580 1,619 2,778
(4,625) (5,852) (5,349) (6,675) (40,740) (45,125) (2,435) (4,422Small Bus - Real Estate 4,862 6,048 5,221 6,486 26,033 29,942 689 1,136
(6,021) (7,668) (6,415) (8,178) (32,854) (38,554) (975) (1,643)Small Bus - Professional 12,894 15,850 13,153 16,198 79,439 99,137 3,539 5,915
(15,167) (19,380) (15,512) (19,812) (95,903) (121,104) (4,835) (8,168)Small Bus - Various Services 17,884 20,356 18,957 21,547 236,394 276,780 4,098 6,284
(19,292) (22,347) (20,418) (23,595) (249,494) (292,839) (4,998) (7,743)Small Bus - Health Care 10,489 12,237 11,771 13,832 128,662 159,310 3,645 5,839
(12,179) (14,422) (13,428) (15,878) (128,062) (156,878) (3,770) (6,009)Small Bus - All Other 22,111 20,906 23,959 22,773 181,684 178,992 5,000 6,439
(23,472) (22,619) (25,338) (24,430) (192,827) (193,940) (5,732) (7,700)Large Business - Total 2,183 2,347 18,165 23,088 1,056,868 1,209,905 35,746 56,104
(1,219) (1,271) (18,718) (23,937) (1,122,671) (1,322,846) (41,672) (68,779)Neighboring Small Business 111,074 119,571 118,860 128,113 1,092,343 1,179,329 30,060 43,451
(58,858) (62,611) (62,729) (66,594) (590,688) (614,535) (17,941) (24,977)Notes: Entries are mean values, standard deviations are in parentheses.
Small businesses are defined as those with fewer than 500 employees and large businesses are all others.
Source: Authors' calculations based on data from the U.S. Small Business Administration.
Firms Establishments Employment Payroll ($millions)

32
Appendix Table 3: Average Small and Large Business Measures Across States, Early Years
Variable 1988 1997 1988 1997 1988 1997 1988 1997Small Bus - Construction 11,436 13,255 11,480 13,286 88,306 98,354 2,102 3,024
(11,794) (11,859) (11,839) (11,893) (99,907) (94,560) (2,542) (3,016)Small Bus - Manufacturing 6,439 6,703 6,635 6,908 143,847 145,455 3,095 4,347
(7,929) (7,743) (8,144) (7,958) (174,734) (172,019) (4,012) (5,447)Small Bus - Trans/Com/Utilities 3,501 4,460 3,670 4,737 37,330 44,241 752 1,187
(3,581) (4,223) (3,768) (4,512) (38,920) (44,634) (835) (1,254)Small Bus - Retail Trade 21,989 22,053 24,843 24,804 211,796 222,482 2,459 3,338
(22,735) (22,101) (25,623) (24,644) (220,887) (214,752) (2,793) (3,417)Small Bus - Finance/Ins/Real Estate 8,008 9,262 8,416 10,378 59,193 61,661 1,363 2,134
(9,856) (10,551) (10,252) (11,636) (73,225) (72,093) (2,024) (3,102)Small Bus - Services 36,680 44,563 38,606 47,273 312,380 408,918 5,825 10,715
(42,025) (49,037) (44,215) (51,883) (356,387) (438,563) (7,725) (13,163)Small Bus - All Other 11,615 11,439 12,868 12,638 101,296 105,920 2,347 3,425
(13,241) (13,278) (14,503) (14,436) (116,306) (122,378) (2,911) (4,221)Large Business - Total 1,636 2,107 13,410 17,482 794,551 1,011,025 19,018 32,469
(977) (1,186) (14,530) (17,992) (899,388) (1,067,296) (23,517) (37,694)Neighboring Small Business 99,012 110,557 105,772 118,756 954,949 1,084,048 17,981 28,179
(55,155) (58,482) (58,610) (62,557) (552,831) (583,903) (11,643) (16,723)Notes: Entries are mean values, standard deviations are in parentheses.
Small businesses are defined as those with fewer than 500 employees and large businesses are all others.
Source: Authors' calculations based on data from the U.S. Small Business Administration.
Firms Establishments Employment Payroll ($millions)

33
Appendix Table 4: Average Small and Large Business Births and Deaths Across States, Later Years
Variable 1999 2006 1999 2006Small Births/Deaths - Construction 1,643 2,195 1,410 1,654
(1,573) (2,268) (1,298) (1,609)Small Births /Deaths- Manufacturing 471 434 556 476
(630) (571) (723) (613)Small Births/Deaths - Retail Trade 1,448 1,633 1,661 1,713
(1,576) (1,878) (1,698) (1,808)Small Births/Deaths - Transportation 425 487 380 417
(398) (499) (361) (402)Small Births/Deaths - Information 214 190 189 171
(336) (302) (283) (259)Small Births/Deaths - Finance/Insurance 523 677 444 520
(584) (824) (496) (600)Small Births/Deaths - Real Estate 549 889 537 676
(681) (1,207) (661) (892)Small Births/Deaths - Professional 1,529 1,875 1,244 1,490
(1,928) (2,512) (1,533) (1,900)Small Births/Deaths - Various Services 2,093 2,642 2,043 2,271
(2,284) (3,006) (2,265) (2,528)Small Births/Deaths - Health Care 879 1,140 896 901
(1,039) (1,383) (1,073) (1,117)Small Births/Deaths - All Other 2,387 2,060 2,954 2,908
(2,852) (2,504) (3,476) (3,355)Large Births/Deaths - Total 2,062 2,234 1,506 1,582
(2,260) (2,418) (1,746) (1,659)Neighboring Small Births/Deaths 11,881 13,696 11,229 12,100
(6,318) (7,366) (5,949) (6,392)Notes: Entries are mean values, standard deviations are in parentheses.
Small businesses are defined as those with fewer than 500 employees and large businesses are all others.
Source: Authors' calculations based on data from the U.S. Small Business Administration.
Births Deaths

34
Appendix Table 5: Average Small and Large Business Births and Deaths Across States,
Early Years
Variable 1990 1998 1990 1998Small Births/Deaths- Construction 1,657 1,585 1,506 1,441
(2,025) (1,461) (1,657) (1,361)Small Births/Deaths - Transportation/Com/Util 665 554 615 574
(858) (704) (803) (717)Small Births/Deaths - Wholesale Trade 493 582 447 538
(505) (558) (470) (530)Small Births/Deaths - Retail Trade 2,807 2,422 2,848 2,654
(3,099) (2,574) (3,116) (2,727)Small Births/Deaths - Fin/Ins/Real Estate 1,004 1,067 880 937
(1,385) (1,237) (1,152) (1,125)Small Births/Deaths - Services 4,207 4,715 3,511 4,189
(5,170) (5,542) (4,346) (4,932)Small Births/Deaths - All Other 1,465 1,421 1,445 1,173
(1,800) (1,852) (1,764) (1,490)Large Births/Deaths - Total 1,280 2,010 970 1,522
(1,432) (2,194) (1,059) (1,688)Neighboring Small Births/Deaths 11,904 12,032 11,039 11,217
(6,640) (6,380) (6,133) (5,931)Notes: Entries are mean values, standard deviations are in parentheses.
Small businesses are defined as those with fewer than 500 employees and large businesses are all others.
Source: Authors' calculations based on data from the U.S. Small Business Administration.
Births Deaths

35
Appendix Table 6: Summary Statistics for Other Regression Variables
Variable Mean Std.Dev. Mean Std.Dev.GSP Growth Rate (%) 6.29 1.92 3.37 2.74Employment Growth Rate (%) 2.06 1.30 -0.02 1.02SPI Growth Rate (%) 7.59 1.56 4.56 2.24GSP per capita Growth Rate (%) 4.63 1.51 2.45 2.78Employment per capita Growth Rate (%) 0.69 0.51 -0.94 1.10Population Density 164.16 233.68 190.53 256.10Unemployment Rate (%) 5.49 1.91 4.27 0.99Energy Price Index 7.41 1.05 18.40 2.77College Degree (%) 19.74 4.12 26.74 4.69Wage ($) 10.05 1.17 16.83 1.93State and Local Taxes per Capita (000s) 1.70 0.43 4.10 0.99Sales Tax Rate (%) 4.30 1.73 4.82 1.89Top CIT Rate (%) 6.54 3.11 6.53 2.88Top PIT Rate (%) 5.64 3.52 5.33 2.98Sales Factor Apportionment (%) 34.38 17.44 54.49 29.91Combined Reporting 0.22 0.42 0.32 0.47Throwback Rule 0.49 0.50 0.46 0.50Inheritance, Estate, and Gift Taxes 0.50 0.51 0.22 0.42Age 25-44 (%) 31.81 1.95 27.74 1.36Age 45-64 (%) 18.38 1.22 25.25 1.75Age 65 and over (%) 12.20 2.15 12.61 1.72Note: GSP, employment, SPI, GSP per capita, and employment per capita growth rates listed are actually for 1989 and 2008.
Source: Various sources, as detailed in Appendix Table 1.
1988 2007

36
Appendix Table 7: GSP, Employment, and Small Business Births, by State
StateGSP Growth
Employment Growth
Small Business Birth Growth GSP Growth
Employment Growth
Small Business Birth Growth
Alabama 6.01 0.60 -3.44 5.26 2.37 7.44Alaska -11.67 2.40 2.27 10.04 2.19 10.58Arizona 3.79 0.45 1.59 10.17 4.91 15.87Arkansas 7.21 2.18 -0.99 5.82 2.18 11.61California 2.12 -0.50 -3.81 6.23 1.73 9.17Colorado 5.40 2.29 6.61 5.72 2.30 6.31Connecticut 1.30 -4.09 -7.89 6.49 1.42 5.70Delaware 8.73 -1.39 -0.05 3.43 1.90 0.62Florida 4.23 -0.34 -3.11 7.08 3.12 2.61Georgia 4.93 -1.15 -0.16 4.93 2.99 5.94Hawaii 5.45 2.88 3.01 7.33 2.53 13.93Idaho 4.60 3.16 -10.19 3.73 4.90 20.44Illinois 3.33 -0.34 0.21 5.57 1.52 4.79Indiana 3.35 0.07 -0.90 3.94 1.08 10.55Iowa 3.20 1.16 2.23 3.32 1.48 15.65Kansas 3.98 1.03 4.96 6.48 1.89 5.80Kentucky 4.66 -0.15 -3.19 5.47 1.58 5.60Louisiana 0.91 1.24 3.87 3.83 0.70 7.21Maine 0.53 -3.40 -4.49 4.51 1.02 12.32Maryland 2.27 -2.77 -6.23 5.08 1.78 7.62Massachusetts 0.76 -4.64 -4.97 4.36 1.50 6.41Michigan 2.36 -1.46 -2.40 0.36 -0.21 0.93Minnesota 3.20 0.94 4.38 3.16 1.32 9.28Mississippi 5.29 0.69 -1.71 5.48 1.76 10.70Missouri 5.26 -1.03 -0.85 3.22 1.48 -2.50Montana 4.67 2.36 2.76 6.96 3.12 16.33Nebraska 5.42 0.43 3.24 5.43 1.28 10.25Nevada 5.67 1.74 -1.20 7.89 4.85 11.77New Hampshire 4.10 -4.17 -5.78 4.41 1.18 5.86New Jersey 3.47 -3.24 -4.36 5.65 1.57 3.44New Mexico 13.01 2.96 3.65 5.32 2.77 12.01New York 0.84 -2.55 -2.90 7.12 1.29 4.54North Carolina 4.69 -0.95 -5.47 6.56 3.04 8.26North Dakota 1.57 2.20 1.30 5.50 2.07 11.79Ohio 2.84 -0.35 0.64 2.10 0.58 4.28Oklahoma 3.11 0.81 4.14 8.91 2.88 4.38Oregon 4.96 0.56 3.67 11.00 2.86 8.07Pennsylvania 3.95 -1.29 -2.91 5.04 1.43 4.03Rhode Island 0.34 -4.94 -11.69 5.03 0.90 8.74South Carolina 4.27 -1.40 0.13 5.05 2.54 4.41South Dakota 7.29 2.67 -1.40 2.53 2.05 11.94Tennessee 7.30 0.01 -0.67 5.22 1.90 6.52Texas 3.79 1.73 2.40 8.39 3.68 7.34Utah 6.96 2.38 9.01 10.17 5.17 15.60Vermont 0.50 -1.95 -8.78 3.78 0.79 7.45Virginia 4.14 -1.58 -6.97 4.98 1.66 8.74Washington 5.94 1.21 -1.52 7.19 3.01 8.96West Virginia 4.71 0.12 -1.29 6.26 1.49 4.35Wisconsin 4.43 0.93 4.27 4.56 1.18 7.77Wyoming 2.12 2.29 11.20 15.78 4.48 11.63Source: Various sources, as detailed in Appendix Table 1.
1989-1990 2005-2006