Understanding Infrastructure Financing for California Policy Institute of Occasional Papers...
60
Public Policy Institute of Occasional Pa p ers Understanding Infrastructure Financing for California Shelley de Alth Kim Rueben June 2, 2005 The California 2025 project www.ca2025.org , conducted with support of the William and Flora Hewlett Foundation, addresses issues that will affect the state of the State in 2025. The Technical Report series provides more information on topics discussed in chapters of the project’s major report, California 2025: Taking on the Future (Hanak and Baldassare, eds., PPIC, 2005). California
Transcript of Understanding Infrastructure Financing for California Policy Institute of Occasional Papers...

Public Policy Institute of
Occasional Papers
Understanding Infrastructure Financing for California
Shelley de Alth Kim Rueben
June 2, 2005 The California 2025 project www.ca2025.org, conducted with support of the William and Flora Hewlett Foundation, addresses issues that will affect the state of the State in 2025. The Technical Report series provides more information on topics discussed in chapters of the project’s major report, California 2025: Taking on the Future (Hanak and Baldassare, eds., PPIC, 2005).
California

The Public Policy Institute of California (PPIC) is a private operating foundation established in 1994 with an endowment from William R. Hewlett. The Institute is dedicated to improving public policy in California through independent, objective, nonpartisan research. PPIC's research agenda focuses on three program areas: population, economy, and governance and public finance. Studies within these programs are examining the underlying forces shaping California’s future, cutting across a wide range of public policy concerns, including education, health care, immigration, income distribution, welfare, urban growth, and state and local finance. PPIC was created because three concerned citizens – William R. Hewlett, Roger W. Heyns, and Arjay Miller – recognized the need for linking objective research to the realities of California public policy. Their goal was to help the state’s leaders better understand the intricacies and implications of contemporary issues and make informed public policy decisions when confronted with challenges in the future. David W. Lyon is founding President and Chief Executive Officer of PPIC. Thomas C. Sutton is Chair of the Board of Directors.
Copyright © 2005 by Public Policy Institute of California All rights reserved San Francisco, CA Short sections of text, not to exceed three paragraphs, may be quoted without written permission provided that full attribution is given to the source and the above copyright notice is included. PPIC does not take or support positions on any ballot measure or on any local, state, or federal legislation, nor does it endorse, support, or oppose any political parties or candidates for public office. Research publications reflect the views of the authors and do not necessarily reflect the views of the staff, officers, or Board of Directors of the Public Policy Institute of California.

Summary
Over the last decade, many observers have questioned whether or not California’s future is endangered by a lack of infrastructure spending. Answering this question requires a basic understanding of current levels of infrastructure financing and spending patterns. It is also important to consider how these levels and patterns have changed over time and how they compare to those in the rest of the country.
California spending on infrastructure was $931 per capita in 2002, about the same level of spending as the rest of the country. This figure reflects a recent increase in capital expenditures that now resembles the levels of the 1950s and 1960s, the heyday of California public projects. However, our current spending priorities differ from those of other states. In particular, more of our capital spending is used for water supply, natural resources, and community development projects, and a smaller portion is dedicated to highway and road projects. Until recently, California was also spending substantially less on education facilities, but from 1997 to 2002, California increased such spending 70 percent in real per capita terms. This money may provide less than it used to, largely because the costs of building have also increased.
Overall, local governments in California provide more infrastructure than their counterparts in the nation as a whole. However, this does not mean that the money is raised locally. Proposition 13, passed in 1978, hindered local government’s ability to raise money through the property tax, and local governments receive a substantial amount of pass-through money from the federal and state government. Yet local governments have also found new ways to raise capital funds, including optional sales taxes for transportation (passed at the county level) and an increased reliance on local bonds for school facilities.
State revenue sources for infrastructure projects have also changed over time. Currently, very little general fund revenue is used directly for infrastructure projects. This is in part due to the expanded use of the general fund to pay for education operating expenditures. Instead, state capital projects are largely financed with general obligation (GO) and revenue bonds. In 2002-2003, bond funds made up over three-quarters of state capital outlay sources, a majority of which was used to finance school facilities. However, the ability to pass large bonds to finance projects has been severely curtailed by an estimated debt service ratio of around 7 percent for the next five years. A prudent debt ratio—general fund debt payments divided by general fund revenues—is usually thought to be 6 percent or less. This increased debt service level is partly due to the passage of recent large GO bonds for education, resources, and housing. Additionally, the state refinanced much of its outstanding debt to avoid current payment obligations, and voters authorized $15 billion for the Economic Recovery Bond to pay off short-term debt to balance the state budget.
Voter support for state and local bonds has greatly increased facility funding on schools. Since 1998, the state has passed over $28 billion in GO bonds to finance K-12 school construction and modernization. The state also revamped its distribution system in 2000, creating a waiting list of projects for school districts that applied after a given bond’s funds were allocated. In addition, the state has earmarked a portion of these funds for districts with overcrowded
- i -

schools. These changes have made it easier for large urban school districts to qualify for state matching funds. In addition, voters approved Proposition 39 in 2000, a measure that lowered the voter threshold for passing local school bonds from two-thirds to 55 percent. Thus far, school districts have approved over $20 billion in new funds, about half of which would not have been approved if the two-thirds supermajority were required. Yet some concerns remain about the distribution of these funds and whether or not they are going to the districts with the most urgent needs.
Capital expenditures for higher education have also increased dramatically. Over the last four years, almost $4 billion of state general obligation bonds have been approved. In addition, UC and CSU have attracted private funds for capital projects. Following the passage of Proposition 39, community college districts also approved over $9 billion in local bonds. However, capital spending makes up only 9 percent of higher education costs, and recent state budget cuts have affected operating budgets dramatically, resulting in higher student fees. Even so, California public colleges remain some of the most affordable in the country, and the fee hikes partially reflect the fact that fees had been flat for eight years prior to 2003.
In California, water infrastructure has historically been built through large-scale federal and state programs financed largely with user fees. Environmental sustainability and habitat restoration have received increasing emphasis and bond funding, but affordable water for agriculture and a growing population are still top priorities. Collaborative arrangements like CALFED, which bring an array of concerned parties to the table, seek on-going water supply solutions by following a “beneficiary pays” principle. Growing concerns, however, include the ability of local governments to ensure high-quality water, manage storm water, and avoid waterway pollution. Although federal funds historically have been used to provide clean water, the ultimate responsibility for this may rest with local governments who, given the increasing requirement for voter approval for general fees and assessments, may be left responsible for costly cleanups with no clear source of revenue.
California spending for new transportation projects has declined relative to previous levels and to those in the rest of the country. The traditional sources of revenue, the federal and state gasoline taxes, are not indexed to inflation or the cost of gasoline and have eroded over time. Transportation funding has relied increasingly on sales tax revenues, especially at the county level. Because the tax is levied on all residents and on all goods, this arrangement weakens the link between those who pay for transportation and those who use it. These taxes now face an increased voter approval requirement for passage and renewal. In addition, increasing shares of transportation revenues are going to maintenance and mass transit projects. In November 2002, voters passed Proposition 42, which earmarks the sales tax on gasoline for transportation projects, but recent funding cuts and borrowing from transportation funds have curtailed infrastructure projects. Although transportation funding has fallen in recent years, funding mechanisms that return to a user-based approach, such as gas tax increases and toll collection, could be used to pay for new roads.
Going forward, it will be important for Californians to decide which programs are worth funding and how to finance them. These challenges are heightened by two major considerations. First, local governments are increasingly responsible for capital projects, and coordination efforts will become more complicated. Second, as voters continue to make policy
- ii -

at the ballot box, it will become increasingly important for them to understand how their decisions affect budget trade-offs related to infrastructure funding and other spending priorities.
- iii -


Contents
Summary i
Figures vii
Tables ix
Acknowledgments xi
PAYING FOR CALIFORNIA’S INFRASTRUCTURE 1 Infrastructure Financing Methods 1
Local Financing 3 Infrastructure Spending Patterns 4
Spending from State Budget Funds 6 Federal Transfers for Infrastructure 9
K-12 EDUCATION 11
HIGHER EDUCATION 15
WATER SUPPLY AND QUALITY 19 Water Quality 22
TRANSPORTATION 23 Local Revenue Sources 27
Conclusion 30
References 33
Appendix A: Data Tables 35
Appendix B: Data Sources and Methods 41 Census of Governments 41 California State Budget 41 California Local Governments 43
- v -


Figures
Figure 1 Per Capita State and Local Capital Outlay Expenditures, 1957-2002
Figure 2 California versus U.S. State and Local Capital Outlay, 1997 and 2002
Figure 3 State Capital Outlay Expenditures, 1965-1966 and 2002-2003
Figure 4 Distribution of State General Obligation Bonds for Infrastructure, 1972–2004
Figure 5 California’s Debt Service Ratio, 1991-1992 to 2009-2010
Figure 6 California per Pupil School Infrastructure Spending, 1959-2002
Figure 7 California versus U.S. Real Capital Outlay on Highways (per 1000 VMT)
Figure 8 California Counties That Ever Passed a Local Transportation Sales Tax
- vii -

Tables
Table 1 State Bond Types, Typical Uses, and Outstanding Amounts
Table 2 State Revenue Sources for Infrastructure Financing
Table 3 Federal Grants for Major Physical Capital Investment
Table 4 State K-12 Education General Obligation Bonds, 1974-2004
Table 5 Local K-12 School Facility Bonds since Proposition 39
Table 6 State Higher Education General Obligation Bonds, 1972-2004
Table 7 Distribution of Recent State Bond Funds to Higher Education System
Table 8 State Capital Outlay Revenue for Higher Education, 1996-1997 through 2000-2001
Table 9 Local Community College Facility Bonds since Proposition 39
Table 10 State Water General Obligation Bonds, 1972-2004
Table 11 Recent Water-Related State General Obligation Bonds
Table 12 State Transportation Revenues for Capital Outlay, 2002-2003
Table 13 State and Federal Gas Tax Rates
Table 14 State Ballot Measures for Transportation Capital Outlay Funds, 1990-2004
Table 15 Local Transportation Revenues, 1999-2000
- ix -


Acknowledgments
Funding for this project was generously provided by the William and Flora Hewlett Foundation as part of the Public Policy Institute of California’s California 2025 project. We wish to thank many people who provided valuable feedback on an earlier draft of this report and guidance as we delved into the budget and Controller data. Multiple analysts from the Legislative Analyst’s Office reviewed this report and advised us in our research. These include Dana Curry, Mark Newton, and Mac Taylor. Henry Wulf, Donna Hirsch, Jeffrey Little, and Steve Poyta of the U.S. Census Bureau, Governments Division answered our questions and confirmed that capital data were missing for some special districts in 2002. Alice Fong and Anita Tomasovitch of the State Controller’s Office helped us understand why information was missing and provided us with additional information for 2002 to help us augment the Census data. Ellen Hanak (Public Policy Institute of California) provided expertise on water topics and offered helpful guidance for the overall analysis. Finally, we would like to thank Peter Richardson for his excellent editorial skills. Any remaining errors in consolidation of the numbers or interpretation are our own.
- xi -


Paying for California’s Infrastructure
As a first step toward understanding California’s infrastructure needs over the next two decades, this paper examines how California’s state and local governments pay for projects and services. It also examines spending levels and priorities now and how they compare to those in earlier periods and in the rest of the country. Finally, it summarizes recent changes in infrastructure financing generally and in four specific sectors —K-12 education, higher education, water supply and quality, and transportation —and how California’s decisions have been affected by the ongoing state budget crisis.
Infrastructure Financing Methods
There are three basic ways to pay for infrastructure: pay-as-you-go, leasing and private provision, and borrowing. Under pay-as-you-go financing, the government pays for a project out of current revenues. No borrowing occurs, and no interest is paid. This approach limits spending to cash on hand and therefore renders many large projects infeasible. Currently, California uses pay-as-you-go funding principally from federal subventions and transfers, which are distributed on a revenue-sharing basis.
Another way to provide infrastructure is for the government to contract with the private sector. Under this approach, private firms may provide services directly to the general public, such as with the provision of waste disposal services; or the government can lease public property to private companies, allow them to pay for improvements, and then receive the improved property at the end of the lease agreement. Airport parking lots, for example, are often financed this way.
Much of California’s infrastructure financing is based on borrowing. By issuing bonds and paying them off over 20 or 30 years, governments can undertake large projects that could not be paid for out of current revenues. Interest payments on these bonds can double the nominal cost of a project, but the cost in real dollars is lower. For large capital projects, borrowing has the added advantage of matching the long-term costs of such projects to their long-term benefits. In effect, the various generations that will benefit from an infrastructure project contribute to its financing.
Infrastructure borrowing is done with general obligation (GO) or revenue bonds. When the state or local government issues GO bonds, it pledges to use its general revenues to pay back the interest and principal, and this debt is backed by the full faith and credit of the issuing government. Revenue bonds, in contrast, are paid back with a revenue stream generated from the infrastructure project itself—for example, tolls generated from a toll road or water fees for a pipeline project—or with special assessments for specific projects. The interest rate for GO bonds depends on the economic and fiscal health of the issuing government; for revenue bonds, rates reflect the expected profitability of the project. At the state level, GO bonds require a simple majority vote; local GO bonds generally require approval from a supermajority in that jurisdiction, with vote requirements varying by the use of the bond revenue.
- - 1

GO bonds can be separated into two types: self-liquidating and nonself-liquidating. Self-liquidating bonds are backed by project-generated revenue streams (such as mortgages for veterans’ housing) and are generally not included when calculating debt-service ratios. Nonself-liquidating bonds are paid back with general fund revenues (Table 1). We have included the Economic Recovery Bond, which was passed in March 2004 and allows the government to borrow up to $15 billion, in the category of nonself-liquidating debt even though it will be repaid with dedicated sales tax revenues because the services these revenues would have otherwise provided must now be funded with other revenues.1 In addition, the Economic Recovery Bond will be included in estimating California’s future debt load, and the state is responsible for repayment from the general fund if the dedicated sales tax revenues are not adequate.
Table 1 State Bond Types, Typical Uses, and Outstanding Amounts
($ billions) Types of bonds Uses
State pays debt service
Voter approval required
Amount outstanding
12/97
Amount outstanding
7/04 General obligation (nonself-liquidating)
Education facilities, seismic retrofit, parks, water projects,Economic Recovery Bond
Y Y $14.9 $43.9
General obligation (self-liquidating)
Veterans’ housing, 1959 California water debt
N Y 3.8 2.2
Revenue bonds State Water Project additions, college dorms, non-public projects
N N 22.2 10.9
Lease-payback revenue bonds
Prisons, college facilities, state office buildings
Y N 6.4 7.3
SOURCES: Legislative Analyst’s Office (1998) and California State Treasurer (2004).
Revenue bonds are paid for with specific funds and are not backed by the full faith and credit of the state; thus they do not require voter approval. Lease-payback revenue bonds, however, are a subset of revenue bonds that mirror a lease-financing agreement. The debt is used to construct a government-owned facility, and the debt repayment is seen as equivalent to what the government would have needed to pay in rental costs for the space if they had leased it from the private sector. The bond costs are paid for by general fund revenue. These bonds do 1 This categorization of the Economic Recovery Bond is open for interpretation. For instance the State Treasurer’s Office classifies the bond as self-liquidating, since it is not repaid from the general fund.
- - 2

not require voter approval because the courts have ruled that the lease revenue mechanism does not create constitutional debt but is equivalent to a rental obligation. However, the payments are included by rating agencies in the calculation of California’s debt ratio.
State general obligation debt is mainly repaid with general fund revenues from existing tax sources. Because this repayment is not explicitly linked to higher taxes, voters are not always aware that new projects will lead to either new taxes or spending cuts in other parts of the budget. As the state becomes more reliant on debt financing, maintaining future spending on operations may be threatened because of the need to pay off the existing debt burden.
Local Financing
Local governments also finance infrastructure through bonds and dedicated revenue streams. However, when local governments issue general obligation bonds they are usually repaid with voter-approved property tax increases. Local revenue bonds – used extensively for water and sewer projects – are repaid with revenues from services, local sales and parcel taxes, developer and user fees, and benefit assessments. These myriad of revenue sources are also used to provide some spending directly on infrastructure projects, most notably local sales tax revenues for transportation projects. Local governments also receive state and federal money that is passed through to local governments for local projects in a variety of sectors.
Over the last generation, statewide ballot initiatives have limited local governments’ ability to raise tax revenue.2 Passed in 1978, Proposition 13 capped the property tax rate at 1 percent, limited changes in property value assessments to when property is sold, and required a two-thirds majority for the passage of special taxes. In 1986 voters approved a statutory measure that required voter approval (a simple majority) for passing other general taxes. Some counties have also passed sales taxes for transportation projects. Initially, these sales taxes required approval by a majority of voters and were considered general taxes, but the courts have decided that such taxes are special taxes and therefore now require a two-thirds supermajority for passage or renewal.
User fees and special assessments are also used to provide infrastructure for local governments. These fees may vary with consumption (as with fees for electricity or water) or may be assessed as a flat monthly charge. User fees do not require voter approval if they do not exceed the “reasonable cost of providing service.” User fees that exceed a reasonable cost require the same level of voter approval as a special assessment, which local governments can levy for public-benefit-related services like flood control and streetlights. Following the passage of Proposition 218 in 1996, special assessments require a two-thirds majority of voters or a simple majority of property owners for passage. There are ongoing debates and court battles over the differences between user fees, special assessments, special taxes, and general taxes, as well as what is a “reasonable” cost for a service, but it is clear that local governments increasingly face the need for public approval to carry out new or ongoing projects.
The one area in which raising new funds has become easier for local governments in recent years is K-14 education. In November 2000, voters approved Proposition 39, which
2 For more information on these statewide limitations on local revenues see Rueben and Cerdán (2003).
- - 3

decreased the supermajority requirement for local school bond measures from two-thirds to 55 percent.3 Although there is talk of statewide initiatives to lower the passage rate for other types of local GO bond measures, none has been approved so far.
Finally, local governments have also relied on development fees for infrastructure financing. The local government can negotiate these fees while approving new developments, which are asked to bear the burden for new services. However, this approach is more difficult to use if local governments wish to build new infrastructure in existing areas.
Infrastructure Spending Patterns
Infrastructure spending in California has varied over time as the result of changes in public attitudes, revenue availability, and population demands.4 The Pat Brown era (1959-1967) is often seen as a boom period of infrastructure building and was characterized by increased federal spending, bipartisan support for infrastructure, and increased tax revenues. Since that time, the political support for infrastructure provision has changed. Beginning in the late 1960s, per capita state and local capital outlays declined in California, reaching a low point following the passage of Proposition 13 in 1978. Although this decline was more dramatic in California, it was similar to capital outlay expenditure patterns found in the United States as a whole (Figure 1). 5
The drop in infrastructure spending predated Proposition 13 and reflected temporary declines in both federal capital funds and school capital spending because of a decline in the size of the school-age population. Per capita capital expenditures began increasing again in 1982, with dramatic increases in the last few years. In 2002, California spent $931 per person on capital compared to $917 in the country as a whole. This is over one-third more than the amount spent in 1997 and one-quarter more on a real per capita basis than was spent in 1967—the former high point in California infrastructure spending. California has also always spent more of its capital funds locally than the rest of the country. In 2002, local governments carried out 83 percent of capital expenditures in California compared to 65 percent in the country as a whole. There has been a shift in where this money is coming from, with California’s state government funding an increasing share of local projects.
3 This lower majority requirement comes with additional restrictions on the bond funds including an enumeration of projects that will be funded and the presence of a voter oversight committee. In addition, the lower requirement is available only if the bond is proposed during an election where a federal, state, county, or city election is also occurring. 4 To examine infrastructure spending over time, we use U.S. Census Bureau, Governments Division data available from 1957-2002 in five-year increments. Because of changes in state Controller reporting methodology in 2002, there is missing information in the Census numbers on capital expenditures for nontransportation special districts. We have therefore augmented the Census numbers with information from the Controller’s office about changes in net assets for special districts. Appendix Tables A1, A2, and A3 provide more information from the U.S. Census Bureau, Governments Division on the level and composition of spending in California and the United States for capital and non-capital expenditures. 5 Unless otherwise noted, all dollar amounts are given in 2003 dollars.
- - 4

Figure 1
Per Capita State and Local Capital Outlay Expenditures, 1957-2002
0
100
200
300
400
500
600
700
800
900
1000
1957 1962 1967 1972 1977 1982 1987 1992 1997 2002
Expe
nditu
res
(200
3 pe
r cap
ita $
)
California total United States total California local United States local
California total
U.S. total
U.S. local
California local
Proposition 13Governor Pat Brown era
SOURCES: U.S. Census Bureau, Governments Division (1957-2002); California State Controller (2001-2002).
Although California’s overall per capita spending levels now approximate those in the
rest of the country, how the state spends that money has diverged from the national pattern (Figure 2). In 1997, California spent significantly more than the United States as a whole on resources and community development ($95 per capita versus $56) and water ($79 versus $34)6 and less on highways and roads ($92 versus $176) and educational facilities ($140 versus $175). By 2002, California was still spending less on highways and roads ($156 versus $233) and more on water and resources (including levee, irrigation, and drainage special districts). However, California had almost caught up with the nation as a whole for spending on educational facilities ($239 versus $250).
6 Although California is currently and historically has spent more on water projects than the nation as a whole, California water project spending is on par with that of other arid Western states.
- - 5
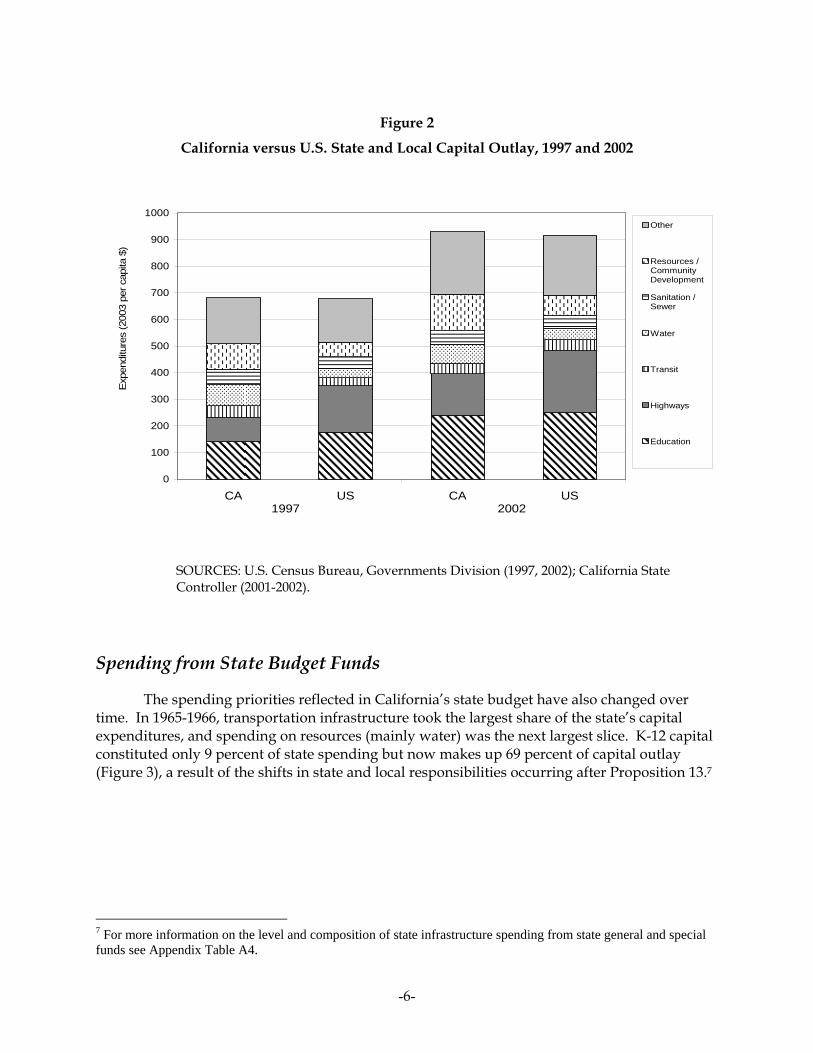
Figure 2
California versus U.S. State and Local Capital Outlay, 1997 and 2002
0
100
200
300
400
500
600
700
800
900
1000
CA US CA US
Exp
endi
ture
s (2
003
per c
apita
$)
Other
Resources /CommunityDevelopment
Sanitation /Sewer
Water
Transit
Highways
Education
1997 2002
SOURCES: U.S. Census Bureau, Governments Division (1997, 2002); California State Controller (2001-2002).
Spending from State Budget Funds
The spending priorities reflected in California’s state budget have also changed over time. In 1965-1966, transportation infrastructure took the largest share of the state’s capital expenditures, and spending on resources (mainly water) was the next largest slice. K-12 capital constituted only 9 percent of state spending but now makes up 69 percent of capital outlay (Figure 3), a result of the shifts in state and local responsibilities occurring after Proposition 13.7
7 For more information on the level and composition of state infrastructure spending from state general and special funds see Appendix Table A4.
- - 6

Figure 3 State Capital Outlay Expenditures, 1965-1966 and 2002-2003
1 9 6 5 - 1 9 6 6
R e s o u r c e s2 4 %
H ig h e r E d u c a t io n
11%
K - 12 E d u c a t io n9 %
O t h e r4 %
T r a n s p o r t a t io n5 2 %
2 0 0 2 - 2 0 0 3
R e s o u r c e s5 %
H ig h e r E d u c a t i o n
4 %
O t h e r0 % T r a n s p o r t a t i o n
2 2 %
K - 12 E d u c a t i o n6 9 %
Total state spending (2003 $s): $10,607 millionReal per capita spending: $299
Total state spending (2003 $s): $5,789 millionReal per capita spending: $307
SOURCE: California Department of Finance (1967-1968 and 2004-2005).
Likewise, the state’s capital funding sources have changed significantly since the early 1960s. Most notably, the state has moved away from pay-as-you-go financing, with a corresponding increase in reliance on bonds (Table 2). The amount of direct payments from the general fund for infrastructure payments has plummeted from the level found in the early 1960s, with general fund revenues now mainly being used to pay back debt.8 Special funds are usually limited to specific programs, with the State Highway Account being the largest. Federal funds make up a significant portion of the state’s pay-as-you-go infrastructure funds ($1.5 billion in 2002-2003, about 45 percent of capital outlay revenue excluding K-12 local assistance) and provide money to local governments to pay for highways, mass transit, flood control, and veterans’ homes.9
8 It is important to note that the shift in how California funds infrastructure makes comparisons in how much general fund revenues are being spent on infrastructure projects somewhat misleading. In the ad campaigns favoring
e
Proposition 53 (on the October 2003 ballot), proponents highlighted this decline in general fund spending without recognizing the larger role of special funds and shift to bonds to pay for new investment. 9 California Budget Project (1999); Legislative Analyst’s Office (February 2004); California Department of Financ(2004-2005).
- - 7
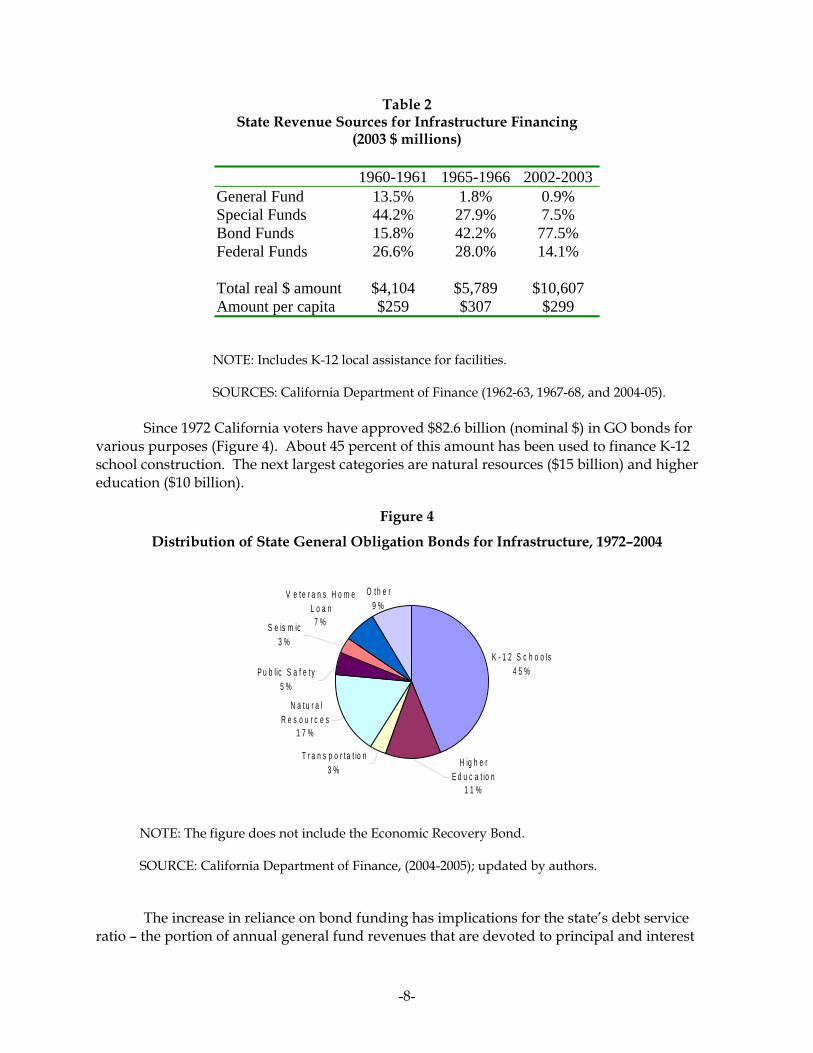
Table 2 State Revenue Sources for Infrastructure Financing
(2003 $ millions)
1960-1961 1965-1966 2002-2003 General Fund 13.5% 1.8% 0.9% Special Funds 44.2% 27.9% 7.5% Bond Funds 15.8% 42.2% 77.5% Federal Funds 26.6% 28.0% 14.1%
Total real $ amount $4,104 $5,789 $10,607 Amount per capita $259 $307 $299
NOTE: Includes K-12 local assistance for facilities.
SOURCES: California Department of Finance (1962-63, 1967-68, and 2004-05).
Since 1972 California voters have approved $82.6 billion (nominal $) in GO bonds for various purposes (Figure 4). About 45 percent of this amount has been used to finance K-12 school construction. The next largest categories are natural resources ($15 billion) and higher education ($10 billion).
Figure 4
Distribution of State General Obligation Bonds for Infrastructure, 1972–2004
K - 1 2 S c h o o ls4 5 %
T r a n s p o r t a t io n3 %
N a t u r a l R e s o u r c e s
1 7 %
H ig h e r E d u c a t io n
1 1 %
O t h e r9 %
P u b lic S a f e t y5 %
V e t e r a n s H o m e L o a n
7 %S e is m ic3 %
NOTE: The figure does not include the Economic Recovery Bond.
SOURCE: California Department of Finance, (2004-2005); updated by authors.
The increase in reliance on bond funding has implications for the state’s debt service ratio – the portion of annual general fund revenues that are devoted to principal and interest
- - 8
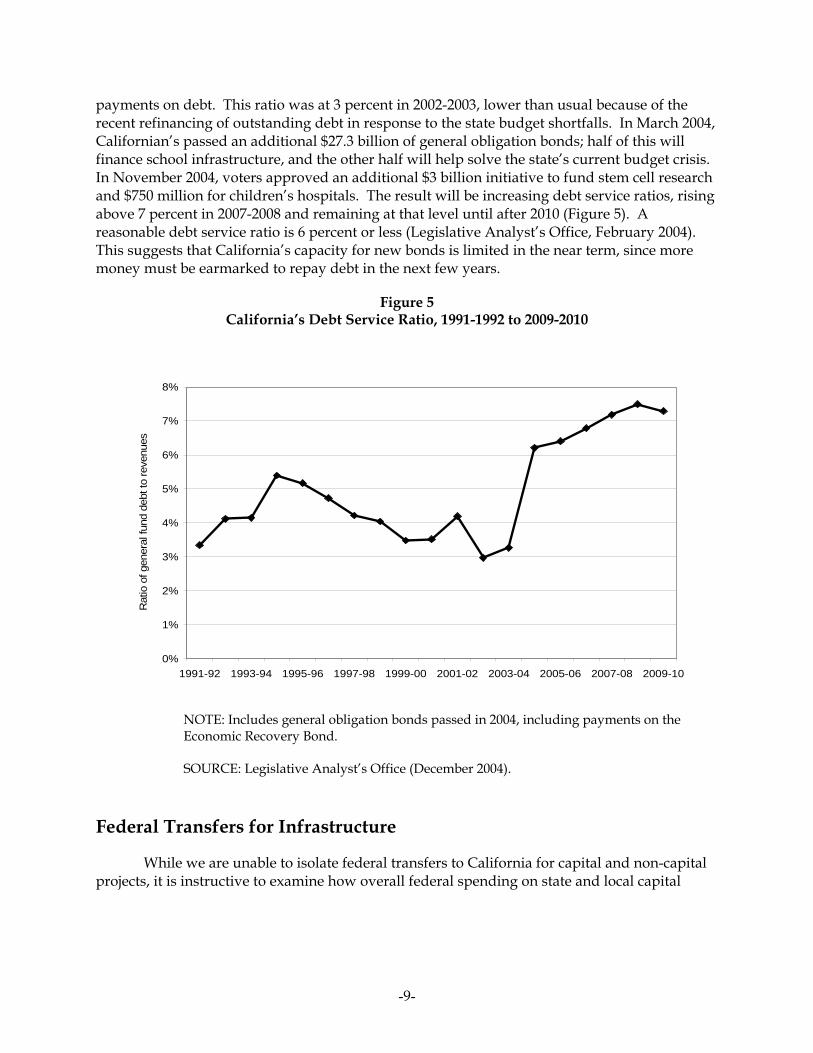
payments on debt. This ratio was at 3 perce 3, lower than usual because of the recent refinancing of lls. In March 2004, Californian’s passed an additional $27.3 obligation bonds; half of this will
nance school infrastructure, and the other half will help solve the state’s current budget crisis. In November 2004, voters approved an additional $3 billion initiative to fund stem cell research and $750 million f spitals. The result wil reasin service ratios, rising above 7 percent in remainin leve fter 2 ure 5). A reasonable debt se percent o gisla alyst , February 2004). This suggests that acity for nds i in t term, since more money must be earmarked to repay debt in the next few years.
e 5 91-19 2009-2
nt in 2002-200outstanding debt in response to the state budget shortfa
billion of generalfi
or children’s ho l be inc g debt 2007-2008 and g at that l until a 010 (Figrvice ratio is 6 r less (Le tive An ’s Office California’s cap new bo s limited he near
FigurCalifornia’s Debt Service Ratio, 19 92 to 010
0%
1%
2%
3%
4%
5%
6%
7%
bt to
reve
nues
8%
1991-92 1993-94 1995-96 1997-98 1999-00 2001-02 2003-04 2005-06 2007-08 2009-10
Rat
io o
f gen
eral
fund
de
NOTE: Includes general obligation bonds passed in 2004, including payments on the Economic Recovery Bond.
SOURCE: Legislative Analyst’s Office (December 2004).
Fede
and non-capital rojects, it is instructive to examine how overall federal spending on state and local capital
ral Transfers for Infrastructure
While we are unable to isolate federal transfers to California for capital p
- - 9

projects has changed over time.10 Currently federal transfers for state and local capital projechave surpassed peak levels found in the late 1970s. Federal capital funds dipped in the 1980s, but this was a limited decline in federal funds that reversed in the late 1990s (Table 3).
Table 3
Federal Grants for Major Physical Capital Investment 1960 1965 1970 1975 1980 1985 1990 1995
ts
2000 Real per capita capital grants $88.0 $120.7 $139.2 $129.1 $167.6 $149.8 $136.6 $162.8 $176.2 Percent capital grants for: Highways 88% 80% 42% 40% 51% 51% 49% 51% Urban mass transport 12% 9% 11% Airports 2% 1% 1% 3% 3% 3% 4% 5% 3% Community development 3% 12% 23% 23% 26% 20% 14% 13% 12% Natural resources and environment
3% 3% 5% 21% 22% 14% 12% 9% 7%
Housing assistance 0% 0% 0% 0% 0% 0% 5% 15% 15% Other non-defense 4% 3% 8% 5% 1% 1% 1% 1% 0% Defense 0% 0% 0% 0% 0% 0% 1% 0% 0% Real per capita capital grants $88.0 $120.7 $139.2 $129.1 $167.6 $149.8 $136.6 $162.8 $176.2
61% 0% 0% 2% 6% 9% 10%
Real per capita total grants to state and local governments
$186.0 $264.1 $474.7 $590.6 $678.6 $636.9 $679.8 $925.4 $1031.0
Percent of total federal grants allocated for capital
47% 46% 29% 22% 25% 24% 20% 18% 17%
SOURCE: Office of Management and Budget, (2004).
However federal money now funds different types of capital. In the 1950s and 1960s, the bulk of federal capital transfers went to highways. Beginning in the 1970s funds were increasingly used for other projects including mass transit, community and regional development projects, and natural resource and environment projects, with highway and road projects receiving 40 percent of funds in 1980, down from a high of nearly 90 percent of capital transfers. The share of money for highways increased during the 1980s, and highway and road projects currently make up about half of all federal transfers for capital. Recently funds for housing assis different options in subsidized housing. The other major change is a reallocation in the importance of capital gr ely focus
n redistribu g Medicaid and welfare rograms. Thus the federal government is still involved in infrastructure projects, but its focus
r the last forty years.
tance have increased as large federal housing projects have been replaced with
ants in federal spending priorities. Federal grants today largtive programs and payments to individuals, includino
phas shifted to fund a wider array of projects ove
10 Overall California received $34 billion from federal formula grants in 2001 or 12 percent of all federal grants, a share proportional to California’s share of the U.S. population, but much of this money was for non-capital expenditures. For more information on California’s share of overall federal funds see Ransdell (2002).
- - 10

K-12 Education
To flesh out our picture of infrastructure spending, we turn now to specific sectors, eginning with K-12 education. Most education spending is for operating expenditures and is
done at the local level. In 1999-2000, local sc icts spent $5.0 billion on capital outlay and $39.8 billion on
Per student outlays on school facilities have b ny bu dy th 30 ssa P i c p a g e
ing began o incre se in the mid-1990s, well before the lower rity requirement for local school bond measures wa sed we 99 002
increased p upil ital ding by over $140. ad al l of rowing por sch gen an oo litie cifically.
Figure 6 alifornia Per il S l In truc Spe ng, -200
bhool distr
operating expenditures.11
een a thing t stea over e last years. Even before the pa ge of roposit on 13, s hool ca ital fin ncing was fallin (Figur 6). Per pupil capital spend t asupermajo s pas . Bet en 19 and 2 , local governments er p cap spen This dition evel spending reflects the g sup t for ools erally d sch l faci s spe
C Pup choo fras ture ndi 1959 2
$1,000
$1,200
$-
$200
$400
$600
1959 1962 1965 1968 1971 1974 1977 1980 1983 1986 1989 1992 1995 1998 2001
2003
$ p
er
Proposition 13
$800
il p
up
SOURCE: California Department of Education (1959-2002). 11 We rely on California local government controller data and state budget information to calculate the annual spending levels in each sector. For more information on expenditure sources for our highlighted sectors see Appendix Table A5.
- - 11

By 1986, K-12 capitabonds, and developer and o
l finance relied more or less equally on state bond money, local ther local fees.12 This pattern continued into the 1990s, with local
districts paying for just over two-thirds of capital outlay costs for K-12 education through a combin s
willing to pass large state GO bonds to fund K-12 education (Table 4). Prior to recent reforms, however, this funding system suffered from some s d
basis on a
h impaired districts capacity to plan and raise local supplemental funds.
State K-12 Education General Obligation Bonds, 1974-2004 ($ millions)
Years No. proposed
No. passed
Amount proposed
Amount passed
Real amount
proposed (2003 $)
Real amount passed
(2003 $)
ation of local general obligation bonds (32%), developer fees (11%), and other source(27%) (Brunner and Rueben, 2001), and with state GO bonds covering the remaining third.
During the recent past, voters have been13
erious weaknesses, with school districts uncertain when funding would be available anhow much to expect. Although the State Allocation Board’s decision-making process has changed frequently, it historically allocated bond money on a first-come, first-servedbond-by-bond basis. Moreover, it required matching funds from localities.14 Until 2000, school districts needed to reapply each time a bond was passed. This money was usually depleted entirely before new bonds were authorized, creating a “hill and valley” revenue stream, whic
Table 4
1974-80 3 1 700 150 1,601 419 1981-85 2 2 950 950 1,423 1,423 1986-90 5 5 4,000 4,000 5,253 5,253 1991-95 3 2 3,800 2,800 4,524 3,400 1996-00 2 2 8,725 8,725 9,176 9,176 2001-04 2 2 21,400 21,400 21,573 21,573 Total 17 14 $ 39,575 $ 38,025 $ 43,551 $ 41,244
Moreover, the finance system led to considerable inequities, with many California
children schooled in inadequate facilities. In 2001, one in three children attended schools that were overcrowded or in need of modernization, with estimated costs to correct these problems at $30 billion (Legislative Analyst’s Office, 2001). Following litigation surrounding the distribution of Proposition 1A funds (passed in 1998), the state revamped its formula for distributing bond funds, specifically allocating a portion of new bonds for school districts with critically overcrowded schools and maintaining a list of projects to be funded from one bond
12 Following th would locally finance new
cilities. Seve sources. For more information see runner and Rueben (2001).
13 Some state bond measures combined financing for K-12 and higher education. In this section, however, we list
unding specific limits on school facility finances see Brunner and Rueben (2001).
e passage of Proposition 13 in 1978, it was unclear how school districts ral reforms occurring in the mid 1980s reestablished local fundingfa
B
the funds solely for K-12 districts. We will discuss higher education financing in the next section. 14 Hardship funds were allowed for school districts that could show an inability to raise local funds. For moreinformation on the details surro
- - 12

pool to l for
facilities. These funds included money to fund existing approved projects off the Proposition 1A wai
irement for the passage of school bonds in local elections from two-thirds to 55 percent, school districts passed more than 250 bond measures for more than $20 b ightly less than half of these measures would not have p
Table 5 cal K-12 ol Fac ds s ositi
)
Number Amount
the next. The new formula also limited the state match to a certain amount per pupieach type of district.
After these changes were put into place, voters passed Proposition 47 in 2002 and Proposition 55 in 2004, which authorized $21.4 billion in new state bond funds for K-12
tlist ($4.8 billion), projects in critically overcrowded schools ($4.1 billion), modernization projects in existing schools ($3.7 billion), and new construction to accommodate projected growth in enrollments ($8.8 billion). Although there is a per pupil cap on state contributions, most money is still distributed on a matching basis, so school districts with higher propertyvalues are able to raise more local funds, thereby possibly becoming eligible for more state money.15 However, hardship funds still assist districts that are unable to raise their local match.
Concerns about the ability to raise local revenues have been lessened in the last few years. Since the passage of Proposition 39, which lowered the vote requ
illion. Slassed without the lower supermajority requirement (Table 5).
Lo Scho ility Bon($ billions
ince Prop on 39
($)Passed 256 20.3 Not passed 50 1.7 Proposed 306 22.1 Passed w less tha 119 9.9
ith n 2/3
afterm th of Proposition 39, t ay wish to examine its role in financing
school facilities. The Legislative Analyst’s Office has suggested allocating state education capital funds on an going per il ba inevenues, which would address equity concerns and provide a predictable facility revenue
stream takes
n local tricts
schools, we are allocating much of the next decade’s school infrastructure funds today. In
In the a he state m
on pup sis and mov g away from a reliance on bond r
(2001). Alternatively, state revenues could be allocated based on a local match that into account the fact that the same tax rate raises different amounts of revenues across differentdistricts (because of differences in assessed property values across different districts). The state could equalize this system by using state money to top off the revenues raised by a giveproperty tax increase to equalize levels across the state. This would give lower-wealth disa higher state match rate for new construction programs.
Although the increased level of state and local bond funding seems promising for
particular, if there are future unexpected demographic shifts, some growing districts may find that they are unable to provide adequate facilities once the current funds have been spent. The increased surge in funds has also had at least one unintended consequence: The costs of 15 There is a limit on the level to which school districts can raise property tax rates, so districts with lower propvalues may be constrained in how much state funding they will be able to receive.
erty
- - 13

building schools have increased dramatically, with the demand for construction exceeding the supply of school construction firms. Therefore, higher costs may produce fewer classrooms than originally anticipated. This pattern might have been avoided if money had been allocated on a more regular basis.
- - 14

Higher Education
A mix of federal, state, and local district sources finance the University of California (UC), California State University (CSU), and California community college (CCC) capital
utlays. State funds for capital and operating expenditures totaled about $10.7 billion in 1999-2000 and came from education bonds, earmarked special funds, and the state general fund. Student fees and private funds now augment state funds, adding $1.4 billion for capital and $8.2 billion in operating expenditures in 1999-2000. Similar to patterns found in K-12 education, higher education spending is predominantly for operating expenses. The ratio of capital to operating expenses is 9 percent.16 As with overall capital spending, capital outlays for higher education declined rapidly during the 1970s, especially after the passage of Proposition 13, but increased during the late 1980s and 1990s. U.S. Census Bureau data for higher education capital outlay show a real per student spending peak of $1,652 in 1967 and a trough of $592 in 1982. By 2002, California was spending $767 per full-time student.
Before Proposition 13, local community college districts funded their own building programs through local bonds and property taxes with some matching funds from the state. Roughly 10 to 15 percent of UC and CSU capital funding came from federal sources through the 1963 Higher Education Facilities Act. Tideland oil revenues from state-owned land also financed UC, CSU, and CCC capital outlays. These revenues were deposited in the Capital Outlay Fund for Public Higher Education (COFPHE) and totaled $964 million (in nominal dollars) between 1965 and 1986—about 19 percent of all higher education capital outlay spending in that period (California Postsecondary Education Commission, 2002).
Following the passage of Proposition 13, community colleges lost the ability to propose new local bond measures, and federal funds for UC and CSU dried up in the 1980s. Also in 1985, oil prices dropped dramatically, decreasing revenue available from the Tideland Oil Fund. The state then shifted to using bond measures to fund higher education infrastructure projects. In 1986, the legislature proposed and voters passed Proposition 56, a bond measure for higher education raising $400 million. This was the first time state bond funds were used to fund facilities for UC or CSU. State bond measures are now used regularly to fund higher education capital outlays (Table 6). Until 1996, measures for higher education and K-12 capital outlays were proposed separately, but because of stronger voter support for K-12 bonds, propositions are now joint K-University bond acts.
o
16 For more information on expenditure sources for higher education see Appendix Table A5.
- 15 -

Table 6
State Higher Education General Obligation Bonds, 1972-2004 ($ millions)
Date Proposition #
Amount proposed
Real amount proposed (2003 $)
Real amount passed
(2003 $) Nov-72* 1 160 572 Y Jun-76* 4 150 359 N Nov-86 56 400 568 Y Nov-88 78 600 794 Y Jun-90 121 450 562 Y Nov-90 143 450 562 N Jun-92 153 900 1,093 Y Jun-94 1C 900 1,012 N Mar-96+ 203 975 1,043 Y Nov-98+ 1A 2,500 2,616 Y Nov-02+ 47 1,650 1,675 Y Mar-04+ 55 2,300 2,300 Y Total $ 11,435 $ 13,157 $ 11,223 * These bond measures are for community colleges only. + These bond measures also include K-12 money.
Before 2000, higher education bond funds had been split into thirds for UC, CSU, and
CCC. Proposition 47 (2002) and Proposition 55 (2004), which made nearly $4 billion available for higher education projects, increased the community college share to 40 percent, with UC and CSU receiving 30 percent each (Table 7).
Table 7 Distribution of Recent State Bond Funds to Higher Education System
($ millions)
Prop 47 (11/02)
Prop 55 (3/04)
Total
Community Colleges 746 920 1,666 CSU 496 690 1,186 UC 408 690 1,098 Total $ 1,650 $ 2,300 $ 3,950
- 16 -

UC has been fairly succebillion through private and othe
ssful in securing private money for capital building, raising $4.6 r nonstate funds from 1996-1997 through 2000-2001 (Table 8).
Additionally UC can finance new research facilities through bonds backed by future research revenu SU
tate e, a step recently recommended by the Legislative Analyst’s Office (June 2004). The C
system has been less successful in private fundraising, raising only $258 million from nonsfunds over this same period.
Table 8 State Capital Outlay Revenue for Higher Education, 1996-1997 through 2000-2001
($ millions)
State General & COFPHE Funds
GO Bonds Revenue Bonds & Special Funds
Other Nonstate Funds
Total
UC 10.0 981.9 195.9 4,621.8 5,809.6 CS U 35.6 945.9 11.7 258.3 1,251.4CC 1,004.5 1.5 * 1,006.0
Total 45.6 2,932.4 209.0 4,880.1 $ 8,067.0
* Community College numbers do not include local district revenues, which are discussed below
SOURCE: California Postsecondary Education Commission (2002).
.
Although community colleges have not raised substantial amounts of private money, the pas
rds sage of Proposition 39 has helped them raise over $9 billion in local district bonds since
2001 (Table 9). Nearly three-quarters of these measures would not have passed if the two-thisupermajority had been required.
Table 9 Local Community College Facility Bonds since Proposition 39
($ billions)
Number Amount ($)Passed 46 9.1 Not passed 5 1.0 Proposed 51 10.0 Passed with less than 2/3 33 6.6
The recent state budget crisis has caused California to re-examine its previous levels of
support for higher education. Campuses have had to make reductions in services, increase class sizes and raise student fees. However California tuition and fees are still lower than the average costs faced by students in other states, and community college fees remain among the lowest in the country. While the budget crisis is forcing students to pay more and campuses to cut back, infrastructure for higher education is not as threatened as operating budgets. In addition, California may want to consider adoption of systematic student fee increases to avoid
- 17 -

the swings in tuition rates caused by the current policy of leaving tuition constant until a period of budgetary stress and then raising rates dramatically.
- 18 -

Water Supply and Quality
California water resources are used for agricultural, residential, industrial, environmental, recreational, and other purposes. To accommodate these various uses, California has a vast infrastructure system for water supply, conveyance, and quality control. In 1999-2000, capital spending for water supply and water quality totaled $4.7 billion, and operating expenses totaled $9.6 billion. Abo ird of this spending is used for sewer system
City water agencies and nearly 1,300 local water districts and other entities spend most of this mone e w o iciwastewater es are the largest y and district funds. In 1997-1998, cities brought in $4.1 billion in water and sewer service charges, or 80 percent of city water and sewer functional revenues (California State Controller, 199 ater sdistricts brought in $4.3 billion in fees, nearly 60 perc ater dist reven is yea slative A t’s Office, 2 verage yearly water fees i were $ only 3 percent of communities faced fees greater than ercent of med househ e (Hanak and Barbour, 2005).
useinf cal utilities. These include
e ral olorad s.
billion in nominal dollars as of 1999 (Dowall and Whittington, 2003). The Colorado River Pro administered by USBR, allocates water from the Colora ceiving a significant share.
The California Department of Water Resou R WP, which furnishes a substantial portion of the water supplies for urban Southern California as well as agricultural users in the southern Sa lley. Construction on these conveyance and storage facilities began in the 1960s, when voters approved a $1.75 billion general obligation bond ($8.2 billion in 2003 dollars) t on. er supp ntractors became esponsible for repayme these costs to users in the form of es. Su
r
ut one-ths and wastewater treatment centers. 17
y either to providdischarge. User fe
ater directly r to meet water stsource of both cit
andards for mun special
pal
7-98). Wr l
pecial e wnt of ict tota
n 2 3 ues in th
r (Legi n lysa 002b). A 00ian
363, andold incom1.5 p
Although local water utilities are primarily responsible for delivering water to end rs, several state and federal projects established significant conveyance and storage
rastructure during the mid-twentieth century to supply these lo federal Central Valley Project (CVP), the State Water Project (SWP), and the fedeth
C o River Project. These projects have authority to levy fees and charges for capital costThe U.S. Bureau of Reclamation (USBR) constructed the CVP beginning in 1937 and still controls the facilities. The project was financed through federal appropriations and repayments from water users, including agriculture, municipal and industrial users, and power customers. Total construction costs totaled $3.3
ject, also do River among the Western states, with California historically re
rces (DW ) runs the S
n Joaquin Va
o finance initial constructint of this GO bond and passed on
Wat ly corfe bsequently, revenue bonds have been used to finance additional SWP facilities in Southern California and along the central coast and are also paid off with user fees.
California voters have been asked to approve 15 statewide water-related GO bonds ovethe last 30 years, and have done so for all but one of these, for a total of $9.9 billion (Table 10). The vast majority of these bonds have focused on water-quality-related issues, for both urban supply (“drinking water”) and wastewater (usually called “clean water”) programs. The most 17 For more information on expenditure sources for water supply and quality see Appendix Table A5.
- 19 -

recent bonds have also focused on ecosystem restoration and grants to local water districts to increase water use efficiency and augment local supplies (Table 11).
Table 10 State Water General Obligation Bonds, 1972-2004
($ millions)
Date Proposition #
Purpose Amount proposed
Real amount proposed (2003 $)
Real amount passed
(2003 $) Jun-74 2 Clean Water 250 698 Y Jun-76 3 Drinking Water 175 419 Y Jun-78 2 Clean Water & Conservation 375 753 Y Nov-84 25 Clean Water 325 473 Y Nov-84 28 Drinking Water 75 109 Y Jun-86 44 Water Quality &
Conservation 150 213 Y
Nov-86 55 Drinking Water 100 142 Y Nov-88 81 Drinking Water 75 99 Y Nov-88 82 Conservation 60 79 Y Nov-88 83 Clean Water & Reclamation 65 86 Y Nov-90 148 Water Supply 380 475 N Nov-96 204 Water Supply 995 1,064 Y Mar-00 13 Drinking, Clean Water,
Watershed & Flood 1,970 2,008 Y
Mar-02 40 Clean Water 300 305 Y Nov-02 50 Supply, Clean Water,
Drinking Water & Wetlands 3,440 3,492 Y
Total $ 5,295 $ 10,416 $ 9,942
- 20 -

Table 11
Recent Water-Related State General Obligation Bonds ($ millions)
Bond Fund Prop # Amount 1996 Safe, Clean, Reliable Water Supply Bond Act 204 $ 995 CALFED 45 Water Supply
3 117
W
50
ed 760200 *
3440
825
astewater 235 Bay-Delta Improvement & Flood Control 1902000 Safe Drinking Water, Clean Water, Watershed Protection, and Flood Protection Act
13 $ 1970
CALFED 2 Water Supply & Conservation 535 Drinking Water 70 Wastewater 355 Flood Control & Watersh
2 California Clean Water, Clean Air, Safe Neighborhood Parks, and Coastal Protection Act
40 $ 2600
Water Quality & Restoration 3002002 Water Quality, Supply and Safe Drinking Water Projects Coastal Wetlands Purchase and Protection Bond Act
50 $
CALFED Water Supply & Integrated Regional Management 640 Drinking Water (Includes Desalination & Water Security) 585 Wastewater 370 Coastal Protection & Colorado River Management 1020
* The remaining $2300 of Proposition 40 funded nonwater-related projects.
,
ol or ,
ossible to
avoid or minimize subsidies. However, to date, the state bond funds have been the primary revenu
A large portion of the most recent bonds –- $1.5 billion –- has been allocated to the CALFED program, a multiagency state and federal effort to restore the Bay Delta fisheriesensure water and environmental quality, and secure the water supply. Representatives include urban, environmental, agricultural, and other interests. CALFED does not directly contrmanage water supply but attempts to coordinate activities of various water actors in the stateincluding the CVP, SWP, and local agencies. CALFED’s long-term financial plan follows a“beneficiary pays” principle, with project benefits and costs as closely correlated as p
e source, with relatively little money forthcoming from either federal sources or local users. CALFED partners have recently completed a 10-year finance plan that allocates costs among federal, state and local authorities. In October 2004, federal legislation authorized $395million from 2005 to 2010 to support the federal share of CALFED expenditures.
- 21 -
Water Quality
The recent state bonds also provide substantial resources to help local agencies improve water quality, a shift frwas available. In the f n Water Act of 1972, federal grants provided more than 75 perc ital costs for upgrading wastewater systems to water qu dards. This wad ed ed into a C er State Rev dmatching funds, to provide low-interest loans to waste ies. e CSafe Drinking Water State Revolving Fund was established to assist wsp .6 mi n in for water quality in 1999-2000. Currently Congress is co g bill at w itional federal m for local treatmen ant in ture, m ivat sues oncerns by local g ts a nvi he gr costs of water programs.
Sta ater Resources Control Board (SWRCB) administers clean water programs, co aste r a noff. The recent ge of Propositions 13, 4 d 50 has greatly increased the state’s ability to provide local assistance for clean water projects. In 20 estim d ex these bond funds total $559 million, or three-quarters of th ed $ mil ance from the SWR .
Dep en ffice o inking Wa dministers the st drinking water programs. Here, too, bond fun dramati increasinsp In 1 000 nds – it lent $21.3 n to loca es for dr ng w cts of w urces) and made a sm ber of capital grants. The DHS drinking water budget appropriation in 2003-2004 includes $115 million in local assistance from th position 50, representing one-third of that year’s DHS environmental control local assistance budget.
Whereas user fe e for water and wastewater systems, there are questions about the funding of a relatively new area of ater quality regulation – storm water. It is uncertain whether increa l ch y fo
property ppro incplementation of property-related fees or assessments. If more stringent voting standards are
required, without federal or state subsidies, local governments will be responsible for meeting standards but will lack clear options for raising revenue.
Another question involves funding for the restoration of fish and wildlife habitats. Recent state bonds and efforts such as the CALFED Environmental Water Account, which buys and stores water to mitigate competing environmental and water user needs, show the public’s and state’s willingness to fund water for the environment. To meet the continued funding requirements of the CALFED program and new ecological challenges, however, funding mechanisms will have to keep pace.
om the policy in the 1990s, during which relatively limited state funding irst decade following the passage of the federal Clea
ent of the capmeet the new and convert
ality stanlean Wat
program olving Funwater utilit
s then substan, with 20 perce
In 1996, thater utilities. California
tially nt state
alifornia ownsiz
ent $134 llio federal fundsnsiderin s th ould provide add oney water t plfrastruc ot ed by September 11 security is
ups regarding t and c raised
overnmen nd e ronmental gro owing clean
The te Wvering w wate nd storm water ru passa 0, an
03-2004, ate penditures frome estimat 750 lion in local assist CB
The artm t of Health Service’s (DHS) O f Dr ter aate’s safe ds are cally g ending.
e999-2( f
– before the bo millio l entiti inkiater proj hal hich was from federal so
e recently passed Pro
all num
es are a straightforward local funding sourcw
ses in loca-owner a
arges to paval for the
r storm rease or water management require two-thirds voter or
im
- 22 -

Transportation
How people and goods travel throu will help determine the state’s quality of life and continued prosperity. Transportation infrastructure financing has undergone dramatic shifts since the large-scale freeway projects of the 1950s and 1960s. Although the overall level of hat of the earlier peri ss money is now spent on construction and more is spent on operations. In 1967 and 2 02, tcom d operating expenses for highways and roads totaled $315 and $ 32 pcap y. In 1967, $231 went to capital, versus only $156 more recently. Mass transit has 72, California spent $20 per capita o trancon
tlay spending on highways and roads was evenly divided between state and local projects, with each spending slightly less than $1.9 billion.1 Mucthe local spending is allocated by cities and counties but is coordinated through regional transportation planning agencies, which receive revenue from the federal and statego
00 was $2.6 billion—about 65 e transit cap spe from federal and state sources. Capital spending on ma at year largely because of federal grants and local funds for the unty MetrTra 2001-2002, total transit capital expenditures fell to $1.5 billion, a more representative level of recent transit infrast cturefin
es over the past forty years as costs have risen, revenues have eroded over time, and financing has shifted away from a user fee nding per 1000 vehicle-miles traveled
MT) declined dramatically from 1965 to 1980 and has remained relatively constant since e decline was less extreme.
.S. real per 1,000 VMT capital spending on highways was $22.3 and California’s spending was $15.8 in
gh California
spending on highways and roads is now comparable to t od, le of this 0 he
bined capital an 3 er ita, respectivel, meanwhile, emerged as a key sector. In 19
18n sit
struction; in 2002, it spent twice that.
In 1999-2000, capital ou9 h of
vernment.
For transit, state and local capital outlay spending in 1999-20percent of operating expenditures ($4.0 billion). Virtually all of thnt locally, although much of it comes
ital money is
ss transit was unusually high th Bay Area Rapid Transit Authority (BART) and the Los Angeles Consportation Authority to complete extension projects. In
o
ru ancing.
New freeway construction has faced increasing challeng
approach. California real highway capital outlay spe(V(Figure 7). National trends have followed a similar pattern though thU
2000.
18 These real per capita numbers are based on U.S. Census Bureau reported figures, which can be found in Appendix Table A1. 19 For m nformation on expenditure sources for highways, roads, and transit see Appendix Table A5. ore i
- 23 -

Figure 7 Outlay on Highways California versus U.S. Real Capital
(per 1000 VMT)
$
$30
$40
$50
$60
100
0 V
MT
US
$10
$20CA
01965 1970 1975 1980 1985 1990 1995 2000
2000
$ p
er
al outlay and federal VMT data from the and California VMT data provided by the
s and
into the State Highway Account. California’s federal gas and diesel tax contributions are eposited into the Federal Highway Trust Fund and redistributed. Additionally, 4.75
percentage points of the 6 percentage point sales tax on diesel fuel has historically been
NOTE: Includes federal, state and local capital outlay expenditures.
SOURCES: Authors' calculations based on capitFederal Highway Administration (various years)California Department of Transportation (2004).
While spending declined in terms of vehicle mile traveled, costs of construction and
maintenance rose dramatically because of more stringent freeway design standards, skyrocketing right-of-way costs, new environmental planning costs, and rising labor costs. The cost of constructing a new highway mile in the 1990s is estimated to be three times higher than the cost during the early 1960s.20
Traditional sources of revenue for transportation have been user fees such as federal and state fuel taxes, sales taxes on fuel, vehicle registration fees, motor vehicle weight fees, drivers’ license fees, and tolls. These revenues are deposited into special funds administered by the state and earmarked for transportation, including the Federal Highway Trust Fund, State Highway Account, and the Public Transportation Account. About one-third of the state gadiesel tax is distributed to local governments for streets and roads; the remainder is deposited
d
20 For a description of the methodology behind this calculation see Hanak and Barbour (2005).
- 24 -

allocated to the Public Tranimprovements (Legislative
sportation Account for transit operating expenses and Analyst’s Office, 2002a). Table 12 shows the most recent revenue
sources for state capital outlay transportation spending. Note that this does not include state or federal money passed through to local governments for capital, including most transit capital funding.
Table 12 State Transportation Revenues for Capital Outlay, 2002-2003
($ millions)
Highway Bond Funds $ 32.3 1.4% Seismic Retrofit Bond Act of 1996 32.3
eral Trust Fund $ 1,480.7 65.2%
Transit
Special Funds $ 725.8 32.0% State Highway Account 486.3 Toll Bridge Seismic Retrofit Account 190.9 Traffic Congestion Relief Fund 48.6 Fed
Special Funds $ 31.7 1.4% State Highway Account 23.7 Public Transportation Account 0.3 Traffic Congestion Relief Fund 7.7 Total $ 2,270.5 100.0%
SOURCE: California Department of Finance (2004-2005).
State and federal gasoline and diesel taxes are still important – funding about half of transportation spending and raising more than $3 billion each in California annually. Howeverfuel tax increases have been sporadic and politically difficult to pass, making it hard to maintain revenues in real terms (Table 13). Additionally, this revenue source has become less reliable over time. Even with dramatic increases in vehicle travel, fuel consumption (and therefore real tax revenue) ha
,
s declined because of increasing vehicle fuel efficiency.
- 25 -

Table 13 State and Federal Gas Tax Rates
(cents per gallon)
Year California Federal Total Total Real (2003)
1950 4.5 1.5 6.0 45.8 1951 2.0 6.5 46.0 1953 6.0 8.0 55.1 1956 3.0 9.0 60.9 1959 4.0 10.0 63.2 1963 7.0 11.0 66.1 1983 9.0 9.0 18.0 33.3 1987 9.1 18.1 29.3 1990 14.0 14.1 28.1 39.6 1991 15.0 29.1 39.3 1992 16.0 30.1 39.5 1993 17.0 18.4 35.4 45.1 1994 18.0 36.4 45.2 2003 18.0 18.4 36.4 36.4
SOURCE: California Department of Transportation.
Thand the fe1960. But d away from highway development and
ward transit, local roads, and operations and maintenance. Federal authority has also devolv
tion capital projects (Table 14). In 1990 and 1996, voters and seismic upgrades of bridges and highways
($2 bill
1.2
y
e federal highway program used to be the largest source of federal aid to the states, deral share of state and local capital spending on highways reached 46 percent in since the mid-1960s, federal money has shifte
toed to regional transportation agencies and local control.
The current mix of transportation financing still represents a primarily pay-as-you-go system. But as gasoline tax revenue and federal funds have eroded, the state has turned to ballot initiatives to fund transportaapproved GO bonds for rail transit ($3 billion)
ion). Californians also approved Proposition 42 in 2002, which earmarked 80 percent of the 6 percent state sales tax on gas to be spent on transportation projects, including highway improvement and repairs, mass transit, and local road and street repairs. (That revenue hadpreviously been allocated to the general fund.) Proposition 42 is estimated to raise about $billion per year in revenues for transportation. However, the funds can be allocated back to the general fund by a two-thirds majority vote of the Legislature, and this occurred at least partiallin each of the subsequent budget years to help address the state’s budget crisis.
- 26 -

Table 14
State Ballot Measures for Transportation Capital Outlay Funds, 1990-2004 ($ millions)
Date Proposition # Amount propose
Real amount osed
Passed Purpose d prop
(2003 $)
Jun-90 108 1,000 Y Rail Transit 1,250 Jun-90 116* 1,990 2,487 Y Rail Transit
122 300 375 Y ism1,214 N Transit
2,000 2,249 N is1,000 1,124 N Transit
Y ismic sales tax st
Jun-90 Se ic Nov-92 156 1,000 RailJun-94 1A Se mic Nov-94 181 RailMar-96 192 2,000 2,139 SeNov-02 42+ 6% Y Infra ructure
* tion 116 was allocated to the Alameda C ro ich f ail transportation. + xisting 6 percent sales tax o ine for t
Although voters have passed bond measures and initiatives to earmark funds for
transportation, it is unclear in practice how this will translate into transportation capital funding the near term. Future Proposition 42 funds are not guaranteed, repayment of loans from the
general fund are uncertain, seismic retrofit costs have turned out to be higher than expected, federal fun el will lower federal
pportionments unless legislative action is taken.21 Raising gas taxes will be difficult politically given t a
The decline in state gas tax revenues and federal funds has also prompted some local governments to seek new funding sources through the primary option at their disposal – a state sanctioned optional sales tax.22 Historically, local governments funded street and road construction predominantly through local general fund revenues (largely from property taxes) and their share of the gasoline tax pass-through from the state. In 1971, state voters also passed a ¼ cent general sales tax on all sales to fund local transit, which is deposited into each county’s
$29.9 million of Proposi orridor p ject, whacilitated shipping container r Proposition 42 allocated most of the e
ransportation projects. n gasol
in
d levels are unknown, and a conversion to ethanol fua
he current level of gasoline prices and the relatively small amount of money raised byone cent per gallon increase in the fuel tax. While a large amount of money is still being expended for transportation, funds for new projects are extremely limited, and we may not be adequately planning for the future.
Local Revenue Sources
21 Currently the excise tax on gasohol is lower than that on gasoline, with the decrease in excise tax being between 3 and 5.5 cents per gallon depending on the amount of ethanol in the mix. 22 Counties that have passed additional sales taxes for transportation usually pass a ½ cent rate for roads, and in the counties served by BART and in Los Angeles, another ½ cent tax has been passed for mass transit projects.
- 27 -
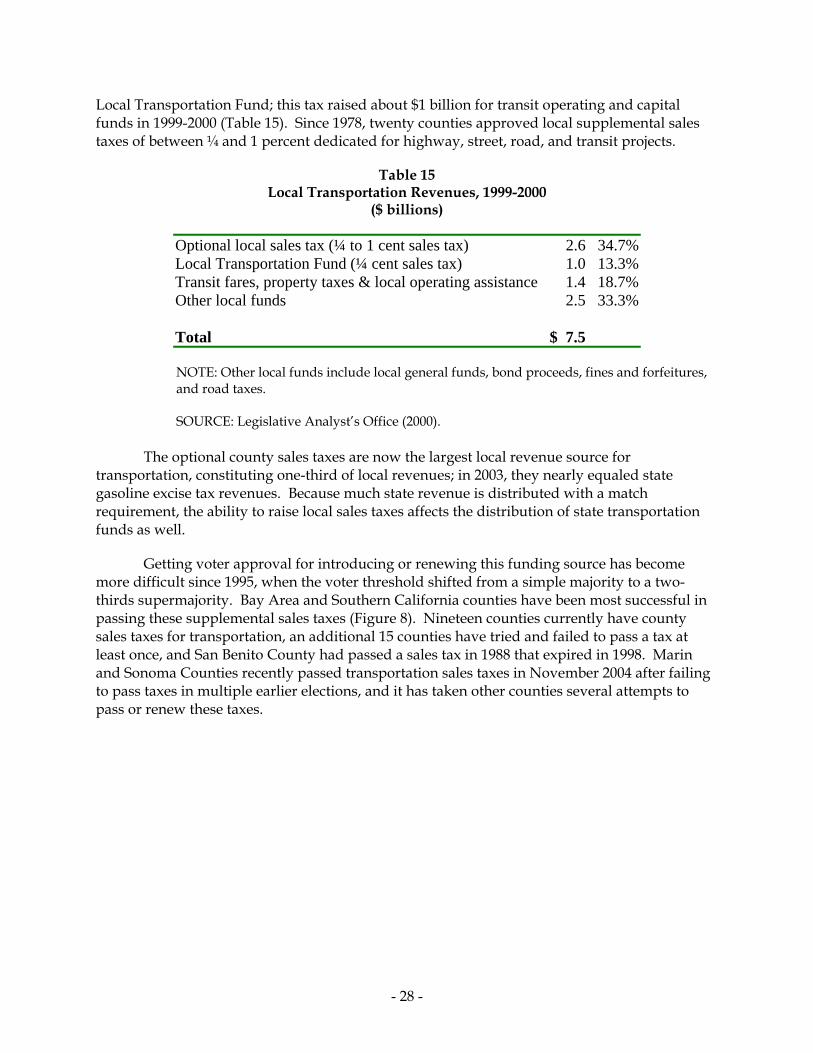
Local Transportation Fund; this tax raised a llion for transit operating and capital funds in 1999-2000 (Table 15). S ed local supplemental sales taxes of between ¼ and 1 percent dedicated for highway, street, road, and transit projects.
15 Local Transportation Revenues, 1999-2000
llions)
Op local tax (¼ to 1 t sales tax 34.7%
bout $1 biince 1978, twenty counties approv
Table
($ bi
tional sales nce ) 2.6 Lo nspo n Fund (¼ sales tax) 13.3% Tra res, pro erty taxes & l operatin stance 18.7% Other local funds 33.3%
To $
cal Transit fa
rta iotp
cent loca
g assi
1.0 1.4 2.5
tal 7.5
NOTE: Other lo ds includ general fu ond proce s and forfeitures, and axes.
SO egis Analyst’s Of ce (2000).
The optional county sales taxes are now the large l revenue source for transportation, utin third of l venues; i , they ne qualed state
asoline excise tax revenues. Because much state revenue is distributed with a match requirement, the ability to raise local sales taxes affects the distribution of state transportation funds as well.
Getting voter approval for introducing or renewing this funding source has become more d
in
at that expired in 1998. Marin
and Sonoma Counties recently passed transportation sales taxes in November 2004 after failing to pass
cal fun e local nds, b eds, fine road t
URCE: L lative fi
st loca constit g one- ocal re n 2003 arly e
g
ifficult since 1995, when the voter threshold shifted from a simple majority to a two-thirds supermajority. Bay Area and Southern California counties have been most successfulpassing these supplemental sales taxes (Figure 8). Nineteen counties currently have county sales taxes for transportation, an additional 15 counties have tried and failed to pass a taxleast once, and San Benito County had passed a sales tax in 1988
taxes in multiple earlier elections, and it has taken other counties several attempts to pass or renew these taxes.
- 28 -

Figure 8
California Counties That Ever Passed a Local Transportation Sales Tax
SOURCE: Surface Transportation Policy Project (2002); updated by authors.
Recent state budget shortfalls also affect local transportation funding. Some local government transit districts are facing a loss of funds as part of the Governor’s negotiated deal with local governments. Under this deal, local governments forgo $1.3 billion in local propertytaxes in each of the next two years in exchange for support of a ballot measure to safeguard local funds in future years.
rnments are playing a larger role in transportation funding throug
use will be crucial to consider as California prepares for its transportation future.
It is clear that local goveh the local sales taxes. The primary concern raised by this is the new supermajority
requirement and the ability of counties to maintain these taxes. There are also geographical equity issues raised by the fact that these local taxes are largely concentrated in coastal communities. Additionally, increasing reliance on sales tax revenue further divorces transport use from transportation financing. Allocating the costs of transport to users of the system encourages more efficient behavior and can reduce negative effects, such as congestion. Forward-thinking strategies on transportation financing that consider the incentives on system
- 29 -

Conclusion
California currently spends about as much as the rest of the country on infrastructure projects, but less on transportation infrastructure and more on water and resources than other states. California’s curren s, but again, the priorities have shifted.
Ove increased dra oing forward, the d. Should sch e more responsible Sh e become less reliant on bond financing for school facilities and shift to an annual p cation of funding? Should revenues be distributed in a way to reflect differences in district wealth? Should state utions be based more on future predicted growth or current enrollments? In higher education, where facilities represent a relatively small percentage of total higher education spadmissions higher education switch to more year-round programs? How should admissions be set?
s. old
s.
cal governments are largely responsible for ensuring water quality, but because the costs of
hus
not be cost-effective. Furthermore, traditional sources of revenue are declining in real terms. Federal and state fuel taxes, which currently raise 36.4 cents per gallon of gasoline, have not increased since 1994, and although Californians are driving more, increased fuel efficiency and higher project costs have further eroded the real value of the fuel tax revenue.
Increasingly, highway, road, and transit infrastructure is financed with other taxes, most notably dedicated county sales taxes. Renewal of these sales taxes might now face opposition as vote requirements have changed to require a two-thirds majority for passage or renewal. General sales taxes do not tie road use to the cost of providing roads, nor do they promote the efficient use of transportation infrastructure as much as a user-based gas tax or toll does.
Transportation questions go beyond the arithmetic of funding sources. How much of transportation costs should the actual users of transportation pay? How does building new
t level of spending surpasses that of the 1960
r the last decade, support for K-12 facilities has matically. Gre are still important questions to be addresse ool districts bfor facilities financing in the aftermath of Proposition 39? ould the stat
er pupil allo
distrib
ending, questions of overall access are likely to be more pressing. Should criteria be re-examined? Should
decisions be made? How should tuition levels
California continues to spend more than the national average of its infrastructure dollars on water supply and quality, although spending levels are in line with other Western stateWater users bear most of these costs, but rates are relatively low as a percentage of househincome, and most water districts and municipalities have been able to meet their revenue needGoing forward, the main water financing issues center around water quality and ecosystem restoration. Lo
controlling storm-water runoff are not linked directly to benefits received by specific households, local governments could face a two-thirds vote requirement to pass new fees. Tlocal authorities may be faced with clean-up costs without a clear way of paying for them. For ecosystem improvements, the question is whether voters will continue to support state bonds, since contributions by the federal government and water users have been relatively limited.
Transportation infrastructure seems to be the main area where California has fallen behind in investment. Today, many more highway dollars are used for maintenance rather than new construction. Transportation revenues are also increasingly allocated to mass transit programs that may or may
- 30 -

highways affect growth and congestion? Should transportation revenues go for roads or mass transit? These questions must be answered nia considers its infrastructure future.
Finally, California’s increasing reliance on debt financing in recent years to help solve the state’s budget crisis also limits the state’s options in undertaking new projects. Our current debt load is projected to be about 7 percent for the next five years, higher than the level deemed prudent by credit rating agencies, which can limit our future ability to undertake new projects at the state level. Local governments also are faced with an increasingly restrictive environment for raising new revenues as voter approval is required for a growing list of sources. As new infrastructure projects are examined, these constraints might mean that new options for funding infrastructure will be necessary.
as Califor
- 31 -


References
Brunne
California Department of Finance, Governor’s Budget & Budget Summary, Sacramento, California, 1962-63, 1967-68, 1986-87, 1998-99, 2001-02, 2004-05.
California Department of Finance, Chart K-7 and K-8 (General Obligation Bonds) from Governor’s Budget 2004-05, available at www.dof.ca.gov/html/bud_docs/backinfo.htm.
California Department of Transportation, Fact Sheet: Important Events in California’s History, available at www.dot.ca.gov/hq/paffairs/about/cthist.htm.
California Department of Transportation, Historical Vehicle Miles Traveled data, e-mailed from Luk Lee, 2004.
California Postsecondary Education Commission, Fiscal Profiles, 2002, available at www.cpec.ca.gov/completereports/2003reports/FiscalProfiles2002.asp.
California State Controller, Counties Annual Report, Cities Annual Report, School Districts Annual Report, Special Districts Annual Report, Streets and Roads Annual Report, Transit Operators & Non-Transit Claimants Annual Report, Sacramento, California, 1996-97, 1997-98, 1999-00, 2001-02.
California State Controller, Special District data on Total Fixed Assets for 2001 and 2002, e-mailed from Alice Fong, August 2004.
California State Treasurer, “General Fund Supported Debt,” available at www.treasurer.ca.gov/Bonds/gfdebt.pdf, July 1, 2004.
Chancellor’s Office, California Community Colleges, Fiscal Data Abstract, Sacramento, California, 1999-00.
Dowall, David E., and Jan Whittington, Making Room for the Future: Rebuilding California’s Infrastructure, Public Policy Institute of California, San Francisco, California, 2003.
Federal Highway Administration Office of Policy Information, Federal Highway Statistics, Tables HF-202C and VM-201, various yrs, available at www.fhwa.dot.gov/policy/ohpi/hss/ hsspubs.htm
Hanak, Ellen, and Mark Baldassare, eds., California 2025: Taking on the Future, Public Policy Institute of California, San Francisco, California, 2005.
r, Eric, and Kim Rueben, Financing New School Construction and Modernization: Evidencefrom California, Occasional Paper, Public Policy Institute of California, San Francisco, California, June 2001.
California Budget Project, Budget Brief: CA’s Public Investment Gap, 1999, available at www.cbp.org/1999/bb990901.html.
California Department of Education, J-200 expenditure data, 1959-2002, available at www.cde.ca.gov/ds/fd/fd/.
- 33 -

Hanak, Ellen, and Elisa Barbour, Sizing Up the Challenge: California’s Infrastructure Needs, Occasional Paper, Public Policy Institute of California, San Francisco, California, 2005.
Legislative Analyst’s Office, A Primer on State Bonds, February 1998, available at www.lao.ca.gov/1998/013098_bonds/0298_state_bonds.html.
Legislative Analyst’s Office, California Travels, May 2000, available at www.lao.ca.gov/2000/051100_cal_travels/051100_cal_travels_intro.html.
Legislative Analyst’s Office, A New Blueprint for California School Facility Finance, May 2001, available at www.lao.ca.gov/2001/school_facilities/050101_school_facilities.html.
Legislative Analyst’s Office, Proposition 42 Analysis, March 2002a, available at www.lao.ca.gov/ballot/2002/42_03_2002.htm.
Legislative Analyst’s Office, Water Special Districts: A Look at Governance and Public Participation, March 2002b, available at http://www.lao.ca.gov/2002/water_districts/ Special_Water_Districts.html.
Legislative Analyst’s Office, Analysis of the 2004-05 Budget Bill, “Capital Outlay Overview,” February 2004, available at http://www.lao.ca.gov/analysis_2004/cap_outlay/ co_01_ov_anl04.htm#_1_1.
Legislative Analyst’s Office, Funding UC Research Facilities, June 2004, available at http://www.lao.ca.gov/2004/uc_fac_fclty/062304_uc_fac_res.htm.
Legislative Analyst’s Office, Latest Debt Service Ratio projections, e-mailed from Brad Williams, December 2004.
Office of Management and Budget, The Budget for Fiscal Year 2005, Washington, D.C., 2004. Historical Tables 9.6, 12.3.
Ransdell, Tim, California’s Share of Federal Formula Grants, 1991-2001, Public Policy Institute of California, San Francisco, California, 2002.
Rueben, Kim, and Pedro Cerdán, Fiscal Effects of Voter Approval Requirements on Local Governments, Public Policy Institute of California, San Francisco, California, 2003.
Surface Transportation Policy Project, 2002, available at www.transact.org/ca/default.htm.
U.S. Bureau of Labor Statistics, Producer Price Index, Materials and Components for Construction, WPUSOP2200, available at www.bls.gov.
U.S. Census Bureau, Governments Division, Census of Governments, Compendium of Government Finances and Individual Unit Files, Washington, D.C., 1957-1997; State by Type of Government data files, 2002, available at www.census.gov/govs/www/estimate02.html.
U.S. Census Bureau, Population Division, Population Estimates by State, Washington, D.C., 1957-2003.
- 34 -

Appendix A: Data Tables
(real per capita 2003 $), California
997 2002
Table A1 Historical Per Capita State and Local Capital Outlay and Non-Capital Outlay Spending
California 1957 1962 1967 1972 1977 1982 1987 1992 1Capital Outlay Higher Education 22.5 43.4 51.4 31.0 38.2 28.5 40.4 37.4 39.7 35.5K-12 Education 121.5 126.1 95.4 63.7 53.8 19.8 49.0 80.4 100.7 203.7Highways 166.0 199.2 230.8 185.6 66.5 65.5 83.7 110.0 91.6 156.0
32.0 31.1 57.7 76.8 79.3 73.239.0
137.2
358.9 530.6 658.4 682.4 931.2
Sanitation/Sewer 18.5 19.8 22.4 31.3 41.1 44.0 39.1 55.2 58.0 50.2Water 30.9 56.5 48.3 44.4Transit -- 1.2 38.5 19.5 5.8 15.4 21.1 43.3 43.9Resources/ Comm. Development
31.3 75.5 149.0 73.9 54.5 64.5 78.7 81.8 95.2
Other 94.3 107.8 109.0 128.2 82.4 90.1 160.8 173.6 173.9 236.Total 485.0 629.4 744.7 577.7 374.4 3State Total 176.8 216.6 303.9 191.0 83.5 83.5 131.4 137.7 120.7 160.7Local Total 308.2 412.7 440.8 386.7 290.9 275.3 399.2 520.7 561.7 770.5
Non-Capital Outlay
Higher Education 67.0 171.9 212.9 250.5 328.6 336.4 371.6 397.8 362.1 555.5K-12 Education 337.2 467.4 653.5 835.8 753.0 689.2 846.3 970.4 950.8 1339.5Highways 54.2 62.0 84.2 85.0 85.4 80.1 113.5 132.9 116.7 176Sanitation/Sewer 7.9 10.1 13.1 42.0 42.4 56.7 78.1 122.4 138.6 155.
.60
180.4153.0
Resources/ Comm. 78.9 91.7 107.5 153.0 128.2 149.7 200.7 242.6 253.8 300.4
.8 2190.1 2813.3 3522.9 3533.5 4723.8.8 7584.1
Water 32.2 45.2 59.9 78.7 75.3 84.2 117.9 135.5 153.5Transit -- 23.2 25.2 34.4 52.8 69.0 80.7 101.7 121.8
Development Other 685.4 1038.3 1521.2 2025.8 2061Total 1262.8 1909.8 2677.6 3505.2 3527.5 3655.4 4622.2 5626.2 5630State Total 323.8 587.7 878.1 1066.7 1242.1 1331.3 1624.0 2077.3 2078Local Total
.4 3036.7939.0 1322.2 1799.5 2438.5 2285.4 2324.1 2998.3 3548.8 3552.4 4547.4
NOTE: 2002 data are augmented with additional local capital outlay data from the State Controller’s
004); reau, Population Division (1957-2003); Bureau of Labor Statistics price index.
Office. See Appendix B for a description of the methodology.
SOURCES: U.S. Census Bureau, Governments Division (1957-2002); California State Controller (2U.S. Census Bu
- 35 -
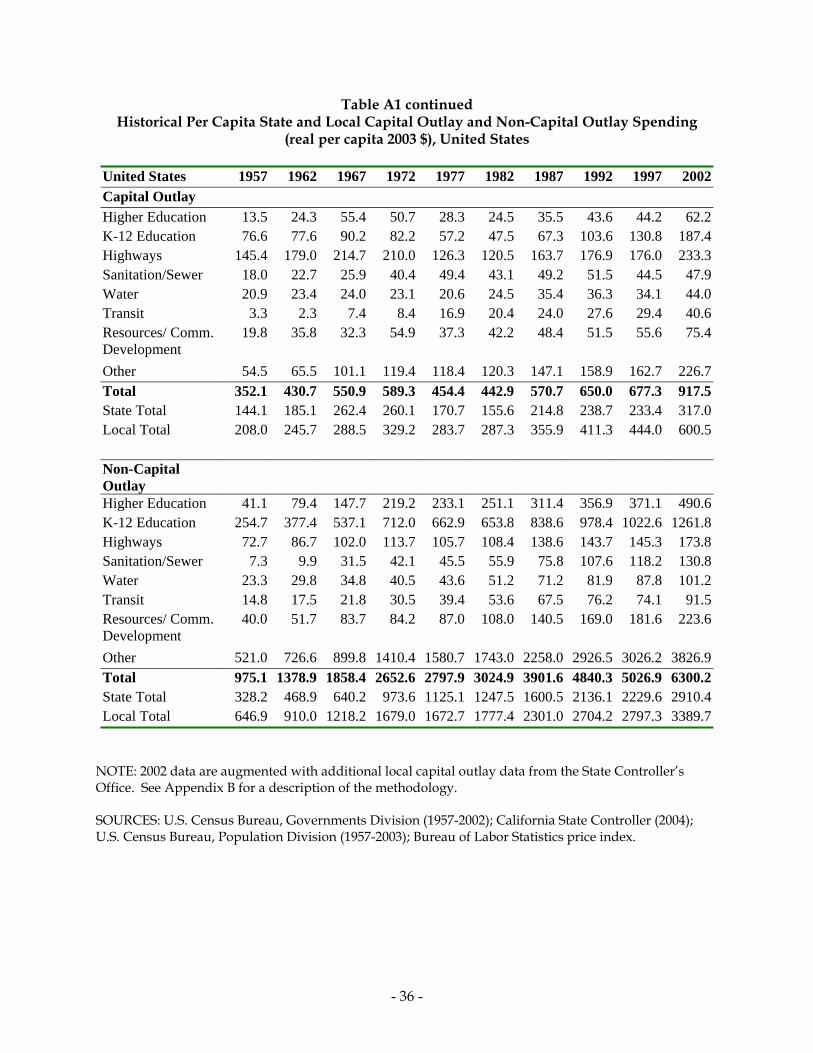
Table A1 continued Historical Per Capita State and Local Capital Outlay and Non-Capital Outlay Spending
(real per capita 2003 $), United States
2 1987 1992 1997 2002 United States 1957 1962 1967 1972 1977 198Capital Outlay Higher Education 13.5 24.3 55.4 50.7 28.3 24.5 35.5 43.6 44.2 62.2K-12 Education 76.6 77.6 90.2 82.2 57.2 47.5 67.3 103.6 130.8 187.4
3.344.5 47.9
44.0.6 29.4 40.6
37.3 42.2 48.4 51.5 55.6 75.4
158.9 162.7 226.70.7 550.9 589.3 454.4 442.9 570.7 650.0 677.3 917.5
Highways 145.4 179.0 214.7 210.0 126.3 120.5 163.7 176.9 176.0 23Sanitation/Sewer 18.0 22.7 25.9 40.4 49.4 43.1 49.2 51.5 Water 20.9 23.4 24.0 23.1 20.6 24.5 35.4 36.3 34.1Transit 3.3 2.3 7.4 8.4 16.9 20.4 24.0 27Resources/ Comm. 19.8 35.8 32.3 54.9Development Other 54.5 65.5 101.1 119.4 118.4 120.3 147.1Total 352.1 43State Total 144.1 185.1 262.4 260.1 170.7 155.6 214.8 238.7 233.4 317.Local Total 208.0 245.7 288.5 329.2 283.7 287.3 355.9 411.3 444.0 60
00.5
Non-Capital Outlay Higher Education 41.1 79.4 147.7 219.2 233.1 251.1 311.4 356.9 371.1 490.6K-12 Education 254.7 377.4 537.1 712.0 662.9 653.8 838.6 978.4 1022.6 1261.8
7.3 9.9 31.5 42.1 45.5 55.9 75.8 107.6 118.2 130.81.2
84.2 87.0 108.0 140.5 169.0 181.6 223.6
.4 1580.7 1743.0 2258.0 2926.5 3026.2 3826.9Total 975.1 1378.9 1858.4 2652.6 2797.9 3024.9 3901.6 4840.3 5026.9 6300.2
Highways 72.7 86.7 102.0 113.7 105.7 108.4 138.6 143.7 145.3 173.8Sanitation/Sewer Water 23.3 29.8 34.8 40.5 43.6 51.2 71.2 81.9 87.8 10Transit 14.8 17.5 21.8 30.5 39.4 53.6 67.5 76.2 74.1 91.5Resources/ Comm. 40.0 51.7 83.7Development Other 521.0 726.6 899.8 1410
State Total 328.2 468.9 640.2 973.6 1125.1 1247.5 1600.5 2136.1 2229Local Total 646.9 910.0 1218.2 1679.0 1672.7 1777.4 2301.0 2704.2 2
.6 2910.4797.3 3389.7
NOTE: 2002 data are augmented with additional local capital outlay data from the State Controller’s Office. See Appendix B for a description of the methodology.
SOURCES: U.S. Census Bureau, Governments Division (1957-2002); California State ControllerU.S. Census Bureau, Population Division (1957-2003); Bureau of Labor Statistics price index.
(2004);
- 36 -
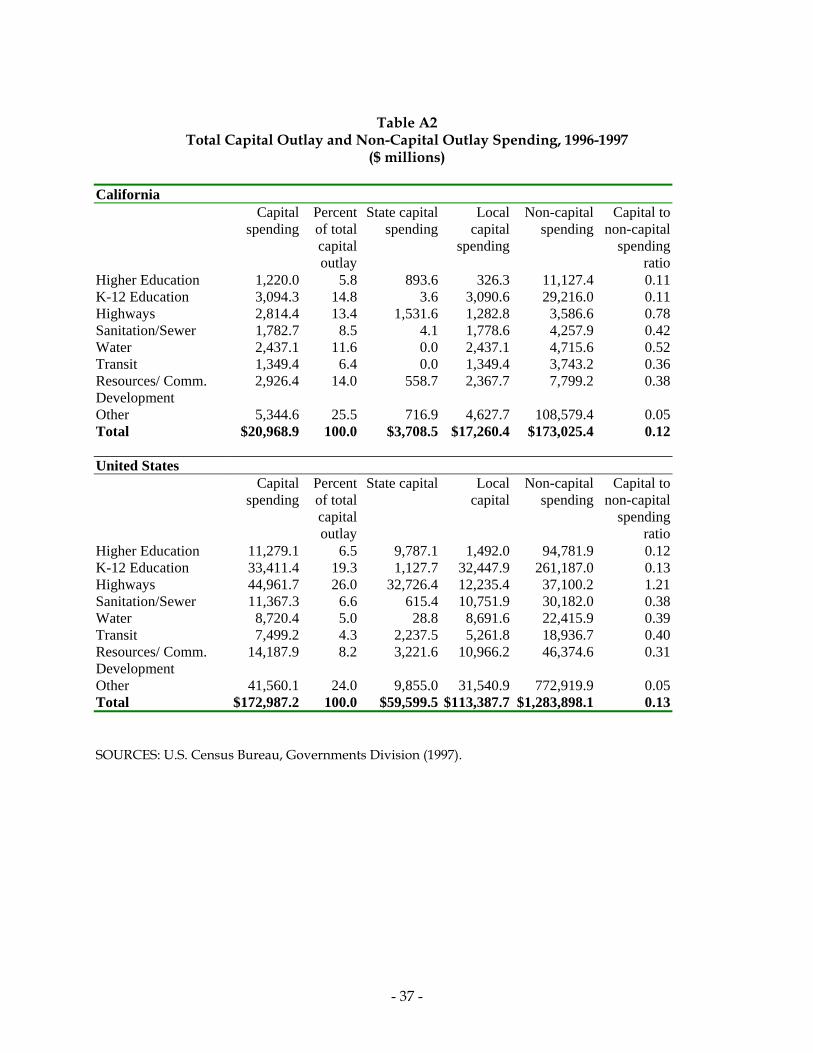
Table A2
Total Capital Outlay and Non-Capital Outlay Spending, 1996-1997 ($ millions)
California
Capital n
Percent o
capital tl
State capital spending
Local ap
spending
Non-capital in
Capital to -c ending
spendi g of t tal
ou ay
c ital spend g non apitalsp
ratioHigher EducationK-12 Education
1,2203,094
.0
.3 5 .6 32 7.4
14 .6 09 6.1 .6 28 6
.7 8 .1 77 7.9
.1 11 .0 43 5.61 .4 6 .0 34 3.2
.4 1 .7 9.2
2 .9 9$ 0 .5 26 $ 5
s
.8
.8893
36.30.6
11,1229,21
0.110.113, 0
.6 Highways 2,814.4 3.4 1,531 1, 2.8 3,58 0.78Sanitation/Sewer 1,782 .5 4 1, 8.6 4,25 0.42Water 2,437 .6 0 2, 7.1 4,71 0.52Transit ,349 .4 0 1, 9.4 3,74 0.36Resources/ Comm. Development
2,926 4.0 558 2,367.7 7,79 0.38
Other Total
5,34420,968
.6
.9 15.50.0
716$3,708
4,62$17,
7.70.4
108,57173,02
.4
.4 0.050.12
United State
Capitspending
cof total capital outlay
at a Lcapital
N itspending
non-capital
ending ratio
al Per ent St e capit l ocal on-cap al Capital to
sp
Higher Education 11,279.1 6.5 9,787.1 4 11 .7 4 72 .4 2 0
.3 6 .4 75 2
.4 5 .8 5
.2 4 .5 26 6s/ Comm. 14 .9 8 .6 96
41,560.1 24.0 9,855.0 31,540.9 772,919.9 0.05$
1, 92.0 94,78 .9 0.12K-12 Education 33,411
4.4 .7
9.36
1,12732
32, 47.935
261,18 .0 0.13Highways Sanitation/S
4,96111,367
.0
.6,726615
12,10,
.41.9
37,1030,18
.2
.0 1.210.38ewer
Water 8,720 .0 28 8,691.6 22,41 .9 0.39Transit 7,499 .3 2,237 5, 1.8 18,93 .7 0.40ResourceDevelopment Other
,187 .2 3,221 10, 6.2 46,374.6 0.31
Total 172,987.2 100.0 $59,599.5 $113,387.7 $1,283,898.1 0.13
SOURCES: U.S. Census B G
ureau, overnments Division (1997).
- 37 -

Total Capital O ing, 2001-2002 ($ millions)
California
Table A3 utlay and Non-Capital Outlay Spend
Capit
inrc
f toau
St pitdin
l capital
spending
cape
Capital to o ta
ngtio
al Pespend g o
ent tal
co
pital tlay
ate ca al spen g
Loca Non- ital sp nding n n-capi l
spendira
H 23 88. ,1 06K-12 Education 21 2 0. 7, ,1 15H s 5,379.0 16 89. 2, ,0 88Sanitation/Sewer 1,731 4. 1, ,3 32Water 2,525.0 7.9 0.0 2,525.0 6,219.5 0.41Transit 1,345 , 26Resources/ Comm. Development
3 4 , 46
Other 8,14 1 , 05T 0 1 4 2 , 12
U
igher Education 1,2 .6 3.8 6 1 535.5 19 52.1 0.7,0 .4 1.9 0 021.4 46 81.5 0.
ighway .8 2,9 5 389.5 6 87.8 0..5 5.4 7 726.7 5 44.0 0.
.7 4.2 0.0 1,345.7 5 276.1 0.4,7 1.7 14.7 8 8.0 3,883.7 10 358.6 0.
7.9 25.4 1,0 0.5 7,137.4 162 865.6 0.otal $32,1 5.8 00.0 $5,5 0.8 $ 6,565.1 $261 485.1 0.
nited States
Capital in
Percent f au
State capital Local l
Non-capital e
Capital to o ta
nti
spend g o total c pital o tlay
capita sp nding n n-capi l spendi g
oraH 47 6 , 13K 50.8 2 90. 52, , 15Highways 69.7 2 71. 16, ,2 34S /Sewer 96 78. 12, ,1 37W 93 22. 1 , 44Transit 11,513.8 4.4 3,911.2 7,602.7 25,954.4 0.44Resources/ Comm. Development
8 3 1 3
O 5 4 0T 5 1 1 7 1
igher Education -12 Education
17,653,1
.9
6.80.4
15,34
5.20
2,282.7660.8
139357
162.3 922.1
0.0.
66,1 5.4 49,2 5 898.1 49 97.8 1.anitation 13,5 .6 5.2 6 4 918.3 37 04.4 0.ater 12,4 .6 4.8 2 2 2,271.3 28 708.5 0.
21,3 9.8 8.2 4,8 0.1 6,559.7 63,427.3 0. 4
ther 64,294.1 24.7 15,1 0.5 9,143.7 1,085,540.7 0. 6otal $260,2 6.3 00.0 $89,9 9.0 $1 0,337.3 $1,787,117.6 0. 5
NOTE: U.S. Census Bureau data are augmented with additional local capital outlay data from the State
SOURCES: U.S. Census Bureau, Governments Division (2002); California State Controller (2004).
Controller’s Office. See Appendix B for a description of the methodology.
- 38 -

Table A4
State Budget Capital Outlay Expenditures over time (actual $ millions, real per capita 2003 $)
1965-66u
1965-66
ca
1984-85 ctual
1984-85 lpit
2002-03 u
2002-03
act al real per pita
a reaca
per a
act al real per capita
Transportation 659.3 159.84 892 2301.95 8 .97 48.34 64.87Resources
on308.6 74.82 73.15 3.96
.51 32.36 74.7 4.0 .55 .40 27. 43.2 4.0 .10 204.68
.63 1.85 86.8 4.70 .96
s .46 1.81 14.1 0.77 .90
ther .31 9.04 17.1 0.93 .80
6.3 $307.0 602 86 7.3 $
3 537.00 15.13Higher Educati
ation133 5 5 453
012.78
K-12 Educ 112 25 4 4 2 7263Corrections
& Human 7 4 9 0.28
HealthService
7 4 1 0.05
General Govt & O 37 5 39 1.12
Total $1,26 $1, .2 $ .7 $10,60 298.9
NOTE: K-12 education capi y loca ance t c istrict capital outl y. Expenditures do not ntal c d
SOURCES: California Department of (1967-1968, 1986-1987, 2004-2005).
tal outla is state money ginclude n
Finance
iven ason-governme
l assistost fun
o fund s.
lo al school da
- 39 -

Table A5 California State Budget and Local Controller data, 1999-2000
K-12 Education School Districts
t Total Capital/ Operating
State Budge
Operating Expenditures 40,002 Capital Outlay 1Local Assistance 63
39,7845,000
218
32,85,001
13%
n nity
ge cts
State Budget
iversund
Total Capital/ eratin
Higher Educatio Commu ColleDistri
Un ity F s * Op g
Operating Expenditures 9 10,312 8,21 22,95 4,42 4 4 CapitalLocal A
Outlay 436 1,37 2,033 9% 3,087
219 8 ssistance
Water cial
rictsS Total Capital/
eratinCities Spe
DistLocal Total
tate Budget Op g
Water Supply & Dr king Wa r in te Operating xpenditures 6 3Capital Outlay 53 2,824 4 3,2Local Assistance 93 Sewer & Other Water Quality
itures 74 3, 6 + 1 1, 43%
E 2,127571
3,72,2
3 5,890 32 60
6,223 84
53%
Operating Expend 1,795 1,2 3,069 339 408 Capital Outlay 754 70 ,460 460 Local Assistance 230 Highways, Streets, Roads
Local En State Budget tal pital/rating
tities To Ca Ope
Operating Expenditures 2,165 1,026 3,191 Capital Outlay Suppo 8
l Outlay ,8ocal Assistance 860
rt1
887 8 762 90%
Capita 88 1,774 3,6L Transit Local Entities State Budget Total Capital/
Operating Operating Expenditures 3,891 89 3,979 Capital Outlay 2,523 45 2,568 65% Local Assistance 453 * See Appendix B for a definition of University Funds. + Special district sewer capital outlay is estimated; see Appendix B for the methodology.
SOURCES: California Department of Finance (2001-2002); California State Controller (1999-2000); Chancellor’s Office (1999-2000).
- 40 -

Appendix B: Data Source Methods
Census of Governme
Fiscal informatio fo d l r a or States was obtained from the nsu , Go en n, CGovernments, Vol. 4, Compendium of Gover Finances, 1957, 7, 1972, 197 ,
1997, and 200 iles a at ensu go / html. ation contains fis for al and overnments in the United
unties, m ities a nsh ool d ts, a ial ts U.S. Census for th De t of er
eal figures, w late by rodu ice In or Mat andnts for Construction provided by Bureau of Labor Statistics, WPUSOP2200. To obtain
ivide b fornia a nite s annual Population Estimates and the U.S. Ce Division. Price indices
pulation estimate iven fiscal ye nt th f r.
Census of Governments special district capital outlay data for 2002 were incomplete,
apital outlay totals and in the respective sectors of Resources/Community Development, Water, Sanitation/Sewer, and
ed from data supplied by the California State Controller for Total Fixed Assets by special district type in 2001 and 2002; we calculated the change in fixed assets between the two years and used these totals to augment what was reported by the Census of Governments for California and United States special district capital outlay.
Census data are useful for comparisons of total, state, and local expenditures over time and between California and the rest of the United States. However, certain sector totals for capital outlay cannot be tracked consistently over time. For instance, the “Water supply” expenditure category only includes local government expenditures prior to 1977, not state or federal water supply expenditures. Additionally prior to 1982 the Compendium of Government Finances does not list capital outlay expenditures for Police protection, Fire protection, Health, Public Welfare, or Sanitation. These expenditures can be calculated from raw data files in 1972 and 1977, but the 1960s raw files do not allow this calculation. Thus to avoid differences in definitions and incomplete comparisons, we do not use the Census of Governments data to compare expenditures by function over time, but it is useful for total expenditure comparisons.
California State Budget
Fiscal information on more detailed state-level expenditures and revenues was obtained from the California Department of Finance, Governor’s Budget, 1962-63, 1967-68, 1986-87, 2000-01, and 2004-05. The budget of a given fiscal year contains actual expenditures for the fiscal year two years previous (i.e., the 2004-05 budget contains 2002-03 actual expenditures).
s and
nts
n r state anU.S. Ce
ocal gove nment totvernm
ls in Califts Divisio 1962, 196
nia and thensus o
e Unitedf 7, 1982
s Bureaunment
1987, 1992, and 2 data f vailable www.c s.gov/ vs/www index.This inform cal data l state local g Statesincluding states, co unicipal nd tow ips, sch istric nd spec districsurveyed by the Bureau e U.S. partmen Comm ce.
To obtain rCompone
e def the P cer Pr dex f erials
per capita figures, we dten-year Census counts provided by
y Cali nd Unsus Bureau, Population
d State
and po s used in a g ar represe e later year of the iscal yea
because of a reporting change of fixed assets by the California State Controller. To correct for this problem, we have added in $3,042,672,000 to the special district c
Other for both California and the United States. This amount was compil
- 41 -

For total expenditures we use numb et Appendix Schedule 9. These totals inclu e reimbursements from other levels of government or non-governmental cost funds (i.e., student
tely raised f UC a n trans ion fun her funds that are not included in budget totals). For expenditures of individual function categories
cation), w added non- rnmental d expenditures to nditures Department and Age gets.
emain excluded.
f higher education, the dget lists revenue sources that ct level ab fer “U ity F
include Higher Education F ncom de rsity Funds, Nng astintlay Colle itor nue F U Park Revenue
rsity Continuing Education Revenue Fund, and t ial Dep Fund.
The following state departments are included in each function category listed in ix Table A5:
Transportation: California Transportation Commission (Transit), Department of ics and Transportation Planning and Administration, which
een Highway ra igh d Ra ority (T ansit), rtation Prog (Tran
g Water: Department of Water Resources, Department of D Wa
Water Quality: State Wa Re s C l Boa
condar University of College r rsity of Governors of the
ia Community Colleges, California Student Aid Commission
rtment of ucation, Sta ntributions e State Teachers’ em, School Faci d Progra mission cher Cre ling
In 1962-63 and 1967-68 the budget format is different. General, Special, and Bond Fund xpenditures are tak p get S e 1 for ory.
penditures S er fu t inclu ll uded. ital expenditures including the State Building Program, Progr te Highway Program, Wildlife Conservation Program,
ion Acquisition and Developm rogram, a fornia Water Facilities ded. For K-12 ed cation, local assistance “Payments to Schools Districts”
hool Building Loan Fund, and State School
ers reported in the Budgde General, Special, Bond, and Federal Funds but do not includ
fees for UC, priva unds for nd CSU, certai portat ds, and ot
(i.e., Transportation, Edutary expe
e haveb
gove cost funreported budge y reviewing ncy budReimbursements r
In the case ocollected at the state
state bule A5 ree, Nonfe
are not in faunds”; they
onfederal . Appendix T
ees and Is Fund, H
s to these asral Unive
nivers
Extramural Funds, HastiOperations & Capital Ou
gs Extramural Fund, Other Unclassified Funds (State ges Dorm), CSU y Reve und, CS ing
ositFund, State Unive he Spec
Append
Transportation (excluding Aeronautcannot be allocated betw s and T nsit), H -Spee il Auth rSpecial Transpo rams sit)
Water Supply and DrinkinHealth Services Office of rinking ter
Sewer and ter so rceu ontro rd
Higher Education: California PostseCalifornia, Hastings Californ
y Education Commission, nia State Unive of Law, Califo , Board
Education: Depa Ed te Co to thRetirement Syst lities Ai m, Com on Tea dentia
capital eFederal Fund ex
en from the Caare taken from
ital Outlay Budchedule 2. Oth
chedulnds no
each categded in overa
budget totals are not inclnstruction
All capDistrict Fair Co am, StaParks and Recreat
rogram are incluent P nd aliC
P ufrom the State School Building Aid Fund, Public ScConstruction Fund are included as capital outlays.
- 42 -

California Local Governments
Fiscal information on more detailed local-level expenditures and revenues was obtained ler’s Office Annual Financial Reports for Counties, Cities,
Special Districts, School Districts, Streets and Roads, and Transit Operators, 1999-00, and the Chance x
ditures
s e rep rted in the
Chancellor’s Office Fiscal Data Abstract; the capital outlay total is reported in Table VII, and operati ater
in the Streets and Roads Annual Report; capital outlay (classified as “construction and rights of way”) i
t
from the California State Control
llor’s Office of California Community Colleges Fiscal Data Abstract, 1999-00. AppendiTable A5 details local government data in each function category for operating expenand capital outlay.
K-12 school district expenditures are reported in the School Districts Annual Report; capital outlay is reported in Figure 12, and operating expenditures are total expenditures minucapital outlay. Higher education community college district expenditures ar o
ng expenditures are “total expenditures and other outgo” minus capital outlay. Wlocal expenditure data are reported in the Cities Annual Report and Special Districts Annual Report; capital outlay and operating expenditures are reported in Table 7 for cities, and capital outlay (classified as “additions to fixed assets”) and operating expenditures are reported in Tables 22 and 23 for special districts. Highways, streets, and roads expenditures are reported
s reported in Figure 1, and operating expenditures are calculated as total expendituresminus capital outlay. Transit expenditures are reported in the Transit Operators and Non-TransiClaimants Annual Report; capital outlay (classified as “capital additions to equity”) is reported in Figure 5, and operating expenses are reported in Figure 10.
- 43 -


PUBLIC POLICY INSTITUTE OF CALIFORNIA
Board of Directors
Thomas C. Sutton, Chair Chairman & CEO Pacific Life Insurance Company
Edward K. Hamilton Chairman Hamilton, Rabinovitz & Alschuler, Inc.
Gary K. Hart Founder Institute for Education Reform California State University, Sacramento
Walter B. Hewlett Director Center for Computer Assisted Research in the Humanities
David W. Lyon President and CEO Public Policy Institute of California
Cheryl White Mason Vice-President Litigation Legal Department Hospital Corporation of America
Arjay Miller Dean Emeritus Graduate School of Business Stanford University
Ki Suh Park Design and Managing Partner Gruen Associates
Constance L. Rice Co-Director The Advancement Project
Raymond L. Watson Vice Chairman of the Board Emeritus The Irvine Company
Carol Whiteside President Great Valley Center
Advisory Council
Clifford W. Graves General Manager Department of Community Development City of Los Angeles
Elizabeth G. Hill Legislative Analyst State of California
Hilary W. Hoynes Associate Professor Department of Economics University of California, Davis
Andrés E. Jiménez Director California Policy Research Center University of California Office of the President
Norman R. King Executive Director San Bernardino Associated Governments
Daniel A. Mazmanian C. Erwin and Ione Piper Dean and Professor School of Policy, Planning, and Development University of Southern California
Dean Misczynski Director California Research Bureau
Rudolf Nothenberg Chief Administrative Officer (Retired) City and County of San Francisco
Manuel Pastor Professor, Latin American & Latino Studies University of California, Santa Cruz
Peter Schrag Contributing Editor The Sacramento Bee
James P. Smith Senior Economist RAND Corporation

PUBLIC POLICY INSTITUTE OF CALIFORNIA 500 Washington Street, Suite 800 San Francisco, California 94111 Phone: (415) 291-4400 Fax: (415) 291-4401 www.ppic.org [email protected]