Understanding how carbon dioxide emissions from human … Change Lawsuit... · 2018-05-23 ·...
70
Understanding how carbon dioxide emissions from human activity contribute to global climate change MYLES ALLEN Environmental Change Institute, School of Geography and the Environment & Department of Physics University of Oxford [email protected]
-
Upload
truongkhanh -
Category
Documents
-
view
214 -
download
0
Transcript of Understanding how carbon dioxide emissions from human … Change Lawsuit... · 2018-05-23 ·...
Understanding how carbon dioxide emissions from human activity contribute to global climate changeMYLES ALLEN Environmental Change Institute, School of Geography and the Environment & Department of Physics
University of Oxford

The impact of carbon dioxide emissions on global climate
• How rising atmospheric CO2 causes global warming
• How industrial emissions are increasing atmospheric CO2
• Modeling the impact of increasing CO2 concentrations
• Quantifying human and natural influences on global climate
– A digression on ice-ages
• How rising temperatures are affecting global sea level
• The permanent, cumulative impact of CO2 emissions
– Implications for the impact of delay in emission reductions

1824-1860s: Fourier and Tyndall
• Identified CO2 as one of the trace gases responsible for the blanketing effect of the atmosphere, absorbing and emitting infra-red radiation, keeping Earth’s surface warm.
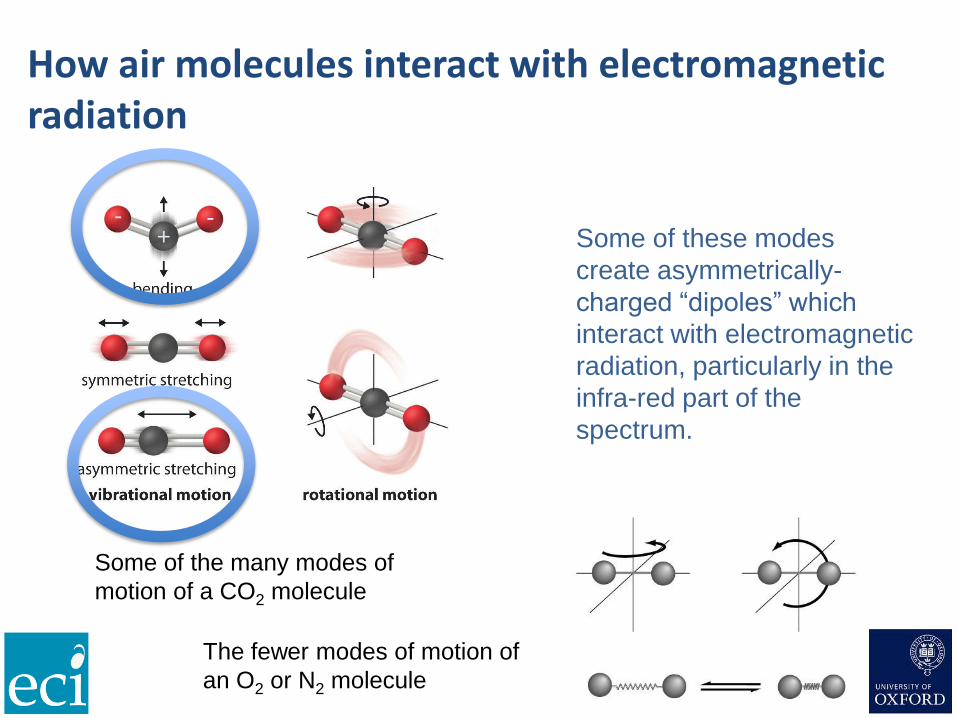
How air molecules interact with electromagnetic radiation
Some of the many modes of
motion of a CO2 molecule
The fewer modes of motion of
an O2 or N2 molecule
+--
Some of these modes
create asymmetrically-
charged “dipoles” which
interact with electromagnetic
radiation, particularly in the
infra-red part of the
spectrum.

The first quantitative account of the impact of rising CO2 on temperature: Svante Arrhenius
• “Any doubling of the percentage of carbon dioxide in the air would raise the temperature of the earth's surface by 4°C; and if the carbon dioxide were increased fourfold, the temperature would rise by 8°C.”

Both temperature and density of absorbing CO2
molecules decrease with height
View
from
side
View
from
aboveRate of energy emitted to
space depends on the
average temperature of
molecules as seen from
above
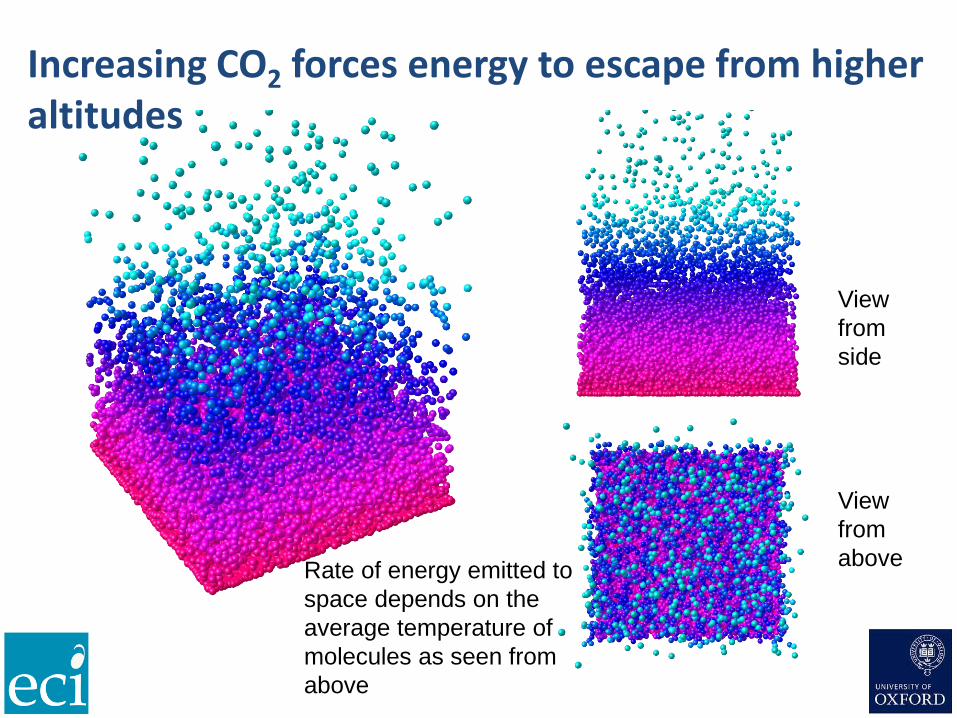
Increasing CO2 forces energy to escape from higher altitudes
View
from
side
View
from
aboveRate of energy emitted to
space depends on the
average temperature of
molecules as seen from
above

Higher air is colder, and so radiates less energy
View
from
side
View
from
aboveRate of energy emitted to
space depends on the
average temperature of
molecules as seen from
above

So the surface and lower atmosphere have to warm up to restore balance
View
from
side
View
from
above
Original state
before CO2
increase &
warming
Rate of energy emitted to
space depends on the
average temperature of
molecules as seen from
above

Successive CO2 doublings have about the same impact on global energy budget
View
from
side
View
from
above
After the first
CO2 doubling
and before
warming

Impact of rising GHGs on the spectrum of outgoing energy has been directly observed from space
Nimbus 4,
1970
Comparison
of outgoing
spectra, 1997
versus 1970.
Harries et al
(2001)

And is tested in the models used for weather forecasting millions of times per day
Satellite observed outgoing radiation
Modelle
doutg
oin
g r
adia
tion
Dessler et al, JGR, 2008
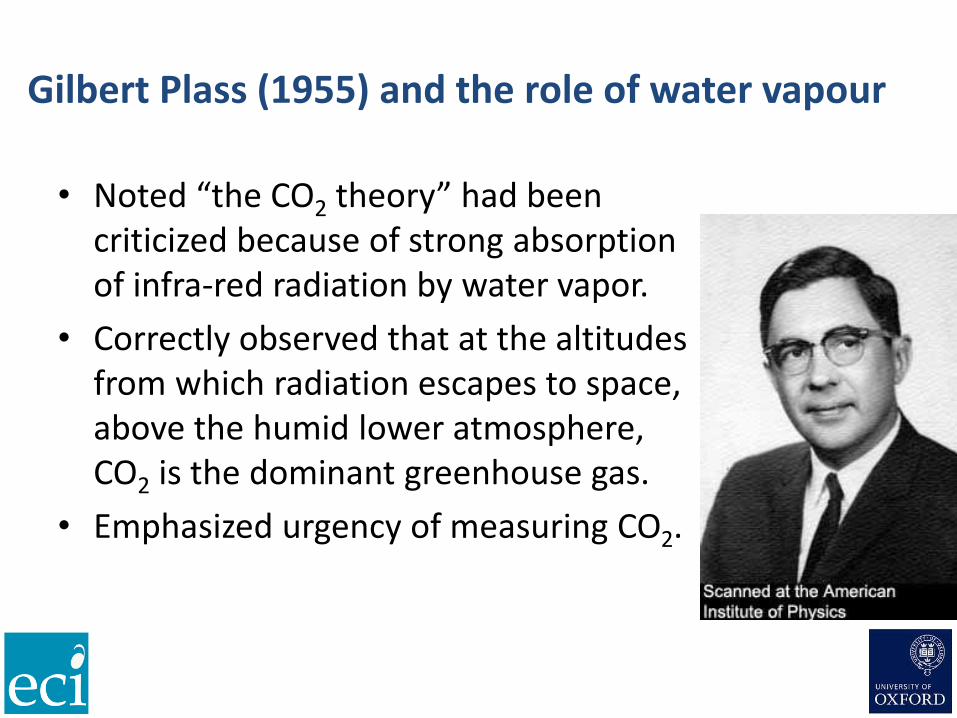
Gilbert Plass (1955) and the role of water vapour
• Noted “the CO2 theory” had been criticized because of strong absorption of infra-red radiation by water vapor.
• Correctly observed that at the altitudes from which radiation escapes to space, above the humid lower atmosphere, CO2 is the dominant greenhouse gas.
• Emphasized urgency of measuring CO2.

The impact of carbon dioxide emissions on global climate
• How rising atmospheric CO2 causes global warming
• How industrial emissions are increasing atmospheric CO2
• Modeling the impact of increasing CO2 concentrations
• Quantifying human and natural influences on global climate
– A digression on ice-ages
• How rising temperatures are affecting global sea level
• The permanent, cumulative impact of CO2 emissions
– Implications for the impact of delay in emission reductions

Roger Revelle, 1957
• Explained how ocean buffer chemistry limits the amount of CO2 taken up by the oceans, even in equilibrium.
• Hence CO2 emissions have a permanent impact on climate: we can’t rely on the oceans to dilute them away.

Charles David Keeling’s observations, 1958-60
• Unequivocal evidence that CO2 concentrations are rising steadily

Carbon dioxide levels are rising to levels not seen in over 20 million years

Atmospheric oxygen and carbon isotopes indicate recent CO2 increase is created by combustion, not simply released from the oceans
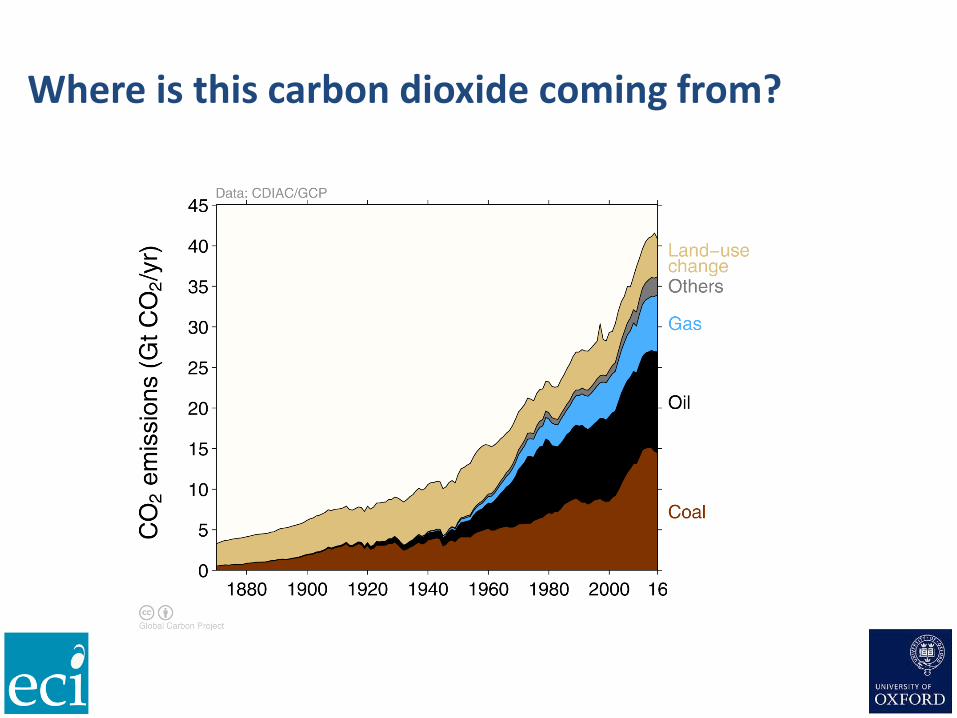
Where is this carbon dioxide coming from?
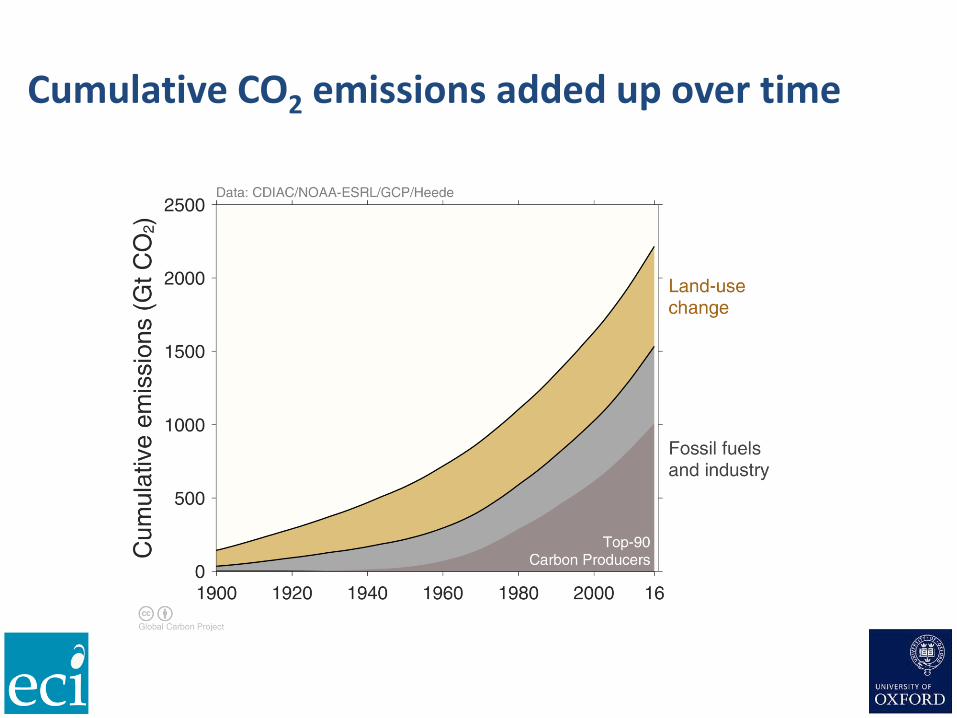
Cumulative CO2 emissions added up over time
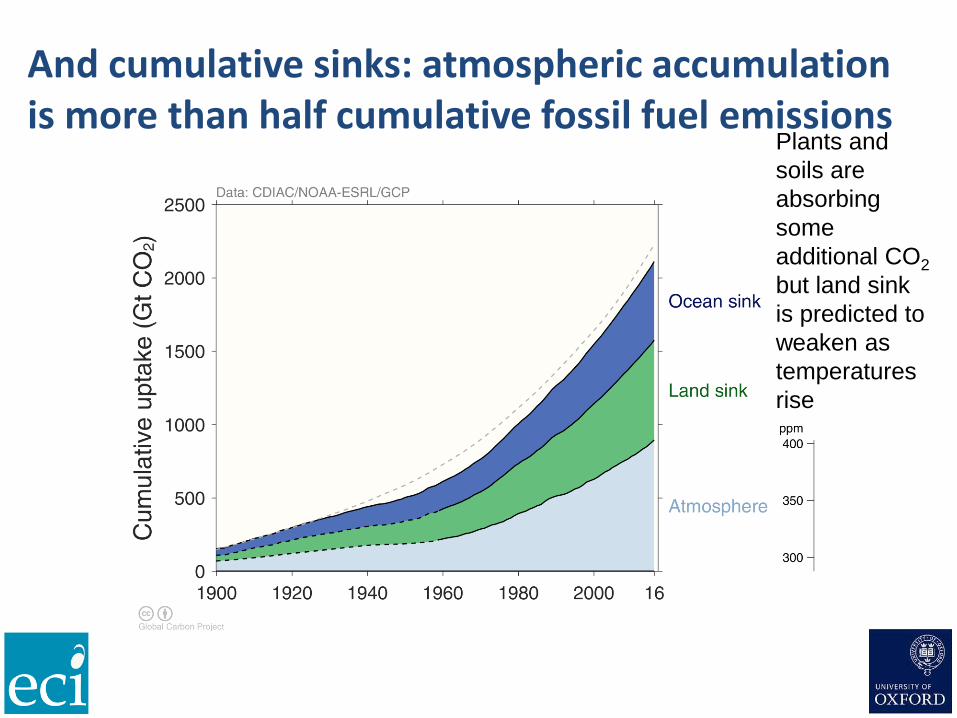
And cumulative sinks: atmospheric accumulation is more than half cumulative fossil fuel emissions
Plants and
soils are
absorbing
some
additional CO2
but land sink
is predicted to
weaken as
temperatures
rise
The impact of carbon dioxide emissions on global climate
• How rising atmospheric CO2 causes global warming
• How industrial emissions are increasing atmospheric CO2
• Modeling the impact of increasing CO2 concentrations
• Quantifying human and natural influences on global climate
– A digression on ice-ages
• How rising temperatures are affecting global sea level
• The permanent, cumulative impact of CO2 emissions
– Implications for the impact of delay in emission reductions

Modeling the impact of rising CO2 concentrations: the global energy budget
• Increased CO2 and other forms of pollution are already reducing outgoing radiation by about 2.5 W/m2
– Equals 12.5 million TWh per year
– World primary energy consumption is ~175,000 TWh per year
• The planet as a whole has to warm up to restore the balance between incoming and outgoing energy.

Disturbing the global energy balance
2.5 additional W/m2 IN
due to increased GHGs
1.75 additional
W/m2 OUT
due to 1°C
observed
warming
0.75 W/m2 increasing heat
content of the climate system

Most of that energy imbalance is being trapped in the oceans
• 0.75W/m2 = 135 ZJ/decade
• First documented by Sydney Levitus et al (2000)

The global energy budget, now and in equilibrium
DFexternal = l +m( )DT + DQocean
DF2xCO2 = lDT2xCO2
Net energy
imbalance due to
external drivers =
c. 2.5 W/m2
Additional energy
emitted to space per
degree of warming due
to disequilibrium
Warming relative to
pre-industrial = c. 1°C
Rate of energy
accumulation in
climate system =
c. 0.75 W/m2
Equilibrium warming
due to doubling CO2
(“Climate Sensitivity”)
Additional energy
emitted to space per
degree of warming in
equilibrium
Energy imbalance
due to doubling
CO2 = 3.7 W/m2
Now:
Equilibrium:

“Bottom-up” estimates of warming due to doubling of CO2
• Manabe and Wetherald, 1967: single-column radiativeconvective model, 2.3°C
• Manabe and Wetherald, 1975: three-dimensional general circulation model, 3.5°C

The 1979 National Academy of Sciences Report
• Gave a range of 1.5-4.5°C for equilibrium warming on doubling CO2, emphasizing:
– Oceans “could delay the estimated warming for several decades”
– “We may not be given a warning until the CO2 loading is such that an appreciable climate change is inevitable.”
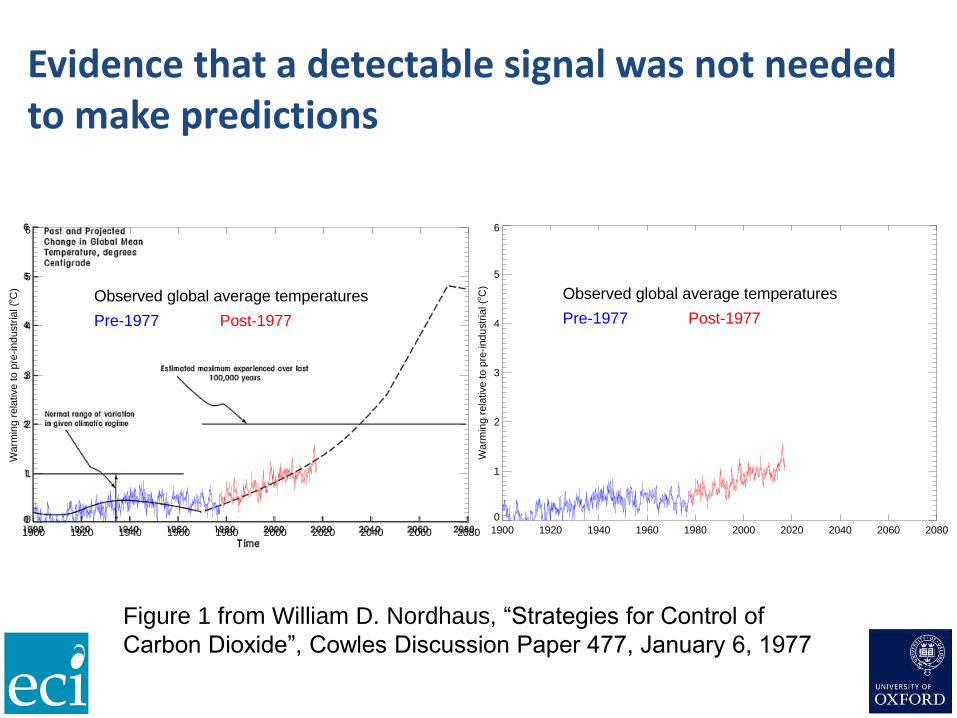
Evidence that a detectable signal was not needed to make predictions
1900 1920 1940 1960 1980 2000 2020 2040 2060 2080
0
1
2
3
4
5
6
Warm
ing
rela
tive
to p
re-i
nd
ustr
ial (o
C)
Observed global average temperatures
Pre-1977 Post-1977
1900 1920 1940 1960 1980 2000 2020 2040 2060 2080
0
1
2
3
4
5
6
Warm
ing
rela
tive
to p
re-i
nd
ustr
ial (o
C)
Observed global average temperatures
Pre-1977 Post-1977
Figure 1 from William D. Nordhaus, “Strategies for Control of
Carbon Dioxide”, Cowles Discussion Paper 477, January 6, 1977

The impact of carbon dioxide emissions on global climate
• How rising atmospheric CO2 causes global warming
• How industrial emissions are increasing atmospheric CO2
• Modeling the impact of increasing CO2 concentrations
• Quantifying human and natural influences on global climate
– A digression on ice-ages
• How rising temperatures are affecting global sea level
• The permanent, cumulative impact of CO2 emissions
– Implications for the impact of delay in emission reductions
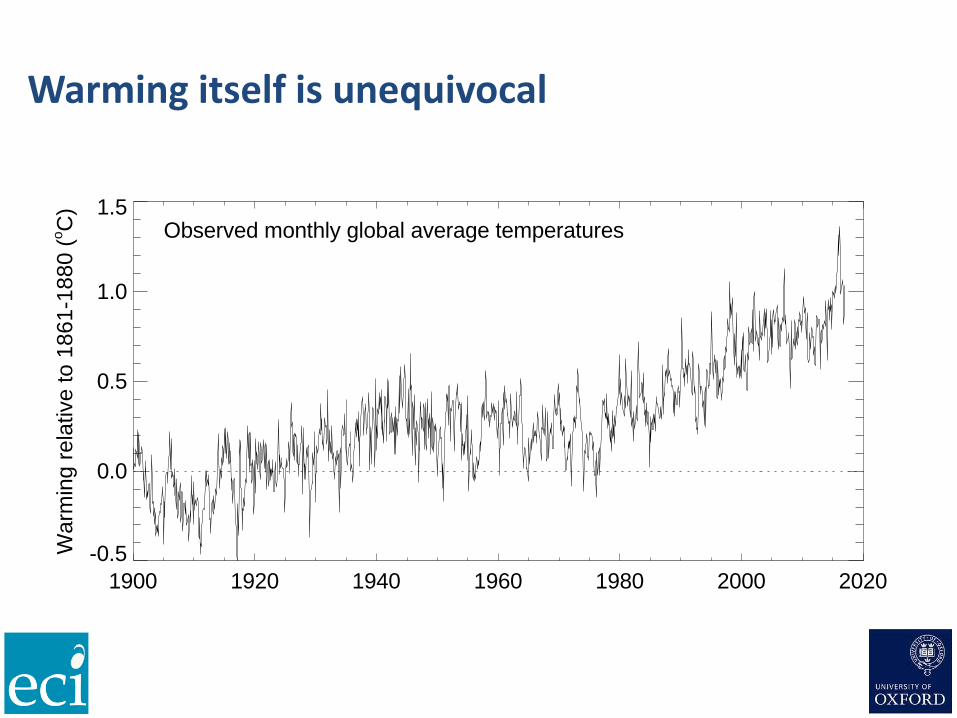
Warming itself is unequivocal
1900 1920 1940 1960 1980 2000 2020
-0.5
0.0
0.5
1.0
1.5
Wa
rmin
g r
ela
tive t
o 1
861
-18
80
(oC
)
Observed monthly global average temperatures
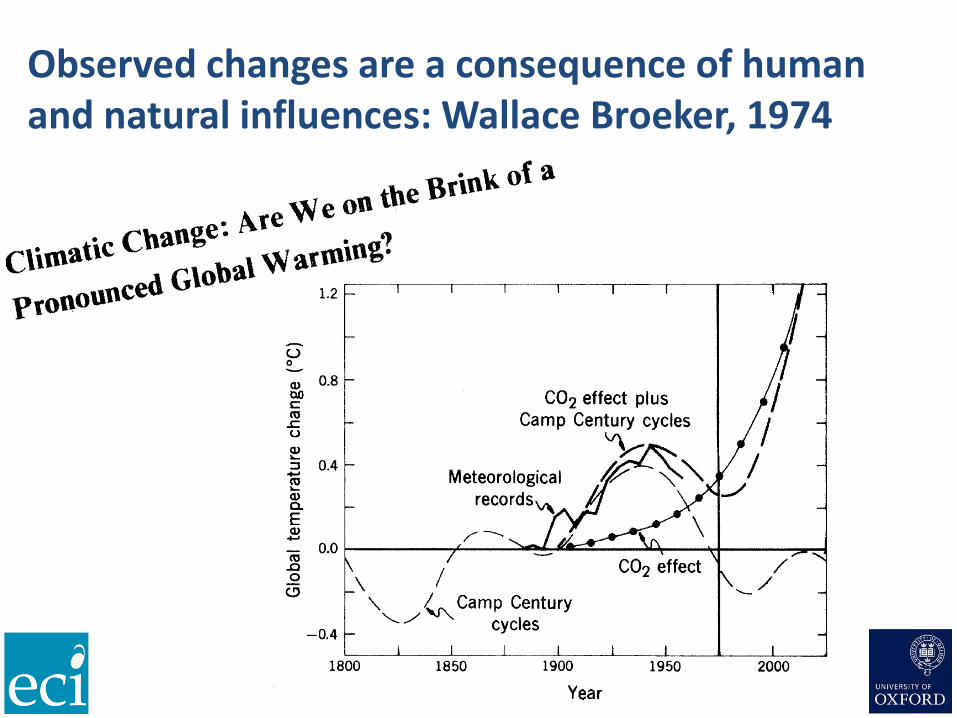
Observed changes are a consequence of human and natural influences: Wallace Broeker, 1974

The impact of carbon dioxide emissions on global climate
• How rising atmospheric CO2 causes global warming
• How industrial emissions are increasing atmospheric CO2
• Modeling the impact of increasing CO2 concentrations
• Quantifying human and natural influences on global climate
– A digression on ice-ages
• How rising temperatures are affecting global sea level
• The permanent, cumulative impact of CO2 emissions
– Implications for the impact of delay in emission reductions

The origins of the Little Ice Age, 1400-1900
• Gradual 0.5°C cooling over the millennium.
• Onset can be explained as a response to higher volcanic activity and low solar activity.
Sunspot number
N. Hemisphere temperature
Volcanic
activity

Milutin Milankovitch and the origins of the ice ages

Milankovitch cycles and ice-core records over the past 800,000 years

Permanent ice observed (even in Antarctica) only appeared after CO2 dropped below 400ppm
Age (Millions of years before present)

More recent drivers of change in global temperature
1900 1920 1940 1960 1980 2000 2020
-4
-2
0
2
4
Top
-of-
atm
osph
ere
im
ba
lan
ce
(W
/m2)
Drivers of change in the global energy balance:
Human activity
Long- and short-term solar variability
Volcanic activity

The shape of the responses to these drivers is determined by simple energy conservation
1900 1920 1940 1960 1980 2000 2020
-0.5
0.0
0.5
1.0
1.5
Wa
rmin
g r
ela
tive t
o 1
861
-18
80
(oC
)
Expected responses to external drivers:
Human activity
Long- and short-term solar variability
Volcanic activity

We use these “fingerprints” to test the null-hypothesis that CO2 has no warming effect
1900 1920 1940 1960 1980 2000 2020
-0.5
0.0
0.5
1.0
1.5
Wa
rmin
g r
ela
tive t
o 1
861
-18
80
(oC
)
-0.5
0.0
0.5
1.0
1.5
CO
2-in
duce
d w
arm
ing in 2
01
6 (
oC
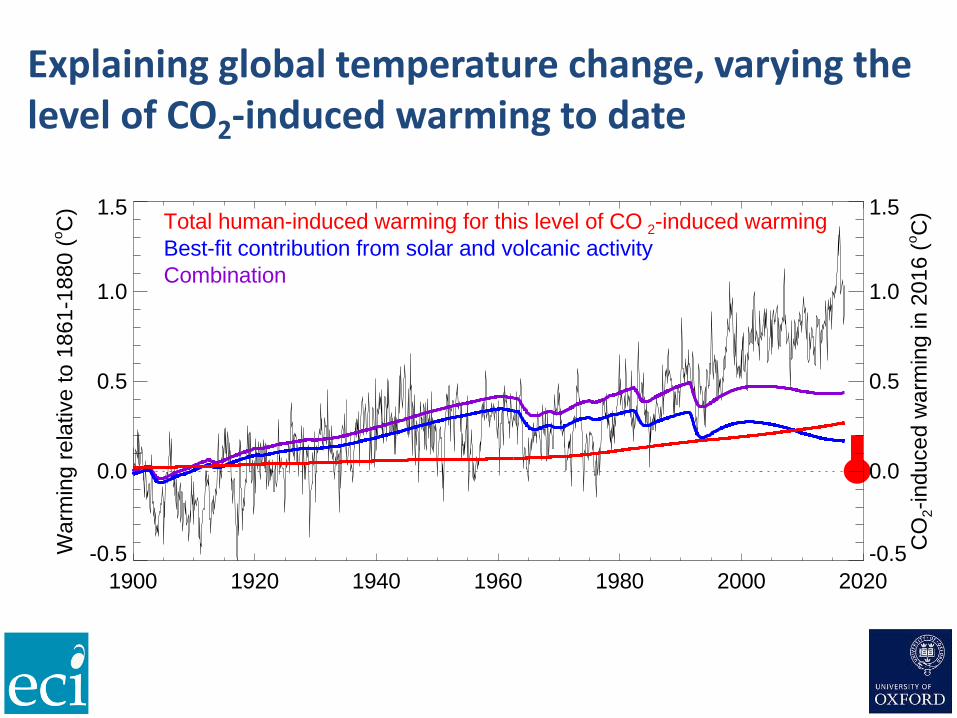
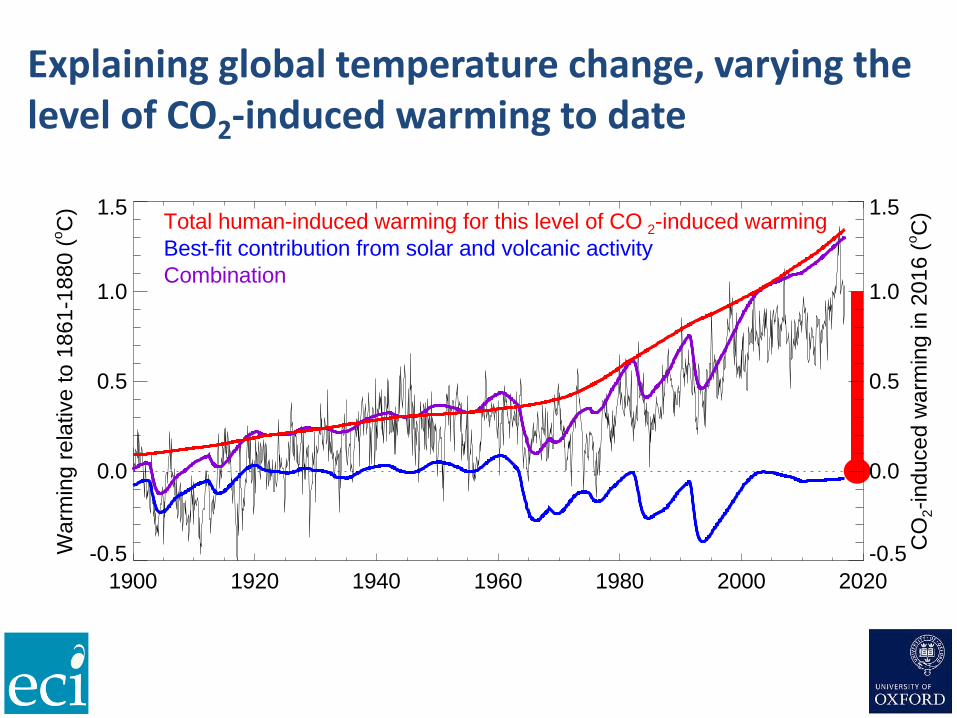
)Total human-induced warming for this level of CO 2-induced warming
Best-fit contribution from solar and volcanic activity
Combination
Best fit to observed warming allowing any amplification of responses to low- and high-frequency solar variability and volcanic activity
“What if” exercise: what if CO2 has no impact on global
temperature? Observed changes would then be extremely
unlikely, even if we allow for unknown processes amplifying the
response to very small changes in solar activity.

Explaining global temperature change, varying the level of CO2-induced warming to date
1900 1920 1940 1960 1980 2000 2020
-0.5
0.0
0.5
1.0
1.5
Wa
rmin
g r
ela
tive t
o 1
861
-18
80
(oC
)
-0.5
0.0
0.5
1.0
1.5
CO
2-in
duce
d w
arm
ing in 2
01
6 (
oC
)Total human-induced warming for this level of CO 2-induced warming
Best-fit contribution from solar and volcanic activity
Combination

Similar conclusions from multi-dimensional fingerprints based on complex climate models
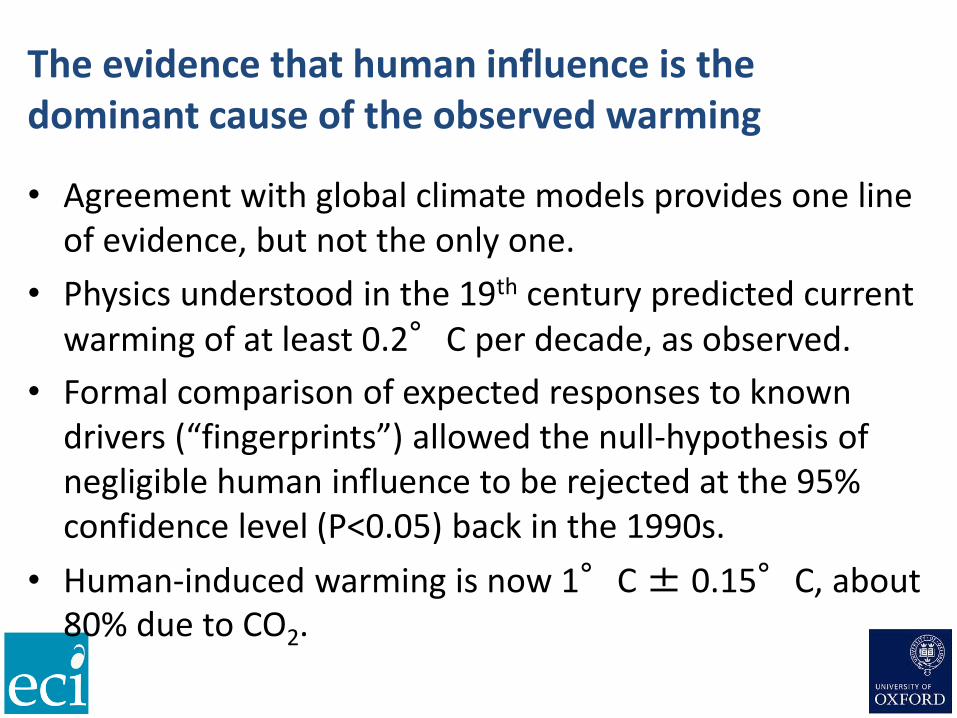
The evidence that human influence is the dominant cause of the observed warming
• Agreement with global climate models provides one line of evidence, but not the only one.
• Physics understood in the 19th century predicted current warming of at least 0.2°C per decade, as observed.
• Formal comparison of expected responses to known drivers (“fingerprints”) allowed the null-hypothesis of negligible human influence to be rejected at the 95% confidence level (P<0.05) back in the 1990s.
• Human-induced warming is now 1°C ± 0.15°C, about 80% due to CO2.

The impact of carbon dioxide emissions on global climate
• How rising atmospheric CO2 causes global warming
• How industrial emissions are increasing atmospheric CO2
• Modeling the impact of increasing CO2 concentrations
• Quantifying human and natural influences on global climate
– A digression on ice-ages
• How rising temperatures are affecting global sea level
• The permanent, cumulative impact of CO2 emissions
– Implications for the impact of delay in emission reductions
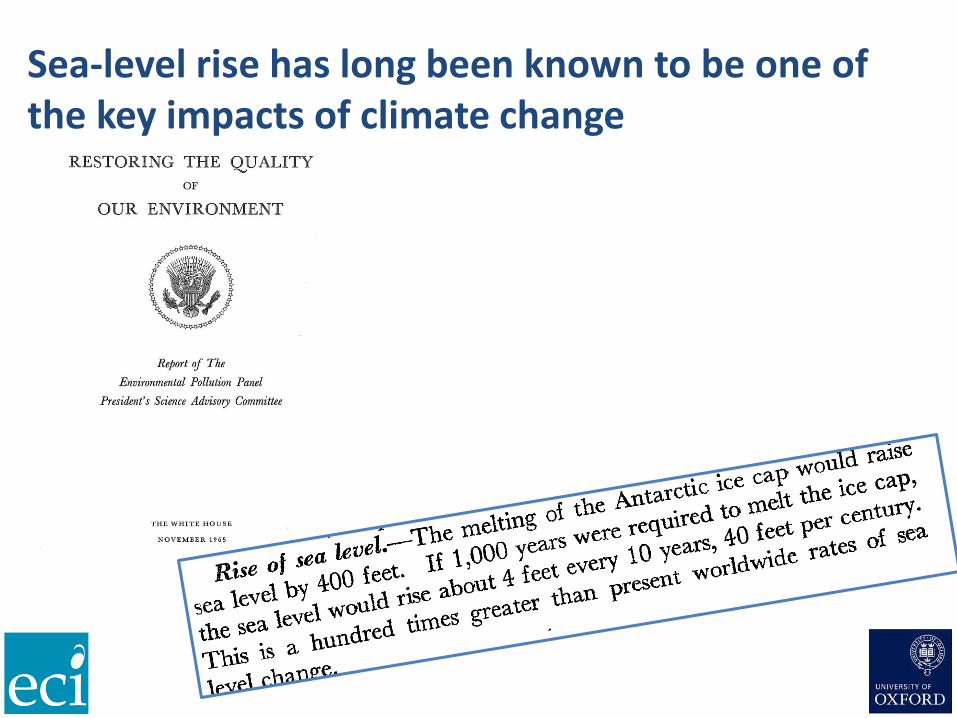
Sea-level rise has long been known to be one of the key impacts of climate change
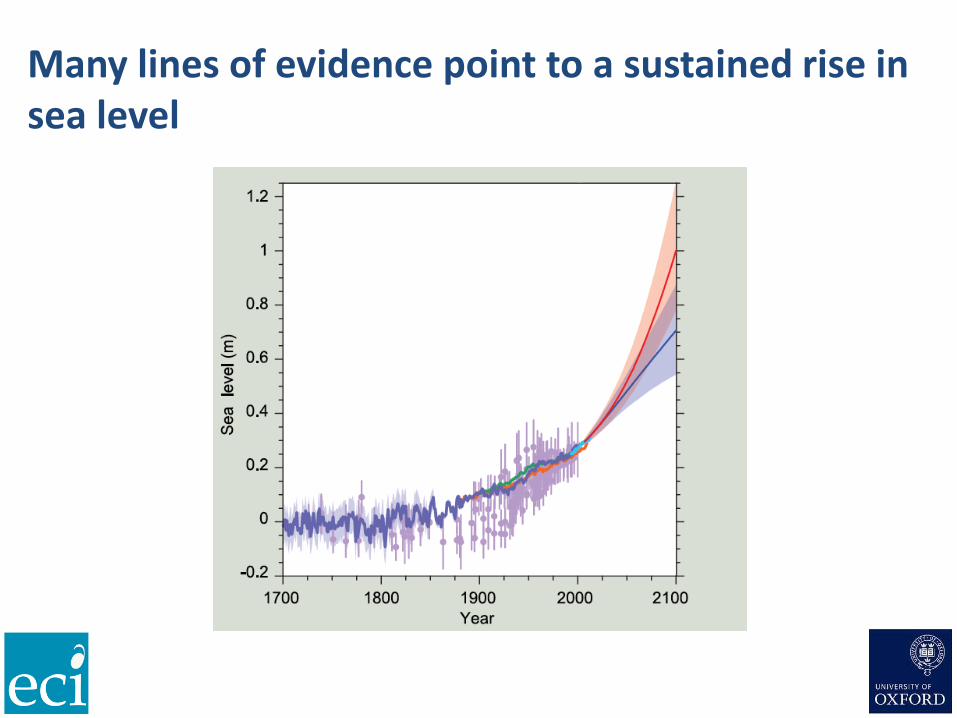
Many lines of evidence point to a sustained rise in sea level

Mountain glaciers are melting faster due to human-induced warming
• Worldwide retreat of mountain glaciers, likely exacerbated by human-induced warming since 1960s.
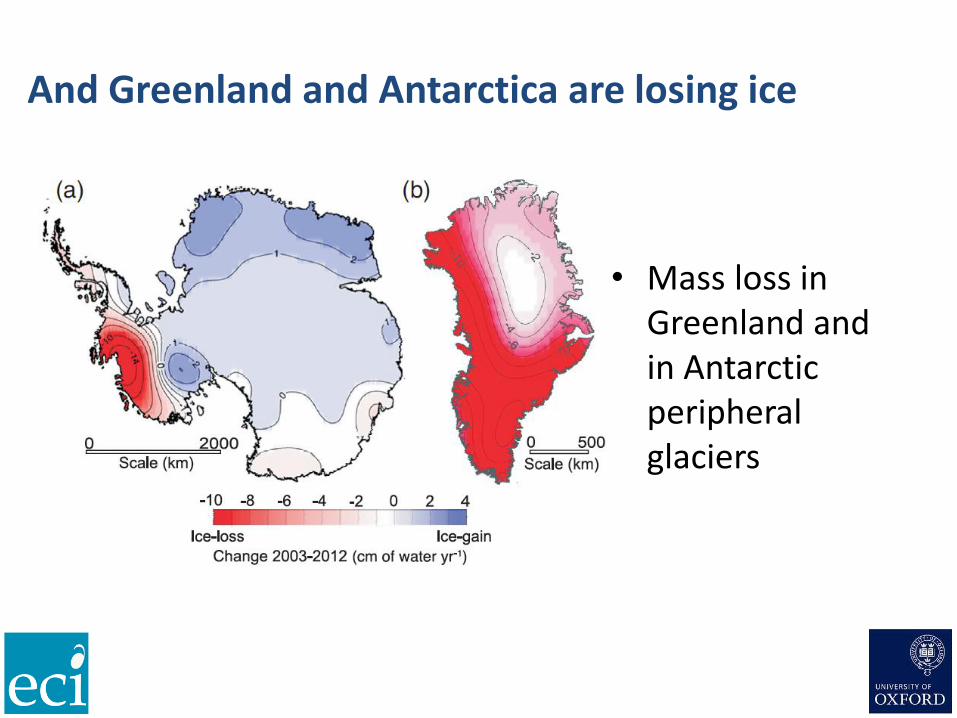
And Greenland and Antarctica are losing ice
• Mass loss in Greenland and in Antarctic peripheral glaciers

Most sea level change so far is due to thermal expansion and melting glaciers
Colored lines: observed sea level from different data sources
Grey lines: modeled sea level due to expansion and glaciers
Black solid: model average
Dotted: including contribution from ice sheets
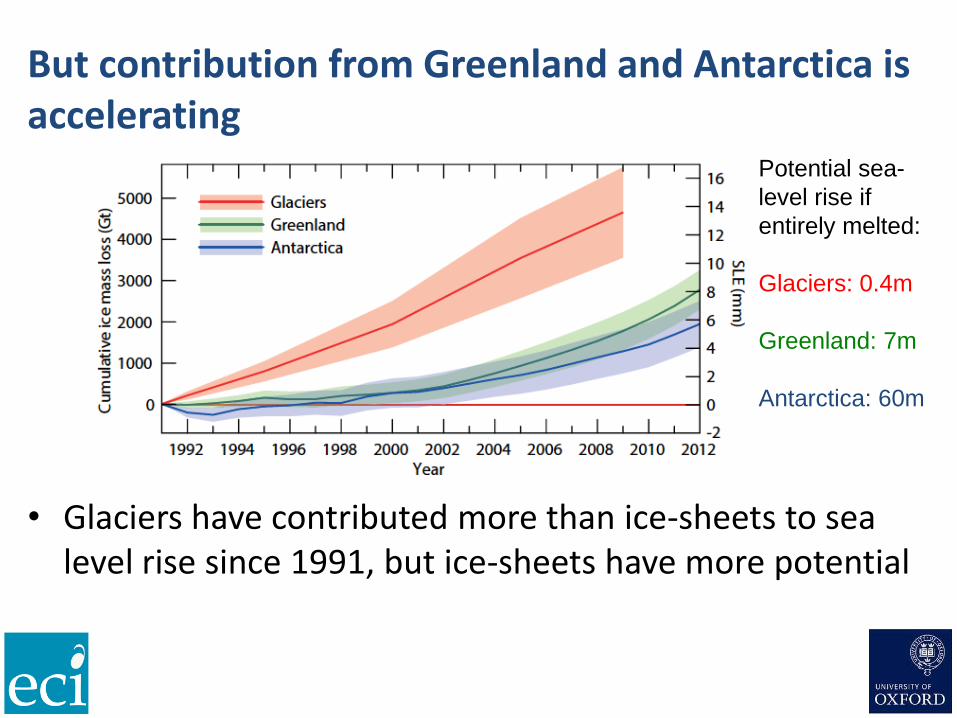
But contribution from Greenland and Antarctica is accelerating
• Glaciers have contributed more than ice-sheets to sea level rise since 1991, but ice-sheets have more potential
Potential sea-
level rise if
entirely melted:
Glaciers: 0.4m
Greenland: 7m
Antarctica: 60m
The impact of carbon dioxide emissions on global climate
• How rising atmospheric CO2 causes global warming
• How industrial emissions are increasing atmospheric CO2
• Modeling the impact of increasing CO2 concentrations
• Quantifying human and natural influences on global climate
– A digression on ice-ages
• How rising temperatures are affecting global sea level
• The permanent, cumulative impact of CO2 emissions
– Implications for the impact of delay in emission reductions

Permanent, cumulative impact of CO2 emissions on climate
• Roger Revelle, picked up by David Archer in the 2000s.
• Susan Solomon and others in 2009: net CO2 emissions need to be reduced to zero to stabilize temperatures, at any level.

CO2 emissions have a permanent, cumulative impact of on global temperatures
1950 2000 2050 2100 2150
0
20
40
60
80
100
Bill
ion
s o
f to
nne
s p
er
yea
r
Global CO2
emissions
Business-as-
usual
Zero from 2020
1950 2000 2050 2100 2150
300
350
400
450
500
550
600
Con
centr
ation
(pp
m)
Atmospheric CO2
concentration
1950 2000 2050 2100 2150
0.0
0.5
1.0
1.5
2.0
2.5
3.0
Glo
ba
l w
arm
ing
(oC
)
CO2-inducedwarming
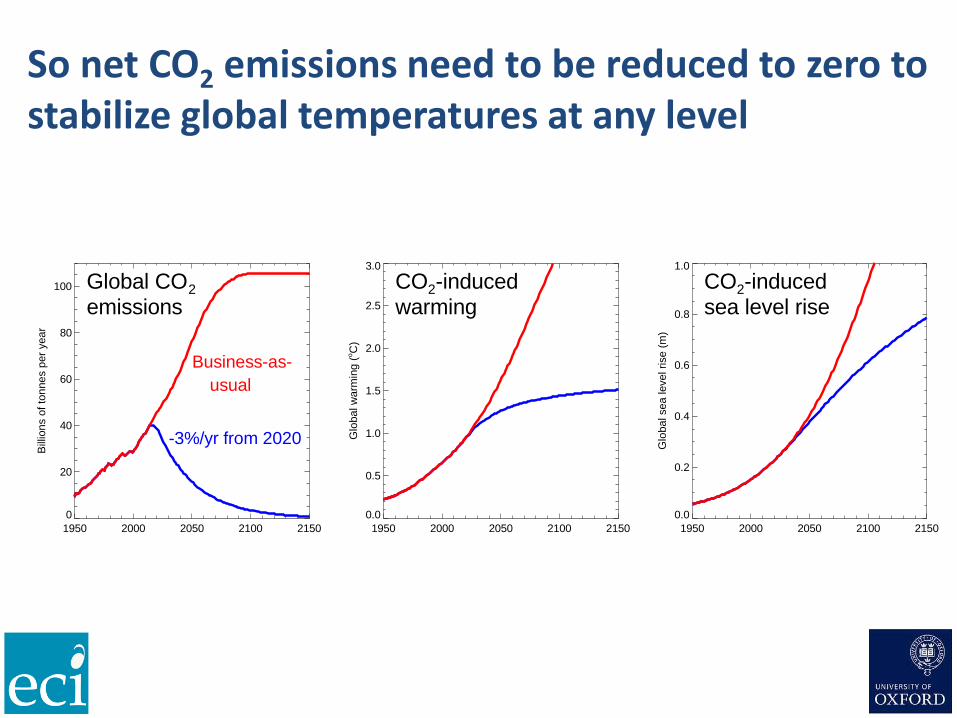
So net CO2 emissions need to be reduced to zero to stabilize global temperatures at any level
1950 2000 2050 2100 2150
0
20
40
60
80
100
Bill
ion
s o
f to
nne
s p
er
yea
r
Global CO2
emissions
Business-as-
usual
-3%/yr from 2020
1950 2000 2050 2100 2150
0.0
0.5
1.0
1.5
2.0
2.5
3.0
Glo
ba
l w
arm
ing
(oC
)
CO2-inducedwarming
1950 2000 2050 2100 2150
0.0
0.2
0.4
0.6
0.8
1.0
Glo
ba
l sea
leve
l rise (
m)
CO2-inducedsea level rise
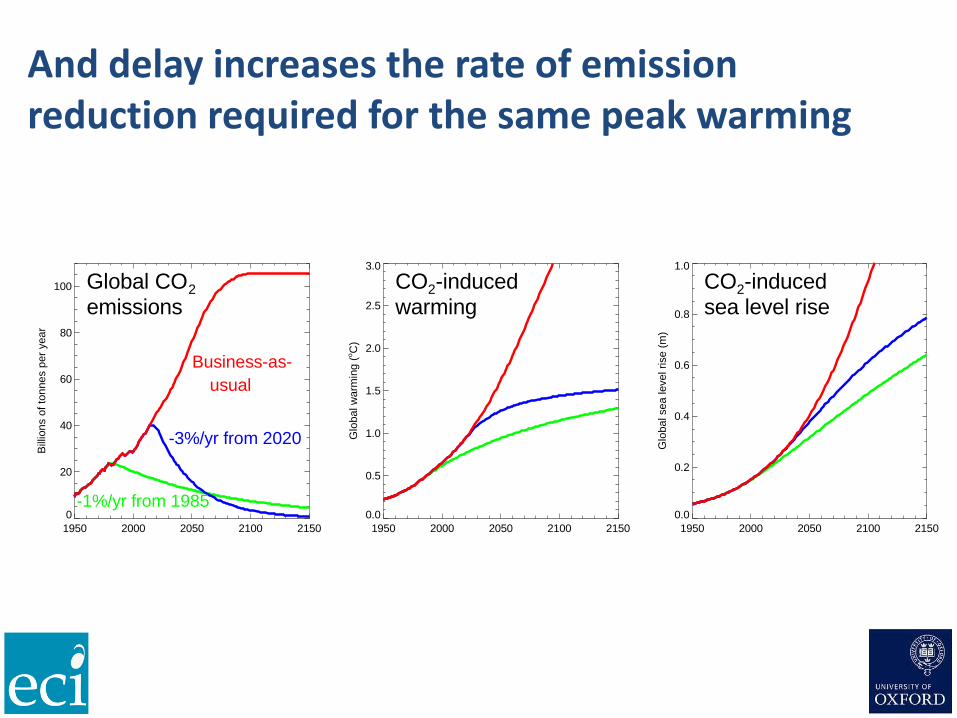
And delay increases the rate of emission reduction required for the same peak warming
1950 2000 2050 2100 2150
0
20
40
60
80
100
Bill
ion
s o
f to
nne
s p
er
yea
r
Global CO2
emissions
Business-as-
usual
-3%/yr from 2020
-1%/yr from 1985
1950 2000 2050 2100 2150
0.0
0.5
1.0
1.5
2.0
2.5
3.0
Glo
ba
l w
arm
ing
(oC
)
CO2-inducedwarming
1950 2000 2050 2100 2150
0.0
0.2
0.4
0.6
0.8
1.0
Glo
ba
l sea
leve
l rise (
m)
CO2-inducedsea level rise
Key points
• The essential physics linking CO2, global temperatures and global sea level have been known for over 100 years.
• The contribution of fossil fuel emissions to rising atmospheric CO2 largely understood since the 1960s.
• The expectation of a substantial warming due to increasing CO2 was established in the 1970s.
• Evidence for an observable human-induced warming emerged in the 1990s.
• The need for net zero CO2 emissions emerged post-2000.


![Human carbon dioxide emissions [ Mt C]](https://static.fdocuments.us/doc/165x107/56813d0c550346895da6bffd/human-carbon-dioxide-emissions-mt-c.jpg)