A REVIEW OF CARBON-DIOXIDE GAS EMISSIONS FROM …
17
Journal of Oil Palm and Palm Oil Research Vol. 1, No. 1, October 2020, p. 23-39 23 This is an open access article under the CC BY-NC license (https://creativecommons.org/licenses/by-nc/4.0/) Heru Bagus Pulunggono 1, 5 , Affan Cahyahusna 2 , Syaiful Anwar 1 , Basuki Sumawinata 1 , Darmono Taniwiryono 3 , Siswanto 3 , Happy Wiadiastuti 3 , Nizam Tambusai 4 , Husni Mubarok 4 , and Supiandi Sabiham 2 1 ) Department of Soil Science and Land Resource, IPB University, Bogor 16680 Indonesia 2 ) Graduate School of IPB University, Bogor 16680 Indonesia 3 ) Indonesian Research Institute for Biotechnology and Bioindustry, Bogor 16128 Indonesia 4 ) Practitioners for Oil Palm Development in Peatlands 5 ) Corresponding author: [email protected] ABSTRACT The C loss from peatlands through CO 2 flux was derived from autotrophic (root) respiration and peat decomposition (heterotrophic respiration). The CO 2 emitted into the atmosphere was determined as a net flux, showing the difference between CO 2 gas released from peat surface and CO 2 gas absorbed by oil palm trees and other crops. This paper aims to: (1) review the current reports concerning CO 2 (eq) flux or emission from oil palm plantations on drained peatlands, and (2) review the one-year research activities in relation to (i) contribution of peat decomposition to subsidence, and (ii) emission factor of peatlands drained for oil palm plantations. Based on review past reports, the emission of CO 2 from peatlands drained for oil palm plantations varied from 33-95 Mg ha -1 yr -1 . However, emission factor used for CPO evaluation as raw material of biodiesel was 95 Mg ha -1 yr -1 , for which the use of contribution of peat decomposition to subsidence was about 92%. One-year data observation from our research showed the contribution of peat decomposition of subsidence of about 43.2%. The net-flux was measured above the canopy and the result showed the average CO 2 flux was 19.0 Mg CO 2 ha -1 yr -1 as CO 2 emission. The flux from peat decomposition was measured at the farthest distance from the oil palm trees and the results showed the average peat CO-flux was 29.2 Mg CO 2 ha -1 yr -1 as peat CO 2 emissions. The contribution of peat decomposition to peat subsidence is 43.2%. From the results of those CO 2 flux measurement we suggest that emission factor for peatlands drained for an oil palm plantation varied from 20 to 30 Mg CO 2 ha -1 yr -1 . This means emission factor used for CPO evaluation was over-estimated. INTRODUCTION Background In Indonesia, peatlands currently cover about 13.43 million ha, most of which are situated in the east coast of Sumatra, west and south coasts of Kalimantan, and north and south coasts of Papua; smaller peatlands are found in West and Central Sulawesi (ICALRD 2019). More than 50% of peatlands in the country is claimed to be degraded lands due the development of drainage canals for agriculture, oil palm plantations, or industrial forest plantation A REVIEW OF CARBON-DIOXIDE GAS EMISSIONS FROM PEATLANDS TO DETERMINE THE EMISSIONS FACTOR FOR DRAINED PEATLANDS FOR OIL PALM PLANTATIONS IN INDONESIA
Transcript of A REVIEW OF CARBON-DIOXIDE GAS EMISSIONS FROM …

Journal of Oil Palm and Palm Oil Research Vol. 1, No. 1, October 2020, p. 23-39
23 This is an open access article under the CC BY-NC license (https://creativecommons.org/licenses/by-nc/4.0/)
Heru Bagus Pulunggono1, 5, Affan Cahyahusna2, Syaiful Anwar1, Basuki Sumawinata1,
Darmono Taniwiryono3, Siswanto3, Happy Wiadiastuti3, Nizam Tambusai4, Husni Mubarok4,
and Supiandi Sabiham2
1) Department of Soil Science and Land Resource, IPB University, Bogor 16680 Indonesia 2) Graduate School of IPB University, Bogor 16680 Indonesia
3) Indonesian Research Institute for Biotechnology and Bioindustry, Bogor 16128 Indonesia 4) Practitioners for Oil Palm Development in Peatlands
5) Corresponding author: [email protected]
ABSTRACT
The C loss from peatlands through CO2 flux was derived from autotrophic (root) respiration
and peat decomposition (heterotrophic respiration). The CO2 emitted into the atmosphere
was determined as a net flux, showing the difference between CO2 gas released from peat
surface and CO2 gas absorbed by oil palm trees and other crops. This paper aims to: (1)
review the current reports concerning CO2(eq) flux or emission from oil palm plantations on
drained peatlands, and (2) review the one-year research activities in relation to (i) contribution
of peat decomposition to subsidence, and (ii) emission factor of peatlands drained for oil palm
plantations. Based on review past reports, the emission of CO2 from peatlands drained for oil
palm plantations varied from 33-95 Mg ha-1 yr-1. However, emission factor used for CPO
evaluation as raw material of biodiesel was 95 Mg ha-1 yr-1, for which the use of contribution of
peat decomposition to subsidence was about 92%. One-year data observation from our
research showed the contribution of peat decomposition of subsidence of about 43.2%. The
net-flux was measured above the canopy and the result showed the average CO2 flux was
19.0 Mg CO2 ha-1 yr-1 as CO2 emission. The flux from peat decomposition was measured at
the farthest distance from the oil palm trees and the results showed the average peat CO-flux
was 29.2 Mg CO2 ha-1 yr-1 as peat CO2 emissions. The contribution of peat decomposition to
peat subsidence is 43.2%. From the results of those CO2 flux measurement we suggest that
emission factor for peatlands drained for an oil palm plantation varied from 20 to 30 Mg CO2
ha-1 yr-1. This means emission factor used for CPO evaluation was over-estimated.
INTRODUCTION
Background
In Indonesia, peatlands currently cover about 13.43 million ha, most of which are situated in
the east coast of Sumatra, west and south coasts of Kalimantan, and north and south coasts
of Papua; smaller peatlands are found in West and Central Sulawesi (ICALRD 2019). More
than 50% of peatlands in the country is claimed to be degraded lands due the development of
drainage canals for agriculture, oil palm plantations, or industrial forest plantation
A REVIEW OF CARBON-DIOXIDE GAS EMISSIONS FROM PEATLANDS TO DETERMINE THE EMISSIONS FACTOR FOR DRAINED PEATLANDS FOR
OIL PALM PLANTATIONS IN INDONESIA

Journal of Oil Palm and Palm Oil Research Vol. 1, No. 1, October 2020, p. 23-39
http://joppor.cpopc.org/index.php/joppor 24
(HTI, Hutan Tanaman Industri). Because of the presence of seasonal variation throughout the
year (Wakhid et al. 2017; Marwanto et al. 2018), drainage canals have disturbed peat
materials causing changes in biological, physical and chemical properties of peat, and
lowered groundwater levels (GWL) particularly during the dry season. These conditions were
then claimed to be the cause of large CO2 emissions (Furukawa et al. 2005; Couwenberg et
al. 2010). However, Marwanto et al. (2019) showed that the peat layers above GWL or even
at 0-20 cm depth had high water content due to the presence of capillary action which were
able to reduce CO2 emission.
The change of land cover in peatlands from peatswamp forest to plantation crops, in
particular oil palm plantations went through long-term processes which have been reported
by Pagiola (2000); Holmes (2000); Tjondronegoro (2004); Agus et al. (2011); and Rehman et
al. (2015). The processes were started by spontaneous migration that occurred in coastal
areas in Sumatra and Kalimantan in the 1920s and the governmental transmigration project
in 1969, followed by the presence of systematic logging through the scheme of the so called
Forest Concession Right (HPH, Hak Pengusahaan Hutan) in the 1970s. Those activities
caused the loss of natural forests which reached its peak during the years1985 to 1997, and
resulted in rapidly developing vast degraded lands. The expansion of oil palm plantations into
the degraded peatlands was started in 1990.
Environmental issues of CO2 emission from peatlands in oil palm plantations have affected
the global crude-palm-oil (CPO) trade. The standard for CO2(eq) emissions reduction from
palm oil-based biodiesel released by the Environmental Protection Agency, The United
States of America (US-EPA) in 2012, had to be more than 20% compared to the petroleum
diesel baseline. Based on the US-EPA’s calculation, however, the lifecycle of CO2(eq)
emissions from tropical peatlands associated with the palm oil-based biodiesel had reduced
the emissions to only 17%. Therefore, to verify this calculation, reviewing past studies in
more detail and analyzing the data from our research results of CO2 flux from peatlands in oil
palm plantations using chamber, subsidence and Eddy covariance methods had to be done.
Objectives of the paper
The objectives of this paper are mainly to:
1) Review the current reports concerning CO2(eq) flux or emission from oil palm plantations on drained peatlands, and
2) Review the one-year research activities in relation to (i) contribution of peat decomposition to subsidence, and (ii) emission factor of peatlands drained for oil palm plantations.
Approach
This paper presents the results of a comprehensive review of several literatures in relation to
CO2 flux or emission from oil palm plantations on peatlands in Indonesia. In order to clarify
the land use conversion of peatswamp forest to oil palm plantations, we describe the history
of land use changes in Indonesia which is claimed to be the cause of decreasing peat quality
and increasing CO2 flux/emission. The results of the reviewed literatures of CO2 emission

Journal of Oil Palm and Palm Oil Research Vol. 1, No. 1, October 2020, p. 23-39
http://joppor.cpopc.org/index.php/joppor 25
were then assessed by our one-year research activities using the methods of chamber,
subsidence, and Eddy Covariance for quantifying the CO2 flux/emission from peatlands in an
oil palm plantation. Analyses of such methods based on data availability as the results of
real-time observation during the period from April 2019 to March 2020.
Peatlands and Peatswamp Forest Conversion
Peatlands in Indonesia were formerly covered by dense forests (Sabiham, 1988) that were
mainly dominated by large trees of many species growing in swampy conditions. Therefore,
peat materials which were found in the islands of Sumatra, Kalimantan, Sulawesi, and Papua
(Figure 1) were similar, very rich in wood having more or less decomposed trunks and
branches (Polak 1975). Peat
accumulation processes developed
during the Holocene period according to
the results of 14C-dating (Sabiham 1988;
Biagioni et al. 2015). These processes
yielded a unique ecosystem with highly
variable places in different
environments (Schrier-Uijl et al. 2013)
with a peat thickness of up to more than
7 m.
Figure 2 shows a model of the integrated
stratigraphic layer of peat deposits in relation
to peat ecosystem formation (Sabiham, 1988).
Thick deposits of peat have accumulated as a
consequence of low topographic relief, high
biomass production, and high rainfall (Page et
al. 2010; Dommain et al. 2011).
The occurrence of peat accumulation is due to
waterlogged conditions and, therefore, the
deposited peats are naturally in an anaerobic
condition, with various thick peat deposits and
storing very high C content (Page et al. 2011;
Biagioni et al. 2015). The accumulation rate of peat materials in the sub layer was faster
compared to that in upper layer (Sabiham 1988). Carbon storage has a global importance,
particularly in relation to CO2 gas emitted into the atmosphere.

Journal of Oil Palm and Palm Oil Research Vol. 1, No. 1, October 2020, p. 23-39
http://joppor.cpopc.org/index.php/joppor 26
Peatlands covered by forests are important climatic mitigating areas as water sources,
particularly during the dry season or the occurrence of El Nino (Yule 2016). However, since
the final part of the 1960s, a majority of the Indonesian peatlands and peatswamp forests
were claimed by some environmentalists to be degraded areas due to the rapid land-use
changes, particularly into oil palm plantations, where many drainage canals were developed
and caused the emission of the formerly stored C (Pagiola 2000). Based on the results of
our review of several published-papers (Table 1), we had a difficulty to understand that forest
degradation was due to the rapid changes in oil palm plantation; in fact, primary peatswamp
forests were overall not directly converted into oil palm plantations.

Journal of Oil Palm and Palm Oil Research Vol. 1, No. 1, October 2020, p. 23-39
http://joppor.cpopc.org/index.php/joppor 27
The expansion of oil palm plantations into primary and secondary/ degraded peatswamp
forests in Sumatra, Kalimantan and Papua during the period 1990 to 2010 (Table 2) was in
total only 6% and 28%, respectively (Agus et al. 2011; Gunarso et al. 2013).
While its expansion into shrubs and agricultural lands was, respectively, about 26 and 40%.
Rehman et al. (2015) reported that the exploitation of peatswamp forests for oil palm
plantations in Riau and West Kalimantan was indirect and that the forest was not only
converted to oil palm plantations, but also to the other land uses. Based on an analysis of all
regions and temporal periods in both the Provinces of Riau and West Kalimantan, only 0.94%
of oil palm plantations were created on peatlands derived from primary peatswamp forests,
and about 21.55% from secondary peatswamp forest.
Important Factors Influencing CO2 Emission in Drained Peatlands
Empirical studies showed that the main factors which strongly influenced CO2 emission from
drained peatlands consisted of: (i) physical properties of peat such as bulk density, peat
porosity and ripeness, and (ii) groundwater level (GWL) movement (Husen et al. 2014;
Marwanto et al. 2018). Field evidence indicated that GWL fluctuation has a close relationship
with rainfall throughout the year (Wakhid et al. 2017).

Journal of Oil Palm and Palm Oil Research Vol. 1, No. 1, October 2020, p. 23-39
http://joppor.cpopc.org/index.php/joppor 28
Physical properties of peat
Bulk density (BD) of the upper-layer peat (at 0-30 cm depth) in oil palm plantations mostly
varied between 0.07 to 0.25 g cm-3 (Agus and Wahdini 2008; Hooijer et al. 2011, 2012). We
summarized that the value of peat BD measured at the beginning of the drainage canal
construction ranged from 0.07 to 0.10 g cm-3. Whereas after the drained peatlands were
used for oil palm cultivation, the peat BD increased to 0.14 and 0.25 g cm-3 depending on its
cultivation age. The change of this peat BD was the cause of peat consolidation due to water
loss through drainage systems, or compaction caused by human activities during oil palm
cultivation (Hooijer et al. 2011). This change has resulted in the increase of micro
peat-porosity and peat ripeness (Anwar 2001), causing the increase of peat moisture content
and the decrease of the emitted CO2 gas from the peat surface (Marwanto et al. 2019).
Water table/GWL movement
The high GWL occurred during the wet season and the low level during the dry season,
following a seasonal variation in precipitation (Wakhid et al. 2017). In our study, monitoring
GWL was carried out at a real time of every 60 minutes using HOBO Water Level (13 ft) Data
Logger. We also placed dip-wells at several selected locations of the planting blocks to
measure the GWL manually. Weekly measurements were taken.
Based on the results of our monitoring
during the period April 2019 to March 2020
(Figure 3), the GWL movement showed that
in the dry season (April to July 2019) the
water table generally dropped to more than
60 cm below the peatland surface, and in
August 2019, during extremely dry
conditions, it decreased to more than 80 cm.
In the wet season (September 2019 to
January 2020), however, the water table
increased to 30 cm, and sometimes to
about 20 cm, below the peatland surface.
There was a negative correlation between
GWL and peat water content (Table 3), and
this indicated that despite the lower GWL,
the peat water content at the depth of 0-20 cm was still high, meaning that peat was still
moist.

Journal of Oil Palm and Palm Oil Research Vol. 1, No. 1, October 2020, p. 23-39
http://joppor.cpopc.org/index.php/joppor 29
Review of past report on Carbon Dioxide Emission from Drained Peatlands in Oil Palm
Plantations
Several researchers reported that CO2 emissions from drained peatlands in oil palm
plantations ranged from 33 to 85 Mg CO2 ha-1 yr-1 (Table 4), with a mean of about 45 Mg. CO2
ha-1 yr-1. These CO2-emission values were obtained from the measurement based on
chamber and subsidence methods. Page et al. (2011) have calculated the annualized value
for peat C loss from oil palm plantation over a 30-year time period as a mean high emission
rate from drained peatlands for 25 to 50 years of plantation cycles, from which the result of
calculation was 95 Mg CO2 ha-1 yr-1. This was emission-factor for the peatlands drained for
oil palm plantations.
However, we considered that this proposed emission-factor was over-estimated and not
realistic because it was calculated by using a high value of the contribution of peat
decomposition to subsidence, i.e. 92%. Couwenberg et al. (2010) and Wosten et al. (1997)
proposed that the contribution of peat decomposition to subsidence was at 40 and 60%,
respectively; the other factors
which would influence subsidence were consolidation and compaction. A part of CO2 flux
from peat surface is derived from root respiration. The contribution of root respiration to the
flux from peatlands covered by <6-year and 15-year oil palm trees was calculated about 17%
(Dariah et al. 2013) and 74% (Sabiham et al. 2014), respectively. Lowering GWL increased
CO2 flux (Furukawa et al. 2005; Hirano et al. 2015) which was mostly caused by increasing
root respiration rather than by peat decomposition. Calculating the emission factor for
peatlands drained for oil palm cultivation, as showed by CO2 flux, is still a challenge.
Journal of Oil Palm and Palm Oil Research Vol. 1, No. 1, October 2020, p. 23-39
http://joppor.cpopc.org/index.php/joppor 30
In 2014, IPCC calculated the emission factor for organic soils based on data from many
published-papers; and the emission factor was suggested to be 40 Mg CO2 ha-1 yr-1 (Table 3).
However, direct measurements of CO2 flux based on specific locations and different methods
are important to be clarified. Annualized emission-value was used and reported in 2012 by
US-EPA as he proposed
Emission Factors for Peatlands Drained for Oil Palm Plantation:
A Review Based on CO2-flux Measurement
Three methodologies are usually used for the measurement of CO2 flux from peatlands,
namely: closed chamber, subsidence and Eddy covariance methods. The closed chamber
method is the direct measurement of C emission from peatland surface using the
conventional chamber method which is still used by many scientists (Table 4).
However, this method seems to have limitations due to the short-term measurement and the
mixture of autotrophic and heterotrophic respirations. In this study, the automated soil gas
flux system (LiCor-8100A) was used for measuring peat CO2-gas flux at the real time every
30 minutes. The strength of the subsidence method to determine the emission factor is the
fact that it has no root respiration confusion. However, this method needs other supporting
data, such as: peat BD and C content (Hooijer et al. 2011, 2012). Other information that is
most important for supporting this method is the relative contribution value of peat
decomposition to subsidence.
The last is the Eddy covariance method, that has recently been used by many researchers for
the measurement of CO2 flux in an ambient above the canopy. In this study, we used the
LiCor-7500 open path CO2/H2O gas analyzer, and measurement was conducted at the real
time of every 30 minutes. Although this instrument has high accuracy for measuring the
densities of CO2 and H2O vapor in turbulent air structures (Burba 2013), this method needs
several sophisticated tools which are very expensive. Thus, the method is mostly used for
scientific development. GWL, subsidence, and some peat physical properties were monitored
by several instruments in order to support the method of Eddy covariance.
In this review, the used data were collected from April 2019 until March 2020 observation.
The observation was conducted in an oil palm plantation in Siak Riau, at the coordinate of 0º
44’ 55.99” N and 101º 45” 14.04’ E; Lat. 0.74896 N and Long 101.75396 E, where the age of
the oil palms varied from 12 to 15 years. The review has three main objectives; first, to
analyze environmental factors which influence the flux; second, to determine the contribution
of peat decomposition to subsidence and third, to ascertain the emission factor for
peatlands drained for oil palm plantations based on CO2 flux measurement.

Journal of Oil Palm and Palm Oil Research Vol. 1, No. 1, October 2020, p. 23-39
http://joppor.cpopc.org/index.php/joppor 31
The influence of some important environmental factors on CO2 flux
The important environmental factors influencing the CO2 flux from peatland surface are
physical properties of peat, rainfall or precipitation, peat water content, and peat temperature
(Furukawa et al. 2005; Wakhid et al 2017). Analyses of the physical properties of peat are
focused on peat BD and available water content using the method developed by the
Department of Soil Science and Land Resource, IPB University.
Rainfall or precipitation, peat water content, and peat temperature were measured at the real
time of every 30 minutes by using the respective related-instruments as the accessories of
Eddy covariance. The measurement of rainfall was monitored using the rain gauge
(TR-525USW Texas Electronic). Peat water content data was collected by using Stevens
Hydra Probe II-A (Soil Moisture Probe), while peat temperature monitoring was conducted
using Soil Temperature Sensor of LiCor-7900-1. The collected data using the respective
Journal of Oil Palm and Palm Oil Research Vol. 1, No. 1, October 2020, p. 23-39
http://joppor.cpopc.org/index.php/joppor 32
instruments, including soil temperature, were then downloaded and transferred into the Excel
Program, and then calculated using the Software Soilflux-Pro (Burba 2013).
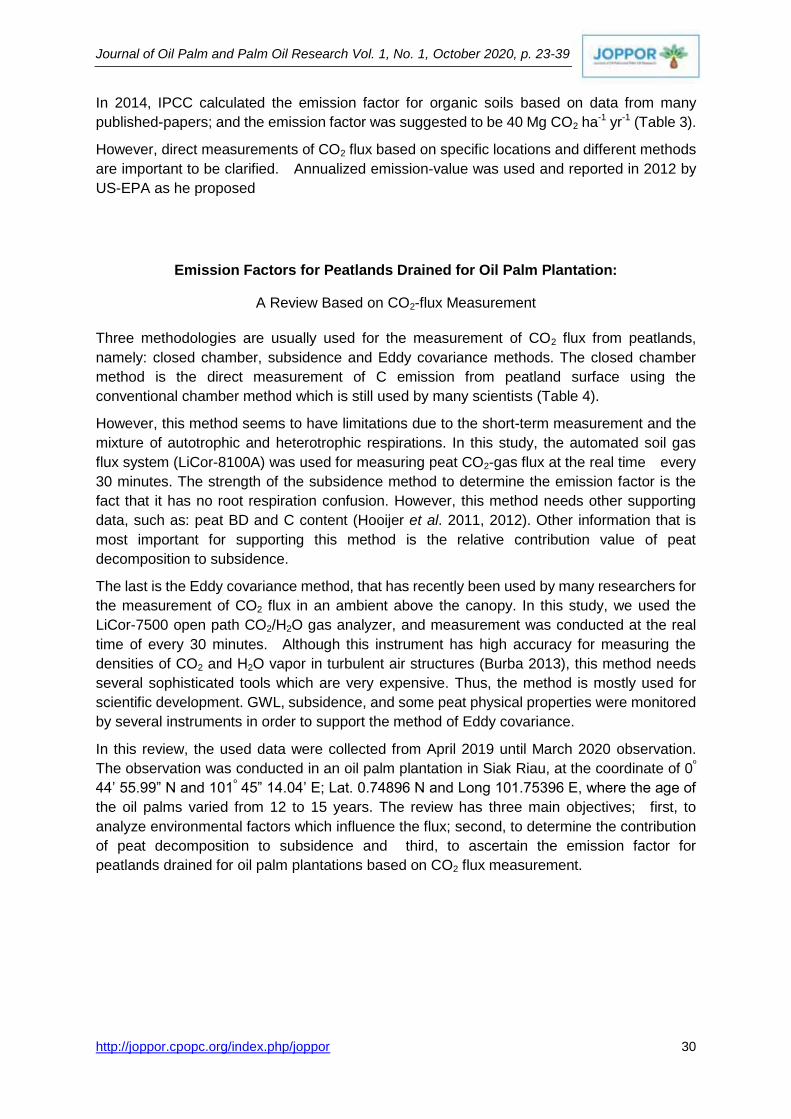
Environmental factors that strongly influence CO2 flux in ambient above canopy are air
temperature and evapotranspiration (ETP). Air temperature monitoring was carried out by
using the 14-Plate Radiation Shield RM Young, an instrument of Humidity and Temperature
Sensor, as one of the Biomet System Packages consisting of four components of radiation
measurement and self-calibrating heat flux measurement for tower application. Monitoring
of ETP is based on the H2O gas measurement results using Li-Cor 7500 CO2/H2O Analyzer.
The collected data were analyzed using Software Eddy-Pro.
The results of analyses of BD, peat water content at pF 2.54 and 4.2, available water content,
peat water content at the layer of 0-20 cm, rainfall, and ETP are shown in Table 5.
This table shows that the average peat BD at 0-20 cm depth is 0.134 ± 0.023 g cm-3, and it
then decreased with increasing peat depth. Peat BD in the dry season was relatively lower
than that in wet and transition seasons. The average daily rainfall was 4.14 mm.
Based on water contents at pF 2.54 and 4.2, the average available water in peat at the depth
of 0-20 cm could be calculated and the result showed the value of 3.2 ± 1.6% (v/v). According
to peat-water content at the layer of 0-20 cm (Table 5), peat above GWL would be in wet
conditions although GWL was sometimes lowered to 100 cm below the peat surface. By
calculation with peat BD of 0.134 g cm-3, the relative water content by weight is about 292.5%
(w/w). So, the water content in one hectare (at 0-20 cm peat depth) was calculated to be
about 585.0 Mg water ha-1 or about 58.5 mm.
Based on the calculation results of ETP (Table 5), the total water in peat that is needed for
supporting daily crop transpiration and daily peat evaporation from the depth of 0-20 cm was
about 3.66 ± 0.75 mm day-1. Because the average total-water content in peat at the same
depth is 39.2% (v/v) and its availability is 3.2% (v/v), so the total available water that could be

Journal of Oil Palm and Palm Oil Research Vol. 1, No. 1, October 2020, p. 23-39
http://joppor.cpopc.org/index.php/joppor 33
used to support daily evaporation and transpiration is (3.2/39.2 x 58.5) mm or 4.78 mm day-1.
The total available water in peat is the sum of daily rainfall and available water, which is (4.78
+ 4.14) mm or 8.92 mm day-1. By comparing this against daily ETP (of about 3.66 mm day-1),
there is a surplus of water content in the 0-20 cm peat layer of about 5.26 mm day-1. This
means that peat layers above GWL could be considered as peat in a moist condition
throughout the year. Marwanto et al. (2019) reported that the moist peat in the top layer is
able to significantly decrease the released CO2 flux from the sub layers.
Contribution of peat decomposition to subsidence in relation to CO2 flux
Studying the relationship between CO2 flux and peat decomposition as one of the sources of
flux was not easy to implement in the field due to some difficulties in handling the flux
observation without the effect of root respiration. In order to solve such a problem, we
followed the research approach of Sabiham et al. (2014) and Dariah et al. (2013) with some
modification. Each of the four automated soil-gas-flux (automatic chambers of LiCor-8100A)
was placed at the selected oil palm tree as observation points (Figure 4), where the distance
from the center of the tree trunk to each automated chamber was 1.5, 2.5, 3.5, and 4.5 m.
Oil palm roots, as one of the sources of CO2 flux, was observed in detail by Sabiham et al.
(2014). They found that, in the top layer, of the four root sizes with diameters <0.5; 0.5-2.5;
2-5-5.0; >0.5 mm, only the root density of the first two sizes had significant negative
correlation with the distance of the
observation points. This indicated the
presence of a gradual decrease in the root
densities with increasing distance. Both
oil-palm root densities at 4.5 m from the tree
trunk were nearly zero, meaning that no
flux occurred from root respiration, and thus,
flux was only released by peat
decomposition. Harianti et al. (2017)
reported similar results which showed that
the total active oil-palm’s roots at the upper
layer of peat were decreased with increasing
distance from the oil palm tree.
The subsidence of peatlands in the study
area was measured at the 3-selected planting blocks having oil palm trees with the respective
ages of <10, 10-15, and >15 years. The measurement was conducted using an iron pipe
stick with a diameter of two inches. At each block, two subsidence sticks, with an iron ring
as a reference point of the peat surface when the measurement started, were driven into the
peat vertically until a 1.0 m-depth in the mineral soil substratum. The results (Table 6)
indicated that the lowest peat flux of 0.08 ± 0.06 Mg CO2 ha-1 day-1 was found at the
observation point farthest from the oil palm tree. The flux then sharply increased closer to the
observation point nearest to the oil palm tree, reaching the highest flux of 0.23 ± 0.13 Mg ha-1
day-1 or 84 Mg CO2 ha-1 yr-1.
During the wet season, the peat CO2 flux of 0.15 ± 0.09 Mg CO2 ha-1 day-1 was lower than that
in dry season that was shown by the value of 0.21 ± 0.08 Mg CO2 ha-1 day-1. This clearly

Journal of Oil Palm and Palm Oil Research Vol. 1, No. 1, October 2020, p. 23-39
http://joppor.cpopc.org/index.php/joppor 34
indicated that with the increasing peat water content due to relatively high rainfall and high
GWL, the peat CO2 flux would significantly decrease, and this was substantiated by Pearson’s
correlation test shown in Table 3.
The average peat CO2-flux from all observations was 0.17 ± 0.09 Mg CO2 ha-1 day-1 or 62.1
Mg CO2 ha-1 yr-1. In accordance with Sabiham et al. (2014) and Harianti et al. (2017) who
reported that no active roots could be found at the distance farthest from oil palm tree, in this
study there were no active roots at the distance of 4.5 m from the oil palm tree. Therefore, the
lowest CO2 flux of 0.08 ± 0.06 Mg CO2 ha-1 day-1, occurring at the observation point farthest
from the oil palm tree, could be considered as the flux derived from peat decomposition.
Based on the results of subsidence measurement (Table 6), the lowest rate of subsidence
(1.65 cm yr-1) occurred at the planting block covered by oil palm trees <10-years old. The rate
increased with the increasing age of the oil palm tree. The highest rate (3.19 cm yr-1) was
found in the planting block with oil palm trees aged more than15-years old. The average
subsidence rate from all measurements during a one year period was 2.47 cm yr-1.
Following the analysis results of the subsidence rate and the CO2 flux measured from the
observation point farthest from the oil palm tree, the contribution of peat decomposition (CPD)
to the subsidence could then be calculated by using the following equation:
CPD = (A)/(P) x 100%
where
(A) Actual CO2 flux (Mg CO2 ha-1
yr-1
) is the flux measured by using the automated soil gas flux system (LiCor-8100A) at the farthest point from the oil palm tree.
(P) Potential CO2 flux (Mg CO2 ha-1
yr-1
) is the flux resulting from the calculation of the subsidence
rate per year (dm) x 1,000,000 dm2 x BD (kg dm
-3) x C-organic (%) x 44/12

Journal of Oil Palm and Palm Oil Research Vol. 1, No. 1, October 2020, p. 23-39
http://joppor.cpopc.org/index.php/joppor 35
The actual CO2 flux derived from peat decomposition was 0.08 Mg CO2 ha1 day-1 or about
29.2 Mg CO2 ha-1 yr-1. Whereas the potential CO2 flux that could be obtained depended on
the value of the subsidence rate, peat BD, and C-organic content, was determined by using
the following calculation: 0.247 dm x 1,000,000 dm2 x 0.134 kg dm-3 x 55.64/100 x 44/12 =
67,52 Mg CO2 ha-1 yr-1.
Therefore, the contribution of peat decomposition to the 2.47-cm subsidence of peat surface
per year is:
(29.2 / 67.52) x 100% = 43.2%
Emission factors for peatlands drained for oil palm plantations
There are two CO2 fluxes that must be carefully considered: (i) CO2 fluxes released from the
peat surface as the total fluxes derived from root respiration and peat decomposition, and (ii)
net CO2 flux in the ambient above canopy (Burba 2013). The net flux can be defined as the
flux resulting after the total flux from the peat surface was reduced by CO2 sequestration.
Therefore, the total CO2 flux from the peat surface should not be used as an emission factor.
The results shown in Table 6 indicate that the average net CO2 flux during the dry season
(0.044 ± 0.077 Mg CO2 ha-1 day-1) was lower than that in the wet season (0.059 ± 0.066 Mg
CO2 ha-1 day-1). This indicates the present high absorption of CO2 occurred during the dry
season. In relation to the daily net flux, Figure 5 shows that the average flux in the day time
(09:00 to 17:00) was lower than that in the night. This means that there is an occurrence of
CO2 sequestration through photosynthesis.
From the one-year observation, the average net CO2 flux was 0.052 ± 0.074 Mg CO2 ha-1
day-1, while the average CO2 flux from the peat surface was 0.17 ± 0.09 Mg CO2 ha-1 day-1. In
this micro scale of the environment, the sequestration of CO2 by oil palm trees and understory
cover crops can be calculated simply, of which the result is about 0.118 Mg CO2 ha-1 day-1.
Fig 5. Measurement of net CO2-flux above canopy using LiCor-7500 CO2/H2O gas
analyser that installed to the tower having the height of 19 m

Journal of Oil Palm and Palm Oil Research Vol. 1, No. 1, October 2020, p. 23-39
http://joppor.cpopc.org/index.php/joppor 36
The average CO2 flux derived from respiration, calculated from each observation point at the
respective distance of 1.5, 2.5, and 3.5 m from the oil palm tree, was 0.12 Mg CO2 ha-1 day-1.
These results indicate that the total CO2 flux from respiration was overall sequestrated.
Therefore, in order to determine the emission factor for peatlands drained for oil palm
plantations, it might be more feasible to consider:
1) Net CO2 flux for a micro scale of peatland environment in oil palm plantations, having a value of 0.052 Mg CO2 ha-1 day-1, or about 19.0 Mg CO2 ha-1 yr-1 as net CO2 emission.
2) CO2 flux from peat decomposition, having the value of 0.08 Mg CO2 ha-1 day-1, or about 29.2 Mg CO2 ha-1 yr-1 as the CO2 emission of peat.
Based on this consideration, we propose that the emission factor for peatlands drained for oil
palm plantations to be in the range of 20 to 30 Mg CO2 ha-1 yr-1.
CONCLUSION
The main factors which strongly influence the CO2 emission from drained peatlands are peat
water content and water table movement which are closely related to rainfall throughout the
year. Having surplus water content, the peat layers above GWL, the top peat layers in
particular, are always in a moist condition. The emission of CO2 from the peat surface is
mainly derived from root respiration and peat decomposition. The contribution of peat
decomposition to peat subsidence is 43.2%. Peat CO2 emission from root respiration is about
43.8 Mg CO2 ha-1 yr-1, which is equal to the sequestrated CO2 of about 43.1 Mg CO2 ha-1 yr-1.
This indicates that all emission from root respiration is absorbed by the oil palm trees and
other crops grown in the plantation. Thus, it is not feasible to use the total emission from the
peat surface to determine the emission factor.
CO2 emissions measured above the canopy and from peat decomposition are the best to be
used as emission factors for peatlands drained for oil palm plantations, which range from 20
to 30 Mg CO2 ha-1 yr-1.
ACKNOWLEDGEMENT
We thank the Board of Directors of BPDP-KS for the financial support which made our
research possible. We do believe that the research would not have been successful without
the help of friends and colleagues in the Soil Laboratory of the Department of Soil Science
and Land Resource, IPB University who did all or part of the research activities.
REFERENCES
Agus F, Wahdini W. 2008. Assessment of carbon stock of peatland at Tripa, Nagan Raya
District, Nanggroe Aceh Darusssalam Province of Indonesia. Indonesian Centre for
Agricultural land Resources Research and Development and World Agroforestry Centre
(ICRAF). Bogor, Indonesia
Agus F, Hairiah K, Mulyani A. 2011. Pengukuran Cadangan Karbon Tanah Gambut. Petunjuk
Praktis. Bogor (ID): World Agroforestry Centre-ICRAF, SEA Regional Office dan Balai
Besar Penelitian dan Pengembangan Sumberdaya Lahan Pertanian (BBSDLP). p.58

Journal of Oil Palm and Palm Oil Research Vol. 1, No. 1, October 2020, p. 23-39
http://joppor.cpopc.org/index.php/joppor 37
Anwar S, Kosaki T, Yonebayashi K. 2001. Impregnation of peat soil using polyethylene glycol
4000 for the preparation of thin sections. Soil. Sci. Plant. Nutr. 47(1): 79-86.
https://doi.org/10.1080/00380768.2001.10408370
Biagioni S, Krashevska K, Achnopha Y, Saad A, Sabiham S, Behling H. 2005. 8000 years of
vegetation dynamics and environmental changes of a unique inland peat ecosystem of
the Jambi Province in Central Sumatra, Indonesia. Palaeogeogr. Palaeocl.
440:813-829.https://doi.org/10.1016/j.palaeo.2015.09.048
Burba G. 2013. Eddy Covariance Method for Scientific, Industrial, Agricultural, and
Regulatory Applications: A Field Book on Measuring Ecosystem Gas Exchange and
Areal Emission Rates. Nebraska (US): LI-COR Biosciences. pp.331
Couwenberg J, Dommain R, Joosten H. 2010. Greenhouse gas fluxes from tropical peatlands
in South-East Asia. Glob. Change. Biol. 16. 1715 - 1732.
https://doi.org/10.1111/j.1365-2486.2009.02016.x
Dariah A, Marwanto S, Agus F. 2013. Root-and-peat-based CO2 emission from oil palm
plantation. Mitig. Adapt. Strateg. Glob. Change.
https://doi.org/10.1007/s11027-013-9515-6
Dommain R, Couwenberg J, Joosten H. 2011. Development and carbon sequestration of
tropical peat domes in south-east Asia: Links to post-glacial sea-level changes and
Holocene climate variability. Quaternary Sci Rev. 7- 8 (30): 999-1010.
https://doi.org/10.1016/j.quascirev.2011.01.018
Fargione J, Hill J, Tilman D, Polasky S, Hawthorne P. 2008. Land clearing and the biofuel
carbon debt. Science. 319: 1235-1238. https://doi.org/10.1126/science.1152747
Furukawa Y, Inubushi K, Ali M, Itang AM, Tsuruta H. 2005. Effect of changing groundwater
levels caused by land-use change on greenhouse gas fluxes from tropical peat lands.
Nutr. Cycl. Agroecosyst. 71: 81-91. https://doi.org/10.1007/s10705-004-5286-5
Gunarso P, Hartoyo ME, Nugroho Y. 2013. Analysis of land-cover changes to oil palm in
Indonesia. Jakarta (ID): Universitas Negeri Jakarta
Harianti M, Sutandi A, Saraswati R, Maswar, Sabiham S. 2017. Organic acids exudates and
enzyme activities in the rhizosphere based on distance from the trunk of oil palm in
peatland. Malays. J. Soil. Sci. 21: 73- 88. ISSN: 1394-7990
Hirano T, Kusin K, Limin S, Osaki M. 2015. Evapotranspiration of tropical peat forest. Glob.
Chang. Biol. 21:1914-1927. https://doi.org/10.1111/gcb.12653
Holmes D. 2000. Deforestation in Indonesia: A review of the Situation in Sumatra, Kalimantan,
and Sulawesi. Jakarta (ID): World Bank
Hooijer A, Page SE, Jauhiainen J, Lee WA, Lu XX, Idris A, Anshari G. 2012. Subsidence and
carbon loss in drained tropical peatlands. Biogeosciences. 9:1053-1071.
https://doi.org/10.5194/bg-9-1053-2012
Hooijer A, Page SE, Jauhiainen J, Lee WA, Lu XX, Idris A, Anshari G. 2011. Subsidence and
carbon loss in drained tropical peatland: reducing uncertainty and implications for
emission reduction options. Biogeosciences Discuss. 8:9311-9356.
Husen E, Salma S, Agus F. 2014. Peat emission control by groundwater management and
soil amendments: evidence from laboratory experiments. Mitig Adapt Strateg Glob
Change. 19:821-829. https://doi.org/10.1007/s11027-013-9526-3
ICALRD, Indonesian Center for Agricultural Land-resources Research and Development.
2019. Map of the Indonesian Peatlands with the Scale of 1:50,000 (Peta Lahan Gambut

Journal of Oil Palm and Palm Oil Research Vol. 1, No. 1, October 2020, p. 23-39
http://joppor.cpopc.org/index.php/joppor 38
Indonesia Skala 1:50.000). Agricultural Research and Development Agency, Ministry of
Agriculture, the Republic of Indonesia
IOPRI, Indonesian Oil Palm Research Institute. 2009. CO2 Emission on oil palm plantation:
field observation. Paper presented on Indonesian Palm Oil Conference and price Outlook
2010. Bali, December 1-4 2009
IOPRI, Indonesian Oil Palm Research Institute. 2009. CO2 Emission on oil palm plantation:
field observation. Paper presented on Indonesian Palm Oil Conference and price Outlook
2010. Bali, December 1-4 2009
Jauhiainen J, Hooijer A, Page SE. 2011. Carbon dioxide fluxes in an Acacia plantation on
tropical peatland. Biogeosciences Discuss. 8:8269-8302.
http://doi.org/10.5194/bg-9-617-2012
Marwanto S, Sabiham S, Furukawa S. 2019. Importance of CO2 production in subsoil layers
of drained tropical peatland under mature oil palm plantation. Soil and Tillage Research.
186: 206-213. https://doi.org/10.1016/j.still.2018.10.021
Marwanto S, Watanabe T, Iskandar W, Sabiham S, Furukawa S. 2018. Effects of seasonal
rainfall and water table movement on the soil solution composition of tropical peatland.
Soil Science and Plant Nutrition. 1-10. http://doi.org/10.1080/00380768.2018.1436940
Melling L, Hatano R, Goh KJ. 2005. Soil CO2 flux from three ecosystems in tropical peatland
of Sarawak, Malaysia. Tellus. B. 57B:1-11. https://doi.org/10.3402/tellusb.v57i1.16772
Melling L, Goh KJ, Beauvais C, Hatano R. 2007. Carbon flow and budget in a young mature
oil palm agroecosystem on deep tropical peat. In: Rieley J.O., C.J. Banks, and B.
Radjagukguk (Eds.), Proceedings of the International Symposium and Workshop on
Tropical Peatland, Yogyakarta, Indonesia.
http://www.geog.le.ac.uk/carbopeat/media/pdf/yogyapapers/yogyaproceedings.pdf
Page S, Morrison ER, Malins C, Hooijer A, Rieley JO, Jauhiainen J. 2011. Review of peat
surface greenhouse gas emissions from oil palm plantations in Southeast Asia.
Washington DC (US): The International Council on Clean Transportation
Page SE, Wüst R, Banks C. 2010. Past and present carbon accumulation and loss in
Southeast Asian peatlands. PAGES News. 18. 10.22498/pages.18.1.25
Pagiola S. 2000. Land use change in Indonesia. A background paper for Indonesia:
Environment and natural resource management in a time of transition. Washington DC
(US): World Bank
Polak B. 1975. Character and occurrence of peat deposits in the Malaysian Tropic. In,
Proceeding on Modern Quaternary Research in Indonesia, Modern Quaternary
Research in Southeast Asia. pp.71-81
Rehman SAU, Sudadi U, Anwar S, Sabiham S. 2015. Land Use Changes and Above-Ground
Biomass Estimation in Peatlands of Riau and West Kalimantan, Indonesia. J. Int. Soc.
Southe. Asian. Agr. Sci. 21:123-136
Reijnders L, Huijbregts MAJ. 2008. Palm oil and the emission of carbon-based greenhouse
gases. J. Cleaner Prod. 16: 477-482. http://doi.org/10.1016/j.jclepro.2006.07.054
Sabiham S, Marwanto S, Watanabe T, Furukawa S, Sudadi U, Agus F. 2014. Estimating the
relative contributions of root respiration and peat decomposition to the total CO2 flux from
peat soil at an oil palm plantation in Sumatra, Indonesia. J. Trop. Agr. Develop. 58(3):
87-93. http://doi.org/10.11248/jsta.58.87
Journal of Oil Palm and Palm Oil Research Vol. 1, No. 1, October 2020, p. 23-39
http://joppor.cpopc.org/index.php/joppor 39
Sabiham S. 1988. Studies on peat in the coastal plains of Sumatra and Borneo. PhD
Dissertation. Kyoto University, Kyoto, Japan.
Schrier-Uijl AP, Silvius M, Parish F, Lim KH, Rosediana S, Anshari G. 2013. Environmental
and social impact of oil palm cultivation on tropical peat - A scientific review. Round
Table on Sustainable Palm Oil (Kuala Lumpur, Malaysia)
Tjondronegoro SMP. 2004. From colonization to transmigration: Changing policies in
population resettlement. In, Furukawa H (eds.) Destruction, Health, and Development:
Advancing Asian Paradigms. Kyoto (JP): Kyoto University Press and Trans Pacific Press.
p.638
Wakhid N, Hirano T, Okimoto Y, Nurzakiah S, Nursyamsi D. 2017. Soil carbon dioxide
emissions from a rubber plantation on tropical peat. Sci. Total. Environ. 581-582:857-865.
https://doi.org/10.1016/j.scitotenv.2017.01.035
Wicke B, Dornburg V, Junginger M, Faaij A. 2008. Different palm oil production system for
energy purpose and their greenhouse gas implications. Biomass. Bioenerg. 32:
1322-1337. https://doi.org/10.1016/j.biombioe.2008.04.001
Wosten JHM. 1997. Peat subsidance and its pratical implications: a case study in Malaysia.
Geoderma. 78:25-36. https://doi.org/10.1016/S0016-7061(97)00013-X
Yule CM, Lim YY, Lim TY. 2016. Degradation of tropical Malaysian peatlands decreases
levels of phenolics in soil and in leaves of Macaranga pruinosa. Front. Earth. Sci. 4, 45.
http://dx.doi.org/10.3389/feart.2016.00045.
Appreciation. This manuscript was reviewed for JOPPOR by Prof. Dr Kukuh Murtilaksono,
Soil and Water Conservation, IPB University and Prof. Dr Widiatmaka, Evaluation of
Physical Land Resources, IPB University.


![Human carbon dioxide emissions [ Mt C]](https://static.fdocuments.us/doc/165x107/56813d0c550346895da6bffd/human-carbon-dioxide-emissions-mt-c.jpg)