UNDERSTANDING GUESTS’ GENERATION: A STRATEGY FOR …
14
European Journal of Hospitality and Tourism Research Vol.4, No.3, pp.28-40, December 2016 ___Published by European Centre for Research Training and Development UK (www.eajournals.org) 28 ISSN 2054 - 6424(Print), ISSN 2054 - 6432(Online) UNDERSTANDING GUESTS’ GENERATION: A STRATEGY FOR HOTELIERS Kukoyi I.A 1 , Aina O.C 2 , Iwuagwu C.C 3 Olatunji T.T 4 (+234 813 4691 558, [email protected]) Federal University of Agriculture, Abeokuta, Ogun State, Nigeria 1 . Afe Babalola University, Ado-Ekiti, Ekiti State, Nigeria 2,3,4 . ABSTRACT: The study assess trends in service delivery in independent hotels in Ogun State. It classified hotel guests based on the generation they belong to using their period of birth as adopted from Goldman Sachs Global Investment Research (GSGIR). This include, the Baby Boomers, Baby Busters (Generation X) and the Millennials (Generation Y). The investigation focused on the challenges facing hotels and the attributes of various category of people that patronizes independent hotels, their expectation and how hotelier can surpass it. Multistage sampling techniques were used for sample selection. Twenty-four (24) independent hotels were selected from the four major towns in each of the four geopolitical zones that makes up Ogun State using purposive and systemic sampling methods. Simple random sampling method was further used to select four hundred and twenty (420) respondents among guests patronizing the selected hotels. Questionnaires and keys informant interview methods were used for data gathering. Findings of the study revealed that, independent hotels are mostly facing the challenge of poor patronage, unfavourable government policy, high running cost to mention a few. It was also revealed that, independent hotels are mostly patronized by the Millennials (51%) which are mostly male (77%) and are single (67%). Interview with managers of hotel revealed that recent trends in the industry was largely brought by innovations in technology, marketing strategies, human relation and social values which has given birth to several products and services offered by various hotels. The study concludes that, hotels that intend to boost sales to overcome many of their challenges especially in highly competitive regions should intensify efforts to better understand expectations of various generation of customers and which of these generations is most dominant in their region. The study recommends that, hotels that are yet to upgrade their products and services should carve a niche market for themselves that will focus on the dominant group, marketing this group and satisfactorily meeting the expectations of this category of guest without compromising the needs of other category of guests. Keywords: Generation, Guest, Hoteliers. BACKGROUND OF STUDY For decades, hospitality technology has been old, cumbersome and expensive. But in the past few years, we have seen the rise of ‘SaaS’ (Software as a Service) products which are more intuitive and cost much less than their predecessors. Property management service (PMS) and channel managers are now readily available to small properties like independent hotels and hostels that enable owners to compete on a more level playing field. According to Helana (2015), Trip Barometer study report predicts that one-third of travelers will increase their budget for the year 2016, but also warned that 63% of people will not stay in a hotel that lacks air conditioning and 43% of people will not stay somewhere that does not offer free WiFi.
Transcript of UNDERSTANDING GUESTS’ GENERATION: A STRATEGY FOR …

European Journal of Hospitality and Tourism Research
Vol.4, No.3, pp.28-40, December 2016
___Published by European Centre for Research Training and Development UK (www.eajournals.org)
28
ISSN 2054 - 6424(Print), ISSN 2054 - 6432(Online)
UNDERSTANDING GUESTS’ GENERATION: A STRATEGY FOR HOTELIERS
Kukoyi I.A1, Aina O.C2, Iwuagwu C.C3 Olatunji T.T4
(+234 813 4691 558, [email protected])
Federal University of Agriculture, Abeokuta, Ogun State, Nigeria1.
Afe Babalola University, Ado-Ekiti, Ekiti State, Nigeria2,3,4.
ABSTRACT: The study assess trends in service delivery in independent hotels in Ogun State. It
classified hotel guests based on the generation they belong to using their period of birth as adopted
from Goldman Sachs Global Investment Research (GSGIR). This include, the Baby Boomers, Baby
Busters (Generation X) and the Millennials (Generation Y). The investigation focused on the
challenges facing hotels and the attributes of various category of people that patronizes independent
hotels, their expectation and how hotelier can surpass it. Multistage sampling techniques were used
for sample selection. Twenty-four (24) independent hotels were selected from the four major towns
in each of the four geopolitical zones that makes up Ogun State using purposive and systemic
sampling methods. Simple random sampling method was further used to select four hundred and
twenty (420) respondents among guests patronizing the selected hotels. Questionnaires and keys
informant interview methods were used for data gathering. Findings of the study revealed that,
independent hotels are mostly facing the challenge of poor patronage, unfavourable government
policy, high running cost to mention a few. It was also revealed that, independent hotels are mostly
patronized by the Millennials (51%) which are mostly male (77%) and are single (67%). Interview
with managers of hotel revealed that recent trends in the industry was largely brought by innovations
in technology, marketing strategies, human relation and social values which has given birth to several
products and services offered by various hotels. The study concludes that, hotels that intend to boost
sales to overcome many of their challenges especially in highly competitive regions should intensify
efforts to better understand expectations of various generation of customers and which of these
generations is most dominant in their region. The study recommends that, hotels that are yet to
upgrade their products and services should carve a niche market for themselves that will focus on
the dominant group, marketing this group and satisfactorily meeting the expectations of this category
of guest without compromising the needs of other category of guests.
Keywords: Generation, Guest, Hoteliers.
BACKGROUND OF STUDY
For decades, hospitality technology has been old, cumbersome and expensive. But in the past few
years, we have seen the rise of ‘SaaS’ (Software as a Service) products which are more intuitive and
cost much less than their predecessors. Property management service (PMS) and channel managers
are now readily available to small properties like independent hotels and hostels that enable owners
to compete on a more level playing field. According to Helana (2015), Trip Barometer study report
predicts that one-third of travelers will increase their budget for the year 2016, but also warned that
63% of people will not stay in a hotel that lacks air conditioning and 43% of people will not stay
somewhere that does not offer free WiFi.
European Journal of Hospitality and Tourism Research
Vol.4, No.3, pp.28-40, December 2016
___Published by European Centre for Research Training and Development UK (www.eajournals.org)
29
ISSN 2054 - 6424(Print), ISSN 2054 - 6432(Online)
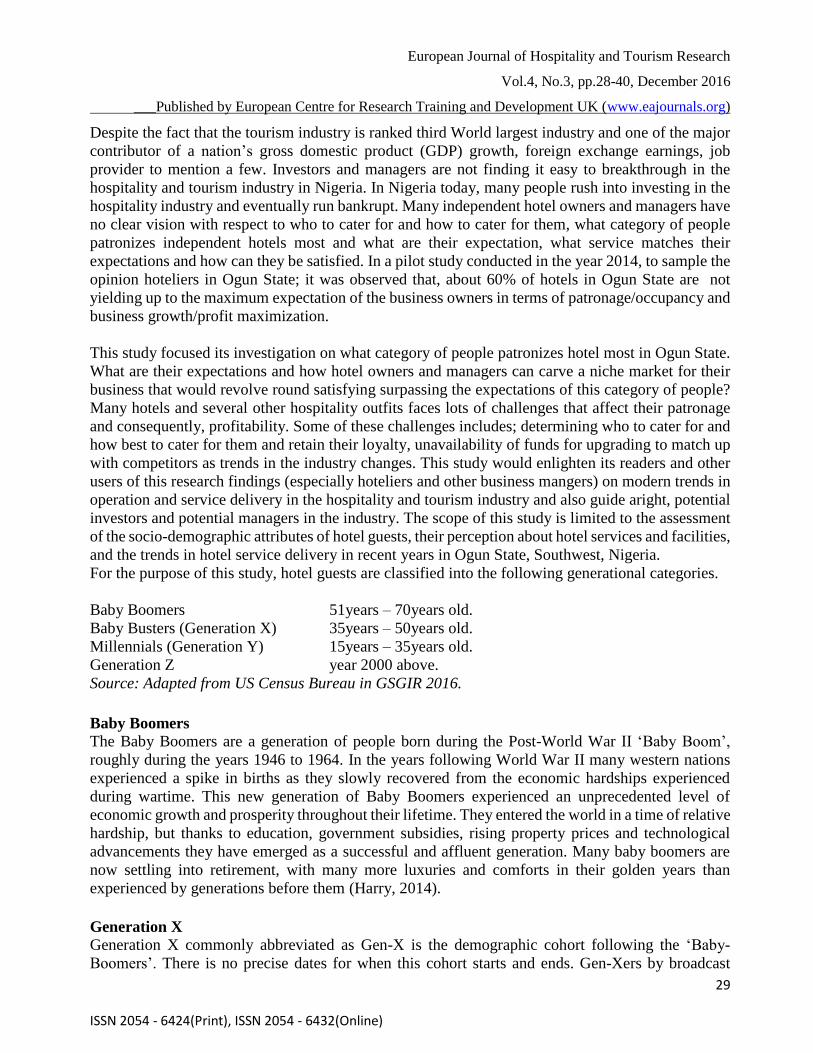
Despite the fact that the tourism industry is ranked third World largest industry and one of the major
contributor of a nation’s gross domestic product (GDP) growth, foreign exchange earnings, job
provider to mention a few. Investors and managers are not finding it easy to breakthrough in the
hospitality and tourism industry in Nigeria. In Nigeria today, many people rush into investing in the
hospitality industry and eventually run bankrupt. Many independent hotel owners and managers have
no clear vision with respect to who to cater for and how to cater for them, what category of people
patronizes independent hotels most and what are their expectation, what service matches their
expectations and how can they be satisfied. In a pilot study conducted in the year 2014, to sample the
opinion hoteliers in Ogun State; it was observed that, about 60% of hotels in Ogun State are not
yielding up to the maximum expectation of the business owners in terms of patronage/occupancy and
business growth/profit maximization.
This study focused its investigation on what category of people patronizes hotel most in Ogun State.
What are their expectations and how hotel owners and managers can carve a niche market for their
business that would revolve round satisfying surpassing the expectations of this category of people?
Many hotels and several other hospitality outfits faces lots of challenges that affect their patronage
and consequently, profitability. Some of these challenges includes; determining who to cater for and
how best to cater for them and retain their loyalty, unavailability of funds for upgrading to match up
with competitors as trends in the industry changes. This study would enlighten its readers and other
users of this research findings (especially hoteliers and other business mangers) on modern trends in
operation and service delivery in the hospitality and tourism industry and also guide aright, potential
investors and potential managers in the industry. The scope of this study is limited to the assessment
of the socio-demographic attributes of hotel guests, their perception about hotel services and facilities,
and the trends in hotel service delivery in recent years in Ogun State, Southwest, Nigeria.
For the purpose of this study, hotel guests are classified into the following generational categories.
Baby Boomers 51years – 70years old.
Baby Busters (Generation X) 35years – 50years old.
Millennials (Generation Y) 15years – 35years old.
Generation Z year 2000 above.
Source: Adapted from US Census Bureau in GSGIR 2016.
Baby Boomers The Baby Boomers are a generation of people born during the Post-World War II ‘Baby Boom’,
roughly during the years 1946 to 1964. In the years following World War II many western nations
experienced a spike in births as they slowly recovered from the economic hardships experienced
during wartime. This new generation of Baby Boomers experienced an unprecedented level of
economic growth and prosperity throughout their lifetime. They entered the world in a time of relative
hardship, but thanks to education, government subsidies, rising property prices and technological
advancements they have emerged as a successful and affluent generation. Many baby boomers are
now settling into retirement, with many more luxuries and comforts in their golden years than
experienced by generations before them (Harry, 2014).
Generation X
Generation X commonly abbreviated as Gen-X is the demographic cohort following the ‘Baby-
Boomers’. There is no precise dates for when this cohort starts and ends. Gen-Xers by broadcast

European Journal of Hospitality and Tourism Research
Vol.4, No.3, pp.28-40, December 2016
___Published by European Centre for Research Training and Development UK (www.eajournals.org)
30
ISSN 2054 - 6424(Print), ISSN 2054 - 6432(Online)
definition includes those individuals born between the early 1960s and the early 1980s, they are
sometimes referred to as ‘Baby Busters’ because their birth years follows the ‘Baby Boom’ that began
after the World War II. The collective persona of Gen-Xers is frequently debated and discussed
among academicians and marketing experts worldwide (Harry, 2014).
Generation X has often been criticized for a snarky and casual disdain for authority. In their
workplace, they want freedom coupled with responsibility and they hate being micromanaged. This
has created decades of conflict between ‘Baby Boomers’ and ‘Baby Busters’. Gen.-Xers have come
of age during an interesting time in the world. They remember rotary dial phones and the explosion
of mobile technology. They grew up in world without social media, and yet have adapted to it, even
invented it exquisitely. Gen-Xers has overtime proven highly adaptable to change (Harry, 2014).
Generation Y (Millennials)
A millennial simply refers a person reaching young adulthood around the year 2000. Millennials (also
known as the millennial generation or generation Y, abbreviated to Gen Y) are the demographic
cohort between generation X and generation Z. There are no precise dates for when the generation
starts and ends. Pew Research Center (PRC) (2015) reports and data on the millennial generation
shows that millennial generation are those born between 1980 and sometime in the early 2000s.
Millennials have become the fastest growing customer segment within the hospitality industry.
Exploration, interaction and experience are the major focus of millennials who are willing to pay
more for a greater experience (Robert, 2015). Many of them are looking for an overall gourmet
experience for a reasonable price and this has produced all new lobby designs in the hotel sector.
Lobby bars and hotel restaurants are wide open with combination work, play and eat/drink spaces
designed with this millennial customer mind. Millennials are constantly looking for a unique and
novel experience and this has and will continue to command change within the market.
Moreover, this customer segment is interested in utilizing technology to do things that many others
have become accustomed to doing manually; checking-in at hotels, paying their restaurant and bar
bills and looking up places to eat, shop and play to name a few. In addition to wanting technology,
millennials have no problems speaking up. If what they are seeking is not handled in their liking, they
will turn to Twitter, Facebook, Instagram, Yelp or TripAdvisor to voice their complaints. And last
but not least, millennials now constitute the largest percentage of independent hotel customers in
recent years (PRC, 2015).
Generation Z
Generation Z is the generation of children born after the Year 2000. They are the children of
Generation X and Generation Y. To be fair we don’t know a whole lot about the character traits of
Generation Z, because they haven’t been on the earth for very long yet. Generation Z are predicted
to be highly connected, living in an age of high-tech communication, technology driven lifestyles and
prolific use of social media. A lot of what we think we know about Generation Z is inferred, and only
time will tell whether we have been correct (Harry, 2014).
Aim and Objectives
The aim of the study is to assess hotel customers in Ogun State and provide a nuance understanding
of their expectations, how to satisfy them and how best to keep them as loyal customers. This would
be achieved through the following specific objectives:

European Journal of Hospitality and Tourism Research
Vol.4, No.3, pp.28-40, December 2016
___Published by European Centre for Research Training and Development UK (www.eajournals.org)
31
ISSN 2054 - 6424(Print), ISSN 2054 - 6432(Online)
i. Identify the category of individuals that patronizes hotels most in Ogun State.
ii. Investigate the major attributes of the category of individuals that patronizes hotel in Ogun
State.
iii. Identify what attracts hotel guests to patronize hotel of their choice in recent times in Ogun
State.
iv. Suggest how the major attributes and needs of hotel guest can be factored in to the trend of
service delivery in hotels.
METHODOLOGY
The researchers made use of survey research method for this study; this is because it is a more
convenient method in the study of both small and large population in other to discover the distribution
of the chosen population Sample. Osuala (2002) confirmed this when he said that survey research
studied both large and small population to discover the relative incidents of the distribution and
interaction of variables. It involves drawing a set of questions on some issues to which selected
members of the population are expected to express their opinion. This method is appropriate because
it ensures high reliability of the result the researcher might arrive at (Kukoyi et’al. 2015).
Samples, Sampling Method and Sample Size:
The samples used for this study includes selected independent hotels within the major towns of the
four geopolitical zones of Ogun State and their managers. Owing to the greatly heterogeneous nature
of the sample and size of the sample area, the study made use of multistage sampling technique for
the sample selection. Purposive sampling method was first used to select the major town in each of
the four geopolitical zones in Ogun State (namely: Abeokuta, Ijebu-Ode, Sagamu and Ilaro). Systemic
sampling method was further used to select three independent hotels of different class from different
quarters within each of these towns. This makes the total number of hotels selected for the study to
be twelve. Finally, the study used simple random sampling method to select five respondents from
every third guest that is above 18 years old that patronizes the hotel in a day for seven days (1 week).
This gives a total of (12 X 5 = 60 (7) = 420) four-hundred and twenty respondents that are hotel guest.
Data Collection Method
Questionnaires were given to the respondents that are hotel guest during check-in time and collected
back from them during their check-out time. Key informant interview was also conducted for the
manager of each of the twelve selected hotels to further gather information on the recent facilities and
services rendered by their respective hotels and the category of people that patronizes them in the last
two years.
DATA ANALYSIS AND PRESENTATION
Data gathered for this study was analyzed using simple statistical tools and presented using table and
charts.
European Journal of Hospitality and Tourism Research
Vol.4, No.3, pp.28-40, December 2016
___Published by European Centre for Research Training and Development UK (www.eajournals.org)
32
ISSN 2054 - 6424(Print), ISSN 2054 - 6432(Online)
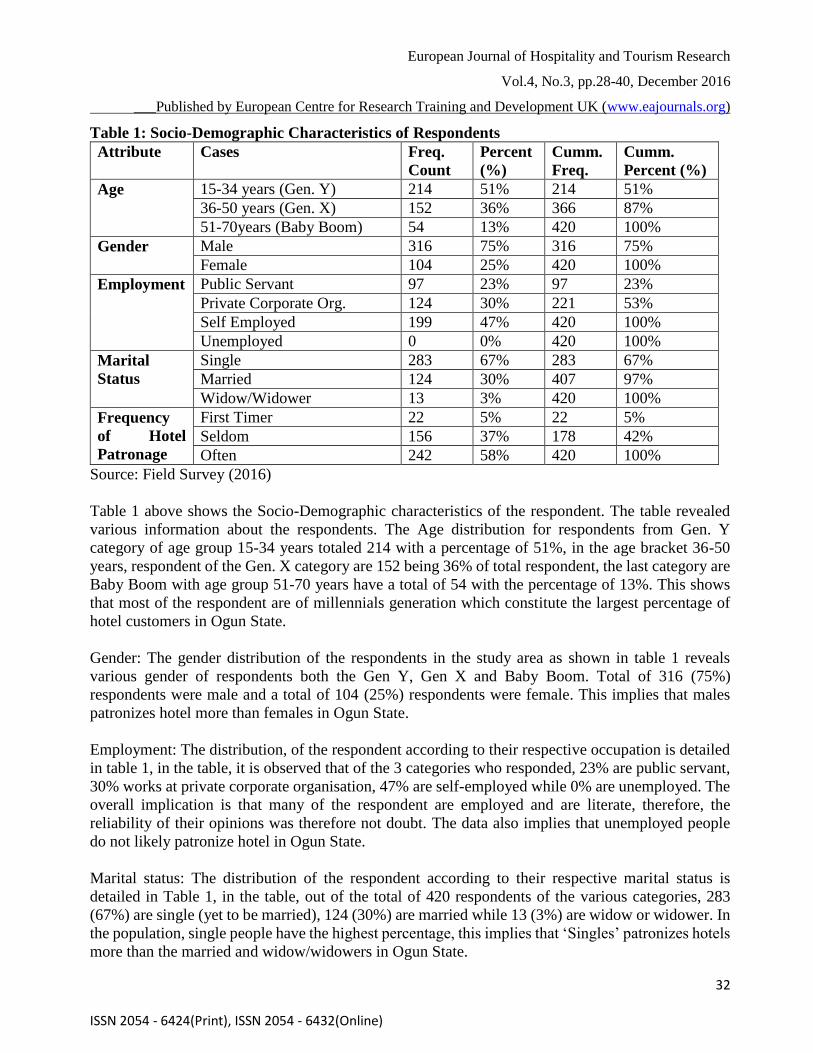
Table 1: Socio-Demographic Characteristics of Respondents
Attribute Cases Freq.
Count
Percent
(%)
Cumm.
Freq.
Cumm.
Percent (%)
Age 15-34 years (Gen. Y) 214 51% 214 51%
36-50 years (Gen. X) 152 36% 366 87%
51-70years (Baby Boom) 54 13% 420 100%
Gender Male 316 75% 316 75%
Female 104 25% 420 100%
Employment Public Servant 97 23% 97 23%
Private Corporate Org. 124 30% 221 53%
Self Employed 199 47% 420 100%
Unemployed 0 0% 420 100%
Marital
Status
Single 283 67% 283 67%
Married 124 30% 407 97%
Widow/Widower 13 3% 420 100%
Frequency
of Hotel
Patronage
First Timer 22 5% 22 5%
Seldom 156 37% 178 42%
Often 242 58% 420 100%
Source: Field Survey (2016)
Table 1 above shows the Socio-Demographic characteristics of the respondent. The table revealed
various information about the respondents. The Age distribution for respondents from Gen. Y
category of age group 15-34 years totaled 214 with a percentage of 51%, in the age bracket 36-50
years, respondent of the Gen. X category are 152 being 36% of total respondent, the last category are
Baby Boom with age group 51-70 years have a total of 54 with the percentage of 13%. This shows
that most of the respondent are of millennials generation which constitute the largest percentage of
hotel customers in Ogun State.
Gender: The gender distribution of the respondents in the study area as shown in table 1 reveals
various gender of respondents both the Gen Y, Gen X and Baby Boom. Total of 316 (75%)
respondents were male and a total of 104 (25%) respondents were female. This implies that males
patronizes hotel more than females in Ogun State.
Employment: The distribution, of the respondent according to their respective occupation is detailed
in table 1, in the table, it is observed that of the 3 categories who responded, 23% are public servant,
30% works at private corporate organisation, 47% are self-employed while 0% are unemployed. The
overall implication is that many of the respondent are employed and are literate, therefore, the
reliability of their opinions was therefore not doubt. The data also implies that unemployed people
do not likely patronize hotel in Ogun State.
Marital status: The distribution of the respondent according to their respective marital status is
detailed in Table 1, in the table, out of the total of 420 respondents of the various categories, 283
(67%) are single (yet to be married), 124 (30%) are married while 13 (3%) are widow or widower. In
the population, single people have the highest percentage, this implies that ‘Singles’ patronizes hotels
more than the married and widow/widowers in Ogun State.

European Journal of Hospitality and Tourism Research
Vol.4, No.3, pp.28-40, December 2016
___Published by European Centre for Research Training and Development UK (www.eajournals.org)
33
ISSN 2054 - 6424(Print), ISSN 2054 - 6432(Online)
Frequency of Hotel patronage: The patronage of the respondent was grouped in a distribution of first
timer, seldom and often with frequency count of 22, 156 and 242 respondents respectively and their
respective percentage being 5%, 37% and 58%. This shows that majority of the respondent for this
study patronizes hotels often, closely followed by those who visit seldomly, while the first timer rate
is relatively low. More so, amongst the generations, figure ‘1’ below reveals that the Gen. Y
patronizes hotels most often in Ogun State.
Table 2: Assessment of Hotel Guest’s Employment Status
Category Public Servants Private Corporate Org. Self Employed Total
Baby Boomers 17 (18%) 23 (18%) 40 (20%) 80 (19%)
Generation X 52 (53%) 43 (35%) 68 (34%) 163 (39%)
Generation Y 28 (29%) 58 (47%) 91 (46%) 177 (42%)
Total 97 124 199 420
Source: Field Survey (2016)
The employment status of the three category of hotel guest was grouped in a distribution of public
servants, private corporate organisation and self-employed. 17 out of 80 Baby Boomers with a
percentage of 18% are public servants, 23 Baby Boomers with a percentages of 18% works at private
corporate organisation while 40 Baby Boomers with a percentage of 20% are self-employed. Thereby
having a total population of 80 Baby Boomers with a percentage of 19% overall.
For the second category (Generation X), it was revealed that 52 members of the generation with a
percentage of 53% are public servants and 43 member of generation X with a percentage of 35%
works at private corporate organizations and 68 member of generation X with a percentage of 34%
are self-employed. The total population of generation X is 163 with a total percentage of 39% of the
total respondent.
For the third category (Generation Y), 28 (29%) are public servants, 58 (47%) works at private
corporate organizations and 91 (46%) are self-employed. The Generation Y thereby has 177 total
member with 42% of the total respondent population. This implies that most member of the three
category are self-employed with a population of 199 respondents.
Table 3: Assessment of Hotel Guest’s Marital Status
Category Single Married Widow/Widower Total
Baby Boomers 12 (4%) 60 (48%) 7 (54%) 79 (19%)
Generation X 52 (19%) 48 (39%) 4 (31%) 107 (25%)
Generation Y 219 (77%) 16 (13%) 2 (15%) 237 (56%)
Total 283 124 13 420
Source: Field Survey (2016)
Table 3 above, indicates the distribution of the generational category relating to their respective
marital status. The Baby Boomers comprised of 12 singles, 60 married and 7 widow/widowers, with
percentage of 4%, 48% and 54% respectively. This category has 79 members (19%) of the total
respondents. The Generation X category comprised of 52 singles, 48 married and 4 widow/widower
(that is, 19%, 39% and 31% respectively) thereby having a total of 107 (25%) representative of the
total respondents.
European Journal of Hospitality and Tourism Research
Vol.4, No.3, pp.28-40, December 2016
___Published by European Centre for Research Training and Development UK (www.eajournals.org)
34
ISSN 2054 - 6424(Print), ISSN 2054 - 6432(Online)
The Generation Y comprised of 219 singles, 16 married, and 2 widow/widower (that is, 77%, 13%
and 15% respectively), thereby having a total population of 237 with a total percentage of 56% of the
total respondents. This implies that the three generational category has more single member with a
total of 283 (77% of which are millennials) and has relatively low number of (13) widow/widower
(54% of which are baby boomers). Recall that, table ‘1’ above, reported that singles patronizes hotels
in Ogun State, Nigeria more than the married and widow/widower. This further reveals that the
Generation Y category patronizes hotel most in Ogun State.
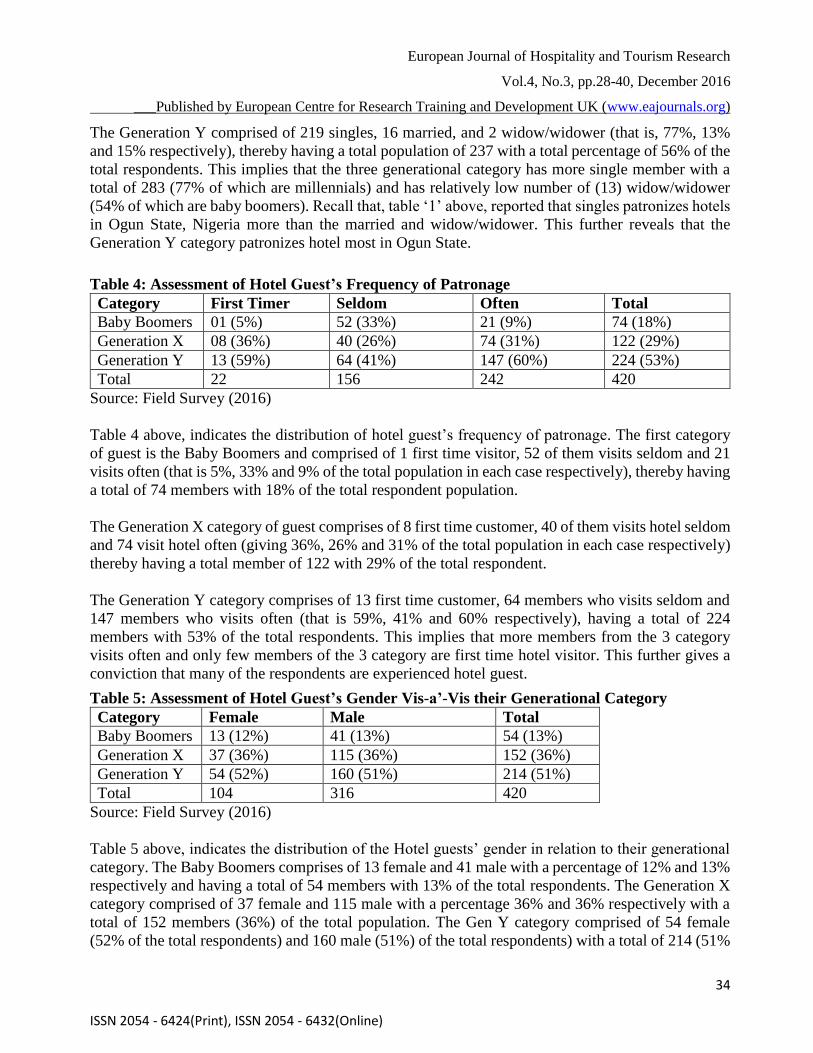
Table 4: Assessment of Hotel Guest’s Frequency of Patronage
Category First Timer Seldom Often Total
Baby Boomers 01 (5%) 52 (33%) 21 (9%) 74 (18%)
Generation X 08 (36%) 40 (26%) 74 (31%) 122 (29%)
Generation Y 13 (59%) 64 (41%) 147 (60%) 224 (53%)
Total 22 156 242 420
Source: Field Survey (2016)
Table 4 above, indicates the distribution of hotel guest’s frequency of patronage. The first category
of guest is the Baby Boomers and comprised of 1 first time visitor, 52 of them visits seldom and 21
visits often (that is 5%, 33% and 9% of the total population in each case respectively), thereby having
a total of 74 members with 18% of the total respondent population.
The Generation X category of guest comprises of 8 first time customer, 40 of them visits hotel seldom
and 74 visit hotel often (giving 36%, 26% and 31% of the total population in each case respectively)
thereby having a total member of 122 with 29% of the total respondent.
The Generation Y category comprises of 13 first time customer, 64 members who visits seldom and
147 members who visits often (that is 59%, 41% and 60% respectively), having a total of 224
members with 53% of the total respondents. This implies that more members from the 3 category
visits often and only few members of the 3 category are first time hotel visitor. This further gives a
conviction that many of the respondents are experienced hotel guest.
Table 5: Assessment of Hotel Guest’s Gender Vis-a’-Vis their Generational Category
Category Female Male Total
Baby Boomers 13 (12%) 41 (13%) 54 (13%)
Generation X 37 (36%) 115 (36%) 152 (36%)
Generation Y 54 (52%) 160 (51%) 214 (51%)
Total 104 316 420
Source: Field Survey (2016)
Table 5 above, indicates the distribution of the Hotel guests’ gender in relation to their generational
category. The Baby Boomers comprises of 13 female and 41 male with a percentage of 12% and 13%
respectively and having a total of 54 members with 13% of the total respondents. The Generation X
category comprised of 37 female and 115 male with a percentage 36% and 36% respectively with a
total of 152 members (36%) of the total population. The Gen Y category comprised of 54 female
(52% of the total respondents) and 160 male (51%) of the total respondents) with a total of 214 (51%
European Journal of Hospitality and Tourism Research
Vol.4, No.3, pp.28-40, December 2016
___Published by European Centre for Research Training and Development UK (www.eajournals.org)
35
ISSN 2054 - 6424(Print), ISSN 2054 - 6432(Online)
of the total respondent). This implies that there are more male for all category of guests that patronizes
hotels in Ogun State.
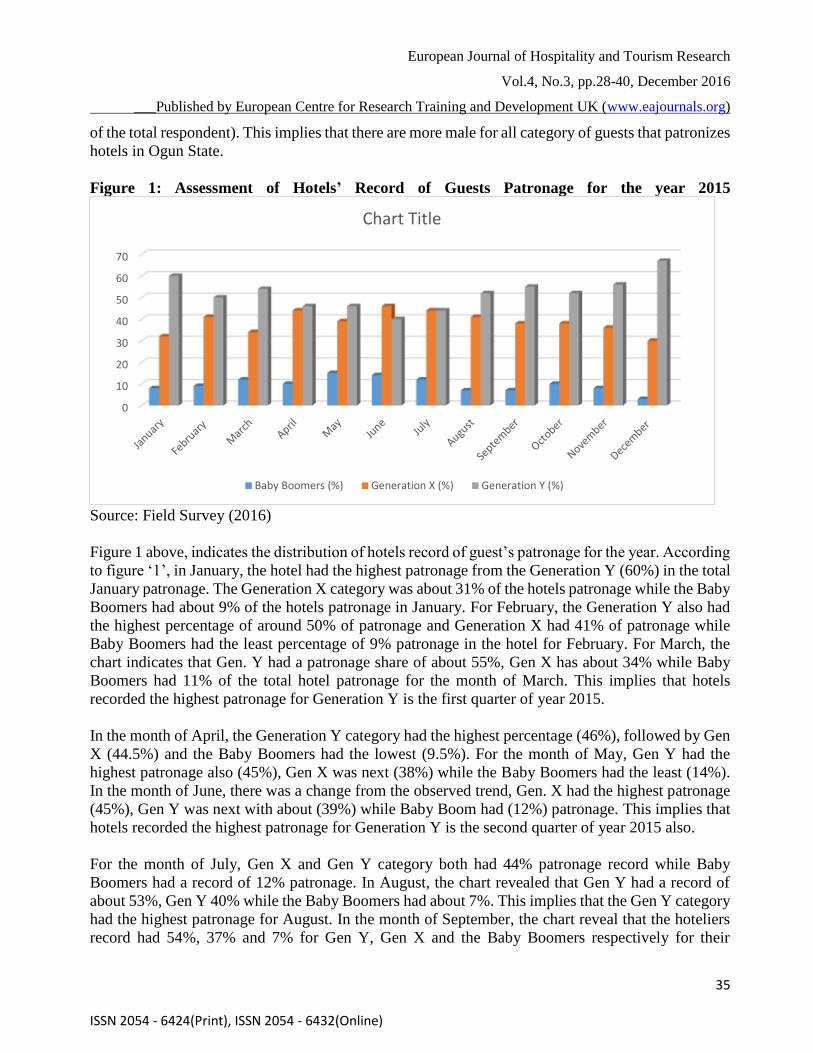
Figure 1: Assessment of Hotels’ Record of Guests Patronage for the year 2015
Source: Field Survey (2016)
Figure 1 above, indicates the distribution of hotels record of guest’s patronage for the year. According
to figure ‘1’, in January, the hotel had the highest patronage from the Generation Y (60%) in the total
January patronage. The Generation X category was about 31% of the hotels patronage while the Baby
Boomers had about 9% of the hotels patronage in January. For February, the Generation Y also had
the highest percentage of around 50% of patronage and Generation X had 41% of patronage while
Baby Boomers had the least percentage of 9% patronage in the hotel for February. For March, the
chart indicates that Gen. Y had a patronage share of about 55%, Gen X has about 34% while Baby
Boomers had 11% of the total hotel patronage for the month of March. This implies that hotels
recorded the highest patronage for Generation Y is the first quarter of year 2015.
In the month of April, the Generation Y category had the highest percentage (46%), followed by Gen
X (44.5%) and the Baby Boomers had the lowest (9.5%). For the month of May, Gen Y had the
highest patronage also (45%), Gen X was next (38%) while the Baby Boomers had the least (14%).
In the month of June, there was a change from the observed trend, Gen. X had the highest patronage
(45%), Gen Y was next with about (39%) while Baby Boom had (12%) patronage. This implies that
hotels recorded the highest patronage for Generation Y is the second quarter of year 2015 also.
For the month of July, Gen X and Gen Y category both had 44% patronage record while Baby
Boomers had a record of 12% patronage. In August, the chart revealed that Gen Y had a record of
about 53%, Gen Y 40% while the Baby Boomers had about 7%. This implies that the Gen Y category
had the highest patronage for August. In the month of September, the chart reveal that the hoteliers
record had 54%, 37% and 7% for Gen Y, Gen X and the Baby Boomers respectively for their
0
10
20
30
40
50
60
70
Chart Title
Baby Boomers (%) Generation X (%) Generation Y (%)

European Journal of Hospitality and Tourism Research
Vol.4, No.3, pp.28-40, December 2016
___Published by European Centre for Research Training and Development UK (www.eajournals.org)
36
ISSN 2054 - 6424(Print), ISSN 2054 - 6432(Online)
patronage. This also implies that hotels recorded the highest patronage for Generation Y is the third
quarter of year 2015.
In October, the hotels had 52%, 38% and 9% for Gen Y., Gen X and Baby Boomers respectively in
their record. In the month of November, patronage by Gen Y was the highest (56%) followed by the
Gen X (36%) and the Baby boomers had the least patronage (8%). In December, the Gen Y also had
the highest patronage (67%), next is the Gen X (29%) while Baby Boomers had the least patronage
(4%). This implies that the Gen Y category of guest patronized hotels most followed by Gen X while
Baby Boomers patronized hotels least in the year 2015 in Ogun State, Nigeria.
Table 6: Hotel Managers’ View on Modern Facilities/Services that Attract Customers to Hotels
Innovation Provision Description of
Service
Effect Benefits/Values
Technology
Based
WiFi Radio WiFi internet as
Value added
service
Makes internet
accessibility very
easy and more
available for both
the facility and its
guests
Builds guests
confidence that the
facility is 21st
century compliant
and make the
facility
environment
Technology
Based
Website,
Global
Distribution
System (GDS)
&
Central
Reservation
System
Online
booking/reservatio
n platform.
Allows guest access
information about
the facility on the
internet, make
bookings/reservatio
n on the internet
also.
Payments can also
be made online
through internet
bank transfers,
PayPal etc.
Reduce the stress
and cost of having
to get to the
premises of the
facility before
order can be
placed for
bookings
/reservation.
Technology
Based
Microchips Point of Sale
(POS) Machine
Allows customer
make payment
without necessarily
tendering cash.
Payment can be
made through the
use of credit cards
and debit cards
Reduces the risk of
carrying cash
about. Promotes
cashless economy
and saves the
facility the cost of
managing cash.
Technology
Based
Microchips with
programmable
memory
Key cards for
rooms
Most facilities are
recently upgrading
from the inserted
Allows customers
access their hotel
rooms without
carrying about the
traditional metal
keys.
Guarantees
security of the
hotel guest and
possibility of
strangers access
the guest’s room

European Journal of Hospitality and Tourism Research
Vol.4, No.3, pp.28-40, December 2016
___Published by European Centre for Research Training and Development UK (www.eajournals.org)
37
ISSN 2054 - 6424(Print), ISSN 2054 - 6432(Online)
key cards to soft
touch key cards.
Technology
Based
Camera, Video
converter,
Monitor Screen
Closed Circuit
Television
(CCTV) Camera
Allows the security
unit and
management of the
hotel to keep a 24/7
surveillance of
happenings within
the vicinity of the
property.
Boosts
management and
guest’s confidence
of security of life
and property
within the facility
premises.
Curbs crime
within the hotel
premises.
Technology
Based
Video Recorder
and Computer
Software
Digital Video
Marketing
Uses video clips to
engage Guest of
Social Media
Increases hotel’s
income
Technology
Based
Sensor/Camera Automatic Room
Lightning System
Human Detector
Switches on
automatically
immediately a guest
steps into a room
and off soon after
the room is no
longer been
occupied by guest.
Efficiently
conserve and
effectively
controls the
consumption of
energy within the
facility. Reduces
risk of fire
outbreak caused
by electricals
resulting from
guest carelessness
after leaving hotel
room.
Technology
Based
Mechatronic
Sensor/Camera
Electric Motor
Electronic Motor
Driven Doors
Automatically
opens hotel doors to
people as they
approach the
entrance to the hotel
Reduces the stress
of opening and
closing of the door
by human being
and also gives the
guest a convincing
welcome that the
hotel is technology
compliant.
Technology
Based
Sensor/Camera Car Scanner Car Scanners are
installed at the
facility’s entrance
gate. Use by
security offices to
assess all vehicles
coming in to the
premises
Helps in security
checks and boost
customers
confidence level
on security within
the premises.
Safety of life and
properties.

European Journal of Hospitality and Tourism Research
Vol.4, No.3, pp.28-40, December 2016
___Published by European Centre for Research Training and Development UK (www.eajournals.org)
38
ISSN 2054 - 6424(Print), ISSN 2054 - 6432(Online)
Man-Man
Ancillary
Services
Customer
Relations
Concierge Attends to guest’s
personal needs.
Makes guest feel
well pampered and
specially treated.
Builds good and
long lasting
customer relation.
Promotes
patronage, sales
and customer
loyalty.
Human
Relation
Marketing
Strategy
Customer
Relation/Marketi
ng
Loyalty programs Creates more
business friendly
atmosphere for
customers
Keeps loyal
customers of the
facility for a longer
period.
Technology/
Human
Ancillary
Services
Health/Fitness Gyms, Swimming
and other
reasonable
sporting facility
Creates a much
more relaxing
environment for
customer
Increase patronage
and Boost revenue
base
Man-Man
Ancillary
Services
Health/Beauty Spa, Make-Ups Creates a much
more relaxing and
beautifying
environment for
customer
Boost revenue
base and guest
comfort/confidenc
e in the services of
the hotel
Technology/
Human
Ancillary
Services
Souvenir
Shops/Business
Centers
Daily needs/
Mini-mart and
computer business
center/ travel
agents
Guest are opportune
to carry out virtually
all business
activities within the
premise of the hotel
Boost revenue
base and guest
comfort/confidenc
e in the services of
the hotel
Technology/
Human
Ancillary
Services
Shuttle Services Local
Transportation
Guest are able to
reach all places of
their choice (such as
tourist centers,
cinema etc.)
Boost revenue
base and guest
comfort/confidenc
e in the services of
the hotel
Food and
Beverage
Services
Restaurants/Bars Variety of food and
drinks for hotel
guests and visitors’
consumption
Hotels recently now
serve foods that
were not part of
their traditional
menu (such as
noodles and lots of
indigenous meals).
Hotels now operate
different kinds of
Bar to match up
with customer
expectations (such
as lobby bars).
Hotels are able to
meets guest’s
expectations and
also increase their
revenue base.
Guests are better
served and more
satisfied.
Source: Field Survey (2016)

European Journal of Hospitality and Tourism Research
Vol.4, No.3, pp.28-40, December 2016
___Published by European Centre for Research Training and Development UK (www.eajournals.org)
39
ISSN 2054 - 6424(Print), ISSN 2054 - 6432(Online)
Table 7: Guest’s Perception on the Level of Significance Attached to Innovations and Services
Rendered by Hotels in Ogun State
Service
Rendered
Human
Relations
Technology
Compliance
Security of
Life and
Properties
Accommod
ation
Services
Food and
Beverage
Services
Ancillary
Services
Category of
Guest
Significance
Level
Sig.
%
Insig.
%
Sig.
%
Insig.
%
Sig.
%
Insig.
%
Sig.
%
Insig.
%
Sig.
%
Insig.
%
Sig.
%
Insig.
%
Baby
Boomers
65 35 30 70 70 30 60 40 70 30 50 50
Baby
Busters
60 40 60 40 65 35 70 30 60 40 60 40
Millennials 50 50 80 20 50 50 65 35 50 50 70 30
Table 7 above, indicates the perception of each of the guests category on how significant they found
innovations and modern facilities/services that are been offered by hotels that they patronize which
they find attractive to them and also put into consideration in determining their choice of hotel. The
table revealed that, 65%, 60% and 50% of Baby Boomers, Baby Busters and Millennials respectively
found ‘Human Relations’ significant to them in determining their hotel of choice for patronage. This
implies that majority of all category of hotel guests patronizes hotels with good human relations in
the course of their service delivery. The table also revealed that 70% of Baby Boomers does not find
technology compliance significant to their choice of hotel. Whereas, 60% and 80% of Baby Buster
and Millennials respectively find technology compliance by hotels significant to their choice of hotel.
Table ‘7’ further indicate that all categories of hotel guest (Baby Boomers 70%, Baby Busters 65%
and Millennials 50%) finds security of life and properties significant as part of what is been
considered to determine their hotel of choice for patronage.
In the area of provision of accommodation services, which is the primary responsibility of a hotel,
60%, 70% and 65% of Baby Boomers, Baby Busters and Millennials respectively claimed that they
find provision of quality accommodation services germane to their choice of hotel for lodging.
Likewise, 70%, 60% and 50% of Baby Boomers, Baby Busters and Millennials respectively found
the quality of food and beverage services offered significant as part of the factors they consider in
choosing hotel for patronage. This implies that any hotel that wants to be successful must pay vital
attention to quality service delivery in all these aspect irrespective of the category of guest they choose
to cater for. Finally. 50%, 60% and 70% of Baby Boomers, Baby Busters and Millennials respectively
also considers ancillary services significant in determining what hotel they should patronize.
European Journal of Hospitality and Tourism Research
Vol.4, No.3, pp.28-40, December 2016
___Published by European Centre for Research Training and Development UK (www.eajournals.org)
40
ISSN 2054 - 6424(Print), ISSN 2054 - 6432(Online)
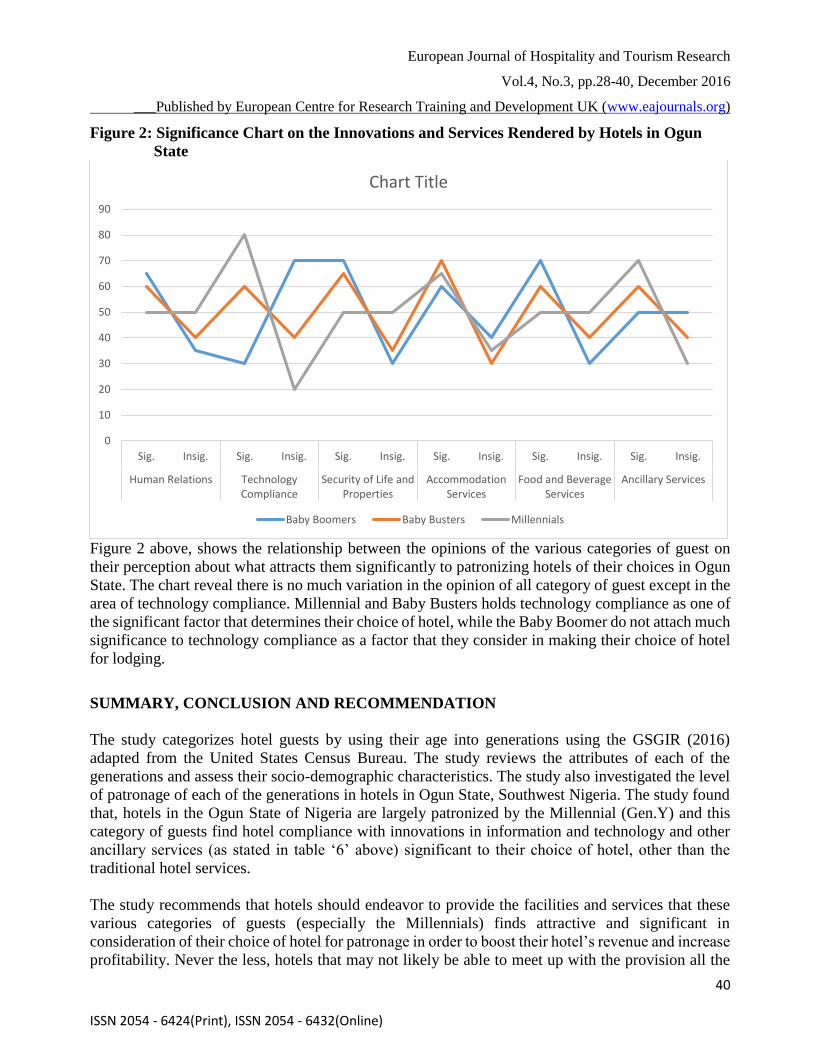
Figure 2: Significance Chart on the Innovations and Services Rendered by Hotels in Ogun
State
Figure 2 above, shows the relationship between the opinions of the various categories of guest on
their perception about what attracts them significantly to patronizing hotels of their choices in Ogun
State. The chart reveal there is no much variation in the opinion of all category of guest except in the
area of technology compliance. Millennial and Baby Busters holds technology compliance as one of
the significant factor that determines their choice of hotel, while the Baby Boomer do not attach much
significance to technology compliance as a factor that they consider in making their choice of hotel
for lodging.
SUMMARY, CONCLUSION AND RECOMMENDATION
The study categorizes hotel guests by using their age into generations using the GSGIR (2016)
adapted from the United States Census Bureau. The study reviews the attributes of each of the
generations and assess their socio-demographic characteristics. The study also investigated the level
of patronage of each of the generations in hotels in Ogun State, Southwest Nigeria. The study found
that, hotels in the Ogun State of Nigeria are largely patronized by the Millennial (Gen.Y) and this
category of guests find hotel compliance with innovations in information and technology and other
ancillary services (as stated in table ‘6’ above) significant to their choice of hotel, other than the
traditional hotel services.
The study recommends that hotels should endeavor to provide the facilities and services that these
various categories of guests (especially the Millennials) finds attractive and significant in
consideration of their choice of hotel for patronage in order to boost their hotel’s revenue and increase
profitability. Never the less, hotels that may not likely be able to meet up with the provision all the
0
10
20
30
40
50
60
70
80
90
Sig. Insig. Sig. Insig. Sig. Insig. Sig. Insig. Sig. Insig. Sig. Insig.
Human Relations TechnologyCompliance
Security of Life andProperties
AccommodationServices
Food and BeverageServices
Ancillary Services
Chart Title
Baby Boomers Baby Busters Millennials
European Journal of Hospitality and Tourism Research
Vol.4, No.3, pp.28-40, December 2016
___Published by European Centre for Research Training and Development UK (www.eajournals.org)
41
ISSN 2054 - 6424(Print), ISSN 2054 - 6432(Online)
generations finds significant in consideration of their choice of hotel should carve a niche to suit any
of the category of guest of their choice that they can best cater for. Report of this study is a guide for
hoteliers in understanding who their potential customers better, and how best they can meet their
guests’ needs.
AREA OF FURTHER RESEARCH
There is need to conduct this kind of study in several other states in Nigeria (and Africa) and in the
United States also, where the categorization criteria used for the study is prevalent, in order to
determine whether the behavioural patterns of the generations (Baby Boomers, Baby Busters: Gen X
and Millennial: Gen Y) with respect to hotel patronage is synonymous to what is obtainable in Nigeria
or not. Also the study can be carried out spreading over 3-5 years to further affirm the behavioural
pattern of the generation in the hotel industry.
REFERENCES
Goldman Sachs Global Investment Research (GSGIR) (2016). Millennials Coming of Age; Our
Thinking.
Harry Wallop (2014) Gen Z, Gen Y, Baby Boomers – A Guide to the generation. The Telegraph
Media Group Limited (online, retrieved: 15-11-16; 7:30am).
Helana Egan (2015) TripAdvisor Trip Barometer Study Report for the year 2015.
Kukoyi I.A, Iwuagwu C.C, Adeyefa E.A, Olatunji T.T, Agboola O.M, & Akadiri J.A (2015).
Assessment of the Level of Compliance and Significance of Information Technology on the
Hotels in Ado-Ekiti, Ekiti State, Nigeria. HATMAN Journal of Hospitality and Tourism.
Vol.5, No 1, Pg. 113-125.
Osuala, N. (2002). Principle of merchant banking and credit administration. (Benin City: Rasajel
Interbiz group). pp 7-17
Pew Research Centre (PRC) (2015). Annual Report on Global Attitudes and Trends. Washington
D.C, USA.
Robert Rauch (2015). Top 10 Hospitality Industry Trends in 2015. 4Hoteliers Magazine (online,
retrieved: 17-09-16 17:59am).