Understanding and Mitigating Packet Corruption in Data ... · Understanding and Mitigating Packet...
14
Understanding and Mitigating Packet Corruption in Data Center Networks Danyang Zhuo University of Washington Monia Ghobadi Microsoft Research Ratul Mahajan Microsoft Research & Intentionet Klaus-Tycho Förster Aalborg University Arvind Krishnamurthy University of Washington Thomas Anderson University of Washington ABSTRACT We take a comprehensive look at packet corruption in data center networks, which leads to packet losses and application performance degradation. By studying 350K links across 15 production data centers, we find that the extent of corruption losses is significant and that its characteristics differ markedly from congestion losses. Corruption impacts fewer links than congestion, but imposes a heavier loss rate; and unlike congestion, corruption rate on a link is stable over time and is not correlated with its utilization. Based on these observations, we developed CorrOpt, a system to mitigate corruption. To minimize corruption losses, it intelligently selects which corrupting links can be safely disabled, while ensuring that each top-of-rack switch has a minimum number of paths to reach other switches. CorrOpt also recommends specific actions (e.g., replace cables, clean connectors) to repair disabled links, based on our analysis of common symptoms of different root causes of corruption. Our recommendation engine has been deployed in over seventy data centers of a large cloud provider. Our analysis shows that, compared to current state of the art, CorrOpt can reduce corruption losses by three to six orders of magnitude and improve repair accuracy by 60%. CCS CONCEPTS • Networks → Network measurement ; Network reliability; Data center networks; Network management ; KEYWORDS CorrOpt, Packet Corruption, Data Center Networks, Optics, Fault Mitigation ACM Reference format: Danyang Zhuo, Monia Ghobadi, Ratul Mahajan, Klaus-Tycho Förster, Arvind Krishnamurthy, and Thomas Anderson. 2017. Understanding and Mitigating Packet Corruption in Data Center Networks. In Proceedings of SIGCOMM ’17, Los Angeles, CA, USA, August 21–25, 2017, 14 pages. https://doi.org/10.1145/3098822.3098849 Permission to make digital or hard copies of all or part of this work for personal or classroom use is granted without fee provided that copies are not made or distributed for profit or commercial advantage and that copies bear this notice and the full citation on the first page. Copyrights for components of this work owned by others than ACM must be honored. Abstracting with credit is permitted. To copy otherwise, or republish, to post on servers or to redistribute to lists, requires prior specific permission and/or a fee. Request permissions from [email protected]. SIGCOMM ’17, August 21–25, 2017, Los Angeles, CA, USA © 2017 Association for Computing Machinery. ACM ISBN 978-1-4503-4653-5/17/08. . . $15.00 https://doi.org/10.1145/3098822.3098849 1 INTRODUCTION Packet losses in data center networks (DCNs) hurt applications and can lead to millions of dollars in lost revenue [20, 26, 37]. For instance, packet loss rate above 0.1% causes RDMA’s throughput to drop by 25% for bulk transfer [36]. For user-facing video traffic, loss rates of 0.01% can cause TCP CUBIC’s throughput to drop by 50% [10]. Even sporadic packet losses can cause catastrophic virtual machine reboots [5]. Consequently, researchers have explored several approaches to reduce packet loss, including congestion control, active queue management, load balancing, and traffic engineering [2–4, 12, 28, 31, 32, 36]. All of these approaches, however, focus on one source of packet loss—congestion that occurs when the network’s load exceeds its capacity. However, another significant source of packet loss, namely packet corruption, has received little attention. Packet corruption occurs when the receiver cannot correctly decode transmitted bits. Such decoding errors cause the cyclic redundancy check in the Ethernet frame to fail and force the receiver to drop the packet. While recent studies categorize different sources of packet loss and acknowledge packet corruption as a contributor [5, 34, 37], not much is known today about the extent and characteristics of corruption-induced packet loss. This paper presents what to our knowledge is the first large-scale study of packet corruption in DCNs. We monitor 350K switch-to- switch, optical links within 15 data centers of a major cloud provider, over seven months. We find that, despite the cloud provider’s efforts to mitigate corruption, the number of packets lost due to corrup- tion is significant. To improve mitigation techniques for packet corruption, we need a thorough understanding of its characteristics. We uncover several relevant characteristics of corruption losses and contrast them with those of congestion. For instance, while the loss rate due to congestion varies with link utilization, that due to corruption is relatively stable over time and is independent of the link’s utilization. This observation implies that reducing the load on the link, as in congestion control, will not reduce packet corruption rate. We also find that, compared to congestion, cor- ruption plagues fewer links but imposes higher loss rates on those links. Finally, we find that corruption exhibits weak locality, i.e., the chances of multiple corrupting links being on the same switch or being topologically close are noticeable but low, while congestion exhibits strong locality. We also analyze hundreds of trouble ticket logs to find the com- mon root causes of corruption. These range from faulty transceivers (i.e., devices that convert between optical and electrical signals) and switches, to poorly installed hardware, to damaged optical fiber, to
Transcript of Understanding and Mitigating Packet Corruption in Data ... · Understanding and Mitigating Packet...

Understanding and Mitigating Packet Corruptionin Data Center Networks
Danyang Zhuo
University of Washington
Monia Ghobadi
Microsoft Research
Ratul Mahajan
Microsoft Research & Intentionet
Klaus-Tycho Förster
Aalborg University
Arvind Krishnamurthy
University of Washington
Thomas Anderson
University of Washington
ABSTRACTWe take a comprehensive look at packet corruption in data center
networks, which leads to packet losses and application performance
degradation. By studying 350K links across 15 production data
centers, we find that the extent of corruption losses is significant
and that its characteristics differ markedly from congestion losses.
Corruption impacts fewer links than congestion, but imposes a
heavier loss rate; and unlike congestion, corruption rate on a link
is stable over time and is not correlated with its utilization.
Based on these observations, we developed CorrOpt, a system to
mitigate corruption. To minimize corruption losses, it intelligently
selects which corrupting links can be safely disabled, while ensuring
that each top-of-rack switch has a minimum number of paths to
reach other switches. CorrOpt also recommends specific actions
(e.g., replace cables, clean connectors) to repair disabled links, based
on our analysis of common symptoms of different root causes of
corruption. Our recommendation engine has been deployed in over
seventy data centers of a large cloud provider. Our analysis shows
that, compared to current state of the art, CorrOpt can reduce
corruption losses by three to six orders of magnitude and improve
repair accuracy by 60%.
CCS CONCEPTS• Networks → Network measurement; Network reliability; Datacenter networks; Network management;
KEYWORDSCorrOpt, Packet Corruption, Data Center Networks, Optics, Fault
Mitigation
ACM Reference format:Danyang Zhuo,Monia Ghobadi, RatulMahajan, Klaus-Tycho Förster, Arvind
Krishnamurthy, and Thomas Anderson. 2017. Understanding and Mitigating
Packet Corruption in Data Center Networks. In Proceedings of SIGCOMM’17, Los Angeles, CA, USA, August 21–25, 2017, 14 pages.https://doi.org/10.1145/3098822.3098849
Permission to make digital or hard copies of all or part of this work for personal or
classroom use is granted without fee provided that copies are not made or distributed
for profit or commercial advantage and that copies bear this notice and the full citation
on the first page. Copyrights for components of this work owned by others than ACM
must be honored. Abstracting with credit is permitted. To copy otherwise, or republish,
to post on servers or to redistribute to lists, requires prior specific permission and/or a
fee. Request permissions from [email protected].
SIGCOMM ’17, August 21–25, 2017, Los Angeles, CA, USA© 2017 Association for Computing Machinery.
ACM ISBN 978-1-4503-4653-5/17/08. . . $15.00
https://doi.org/10.1145/3098822.3098849
1 INTRODUCTIONPacket losses in data center networks (DCNs) hurt applications
and can lead to millions of dollars in lost revenue [20, 26, 37]. For
instance, packet loss rate above 0.1% causes RDMA’s throughput
to drop by 25% for bulk transfer [36]. For user-facing video traffic,
loss rates of 0.01% can cause TCP CUBIC’s throughput to drop by
50% [10]. Even sporadic packet losses can cause catastrophic virtual
machine reboots [5].
Consequently, researchers have explored several approaches
to reduce packet loss, including congestion control, active queue
management, load balancing, and traffic engineering [2–4, 12, 28,
31, 32, 36]. All of these approaches, however, focus on one source
of packet loss—congestion that occurs when the network’s load
exceeds its capacity.
However, another significant source of packet loss, namely packet
corruption, has received little attention. Packet corruption occurs
when the receiver cannot correctly decode transmitted bits. Such
decoding errors cause the cyclic redundancy check in the Ethernet
frame to fail and force the receiver to drop the packet. While recent
studies categorize different sources of packet loss and acknowledge
packet corruption as a contributor [5, 34, 37], not much is known
today about the extent and characteristics of corruption-induced
packet loss.
This paper presents what to our knowledge is the first large-scale
study of packet corruption in DCNs. We monitor 350K switch-to-
switch, optical links within 15 data centers of amajor cloud provider,
over seven months. We find that, despite the cloud provider’s efforts
to mitigate corruption, the number of packets lost due to corrup-
tion is significant. To improve mitigation techniques for packet
corruption, we need a thorough understanding of its characteristics.
We uncover several relevant characteristics of corruption losses
and contrast them with those of congestion. For instance, while
the loss rate due to congestion varies with link utilization, that due
to corruption is relatively stable over time and is independent of
the link’s utilization. This observation implies that reducing the
load on the link, as in congestion control, will not reduce packet
corruption rate. We also find that, compared to congestion, cor-
ruption plagues fewer links but imposes higher loss rates on those
links. Finally, we find that corruption exhibits weak locality, i.e., the
chances of multiple corrupting links being on the same switch or
being topologically close are noticeable but low, while congestion
exhibits strong locality.
We also analyze hundreds of trouble ticket logs to find the com-
mon root causes of corruption. These range from faulty transceivers
(i.e., devices that convert between optical and electrical signals) and
switches, to poorly installed hardware, to damaged optical fiber, to
SIGCOMM ’17, August 21–25, 2017, Los Angeles, CA, USA D. Zhuo et al.
dirty optical connectors. By monitoring the optical layer contem-
poraneously with the tickets, we uncover the common symptoms
for each such root cause.
The prevalent method to mitigate corruption is to disable links
with corruption loss rate above a certain level (e.g., 10−6), provided
that the switches to which they attach have at least a threshold
number of active uplinks toward the spine of the DCN [26]. This
threshold ensures that the hosts using the switch have enough left-
over capacity—otherwise, we might replace corruption losses with
heavy congestion losses. Links are disabled automatically using soft-
ware that monitors the corruption loss rate of each link. Though it
does not repair corrupting links, this software is important because
it reduces the chances of application traffic experiencing corruption
losses. For each disabled link, a maintenance ticket is issued for
operators to manually repair the link. The operators attempt to
repair the link via a sequence of steps (e.g., clean the optical fiber
and connectors; replace the transceiver; replace the cable), based on
their expertise and largely independent of the root cause. The link
is enabled after each step, and the next step is taken if the previous
one did not succeed at eliminating corruption.
The method above has two limitations. First, the criterion for
disabling links is greedy and local.While such decisions can bemade
quickly, they miss better opportunities that can reduce the level of
corruption losses, i.e., disable links with higher corruption rates or
disable more corrupting links. We show that such opportunities
exist while meeting the same capacity constraint. Second, since the
strategy to repair corruption is agnostic of the root cause, it can
take multiple steps to eliminate corruption. In fact, with the current
strategy, the link is fixed in the first step only 50% of the time.
Based on the observations above, we develop CorrOpt, a system
to mitigate corruption in DCNs. Because the problem of identifying
the optimal set of corrupting links to disable, which minimizes
corruption losses while meeting capacity constraints, is NP-hard,
CorrOpt uses a two-phase approach. First, when a link starts cor-
rupting packets, a fast decision is made on whether the link can
be safely turned off. Even this fast decision allows us to lower cor-
ruption losses than the current method because it considers the
entire set paths from top-of-rack switches to the spine, instead of
just the switches adjacent to the link. But this fast decision is not
optimal. To approximate optimality, we use a second phase that
does a global optimization to determine the set of links that can
be safely disabled. The combination of the two phases allows us to
react quickly and optimize later.
CorrOpt also has a recommendation engine that uses a root
cause-aware approach to propose the right repair for corrupting
links. Based on the link’s characteristics (i.e., corruption rate, optical
transmit power, optical receive power) and history of actions taken
thus far (if any), it generates concrete recommendations for oper-
ators on what corrective action is needed. This recommendation
engine has been deployed in over 70 DCNs of our cloud provider.
We evaluate CorrOpt using the deployment of the recommenda-
tion engine and a trace-based analysis using data from production
DCNs. We find that CorrOpt responds to packet corruption quickly
and lowers the amount of corruption losses by up to three to six
orders of magnitude, while meeting the desired capacity constraints.
We also find that our recommendation engine has improved the
accuracy of repairing the link at the first attempt from 50% to 80%.
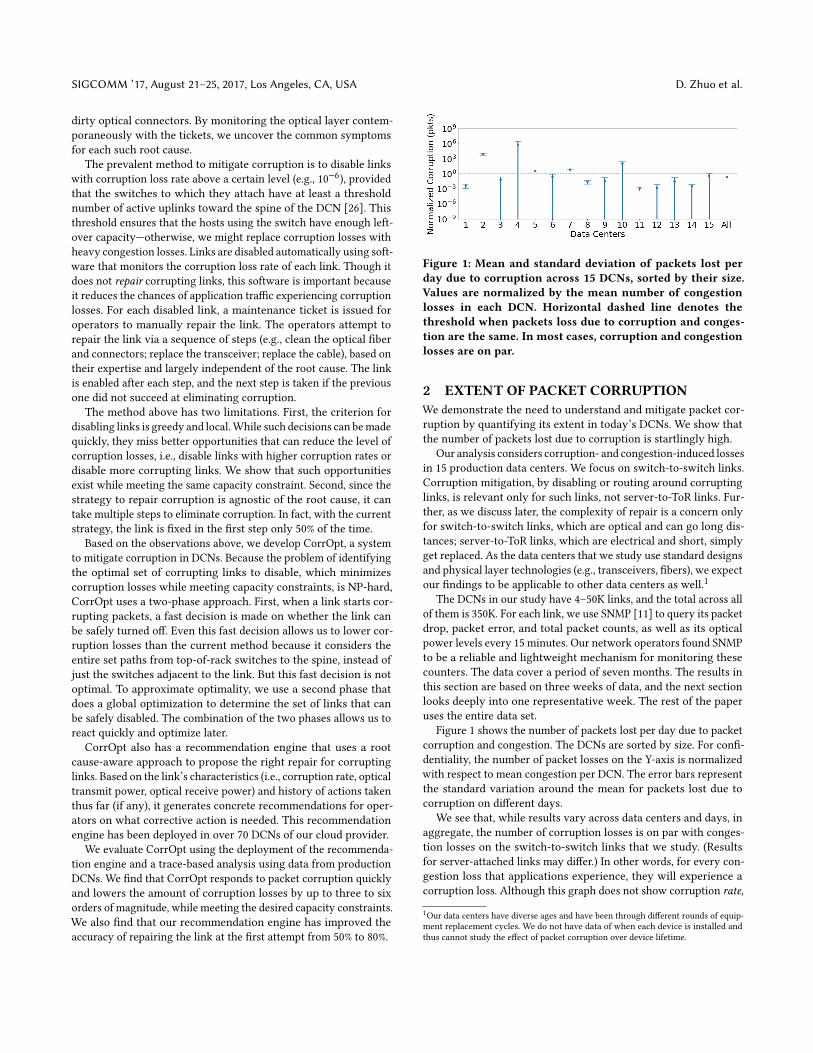
Figure 1: Mean and standard deviation of packets lost perday due to corruption across 15 DCNs, sorted by their size.Values are normalized by the mean number of congestionlosses in each DCN. Horizontal dashed line denotes thethreshold when packets loss due to corruption and conges-tion are the same. In most cases, corruption and congestionlosses are on par.
2 EXTENT OF PACKET CORRUPTIONWe demonstrate the need to understand and mitigate packet cor-
ruption by quantifying its extent in today’s DCNs. We show that
the number of packets lost due to corruption is startlingly high.
Our analysis considers corruption- and congestion-induced losses
in 15 production data centers. We focus on switch-to-switch links.
Corruption mitigation, by disabling or routing around corrupting
links, is relevant only for such links, not server-to-ToR links. Fur-
ther, as we discuss later, the complexity of repair is a concern only
for switch-to-switch links, which are optical and can go long dis-
tances; server-to-ToR links, which are electrical and short, simply
get replaced. As the data centers that we study use standard designs
and physical layer technologies (e.g., transceivers, fibers), we expect
our findings to be applicable to other data centers as well.1
The DCNs in our study have 4–50K links, and the total across all
of them is 350K. For each link, we use SNMP [11] to query its packet
drop, packet error, and total packet counts, as well as its optical
power levels every 15 minutes. Our network operators found SNMP
to be a reliable and lightweight mechanism for monitoring these
counters. The data cover a period of seven months. The results in
this section are based on three weeks of data, and the next section
looks deeply into one representative week. The rest of the paper
uses the entire data set.
Figure 1 shows the number of packets lost per day due to packet
corruption and congestion. The DCNs are sorted by size. For confi-
dentiality, the number of packet losses on the Y-axis is normalized
with respect to mean congestion per DCN. The error bars represent
the standard variation around the mean for packets lost due to
corruption on different days.
We see that, while results vary across data centers and days, in
aggregate, the number of corruption losses is on par with conges-
tion losses on the switch-to-switch links that we study. (Results
for server-attached links may differ.) In other words, for every con-
gestion loss that applications experience, they will experience a
corruption loss. Although this graph does not show corruption rate,
1Our data centers have diverse ages and have been through different rounds of equip-
ment replacement cycles. We do not have data of when each device is installed and
thus cannot study the effect of packet corruption over device lifetime.
Understanding and Mitigating Packet Corruptionin Data Center Networks SIGCOMM ’17, August 21–25, 2017, Los Angeles, CA, USA
Loss bucket links w. corruption links w. congestion
[10−8 - 10−5) 47.23% 92.44%
[10−5 - 10−4) 18.43% 6.35%
[10−4 - 10−3) 21.66% 0.99%
[10−3+) 12.67% 0.22%
total 100% 100%
Table 1: Comparison of the normalized distribution of linkswith congestion and corruption loss for different loss buck-ets. 12.67% of total links that experience corruption, havea corruption loss rate greater than or equal to 10
−3 (0.1%loss rate) whereas only 0.22% of links with congestion, havecongestion loss rate of 10−3. The numbers in each columnare normalized so that the table does not reveal the overallpercentage of links with congestion or corruption losses forconfidentiality reasons.
the next section shows that it can be quite high for some links.
This high level of corruption loss happens even though there is al-
ready a system to discover and turn off links with corruption. While
this system has limitations, which we explain in §5, we estimate
that without it, corruption-induced losses would be two orders of
magnitude higher.
Our results clearly demonstrate the need for an effective strategy
to mitigate corruption in DCNs. Our proposed system, CorrOpt,
provides such a strategy. To explain the rationale underlying its
design, in the next two sections, we dig more deeply into the nature
of corruption and its root causes.
3 CORRUPTION CHARACTERISTICSTo develop a thorough understanding of packet corruption, in this
section we identify the characteristics of corruption and compare
them to congestion. Though not our focus, our observations can also
help load balancing and congestion control systems appropriately
handle congestion vs. corruption losses when switch counters are
not available to distinguish the two.
Corruption impacts fewer links but can be more severe than conges-tion. Our data reveal that while congestion is a more widespread
phenomenon in terms of the links it impacts, packet corruption
affects fewer links. We compute the percentage of links with con-
gestion and corruption loss rate above 10−8
and find that the total
number of links with corruption is less than 2-4% of those with
congestion.2
This difference suggests that a small set of links have high corrup-
tion loss rate, given that the number of corruption and congestion
losses is similar. Table 1 shows the distribution of links with cor-
ruption and congestion in different loss buckets, normalized such
that the total in each column adds to 100%. Overall, only a small
percentage of links in the DCN have any corruption or congestion;
we exclude these percentages for confidentiality. We see that over
90% of links with congestion have a loss rate between 10−8
and 10−5.
2IEEE 802.3 standard requires each link to have corruption loss rate under 10
−8, but
operators today tend to worry only when packet loss rates start approaching 10−6.
In this paper, we conservatively use 10−8
as the threshold to deem a link as lossy or
non-lossy.
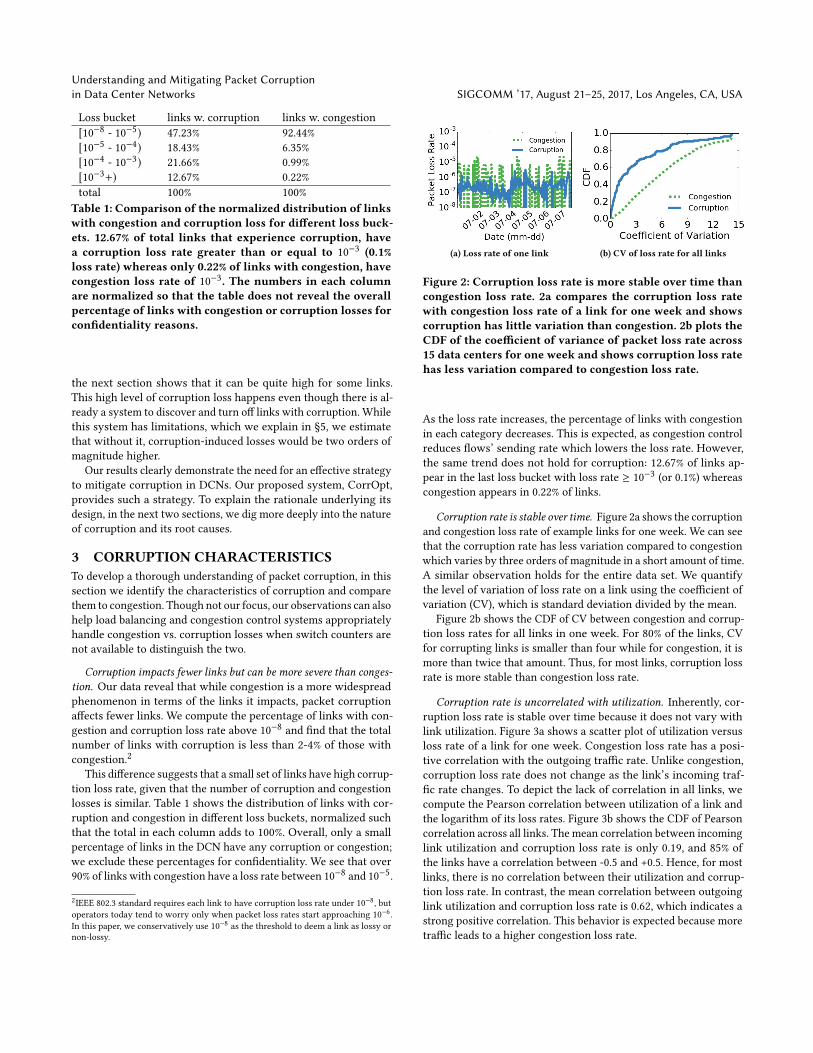
(a) Loss rate of one link (b) CV of loss rate for all links
Figure 2: Corruption loss rate is more stable over time thancongestion loss rate. 2a compares the corruption loss ratewith congestion loss rate of a link for one week and showscorruption has little variation than congestion. 2b plots theCDF of the coefficient of variance of packet loss rate across15 data centers for one week and shows corruption loss ratehas less variation compared to congestion loss rate.
As the loss rate increases, the percentage of links with congestion
in each category decreases. This is expected, as congestion control
reduces flows’ sending rate which lowers the loss rate. However,
the same trend does not hold for corruption: 12.67% of links ap-
pear in the last loss bucket with loss rate ≥ 10−3
(or 0.1%) whereas
congestion appears in 0.22% of links.
Corruption rate is stable over time. Figure 2a shows the corruptionand congestion loss rate of example links for one week. We can see
that the corruption rate has less variation compared to congestion
which varies by three orders of magnitude in a short amount of time.
A similar observation holds for the entire data set. We quantify
the level of variation of loss rate on a link using the coefficient of
variation (CV), which is standard deviation divided by the mean.
Figure 2b shows the CDF of CV between congestion and corrup-
tion loss rates for all links in one week. For 80% of the links, CV
for corrupting links is smaller than four while for congestion, it is
more than twice that amount. Thus, for most links, corruption loss
rate is more stable than congestion loss rate.
Corruption rate is uncorrelated with utilization. Inherently, cor-ruption loss rate is stable over time because it does not vary with
link utilization. Figure 3a shows a scatter plot of utilization versus
loss rate of a link for one week. Congestion loss rate has a posi-
tive correlation with the outgoing traffic rate. Unlike congestion,
corruption loss rate does not change as the link’s incoming traf-
fic rate changes. To depict the lack of correlation in all links, we
compute the Pearson correlation between utilization of a link and
the logarithm of its loss rates. Figure 3b shows the CDF of Pearson
correlation across all links. The mean correlation between incoming
link utilization and corruption loss rate is only 0.19, and 85% of
the links have a correlation between -0.5 and +0.5. Hence, for most
links, there is no correlation between their utilization and corrup-
tion loss rate. In contrast, the mean correlation between outgoing
link utilization and corruption loss rate is 0.62, which indicates a
strong positive correlation. This behavior is expected because more
traffic leads to a higher congestion loss rate.

SIGCOMM ’17, August 21–25, 2017, Los Angeles, CA, USA D. Zhuo et al.
(a) Utilization vs. loss rate (b) Correlation of utilization and lossrate
Figure 3: Corruption loss rate is less correlated with utiliza-tion than is congestion loss rate. 3a shows a scatter plot ofutilization versus loss rates of a link for one week. Unlikecongestion, the corruption loss rate does not change as thelink’s utilization changes. 3b plots the CDF of Pearson cor-relation between utilization and logarithm of loss rate. Theaverage Pearson correlation between utilization and conges-tion loss rate is 0.62. The average Pearson correlation be-tween utilization and corruption loss rate is 0.19.
Because the corruption loss rate is uncorrelated with utilization,
application or transport layer reactions will not resolve it. Thus,
unlike congestion, packet corruption is a pernicious fault that is
is not mitigated when senders slowdown. Instead, it persists—to
stop it, we must disable the link and then have technicians fix it.
A related, unfortunate aspect of corruption losses is that they lead
loss-sensitive transport protocols such as TCP to unnecessarily
slow down, which does nothing to resolve corruption but does hurt
application performance.
Corruption has weak spatial locality. We investigated if corrupt-
ing links tend to be spatially correlated (e.g., on the same switch or
topologically close) or scattered across the DCN (uniformly and)
randomly, and we found weak spatial locality. To demonstrate this
finding, we first compute the fraction of switches in the DCN that
have at least one link with a high corruption loss rate, i.e., in the
set of the worst 10% of corrupting links. We then simulate a hypo-
thetical setting in which the same number of corrupting links are
randomly spread through the network, and again compute the frac-
tion of switches to which they belong. We then calculate the ratio
of the two switch fractions. For example, let’s say x% of switches
contain the worst 10% of corrupting links. If those corrupting links
are uniformly distributed, y% of switches will contain them. Then
the ratio isxy . If the ratio is 1, it suggests that corrupting links are
scattered randomly across the switches. Lower ratios indicate more
co-location with switches.
We repeat this analysis for 100 different values, between 0 and
100%, for the set of corrupting links chosen, and we also repeat
the analysis for congested links. As Figure 4 shows, for congestion,
the number of affected switch is only 20% of what the random
distribution suggests. This means congested links exhibit a high
degree of spatial locality. For corruption, this ratio is around 80%,
which indicates weak spatial locality. We can also see that when we
focus on the worst corrupting links (e.g., the top 10%), the locality
Figure 4: Links with packet corruption have weak locality.
(a) Corruption (b) Congestion
Figure 5: Corruption is highly asymmetric. 5a shows corrup-tion loss rate at x-axis and the corruption loss rate on theopposite direction at y-axis. 5b is a similar figure for conges-tion loss rate.
is weaker. Thus, the worst offenders are more likely to be randomly
spread in the network.
While we expected congestion to exhibit locality, the locality
(albeit weak) of corruption surprised us. As we show in §4, it occurs
because of shared root causes (e.g., bad switch backplane or poorly-
routed fiber bundle). We also found that spatially related links
start corrupting packets roughly the same time and have similar
corruption loss rates. We omit these results from the paper.
Corruption is asymmetric. Corruption in one direction of the link
does not imply corruption in the reverse direction. With a week’s
worth of data, we observed that only 8.2% of the links among links
with packet corruption had bidirectional corruption.3For conges-
tion, 72.7% of links among links with congestion losses had bidi-
rectional losses. For those links with bidirectional losses, Figure 5
shows average packet loss rate on both directions of the link. For
congestion, however, we see a cluster of links for which the conges-
tion loss rates in both directions are similar and large. We speculate
that high, bidirectional congestion is caused by link failures that
temporarily reduce network capacity for both upstream and down-
stream traffic.
Corruption is uncorrelated with link location. Corruption happensat every stage of the DCN topology. We computed the probability
that a link is corrupting for each stage of the network (e.g., ToR-to-
aggregation, aggregation-to-ToR, aggregation-to-spine), and we did
not observe any bias. This observation also implies that corruption
3This asymmetry implies that a more efficient way (in terms of network capacity)
to mitigate corruption would be to disable only one direction of the link, but since
current hardware and software does not allow unidirectional links, we disable both
directions in CorrOpt.
Understanding and Mitigating Packet Corruptionin Data Center Networks SIGCOMM ’17, August 21–25, 2017, Los Angeles, CA, USA
does not depend on cable length, since cable lengths at higher
stages tend to be longer, or the type of switch. In contrast, we find
that certain stages of the DCN have significantly fewer congestion
losses than the rest. We find this reduction in congestion losses to
be correlated with the use of deep buffer switches. Shallow buffer
switches in such stages still experience congestion losses.
4 ROOT CAUSES OF CORRUPTIONTo successfully repair a corrupting link, operators need to address
the root cause of corruption. We analyzed over 300 trouble tickets
while monitoring all links’ optical receive power (RxPower) and
transmit power (TxPower), as well as their corruption statistics.4
This tandem monitoring of tickets and link statistics turns up a
set of symptoms that are the most common signature of each root
cause. In §5.2 we use these symptoms to recommend repair actions
to on-site technicians to help them eliminate corruption faster.
Root cause 1: Connector contamination. An optical link consists
of fiber optics cable and a transceiver on each end. Transceivers
convert the signal between electrical and optical domains, and
the fiber carries the optical signal. In fiber optics, the tolerance of
dirt or contamination on a connector is near zero [22]. Airborne
dirt particles may even scratch the connectors permanently if not
removed. Fiber tips or connectors can become contaminated during
installation or maintenance. Patch panels can become contaminated
if they are left open to the air or scrape off foreign particles under
repeated usage. Figure 6a shows an MTP fiber connection with 12
fiber cores. Prior to installation, technicians should inspect each
fiber core manually using a fiber microscope. Figure 6b shows a
magnified image of two cores we inspected using a P5000i Fiber
Microscope [21]. In this case, the device foundmore than five defects
larger than 2 µm in diameter on the right-hand side fiber core and
failed the test on it. Common types of contamination and defects
include dirt, oil, pits, chips, and scratches [13]. Fiber cleaning can
remove dirt and contamination on the connector.
Contamination reduces RxPower which increases the probability
of packet corruption by making it more likely that the transceiver is
unable to decode the signal correctly [38]. Since fiber optics cables
and connectors are unidirectional, we find that the most probable
indicator of contamination is high TxPower on both sides of the
link, with low RxPower along only one direction of the link (i.e.,
the receiving side of corruption). As Figure 7 shows, the packet
corruption of a link jumps at the same time as its RxPower drops,
but the TxPower on the opposite side remains stable. In this case,
cleaning the both sides of the link mitigates the corruption.
Not all forms of contamination cause low RxPower; some cause
backs reflections, where the RxPower remains high but the reflec-
tions interfere with signal decoding. Transceivers do not report
on reflections, and thus we are not able to correctly identify this
root cause all the time. Such limitations of accurate identification
exist for other root causes as well, which is why the accuracy of
our repair recommendations is not 100%.
Root cause 2: Damaged or bent fiber. Cable management is a
tedious task in large fiber plants. A bent or damaged fiber causes
the optical signal to leak out of the fiber, reducing the signal strength
4In modern DCNs, all inter-switch links tend to be optical.
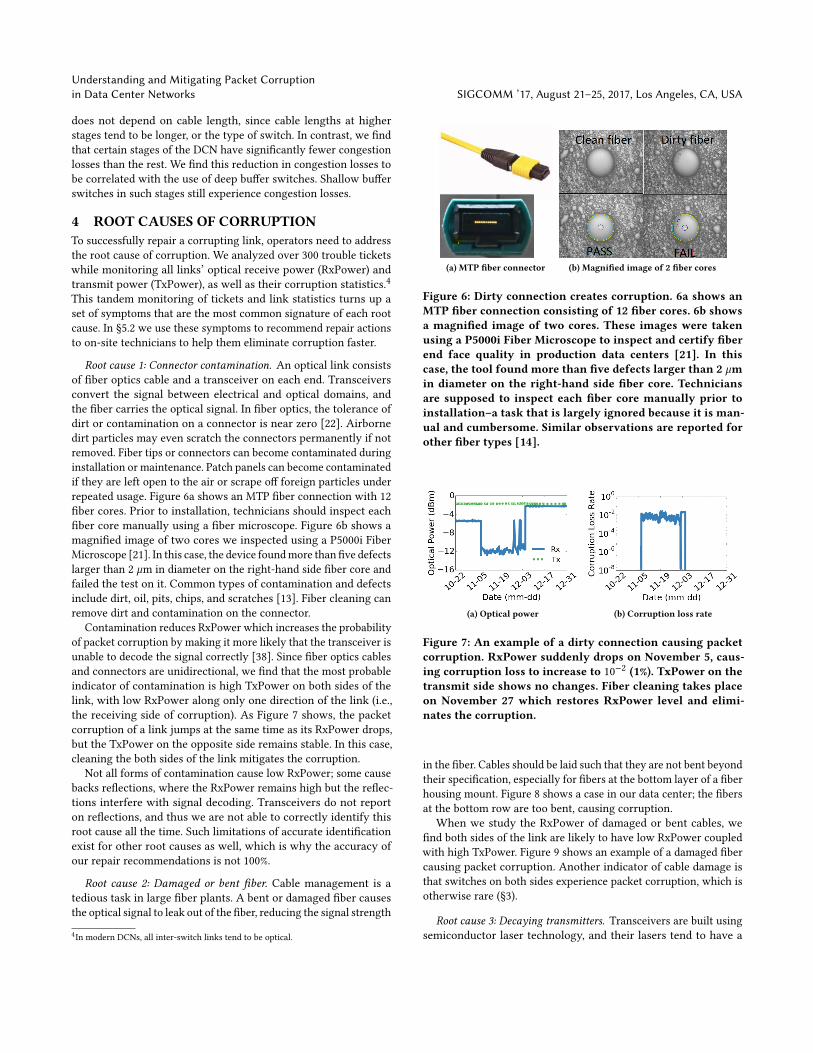
(a) MTP fiber connector (b) Magnified image of 2 fiber cores
Figure 6: Dirty connection creates corruption. 6a shows anMTP fiber connection consisting of 12 fiber cores. 6b showsa magnified image of two cores. These images were takenusing a P5000i Fiber Microscope to inspect and certify fiberend face quality in production data centers [21]. In thiscase, the tool found more than five defects larger than 2 µmin diameter on the right-hand side fiber core. Techniciansare supposed to inspect each fiber core manually prior toinstallation–a task that is largely ignored because it is man-ual and cumbersome. Similar observations are reported forother fiber types [14].
(a) Optical power (b) Corruption loss rate
Figure 7: An example of a dirty connection causing packetcorruption. RxPower suddenly drops on November 5, caus-ing corruption loss to increase to 10
−2 (1%). TxPower on thetransmit side shows no changes. Fiber cleaning takes placeon November 27 which restores RxPower level and elimi-nates the corruption.
in the fiber. Cables should be laid such that they are not bent beyond
their specification, especially for fibers at the bottom layer of a fiber
housing mount. Figure 8 shows a case in our data center; the fibers
at the bottom row are too bent, causing corruption.
When we study the RxPower of damaged or bent cables, we
find both sides of the link are likely to have low RxPower coupled
with high TxPower. Figure 9 shows an example of a damaged fiber
causing packet corruption. Another indicator of cable damage is
that switches on both sides experience packet corruption, which is
otherwise rare (§3).
Root cause 3: Decaying transmitters. Transceivers are built usingsemiconductor laser technology, and their lasers tend to have a
SIGCOMM ’17, August 21–25, 2017, Los Angeles, CA, USA D. Zhuo et al.
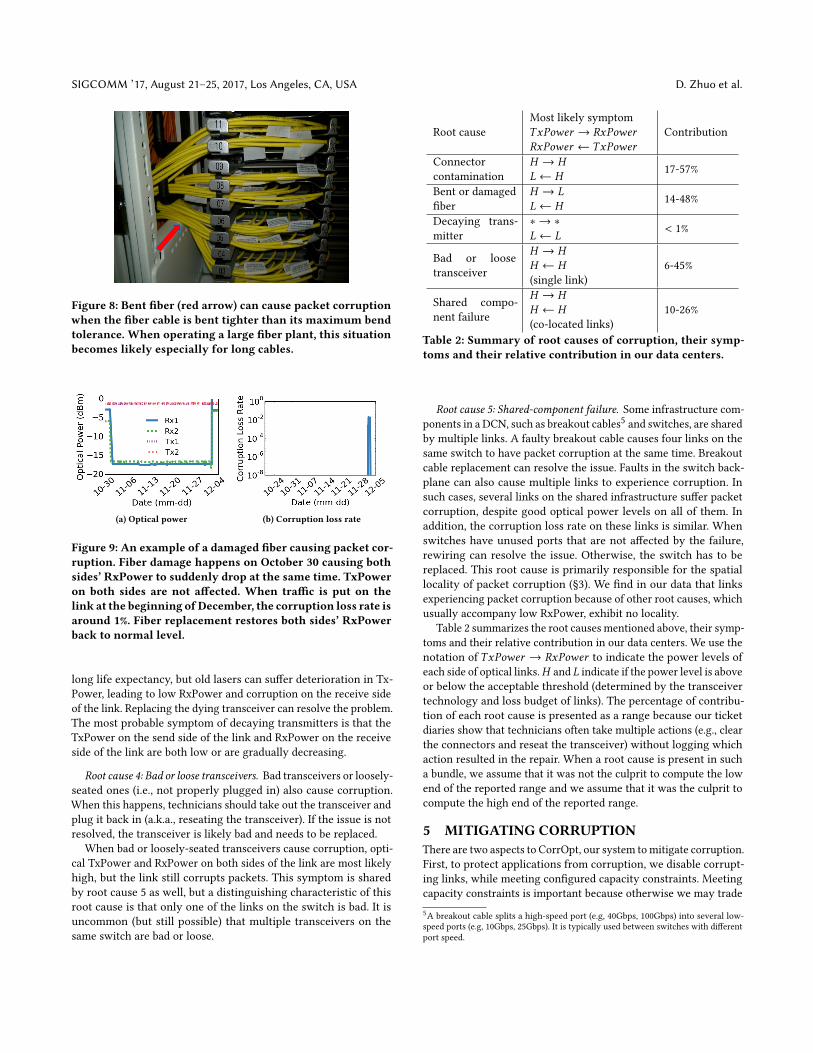
Figure 8: Bent fiber (red arrow) can cause packet corruptionwhen the fiber cable is bent tighter than its maximum bendtolerance. When operating a large fiber plant, this situationbecomes likely especially for long cables.
(a) Optical power (b) Corruption loss rate
Figure 9: An example of a damaged fiber causing packet cor-ruption. Fiber damage happens on October 30 causing bothsides’ RxPower to suddenly drop at the same time. TxPoweron both sides are not affected. When traffic is put on thelink at the beginning ofDecember, the corruption loss rate isaround 1%. Fiber replacement restores both sides’ RxPowerback to normal level.
long life expectancy, but old lasers can suffer deterioration in Tx-
Power, leading to low RxPower and corruption on the receive side
of the link. Replacing the dying transceiver can resolve the problem.
The most probable symptom of decaying transmitters is that the
TxPower on the send side of the link and RxPower on the receive
side of the link are both low or are gradually decreasing.
Root cause 4: Bad or loose transceivers. Bad transceivers or loosely-seated ones (i.e., not properly plugged in) also cause corruption.
When this happens, technicians should take out the transceiver and
plug it back in (a.k.a., reseating the transceiver). If the issue is not
resolved, the transceiver is likely bad and needs to be replaced.
When bad or loosely-seated transceivers cause corruption, opti-
cal TxPower and RxPower on both sides of the link are most likely
high, but the link still corrupts packets. This symptom is shared
by root cause 5 as well, but a distinguishing characteristic of this
root cause is that only one of the links on the switch is bad. It is
uncommon (but still possible) that multiple transceivers on the
same switch are bad or loose.
Root cause
Most likely symptom
TxPower → RxPowerRxPower ← TxPower
Contribution
Connector
contamination
H → HL← H
17-57%
Bent or damaged
fiber
H → LL← H
14-48%
Decaying trans-
mitter
∗ → ∗
L← L< 1%
Bad or loose
transceiver
H → HH ← H(single link)
6-45%
Shared compo-
nent failure
H → HH ← H(co-located links)
10-26%
Table 2: Summary of root causes of corruption, their symp-toms and their relative contribution in our data centers.
Root cause 5: Shared-component failure. Some infrastructure com-
ponents in a DCN, such as breakout cables5and switches, are shared
by multiple links. A faulty breakout cable causes four links on the
same switch to have packet corruption at the same time. Breakout
cable replacement can resolve the issue. Faults in the switch back-
plane can also cause multiple links to experience corruption. In
such cases, several links on the shared infrastructure suffer packet
corruption, despite good optical power levels on all of them. In
addition, the corruption loss rate on these links is similar. When
switches have unused ports that are not affected by the failure,
rewiring can resolve the issue. Otherwise, the switch has to be
replaced. This root cause is primarily responsible for the spatial
locality of packet corruption (§3). We find in our data that links
experiencing packet corruption because of other root causes, which
usually accompany low RxPower, exhibit no locality.
Table 2 summarizes the root causes mentioned above, their symp-
toms and their relative contribution in our data centers. We use the
notation of TxPower → RxPower to indicate the power levels of
each side of optical links.H and L indicate if the power level is aboveor below the acceptable threshold (determined by the transceiver
technology and loss budget of links). The percentage of contribu-
tion of each root cause is presented as a range because our ticket
diaries show that technicians often take multiple actions (e.g., clear
the connectors and reseat the transceiver) without logging which
action resulted in the repair. When a root cause is present in such
a bundle, we assume that it was not the culprit to compute the low
end of the reported range and we assume that it was the culprit to
compute the high end of the reported range.
5 MITIGATING CORRUPTIONThere are two aspects to CorrOpt, our system tomitigate corruption.
First, to protect applications from corruption, we disable corrupt-
ing links, while meeting configured capacity constraints. Meeting
capacity constraints is important because otherwise we may trade
5A breakout cable splits a high-speed port (e.g, 40Gbps, 100Gbps) into several low-
speed ports (e.g, 10Gbps, 25Gbps). It is typically used between switches with different
port speed.

Understanding and Mitigating Packet Corruptionin Data Center Networks SIGCOMM ’17, August 21–25, 2017, Los Angeles, CA, USA
Figure 10: Example of problems with switch-local checking, with ToR capacity constraints of c=60%. (a): Every switch keepssc=c=60% of its uplinks alive, resulting in 8 disabled links, but only 9 out of 25 paths to the spine are still available for T , farbelow the constraint of 60%. (b): When sc=
√c = 0.77 of the links are kept online, the ToR capacity constraint is met, but only 4
links can be disabled. (c): The optimal solution, which has 12 disabled links offline and meets the capacity constraints.
off corruption losses for heavy congestion losses. For practical rea-
sons, we only consider disabling links as a strategy in this paper; it
requires minimal changes to our existing infrastructure. We will
consider other strategies, such as error coding, source routing, or
traffic engineering to move sensitive traffic away from corrupting
links, in future work. That said, any such strategy would still need
to disable corrupting links at some point to enable operators to fix
them. Our strategy to detect and disable corrupting links can be
used in combination with these strategies.
If we rely solely on disabling links for corruption mitigation,
the DCN will have fewer and fewer links as time progresses. In-
stead, we must also fix the root cause of corruption, so links can be
enabled again. Thus, the second aspect of CorrOpt is generating
repair recommendations for disabled links based on root causes
and symptoms described in §4. Our recommendations reduce both
repair time and packet loss (§7.2).
5.1 Disabling Corrupting LinksWhile disabling corrupting links reduces corruption losses, it also
reduces network capacity. In the extreme cases, especially because
of the locality of corrupting links, blindly disabling links can create
hotspots, and, hence, engender heavy congestion losses; it may
even partition the network.
To lower corruption losses without creating heavy congestion,
we consider a common capacity metric [24, 29, 34]: the fraction
of available valley-free paths from a top-of-rack switch (ToR) to
the highest stage of the network (i.e., the spine). This metric quan-
tifies available capacity and redundancy for a ToR after links are
disabled. Because traffic demand can differ across ToRs [17], we
allow per-ToR thresholds. Our data show up to 15% of corrupting
links cannot be disabled due to capacity constraints under real-
istic configurations (e.g., when every ToR has threshold between
50–75%).
CorrOpt determines the subset of links to disable based on the
impact of corrupting links that remain active. Each link l withpacket corruption rate of fl has impact I (fl ), where I (.) is a mono-
tonically increasing penalty function that reflects the relation-
ship between application performance and loss rate [27, 36]. Cor-
rOpt aims to minimize the total penalty of packet corruption, i.e.,∑l ∈links(1 − dl ) × I (fl ), where dl is 1 if the link is disabled and 0
otherwise. Our goal is to determine the value of dl for each link l ,while meeting capacity constraints.
However, as we prove in Appendix A (via reduction to 3-SAT)
this problem is computationally difficult.6
Theorem 5.1. Deciding which links to disable in a Clos topology,s.t. the total penalty of packet corruption is minimized under capacityconstraints, is NP-complete.
Because of the complexity, we cannot quickly determine the optimal
set of links to disable. Speed is desirable to protect applications from
corruption, but it is not possible to be both fast and optimal.
State-of-the-art: switch-local checking. Current DCN operators
opt for speed [26]. When a new corrupting link is found, a controller
decides whether it can be disabled based on the number of available
uplinks at the switch to which it is attached. For a threshold of
sc and a switch withm uplinks, ⌊m × (1 − sc )⌋ of the uplinks canbe disabled. For example, with m = 5 uplinks and sc = 60%, at
most two uplinks can be disabled. When a link is enabled, after
repairing corruption or other problems, the same check is run for
all active corrupting links to see if additional links, which could
not be disabled before, can be disabled now.
Unfortunately, switch-local checks are highly sub-optimal. Fig-
ure 10 shows an example, where T is a ToR with five uplinks, to
switches (A through E) that also have five uplinks each. Corrupting
links are in red, and dashed lines represent disabled links. Suppose
we want to enforce a per-ToR capacity constraint of c=60%. If wedirectly map c to the switch-local constraint, i.e., sc=c , Figure 10(a)shows the network state that will emerge. The direct mapping leads
to disabling eight corrupting links. However, ToR T now has only
nine of 25 (36%) possible paths to the spine, far below the desired
limit of 60%.
This problem can be fixed by enforcing a switch-local capacity
constraint of sc =√c = 0.77 because this forces c fraction of
paths to the core switches to be available. But now, as shown in
Figure 10(b), each switch can disable only one corrupting uplink,
for a total of four disabled links (out of a total of 16 corrupting links).
The optimal solution, however, shown in Figure 10(c), can disable
as many as 12 corrupting links, for a much lower total penalty due
to active corrupting links.
Generalizing the example above, in a simple ToR-aggregation-
spine-topology, a capacity constraint of c requires every switch
to keep
√c of its uplinks. Otherwise, the capacity constraint can
be violated. The gap widens when the DCN has more tiers: with rtiers above the ToR-level, a switch-local algorithm needs to keep
r√c fraction of uplinks active.
6The NP-hard problem stated in [9] is orthogonal to our formulation, as it moves
logical machines between physical machines.
SIGCOMM ’17, August 21–25, 2017, Los Angeles, CA, USA D. Zhuo et al.
Another limitation of a switch-local checker is that it cannot
handle different ToR requirements well. If one ToR has a high
capacity requirement c ′, all upstream switches need to keepr√c ′
uplinks active. A switch-local checker may not be able to disable a
single link in extreme cases.
CorrOpt’s approach. CorrOpt achieves both speed and optimality
using a two-pronged approach. First, when a new corrupting link
is found, it runs a fast checker for a quick response that exploits
global network state to bypass the sub-optimality of switch-local
checking. Second, when links become active, CorrOpt runs an op-timizer that globally optimizes over all active corrupting links in
the network. Link activations allow other remaining corrupting
links to be turned off. Those links tend to have lower loss rates than
newly arrived corrupting link due to the fast checker disabling lossy
links, which gives us time to solve a hard problem. By analyzing the
failure structures in our data set, we are able to efficiently solve the
practical instances of this NP-complete problem. We now provide
more detail on the two components.
Fast checker. Conceptually, when a new corrupting link l arrives,CorrOpt counts the remaining paths for each ToR to the spine
assuming l is removed from the topology. If no ToR’s constraint is
violated, CorrOpt disables l and creates a maintenance ticket for it
with a recommended repair. This process is repeated for each new
corrupting link. As long as no link is activated since its last run,
the network state after the fast checker runs is maximal, i.e., no
more links can be disabled. If no link was activated since the last
run of the fast checker, the optimizer must have left the network
in a maximal state. Thus, we never need to run fast checker on old
corrupting links that could not be disabled earlier.
Because of its exact counting of paths, our fast checker can dis-
able more links than switch-local checking. A naive implementation
of the fast checker is to iterate over all the path from ToR switches
to the spine switches in order to count the number of available
paths for each ToR. The naive implementation is slow because a
large data center network can possibly have over millions of paths.
Using information about all links E in the DCN, we efficiently im-
plement CorrOpt’s fast checker as follows. First, for each switch v2in the second-highest stage, we count the active (one-hop) paths
p1(v2) to the spine (i.e., the highest stage). Then, each switch v3in the third-highest stage adds p1(v2) to each of its active uplinks,
obtaining the number of two-hop paths p2(v3) to the spine. This
process is iterated until the ToR-stage is reached.
With this information, to see if l can be safely disabled, we
check the downstream of l , updating the path counts with the same
method, beginning with the switch directly downstream of l . If alldownstream ToRs of l meet the capacity constraints with l offline,
l is disabled. Conceptually, we perform O(1) operations per link,resulting in a linear runtime of O(|E |). In our experiments, the
fast checker takes only 100-300 ms for the largest DCN, effectively
providing instantaneous decisions.
Optimizer. When a link is enabled, one option is to rerun the fast
checker on all active corrupting links, as is done today in switch-
local checks. However, we can now afford to run a potentially-
slower computation to determine the optimal subset of links to
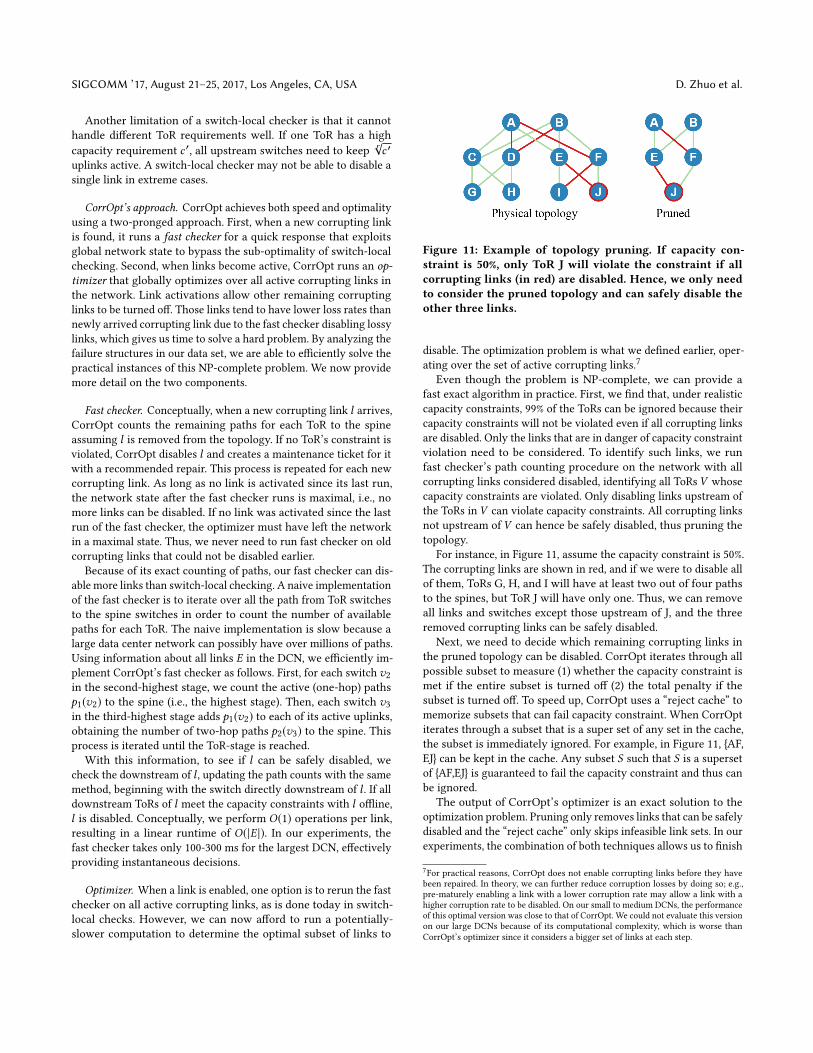
Figure 11: Example of topology pruning. If capacity con-straint is 50%, only ToR J will violate the constraint if allcorrupting links (in red) are disabled. Hence, we only needto consider the pruned topology and can safely disable theother three links.
disable. The optimization problem is what we defined earlier, oper-
ating over the set of active corrupting links.7
Even though the problem is NP-complete, we can provide a
fast exact algorithm in practice. First, we find that, under realistic
capacity constraints, 99% of the ToRs can be ignored because their
capacity constraints will not be violated even if all corrupting links
are disabled. Only the links that are in danger of capacity constraint
violation need to be considered. To identify such links, we run
fast checker’s path counting procedure on the network with all
corrupting links considered disabled, identifying all ToRs V whose
capacity constraints are violated. Only disabling links upstream of
the ToRs in V can violate capacity constraints. All corrupting links
not upstream of V can hence be safely disabled, thus pruning the
topology.
For instance, in Figure 11, assume the capacity constraint is 50%.
The corrupting links are shown in red, and if we were to disable all
of them, ToRs G, H, and I will have at least two out of four paths
to the spines, but ToR J will have only one. Thus, we can remove
all links and switches except those upstream of J, and the three
removed corrupting links can be safely disabled.
Next, we need to decide which remaining corrupting links in
the pruned topology can be disabled. CorrOpt iterates through all
possible subset to measure (1) whether the capacity constraint is
met if the entire subset is turned off (2) the total penalty if the
subset is turned off. To speed up, CorrOpt uses a “reject cache” to
memorize subsets that can fail capacity constraint. When CorrOpt
iterates through a subset that is a super set of any set in the cache,
the subset is immediately ignored. For example, in Figure 11, {AF,
EJ} can be kept in the cache. Any subset S such that S is a superset
of {AF,EJ} is guaranteed to fail the capacity constraint and thus can
be ignored.
The output of CorrOpt’s optimizer is an exact solution to the
optimization problem. Pruning only removes links that can be safely
disabled and the “reject cache” only skips infeasible link sets. In our
experiments, the combination of both techniques allows us to finish
7For practical reasons, CorrOpt does not enable corrupting links before they have
been repaired. In theory, we can further reduce corruption losses by doing so; e.g.,
pre-maturely enabling a link with a lower corruption rate may allow a link with a
higher corruption rate to be disabled. On our small to medium DCNs, the performance
of this optimal version was close to that of CorrOpt. We could not evaluate this version
on our large DCNs because of its computational complexity, which is worse than
CorrOpt’s optimizer since it considers a bigger set of links at each step.

Understanding and Mitigating Packet Corruptionin Data Center Networks SIGCOMM ’17, August 21–25, 2017, Los Angeles, CA, USA
(a)
(b) (d)
(c)
(f)
(g)(e)
Figure 12: An example of unsuccessful repair actions on alink. (a) A healthy state with corruption loss rate below 10
−8.(b) Starts corrupting packets. (c) Disabled for repair. (d) En-abled after the repair but starts corrupting packets again. (e)Disabled again. (f) Enabled after but the repair failed again.(g) Disabled again for repair, and the repair is finally success-ful.
optimizer runs in less than one minute on a 1.3 GHz computer with
2 cores.
5.2 Corruption RepairSimply stated, repairing corruption in today’s DCNs is cumber-
some. Unlike switch configuration errors or congestion, corruption
cannot be remedied via a software-based reaction. For example, as
mentioned in §4, dirt on connectors can cause corruption, and the
only repair is to manually clean the connections. If the root cause
of the corruption is not correctly diagnosed, on-site technicians
must rely on guesswork when deciding what action to take.
Network technicians currently use manual diagnosis. When as-
signed to a ticket, they manually inspect the transceiver and the
fiber to find tight bends or damage. If equipment is not connected
firmly, they reconnect it. If tight bends or damage are found on
the fiber, the technicians replace the fiber. If they cannot find any
problem visually, they may choose to clean the connector with an
optical cleaning kit [30].
If the repair does not address the actual cause of packet corrup-
tion, the link will continue to corrupt packets as soon as the link is
enabled. Figures 7 and 9 show examples of successful repair. In con-
trast, Figure 12 shows a series of two unsuccessful repair attempts.
Both include cleaning the fiber and reseating the transceiver. Fi-
nally, on the third try, the technician replaces the fiber and fixes
the corruption.
This whole process takes several days. In between repair at-
tempts, the link is enabled and a new ticket is generated when it is
disabled again. Generated tickets are placed in a FIFO queue; thus,
the exact time needed for a fix depends on the number of tickets in
the queue. Our analysis of 3400 tickets shows that, on average, it
takes two days for technicians to resolve a ticket; this means, each
failed repair attempt adds two more days during which the link
must be disabled.
Unsuccessful repairs also increase the likelihood of collateral
damage because technicians need to enter the facility more often.
Each entry poses a risk of them affecting something unrelated (e.g.,
Algorithm 1 CorrOpt’s recommendation engine
1: function Recommend Repair(l ink )2: neighbors← links sharing same component (i.e., switch)
3: if has_corruption(neighbors) then4: return Replace shared component
5: if has_corruption(opposite_side) then6: return Replace cable/fiber
7: Rx1← RxPower of link8: Rx2← RxPower of opposite side of link9: Tx2← TxPower of opposite side of link10: if Tx2 ≤ PowerThreshT x then11: return Replace transceiver on the opposite side
12: if Rx1 < PowerThreshRx and Rx2 < PowerThreshRx then13: return Replace cable/fiber
14: if Rx1 < PowerThreshRx then15: return Clean fiber
16: else17: if Transceiver is not reseated recently then18: return Reseat transceiver
19: else20: return Replace transceiver
tripping over cables, replacing the wrong cable or transceiver, or
accidentally powering off equipment).
In CorrOpt, we seek to improve the accuracy of repair by leverag-
ing our observations of the most likely symptoms of corruption root
causes (§4) in terms of optical power levels and the link’s history.
Our strategy is listed in Algorithm 1. It first uses packet corruption
rate on neighboring links to identify shared component failures.
Then it uses TxPower on the opposite side to detect decaying trans-
mitters. CorrOpt uses RxPower to separate optical and non-optical
issues. With non-optical issues, the only solution is to try reseating
the transceiver, and then to replace it.
CorrOpt uses PowerThreshRx (PowerThreshT x ) per optical tech-nology as the minimal RxPower (TxPower) threshold. When both
ends of a link have RxPower below PowerThreshRx , this suggestsbent or damaged fiber. Connector contamination tends to cause
RxPower to be low in one direction. Cleaning connectors with fiber
cleaning kits can often fix corruption.
CorrOpt’s recommendation engine has been deployed in our
DCNs since October 2016. §7.2 evaluates its effectiveness. In our
experience, machine learning techniques can produce similar repair
accuracy. We choose our approach because it is more intuitive.
6 IMPLEMENTATIONFigure 13 shows the workflow and system components of CorrOpt.
When a switch detects packet corruption, it reports to the CorrOpt
controller. The controller uses the fast checker logic to quickly de-
termine if the link can be safely disabled. If the link is disabled, the
recommendation engine (§5.2) generates a ticket with a suggested
repair procedure, based off the monitoring data (collected by an-
other system). When a link is activated, CorrOpt uses the optimizer
logic to check if any active corrupting links can be disabled.
We prototyped fast checker and optimizer with around 500 lines
of python code. We integrated CorrOpt’s recommendation engine
into the cloud provider’s infrastructure with around 50 lines of C#
code.

SIGCOMM ’17, August 21–25, 2017, Los Angeles, CA, USA D. Zhuo et al.
Figure 13: CorrOpt’s system components and workflow.
7 EVALUATIONWe now evaluate CorrOpt for i) its ability to protect applications
by safely disabling corrupting links, while meeting capacity con-
straints; and ii) its ability to speed repairs by correctly identifying
the root cause. The first evaluation uses simulations based on data
from our DCNs, and the second uses our deployment of CorrOpt’s
repair recommendation engine for three months. We study these
two factors individually in §7.1 and §7.2, and we quantify their
combined impact in §7.3.
7.1 Disabling LinksWe simulate the impact of CorrOpt using the topologies and link
corruption traces from two production DCNs, a large DCN with
O(35K) links and a medium-sized DCN with O(15K) links. The trace
period is from Oct to Dec 2016.
We quantify the effectiveness of CorrOpt at disabling links using
“total penalty.” Each corrupting link l with corruption rate fl incursa penalty of I (fl ) per second (§5), and the total penalty per second
is
∑l ∈links(1 − dl ) × I (fl ), where dl is 1 if the link is disabled and 0
otherwise. For simplicity, results in this paper use I (fl ) = fl . Thus,the total penalty is proportional to corruption losses (assuming
equal utilization on all links).
We compare CorrOpt with “switch-local,” the link disabling tech-
nique used today. As we discussed earlier, for this method to guaran-
tee a capacity constraint of c , it should be configured with sc =√c
for three-stage DCNs (which is what we study).
To isolate the impact of link disabling strategy, we couple both
methods with the same repair effectiveness (as CorrOpt’s). When a
link is disabled, it is put into a queue of links that are waiting to
be fixed. Links stay in that queue for two days, the average service
time in our DCNs (§5.2). Based on our observed repair accuracy
(§7.2), 80% of the links are repaired correctly after this time. The
remaining take two rounds of fix, so the overall it takes them four
days to be enabled again.
Figure 14 shows the performance of both methods for the two
DCNs, when the capacity constraint is c=75% for every ToR. The
x-axis is time, and they-axis is total penalty per second. We see that
the penalty of the switch-local checker is much higher, because of its
sub-optimality that we illustrated earlier. It is flat for switch-local
approach because there is a set of corrupting links switch-level
(a) Medium DCN (b) Large DCN
Figure 14: Total penalty per second of switch-local and Cor-rOpt when the capacity constraint is 75% for every ToR.
(a) Medium DCN (b) Large DCN
Figure 15: Fraction of available paths to the spine for theworst ToRs when the capacity constraint is 75%.
(a) Medium DCN (b) Large DCN
Figure 16: Fraction of available paths to the spine for theworst ToRs when the capacity constraint is 50%.
approach is not able to disable and in our model, they corrupt
packets at constant rates. In contrast, CorrOpt can disable the vast
majority of the corrupting links, leading to a much lower penalty.
The penalty varies with time based on the number and relative
locations of corrupting links in the data.
The inability of the switch-local checker to disable links is visi-
ble in Figures 15 and 16, which show the worst ToR’s fraction of
available paths to the spine when the capacity constraint is 75%
and 50%. When lines overlap, it means for some period of time,
performance of CorrOpt is the same of switch-local check. Over-
all, we see that CorrOpt can hit the capacity limit as needed, but
Understanding and Mitigating Packet Corruptionin Data Center Networks SIGCOMM ’17, August 21–25, 2017, Los Angeles, CA, USA
(a) Medium DCN (b) Large DCN
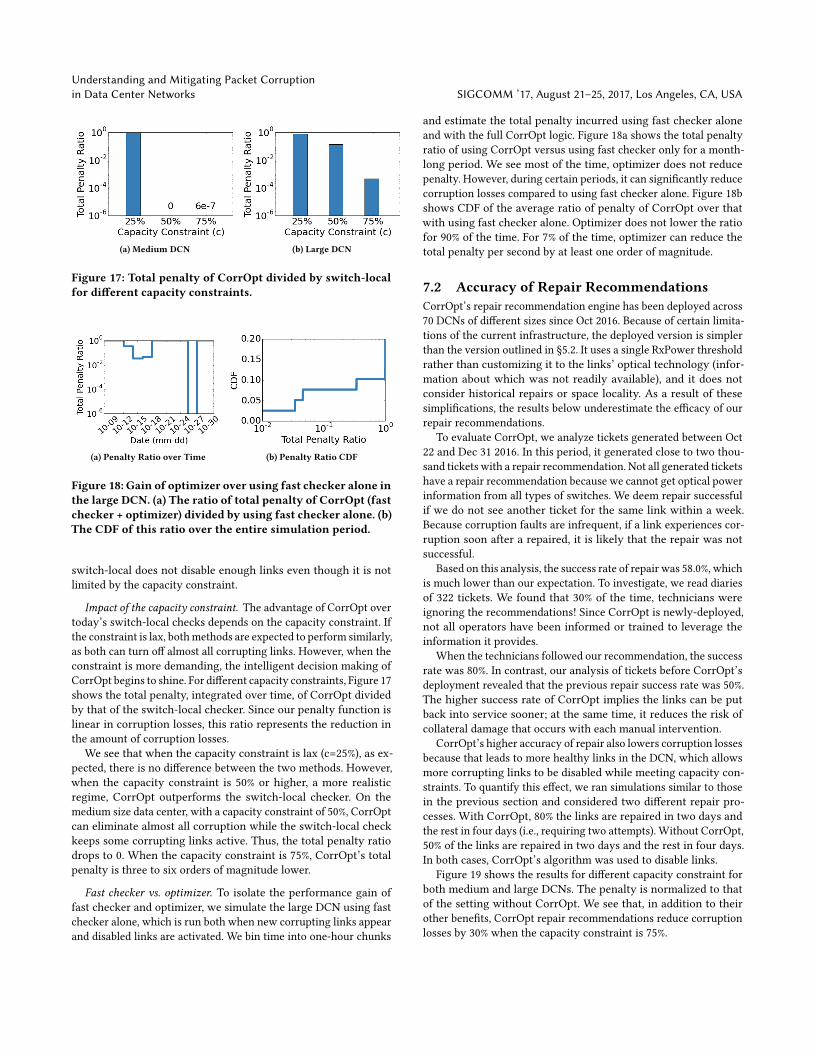
Figure 17: Total penalty of CorrOpt divided by switch-localfor different capacity constraints.
(a) Penalty Ratio over Time (b) Penalty Ratio CDF
Figure 18: Gain of optimizer over using fast checker alone inthe large DCN. (a) The ratio of total penalty of CorrOpt (fastchecker + optimizer) divided by using fast checker alone. (b)The CDF of this ratio over the entire simulation period.
switch-local does not disable enough links even though it is not
limited by the capacity constraint.
Impact of the capacity constraint. The advantage of CorrOpt overtoday’s switch-local checks depends on the capacity constraint. If
the constraint is lax, bothmethods are expected to perform similarly,
as both can turn off almost all corrupting links. However, when the
constraint is more demanding, the intelligent decision making of
CorrOpt begins to shine. For different capacity constraints, Figure 17
shows the total penalty, integrated over time, of CorrOpt divided
by that of the switch-local checker. Since our penalty function is
linear in corruption losses, this ratio represents the reduction in
the amount of corruption losses.
We see that when the capacity constraint is lax (c=25%), as ex-
pected, there is no difference between the two methods. However,
when the capacity constraint is 50% or higher, a more realistic
regime, CorrOpt outperforms the switch-local checker. On the
medium size data center, with a capacity constraint of 50%, CorrOpt
can eliminate almost all corruption while the switch-local check
keeps some corrupting links active. Thus, the total penalty ratio
drops to 0. When the capacity constraint is 75%, CorrOpt’s total
penalty is three to six orders of magnitude lower.
Fast checker vs. optimizer. To isolate the performance gain of
fast checker and optimizer, we simulate the large DCN using fast
checker alone, which is run both when new corrupting links appear
and disabled links are activated. We bin time into one-hour chunks
and estimate the total penalty incurred using fast checker alone
and with the full CorrOpt logic. Figure 18a shows the total penalty
ratio of using CorrOpt versus using fast checker only for a month-
long period. We see most of the time, optimizer does not reduce
penalty. However, during certain periods, it can significantly reduce
corruption losses compared to using fast checker alone. Figure 18b
shows CDF of the average ratio of penalty of CorrOpt over that
with using fast checker alone. Optimizer does not lower the ratio
for 90% of the time. For 7% of the time, optimizer can reduce the
total penalty per second by at least one order of magnitude.
7.2 Accuracy of Repair RecommendationsCorrOpt’s repair recommendation engine has been deployed across
70 DCNs of different sizes since Oct 2016. Because of certain limita-
tions of the current infrastructure, the deployed version is simpler
than the version outlined in §5.2. It uses a single RxPower threshold
rather than customizing it to the links’ optical technology (infor-
mation about which was not readily available), and it does not
consider historical repairs or space locality. As a result of these
simplifications, the results below underestimate the efficacy of our
repair recommendations.
To evaluate CorrOpt, we analyze tickets generated between Oct
22 and Dec 31 2016. In this period, it generated close to two thou-
sand tickets with a repair recommendation. Not all generated tickets
have a repair recommendation because we cannot get optical power
information from all types of switches. We deem repair successful
if we do not see another ticket for the same link within a week.
Because corruption faults are infrequent, if a link experiences cor-
ruption soon after a repaired, it is likely that the repair was not
successful.
Based on this analysis, the success rate of repair was 58.0%, which
is much lower than our expectation. To investigate, we read diaries
of 322 tickets. We found that 30% of the time, technicians were
ignoring the recommendations! Since CorrOpt is newly-deployed,
not all operators have been informed or trained to leverage the
information it provides.
When the technicians followed our recommendation, the success
rate was 80%. In contrast, our analysis of tickets before CorrOpt’s
deployment revealed that the previous repair success rate was 50%.
The higher success rate of CorrOpt implies the links can be put
back into service sooner; at the same time, it reduces the risk of
collateral damage that occurs with each manual intervention.
CorrOpt’s higher accuracy of repair also lowers corruption losses
because that leads to more healthy links in the DCN, which allows
more corrupting links to be disabled while meeting capacity con-
straints. To quantify this effect, we ran simulations similar to those
in the previous section and considered two different repair pro-
cesses. With CorrOpt, 80% the links are repaired in two days and
the rest in four days (i.e., requiring two attempts). Without CorrOpt,
50% of the links are repaired in two days and the rest in four days.
In both cases, CorrOpt’s algorithm was used to disable links.
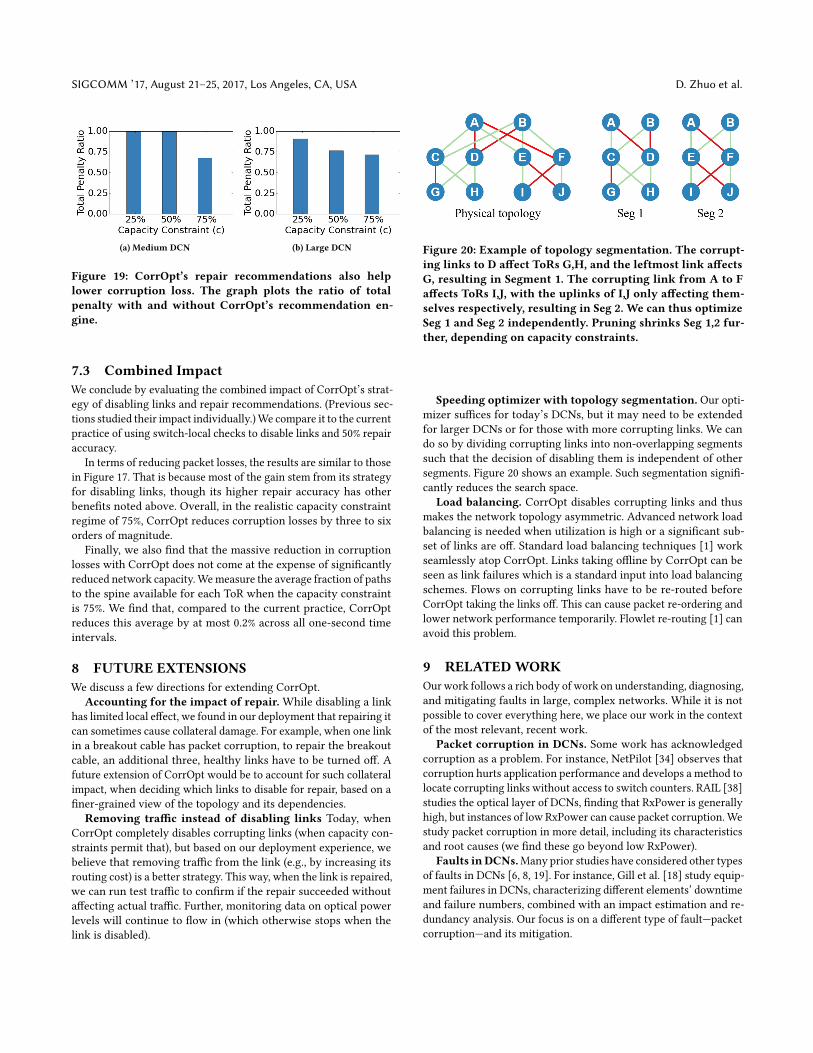
Figure 19 shows the results for different capacity constraint for
both medium and large DCNs. The penalty is normalized to that
of the setting without CorrOpt. We see that, in addition to their
other benefits, CorrOpt repair recommendations reduce corruption
losses by 30% when the capacity constraint is 75%.
SIGCOMM ’17, August 21–25, 2017, Los Angeles, CA, USA D. Zhuo et al.
(a) Medium DCN (b) Large DCN
Figure 19: CorrOpt’s repair recommendations also helplower corruption loss. The graph plots the ratio of totalpenalty with and without CorrOpt’s recommendation en-gine.
7.3 Combined ImpactWe conclude by evaluating the combined impact of CorrOpt’s strat-
egy of disabling links and repair recommendations. (Previous sec-
tions studied their impact individually.)We compare it to the current
practice of using switch-local checks to disable links and 50% repair
accuracy.
In terms of reducing packet losses, the results are similar to those
in Figure 17. That is because most of the gain stem from its strategy
for disabling links, though its higher repair accuracy has other
benefits noted above. Overall, in the realistic capacity constraint
regime of 75%, CorrOpt reduces corruption losses by three to six
orders of magnitude.
Finally, we also find that the massive reduction in corruption
losses with CorrOpt does not come at the expense of significantly
reduced network capacity.Wemeasure the average fraction of paths
to the spine available for each ToR when the capacity constraint
is 75%. We find that, compared to the current practice, CorrOpt
reduces this average by at most 0.2% across all one-second time
intervals.
8 FUTURE EXTENSIONSWe discuss a few directions for extending CorrOpt.
Accounting for the impact of repair. While disabling a link
has limited local effect, we found in our deployment that repairing it
can sometimes cause collateral damage. For example, when one link
in a breakout cable has packet corruption, to repair the breakout
cable, an additional three, healthy links have to be turned off. A
future extension of CorrOpt would be to account for such collateral
impact, when deciding which links to disable for repair, based on a
finer-grained view of the topology and its dependencies.
Removing traffic instead of disabling links Today, when
CorrOpt completely disables corrupting links (when capacity con-
straints permit that), but based on our deployment experience, we
believe that removing traffic from the link (e.g., by increasing its
routing cost) is a better strategy. This way, when the link is repaired,
we can run test traffic to confirm if the repair succeeded without
affecting actual traffic. Further, monitoring data on optical power
levels will continue to flow in (which otherwise stops when the
link is disabled).
Figure 20: Example of topology segmentation. The corrupt-ing links to D affect ToRs G,H, and the leftmost link affectsG, resulting in Segment 1. The corrupting link from A to Faffects ToRs I,J, with the uplinks of I,J only affecting them-selves respectively, resulting in Seg 2. We can thus optimizeSeg 1 and Seg 2 independently. Pruning shrinks Seg 1,2 fur-ther, depending on capacity constraints.
Speeding optimizer with topology segmentation. Our opti-mizer suffices for today’s DCNs, but it may need to be extended
for larger DCNs or for those with more corrupting links. We can
do so by dividing corrupting links into non-overlapping segments
such that the decision of disabling them is independent of other
segments. Figure 20 shows an example. Such segmentation signifi-
cantly reduces the search space.
Load balancing. CorrOpt disables corrupting links and thus
makes the network topology asymmetric. Advanced network load
balancing is needed when utilization is high or a significant sub-
set of links are off. Standard load balancing techniques [1] work
seamlessly atop CorrOpt. Links taking offline by CorrOpt can be
seen as link failures which is a standard input into load balancing
schemes. Flows on corrupting links have to be re-routed before
CorrOpt taking the links off. This can cause packet re-ordering and
lower network performance temporarily. Flowlet re-routing [1] can
avoid this problem.
9 RELATEDWORKOurwork follows a rich body of work on understanding, diagnosing,
and mitigating faults in large, complex networks. While it is not
possible to cover everything here, we place our work in the context
of the most relevant, recent work.
Packet corruption in DCNs. Some work has acknowledged
corruption as a problem. For instance, NetPilot [34] observes that
corruption hurts application performance and develops a method to
locate corrupting links without access to switch counters. RAIL [38]
studies the optical layer of DCNs, finding that RxPower is generally
high, but instances of low RxPower can cause packet corruption.We
study packet corruption in more detail, including its characteristics
and root causes (we find these go beyond low RxPower).
Faults inDCNs.Many prior studies have considered other types
of faults in DCNs [6, 8, 19]. For instance, Gill et al. [18] study equip-
ment failures in DCNs, characterizing different elements’ downtime
and failure numbers, combined with an impact estimation and re-
dundancy analysis. Our focus is on a different type of fault—packet
corruption—and its mitigation.

Understanding and Mitigating Packet Corruptionin Data Center Networks SIGCOMM ’17, August 21–25, 2017, Los Angeles, CA, USA
Fault mitigation. Most work on fault mitigation focuses on
congestion or fail-stop faults, using techniques such as load bal-
ancing and fast rerouting [1, 7, 25, 33, 35]; however, these are less
relevant for corrupting links (e.g., reducing traffic on the link will
not alleviate corruption). RAIL [38] studies a setting where cor-
ruption is the norm (because optical transceivers are used in a
non-conventional manner) and places only loss-tolerant traffic on
corrupting links. We view corruption as an anomaly and mitigate it
by disabling corrupting links, so they can be repaired. zUpdate [24]
and NetPilot [34] depend on knowledge of future traffic demand to
further reduce congestion loss when handling corrupting links or
network update. Those techniques are complementary to CorrOpt’s
link disabling techniques. CorrOpt can work in data center settings
where future traffic demand is not available.
Root cause diagnosis. Using optical-layer characteristics to
diagnose network faults was previously proposed by Kompella
et al. [23]. Ghobadi et al. [16] use optical-layer statistics to help
predict failures in backbone networks. Our work uses an optical-
layer monitor to help determine the root cause of packet corruption
in DCNs.
10 CONCLUSIONOur analysis of packet corruption across many DCNs showed that
the extent of corruption losses is significant. It also showed that,
compared to congestion, corruption impacts fewer links but im-
poses heavier loss rates, and the corruption rate of a link is tempo-
rally stable and uncorrelated to its utilization. CorrOpt, our system
to mitigate corruption, lowers corruption losses by three to six
orders of magnitude by intelligently selecting which corrupting
links to disable while meeting configured capacity constraints. It
also generates repair recommendations that are guided by common
symptoms of different root causes. This recommendation engine
is deployed on all data centers of a large cloud provider, where it
improved the accuracy of repair by 60%.
ACKNOWLEDGMENTSWe thank David Bragg, Jamie Gaudette and Shikhar Suri for help-
ing us design the recommendation engine. We thank Hui Ma and
Shikhar Suri for helping with the deployment of our monitoring
system and the recommendation engine. We also thank our shep-
herd Minlan Yu and the anonymous reviewers for their helpful
feedback on the paper. Klaus-Tycho Förster is supported by the
Danish VILLUM FONDEN project “Reliable Computer Networks
(ReNet)”.
REFERENCES[1] Mohammad Alizadeh, Tom Edsall, Sarang Dharmapurikar, Ramanan
Vaidyanathan, Kevin Chu, Andy Fingerhut, Vinh The Lam, Francis Ma-
tus, Rong Pan, Navindra Yadav, and George Varghese. 2014. CONGA: Distributed
Congestion-aware Load Balancing for Datacenters. In SIGCOMM.
[2] Mohammad Alizadeh, Albert Greenberg, David A. Maltz, Jitendra Padhye,
Parveen Patel, Balaji Prabhakar, Sudipta Sengupta, and Murari Sridharan. 2010.
Data Center TCP (DCTCP). In SIGCOMM.
[3] Mohammad Alizadeh, Abdul Kabbani, Tom Edsall, Balaji Prabhakar, Amin Vahdat,
and Masato Yasuda. 2012. Less is More: Trading a Little Bandwidth for Ultra-low
Latency in the Data Center. In NSDI.[4] Mohammad Alizadeh, Shuang Yang, Milad Sharif, Sachin Katti, Nick McKeown,
Balaji Prabhakar, and Scott Shenker. 2013. pFabric: Minimal Near-optimal Data-
center Transport. In SIGCOMM.
[5] Behnaz Arzani, Selim Ciraci, Boon Thau Loo, Assaf Schuster, and Geoff Outhred.
2016. Taking the Blame Game out of Data Centers Operations with NetPoirot. In
SIGCOMM.
[6] Peter Bailis and Kyle Kingsbury. 2014. The Network is Reliable. Commun. ACM(2014).
[7] Theophilus Benson, Ashok Anand, Aditya Akella, and Ming Zhang. 2011. Mi-
croTE: Fine Grained Traffic Engineering for Data Centers. In CoNEXT.[8] Kashif Bilal, Marc Manzano, Samee U. Khan, Eusebi Calle, Keqin Li, and Albert Y.
Zomaya. 2013. On the Characterization of the Structural Robustness of Data
Center Networks. IEEE Trans. Cloud Computing (2013).
[9] Peter Bodík, Ishai Menache, Mosharaf Chowdhury, Pradeepkumar Mani, David A.
Maltz, and Ion Stoica. 2012. Surviving Failures in Bandwidth-constrained Data-
centers. In SIGCOMM.
[10] Neal Cardwell, Yuchung Cheng, C. Stephen Gunn, Soheil Hassas Yeganeh, and
Van Jacobson. 2016. BBR: Congestion-Based Congestion Control. ACM Queue(2016).
[11] J. D. Case, M. Fedor, M. L. Schoffstall, and J. Davin. 1990. Simple Network
Management Protocol (SNMP). (1990).
[12] Nandita Dukkipati, Matt Mathis, Yuchung Cheng, and Monia Ghobadi. 2011.
Proportional Rate Reduction for TCP. In IMC.[13] FiberStore. 2017. Fiber Optic Inspection Tutorial. http://www.fs.com/
fiber-optic-inspection-tutorial-aid-460.html. (2017).
[14] Fiber for Learning. 2017. Fiber Hygiene. http://fiberforlearning.com/welcome/
2010/09/20/connector-cleaning/. (2017).
[15] M. R. Garey and David S. Johnson. 1979. Computers and Intractability: A Guide tothe Theory of NP-Completeness. W. H. Freeman.
[16] Monia Ghobadi and Ratul Mahajan. 2016. Optical Layer Failures in a Large
Backbone. In IMC.[17] Monia Ghobadi, Ratul Mahajan, Amar Phanishayee, Nikhil Devanur, Janard-
han Kulkarni, Gireeja Ranade, Pierre-Alexandre Blanche, Houman Rastegarfar,
Madeleine Glick, and Daniel Kilper. 2016. ProjecToR: Agile Reconfigurable Data
Center Interconnect. In SIGCOMM.
[18] Phillipa Gill, Navendu Jain, and Nachiappan Nagappan. 2011. Understanding
Network Failures in Data Centers: Measurement, Analysis, and Implications. In
SIGCOMM.
[19] Ramesh Govindan, Ina Minei, Mahesh Kallahalla, Bikash Koley, and Amin Vahdat.
2016. Evolve or Die: High-Availability Design Principles Drawn from Googles
Network Infrastructure. In SIGCOMM.
[20] Peter Hoose. 2011. Monitoring and Troubleshooting, One Engineer’s rant. https:
//www.nanog.org/meetings/nanog53/presentations/Monday/Hoose.pdf. (2011).
[21] JDSU. 2017. P5000i Fiber Microscope. http://www.viavisolutions.com/en-us/
products/p5000i-fiber-microscope. (2017).
[22] Edward John Forrest Jr. 2014. How to Precision Clean All Fiber Optic Connections:A Step By Step Guide. CreateSpace Independent Publishing Platform.
[23] Ramana Rao Kompella, Albert Greenberg, Jennifer Rexford, Alex C. Snoeren, and
Jennifer Yates. 2005. Cross-layer Visibility as a Service. In HotNets.[24] Hongqiang Harry Liu, Xin Wu, Ming Zhang, Lihua Yuan, Roger Wattenhofer,
and David A. Maltz. 2013. zUpdate: Updating Data Center Networks with Zero
Loss. In SIGCOMM.
[25] Vincent Liu, Daniel Halperin, Arvind Krishnamurthy, and Thomas Anderson.
2013. F10: A Fault-Tolerant Engineered Network. In NSDI.[26] David Maltz. 2016. Keeping Cloud-Scale Networks Healthy. https://video.mtgsf.
com/video/4f277939-73f5-4ce8-aba1-3da70ec19345. (2016).
[27] Jitendra Padhye, Victor Firoiu, Don Towsley, and Jim Kurose. 1998. Modeling
TCP Throughput: A Simple Model and Its Empirical Validation. In SIGCOMM.
[28] Jonathan Perry, Amy Ousterhout, Hari Balakrishnan, Devavrat Shah, and Hans
Fugal. 2014. Fastpass: A Centralized "Zero-queue" Datacenter Network. In SIG-COMM.
[29] Peng Sun, Ratul Mahajan, Jennifer Rexford, Lihua Yuan, Ming Zhang, and Ahsan
Arefin. 2014. A Network-state Management Service. In SIGCOMM.
[30] USConec. 2017. Single Fiber Cleaning Tools. http://www.usconec.com/products/
cleaning_tools/ibc_brand_cleaners_for_single_fiber_connections.htm. (2017).
[31] Balajee Vamanan, Jahangir Hasan, and T.N. Vijaykumar. 2012. Deadline-aware
Datacenter TCP (D2TCP). In SIGCOMM.
[32] Christo Wilson, Hitesh Ballani, Thomas Karagiannis, and Ant Rowtron. 2011. Bet-
ter Never Than Late: Meeting Deadlines in Datacenter Networks. In SIGCOMM.
[33] Damon Wischik, Costin Raiciu, Adam Greenhalgh, and Mark Handley. 2011.
Design, Implementation and Evaluation of Congestion Control for Multipath
TCP. In NSDI.[34] XinWu, Daniel Turner, George Chen, Dave Maltz, Xiaowei Yang, Lihua Yuan, and
Ming Zhang. 2012. NetPilot: Automating Datacenter Network Failure Mitigation.
In SIGCOMM.
[35] Kyriakos Zarifis, Rui Miao, Matt Calder, Ethan Katz-Bassett, Minlan Yu, and
Jitendra Padhye. 2014. DIBS: Just-in-time Congestion Mitigation for Data Centers.
In EuroSys.[36] Yibo Zhu, Haggai Eran, Daniel Firestone, Chuanxiong Guo, Marina Lipshteyn,
Yehonatan Liron, Jitendra Padhye, Shachar Raindel, Mohamad Haj Yahia, and
Ming Zhang. 2015. Congestion Control for Large-Scale RDMA Deployments. In
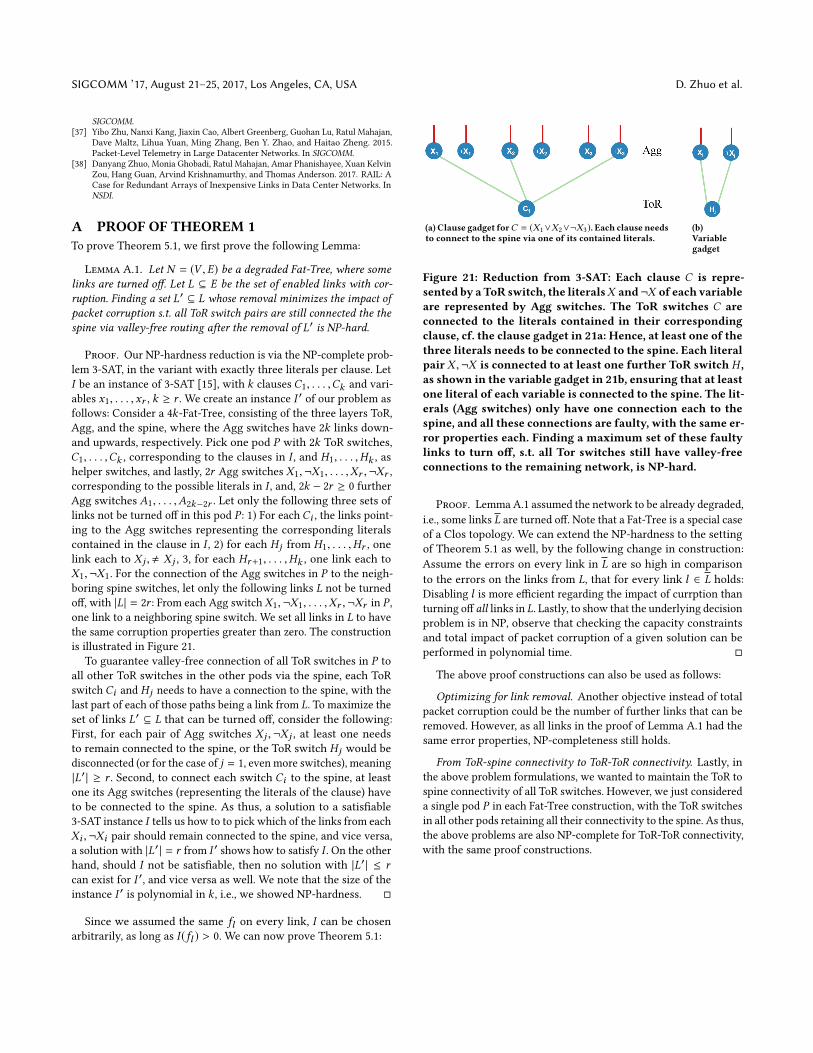
SIGCOMM ’17, August 21–25, 2017, Los Angeles, CA, USA D. Zhuo et al.
SIGCOMM.
[37] Yibo Zhu, Nanxi Kang, Jiaxin Cao, Albert Greenberg, Guohan Lu, Ratul Mahajan,
Dave Maltz, Lihua Yuan, Ming Zhang, Ben Y. Zhao, and Haitao Zheng. 2015.
Packet-Level Telemetry in Large Datacenter Networks. In SIGCOMM.
[38] Danyang Zhuo, Monia Ghobadi, Ratul Mahajan, Amar Phanishayee, Xuan Kelvin
Zou, Hang Guan, Arvind Krishnamurthy, and Thomas Anderson. 2017. RAIL: A
Case for Redundant Arrays of Inexpensive Links in Data Center Networks. In
NSDI.
A PROOF OF THEOREM 1To prove Theorem 5.1, we first prove the following Lemma:
Lemma A.1. Let N = (V ,E) be a degraded Fat-Tree, where somelinks are turned off. Let L ⊆ E be the set of enabled links with cor-ruption. Finding a set L′ ⊆ L whose removal minimizes the impact ofpacket corruption s.t. all ToR switch pairs are still connected the thespine via valley-free routing after the removal of L′ is NP-hard.
Proof. Our NP-hardness reduction is via the NP-complete prob-
lem 3-SAT, in the variant with exactly three literals per clause. Let
I be an instance of 3-SAT [15], with k clauses C1, . . . ,Ck and vari-
ables x1, . . . ,xr , k ≥ r . We create an instance I ′ of our problem as
follows: Consider a 4k-Fat-Tree, consisting of the three layers ToR,
Agg, and the spine, where the Agg switches have 2k links down-
and upwards, respectively. Pick one pod P with 2k ToR switches,
C1, . . . ,Ck , corresponding to the clauses in I , and H1, . . . ,Hk , as
helper switches, and lastly, 2r Agg switches X1,¬X1, . . . ,Xr ,¬Xr ,corresponding to the possible literals in I , and, 2k − 2r ≥ 0 further
Agg switches A1, . . . ,A2k−2r . Let only the following three sets of
links not be turned off in this pod P : 1) For eachCi , the links point-ing to the Agg switches representing the corresponding literals
contained in the clause in I , 2) for each Hj from H1, . . . ,Hr , one
link each to X j ,, X j , 3, for each Hr+1, . . . ,Hk , one link each to
X1,¬X1. For the connection of the Agg switches in P to the neigh-
boring spine switches, let only the following links L not be turned
off, with |L| = 2r : From each Agg switchX1,¬X1, . . . ,Xr ,¬Xr in P ,one link to a neighboring spine switch. We set all links in L to have
the same corruption properties greater than zero. The construction
is illustrated in Figure 21.
To guarantee valley-free connection of all ToR switches in P to
all other ToR switches in the other pods via the spine, each ToR
switch Ci and Hj needs to have a connection to the spine, with the
last part of each of those paths being a link from L. To maximize the
set of links L′ ⊆ L that can be turned off, consider the following:
First, for each pair of Agg switches X j ,¬X j , at least one needs
to remain connected to the spine, or the ToR switch Hj would be
disconnected (or for the case of j = 1, even more switches), meaning
|L′ | ≥ r . Second, to connect each switch Ci to the spine, at least
one its Agg switches (representing the literals of the clause) have
to be connected to the spine. As thus, a solution to a satisfiable
3-SAT instance I tells us how to to pick which of the links from each
Xi ,¬Xi pair should remain connected to the spine, and vice versa,
a solution with |L′ | = r from I ′ shows how to satisfy I . On the other
hand, should I not be satisfiable, then no solution with |L′ | ≤ rcan exist for I ′, and vice versa as well. We note that the size of the
instance I ′ is polynomial in k , i.e., we showed NP-hardness. �
Since we assumed the same fl on every link, I can be chosen
arbitrarily, as long as I (fl ) > 0. We can now prove Theorem 5.1:
(a) Clause gadget forC = (X1∨X2∨¬X3). Each clause needsto connect to the spine via one of its contained literals.
(b)Variablegadget
Figure 21: Reduction from 3-SAT: Each clause C is repre-sented by aToR switch, the literalsX and¬X of each variableare represented by Agg switches. The ToR switches C areconnected to the literals contained in their correspondingclause, cf. the clause gadget in 21a: Hence, at least one of thethree literals needs to be connected to the spine. Each literalpair X ,¬X is connected to at least one further ToR switch H ,as shown in the variable gadget in 21b, ensuring that at leastone literal of each variable is connected to the spine. The lit-erals (Agg switches) only have one connection each to thespine, and all these connections are faulty, with the same er-ror properties each. Finding a maximum set of these faultylinks to turn off, s.t. all Tor switches still have valley-freeconnections to the remaining network, is NP-hard.
Proof. Lemma A.1 assumed the network to be already degraded,
i.e., some links L are turned off. Note that a Fat-Tree is a special case
of a Clos topology. We can extend the NP-hardness to the setting
of Theorem 5.1 as well, by the following change in construction:
Assume the errors on every link in L are so high in comparison
to the errors on the links from L, that for every link l ∈ L holds:
Disabling l is more efficient regarding the impact of currption than
turning off all links in L. Lastly, to show that the underlying decision
problem is in NP, observe that checking the capacity constraints
and total impact of packet corruption of a given solution can be
performed in polynomial time. �
The above proof constructions can also be used as follows:
Optimizing for link removal. Another objective instead of total
packet corruption could be the number of further links that can be
removed. However, as all links in the proof of Lemma A.1 had the
same error properties, NP-completeness still holds.
From ToR-spine connectivity to ToR-ToR connectivity. Lastly, inthe above problem formulations, we wanted to maintain the ToR to
spine connectivity of all ToR switches. However, we just considered
a single pod P in each Fat-Tree construction, with the ToR switches
in all other pods retaining all their connectivity to the spine. As thus,
the above problems are also NP-complete for ToR-ToR connectivity,
with the same proof constructions.