Improving Performance What are the planning considerations for improving performance?

1
FINAL TECHNICAL REPORT
March 1, 2013, through August 30, 2014
Project Title: UNDERSTANDING AND IMPROVING THE PERFORMANCE OF
RESIN GROUTED BOLTS
ICCI Project Number: 13/3A-1
Principal Investigator: A.J.S. (Sam) Spearing, Southern Illinois University
Project Manager: Joseph Hirschi, Illinois Clean Coal Institute
ABSTRACT
Falls of ground from the roof and rib continue to be one of the main sources of accidents
in underground mines. This is worse in coal mines because the immediate roof strata are
typically weak and prone to frequent skin failures and even massive failures in some
cases. Industry reports claim that over 1,500 roof falls occur every year in US coal mines.
To minimize or prevent falls of roof, approximately 68 million rock bolts are installed
annually in underground coal mines in the US. Over 90% of primary roof support
involves resin cartridges with rebar so understanding resin cartridge use is critical for safe
ground control. This project investigates the performance of commonly used rock bolts
with resin and suggests optimum product combinations and installation conditions to
improve the performance of fully grouted bolts. It also investigates various laboratory
techniques to simplify and accelerate the evaluation of parametric processes relevant to
resin performance.

2
EXECUTIVE SUMMARY
Installation of roof and rib support in underground coal mines is essential for miner safety
and also represents a significant portion of total mining costs. It is therefore critical that
the performance of these support systems be understood and optimized. This research
project addressed several important aspects of rock bolt support systems and developed
some useful tests to help in understanding and optimizing them.
In situ short encapsulation analyzed for this study show that they cannot be used to
develop pull-out loads in the immediate roof of specific coal seams because the location
of the coal top is not recorded as part of the existing test methodology. This basic
information is needed if a data base of such information is to be created.
Laboratory pull-out tests showed that #6 rebar installed with resin in a 1-inch hole not
only outperforms #5 rebar installed in the same size hole from a load performance point
of view, but is also less adversely affected by variations in rotational speed and spin time.
In addition, rebar with a modified mechanical shell significantly outperformed rebar with
a conventional shell because resin mixing is much better. Regarding cable bolts, indented
cable bolts without bulbs perform as well as conventional cable bolts with bulbs.
Further to an earlier study by Spearing et al. (2013), preliminary tests have shown that
resin creep is in fact an issue and that more testing and research is needed to better
understand this. A test has been developed and proven that can be used to investigate the
effects of glove fingering by combining pull tests with resin hardness tests and the
amount of glove fingering that can be directly measured. The small-scale drill press test
developed as part of this project has proven to be a useful initial testing technique that
reveals effects of a single parameter change (such as resin gel time, rotational time, or
rotational speed) on overall rock bolt performance.
Further research investigating the performance of #7 rebar, glove fingering, and resin
creep is still required.

3
OBJECTIVES
Project objectives were to understand and improve upon the performance of resin grouted
roof bolts. In order to achieve this, the following tasks were undertaken:
Task 1 – In situ Short Encapsulation Tests
It is standard practice to undertake short encapsulation pull-out tests in each layer within
the immediate roof of an underground coal mine. Mine operators and MSHA rely heavily
on this data to develop and approve roof control plans. In previous underground tests, a
high standard deviation was observed in test results suggesting that this issue needed to
be further investigated and analyzed to hopefully improve the test methodology and the
reliability or results.
Task 2 – Laboratory Pull-out Tests
Laboratory testing consisted of pull-out tests with rock bolts using various design
parameters. Rock bolts were anchored in concrete blocks, a basic homogenous and
isotropic material, at Orica’s Ground Support Research Facility located in Bowerston,
Ohio. In addition, an insertion rig built with funding from Frazer and Jones as part of a
previous ICCI project (Spearing, 2009) was used to anchor rebar in steel pipes and then
evaluate resin setting consistency and any presence of glove fingering by cutting pipes in
two pieces to expose the full resin column.
Task 3 – Prototype Production and New Product Acquisition
Various prototypes of new products and systems were produced or obtained for testing.
These included:
#7 Eclipse rebar where the forged head is offset slightly from the central rebar
axis as seen in Figure 1. Traditionally, this style of roof bolt has only been
supplied in #5 rebar. The belief is that the off-set head creates more eccentricity
during installation thus improving mixing.
Mechanical anchor shells with a welded spring washer on the end of the bolt as
seen in Figure 2. This block prevents the expander nut from spinning off the bolt
during installation allowing the bolt to spin more before the resin sets thus mixing
the resin better. It also permits reverse rotation of the bolt.
Indented cable bolts, shown in Figure 3, that also improve resin mixing.
Eccentric installation wrench, shown in Figure 4, which could produce more
eccentricity in the rebar when being spun, which may improve resin mixing.
Task 4 – Prototype and New Product Testing and Evaluation
New products and prototypes were tested at Orica’s Ground Support Research Facility as
well as in some mines.

4
Figure 1: Eclipse rebar with offset forged head.
Figure 2: Modified mechanical rock bolt shell.
Figure 3: Indented cable made by Orica (left) and Bekaert (right).
Welded Spring Washer

5
Figure 4: Standard wrench (left) and eccentric wrench (right).
Additional Tasks
In addition to the original scope of work, the following tasks were also completed:
Develop a small-scale, quick-and-easy laboratory test that replicates full-scale
tests in terms of both testing conditions and test results.
Develop a test to investigate the effect of glove fingering that utilizes the existing
resin insertion rig housed at the Illinois Coal Development Park High Bay
Laboratory located in Carterville, Illinois. This laboratory is part of Southern
Illinois University’s Coal Research Center.
Conduct preliminary resin creep tests.
INTRODUCTION AND BACKGROUND
Rock related safety continues to improve, but still remains a serious concern as shown in
Figure 5 (Pappas, 2014). Mark et al. (2002) reported that over 1,500 falls of roof occur
every year in US coal mines.
Figure 5: Rock fall injuries and fatalities in US coal mines.
0
200
400
600
2000 2005 2010 2015
Inju
ries
Roof Fall
0
2
4
6
8
10
2000 2005 2010 2015
Fata
litie
s
Year
Rib Fall

6
By definition, primary support is any support installed in-cycle (immediately after
mining) and is the first line of defense against rock fall related accidents in coal mines.
Primary rock bolts can be further categorized into either active or passive bolts. An active
rock bolt is tensioned during the installation process while a passive rock bolt is not.
Passive bolts however have a nominal tension induced by the upward pressure exerted by
the rock bolt boom on the rock bolt after spinning and pushing the rock bolt against the
roof. This can induce a tension of around one to two tons in the bolt. The most common
primary resin-grouted rock bolts used for active support are the partially grouted, resin-
assisted, mechanical anchor bolt and the fully grouted tension rebar bolt.
In the most general sense, passive rock bolt systems are favored because they are
cheaper, provide adequate support in most roof strata conditions, and are easier to install.
Nevertheless, active rock bolts, especially those that are fully grouted, are favored in
highly laminated strata and/or in areas with high horizontal stress conditions. That is
because they are thought to better limit rock movement, especially shearing, due to pre-
tensioning on installation although there is still some debate on the matter. In regards to
bolt usage, trends seem to suggest the increasing use of resin-grouted rock bolts, as
shown in Table 1, will continue.
Table 1: Trends in support usage over time in the US (Dolinar and Bhatt, 2000).
Bolt Type Percent of mines
1976 1988 1991 1999
Mechanical anchor 80 35.3 34.1 8
Fully grouted 20 40 48.2 80
Torque-tension - 3.5 4.61 6
Resin-assisted mechanical anchor - 14.1 11.5 5
Combination - 3.5 - 1
Other1 - 3.6 1.5 -
Total2 100 100 100 100
1 Includes both torque-tension and combination bolts.
2 Data may not add to totals shown because of independent rounding.
Rock Bolt Installation Practices and Recommendations (Spearing et al., 2014)
The two most common support scenarios in coal mines are suspension and beam
reinforcement. A third is keying, which is typically not used for primary support as
immediately after installation the immediate roof has not had time to undergo significant
fracturing. Instead, the immediate roof is assumed to be highly laminated in the worst
case. In the suspension method (see Figure 6), the weak and highly laminated immediate
roof is supported by bolt anchorage into the strong roof strata above. Short encapsulation
tests are particularly useful in designing an effective suspension method. If the strong
roof strata are water bearing, then this method may not be suitable because water can be
introduced into the already weak immediate roof, thus causing additional rock support
issues. In the beam reinforcement method (see Figure 7), laminated or bedded strata
layers are held together to effectively create a reinforced single roof beam.

7
Figure 6: The suspension support method.
Figure 7: The beam reinforcement support method.
Installation practices for passive and active bolts are summarized as follows:
To install a traditional fully grouted passive rebar rock bolt, a single resin
cartridge is inserted into the drill hole ahead of the rock bolt. As the rock bolt is
inserted into the drill hole, the resin cartridge bursts. The bolt is then spun for a
specific number of seconds as recommended by the manufacturer to mix the resin.
The bolt is then held in place via the up-thrust of the bolter during which time the
resin sets. Bolt loading is attributed to subsequent rock movement overtime.
For two-speed active torque tension rock bolts, two resin cartridges are inserted
into the drill hole: a small, fast-setting cartridge followed by a larger, slow-setting
cartridge. During bolt installation, the fast resin gels first and then the threaded
bolt is tensioned by tightening a nut on the end of the bolt. This tension is
maintained in the bolt as the slower resin sets. A new development in this method
is a single cartridge containing both fast and slow resins. Having to only install
one cartridge reduces the amount of time the bolter operator is exposed to
unsupported top while inserting the resin. This obviously also improves bolter
productivity.

8
To install a partially grouted, resin-assisted, mechanical anchor rock bolt, a
mechanical shell is attached (during manufacturing) to the end of the rock bolt
that is inserted in the drill hole. The mechanical shell being inserted through the
resin cartridge prevents the resin from filling the full drill hole column and causes
high back pressure that the drill boom must overcome without bending the bolt.
Once fully inserted, the bolt is spun to fix the shell and impart tension, and then
the resin sets locking in place the tension.
Important operational parameters for successful and cost effective use of resin grouted
rock bolts are:
Standard practice is to drill the bolt hole to one inch longer than needed.
The annulus (annular gap) between the rock bolt and the hole is defined as half
the diametric difference between the drill hole diameter and the rock bolt
diameter. Minimizing this can facilitate resin mixing during installation. The
optimum annulus is ⅛ inch and more than ¼ inch should be avoided.
Manufacturers typically recommend 30-40 rotations during bolt installation,
which with typical bolter speeds equates to 3-5 seconds. Fast cartridges are used
so installation time per bolt is minimized.
After spinning the bolt, if it is passive, it is held for several seconds before the
bolter boom is lowered. If it is active with a mechanical shell, it is tensioned
(torqued) immediately. If it is active with two-speed resin, it is held for 3-5
seconds and then torqued by the bolter.
Rebar steel specifications used for manufacturing rock bolts are described in Table 2. The
most common are #5 Grade (Gr) 60 and #6 Gr 60.
Table 2: Specifications for rock bolts and drill holes.
Size and
Steel Grade
Nominal
Diameter
(inches)
Minimum
Yield Stress
(psi)
Recommended
Hole Diameter
(inches)
Annulus
(inches)
#5 Gr 60 ⅝ or 0.625 60,000 1.0 0.188
#6 Gr 40 6/8 (¾) or 0.750 40,000 1.0 0.125
#6 Gr 60 6/8 (¾) or 0.750 60,000 1.0 0.125
#6 Gr 75 6/8 (¾) or 0.750 75,000 1.0 0.125
#7 Gr 40 ⅞ or 0.875 40,000 1.125 or 1.375 0.125 or 0.250
#7 Gr 60 ⅞ or 0.875 60,000 1.125 or 1.375 0.125 or 0.250
#7 Gr 75 ⅞ or 0.875 75,000 1.125 or 1.375 0.125 or 0.250
Spin time is defined as the time required to achieve the ideal mix between resin and
catalyst. It is important because over or under mixing can result in suboptimal resin grout
bonding strength. After mixing, resin reaches ideal strength by hardening over time. Hold
time is defined as the time required between completion of mixing and setting of resin. It
is important for achieving an acceptable interlock (mechanical key) between bolt and
rock wall. Ranges for spin and hold times are given in Table 3.

9
Table 3: Typical spin and hold times.
Gel Time (seconds) Spin Time (seconds) Hold Time (seconds)
10 3 to 5 3 to 8
20 3 to 6 4 to 8
30 3 to 7 8 to 15
60 5 to 10 18 to 28
120 5 to 10 90 to 150
Anchorage failure is one of the main failure mechanisms for fully grouted bolts. As roof
deformation works its way upward, the mechanical key breaks down and most of the load
is concentrated in the upper end of the bolt. If this load becomes more than the anchorage
strength, bolts fail and are pulled out. Based on 30 years of research, it is known that
anchorage failure is the main reason for roof bolt failure where roof rock is weak and roof
support is most critical. Data available in the literature suggest that in soft shale or coal
roof, 20-30 inches of resin anchorage may be required to achieve full bolt capacity. Pull-
out tests are done in order to determine the effective rock bolt length needed in different
strata because certain lengths of the rock bolt need to provide good anchorage within
weaker strata and this anchorage strength exceeds the ultimate strength of the rock bolt.
Despite its importance in properly designing roof control systems, there is no widely
accepted anchorage test for fully grouted bolts. Standard pull tests have sometimes been
employed, but they provide no information on anchorage near the top of the bolt. An
alternative, first described more than 25 years ago in ASTM F432, is the short-
encapsulation pull test (SEPT). With this test, the bolt is installed with only a short (1 ft
or less) encapsulation length of resin. In recent years variations of this test have become
international standards. A schematic of the SEPT method is shown in Figure 8.
Figure 8: Schematic for in situ rock anchor pull testing and SEPT.
10
Large-scale laboratory tests are easier, faster, less disruptive, and safer when compared to
real-time in situ testing, but they are still time and resource consuming. To overcome this
challenge, a drill press was modified and tested for its suitability as a test rig that would
give similar results to those obtained with large-scale short encapsulation tests. This
method is not a replacement test, but can be used to initially establish trends that could be
later quantified with limited full-scale laboratory short encapsulation tests. This prototype
set-up is the cheapest method for analyzing resin performance using bolts of different
diameters.
Another important installation issue is glove fingering. This occurs when the plastic
housing of the cartridge either partially or completely encases the resin column after
installation preventing or reducing, in theory, the ability of the resin column to interlock
with the rock wall of the drill hole. The “gloved” or unmixed portion reduces the
effective anchor length and adversely affects the rock bolt’s ability to reinforce the roof
strata. Glove fingering has been recognized in fully encapsulated bolts for many years
and has been attributed to poor installation methods (Pettibone, 1987).
EXPERIMENTAL PROCEDURES
Short encapsulation pull tests (SEPT) can be done in the laboratory or in situ, but
underground in situ tests are much more difficult to interpret, replicate, and arrange due
to the following:
Immediate roof strata properties vary considerably even over short distances.
The roof does not always have an even, flat surface and installed bolts are not
always perpendicular to the roof. Therefore, during pull tests other (non-axial)
stresses in the support can be generated.
Tests adversely impact mine productivity as a dedicated bolter and operator are
required.
Ready access in to and out from the test site can be a challenge and requires the
escort of mine personnel, who must be present at all times.
For these reasons, evaluating rock bolt performance by way of full-scale tests can be
done more reliably, with greater safety, and more quickly and easily in the laboratory
environment, if one is readily accessible. Fortunately, two were available for this project.
Pull-out Tests at the Bowerston Facility
A collaborative arrangement with Orica, a world-wide supplier of ground control
products, enabled full-scale laboratory testing at their North American Innovation and
Technology Center in Bowerston, Ohio. The laboratory features a commercial bolter
capable of drilling and inserting rock bolts into concrete blocks. The rig is capable of
modifying single insertion parameters to determine their effects. Installed rock bolts are
pull-tested to obtain load versus displacement curves. The failure mechanism in concrete
is obviously not the same as in the bedded immediate roof of an underground coal mine,
but the laboratory provides a safer research environment and offers flexibility with and
control of testing procedures as well as lower costs. The set-up is shown in Figure 9.

11
Figure 9: Orica’s test rig and bolter at the Bowerston, Ohio facility.
The Bowerston facility is capable of installing rock bolts up to four feet in length with
very precise instrumentation on the bolter accurately controlling and monitoring the
following important parameters during each test:
Spin speed – variable in 5 rpm increments.
Spin direction – varied between clockwise, counterclockwise, or both, if needed
(e.g., clockwise first to mix resin, then counterclockwise to tension bolt).
Spin time - variable in 1-second increments
Hold time – variable in 1-second intervals.
Torque – variable in 5 ft-lb increments up to 500 ft-lb maximum.
These effective controls facilitate maintaining a uniform set of procedures for bolt
installation thereby mitigating any operator-related variability that otherwise could be
encountered in an underground testing environment. Further, to ensure reliable results, at
least three tests were performed for each set of parameters.
The following parameters were not changed throughout the testing regimen:
Hole depth was about one inch longer than bolt length providing space for resin
cartridge liner material and clips to migrate to minimizing any influence they
might have on test results. This space also ensures that the rock bolt is fully
inserted into the hole and does not stick out.
Pull-out tests were always done one hour after installation, unless otherwise
noted.

12
Pull-out Tests at the Carterville Facility
A rock bolt insertion rig built with funds from Frazer and Jones as part of a previous
ICCI-funded project (Spearing, 2009) was used to install fully grouted rock bolts into
steel pipes that were then split open so that resin consistency could be investigated. The
test rig, shown in Figure 10, is housed in the High Bay Laboratory at the Illinois Coal
Development Park in Carterville, Illinois. The facility is part of Southern Illinois
University’s Coal Research Center. The rig was designed to be able to install 4-ft rock
anchors (cables or bolts) into 4-ft long steel pipes of 1-in and 1.375-in internal diameters,
which are typical hole diameters drilled for ground control purposes in coal mines. The
cylinder is hydraulically powered and extends at a rate of 0.5 ft/sec. This is close to the
actual installation speed of most commercial bolters. The maximum up-thrust capacity of
the cylinder is 12,370 lbs. The hydraulic power pack came from an old MTS load frame.
Distance is measured using a string potentiometer, if needed.
Figure 10: Insertion rig at the Carterville, Illinois facility.
The test procedure begins by inserting a resin cartridge into a double-walled pipe
representing the drill hole, which is clamped solidly in place in the test rig. The inner wall
has been scored so that it can easily be split open to examine the resin after it has set. The
outer wall is thicker to prevent the inner wall from splitting prematurely. All resin
cartridges tested were from the same batch to ensure consistent viscosity. Next, a bolt is
fitted into the socket attached to the cylinder. Finally, the cylinder is extended to its full
4-ft length and rotated for a pre-determined length of time. Most tests were repeated at
least three times to ensure reliability and repeatability of results.

13
Modified Drill Press Tests
Large-scale laboratory tests might be easier, better controlled, and safer than in situ pull-
out tests, but they are still time and resource consuming. For example, concrete blocks
used at the Bowerston facility must cure for about 28 days after pouring before they can
be mounted in the rig. Only nine tests can be completed in each concrete block. It takes a
minimum of three people at least two days to complete 18 to 27 tests. Therefore, it was
desirable to come up with a small-scale laboratory test that can be done quickly, easily,
and economically to qualitatively represent short encapsulation tests.
At Southern Illinois University’s Carbondale campus, an older conventional drill press
was modified, as shown in Figure 11, to be suitable as a test rig for achieving results
similar to those obtained with large-scale SEPT. Drill presses usually have a stroke length
of less than six inches, which is inadequate for SEPT. Therefore, a mechanical jack (see
right side of Figure 11) was fitted to the base of the drill press onto which the split steel
block could be mounted. This increased stroke length to twelve inches.
A steel block with a 1-inch hole bored through the center was fabricated to simulate the
drill hole. The block is split into two halves axially along the diameter of the hole, as
shown in Figure 12, so that it can be split apart after resin has cured enabling examination
of the resin column. The drill press was used to insert a piece of rebar into a resin
cartridge placed in the 1-inch hole of the split steel box and to spin the rebar to mix the
resin. All rebar used in this test were Grade 60 for comparing with tests conducted at the
Bowerston facility. After resin mixing, the split steel box was set aside to allow the resin
column to cure and strengthen before being removed.
Previous research by Spearing (2009) found that resin hardness appeared related to short
encapsulation pull-out loads such that the higher the average hardness of the resin
column, the higher the pull-out load. Resin hardness can be measured using a durometer,
as shown in Figure 13. The hardness is obtained by pushing a steel pin a fixed distance
into the resin. Depending on the hardness of the resin, a smaller or greater force is
needed, which is recorded on the durometer’s graduated scale and ranges from 0 and 100.
Measurements are taken along the entire length of the resin column at regular intervals.
During initial tests with the modified drill press and split steel block, a mold release was
not used. This approach proved ineffective because the resin adhered to the steel block.
After several trials with different mold release systems, a small amount of grease was
applied on the entire surface of the split steel box, which was then covered with a very
thin plastic sheet. This system was effective in reducing or eliminating the adhesion
effect between steel and resin. Another practical constraint was that the 3-horsepower
motor on the drill press made a 1-foot encapsulation test impossible because a rock bolt
of that length could not fully penetrate the resin cartridge and still be spun at a consistent
speed with any of the resin formulations. Therefore, a 6-inch encapsulation length was
chosen for these tests. Initial tests were performed under the identical conditions to
validate the reliability of the drill press method.

14
Figure 11: Modified drill press (left) with close-up of jack and box (right).
Figure 12: Split steel block.
Figure 13: Durometer for measuring resin hardness.
15
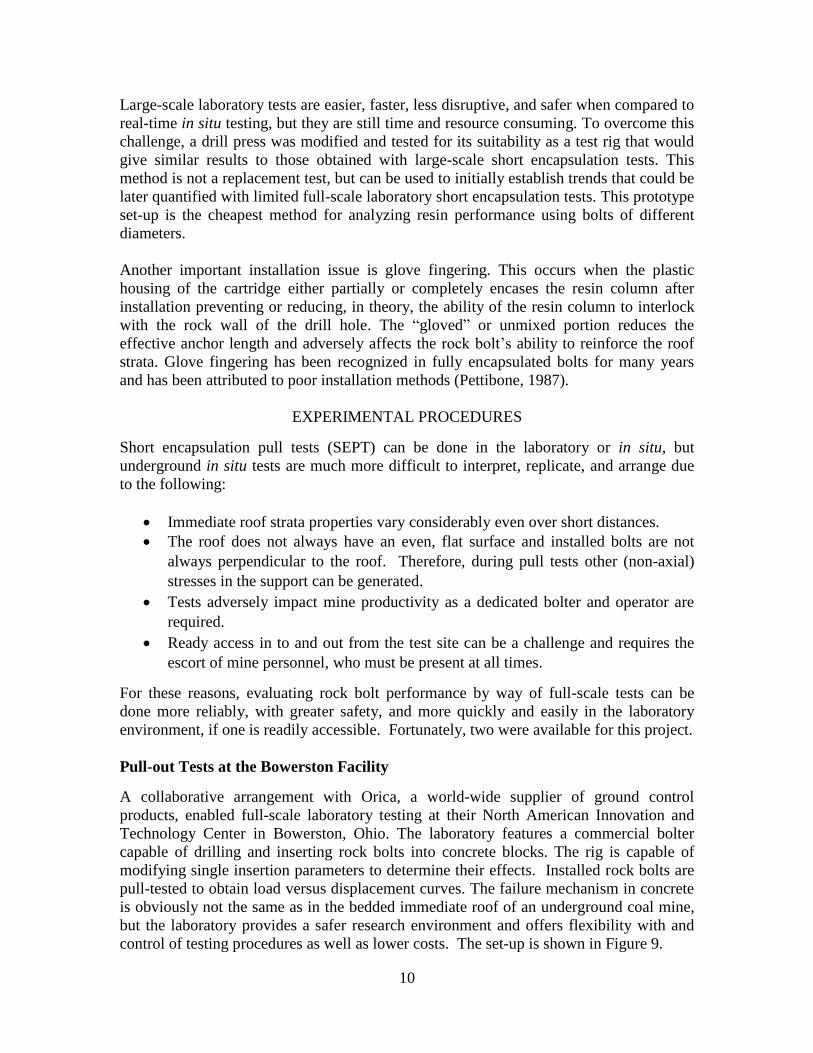
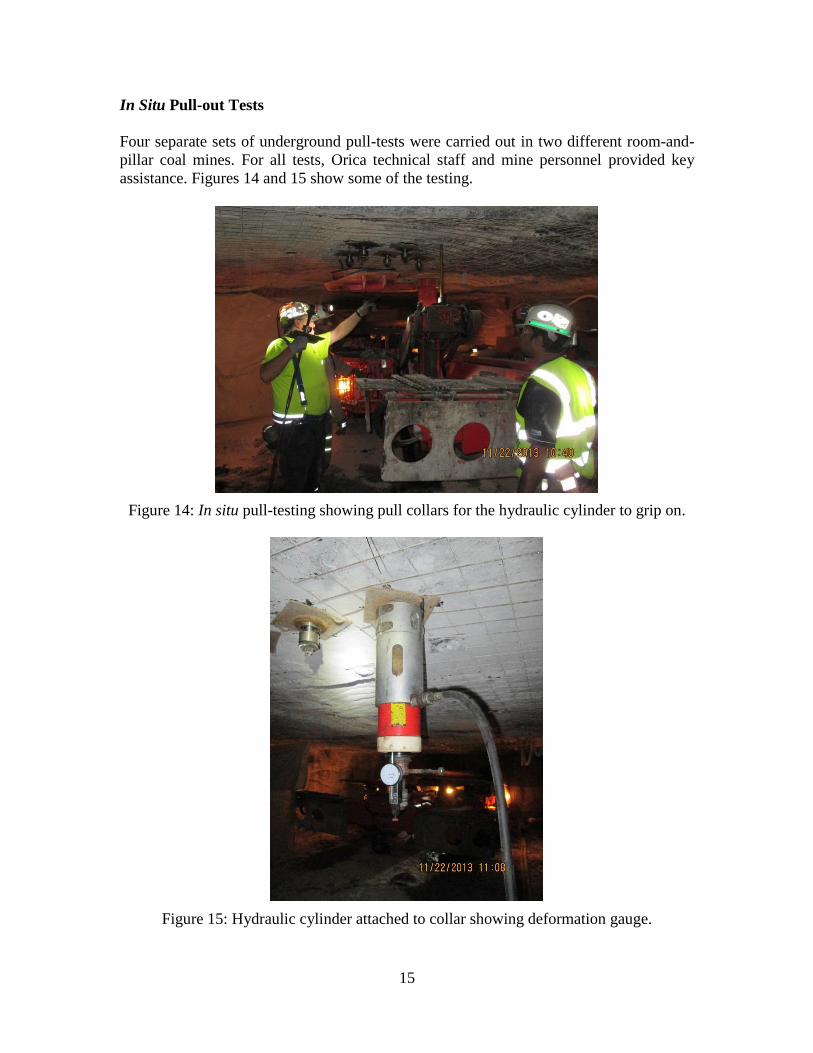
In Situ Pull-out Tests
Four separate sets of underground pull-tests were carried out in two different room-and-
pillar coal mines. For all tests, Orica technical staff and mine personnel provided key
assistance. Figures 14 and 15 show some of the testing.
Figure 14: In situ pull-testing showing pull collars for the hydraulic cylinder to grip on.
Figure 15: Hydraulic cylinder attached to collar showing deformation gauge.

16
Preliminary Creep Tests
Previous research (Spearing et al., 2013) has indicated that resin creep may be an issue
especially in weak rock. Preliminary tests to evaluate resin creep were undertaken as an
additional task for this project. The U-cell is a strain monitoring device developed by Dr.
H. Mitri from McGill University in Montreal, Canada. It is used to monitor strain and
hence stress and load at a single point at the end of a rock bolt. The device is screwed
onto the end of a bolt head, as shown in Figure 16, and is connected to a portable readout
unit. It takes about 10 to 15 minutes for the reading to stabilize, but after that, reliable
readings can be taken at regular intervals. It is reusability makes it quite cost effective.
Figure 16: U-cell instrument.
Calculations to convert measured strain into stresses (and load) are as follows:
If ambient temperature is between 72°F (22oC) and 90°F (32
oC), then P = G (R-Ro);
If ambient temperature is less than 72°F (22oC), then P = G [(R-Ro) - (T-27)(DRDT)];
where T = temperature at the test site, P = load at the U-cell, G = gradient that is obtained
from calibration of each U-Cell, R = readout unit reading after tensioning, R0 = readout
unit initial reading prior to tensioning, and DRDT = rate of change of R with temperature.
Each U-cell is uniquely numbered and has its own calibration curve. For example,
calibration curves for U-cell U34-16 indicate that G = -164.12 (R/kN) and DRDT =
0.00316. For U-cell U34-19, calibration curves indicate that G = -157.62 (R/kN) and
DRDT = 0.003894.
Threaded
Hole
Tensioning
Nut
Locking Nut
to Protect
Connector

17
RESULTS AND DISCUSSION
In Situ Short Encapsulation Pull Test Data Provided by Suppliers
Two of the three major suppliers of rock bolts and resin shared their SEPT data with the
research team. Figure 17 is a compilation of numerous tests conducted in the Illinois
Basin by one of the suppliers. Of specific note is the large variation in deflection and the
variation in pull-out loads. This data, however, did not include rock bolt length so further
analysis was not possible.
Figure 17: SEPTs using #5 rebar in Illinois Basin coal mines.
Information provided by the other supplier was more detailed. Figure 18 shows variation
for the same seam and the same rock bolt length. The large variation in failure load is
self-evident. Some SEPT results obtained from this supplier are shown in Tables 4 and 5;
however, firm conclusions cannot be made because the seam roof location was not
recorded. Hence, results may not be from the same immediate roof location.
Average weighted pull-out tonnage for the 35 SEPTs using #5 Grade 60 rebar shown in
Table 4 is 7.3 tons. This is far less than results achieved at the Bowerston facility, which
averaged about 10 tons. It is believed this is because concrete blocks used at Bowerston
are much stronger than typical immediate mine roof, which is generally shale. Average
weighted pull-out tonnage for the 30 SEPTs using #6 SRD Grade 75 rebar is 9.0 tons.
Typical ultimate tensile failure load is 15 tons.

18
Figure 18: SEPTs using #6 SRD Grade 75 rebar in Indiana 5 seam.
Table 4: SEPT results using #5 Grade 60 rebar.
Seam Rebar
Length (ft) Resin Type
Average Load
(tons)
Average
Displacement
(inches)
Number of
Tests
KY 9 4 H5 7.0 0.22 3
IN 5 4 ? 4.7 0.19 3
IN 5 4 ? 7.0 0.25 2
KY 9 5 H5 9.5 0.42 2
IN 5 5 ? 8.0 0.20 3
IN 5 5 ? 7.0 0.20 2
KY 9 6 H5 8.3 0.39 3
KY 11 6 H5 8.3 0.28 4
IN 5 6 ? 9.0 0.32 2
KY 9 8 H5 7.3 0.29 3
KY 11 8 H5 5.3 0.27 4
KY 11 10 H5 7.3 0.39 4
Table 5: SEPT results using #6 SRD Grade 75 rebar.
Seam Rebar
Length (ft) Resin Type
Average Load
(tons)
Average
Displacement
(inches)
Number of
Tests
IL 6 4 H10 11.5 0.60 6
IN 5 5 ? 5.7 0.35 3
IL 6 6 H10 7.3 0.40 6
IN 5 6 ? 9.3 0.37 3
IN 5 7 ? 8.7 0.29 3
IN 5 8 ? 7.0 0.37 3
IL 6 9 H10 11.0 0.58 6
19
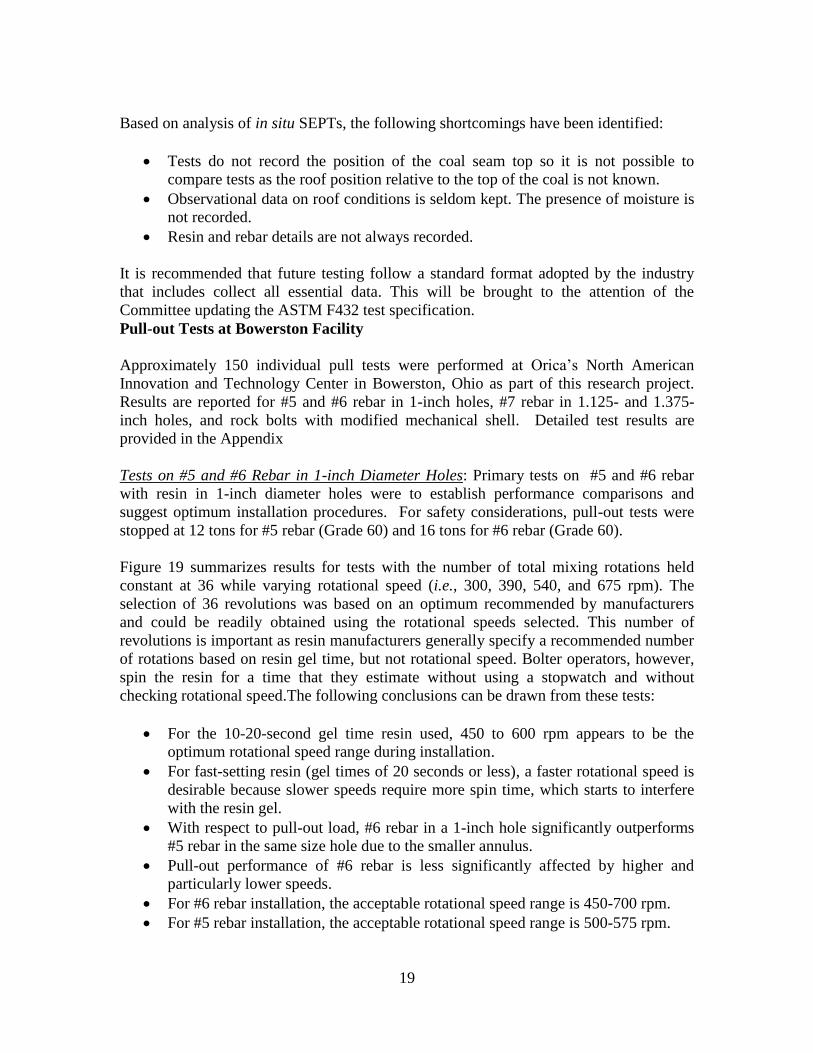
Based on analysis of in situ SEPTs, the following shortcomings have been identified:
Tests do not record the position of the coal seam top so it is not possible to
compare tests as the roof position relative to the top of the coal is not known.
Observational data on roof conditions is seldom kept. The presence of moisture is
not recorded.
Resin and rebar details are not always recorded.
It is recommended that future testing follow a standard format adopted by the industry
that includes collect all essential data. This will be brought to the attention of the
Committee updating the ASTM F432 test specification.
Pull-out Tests at Bowerston Facility
Approximately 150 individual pull tests were performed at Orica’s North American
Innovation and Technology Center in Bowerston, Ohio as part of this research project.
Results are reported for #5 and #6 rebar in 1-inch holes, #7 rebar in 1.125- and 1.375-
inch holes, and rock bolts with modified mechanical shell. Detailed test results are
provided in the Appendix
Tests on #5 and #6 Rebar in 1-inch Diameter Holes: Primary tests on #5 and #6 rebar
with resin in 1-inch diameter holes were to establish performance comparisons and
suggest optimum installation procedures. For safety considerations, pull-out tests were
stopped at 12 tons for #5 rebar (Grade 60) and 16 tons for #6 rebar (Grade 60).
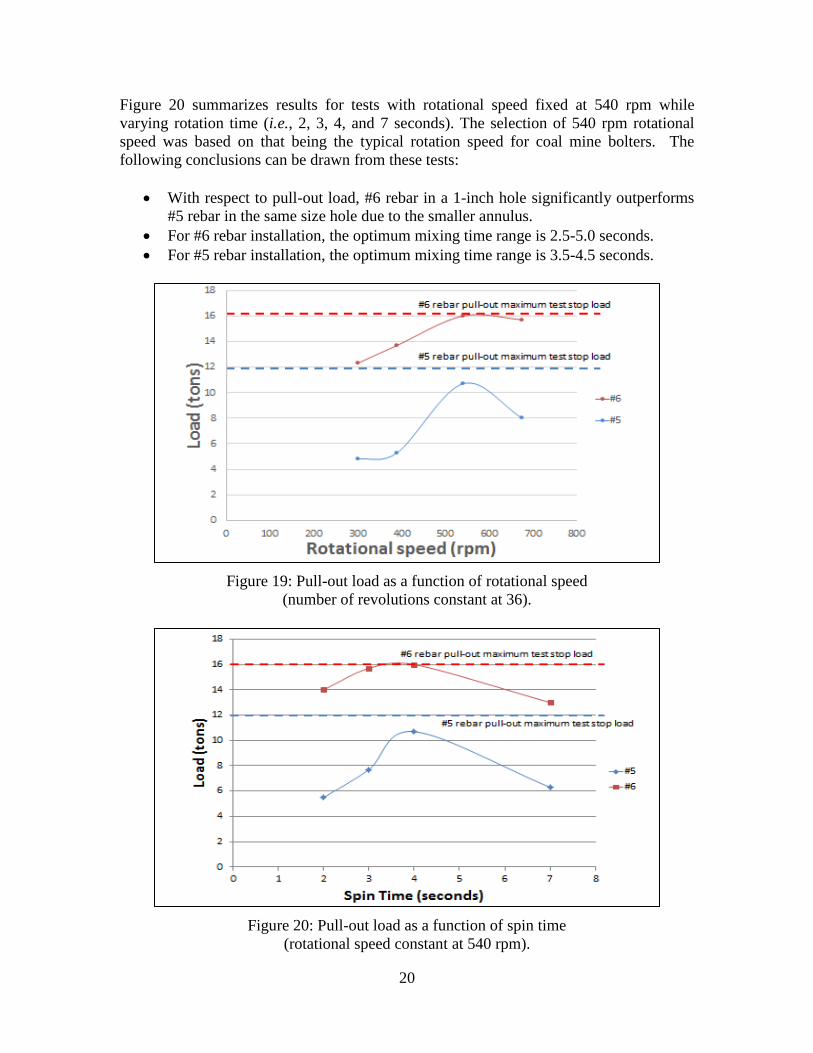
Figure 19 summarizes results for tests with the number of total mixing rotations held
constant at 36 while varying rotational speed (i.e., 300, 390, 540, and 675 rpm). The
selection of 36 revolutions was based on an optimum recommended by manufacturers
and could be readily obtained using the rotational speeds selected. This number of
revolutions is important as resin manufacturers generally specify a recommended number
of rotations based on resin gel time, but not rotational speed. Bolter operators, however,
spin the resin for a time that they estimate without using a stopwatch and without
checking rotational speed.The following conclusions can be drawn from these tests:
For the 10-20-second gel time resin used, 450 to 600 rpm appears to be the
optimum rotational speed range during installation.
For fast-setting resin (gel times of 20 seconds or less), a faster rotational speed is
desirable because slower speeds require more spin time, which starts to interfere
with the resin gel.
With respect to pull-out load, #6 rebar in a 1-inch hole significantly outperforms
#5 rebar in the same size hole due to the smaller annulus.
Pull-out performance of #6 rebar is less significantly affected by higher and
particularly lower speeds.
For #6 rebar installation, the acceptable rotational speed range is 450-700 rpm.
For #5 rebar installation, the acceptable rotational speed range is 500-575 rpm.
20
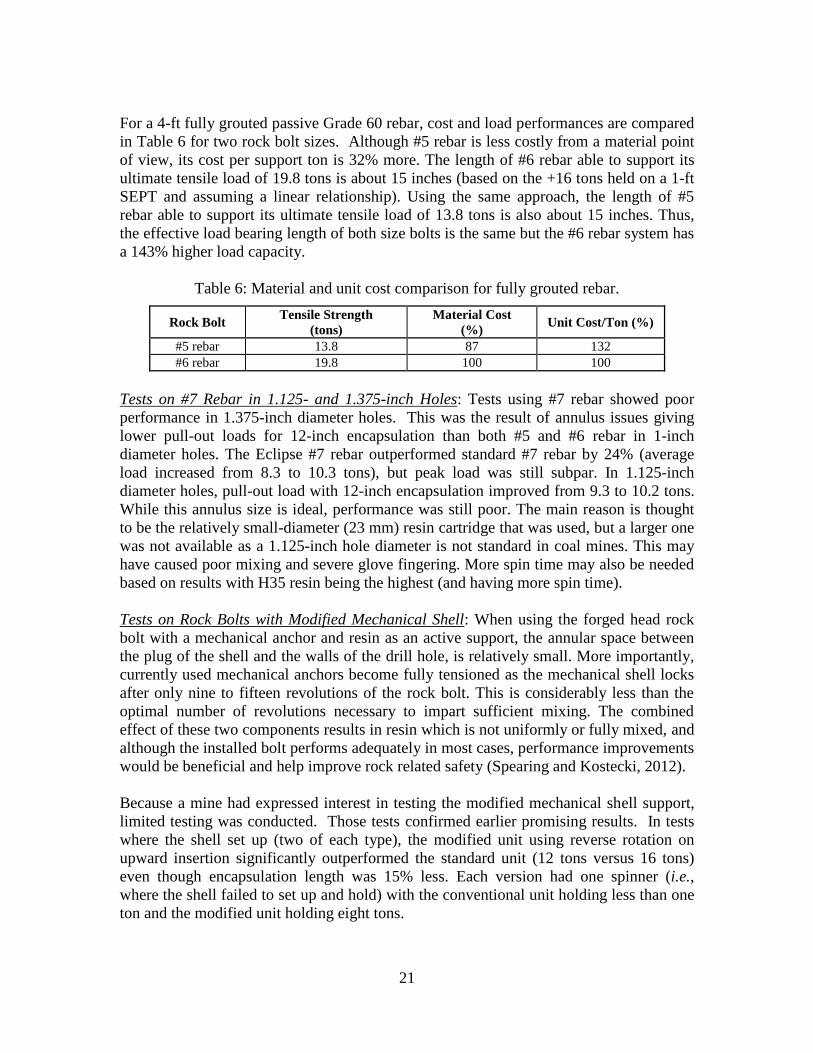
Figure 20 summarizes results for tests with rotational speed fixed at 540 rpm while
varying rotation time (i.e., 2, 3, 4, and 7 seconds). The selection of 540 rpm rotational
speed was based on that being the typical rotation speed for coal mine bolters. The
following conclusions can be drawn from these tests:
With respect to pull-out load, #6 rebar in a 1-inch hole significantly outperforms
#5 rebar in the same size hole due to the smaller annulus.
For #6 rebar installation, the optimum mixing time range is 2.5-5.0 seconds.
For #5 rebar installation, the optimum mixing time range is 3.5-4.5 seconds.
Figure 19: Pull-out load as a function of rotational speed
(number of revolutions constant at 36).
Figure 20: Pull-out load as a function of spin time
(rotational speed constant at 540 rpm).
21
For a 4-ft fully grouted passive Grade 60 rebar, cost and load performances are compared
in Table 6 for two rock bolt sizes. Although #5 rebar is less costly from a material point
of view, its cost per support ton is 32% more. The length of #6 rebar able to support its
ultimate tensile load of 19.8 tons is about 15 inches (based on the +16 tons held on a 1-ft
SEPT and assuming a linear relationship). Using the same approach, the length of #5
rebar able to support its ultimate tensile load of 13.8 tons is also about 15 inches. Thus,
the effective load bearing length of both size bolts is the same but the #6 rebar system has
a 143% higher load capacity.
Table 6: Material and unit cost comparison for fully grouted rebar.
Rock Bolt Tensile Strength
(tons)
Material Cost
(%) Unit Cost/Ton (%)
#5 rebar 13.8 87 132
#6 rebar 19.8 100 100
Tests on #7 Rebar in 1.125- and 1.375-inch Holes: Tests using #7 rebar showed poor
performance in 1.375-inch diameter holes. This was the result of annulus issues giving
lower pull-out loads for 12-inch encapsulation than both #5 and #6 rebar in 1-inch
diameter holes. The Eclipse #7 rebar outperformed standard #7 rebar by 24% (average
load increased from 8.3 to 10.3 tons), but peak load was still subpar. In 1.125-inch
diameter holes, pull-out load with 12-inch encapsulation improved from 9.3 to 10.2 tons.
While this annulus size is ideal, performance was still poor. The main reason is thought
to be the relatively small-diameter (23 mm) resin cartridge that was used, but a larger one
was not available as a 1.125-inch hole diameter is not standard in coal mines. This may
have caused poor mixing and severe glove fingering. More spin time may also be needed
based on results with H35 resin being the highest (and having more spin time).
Tests on Rock Bolts with Modified Mechanical Shell: When using the forged head rock
bolt with a mechanical anchor and resin as an active support, the annular space between
the plug of the shell and the walls of the drill hole, is relatively small. More importantly,
currently used mechanical anchors become fully tensioned as the mechanical shell locks
after only nine to fifteen revolutions of the rock bolt. This is considerably less than the
optimal number of revolutions necessary to impart sufficient mixing. The combined
effect of these two components results in resin which is not uniformly or fully mixed, and
although the installed bolt performs adequately in most cases, performance improvements
would be beneficial and help improve rock related safety (Spearing and Kostecki, 2012).
Because a mine had expressed interest in testing the modified mechanical shell support,
limited testing was conducted. Those tests confirmed earlier promising results. In tests
where the shell set up (two of each type), the modified unit using reverse rotation on
upward insertion significantly outperformed the standard unit (12 tons versus 16 tons)
even though encapsulation length was 15% less. Each version had one spinner (i.e.,
where the shell failed to set up and hold) with the conventional unit holding less than one
ton and the modified unit holding eight tons.

22
In Situ Pull-out Tests
In situ tests were conducted on four separate occasions in two different coal mines.
Results from each of the four occasions are reported separately.
First Underground Tests: The following parameters apply to all tests:
#5 Grade 60 rebar was used in 48-inch lengths. Rock bolts had forged heads.
Spin time was 4 seconds.
Hold time was 10 seconds.
The same bolter and operator were used for every installation.
Rotational speed could not be recorded.
Temperature was not recorded.
Minova H10 resin was used in 23-mm diameter, 11.5-inch long cartridges.
Drill hole diameter was one inch and length was one inch longer than the rebar
length (46.75 inches) effectively inserted into the hole (i.e., less the forged head,
plate, and test collar).
All rock bolts were pull tested one hour after installation.
All rock bolts had a resin restraint made by wrapping insulation tape around the
bolt (to a thickness of at least ⅛ inch) 12 inches from the end of the bolt.
All bolts were loaded to one ton and displacement was set to zero at the beginning
of each test.
Table 7 gives the average of four tests conducted for each test type. These tests gave
similar results to those obtained with concrete blocks at the Bowerston facility. The fact
that they were consistent is encouraging. Eclipse bolts and bolts installed with the
eccentric wrench held the same load as the standard bolt, which was not expected
because these bolts should achieve better mixing. A possible explanation is the resin
restraint used to contain the 1-ft resin encapsulation length. It is speculated that in
addition to restraining the resin, the tape also restricted the whipping or eccentric motion
at the end of the rebar.
Table 7: Average SEPT results for first underground tests using #5 rebar.
Test Type Load (tons) Displacement (inches)
Eclipse Bolt 9.3 0.183
Standard Bolt 9.3 0.182
Standard Bolt (eccentric wrench) 9.3 0.248
Second Underground Tests: The following parameters apply to all tests:
Two types of cable bolts were used – conventional double-bulbed and indented
with no bulbs (newly developed) – each with a length of 72 inches and a nominal
diameter of 0.6 inches.
23
Resin encapsulation length was 30 inches (2.5 feet). This length was selected to
fully encapsulate one cable bulb. The presence of the second bulb makes
displacement readings unrealistic as that bulb elongates and closes under load.
Spin time was planned for 6 seconds.
Hold time was 30 seconds.
The same bolter and two operators (one on each side) were used for every
installation.
Rotational speed could not be recorded.
Temperature was recorded at each pull-out test.
Minova VLIF50 resin was used in 23-mm diameter, 30-inch long cartridges.
Drill hole diameter was one inch and length was 69.75 inches (i.e., less the forged
head, plate, and test collar and with one inch extra at the back of the hole).
All rock bolts were pull tested 1.25 hours after installation. This was to
accommodate the number of cables tested in as short a time as possible.
All bolts were loaded to two tons and displacement was set to zero at the
beginning of each test.
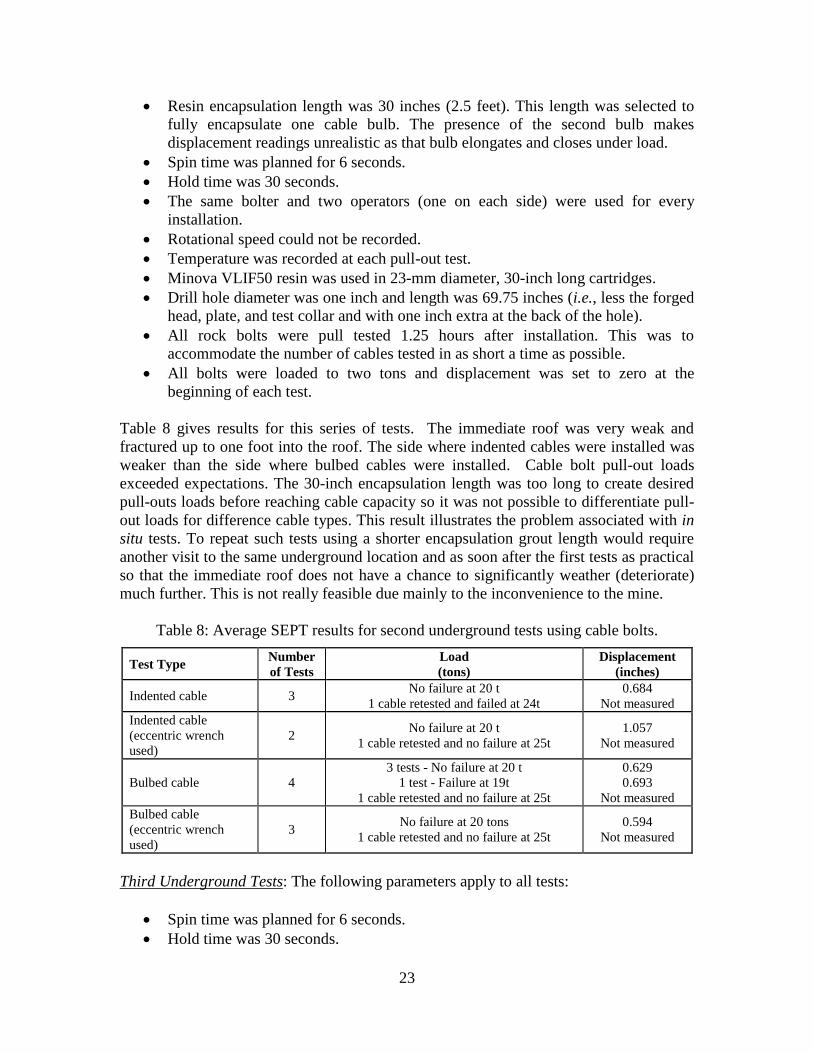
Table 8 gives results for this series of tests. The immediate roof was very weak and
fractured up to one foot into the roof. The side where indented cables were installed was
weaker than the side where bulbed cables were installed. Cable bolt pull-out loads
exceeded expectations. The 30-inch encapsulation length was too long to create desired
pull-outs loads before reaching cable capacity so it was not possible to differentiate pull-
out loads for difference cable types. This result illustrates the problem associated with in
situ tests. To repeat such tests using a shorter encapsulation grout length would require
another visit to the same underground location and as soon after the first tests as practical
so that the immediate roof does not have a chance to significantly weather (deteriorate)
much further. This is not really feasible due mainly to the inconvenience to the mine.
Table 8: Average SEPT results for second underground tests using cable bolts.
Test Type Number
of Tests
Load
(tons)
Displacement
(inches)
Indented cable 3 No failure at 20 t
1 cable retested and failed at 24t
0.684
Not measured
Indented cable
(eccentric wrench
used)
2 No failure at 20 t
1 cable retested and no failure at 25t
1.057
Not measured
Bulbed cable 4
3 tests - No failure at 20 t
1 test - Failure at 19t
1 cable retested and no failure at 25t
0.629
0.693
Not measured
Bulbed cable
(eccentric wrench
used)
3 No failure at 20 tons
1 cable retested and no failure at 25t
0.594
Not measured
Third Underground Tests: The following parameters apply to all tests:
Spin time was planned for 6 seconds.
Hold time was 30 seconds.
24
The same bolter and operator were used for every installation.
Rotational speed could not be recorded.
Temperature was not recorded.
Minova VLIF50 resin was used with 23-mm diameter cartridges and a resin
encapsulation length of 20.5 inches. This was as small as possible so that a bulb
was still completely covered by the resin column.
Drill hole diameter was one inch and length was 70.25 inches (i.e., less the forged
cable head, plate, and test collar and with one inch extra at the back of the hole).
All bolts were loaded to two tons and displacement was set to zero at the
beginning of each test.
Different pull-out times were necessary for these tests due to a communication
breakdown. The grip used with the hydraulic puller has a maximum width, which is
slightly less than the forged head on cable bolts. Cable bolts are usually ground down at
the factory if they are being pull-tested. Unfortunately that did not happen. It was
therefore too time consuming to fit and remove the grip in time so the test time was not
the same. Again, this reiterates the additional problems associated with in situ testing.
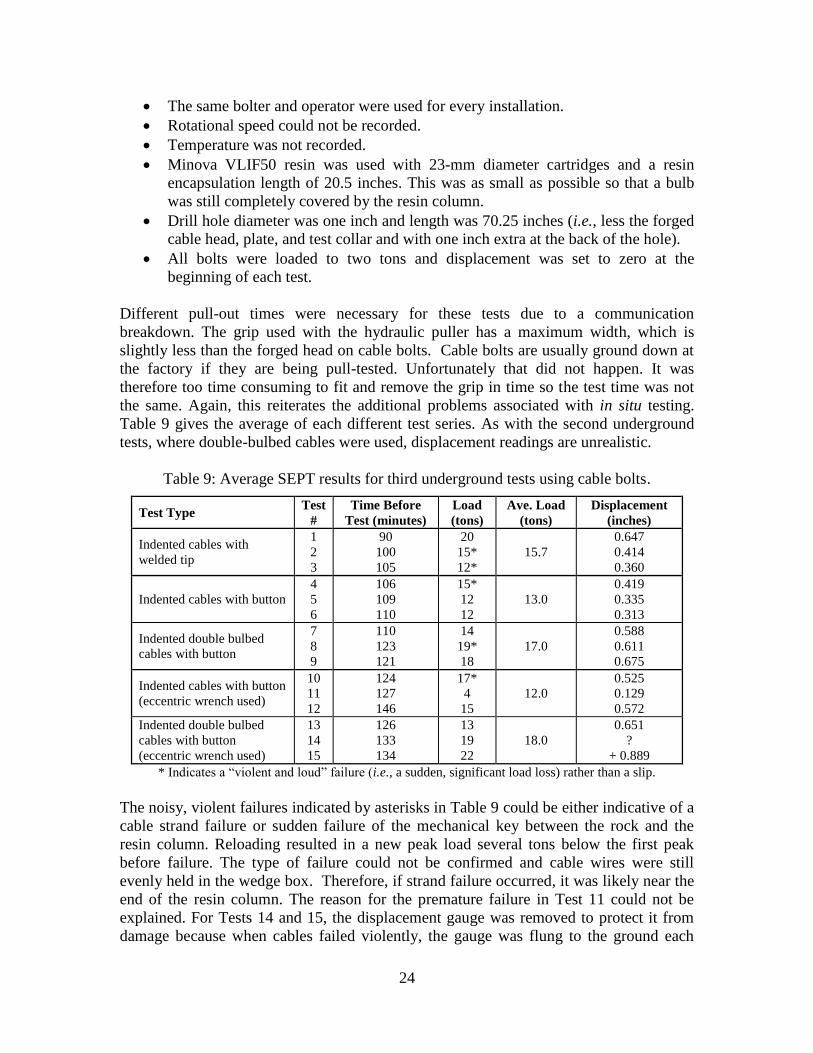
Table 9 gives the average of each different test series. As with the second underground
tests, where double-bulbed cables were used, displacement readings are unrealistic.
Table 9: Average SEPT results for third underground tests using cable bolts.
Test Type Test
#
Time Before
Test (minutes)
Load
(tons)
Ave. Load
(tons)
Displacement
(inches)
Indented cables with
welded tip
1
2
3
90
100
105
20
15*
12*
15.7
0.647
0.414
0.360
Indented cables with button
4
5
6
106
109
110
15*
12
12
13.0
0.419
0.335
0.313
Indented double bulbed
cables with button
7
8
9
110
123
121
14
19*
18
17.0
0.588
0.611
0.675
Indented cables with button
(eccentric wrench used)
10
11
12
124
127
146
17*
4
15
12.0
0.525
0.129
0.572
Indented double bulbed
cables with button
(eccentric wrench used)
13
14
15
126
133
134
13
19
22
18.0
0.651
?
+ 0.889
* Indicates a “violent and loud” failure (i.e., a sudden, significant load loss) rather than a slip.
The noisy, violent failures indicated by asterisks in Table 9 could be either indicative of a
cable strand failure or sudden failure of the mechanical key between the rock and the
resin column. Reloading resulted in a new peak load several tons below the first peak
before failure. The type of failure could not be confirmed and cable wires were still
evenly held in the wedge box. Therefore, if strand failure occurred, it was likely near the
end of the resin column. The reason for the premature failure in Test 11 could not be
explained. For Tests 14 and 15, the displacement gauge was removed to protect it from
damage because when cables failed violently, the gauge was flung to the ground each

25
time. For Test 15, the installation procedure was changed and for the first three seconds
the cable was rotated an inch or two from the roof optimizing the eccentric spin before
finally spinning the head and plate against the roof. This result is very encouraging, but
not definitive as yet.
Conclusions from this set of tests are as follows:
The immediate roof was much stronger at the site of the third underground tests
than at the previous site due to less fracturing.
There seems to be little difference between the button and the weld at the end of a
cable bolt.
Comparing Tests 1-6 with Tests 7-9 and Tests 10 and 12 with Tests 13-15
indicates that bulbs seem to improve pull-out performance of indented cables by
10-20%. (Test 11 results are considered an anomaly and were ignored.)
The eccentric wrench seems to show potential (although not convincing) and an
installation method has been developed that works for any resin bolt installation.
That method is to spin or rotate the bolt with the head a short distance from the
roof to achieve the desired eccentric action before forcing the bolt head against
the roof for the specified hold time.
Fourth Underground Tests: The following parameters apply to all tests:
Spin time was planned for 4 seconds.
Hold time was 15 seconds.
Two roof bolt booms were used where one did all installations with the eccentric
wrench and the other did all normal installations.
Rotational speed could not be recorded.
Temperature was not recorded.
Minova M40 resin was used in 23-mm diameter cartridges that are 18 inches long
for cable bolts and 12 inches long for #5 rebar giving encapsulation lengths of
22.5 inches and 15.5 inches, respectively.
Lengths of both rebar bolts and cable bolts were 48 inches.
Drill hole diameter was one inch. Drill hole length was 46.5 inches for #5 rebar
and 45.5 inches for cable bolts (i.e., less the forged head, plate, and test collar and
with one inch extra at the back of the hole).
Pull-out tests were done after one hour of each test.
No tape was placed on the rebar to help keep the resin in place during installation
as was done in the first underground tests.
#5 rebar bolts were loaded to one ton, cable bolts were loaded to two tons, and
displacement was set to zero at the beginning of each test.
For all eccentric installations, the first three seconds of spin time took place with
the bolt head rotating an inch or two from the roof according to the installation
method established during the third underground tests.

26
Table 10 gives the average of the tests of each different test series. As can be seen, cable
bolts installed with the eccentric wrench gave significantly higher pull-out loads. For #5
rebar, bolts installed with the eccentric wrench showed no advantage in part because all
tests were terminated at 10 tons of load for safety considerations. All results were
surprisingly high considering the annular space, which is not optimum.
Table 10: Average SEPT results for fourth underground tests.
Test Type Test
#
Time Before
Test (minutes)
Load
(tons)
Ave. Load
(tons)
Displacement
(inches)
Indented cables with button
(eccentric installation)
2
4
6
62
60
60
8
5(#)
13
8.66
0.215
0.114
0.278
Indented cables with a
button
7
9
11
60
60
60
4
4(#)
2(#)
3.66
0.098
0.107
?**
#5 Rebar (eccentric
installation)
8
10
12
60
60
60
10*
10*(#)
10*
10*
0.244
0.218
0.232
#5 rebar
1
3
5
60
60
60
10*
10*(#)
10*
10*
0.202
0.205
0.205
# Indicates bolts were held for five additional seconds.
* Indicates no failure observed during testing.
** Premature failure during initial loading due to poor installation.
Pull-out and Resin Hardness Tests at Carterville Facility
Resin for grouting rock bolts is packaged in a plastic-based, film-like cartridge or
capsule. Sometimes during installation, the outer plastic is not shredded during rotational
mixing and creates an interface between the resin column after it sets and the rock around
the drill hole. This effect, known as glove fingering, is the subject of debate (Pettibone,
1987), as it could reduce the mechanical key between the resin column and the rock.
Investigating glove fingering requires exposure of the resin column. Setting rebar into
welded-steel pipes (seamless pipes are not suitable because their smooth internal surface
causes premature slip) that could be cut open was found to be the best approach for
exposing the resin. To correlate pull-out load to resin hardness while possibly examining
glove fingering, the following procedure was adopted:
Grout rebar into thin-walled pipe (see Figure 21(a)) using insertion rig at the Coal
Research Center High Bay Laboratory.
Clamp thin-walled pipe with a split thick-walled pipe so it won’t collapse during
pull testing (see Figure 21(b)).
Conduct pull test to failure, then remove thick-walled pipe and split thin-walled
pipe into two halves with a radial saw. Thick-walled pipe is too difficult to cut.
Measure hardness of exposed resin column with a durometer.
27
(a) (b)
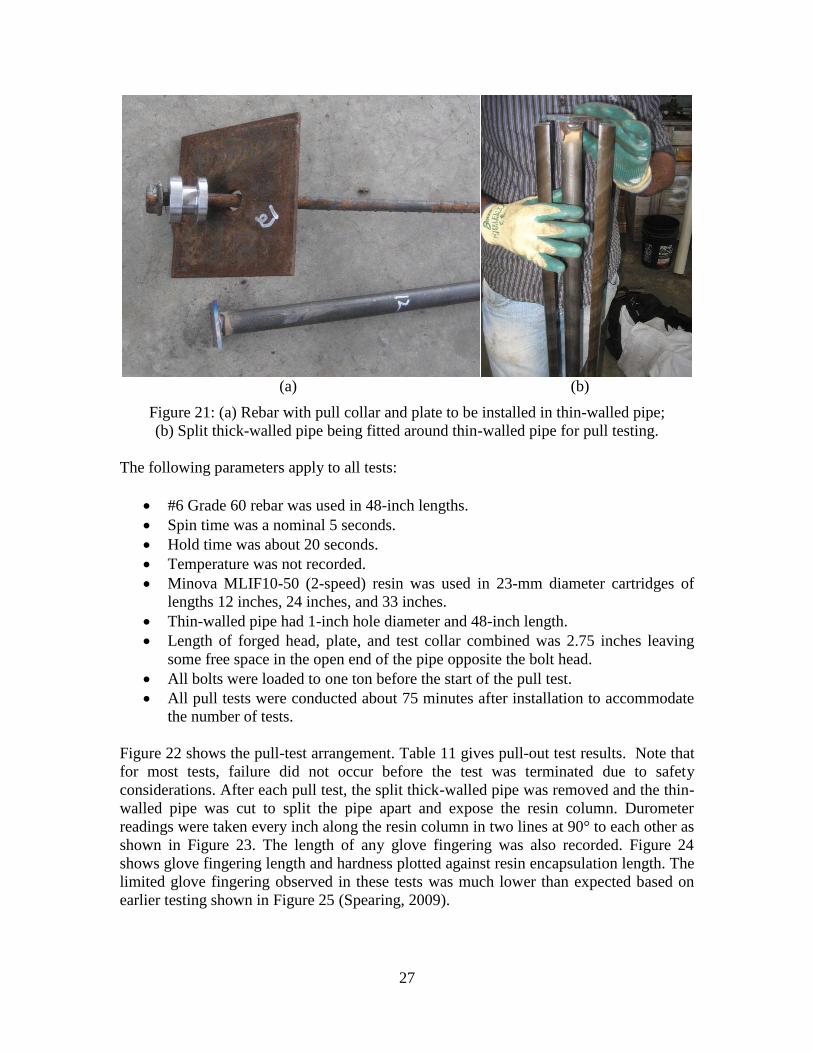
Figure 21: (a) Rebar with pull collar and plate to be installed in thin-walled pipe;
(b) Split thick-walled pipe being fitted around thin-walled pipe for pull testing.
The following parameters apply to all tests:
#6 Grade 60 rebar was used in 48-inch lengths.
Spin time was a nominal 5 seconds.
Hold time was about 20 seconds.
Temperature was not recorded.
Minova MLIF10-50 (2-speed) resin was used in 23-mm diameter cartridges of
lengths 12 inches, 24 inches, and 33 inches.
Thin-walled pipe had 1-inch hole diameter and 48-inch length.
Length of forged head, plate, and test collar combined was 2.75 inches leaving
some free space in the open end of the pipe opposite the bolt head.
All bolts were loaded to one ton before the start of the pull test.
All pull tests were conducted about 75 minutes after installation to accommodate
the number of tests.
Figure 22 shows the pull-test arrangement. Table 11 gives pull-out test results. Note that
for most tests, failure did not occur before the test was terminated due to safety
considerations. After each pull test, the split thick-walled pipe was removed and the thin-
walled pipe was cut to split the pipe apart and expose the resin column. Durometer
readings were taken every inch along the resin column in two lines at 90° to each other as
shown in Figure 23. The length of any glove fingering was also recorded. Figure 24
shows glove fingering length and hardness plotted against resin encapsulation length. The
limited glove fingering observed in these tests was much lower than expected based on
earlier testing shown in Figure 25 (Spearing, 2009).

28
(a)
(b)
Figure 22: (a) Pull collar clamped to bolt head;
(b) Pull-test configuration before installing micrometer.
Table 11: Results of #6 Grade 60 rebar pull-out tests.
Test Number Resin Encapsulation
Length (inches)
Spin Time
(seconds)
Average Peak
Load (tons)
Average No. of
Revolutions on
Installation
1 12 5 16* 31.3
2 12 5 12 32.7
3 12 5 7 28.8
4 12 5 7 29.7
Test 1-4 Ave. 12 5 10.5 30.6
5 24 5 16* 33.7
6 24 5 16* 29.5
7 24 5 16* 29.7
8 24 5 15.5* 28.6
Test 5-8 Ave. 24 5 15.9 30.4
9 48 5 16* 31.1
10 48 5 16* 30.6
11 48 5 16* 28.4
12 48 5 16* 30.8
Test 9-12 Ave. 48 5 16* 30.2
* Indicates no failure observed during testing.

29
Figure 23: Durometer measurement points marked on resin column.
Figure 24: Resin hardness and glove fingering length with encapsulation length.
Figure 25: Extensive glove fingering observed in Spearing (2009).

30
Modified Drill Press Tests
Three initial tests were performed under identical conditions using H10 resin cartridges to
assess the reliability of the drill press method with results shown in Table 12. Orica resin
is named according to its viscosity and nominal gel time (e.g., H10 has a nominal gel
time of 10 seconds, which is faster than H20 with a nominal gel time of 20 seconds).
Based on these initial tests, the frame holding the split steel box was reinforced to limit
vibration during installation and to improve repeatability and consistency of results. It
should be noted that even with grease and plastic wrap, the effectively mixed resin
column was only about five inches in length, and the top one inch was poorly mixed with
some intermixing of grease. This top portion was not considered in results. Also,
hardness is expressed as a unit-less number.
Table 12: Average readings from initial drill press tests.
Test # Durometer Reading Durometer Reading 90° Apart
1 69.75 67.25
2 68.87 74.75
3 53.40 69.40
#6 Rebar Tests: After initial tests, 18 more tests were conducted using #6 grouted rebar
and H10 resin. Drill press rotation was 580 rpm, which closely matched 540 rpm used at
the Bowerston facility. Drag due to resin viscosity caused some delay in the drill press
reaching target speed; then, momentum caused a few additional rotations after power was
turned off. These errors were relatively small and constant for all tests. Table 13 gives
test parameters, Figure 26 shows a test in progress, and Figure 27 shows test results.
Additional tests were done maintaining the number of rotations at a constant level to the
extent possible (the timer could only be set to complete seconds and not fractions of a
second) and altering rotation speed and time through use of different resins. Table 14
gives test parameters and Figure 28 shows results. Hardness results from these small-
scale tests were found to be qualitatively similar to large-scale pull-out tests and are
shown in Figure 29. While not conclusive, it appears from these results that slower
setting resin performs slightly better than faster setting resin (i.e., M35 had the highest
average durometer reading followed by H20 and finally by H10).
Table 13: Common parameters for first set of 18 tests with #6 rebar.
Bolt diameter 0.75 inch (#6 rebar all Grade 60)
Bolt length 25.25 inches
Encapsulation length designed 6 inches (actual was about 5 inches)
Spin time (4 spin times taken) 2 seconds, 3 seconds, 4 seconds, and 7 seconds
Rotational speed 580 rpm
Number of rotations (including an estimate
of the drill drag)
19 rotations, 29 rotations, 38rotations, and 67 rotations,
respectively +3-4 residual turns
Bolt tangential speed 3.62 inches/second
Annulus 0.125 inch

31
Figure 26: Modified drill press test.
Figure 27: Resin hardness and pull-out load versus spin time for #6 rebar.
Table 14: Common parameters for second set of tests with #6 rebar.
Bolt diameter 0.75 inch (#6 rebar)
Bolt length 25.25 inches
Encapsulation length intended 6 inches
Spin time (4 spin times taken) with
rotational speed
290 rpm with 7 secs, 350rpm with 6 secs & 650rpm with 3
secs (580 rpm from previous tests)
Number of rotations(including an
estimate of the drill drag) 33 rotations + 3-4 residual turns
Bolt tangential speed 1.81, 2.18 & 4.06 inch/sec
Annulus thickness 0.125 inch

32
Figure 28: Resin hardness versus rotational speed for #6 rebar.
Figure 29: Comparison of drill press tests with pull-out load tests for #6 rebar.
For #6 rebar, results shown in Figure 28 indicate an anomaly at 290 rpm in the
relationship between hardness and rotational speed when the number of rotations is kept
constant. At this stage, any reason for this is unknown.

33
#5 Rebar Tests: For tests with #5 rebar, H20 resin was used for encapsulation as it was
also used at the Bowerston facility and it exhibited average performance (i.e., between
H10 and M35) during #6 rebar testing in the drill press. Sixteen tests were conducted
with an intended encapsulation of 6 inches in the split steel block. The first test series
using #5 rebar investigated performance with varying spin times (i.e. 2, 3, 4, and 7
seconds). Table 15 gives test parameters and Figure 30 shows results. The relationship
between pull-out tests and resin hardness appears reasonable for #5 rebar.
Table 15: Common parameters for first set of tests with #5 rebar.
Bolt diameter 0.625 inch (#5 rebar)
Bolt length 25.25 inches
Encapsulation length designed 6 inches (about 5 inches achieved)
Spin time (4 spin times are considered) 2, 3, 4 and 7 seconds
Rotational speed 580 rpm
Number of rotations(including an estimate of the
drill drag)
19,29,38 and 67 rotations respectively +3 to 4
residual turns
Annulus thickness 0.188 inch
Tangential velocity 3 inch/second
Figure 30: Resin hardness and pull-out load versus spin time for #5 rebar.
Additional tests were done maintaining the number of rotations at a constant level while
altering rotation speed and time. Table 16 gives test parameters and Figure 31 shows
results. The relationship using #5 rebar between hardness and rotational speed keeping
the number of rotations constant has an anomalous result at 290 rpm similar to that using
#6 rebar. At this stage, the reason for this is unknown.

34
Table 16: Common parameters for the second set of tests with #5 rebar.
Bolt diameter 0.625 inch (#5 rebar)
Bolt length 25.25 inches
Encapsulation length designed 6 inches (about 5 inches achieved)
Spin time (4 spin times taken) with
rotational speed
290 rpm with 7 secs, 350rpm with 6 secs & 650 rpm with 3
secs (580 rpm from previous tests)
Number of rotations(including an
estimate of the drill drag) 33 rotations + 3-4 residual turns
Bolt tangential speed 1.81, 2.18 & 4.06 inch/sec
Annulus thickness 0.125 inch
Figure 31: Resin hardness versus rotational speed for #5 rebar.
Comparison Between #5 and #6 Rebar Results Using Modified Drill Rig: Figures 32 and
33 compare modified drill press results obtained for #5 and #6 rebar. From these tests,
small-scale laboratory encapsulation tests appear to qualitatively follow the same trends
of full-scale tests and could be used to preliminarily test new products or processes before
conducting large-scale short encapsulation tests. The anomaly at 290 rpm is shown again,
but it still cannot be explained.

35
Figure 32: Comparison of #5 and #6 rebar at 580 rpm with different spin times.
Figure 33: Comparison of #5 and #6 rebar with constant number of rotations
(arrows point to average hardness result for each rebar diameter).

36
Preliminary creep tests
Small-scale preliminary creep tests were conducted at Southern Illinois University’s
Carbondale campus in an attempt to understand how the axial load on a pre-tensioned
(active) bolt changed with time immediately after tensioning. For these tests, #6 rebar
was selected because it is the optimum combination with resin in a 1-inch diameter hole
and is commonly used in mines. The rebar was encapsulated in a 9-inch cubical concrete
block with an unconfined compressive strength of about 4,350 psi (30 MPa). Steel pipes
were initially used but found unsuitable and results using concrete were more
representative of a coal roof. Furthermore, they matched test material used at the
Bowerston facility. A pourable resin was used because it eliminated mixing variations
associated with resin cartridge installation and it had a higher strength compared with
polyester resin cartridges used in mines. The test assembly is shown in Figure 34.
The flange assembly above the concrete block is needed because the diameter of the U-
cell body is larger than the 1-inch hole. A torque wrench (see Figure 35) is then used to
provide a pre-determined amount of tension to the resin-bolt system. Typical active bolts
are torqued to about 300-350 ft.-lbs. using the bolter, but with only a 9-inch resin
encapsulation length, rebar was loaded incrementally from a low torque.
The following conditions were used in the laboratory for preliminary tests:
All tests were conducted on #6 rebar with a total length of 19 inches.
Two U-Cells – U34-16 and U34-19 – were used, one for each of the two concrete
blocks available.
Connecting Cable
U-Cell
Flanges
Cement Block
Readout Unit
Figure 34: The U-cell test configuration.

37
Each bolt was encapsulated with pourable resin over the entire length of the
cement block (i.e., 9 inches).
For all tests, temperature was basically stable (the lab is air-conditioned) ranging
from 75 to 88°F.
For each test, initial readings were taken from the U-cell readout unit prior to
tensioning of each bolt. Thereafter, about 15 minutes after tensioning, the first
reading was taken as per the U-cell Operating Manual.
The following torque magnitudes were used for tests: 50 ft.-lbs., 100 ft.-lbs., 150
ft.-lbs., and 200 ft.-lbs. Unfortunately, 200 ft.-lbs. could not be applied
successfully to the U34-16 U-cell due to apparent failure of the readout unit.
All readings after applying initial torque were initially taken at intervals of five
minutes.
U-cell test results are presented in Table 17 and shown for each cell individually in
Figures 36 and 37, respectively. Test-5 was conducted to check for consistency of peak
load attained with an applied torque of 200 ft.-lbs. Figure 38 shows results of all creep
tests using both U-cells.
Figure 35: Torqueing the U-cell and rebar bolt.

38
Table 17: Average results from all preliminary tests.
Test U-Cell
Applied
Torque
(ft.-lbs.)
Peak
Load
(tons)
Residual Load
at Test End
(tons)
Test
Duration
(minutes)
Average Rate of
Creep Load Shedding
(tons/min)
1 U34-19 50 0.79 0.64 20 0.0275
2 U34-19 100 1.27 0.63 120 0.0053
3 U34-19 150 1.54 0.91 300 0.0021
4 U34-19 200 2.65 2.07 120 0.0033
5 U34-19 200 2.51 1.86 180 0.0036
6 U34-16 50 1.03 0.55 180 0.0027
7 U34-16 100 1.57 1.20 180 0.0020
8 U34-16 150 2.16 1.57 180 0.0033
Figure 36: Creep in tests using U34-19 U-cell.
Figure 37: Creep in tests using U34-16 U-cell.
39
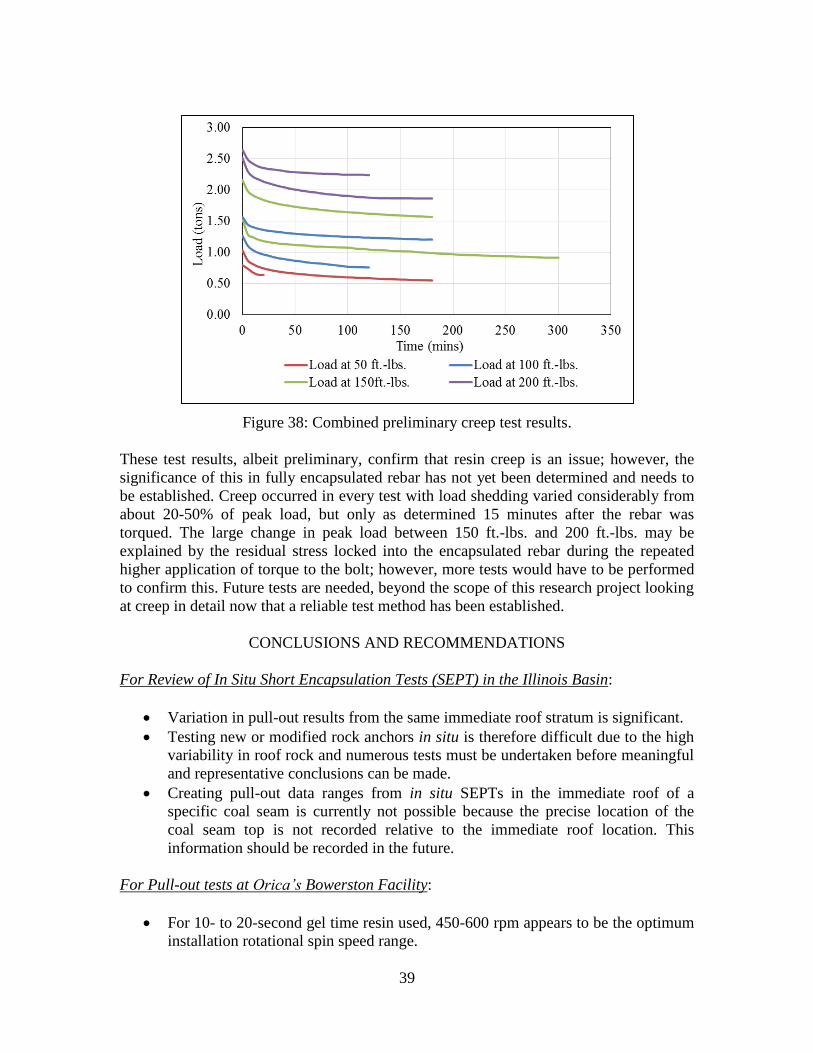
Figure 38: Combined preliminary creep test results.
These test results, albeit preliminary, confirm that resin creep is an issue; however, the
significance of this in fully encapsulated rebar has not yet been determined and needs to
be established. Creep occurred in every test with load shedding varied considerably from
about 20-50% of peak load, but only as determined 15 minutes after the rebar was
torqued. The large change in peak load between 150 ft.-lbs. and 200 ft.-lbs. may be
explained by the residual stress locked into the encapsulated rebar during the repeated
higher application of torque to the bolt; however, more tests would have to be performed
to confirm this. Future tests are needed, beyond the scope of this research project looking
at creep in detail now that a reliable test method has been established.
CONCLUSIONS AND RECOMMENDATIONS
For Review of In Situ Short Encapsulation Tests (SEPT) in the Illinois Basin:
Variation in pull-out results from the same immediate roof stratum is significant.
Testing new or modified rock anchors in situ is therefore difficult due to the high
variability in roof rock and numerous tests must be undertaken before meaningful
and representative conclusions can be made.
Creating pull-out data ranges from in situ SEPTs in the immediate roof of a
specific coal seam is currently not possible because the precise location of the
coal seam top is not recorded relative to the immediate roof location. This
information should be recorded in the future.
For Pull-out tests at Orica’s Bowerston Facility:
For 10- to 20-second gel time resin used, 450-600 rpm appears to be the optimum
installation rotational spin speed range.

40
For fast-setting resin (gel times of 20 seconds or less), a faster rotational speed is
desirable because slow speeds require more spin time interfering with resin gel.
In regards to pull-out load, #6 rebar in a 1-inch hole significantly outperforms #5
rebar in the same size hole due to the smaller annulus.
Pull-out performance for #6 rebar is less significantly affected by higher and
particularly lower speeds than #5 rebar.
For #6 rebar installation, acceptable rotational speed was 450-700 rpm.
For #5 rebar installation, acceptable rotational speed was 500-575 rpm.
For #6 rebar, the optimum mix time range is 2.5-5.0 seconds at the usual bolter
rotational speed of 540 rpm.
For #5 rebar, the optimum mix time range is 3.5-4.5 seconds at the usual bolter
rotational speed of 540 rpm.
#6 rebar is more technical and cost effective than #5 rebar and should be
considered for greater use, especially if rock bolt spacing can be marginally
altered.
#7 rebar performed very poorly in a 1.375-inch diameter hole probably because of
the unfavorable annulus.
The Eclipse #7 rebar with a slightly off-set forged head outperformed the standard
#7 rebar by 24%, but its performance was still surprisingly low.
Whilst in 1.125-inch diameter holes pull-out load improved from 9.3 to 10.2 tons
using 12-inch encapsulation, it was still poor despite the annulus being ideal.
These tests should be repeated with a larger diameter cartridge as this may have
been the main contributing factor to the poor pull-out load.
Reasons for the apparent under-performance of the #7 rebar in both 1-3/8 inch
and 1-1/8 inch holes needs to be investigated. This may be a resin cartridge
diameter issue in the 1-1/8 inch diameter hole.
Bolts with the modified mechanical shell proved superior to bolts with the
conventional mechanical shell. A large field trial is being sought.
For In situ Pull-out Tests:
In situ tests are difficult to obtain repeatable and reliable test results with
comparative systems because of the localized variability of the immediate roof.
Even with the above conclusion, #5 rebar gave similar pull-out test loads to those
in concrete blocks at Orica’s Bowerston facility.
New indented cables without bulbs gave similar pull-out loads to standard cable
bolts with a bulb.
The eccentric wrench may have potential, but more thorough testing is needed.
More data should be kept when undertaking in situ short encapsulation pull tests.
For Pull-out Tests at the Coal Research Center’s Carterville Facility:
Only 12 pull-out tests were carried out; however, based on them and subsequent
durometer tests for resin hardness determination and glove fingering examination,
it is concluded that a reliable and repeatable test method has been devised such

41
that a pull-out test can be done followed by an examination to determine resin
column hardness and the extent of glove fingering.
More pull-out, resin hardness, and glove fingering tests are necessary to better
define the test method just described and to solve these issues.
For Modified Drill Press Tests:
The drill press test has proven to be a useful, quick, cheap, repeatable, and easy
test for screen products or procedures before full-scale lab testing.
The test method is useful for parametric testing when only a single parameter
associated with resin-grouted rock bolts is changed.
H10 resin being a faster setting resin gave a better performance than H20 and
M35 for spin times of two and three seconds, which seems logical.
The current drill press is underpowered and at least a 5HP motor would be better
to test longer and more typical encapsulation lengths (i.e., 12 inches as opposed to
the current length of about five inches).
An anomaly at 290 rpm was found in tests using both #5 and #6 rebar, which at
present cannot be explained.
For Preliminary Creep Tests:
U-cells have proved useful for measuring creep, but can only start to take load
readings 10-15 minutes after the bolt has been tensioned. This length of time is
thought to be significant in the initial load shedding based on the early steep curve
of the load loss.
Resin creep in relatively weak “rock” is significant and based on limited tests to
date, it varies from 20-50% of peak load.
Steel pipes do not appear to be a good medium for testing creep. Concrete
appears better, but it is clearly less convenient.
Detailed creep tests are needed to more fully quantify the issue.
ACKNOWLEDGEMENTS
The principal investigator appreciates the efforts of graduate students Aditya Mishra and
Yeshwanth Tirumalaraju in completing this project. ICCI/DCEO research funds and the
collaboration with Orica’s Bowerston facility are greatly appreciated and acknowledged.
The cooperation of mines where pull testing was conducted is greatly appreciated as that
work is disruptive and time consuming. Pull-test data shared by two of the major rock
bolt suppliers is also greatly appreciated and acknowledged.
42
REFERENCES
ASTM Standard D4435. (2002) “Standard Test Method for Rock Bolt Anchor Pull Test.”
ASTM International, West Conshohocken, PA, DOI:10.1520/D4435, www.astm.org.
Mark, C., Compton, C.S., Oyler, D.C., and Dolinar, D.R. (2002) “Anchorage Pull Testing
for Fully Grouted Roof Bolts.” Proceedings, International Conference on Ground
Control in Mining, NIOSH.
Dolinar, D.R. and Bhatt, S. K. (2000) “Trends in Roof Bolt Application.” Proceedings,
New Technology for Coal Mine Roof Support, Washington D.C., NIOSH, pp. 43–51.
Pappas, D. (2014) Personal Communication. NIOSH.
Pettibone, H.C. (1987) “Avoiding Anchorage Problems with Resin-Grouted Roof Bolts.”
USBM RI 9129, 28 pp.
Spearing, A.J.S. (2009) “Rock Anchor with Resin – Insertion Improvement.” Final
Technical Report for ICCI Project No. 07-1/US-2.
Spearing, A.J.S. and Kostecki, T.R. (2012) “Improving the Performance of Active Rock
Bolts on Coal Mines through a Modified Mechanical Shell and Resin.” Proceedings,
Second Southern Hemisphere International Rock Mechanics Society (SHIRMS 2012)
Symposium, Sun City, South Africa, May 14-17.
Spearing, A.J.S., Kostecki, T.R., Gadde, M., and Hyett, A.J. (2013) “The Performance of
Primary Rock Bolts in Room and Pillar Mines and the Modeling of Their
Performance.” SME Transactions, January.
Spearing, A.J.S., Mishra, A., Kostecki, T.R., Taushanoff, R., and Sell. J. (2014)
“Understanding and Optimizing the Performance of Passive Primary Support on Coal
Mines.” Proceedings, 33rd Annual Conference on Ground Control in Mining, Society
for Mining, Metallurgy, and Exploration, pp. 105-112.

43
DISCLAIMER STATEMENT
This report was prepared by Dr. A.J.S. (Sam) Spearing of Southern Illinois University
Carbondale, with support, in part, by grants made possible by the Illinois Department of
Commerce and Economic Opportunity through the Illinois Clean Coal Institute. Neither
Dr. Spearing, Southern Illinois University Carbondale, nor any of its subcontractors, nor
the Illinois Department of Commerce and Economic Opportunity, Office of Coal
Development, the Illinois Clean Coal Institute, nor any person acting on behalf of either:
(A) Makes any warranty of representation, express or implied, with respect to the
accuracy, completeness, or usefulness of the information contained in this report,
or that the use of any information, apparatus, method, or process disclosed in this
report may not infringe privately-owned rights; or
(B) Assumes any liabilities with respect to the use of, or for damages resulting from
the use of, any information, apparatus, method or process disclosed in this report.
Reference herein to any specific commercial product, process, or service by trade name,
trademark, manufacturer, or otherwise, does not necessarily constitute or imply its
endorsement, recommendation, or favoring; nor do the views and opinions of authors
expressed herein necessarily state or reflect those of the Illinois Department of
Commerce and Economic Opportunity, Office of Coal Development, or the Illinois Clean
Coal Institute.
Notice to Journalists and Publishers: If you borrow information from any part of this
report, you must include a statement about the State of Illinois’ support of the project.
44
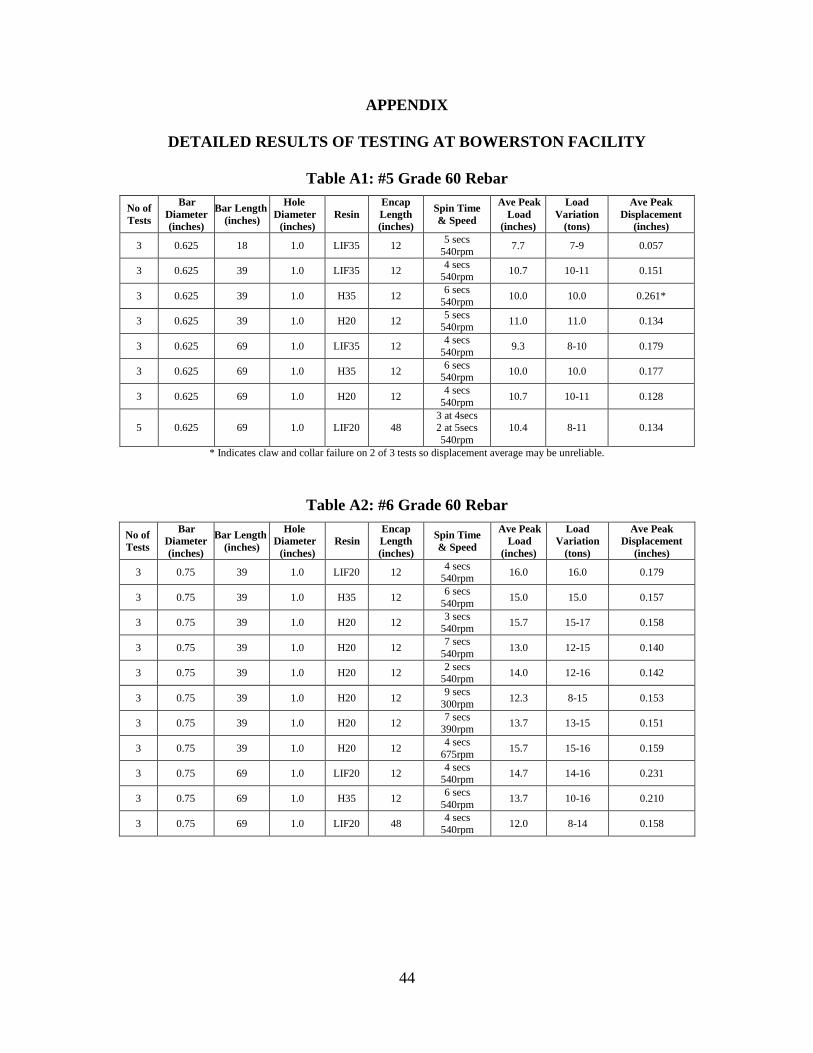
APPENDIX
DETAILED RESULTS OF TESTING AT BOWERSTON FACILITY
Table A1: #5 Grade 60 Rebar
No of
Tests
Bar
Diameter
(inches)
Bar Length
(inches)
Hole
Diameter
(inches)
Resin
Encap
Length
(inches)
Spin Time
& Speed
Ave Peak
Load
(inches)
Load
Variation
(tons)
Ave Peak
Displacement
(inches)
3 0.625 18 1.0 LIF35 12 5 secs
540rpm 7.7 7-9 0.057
3 0.625 39 1.0 LIF35 12 4 secs
540rpm 10.7 10-11 0.151
3 0.625 39 1.0 H35 12 6 secs
540rpm 10.0 10.0 0.261*
3 0.625 39 1.0 H20 12 5 secs
540rpm 11.0 11.0 0.134
3 0.625 69 1.0 LIF35 12 4 secs
540rpm 9.3 8-10 0.179
3 0.625 69 1.0 H35 12 6 secs
540rpm 10.0 10.0 0.177
3 0.625 69 1.0 H20 12 4 secs
540rpm 10.7 10-11 0.128
5 0.625 69 1.0 LIF20 48 3 at 4secs 2 at 5secs
540rpm
10.4 8-11 0.134
* Indicates claw and collar failure on 2 of 3 tests so displacement average may be unreliable.
Table A2: #6 Grade 60 Rebar
No of
Tests
Bar
Diameter
(inches)
Bar Length
(inches)
Hole
Diameter
(inches)
Resin Encap
Length
(inches)
Spin Time
& Speed
Ave Peak
Load
(inches)
Load
Variation
(tons)
Ave Peak
Displacement
(inches)
3 0.75 39 1.0 LIF20 12 4 secs
540rpm 16.0 16.0 0.179
3 0.75 39 1.0 H35 12 6 secs
540rpm 15.0 15.0 0.157
3 0.75 39 1.0 H20 12 3 secs
540rpm 15.7 15-17 0.158
3 0.75 39 1.0 H20 12 7 secs
540rpm 13.0 12-15 0.140
3 0.75 39 1.0 H20 12 2 secs
540rpm 14.0 12-16 0.142
3 0.75 39 1.0 H20 12 9 secs
300rpm 12.3 8-15 0.153
3 0.75 39 1.0 H20 12 7 secs
390rpm 13.7 13-15 0.151
3 0.75 39 1.0 H20 12 4 secs
675rpm 15.7 15-16 0.159
3 0.75 69 1.0 LIF20 12 4 secs
540rpm 14.7 14-16 0.231
3 0.75 69 1.0 H35 12 6 secs
540rpm 13.7 10-16 0.210
3 0.75 69 1.0 LIF20 48 4 secs
540rpm 12.0 8-14 0.158

45
Table A3: #7 Grade 75 Rebar
No of
Tests
Bar
Diameter
(inches)
Bar Length
(inches)
Hole
Diameter
(inches) Resin
Encap
Length
(inches)
Spin Time
& Speed
Ave Peak
Load
(inches)
Load
Variation
(tons)
Ave Peak
Displacement
(inches)
3 0.875 18 1.375 LIF20 12 4 secs
540rpm 5.3 3-7 0.054
3 0.875
39 1.375 LIF20 12
4 secs 540rpm
8.3 7-9 0.118
3 0.875
Eclipse 39 1.375 LIF20 12
5 secs
540rpm 10.3 10-11 0.136
5 0.875 39 1.375 H35 12 6 secs
540rpm 11.8 4-18 0.124
6 0.875 39 1.375 DSI
30sec 12
5 secs
540rpm 7.5 4-12 0.067
6 0.875 39 1.125 LIF20 12 5 secs
540rpm 10.2 6-14 0.090
5 0.875 69 1.375 LIF20 12
3 at 4secs
2 at 5secs
540rpm
6.0 3-11 0.129
3 0.875 69 1.375 H35 12 6 secs
540rpm 10.7 6-13 0.169
5 0.875 69 1.375 LIF20 48
3 at 4secs
2 at 5secs 540rpm
20.4 19-22 0.202
Table A4: Partially Grouted Mechanical Shell Rebar Tests
Test
#
Bar
Diamete
r
(inches)
Bar
Length
(inches)
Hole
Diamete
r
(inches)
Resin
Encap
Length
(inches)
Spin Time
& Speed
Temperature
- ambient
- steel
- resin
Peak
Load
(tons)
Peak
Displacement
(inches)
2.46 0.875 30 1.375 LIF35 16.9 540rpm
To stall
74°F
74°F 77°F
0 Pulled out
SPINNER
2.47 0.875 30 1.375 LIF35 16.9 540rpm
To stall
74°F
74°F 77°F
11 0.079
2.48 0.875 30 1.375 LIF35 16.9 540rpm To stall
74°F
74°F
77°F
13 0.102
2.49 0.75 35 1.375 LIF35 14.3
540rpm
Reverse
then to stall
74°F
74°F
77°F
16 0.151
2.50 0.75 35 1.375 LIF35 14.3 540rpm Reverse
then to stall
74°F 74°F
77°F
8 0.117
SPINNER
2.51 0.75 35 1.375 LIF35 14.3 540rpm Reverse
then to stall
74°F 74°F
77°F
16 0.139
Notes:
A 1.26-inch (32mm) diameter cartridge 12 inches long was used in each test.
Tests 2.46 and 2.50 were spinners (i.e., the mechanical shell did not engage) and
were spun for about 6-8 seconds. In Test 2.46, the resin still had not mixed.
In Tests 2.49-2.51, the rebar was spun in the opposite direction during insertion,
then spun to stall.