UNCLASSIFIED NAVTREQUIPC-S-C-8158-9 … Final Report for Period ... I D " AT (( ,i INMI NT FYP[NS....
104
D-A153 622 VISUAL AND PART-TASK MANIPULATIONS FOR TEACHING i/2 SIMULATED CARRIER LRNDING..(U) CANYON RESEARCH GROUP INC WESTLAKE VILLAGE CA D J SHEPPARD 19 MAR 85 UNCLASSIFIED NAVTREQUIPC-S-C-8158-9 N61339-8i-C-1B85 F/G 5/9 NL mohEEEI-EhEEE mhhhmhhmhhml mhEBhhhhEEEBhE ElhlhhhEEEElhI lflflflflfllflflfllfllfl I mEElhEElhhhhh
Transcript of UNCLASSIFIED NAVTREQUIPC-S-C-8158-9 … Final Report for Period ... I D " AT (( ,i INMI NT FYP[NS....

D-A153 622 VISUAL AND PART-TASK MANIPULATIONS FOR TEACHING i/2SIMULATED CARRIER LRNDING..(U) CANYON RESEARCH GROUPINC WESTLAKE VILLAGE CA D J SHEPPARD 19 MAR 85
UNCLASSIFIED NAVTREQUIPC-S-C-8158-9 N61339-8i-C-1B85 F/G 5/9 NL
mohEEEI-EhEEEmhhhmhhmhhmlmhEBhhhhEEEBhEElhlhhhEEEElhIlflflflflfllflflfllfllflI mEElhEElhhhhh

1.0 Llm 12. 12.
--o ~~I -...... 3 •1 .
LIM, m MI2.
iL 6
IIII 1.0
1111.25 LA1 14111 1.6
***- fh1 111
IIII-
MICROCOPY RESOLUTION TEST CHART
NATIONAL BUREAU Of STANDARDS 196 3
-A
o-:. .. . .. . .. .

iii i~innti r P AT GOWt kNMf N I IYfPt N43F
i: Technical Report NAVTRAEQUIPCEN 81-C-0105-9
V
VISUAL AND PART-TASKLn MANIPULATIONS FOR TEACHINGl~g')SIMULATED CARRIER LANDINGS
Canyon Research Group, Inc.* 741 Lakefield Road, Suite B
Westlake Village, California 91361
.... . . . .
Interim Final Report for Period1 September 1981 -31 August 1984
__ __ X_ MAY 10 1985Li..I DOD DISTRIBUTION STALTEMENT --
.... . Approved for public release;distribution unlimited..
NAALTA.IG.QUP EN ENE
ORADFORD021
* ~ :.4

I 1'lHOM) I " D AT (( ,i INMI NT FYP[NS.
Technical Report NAVTRAEQUIPCEN 81-C-010-9
|b
GOVERNMENT RIGHTS IN DATA STATEMENTReproduction of thus pub-licationTinwhole or in part is permitted forany purpose of the United StatesGovernment.
:-'~~~~~~~.......... . ............... ,. .... . •,,- . ..-- '.-..... ...

'A l il l Y IIA'",'iI(AI(. N (IF IlHlS I"A(-,
REPORT DOCUMENTATION PAGEa REPORT SECURITY CLASSIFICATION 'b RESTRICTIVE MARKINGS
I;NC IASS I VFlI),a SFCURITY CLASSIFICATION AUTHORITY 3 C :IRIBUTION/I AVAILABILITY OF REPORT
2r, D[(LASSFICATION I DOWNGRADING SCHEDULE I ihi i o uIII U11 j t 'I I
-1 P[RFORMIN(j ORGANIZATION REPORT NUMBER(S) S MONITORING ORGAiZATOCN RE.iORT JUMIliEPI',)
NAVI PAFUI I'CFN 81-C-rn 8{)-g,.i PJA I F )I !M )ORMINi, 0I1(ANIA hIiIIN 6 ( 1( 1 i i ;,)L fa JPMt ()F M j;1iIOI Ti, U 'rAN'?ATIION
''h Kr l,, i , :,. I ,'1) X''.'. ['If'.I Iht ,fill i I V : 1-h (,;,I, 't;. i~ i > ','Ii~ m (abl'e) ,
* A , IC 5F rC 'y, State, and ZIP'ode) !b ADU -SS (City State, and ZIP Code)
7.11 1k, t (Ilt R(,d, .Suit( it ,rm>'B II, 3 281k',i :t I, Ik( V i I IIIt, ('A 913(01
*a ',A%1[ (OF FINDING/SPONSORING Bb. OFFICE SYMBOL 9 PROCU REMENT 'NSTRij%,ENT IDENTIF'CA ION NUMB1ER0R iA % 14'AT T e.4 (if applicable)::n, ! Ar .4i. c U) 1r1cl N6 1 ,3 9 - 81- C- 010 5
• ,. E (City, State, and ZIPCode) T0 SOiJRCE OF F!INDING NUPAM ERS
PROGRAM PROJECT TASK !%' IlI'"h f] t0ll11, DC 20 3 61 ELEMENT NO NO NO ACCESSION NO)
N637-33N SP-0I )T R -p 7 ,I"q
IIT Iic(ludrje SeCUrity Classifcation)
' .1 'I,1 .111(1 I',rt t ask Maui jl )Iplat 1(s1 for 'i'.!Cwhi i l S I Ii late,,dI I - 1- I Il IIs 'i (U,1ne: Iass 3 f Led])
:AI AITHOR(S),:). ,,. : ?l, I:, )~
,, 'i',Rt 1b TIME COVERED 14 DATE OF REPORT (Year, Month. Day) 15 'A4 C0uNT
i; Ila FROM 9 TO B1J_1_ 18P 19 MarCI I 1 )85 86(' %I 'Al NrA'1 NOTATION
' CODFS 18. SUBJECT TERMS (Continue on reverse if necessary and identify by hti,K nunberjI i._ 0JP SUB.GROUP Carrier lanciii|,; -i11 mIlation ; part-tasl 1 tI-,1 1,1,,;
-- __ L _________ visual ]irniIT i ai,-; I i slel Lens opt I ITi' I
i I s t- Svst-m tI j ht_ t .W j i ,lj -rlIdm,..' I ,Cntinue on reverse if necessary and identify by block number)
I t.: t'r-ol--trai n-ici nqstud' wa ,S t'Cen)d ;'t 'd with 36 fI i,S I ' ,I 0 ; illreD t 1) i I Ti ti ( 11 1 i r.l t - t-as k t I I I i ii , 1I;,'
'~ ~~~~~ I. t I ()]I ',' ' lt; l ,(II IP 'I t I 1, t( 1 . ] i I , I ;i Pit 1 1t, ,¢ C , I I r 'r ].I ,! I. , .
i i st , l[It I VO I\V ( aIi tWV o.. ', I U 'ee Ill ,,I t w t t I at IS. , 'I'tVIT ,n.(i CII.,ANI)) to th" ''101, diSfl,'.'. ''ho 01 'lit, r
.. . I I .I r i ll,'11t If th, "LOLS disirlay. 'I e x r T i i i l',aiyIiL?'., 3!) t I i ti i 11( t I- i I s w i t h i i :-;t TI l- C u e t i ,I l !I I'e,(Ct , 'K ::nrd l,
,'. ' ',, , I, '.I II'1" 111 Il j t, I ,' I ill i'r ('. h (ilW C .5, t '- , I'' I
.. '' .. , A ll. I ' I ; .','TPAI'T 21 ABSTRACT SECURITY CLASSIFICATIO)N
A'.' U 1 II' j I *Av AS TVl; I Nf w I 1'I ! i t'd'I .,i .,lr ' h. ,:,llr .'21i t) I II iPH I ('riClnlud Ar',lCoie) ,'Pc 1)11(1[ SYv11' I
DD FORM 1473, R4 MAR 83 APR editon may he tied until ehausted SECURITY (IASSjf ( ATI()tj C)F 7',j' i -All other edition% are obsolete .. . ..
I: N " I tI- 1 1 ',)

S ECURITY CLASSIFICATION OF THIS PAGE
V!he Fwejnen t it ow): method of part- task tr ain ing used here was riot"(,Wfet ivo as was., whole-task training. However, t he part-ta sk iiin;i i i,]-
w,~ Ia: -xt I'm*, Ida ae y was enc.,s of f eet. ivye becaulse !; tde 111(1 t W4U, il I it V l r i t jil dI( miens ion s o1I th ie t ek.Never t 11e 1t
1I - ;II ask :oit el II oF tsIin some sk i Is- tha-t coul IhI e ippli eh to the,wI t ta:;k. Iii.~ IU' AlIso a - realistic possibilIi ty that some ajitI~l1! tt twa , ;t-f iask piroceduire is set Up 1,-:01.11d § u rther1 enilan1cU i t s
Tn.'i I wa35 1eJ) nro performance or training benefit from the, RAIhi (VI .IMANl) d i :o I'.,:; There were, however, some minor di f fe rent a~ I
iI f tI I]~h I i [I, f rom the u se i n t ra in i nt o f t he CONVl'EN'I NA 1,tii., i ('oIM1ANO dispi-w ys. These miight be useful in special reined jal
, I I ad ay hI v I-11%0soTic, impl ications for the way these displays irt(,:1 eiaa t ( t fn §1,ot as permanent guidance systems. IFor the presenlt
t, t s sd thait t i. RATE and COMAND display should niot be intr-* (*S t5 hu Ite' hvebcome ca rr ieCr ouia I i f ir-d w it h thlt,(,e 0-
* I *s:;.'I', I; n.:l hi'O~-lilt I ini nqFji ()I this study 1 . i!s that tI*lnstI-,Ii ' t a I lUE)IS has- no generl1 detr imental ef fects.
it.:it I on i5 1.', 1,,E i s a-rtiliee~ t of , carrier landinMt , anid could! adll substantially to the cost of the simulator. T(
lc to hI it iat'r V1,.015 can provide satisfactory training will permIlit* U.S >:f~ens~(1 pl.1roaich to simulating the FLOLS . . A Possible clif§i -
.-VI 1 A~aHtmlrol in) early transfer was noted, hut sufficient ei
tshow hi ; :ihoiiL' this piotential p~roblem.
VI IIA
SECURItTY CLASSIFICATION OF THIS I'AutI
07

NAVTRAEQUIPCEN 81-C-010i5-9
PREFACE
I extend moy appreciation for the technical support provided* by the following individuals associated with the Visual
Technology Research Simulator program: from the Naval TrainingEquipment Center (Code N-732) , Walter Chambers, Dr. DennisWightman, Bruce Riner, Patricia Daoust and Ed Ades; and fromEssex Corporation, Dr. Gavan Lintern, Dr. Daniel Westra, BrianNelson and Karen Thomley.
By-4
DTIC B; -
COPY

- r. n - - - s,- .. sr -w-nr .-- r-r r - rwr -. - , - -. - .- ,- r-v- - - . _ . _,
NAVTRAEQUIPCEN 81-C-0105-9
TABLE OF CONTENTS
Section Page
INTRODUCTION ....................................... 1
Part-Task Training ............................. 2FLOLS Type ..... ................................ 6FLOLS Size .............. ..... ........ . . .... 7
II METHOD .................................... 9
Apparatus ......... ...... . ...................... 9Visual System... ......... ................
Experiment..................................... 11Task Configuration ................... ....... iiFLOLS Type ...... .......... .......... ...... 11FLOLS Size ............................... .... 13
Subjects ....... ................................. 13Experimental Design ............................ 15Procedure ...................................... 15Briefing................. ..... ..... 15
Instructional Feedback ........................ 16Covariate Task ............. .... .... - -.. 16
Performance Measurement and Data Analysis...... 17
III RESULTS ................. .......................... 19
Training Data .................................... 19Transfer Data.... ............................... 21
Glideslope Error ............................. 21RMS Angle-of-Attack Error .................... 33RMS Lineup Error ................ ........... 39
IV DISCUSSION......................................... 45
Traininj Performance ........................... .45Task Effect............................... .. 45FLOLS Size .................................. ... 45FLOLS Type................................... 46

NAVTRlAEQUIPCEN 81-C-0105-9
TABLE OF CONTENTS (cont'd)
Section Page
IV DISCUSSION (cont'd)
Transfer Performance ........................... 46Task Effect ................................... 46FLOLS Type .................................... 48FLOLS Size .................................... 49
V CONCLUSIONS ....................................... 51
REFERENCES ....... . ................ 53
APPENDIX A- Power Analysis ......................... 57
APPENDIX B- Training Data Summary Tables......... 59
APPENDIX C - Transfer Data Summary Tables .......... 71
79

NAVTRAEQUIPCEN 81-C-0105-9
LIST OF ILLUSTRATIONS
Figure Page
I Carrier Approach Schematic DepictingFLOLS Envelope, Tail Hook Glidepathand Arrestment Wire Locations ......................... 5
2 Computer-Generated Image of the AircraftCarrier, with FLOLS and Portion of Wake ............. 10
3 Configuration of FLOLS Simulation, ShowingDatum Bars, Rate Arrows, and Meatball ............... 12
1 Three Pepresentations of Possible RATEor COMMAND Displays ................................ 14
5 Task x FLOLS Size Interactions for RMSGlideslope Error During Training ..................... 22
G Task x FLOLS Size Interactions for AverageGlideslope Error During Transfer ................... 23
7 Block x Task x FLOLS Size Interactionof RMS Glideslope Error for the MiddleSegment During Training ............................. 24
8 Block x Task Interactions for RMS GlideslopeError During Transfer ........ ...................... 27
9 Block x Task Interaction for AverageGlideslope Error During Transfer ................ ..... 28
11 Block x Task x FLOLS Type Interaction ofRMS Glideslope Error for Middle SegmentDuringj Transfer ....................................... 29
11 FLOLS Type Interactions of RMS GlideslopeError During Transfer ......... ............... ....... 31
12 FLOLS Type Interactions for AverageGlideslope Error During Transfer ..................... 32
13 FLOLS Size Interactions of RMS GlideslopeError During Transfer .............................. 34
14 Task x FLOLS Type x FLOLS SizeInteract ion of RMS Gl ideslope Errorfor the Close-in Segment During Transfer ............ 35
H

NAVTRAEQUIPCEN 81-C-'105-9
LIST OF ILLUSTRATIONS (cont'd)
Figure Page
15 Block x Task dnd Block x FLOLS TypeInteractions of RMS Angle-of-Attack Errorfor Middle Segment During Transfer .................... 36
16 FLOLS Type ind FLOLS Size Interactionsof RMS Anglu -of-Attack ErrorDuring Transfer .................................... 38
17 Block x Task x FLOLS Size Interactionof n- A; e-of-Attack Errorfor the Middle Segment During Transfer .............. 40
IF FLOrc Size x FLOLS Type Interactionsfoi RMS Lineup Error During Transfer ................ 41
19 Block x Tac.k x FLOLS Type Interactionsof RMS Lineup Error for the Close-inSegment rjring Transfer ............................ 42
0
S
0.

NAVTRAEQUIPCEN 81-C-0105-9
LIST OF TABLES
Table Page
I Experimental Design ................................. 15
2 Summary of Significant Training Effects ............. 20
3 Summary of Significant Transfer Effects ............. 25
4 Summary of FLOLS Type InteractionsComparing Trials 1-5 Versus 26-30 forRMS and Average Glideslope Error .................. 30
5 Summary of Task Type, FLOLS Type, andFLOLS Size Interactions Comparing Trials1-5 Versus 26-30 for RMS AOA Error ................. 37
i
I.
I6
I
;- - - - -

NAVTRAEQUIPCEN 81-C-0105-9
SECTION I
INTRODUCTION
The approach to and landing on an aircraft carrier is adtmandinj tas' for any pil, t: ind is one of the most dangerous hecan be called upon to perform. The flight skills required for
the task are uui red pri mar ily by repetitive practice on alanid-based runway and in a simulator designed to represent thecriterion device and environment as closely as possible. Whilemany factors contribute to the carrier-landing problem (e.g.,poor v isaal cues, limited land ing area, deck movement),perceptual judgments of vertical position on the flight path andsubseqjuent motor responses are the most critical factors in acarrier approach (Gold, 1974; Durand and Wasicko, 1967). Theobjective of this research is to examine methods of improvingsimulator training effectiveness for the critical features ofthe carrier landing task.
Flight simulators have long been viewed as substituteairplanes. They are designed to represent the criterion deviceand environment to a reasonable degree of fidelity. The goal ofmost flight.simulators is to increase training effectiveness ina safe and cost-effective manner. However, increased trainingeffectiveness is often considered to be almost synonymous withincreased simulation realism (Bunker, 1978).
While technological advances such as high detail and largetfield-of-view visual systems, motion systems and G-seats haveincreased realism, the major emphasis should be to optimizeskil development in the simulator. Thus, a more appropriator-search thrust would focus on principles of learning ratherthatI, development of technology as a path to optimizing skilldevelopment in the simulator.
Emphasic on principles of learning rat her than aI1 ai b itt" ednaolog]y tu increase s imul a' or effectiveness reflects an
Srene:s t-hat in appearance (f cortspon(ience with real ityIath2r that(l an actual corre,;pondence may be suffici (nt [ortr aining (St-ples, 1978) . Even an appeuarance of cortespondcnc,with real it, may be unnecessary, and it may be adeqiato toprovide the ii.-, :isary information for Leaching certain flightobjectives i i anv different ways (Caro, 1977). Furthermore,departures; from reality may not. only be less expensive but man'ybe more effect ive for teaching flight skills (Hennessy, Lintern,an d C',] 'Y,.r , l') ,1 ) . For e xa i 1e, the appl ication of
i mia tor' s Freeze/Reset teat ure (freeze pilot in midf 1 ight togie f oe (11),,d " k ]ad then reset on course) to teach t h'carr ier-aindin, task (Hughes, Lintern, Wiglhtman, Brooks, and
If ng ,.ton, 1981) , and the use of unconventional displays (e.g.,
0. - o ... ° . .

----.
*I NAVTRAEQUIPCEN 81-C-0105-9
outside viewpoint from behind the aircraft, or fl !;htinstruments only) to teach basic flight tasks (Hennessy et al.,1981) have been examined in recent experiments.
Stark (1982) has also suggested that today's advan-edsimulation technology be applied to support individual trainir,jproblems. Stark suggests that difficult and important skill and skill components should be trained outside the whole-ta ..context in low cost but high-fidelity training settings designedto mediate only that information relevant to a specific task ortask component.
'The current s,]dy is an extension of this concept a r Iphilosophy of training and will explore the usefulness clpart-task instruction and two methods of display augmentationfor teaching the carrier-landing task.
PART TASK TRAINING
Part-task training is generally regarded as practice or Iportion of the whole task prior to practice on the whole tasK.one part-task approach is to identify the specific components oft he whole task that are either difficult to learn or arecritical to the acquisi tion of the task. These components canthen be subjected to extensive practice before the total skillis learned. This procedure may lead to a more rapid acquisitionof the task and possibly better transfer to the 4hole task. Amodest amount of transition training would almost certainly berequired to coordinate component skills, but extensive practicein a high fidelity, whole-task simulator would probably beunnecessary (Adams and Hufford, 1962).
Al though some basic research has been d one on pairt-t_,;Kv'rsu'; whole-task training, little has been undertak,,n with',multi-dIimensional perceptual-motor tasks and even less wit hoperationally relevant tasks such1 as carrier-landings.Nvertheless, the basic research provides some insight into theuipplication of part-task training to operational tasks.
fir iggl; aind Wators (1958) use(] a pi tch-and-rolI t aki
t.t";k tro ;totidy t he value of task component interact io( in par -V/I,-7 .: who ,-t Ik training. They found that IraCt ice
: I'liv id mal c'imponit:; was progressively less beneficial, a:; id ' of o p,,rn (part) interaction was inctuas d in th110
It nsf, r or whl, It ti;k.
nd, '1T I:; (1963) used a prediction t ype i -kt t h1 .. . I,? -s of taisk complexity and task organizatirn in
St- veri:r; wtlI ask training. They found that prt-tatt-raining w,'; I, ,:;:; e(ffective than whole-task training for a,,:rit, r if)n t, :;k of high difficulty and hijh comp-,ne r'in terat ion.
2
* : . ' " . - . , " .-.-'.*" " " ::

NAVTRAEQUIPCEN 81-C-0105-9
Schendel, Shields and Katz (1978), in a review of the
literature on variables known to affect the retention of learnedmotor behaviors, states the effectiveness of part-task asopposed to whole-task training methods varies with thedifficulty of a task's independent subtasks and the degree towhich the subtasks are interrelated. They stated that:
"It generally is easier to learn simple tomoderately difficult tasks using whole-training methodsrather than part-training methods, whereas the oppositeis true for more difficult tasks.
"Tasks requiring high coordination and timing oftheir serial-motor components are learned faster usingwhole-training methods. In contrast, part-trainingmethods tend to be more effective for tasks that can bedivided in meaningful independent subtasks.
"There appears to be an interaction between taskdifficulty and task organization that influences therelative effectiveness of part- and whole-trainingmethods. Thus, training for tasks of high organizationbecomes increasingly more effective with whole practiceas task difficulty increases. On the other hand,training for tasks of low organization is increasinglyimproved by part practice as task difficultyincreases."
The carrier-landing task is difficult and requiresconsiderable coordination of motor components. The basicresearch indicates that a part-task approach to training is notadvisable in this type of situation. Briggs and Waters (1958)suggested that this is so because subjects are unable to learnhow specific components of the task interact when the componentsare practiced separately. Concurrent practice is needed tolearn how specific components interact in a highly organizedtask. Briggs and Naylor (1962) also argued that similarity tothe transfer task and the opportunity to develop efficienttiresharing behavior (concurrent practice of task components),ire both needed for effective learning on complex tasks. Thus,part-task training may be inefficient in a difficult task withinterdependent components for two reasons. The training andtransfer tasks are dissimilar, but more important, there is noopportunity to learn to timeshare interacting task components.Thus, a part-task training strategy that allowed efficenttimesharing and learning of subtask interactions would provideefficient transfer for a difficult task with interdependentcomponents. The carrier-landing task is suitable for testingthis hypothesis and the following description of the task willbe used to suggest a possibly effective approach to part-tasktraining.
3

NAVTRAEQUIPCEN 81-C-0105-9
For a carrier approach (Figure 1), the pilot attempts tofollow a designated glideslope (oblique path) so that a hookattached to the tail of the aircraft will contact the landingdeck midway between the second and third of four arrestmentwires (cables laid across the landing deck). The wires are atdifferent distances from the ramp (threshold of the landingdeck). Under the aircraft's momentum the hook travels forwardto snag the third wire for a trap (arrested landing). The firstor second wire may be caught on a low approach and the fourth ona high approach. Very low approaches can result in a rampstrike (collision with the stern of the carrier) while highapproaches can result in a bolter (a missed approach because oftouchdown beyond the wire arrestment area).
The pilot must not only maintain a precise glideslope butalso must simultaneously maintain the correct angle of attack(angle at which the wing moves through the air), airspeed,vertical velocity, and lineup with the landing area. If thepilot maintains position and velocity errors within acceptablelimits, he will execute a successful touchdown and trap (Gold,1974). Although all task dimensions are essential to safe andsuccessful carrier-landings, glideslope control is the mostcritical and difficult.
The part-task training method proposed here is to freezethe aircraft at a point along the carrier approach so that thesubject cannot fly forward to land on the carrier. Thesimulated aircraft will be permitted to move along all except
* its lateral axis. The rationale for this part-task strategy isoutlined below:
1. Subjects will have intensive glideslope trackingpractice in a less complex task. Briggs and Waters (1958)Sugested a simplification method of part-task instruction mayte appropriate for a task with interdependent components.Holding (1962) also argues that positive transfer can occurfollowing task simplification as long as proper information isprovided for error detection and correction.
2. All piloting tasks except lateral control will betimefs1ared. This will provide knowledge of interaction of thewaore critical components. The lack of lineup practice was not
tr'l_;i, i ered ser io u;. Lineup control does not constitute a major[problem in the carrier landing and the experimental task willrequire appropriate left and right stick responses to maintainheading lined up with the landing deck. Thus, a few trials oftransi Lion training in the whole task is expected to besufficient to coordinate the skills essential for lateralcontrol .
In summary, this part-task training strategy allowsextensive practice on error detection and correction of the mostdifficult and critical component of the carrier-landing task,
4
"< '-2. " - i . ." ' . . . . - ,' **- : *-." -- .' . ".' - .. . - . "* . .. .. ""

-.- ~-I-C-%-T T
NAVTRAEQUIPCEN 81-C-0105-9
Lo 4-
14 0
o 404
LU,3
4J 1
-J 0 u X
020 z 0 (1
P-44Qd% IL
L) ol 4
C)
z -j
4J
4

NAVTRAEQUIPCEN 81-C-0105-9
glideslope control. Secondly, the strategy provides knowledgeof component interaction which apparently is necessary for atask with interdependent components. The point on theglideslope that was chosen for the part training resulted in atask of moderate difficulty, and was a point in a normalapproach at which fine control responses start to becomecritical.
FLOLS TYPE
Pr -- imary i_1eisl:ope displacement information for a carrier,pproach i.s provided by the Fresnel Lens Optical Landing System
FLOLS) . It- C( t of light sources behind five vertically.tacked Fresnel lenses that are situated between two horizontalli'ght arrays known as datum bars. The array of lenses and lampsprovide a virtual image which appears to the pilot as a singlelight located 150 icet behind the datum bars. This light, knownas the meatball, is visible to the pilot through the center lenswhen he is within 9.5 minutes of arc of the glideslope and isSeen as level with the datum bars. As the aircraft moves more
* than 9.5 minutes of arc above or below the glideslope, themeatball is seen through higher or lower Fresnel lenses to givethe appearance of a light moving vertically above or below theline of the datum bars (Figure 1).
Although the FLOLS provides the primary displacementinformation for glideslope control, it has long been recognizedthat the system is less than optimum (Brictson, 1967; Perry,1968) . Because the information from the meatball is ofzero-order (displacement only), there are substantial lagsbetween incorrect control inputs and the subsequent errorinformation from the FLOLS. That is, a rate (first-order) errnrrils-t exist for some short period of time before it produces aperceptible displacement (zero-order) error (Kaul, Collyer, and[intern, 1980).
One technique to compensate for the lags between controlinlputs and subsequent error information would be to add afirst-order component to the zero-order component that isindicated hy the meatball. However, this is less than desirable."n" ho1 piI )t would no longer have unambiguous informationd,,,t hi:; pos;ition above or below the glideslope. Kaul et al.
S'W;!) overca,,me this problem by adding another element to the.,: ,is;play. Vertical light arrays appearing as bars;
* trq ir t )p or down from the inside of the datum bars we rc, I :th'~ FIS to provide a first-order display with no lossi
* 4 ;I: irrm~iat im)presently available from the meatball.
tl t al2. tested two configurations of the vertical, *. ii, on, the algorithm drove the arrows up or downj . i n j ):t wh, thr the meatball was moving up or down. This- J , I,:;i jrIIt(d the RATE display. In the other, the algorithm
itr vt thf, vertical bars in proportion to the difference between
6 6

NAVTRAEQUIPCEN 81-C-0105-9
the actual and the ideal descent rates so that null indications
from the arrows would return the pilot to, or maintain him on,the glideslope. This was designated the COMMAND display.
Results of that study showed that the approach pe forman .,with the COMMAND display was more stable and accurate than withthe CONVENTIONAL display. Root mean square (RMS) glidesl peerror scores (standard scores used to measure performance oun aitracking task) for the CCMMAND display were 40% to 50% bett-,than those for the CONVENTIONAL display. Performance with theRATE display tended to lie between performance with theCONVENTIONAL and COMMAND displays (Kaul et al., 1980) . Theconsiderable performance enhancement induced by thesefirst-order displays suggest their potential as a training aid.Wel ier (1979) has argued that first-order displays might t earch)approach glideslope control techniques for carrier landing andthese first-order displays might even help students learn to ea conventional FLOLS display more effectively.
Although Westra (1982) found no differential transferadvantage following instruction with the COMMAND display, thesubstantial performance advantages shown by Kaul et 'l.prompted a further test. Westra had chosen the COMMAND displayfor his training experiment because it had induced the mo-orepowerful performance effects in the early experiment by Kaul etal . fowever, it is also apparent that the COMMAND displaypermits students to fly the glideslope accurately withoutattending to the conventional displacement information. Adependency on the command information may develop that wuildisrupt performance on transfer to the CONVENTIONAL display. ,;Ithe other hand, the RATE display does not permit total neglect)f the conventional displacement information. Thus, di sr uptio'dependencies are less likely to develop. The possibility t1hftthe RATE display is a better choice for training systems is alsosi1pported by Pew (1966) who showed a performance advantage int r,-n:;fer from a rate tracking display to a displacement ti a'Ki Isystem. As the theory and knowledge surrounding the use of the1-i r st-ord(er d i splays for both performance and learnin ;neajer, oth were examined in this experiment.
I V,) K; ; j I-;
In t rel nnvironment, the FLO LS diplay is generat f[,in -l e n t lights. In a flight simulator, it i :: i-,
Ooin'd ,lent and less expensive t.o generate a FLO[1:: imqe 111(ompu t er . B eca use the FLOLS is relatively small and mist I..pr',ivd accurately, a high-fidel ity visual simu] itor ir e.-ii red t. represent it at- it. true rel at ive ;i ,
SAIt .rr,-it ivI y, the FLOLS might he rept esen,, t ,] as l arger t hi t'nrmal ,i z'. The issue of whether the sze of a simulated [
n,-,,; to orrespond to its 3ize in the real -l vironnent r em ii:;unresolved. From an engineering perspective, a large FLOL,
7
• . . . , " . . .

'.%
NAVTRAEQUIPCEN 81-C-0105-9
would be advantageous because to simulate the FLOLS displayaccurately would require a high-detail and costly visual system.
From a training perspective, a large FLOLS may or may notbe advantageous. An oversize FLOLS might also be regarded as anaugmenting cue and may help the student make better sense atwhat he is seeing when flying the simulator (Hennessy et al.,1981) as did the augmented feedback used by Lintern (1980) toteach landings in a light aircraft. Thus, FLOLS size was
* included in the experiment to examine its relative effectiveness*+ for simulator training.
In summary, this experiment was conducted to investigatemethods of improving simulator training effectiveness of thecarrier landing task. A segmentation method of part-tasktraininrg vs whole-task training and two visual factors, FLOLStype and FLOLS size, were investigated at the Visual Technologyesearch Simulator. FLOLS type consisted of the conventionalFLOLS display and two first-order displays, RATE and COMMAND.FLOLS size consisted of small and large simulated FLOLS.
*8
• . - -, .-" ' + . " . ? .[ .,.- • .. . ... ..- - • " - :.i, ,i ' - -. --y - . .- -. - - . .- . -. . -. ' - " . ? . . -? ." .-

NAVTRAEQUIPCEN 81-C-0105-9
SECTION II
METHOD
APPARATUS
The Visual Technology Research Simulator (VTRS), describedelsewhere by Collyer and Chambers (1978), consists of a fullyinstrumented T-2C Navy jet trainer cockpit, a sixdegree-of-freedom synergistic motion platform, a 32-elementG-seat, a wide-angle visual system that can projectcomputer-generated color images, and an Experimenter/OperatorControl Station. The motion system and G-seat were not used inthis experiment.
The T-2C is the Navy's primary jet trainer. It is a twinturbojet, subsonic aircraft. All major T2-C controls anddisplays are simulated in the VTRS. Carrier arrested landingand catapult takeoff capabilities are also provided.
The visual display is a full-color wide-angle real imagepresented on a 10-foot radius spherical screen. The entiredisplay system, consisting of the screen and two projectors, ismounted on the motion base.
The experimenter/operator station provides the capabilityof interacting with the computer and flight simulator for thepurpose of developing, controlling, and monitoring theexperiment.
VISUAL SYSTEM. The background subtended 50 degrees above to 30degrees below the pilot's eye level and 80 degrees to eitherside of the cockpit. The carrier image, a daytimerepresentation of the USS Forrestal (CVA 59), was generated bycomputer and projected onto the background through a 1025-linevideo system. The FLOLS and carrier wake were also generated bythis method (Figure 2).
Average delay between control inputs and generation of thecorresponding visual scene was approximately 117 msec.Calculation of new aircraft coordinates required 50 msec, whilecalculation of the coordinates for the visual scenecorresponding to the viewpoint from the new aircraft coordinatesrequired 17 msec. An updated visual scene was displayed every33 msec.
9

NAVTRAEQUIPCEN 81-C-0105-9
Figure 2. Computer-generated image of the daycarrier with FLOLS and portion of wake.
40
5 10

NAVTRAEQUIPCEN 81-C-0105-9
The sky was light blue and brightness was approximately .12foot-Lambert (fL). The seascape was dark blue and brightnesswas approximately .45 fL. The brightest area of the carrier was
approximately 2.6 fL. Except for the horizon, there were nofeatures represented in either the sky or sea.
The configuration of the FLOLS is shown in Figure 3. TheFLOLS was centered 414 feet down the landing deck and 61 feet tothe left of the centerline. It was set at a nominal 3.5 degreeglideslope and with a lateral viewing wedge of 52 degrees.
EXPERIMENT
Three training factors--task configuration (part vs whole),FLOLS type, and FLOLS size--were investigated as possibletraining aids for the carrier landing task. After 30 trials onone of the training conditions, subjects were transferred foranother 30 trials to the criterion configuration. Performancesin the transfer phase were used to assess the differentialeffects of the training conditions.
TASK CONFIGURATION. For the whole-task condition, the simulatorwas initialized with the aircraft at 9000 feet from the ramp, onglideslope and centerline, and in the approach configuration(hook and wheels down, speed brake out, 15 units Angle of Attack(AOA), half flaps, and power at 83%). A trial was flown fromthe initial condition to wire arrestment or, in the case of abolter, to 1000 feet past the carrier. The carrier was set on aheading of 360 degrees at 20 knots. Environmental wind was setto produce a relative wind component of 25 knots down the deckwith no effective crosswind.
For the part-task condition, the simulator was initializedwith the aircraft at 1800 feet from the ramp, on glideslope andcenterline, and in the approach configuration (hook and wheelsdown, speed brake out, 15 units AOA, and half flaps). Power wasset at 85% with vertical velocity set at approximately zerofeet/minute. Ground position was frozen so that the simulatedaircraft could not converge on the carrier nor deviate fromlineup. All other control responses were the same as for thewhole-task condition. A trial was flown for 60 secondls afterrelease from the initial condition. Sixty seconds of practicein the part-task conaotion corresponded approximately to theamount of time required to fly a whole approach (9000 feet tothe ramp). The carrier was set on a heading of 360 degree.- at 0knots with no environmental wind to produce relative windconditions similar to those of the whole task.
FLOLS TYPE. There were three levels of this factor. The* conventional version of the FLOLS was one and the other two
involved the use of vertical bars added to the conventional
11

NAVTRAEQUIPCEN 81-C-0105-9
0 Nr 000 e~ 0 0
'.4
4 S4
a CD
4
944
U) Q
*~ r- = : , ~ .L0 :3 U
aa U) CflO
cc H0
1a 44 E
IU .- I~C44 Z 44
Ij 4c 9
C a
I-~~ (zW --
124

NAVTRAEQUIPCEN 81-C-005-9
FLOLS (Figure 3,. The vertical bars provided glideslope rate of
displacement iriformation to the subjects. The two levels weredesignated RATE and COMMAND.
For the RATE display, the algorithm (Kaul et al., 1980)drove the arrows in proportion to the difference between actualdescent rate and the descent rate that would maintain presentglideslope angle with respect to the FLOLS (Figure 4).
For the COMMAND display, the algorithm (Kaul et al., 1980)drove the arrows in proportion to the difference between theglideslope displacement rate and a commanded rate that was afunction of glideslope displacement. For a given aircraftvelocity, range and glideslope deviation, the command functionwould guide the pilot back to the glideslope at the optimum rate(Figure 4).
FLOLS SIZE. The FLOLS has a few critical elements that arerelatively small. When represented at true scale in the VTRS,some of the elements were so small that the line-rasterprojection system caused them to flicker excessively as theycros ed raster lines. The flicker can be avoided by making theFLOLS larger than it should be. One goal of this experiment wasto assess whether a size differential in the FLOLS would affectacquisition of the task.
Even the smallest possible representation of the FLOLS hadto be larger than true scale but it would be represented closerto true scale as the simulated aircraft neared the ramp. Ashrinking algorithm was used to reduce the size of the simulatedFLOLS during the approach. Two different shrinking algorithmswere used to establish the FLOLS size factor. The small FLOLSwas enlarged by a factor of 2.0 times its normal size when thedistance behind the ramp was greater than 1000 feet. From 1000feet, the size of the FLOLS was linearly reduced until itattained 1.5 times its normal size at 750 feet. It remainedthis size throughout the remainder of the approach. The largeFLOLS was enlarged by a factor of 4.5 its normal size when thedistance behind the ramp was greater than 2250 feet. From 2250feet the size of the FLOLS was linearly reduced until it
attained 1.5 times its normal size at 750 feet. It remainedthis size throughout the remainder of the approach. At 1800feet from the ramp (the part-task training position), the large
FLOLS was enlarged by a factor of 3.6.
SUBJECTS
Thirty-six male college students between the age of 18 and28 participated in the experiment at the Naval TrainingEquipment Center (NTEC). All subjects were paid volunteers withno flight experience.
13

NAVTRAEQUIPCEN 81-C-0105-9
(a) A static CONVENTIONAL display does not permit a trendinterpretation. For the RATE display this figureindicates that the one-ball high condition will bemaintained, while for the COMMAND display that thepilot is returning to the reference glideslope at anappropriate rate.
(b) For the RATE display this figure indicates one-ballhigh and going higher in relation to the referenceglideslope. For the COMMAND display it indicates thatthe aircraft is high, and is not returning to theglideslope quickly enough (and may even be goinghigher).
*. - (c) For the RATE display this figure indicates that thepilot is returning to the glideslope, while for theCOMMAND display that he is returning to it tooquickly and will probably fly through it.
Figure 4. Three representations of possible RATE orCOtIMAND displays. Figure 4(a) can alsorepresent a CONVENTIONAL display.
14

NAVTRAEQUIPCEN 81-C-0105-9
EXPERIMENTAL DESIGN
A 2x2x3 full factorial quasi-transfer of training designwas used in the experiment. Subjects were randomly assigned toone of the training conditions of the basic design. Aftertraining all subjects were then tested on the condition thatmost closely represented the carrier-landing task; that is, the9000 feet whole-task approach with the CONVENTIONAL display and
" small FLOLS (Table 1)
TABLE 1. TRAINING CONDITIONS
Conventional Rate Command
Small Ill* 112 113FLOLS
Who 1 eTask
Large 121 122 123FLOLS
Small 211 212 213FLOLS
PartTask
Large 221 222 223FLOLS
Condition Codes:
Whole Task = 1 Part Task = 2Small FLOLS = 1 Large FLOLS = 2Conventional = 1 Rate = 2 Command =3
* Also used in the transfer configuration for all groups.
PROCEDURES
Subjects were given a 1.5-hour briefing on carrier-landingprocedures. Their simulator sequence consisted of 30 trainingtrials and 30 transfer trials over a two-day period. Nofamiliarization flights were permitted. Instructional feedbackon their performance was given by the experimenter after eachtraining trial. Feedback for lateral control was given on the
S 15
. ,: : " . " . . . .i . .- . i' :-. , . . ; . . .. , ". : ". - " , . .- - . ' "- - - * -- -. .I.. -.-. . -.- . . . . •*,

-x ° r .- r - -
AQ NAVTRAEQUIPCEN 81-C-0105-9
first three transfer trials. There was no instructionalfeedback on the remaining transfer trials.
BRIEFING. The briefing materials consisted of information oncarrier-landing procedures for each subject, and information ontheir specific training condition. A complete set of briefingmaterial can be obtained from the VTRS facility. Subjects readthe briefing materials and were then instructed oncarrier-landing procedures. The experimenter also described thelocation of cockpit instruments and controls.
INSTRUCTIONAL FEEDBACK. Normally, the Landing Signal Officer(LSO) provides feedback to the pilot during an approach.However, the services an LSO could not be secured for this,xperiment. While this might initially appear unfortunate, it
La:; Leen difficult in previous research to ensure that LSOs orinsZ.ructUrs treat all subjects similarly. A tendency to offermork. .upport uas.di on the way the student performs has beennoted. In this experiment, where student performances should4 depend to some extent on their training condition (Lintern etal., 1981), any tendency to give extra assistance to poorp-.: formances could confound the results of the experiment.
In an attempt to maintain experimental control of4t.,_1f',t /instructor interactions, personnel with a psychologicalh,i:kground were trained to teach the required skills. Whilet-. a I pproach may lose something in the quality of instruction,that loss would seem to be offset by gains in experimental
This approach appeared to have worked successfully ina previous carrier-landing experiment where the experimenterprovided feedback to Navy and Air Force pilots after eachapproach (Lintern et al., 1981).
The experimenter gave instructional feedback after everytirainjnq trial. To aid in the instructional feedback, a graphic
, provided plots of glideslope deviation, angle-of-attack-vi ition, lineup deviation, vertical velocity, aircraft pitch,I ;p)wer setting. Plots were provided for the final 6000 feet
of ti'e whole-task condition and the entire 60 seconds of the* ir t-task (;ondition. Feedback was limited to major problems or
Sr)rs that occurred during the trial.
"V ARIAT, TASK. In simulation research, individual differences* -nd L() account for much of the unexplained variance (Westra,
One method of reducing the unexplained variance is to*,,s:; subject aptitude for the task and account for some of thei)LW'weeri-subject variance through an analysis of covariance. AnATAP I video game was selected as a covariate since priorr, '; , had shown a high test-retest reliability and otherg ),,rlcteristics desirable in a covariate (Jones, Kennedy andP, it tner, 1981). Furthermore, the ATARI video game is a:,) 'lp r. r;3tr()ry tracking task as in the carrier-landing task(Lint,,rn and Kennedy, 1982)
* 16

NAVTRAEQUIPCEN 81-C-0105-9
Subjects were tested with the ATARI Air Combat Maneuvering(ACM) game (Cartridge CX2601, game No. 24, difficulty 'b',right controller) prior to their flight in the simulator. Allsubjects completed a total of 30 games. A subject's score forone game is the total nmber of hits during a 2.25-minute trial.
PERFORMANCE MEASUREMENT AND DATA ANALYSIS
Parameters of aircraft position were sampled at 30 Hz andused to derive summary scores from the desired approach path forthe following segments.
Segment Whole Task Park Task
Start 6000 ft to 4500 ft 21 sec to 30 secFar-Middle 4500 ft to 3000 ft 31 sec to 40 secMiddle 3000 ft to 1500 ft 41 sec to 50 secClose-In 1500 ft to Ramp 51 sec to 60 sec
Root-Mean Square (RMS) error scores were calculated forglideslope, lineup and angle of attack. Mean algebraic errorscores were also calculated for glideslope.
Repeated measures analyses of covariance were the primarystatistical tests of the data. Orthogonal comparison of maineffects of Trials 1-5 vs 26-30, 6-10 vs 21-25 and 11-15 vs 16-20were computed to assess interactions of effects with trials.This analysis gives similar information to the main effects Xtrial block interactions of the main ANOVA, but provides a morepowerful test of initial and brief effects at time of transfer.It was considered advisable to undertake this test and setstatistical significance at the 0.10 level in view of thelimited power allowed by the small number of subjects availablefor this experiment. The power analysis showing the probabilityof detecting a large, medium, or small effect of RMS glideslopeerror for the middle (3000 ft to 1500 ft) and close-in (1500 ftto ramp) segments are presented in Appendix A. The data wasalso blocked (5-trial means) to increase trial-to-trialreliability. Eta squared was calculated to estimate theproportion of variance accounted for by significant effects.
17/18
* *.. .. . *. • . .. ,. . -.. .**. -

-- 7- -. . "0n
NAVTRAEQUIPCEN 81-C-0105-9
SECTION III
RESULTS
Statistical analyses were conducted on both the trainingand transfer data. The training data were analyzed to check theeffectiveness of the factor manipulations and to show thatlearning occurred. The transfer data were analyzed to show theeffects of the training manipulations on performance of thecriterion task.
Data analyses are presented on Root Mean Square (RMS) andaverage glideslope error, RMS Angle-of-Attack (AOA) error andRMS lineup erroi for the middle (3000 ft to 1500 ft) andclose-in (1500 ft to ramp) segments of the approach. The middlesegment was selected for analysis because it contained theposition at which the part-task subjects were trained. Inaddition, it was the last segment to maintain a substantial taskditference for the FLOLS-size factor. There was no taskdifference as a result of this factor in the final 1000 feet ofthe approach. The final segment was considered for analysisbecause it is the most critical segment of the task.
Preliminary analysis of the data to check for normality,symmetry and homogeneity of variances showed the RMS errorscores to be highly skewed with unequal variances. Thus, RMSerror scores were log (X+l) transformed prior to analysis ofvariance to satisfy the assumptions of normality and homogeneityof variance. Although transformation to correct for violationof these assumptions is often considered unnecessary, thefailure to do so can result in a loss of statistical power(Levine and Dunlap, 1982). As there was no apparentdisadvantage resulting from the transformation, and there werespecific theoretical advantages, the log transform was appliedroutinely to all RMS scores. For descriptive purposes, means ofnontransformed scores are presented in tables and graphs.
The proportion of variance (eta squared) accounted for bysignificant effects is also discussed. Following Cohen (1977),values for eta squared of 14% are considered to represent largeeffects, 6% to represent medium effects, and 1% to representsmall effects.
TRAINING DATA
Trends in training data, although informative, are notcentral to training issues. The best use of training data areto check for learning trends and to validate factormanipulations. Significant effects are summarized in Table 2.Means and repeated measures' analysis of covariance summaries
19

* NAVTRAEQUIPCEN 81-C--0105-9
TABLE 2. SUMMARY OF SIGNIFICANT TRAINING EFFECTS
RMS Glideslope Average Glideslope RMS An le ofError Error AttaRIE-rror
Middle Close-In Middle Close-In Middle Close-In
Task (Ta) *
FLOLS Size (FS)* FLOLS Type (FT)
Ta X FS** *
Ta X FTFS X FT
* Ta X FS XFT* Covariate
* Blocks (B) ***** ****
B X Ta*X FS
B X FT*- B X Ta X F'S ***
B X Ta X FTB X FS X FT *****
BX Ta X FS XFT
p < .10*:p < .05
**:p < .01
* 20

NAVTRAEQUIPCEN 81-C-0105-9
are presented in Tables B-i to B-12 in Appendix B. No trainingdata are presented on RMS lineup error since the part-tasksubjects could not deviate from lineup.
Significant learning effects were apparent for the three*dependent measures that are analyzed (Table 2). They accounted
for an average of 31% of the within-subjects experimentalvariance (Tables B-i to B-6). RMS AOA error was significantly
* higher with the whole task than with the part task (Table 2).There were no other significant main effects.
The task by FLOLS size interaction was significant for RMSand average glideslope error. These interactions are shown inFigures 5 and 6. The large FLOLS reduced RMS glideslope errorwith the whole task but increased them with the part task. Theopposite was true with the small FLOLS. Average glideslopeerror indicated that approaches tended to be higher with theconditions showing highest RMS glideslope error.
Two interactions with trial blocks also appear to benoteworthy. The block by task by FLOLS size interaction for RMSglideslope error is diagrammed in Figure 7. This interactionappeared to be due to the differences in error scores in thefirst 10 trials. The error scores were higher for the wholetask with the small FLOLS and for the part task with largeFLOLS. Similar trends were found with average glideslope error.
The blocks by FLOLS size by FLOLS type interaction was alsosignificant for the RMS glideslope error in the middle segment,and for RMS AOA error in both segments. Higher error scoreswere apparent in early trials with the large FLOLS and the ratedisplay. Higher error scores for RMS AOA were also apparent inearly trials with the small FLOLS and the command display.
TRANSFER DATA
The transfer trials consisted of the experimental trainingcondition most representative of the operational carrier-landingLask (9000 ft straight-in approach, conventional and smallFLOLS). Significant transfer effects are summarized in Table 3.Means and repeated measures analysis of covariance summaries arein Tables C-i to C-16 in Appendix C.
GLIDESLOPE ERROR. With only minor exceptions, RMS and average
glideslope error effects showed similar trends (Table 3). Theonly significant main effect was that of task type. RMSglideslope error scores were higher following part-tasktraining. Average error scores indicated a tendency for allsubjects to fly above the glideslope, but the part-trainedsubjects flew significantly higher than did the whole-trainedsubjects. These effects accounted for an average of 14% of the
between-subjects experimental variance.
21

NAVTRAEQUIPCEN 81-C-0105-9
50-
-. ~40-JS
Z .- Large FLO LSU, 30 --
.2
.20- Small L SC-,
* 10-
Whole-Task Part-Task(A) Middle Segment
50-
42 Smage FLOLS
10/
u3 Whl-ak atTs
Fiur 5. SmkxFL iz neall on forOLS
~~22

NAVTRAEQUIPCEN 81-C-0105-9
40
II+ 304'd
20-
, . Large F L O LSC'0. - s
o 10-.2
Small FLOLS
IE
Whole-Task Part-Task
(A) Middle Segment
40-
II
+ 30
(U
20 .- Large FLOLS
, -
o 10.2
GSmall FLOLS
01
14,
Whole-Task Part-Task
(B) Close-In Segment
Figure 6. Task x FLOLS size interactions for average
glideslope error during training.
23.. < < i . ..--:< • i i i ." . -- --. ,- " . . .. < * ' -'-'. .

NAVTRAEQUIPCEN 81-C-0105-9
.LLJ
6P LLL
41
E
0
0
'-4
C" 0
* 04
0
p0
*11
N -44- 4j
((N
i~ a.I 01
U)U
44
24'

NAVTRAEQUIPCEN 81-C-0105-9
TABLE 3. SUMMARY OF SIGNIFICANT TRANSFER EFFECTS
RMS Glideslope Error Average Glideslope Error
Middle Close-In Middle Close-In
* ~Task (TA) ***
FLOLS Size (FS)FLOLS Type (FT)
* Ta XFSTa X FTFS X FTTa X FS X FT *
Covar jate
Blocks (B) *****
B X Ta * * *
B X FT
B ' Ta X FSB XTa XFT*B X FS X FTB X Ta X FS X FT
RMS AOA Error RMS Lineup Error
Middle Close-In Middle Close-In
Task (Ta)FLOLS Size (FS)*FLOLS Type (FT)
q Ta X FSTa XFT *
FS XFT.9Ta X FS XFT*
Covariate **
Blocks (B)***B XTa *
B X FSB BXFT **
B X Ta X FS ****
B X Ta X FTB X FS X FTB X Ta X FS X FT
**p: < .10**p: < .05
***p: < .01
0 25

- -. -C- -- - <
NAVTRAEQUIPCEN 81-C-0105-9
Significant block effects indicated that glideslope errorsdecreased throughout transfer. As shown by the significantblock by task interactions, part trained subjects performed verypoorly in early transfer, but were only slightly disadvantagedin relation to the whole-trained subjects towards the end of thetransfer phase (Figures 8 and 9). These interactions accountedfor an average of 9% of the within-subjects experimentalvariance.
There was a block by task by FLOLS type interaction in themiddle segment for RMS glideslope error (Table 3). Figure 10suggests that this interaction resulted from poor early transferperformances of part trained groups. However, subjects trainedon the part task with the RATE display had the lowest errorscores among part-trained subjects at the start of transfer, andthese error scores remained consistently lower throughouttransfer. Figure 10 also shows that subjects trained on thewhole task with the CONVENTIONAL display had the lowest errorscores throughout transfer.
There were various significant interactions of FLOLS typecomparing trials 1-5 versus 26-30 for both RMS and averageglideslope error. These interactions are summarized in Table 4.In general, a significant interaction of this type indicatesthat the magnitude of differences between conditions changedfrom early in transfer to late in transfer. An interactioneffect of this type would also be indicated by a significantblocks by factor interaction in the ANOVA. However, thestatistical power of the test in the ANOVA was low because ofthe small number of subjects available for the experiment. Theprocedure employed here was used because of its potential toprovide a more powerful test of block by factor interactions.
Figures 11-A and 11-B show RMS glideslope error was lowerfor subjects trained with the COMMAND display versus thosetrained with the CONVENTIONAL display in trials 1-5. Later intransfer (trials 26-30), subjects trained with the CONVENTIONALdisplay had surpassed those trained with the COMMAND display.Figure 11-C also shows RMS glideslope error was lower forsubjects trained with the RATE display versus those trained withthe CONVENTIONAL display in trials 1-5, but this effect quicklydissipated.
While subjects tended to fly above the glideslope in earlytransfer trials, this tendency was more extreme after trainingwith the CONVENTIONAL display than after training with the RATEdisplay (Figure 12). The tendency for CONVENTIONAL trainedsubjects to fly higher on the glideslope continued through
4 transfer trials 11-15, but not thereafter.
There was an interaction of FLOLS size for the comparisonof trials 6-10 versus 21-25 in both the middle segment (F(1,120)=4.50, p < .05) and close-in segment (F(1,120)=4.48, p < .05)
26

* NAVTRAEQUIPCEN 81-C-0105-9
50-
-~40-
S30-
~ 20=~-------~ .. Part-Task
~ Whole-Task
S10-
1-5 6-10 1115 16.20 21-25 26-30Transfer Trials
(A) Middle Segment
50
~40-
2 30-
20-
* ~- .- ~.Part-Task10- Whole-Task
* ~ 10
*1-5 6-10 11-15 16-20 21:25 26:30Transfer Trials
(B) Close-In Segment
* Figure 8. Block x task interactions for RMS glideslopeerror during transfer.
27

*~~~~~~, -7 K ~- - - . . . .
NAVTRAEQUIPCEN 81-C-0105-9
T40-
. 30-
0
w4U0.
-~ 10 .. Part-Task
Whole-Task0-
1-5 6.10 11-15 16-20 2 1'25 230
Transfer Trials(A) Middle Segment
40-
±t 30-
S20-
wCL
0 10-0 Part- Task
~ 0 -- - -Whole-Task
00
T T
1-5 6-10 11-15 16-20 21-25 26-30Transfer Trials
(B3) Close-In Segment
0 Figure 9. Block x task interactions for averageglideslope error during transfer.
28

NAVTRAEQIJIPCEN 81-C-0105-9
0
C .
0-4-
EwwE r_ 23I
ci 2
U,
,/N
0O
4,1
CO 4 -4* C
* 04-
/1 U)rt50
4-' E-
0 1)7 c
C).
LO R/ C-.r1
(1031 ul) JOJJ3 ado1soPlIE Syk
29

*e NAVTRAEQUIPCEN 81-C-0105-9
*TABLE 4. SUMMARY OF FLOLS TYPE INTERACTIONSCOMPARING TRIALS 1-5 VERSUS 26-30FOR RMS AND AVERAGE GLIDESLOPE ERROR
RMS Glideslope Error
Factor Segment F Prob
Conventional vs COMMAND Middle 3.50 *
Conventional vs COMMAND Close-in 6.19 **
Conventional vs RATE Close-in 2.92 *
Average Glideslope Error
Factor Segment F Prob
Conventional vs RATE Middle 5.42 **
Conventional vs RATE Close-in 4.79 **
*p: < .10**p: < .05
03
0
.9 I . ., ,I

* NAVTRAEQUIPCEN 81--C-0105-9
-1 ~ 36-
6za 28i o "~-~ ComandComnd ~ 2
~12{Convent onal I Conventional
a: T
Tras 26 -30 1 -5 Tras 26-30
(A) Conventional x Command (B) Conventional x Command
[Middle Segment] (Close-in Segment]
1442S 36-1
&28~
S20jN NN
0 121Rate
Conventional
1-5 26-30Trials
(C) C-onventional x Rate[Close-In Segment]
Figure 11. FLOLS type interactions of Rms glideslope* error during transfer.
* 31

NAVTRAEQUIPCEN 81-C-0105-9
40-
.- 30-
N
U,) N'
\ ' 1820 N
10-
RateConventional
101
1-5 26-30Trials
(A) Middle Segment
40-
II
+ 30-
CL
w\20" N " N
2 10"4)0\
'-Rate" ~'Conventional
0-
T
1.5 26-30Trials
(B) Close-In Segment
Figure 12. FLOLS type interactions for averageglideslope error during transfer.
IJ.
32

NAVTRAEQUIPCEN 81-C-0105-9
for RMS jlideslope crror. Error scores were lower for subjectstrained with the large FLOLS versus those trained with the smallFLOLS in trials 6-10. A slight reversal occurred in trials21-25 and RMS glideslope error in this transfer block was lowerfor subjects trained with the small FLOLS versus those trainedwith the large FLOLS (Figure 13). There was no difference atthe. end of transfer in the critical close-in segment.
There was a significant interaction of task by FLOLS typeby FLOLS size in the close-in segment for RmS glideslope error(Table 3). Transfer performance was superior for whole-taskt[,jlninJ conditions except when part-task training was combincedwith the RATE display and small FLOLS (Figure 14). Transferperformance following training with the part-task, RATE display,and small FLOLS condition was as good as performance under anyof the whole-task conditions, This interaction accounted for15% of the between-subjects experimental variance in theclose-in segment.
The ATARI covariate was significant in the close-in segmentfor RMS glideslope error (Table 3). Performance on the ATARIvideo game accounted for a substantial 19% of thebetween-subjects experimental variance in this segment.
RMS ANGLE-OF-ATTACK. There were no statistically significantmain effects for the transfer trials (Table 3).
There was a block by task interaction and a block by FLOLStype interaction in the middle segment (Table 3). Figure 15-Aindicates that the block by task interaction was significantbecause of an upturn in the RMS AOA error scores for thepart-trained subjects toward the end of transfer. This block bytask interaction accounted for 4% of the within-subjectsexperimental variance in the middle segment. Figure 15-Bindicates that the significant block by FLOLS type interactionresulted from a sharp improvement in RMS AOA error for theCOMMAND trained subjects in early transfer, followed by asimilarly sharp deterioration in later transfer. This block byFLOLS type interaction accounted for 10% of the within-subjectsexperimental variance in the middle segment.
There were various significant interactions comparingtrials 1-5 versus 26-30 for RMS AOA error. These interactionsare summarized in Table 5. RMS AOA error was lower for subjectstrained on the part task versus those trained on the whole taskin trials 1-5. This effect is consistent with the block by taskinteraction previously noted for this segment.
Figures 16-A and 16-8 show RMS AOA error was lower forsubjects trained with the COMMAND display versus those trainedwith the CONVENTIONAL display in trials 1-5. These error scorescontinued to be lower through transfer trials 21-25, but thetrend was reversed in trials 26-30. Figures 16-C and 16-D also
33

NAVTRAEQUIPCEN 81-C-0105-9
-28-
*22-
.Large FLOLSV-
16 Small FLOLS
16 1
6-10 21.25Trials
(A) Middle Segment
21-
C-19-
LAj 16-
0 -. Large FLOLS*~13
Small FLOLSS10
6-10 21-25Trials
(B) Close-In Segment
error during transfer.
34

NAVTRAEQUIPCEN 81-C--0105-9
0
4,4-)L) 44
a (
- -Lo
E4
4-1 1
0
m 0-4 -4
/ 4J
I /-I /D
xa4pao;ui) OJJ adosap1E) ~y)
35a

NAVTRAEQLJIPCEN 81-C-0105-9
.70-Z
o .6 - - ----- - Whole-TaskPart-Task2.50
LU
,~.40-
S.30
0 T,
1-5 6-10 11-15 16-20 21-25 26.30Transfer Trials
(A) Block x Task
.70-
0 .60 \
- ~Command2.50-
U
S.40
S.30
1-5 6-10 11-15 16-20 21:25 26'30Transfer Trials
(B) Block x FLOLS Type
£ Figure 15. Block x task and block x FLOLS typeinteractions of RMS angle-of-attackerror for the middle segment duringtransfer.
36

- -'--- .- '--w' - . -. - - - n..' -. - -. - . - - - . - - .*- _ - .- -. - , - .- - I
NAVTRAEQUIPCEN 81-C-0105-9
TABLE 5. SUMMARY OF TASK TYPE, FLOLS TYPE,AND FLOLS SIZE INTERACTIONS COMPARINGTRIALS 1-5 VERSUS 26-30 FOR RMS AOA ERROR
Task Type
Factor Segment F Prob
Part versus Wnole Middle 3.77
FLOLS Type
Factor Segment F Prob
Conventional versus Command Middle 5.42 **
Conventional versus Command Close-in 3.79 *
FLOLS Size
Factor Segment F Prob
Large versus Small Middle 6.88
Large versus Small Close-in 5.51 **
*: p < .1)•**: p < . 5
p < .05
4
4
4 37
* * ~w -. - . * .* .

* NAVTRAEQUIPCEN 81-C-0105-9
0 0
75 Command.60
- Command4 .50- <.65-o 0 Cne4 5Conventional <4toa.41601Cnetoa
1-5 26-30 1-5 26-30Trials Trials
*(A) FLOLS Type Interaction (B) FLOLS Type Interaction[Middle Segment] [Close-In Segmnent]
4 .65- 4.80-0 0. Small
.6 75-Sal FLOLSS 60
&LU F LLS LU< .50- La rge < .65-C FLOLS 0Lag< .45- .6o arg
FLOLST T
1.5 26-30 1-5 26-30Trials Trials
(C) FLOLS Size Interaction (D) FLOLS Size Interaction(Middle Segment] [Close-in Segment]
* Figure 16. FLOLS type and FLOLS size interactions ofRMS angle-of-attack error during transfer.
38

NAVTRAEQUIPCEN 81-C-0105-9
show RMS AOA error was lower for subjects trained with the smallFLOLS versus those trained with the large FLOLS in trials 1-5.A reversal occurred in trials 26-30 in the close-in segment.RMS AOA error in trials 26-30 was lower for subjects trainedwith the large FLOLS versus those trained with the small FLOLS.
There was a block by task by FLOLS size interaction forboth segments (Table 3). Figure 17 shows that in the middlesegment, subjects who had trained with the whole task and lorgeFLOLS started the transfer phase with the highest AOA error
- cores and that trend continued throughout transfer. Subjectswho had trained with the part-task and small FLOLS started thetransfer phase with the lowest error scores. However, theinteraction in the critical close-in segment was only moderatelysignificant (p < .10) and was not as well defined. subjectstrained with tne whole task and large FLOLS had lower AOA errorscores at the start of transfer versus those trained with thewhole task and small FLOLS. There did not appear to be anydifference between these two conditions in the remainingtransfer trials for this segment.
The ATARI covariate was moderately significant in theclose-in segment and accounted for 10% of the between-subjectsexperimental variance.
RMS LINEUP ERROR. The only significant main effect for thetransfer trials was that of FLOLS type in the middle segment(Table ?). ILMS lineup error was lower for subjects trained withthe RATE and CONVENTIONAL displays versus subjects trained withthe COMMAND display. The Newman-Keuls Test for comparison ofthe mean differences between the RATE and COMMAND display andtle CONVENTIONAL and COMM\ND display approached significance atthe .05 level. This effect accounted for 9% of thebetween-subjects experimental variance in the middle segment.
There was a significant FLOLS size by FLOLS typeinteraction for both segments (Table 3) Figure 12 indicatu';that subjects trained with the small FLOLS and RATE display hadthe lowest error scores. The FLOLS size by F[.OLS typeinteractions accounted for an average of 12% of thebetween-subjects experimental variance.
There was a significant block by task interaction and bloc,by FLOLS type interaction in the close-in segment (Table 3). Asexpected, subjects trained with the part task had hiqher errorsAres ,t the start of tririsfet , but rapidly iinproved theirperformances close to those of the whole-trained subjects(Figure 19-A). In the block by FLOLS type interaction, subjcctstrained with the COMMAND and CONVENTIONAL displays had high(error :,;cores a t the start of transfer, whereas subjects trained!with the RATE display showed good transfer performanceimmediately (Figure 19-B). However, after only a few trials,all groups were performing well.
'19

9 NAVTRAEQUIPCEN 81-C-0105-9
LO -c-j 0 0
U- Ll-
0--
0N 44
0
C -4
(N
-4
U
U')
(sm~(I -O ul OJ CV 005vS V
40 I

" - r
NAVTRAEQUIPCEN 81-C-0105-9
- Large 1LOLS
---- ,,,,ASmall FLOLS<" 50 . . .
.
T* [4
Conventional Rate Command
(A) Middle Segment
70i
C
30SalFOL
-Large FLOLS
S10
T'
Convent,onal Rate Command
(8) Close-In Segment
Fi u. i. FLOLS size x FL L .~ t',_pe interactions !-r?,MS lineup error cu-In transfer.
* 41

.* NAVTRAEQUIPCEN 81-C-0105-9
90
70-
, 5 0 -
-- 50 Part-Task
.30t Whole-Task
10
1-5 6-10 11.15 16.20 21'25 26-30Transfer Trials
(A) Block x Task
904
70 ',
I \ '
5 5-3 \N~",C . -- ., mm a i
- - -- - -- - R t
11Rate1
T1-5 6-10 11-15 16-20 21 .25 26-30
Transfer Trials
(B) Block x FLOLS Type
Figure 19. Block x task and block x FLOLS typeinteractions of RMS lineup error forthe close-in segment during transfer.
42
• * ... . - - - - - . - . . . ..-

NAVTRAEQUIPCEN 81-C-01(15-9
The ATARI covariate was highly significant and accountedfor an average of 27% of the between-subjects experimentalvariance in the segments.
n
0
". 43/44

NAVTRAEQUIPCEN 8I--C-0l105-9
SECT ION IV
DI SCUS SI ON
Of the two sets of data provided by i transfer-of-trainingstudy, only the transfer set jt-ov iie e\,idence of differenti atraining effectiveness. As arjued by Salmoni, Schmidt, andWalter (1984) , tr en ds ir tiet tr, ninj data nay be the result ,ftransient performance effects, and may not reflect anyrelatively permanent difference_; in learning. The training dat-are discussed here specifically to ensure that they follow areasonable pattern, and because the trends may assist in theexplanation of trends in the transfer data. Thus, the followingdiscussion of differential training effectiveness will relyprimarily on the transfer data.
TRAINING PERFORMANCE
Substantial learning occurred in the training phase of thee):periment as evidenced by the reliable block (learning) effectsand the amount of variance accounted for by these effects forall measures of performance.
TA;K EFFECT. There was no difference between trainingperformance of the part-task and the whole-task groups on anyj ids lope measures of performance. Hence, the part-task methodappears to have been successful in providing an effective(although not superior) learning environment for glideslopetr -ac k in,.I .
FrII inig p,- r formance of thIe part-task subjects versuswJ I, <-.task :;nb j ect: was rel iably better on anqle-of-attack"'_' r, . Thji, may have been the result of the greater demand on
_dr,,11! r ol for thIe part-task group. The view of th-r rr ..r in t, p rt-task condition was sl ight]y different as a
1 ,n . Of iv- n,', ,i to start with an, to maint ain zero vorti i,. "ty tI '; 7 'n gi ideslope. As it took less attitude chang e
. _ ar - t -k condition aj oppo se.d to the whole-t, t",, .Ition to lose sight of the aircraft carrier beneath the no,e
' ....ckp , sebjct may have te nded to i imit their at titud,,in in t he part-task condition.
'I ;'. iht h I r (c t i in o [ If i z, 'nmd t , k t.y)e W
1)1//T hg- 'Ime lar,ge FLOLS when used in the whole-task cond it ianw4,; , tective in hel.ping subjects learn ql ideslope trackinI;k iIIs in the simulator more quickly. However, the large FLOSi_' ' 11,,t a:; ,tfe :Live when used in the part-task condition. Apre:;ent there is no obvious. reason that part-task performan:wo u 1d be poorer with a 1a rg e FLOL.; than wit h a sia 11 F1, Lo'.
-

NAVTRAEQUIPCEN U--~U-
FLJSTYPE. There were no reliable t r a ining a d van ta g es W ithe2i th1e r the RATE o r COMMAND displays. Th e Se r e SuIt S a r
*surprising considering bo th t h- RATE anld COMMAND d is pla-3ysgicaty improved glideslope or a ck ini jfor experienced
triefr pilots (Ka L) e t al .,198!) . hoevr tey a r.c cri si St e nt wi th d a to- f rom Westra (198,2) ;h r als-o fa)und n,-,training, advantage with the COMMAND display-1, in earl y learning oft-h e carrier-landing ta s k. ThUS, i t appears that ea rlygl Iid eslo pe trac k ing pe r formance I limiited by the students'ab5ility to properl ,y execute the control movements. Considerableexperience, with a concomitant improvement in motor skill, seemsnecessary be foe trio, supplementary rate information can assist-glideslope tracking performance.
TRAN5FER PERFORMANCE
TAS K TY P :. TheQ r e s uIts i nd ic a te thatL glI id es lope controlf - o .w ii nj) part -task trai nnig was niot as acc Urtat as i t was a fte r; ,jle-tAsk trrainin. Transfer from the pa rt task produced poo r
0 t2adrl1y transfer in relation to transfer from the whole task, andthis disadvantage did niot appear to be entirely overcome by thleor l o f transfer. There was a three-way interaction whichinjice:i~e that part-task practice with the RATE display and
* ~ sial l FLOLS was as efci for gl ideslope control as waswho~ie-task practice. However , whilIe the po we r to test thisoverall interaction was adequate, there was niot enough power torJ_,rve its interpretation in relation to paired comparisons of
* c~ ~l Nevertheless, the implications of this interaction arei:oportant and will be discussed in the following paragraphs
togeherwith other task-type trends.
T:! cajrr~er lan-dingj task is difficult and, rI u r is hindar'i- rt ior)n oft i ts mo to r components . Prev ious part-task.r,, hasi, nd icaited that ii knowledge of comiponent interactionI es sa r tL tr a in a task with interdependent comnponents.a' :~ ndNaylo)r (1962) argued that smlrt tohe trcinf-for
k I L; r n( eded for effective learning of complex L.1S'* LI', ii ' ' f :;milarity between train ingj and transfer t a,"
h Iv in (I : t od toC the rfla t ive i nietf i c i e ny fIj sJhe'l fi i .l ~ tlwv . nd:; i[
II Iittt iod it. i on to the lack of ,similarity betweoc:In l 'r tas k:; mtothet fac t.o r relate d t to:t
!,j~~ ~ ~ t[ f I Ito pr"' it n ;i f.r am thiIe me ( t- ha1-1 I n J) aIo 2'c~ri n r perormr.:e.
the- -,rr ai intorma'tion tr-!'. the mea2,thalll is at[ zero)-., rt-1l 11'n; S y) . Howe:_ver, time! 1 1 in er Jan 11 t thle FLOIS
))a < lnj the apral to th car L-r ier so t hat thlit*~~~~ ti 1 wo i n(-nor e ;na v a o id aI r r-o 1- in the t
t1 il ill,it . ,I ion sle m 'I ,;m i 1 yo ill t 11 r tei 1
ri. 'f mm Ipp 'i. )Ih ImI li' 1) r -t m c:u)ri t, ion, suLbject;

NAVTRAEQUIPCEW 81-C-010i5--9
practiced gi ideslope control at onl y one point al on tcLfglideslope. While changes in display gain were not considerudcritical to learning, effective glideslope control, especiallyin the close- in segment, demands an awareness of anti i i Lpa tedmeatball movement and appropriate control responses. The FL()Ldisplay may not have been sensitive enough at the point at whichthe part-task subjects practiced glider"Iape control to enahleeffective learning ot rate interpretation skills from themeatball. The glideslope control techniques that were learnedwere probably based primarily on displacement error. Thus, thepart-task trained subjects may have been at a distinctdisadvantage, at time of transfer, in relation to their abilityto make judgments about rates of glideslope deviations.
The addition of the RATE display appears to have helped thepart-task subjects, who trained with the small FOLS, to followthe alides.ope more accurately in the close-in segment. Thesesubjects may have been able to learn so(me rate interpretationskills for transfer to the whole task. However, such anexplanation does not suggest why part-task subjects trained withthe large FLOLS did not similarly benefit from the addition ofthe RATE elements in traininq. Perhaps there is a confoundingproblem for part-task training with the RATE display and large
SLOL in transferring to the small FLOLS. Unfortunately, thestatistical power for comparison of pairs of cells was notadequate to ascertain the reliability of this result.
As noted earlier, AOA control in training was better LCrpart-trained subjects. This advantage carried over to early
transfer , al though the effect was brief and was statistic'- a.si.ni f icant only for the m idd Ie segment on which the pat
ui j e ct.! were trained. Never t h te ss o , this ir Id ira -JI- nco u r ;g ing for the part-task training strategy since AOA
7ontrol is considered to be as important as glideslope on t ro .A training strategy that could provide superior training on AOAcontrol, a,tong ;-hit adecjuate training on glid, lope control forthe carrier-landing task, would be beneficial.
AL; expected , a moderate amount oh transition traini i i.1 he whole task was sufficient to coordiiate t:e skills es'sentiaifor lateral control. In addition, it is expected t hat the
- - amount of transi tion training to coordinate lateral cont-rolwould ho much, less for students who lhave some flight experience.
I I nmm.ry, th e part-task traIning pr celire tested honeL( -,may be .. , u ,-fr ,Ilid-eslop, tra,iii J inst ruct ion if it c,,n ec] rm expens ive than whole-task train inj. Ir addition, it d idpr ''i( ., br ie' I and poss i hi y ue: t f f ] : h-ncemen t of ACA.low -,v,, , w i a t K to part- task tr i in , i I pr )vile j srme po.sitIv
t triI:;f ,r iii r, -ltior to B]t iwsi lope t I :c king , it. wa I not ao Ie c i i eI t aLe whole-task tra i ing. The par t- t.l sk traini l
t rf egJy YMighIt )e( further refined to L)%' ide better transfer inrelation to gI ideslope tracking, possibly by posi tioning the
47
.. . ... * - - -, . . . . - , . -

NAVTRAEQUIPCEN 81-C-0105-9
simulated aircraft closer to the touchdown area or bymanipulating the gain of the meatball. This technique offerssome promise as a relatively inexpensive method for earlycarrier-landing training, although further research seemsnecessary to establish its value.
FLOLS TYPE. There were no significant differential transfereffects on RMS glideslope tracking after training with theCONVENTIONAL, RATE, or COMMAND displays. However, theimprovement evident in transfer for all these groups was not asnoticeable for the group trained with the COMMAND display. Withthis particular display it was possible to ignore theconventional displacement information entirely, so that subjectscould have become dependent on the supplementary commandinformation. Thus, some difficulty in transitioning to theCONVENTIONAL display would be expected if subjects had notlearned to interpret the displacement information withreasonable efficiency, and this may account for the smallerimprovement in transfer following training with the COMMANDdisplay.
There were some minor differential transfer effects withother measures resulting from the use in training of theCONVENTIONAL, RATE, and COMMAND displays. AOA control wasbetter following training with the COMMAND display and poorerfollowing training with the RATE display. Subjects who learnedwith the COMMAND display apparently made glideslope correctionswith power (correct procedure), while subjects trained with theR ATE display seem to have preferred pitch corrections. While itis easier to track glideslope by adjusting pitch attitude, it isnot the correct technique for carrier landings. Pitchadjustments for glideslope tracking are not only dangerousin-close, but can lead to incorrect airspeed and pitch attitudeat touchdown, both of which can result in structural damage tothe aircraft.
There was a marked increase in AOA error for the COMMAND,t'-1hnod group at the end of transfer. This indicates that forsnme tinexpected reason, subjects started using more pi tchad] u.;tment; to track glideslope. This large increase in AOAerror is inconsistent with the rest of the transfer data and mayhav been a result of fatigue. It is, however, difficult to;(Jgqe!Jt why only one group would suffer the effects of fatigueat this point.
,ome differential transfer effects were also apparent withP/_I'11j e glideslope error. Subjects tended to fly above thelIJd,.,;lope in early transfer trials and this tendency was moreo xtrefmlf after training with the CONVENTIONAL and COMMAND• lispays than after training with the RATE display. This biasdoe(s not necessarily reflect a difference in overall performanct,
. quality, but it may be important from an operational viewpointbecau;e higher approaches often result in a bolter. Thus, RATE
48
7. e

NAVTRAEQUIPCEN 81-C-0105-9
training seems to offer the benefit of discouraging highapproaches.
The concept of reduced workload would suggest that if a, first-order display assisted glideslope control, it may also
assist lineup control because the subject could divert some ofhis attention to lineup control (Kaul eL al., 1980). The RATE
• display did encourage better lineup control although this effectagain occurred only in early transfer trials. However, therewas a lineup problem in the middle segment for subjects trainedwith the COMIMANP display. The COMMAND display may haveattracted more than its share of attention to the detriment oflineup, although this was not apparent in the training data.Lineup control was better for the COMMAND display in theclose-in segment, but in an operational environment, a largelineup error in the middle segment is to be avoided because itmay result in a wave off prior to reaching the close-in segment.
In summary, although there were some differential transfeteffects resulting from the use in training of the RATE andCOMMAND displays, there was not a significant performanceadvantage in glideslope control with either display. Previousresearch at the VTRS had shown a significant performanceadvantage in glideslope control for experienced pilots using theCOMMAND and RATE displays (Kaul et al., 1980). However,subsequent research at the VTRS found no performance or transferadvantage with the COMMAND display for pilots who were taughtcarrier landing in the simulator (Westra, 1981). Thus, eitherpilots who are in the early stages of learning the carrierlanding task do not benefit from the command display or theproper method of using it in training has not been found. RATEand COMMAND training did have some minor benefits on averageglideslope error and on RMS AOA error. This raises thepossibility that these displays might be used for remedialcorrection of specific bad habits. However, further evaluationof these displays is needed to thoroughly define their trainingvalue. For the present, it is suggested that the RATE andCOMMAND displays should not be introduced to pilots ontil the'yha v e become carrier qualified with, the conventional F L0LS.
FOv,; SIZE. Transition from a large to a small FLOLS producedrw s; ign ificant advantages or di sadvantages on g1 i desl ope
dimensions of performance. While there were sme :ignificmtinteraction effects from comparing trial blocks 6-10 and 21-25for RMS glides],ipe error, they appear to be ur, impor tin f()rtraining issues. Since there were no apparent negative effectsin initial transfer from large to small FLOLS, and thointeractions were weak, the significant effects were not judqJJto be operationally important.
There were some AOA effects resulting from the manipulationof FLOLS size. These effects were inconsistent across segments,with transition from the large FLOLS producing relatively poor
49

NAVTRAEQUIPCEN 81-C-0105-9
AOA control scores in the middle segment in early transfer, but
relatively good AQA control scores in the close-in segment in
later transfer. Thus, there may be a short-lived problem for
AOA control in transfer following the use of a large FLOLS intraining, but this would appear to be outweighed by the longerterm benefit that is evident with the crucial close-in segment.
In summary, transfer from a large to a small FLOLS had nodetrimental effects on glideslope performance, but there weresome effects on AOA control. Overall, these effects were
* considered to favor training with the large FLOLS, but there maybe a possible difficulty early in transfer. However, Navyflight students are likely to understand the need for good AOAcontrol far better than did the college students used in thisexperiment, and sufficient care during instruction should avoidany possible negative consequences from instruction with a largeFLOLS. Thus, it is concluded that the larger FLOLS can providesatisfactory training for the carrier landing task.
50
" S"
.. . ' ' '' 50.° - . i . . ' ..- .

NAVTRAEQUIPCE'N 81-C-0105-9
SECTION V
CONCLUSIONS
A quasi-transfer-of-training study was conducted with 3(flight-naive subjects to investigate a segmentation method ofpart-task training and two methods of visual augmentation forteaching simulated carrier landings. One visual enhancementinvolved adding two types of descent rate information(designated RATE and COMMAND) to the FLOLS display. The othervisual enhancement was enlargement of the FLOLS display. Theexperimental sequence consisted of 30 training trials withinstructional feedback under a particular experimentalcondition, followed by 30 test trials with no instructionalfeedback under the criterion condition (whole task withconventional and small FLOLS).
The segmentation method of part-task training used here wasnot as effective as was whole-task training. However, thepart-task manipulation was extreme, and apparently was lesseffective because students were unable to practice some criticaldimensions of the task. Nevertheless, part-task subjects didlearn some skills that could be applied to the whole task.There is also a realistic possibility that some adjustments inthe way the part-task procedure is set up would further enhanceits effectiveness. Further development may permit thisprocedure to be as effective as the backward chaining method ofpiart training that has been shown to be very effective forcarrier-landing instruction (Wightman, 1983). Thus, part-tasktraining shows promise as an effective training technique forthe carrier-landing tasks, particularly considering the factthat it would permit the use of a relatively inexpensivetraining device.
Previous studies at the VTRS had shown a significantperformance advantage in glideslope control with the COMMAND andRATE displdys for experienced carrier pilots, but no performanceof transfer advantage for student pilots who were taught carrierlandings in the simulator. The strong performance advantage torexperienced pilots had prompted a further test of the trainingeffectiveness of the two special FLOLS displays. In spite ofsome variations in experimental procedures, the results wereessentially similar to those of the previous training study.There is apparently no general performance or training benefitfrom the RATE or the COMMAND display with flight-naive subjectsor with pilots who have no prior carrier landing experience.There were, however, some minor differential transfer effectsresulting from the use in training of the CONVENTIONAL, RATE,and COMMAND displays. These might be useful in special remedialsituations and may have some implications for the way these
51

NAVTRAEQUIPCEN 81-C-0105-9
(iisploys are introduced into the fleet as permanent guidancesystems. For the present, it is suggested that the RATE andCOMMAND display should not be introduced to pilots until theyhave become carrier qualified with the conventional FLOLS.
Possibly, the most important finding of this study is thattransfer from a large to a small FLOLS has no generaldetrimentai t fects. Representation of the FLOLS is a criticalelement of a carrier landing trainer, and could addsubstantially to the cost of the simulator. The fact that alarger FLOLS can provide satisfactory training will permit aless expensive approach to simulating the FLOLS. A possibledifficulty with AOA control in early transfer was noted, butsufficient care in training should overcome this potentialproblem.
52 !7.0 i . : . . - " . , ' " i - ' " " ' , i "..

; '" - ° " - • ; ' ' - ' - " -- -- , - c. 'L -- - ' ° ,
NAVTRAEQUIPCEN 81-C-0105-9
REFERENCES
Adams, J.A., and Hufford, L.E. Contributions of a part-tasktrainer to the learning and relearning of a time-sharedflight maneuver. Human Factors, 1962, 4, 159-170.
Brictson, C.A. Analysis of F-4 aircraft day and night carrierapproaches. Aerospace Medicine, 1967, 38, 1219-1224.
Briggs, G.E., and Naylor, J.C. The relative efficiency ofseveral training methods as a function of transfer taskcomplexity. Journal of Experimental Psychology, 1962, 64,505-512.
Briggs, G.E., and Waters, L.K. Training as a function ofcomponent interaction. Journal of Experimental Psychology,1958, 56, 492-500.
Bunker, M.W. Training effectiveness versus simulation realism.SPIE Visual Simulation and Image Realism, 1978, 162, 76-82.
Caro, P.W. Some factors influencing Air Force simulatortraining effectiveness. Alexandria, VA: Human ResourcesResearch Organization, Report No. TR-77-2, 1977.
Cohen, J. Statistical Power Analysis for the BehavioralSciences. New York, NY: Academic Press, 1977.
Collyer, S.C., and Chambers, W.S. AWAVS, a research facilityfor defininq flight trainer visual requirements. InProceedings of the Human Factors Society 22nd AnnualMeeting (Detroit, Michigan) . Santa Monica, CA: HumanFactors Society, 1978.
Durand, T.S., and Wasicko, R.J. Fa tot.F irfluencing glidepathcontrol in carrier landing. Journal of Aircraft, 1967, 4,146-158.
(,c IJ, I. V uIiua percept ion of pi lots; in carr ier landing.,Journal of Aircraft, 1974, 1i, 723-729.
ilennessy, P., Lintern, G., ,nd 1 yely r, U. Unconventionalvisual displays for fl ight training. Orlando, FL: NavalTraining Equipment Center, Report No. 78 -C-0060-5, 1931.
Holding, D.11. Transfer between difficult and easy tasks.British Journal of Psychology, 1962, 53, 397-407.
"I. . ° . ° , - ."

o . . ..-
NAVTRAEQUIPCEN 81-C-0105-9
Hughes, R.G., Lintern, G., Wightman, D.C., Brooks, R.B., andSingleton, J. Applications of simulator freeze to carrierglideslope tracking instruction. Orlando, FL: NavalTraining Equipment Center, Report No. 78-C-0060-9/AFHRL-TR-82-3, 1981.
Jones, M.B., Kennedy, R.S., and Bittner, A.C. A video game forperformance testing. American Journal of Psychology, 1981,94, 143-152.
Levine, D.W., and Dunlap, W.P. Power of the F test with skeweddata: should one transform or not. PsychologicalBulletin, 1982, 92, 272-280.
Lintern, G. Transfer of landing skill after training withsupplemetary visual cues. Human Factors, 1980, 22, 81-88.
Lintern, G., Kaul, C.E., and Collyer, S.C. Glideslopedescent-rate cuing to aid carrier landings. Human Factors,In Press.
Lintern, G., and Kennedy, R.S. Video game as a covariate forcarrier landing research. Perceptual and Motor Skills,1984, 58, 167-172.
Lintern, G., Nelson, B.E., Sheppard, D.J., Westra, D.P., andKennedy, R.S. Visual Techology Research Simulator (VTRS)Human Performance Research: Phase III. Orlando, FL:
lTraining Equipment Center, Report No. 78-C-0060-11,1981.
Naylor, J.C., and Briggs, G.E. Effects of task complexity andtas'k organization on the relative efficiency of part andwhole training methods. Journal of ExperimentalPsychology, 1963, 65, 217-224.
Perry, B.L. Optical guidance systems: analysis, design anddevelopment. Washington, DC: Naval Research Laboratory,Report No. 6581, 1967.
Pew, R.W. Performance of human operating in a three-state relaycontrol system with velocity augmented displays. IEEETransactions of Human Factors in Electronics, 1966, HFE-7,77-83.
Salmoni, A.W., Schmidt, R.A., and Walter, C.B. Knowledge ofreslLs and motor learning: A review and criticalappraisal. Psychological Bulletin, 1984, 95, 355-386.
Schendel, J.D., Shields, J.L., and Katz, M.S. Retention otmotor skills: review. Alexandria, VA: U.S. ArmyResearch nstitute for the Behavioral and Social Sciences.Technical Paper 313, 1978.
54
.° .. .7-

06 NAVTRAEQUIPCEN 81-C-0105-9
Stammers, R.B. Part and whole practice for a tracking task:
C effects of task variables ariJ amount of practice.Perceptual and Motor Skills, 1980, 50, 203-210.
Staples, K.J. Current problems of flight simulators torresearch. Aeronautical Journal, January 1978, 12-32.
Stark, E.A. Simulation technology and the fixation phase.Aviation Space and Environment Medicine, 1982, 53, 984-991.
Weller, D.R. Predictor displays in carrier landing training.Orlando, FL: Naval Training Equipment Center, Report No.IH-311, 1979.
Westra, D.P. Simulator design features for carrier landing:II. In-simulator transfer of tra'iTng. Orlando, FL:Naval Training Equipment Center, Report No. 81-C-0105-1,1982.
Wightman, D. Part-task training strategies in simulated carrierlanding final approach training. Orlando, FL: NavalTraining Equipment Center, Report No. IH-347, 1983.
55/56

'4AV I I :UIPCLN'I~Y~5
Ai'Pi11)IX A
A, LE A -- _1 ,O BA61ILITY OF [i vx'.,:ri f "IN 7ALL, M VDI UMAN-', LARGE EFFECTS CF RMS LbsLji;Lt~ tOfO FOR THE
MIL,:LE AND CLOSE-IN SEWMENTS
middle Sejrnent
Effect Sizesmall Medium Lar~e
Pm S (;ide 1 1,e 1.36 2.72 6.16
Error
Power
S.Alp - .( -la1 .27 .84
Level .10 .18 .40 .92
Close-In Segrient
Effect SizeSmall Medium Large
RMS Glideslope .70 1.42 3.19Err
Power
Alpha .05 .09 .22 .74
Level .10 o16 .33 .85
*57, 58

-~~~~~~~~: -K v .- 9---v~,.- .- ,----
NAVTRAEQUIPCEN 81-C-0105-9
APPENDIX B
TRAINING DATA SUMMARY TABLES
TABLE B-I. REPEATED MEASURES ANALYSIS OF COVARIANCE OF RMS
GLIDESLOPE ERROR FOR THE MIDDLE SEGMENT DURING TRAINING
Source of Sum of Mean ProportionVariance Squares df Squares F of Variance
Between Factor
Task (Ta) .219 1 .219 .62 NSFLOLS Size (FS) .204 1 .204 .58 NSFLOLS Type (FT) .539 2 .270 .76 NSTa x FS 1.433 1 1.433 4.06* .11Ta x FT .820 2 .410 1.16 NSFS x FT .765 2 .382 1.08 NS'Ia x FS x FT .473 2 .236 .67 NSCovariate 1.02 1 1.022 2.90 NSError 8.110 23 .353
Within Factor
Blocks (B) 3.675 5 .735 27.89*** .41B x Ta .166 5 .033 1.26 NSB x E .233 5 .047 1.77 NSB x FT .163 10 .016 .62 NSB x Ta x FS .449 5 .090 3.41*** .05B x ra x FT .183 10 .018 .70 NSB x FS x FT .701 10 .070 2.66*** .08B x Ta x FS x FT .228 10 .023 .86 NSError 3.162 120 .026
• :P<.1o**:P<.05
•***:P< .01
59
.

NAVTRAEQUIPCEN 81-C-0105-9
TABLE B-2. REPEATED MEASURES ANALYSIS OF COVARIANCEOF RMS GLIDESLOPE ERROR FOR THECLOSE-IN SEGMENT DURING TRAINING
Source of Sum of Mean ProportionVariance Squares df Squares F of Variance
Between Factor
Task (Ta) .082 1 .082 .21 NSFLOLS Size (FS) .044 1 .044 .11 NSFLOLS Type (FT) .402 2 .201 .51 NSTa x FS 1.574 1 1.574 4.00* .10Ta x FT 1.329 2 .665 1.69 NSFS x FT .722 2 .361 .92 NSTa x FS x FT 1.124 2 .562 1.43 NSCovariate .744 1 .744 1.89 NSError 9.053 23 .394
------------------------------------------------------------------------------
Within Factor
Blocks (B) 4.804 5 .961 39.23*** .52B x Ta .174 5 .035 1.42 NSB x FS .178 5 .036 1.45 NSB x FT .231 10 .023 .94 NSB x Ta x FS .128 5 .026 1.04 NSB x Ta x FT .320 10 .032 1.31 NSB x FS x FT .378 10 .038 1.54 NSB x Ta x FS x FT .147 10 .015 .60 NSError 2.939 120 .024
**:p<.05***:p<.01
60
.. , ' . • .. • ,. , .. ., . • . . ... . .. . . '- -. .

NAVTRAEQUIPCEN 81-C-0105-9
TABLE B-3. REPEATED MEASURES ANALYSIS OF COVARIANCE OF AVERAGE
GLIDESLOPE ERROR FOR THE MIDDLE SEGMENT DURING TRAINING
Source of Sum of Mean ProportionVariance Squares df Squares F of Variance
Between Factor
Task (Ta) 1817 1 1817 1.64 NSFLOLS Size (FS) 417 1 417 .38 NSFLOLS Type (FT) 1412 2 706 .64 NSTa x FS 5256 1 5256 4.76** .13Tax FT 218 2 109 .10 NSFS x FT 4396 2 2198 1.99 NSTa x FS x FT 66 2 33 .03 NSCovariate 64 1 64 .06 NSError 25426 23 1105
Within Factor
Blocks (B) 41696 5 8339 11.91** .25B x Ta 3957 5 791 1.13 NS8 x FS 19419 5 3U9 .56 NSB x FT 5360 10 536 .77 N5B x Ta x F1; 791 5 1580 2.26* .05B x Ta x FT 6r31 10 C)3 .95 NS
x x iS IT 59"1 1 .85 NSB5 x Ta x F'S x FT 88018 111 880 1.26 NSLrror 84000 120 700
* P< (.05* * * :P<.*

NAVTRAEQUIPCEN 81-C-0105-9
TABLE B-4. REPEATED MEASURES ANALYSIS OF COVARIANCEOF AVERACE GLIDESLOPE ERROR FOR THE CLOSE-IN SEGMENT
DURING TRAINING
Source of Sum of Mean ProportionVariance Squares df Squares F of Variance
Between Factor
Task (Ta) 1347 1 1347 .80 NSFLOLS Size (FS) 14 1 14 .01 NSFLOLS Type (FT) 4396 2 2198 1.31 NSTa x FS 7808 1 7808 4.64** .14Ta x FT 21 2 11 .01 NSFoS x FT 3045 2 1522 .90 NSTa x FS x FT 674 2 337 .20 NSCovariate 250 1 256 .15 NS
. Error 38694 23 1682
Within Factor
Blocks (B) 61468 5 12293 12.02*** .25B x Ta 5211 5 1042 1.02 NSB x FS 3507 5 701 .69 NSB x FT 15885 10 1588 1.55 NSb x Ta x FS 16118 5 3223 3.15** .07B x Ta x FT 5385 10 538 .53 NSB x FS x FT 8022 10 802 .78 NSB x Ta x FS x FT 6342 10 634 .62 NSError 122727 120 1022
*:p<.10
**:p <.05***:p<.(l
62

NAVTRAEQUIPCEN 81-C-0105-9
TABLE B-5. REPEATED MEASURES ANALYSIS OF COVARIANCE OF RMSANGLE-OF-ATTACK ERROR FOR THE MIDDLE SEGMENT DURING TRAINING
Source of Sum of Mean ProportionVariance Squares df Squares F of Variance
Between Factor
Task (Ta) .1869 1 .1869 6.23** .17FLOLS Size (FS) .0018 1 .1869 .06 NSFLOLS Type (FT) .0281 2 .0140 .47 NSTa x FS .0057 1 .0057 .19 NSTa x FT .0679 2 .0339 1.13 NSFS x FT .0099 2 .0049 .16 NSTa x FS x FT .0869 2 .0435 1.45 NSCovariate .0002 1 .0002 .01 NSError .6902 23 .0300
Within Factor
Blocks (B) .1288 5 .0258 9.07*** .20B x Ta .0313 5 .0063 2.20* .05B x FS .0041 5 .0008 .29 NSB x FT .0129 10 .0013 .46 NSB x Ta x FS .0105 5 .0021 .74 NSB x Ta x FT .0251 10 .0025 .88 NSB x FS x FT .0757 10 .0076 2.67*** .12B x Ta x FS x FT .0243 10 .0024 .86 NSError .3407 120 .0028
*:P<.10**:p<.05
*** :p< .01
6
6,
()
• '. Z... .. '. : . . Z " .. " ' " " . . " - - L . o ; - , - - . '. -' -" . - ' ? < ' - .- , ,' .- ,.- • ; ... .. ,'...,,- .- ---- - - --'"-" ; --_" ; . . . 4 ,': -- , - - "-.-

NAVTRAEQUIPCEN 81-C-0105-9
TABLE B-6. REPEATED MEASURES ANALYSIS OF COVARIANCE OF RMSANGLE-OF-ATTACK ERROR FOR THE CLOSE-IN SEGMENT DURING TRANING
Source of Sum of Mean ProportionVariance Squares df Squares F of Variance
Between Factor
Task (Ta) .4012 1 .4012 11.53*** .27FLOLS Size (FS) .0001 1 .0001 .00 NSFLOLS Type (FT) .0433 2 .0216 .62 NSTa x FS .0002 1 .0002 .00 NSTa x FT .0681 2 .0340 .98 NSFS x FT .0147 2 .0074 .21 NSTa x FS x FT .1227 2 .0614 1.76 NS
• Covariate .0238 1 .0238 .68 NSError .8001 23 .0348
------------------------------------------------------------- ------------eeeeeeeeeeee
Within Factor
Blocks (B) .1931 5 .0386 10.44*** .23B x Ta .0288 5 .0058 1.56 NSB x FS .0043 5 .0009 .23 NSB x FT .0270 10 .0027 .73 NSB x Ta x FS .0112 5 .0022 .60 NSB x Ta x FT .0142 10 .0014 .38 NSB x FS x FT .0831 10 .0083 2.25** .10B x Ta x FS x FT .0186 10 .0019 .50 NSError .4442 120 .0037
S*:p<.10
* * :p< .05** :p<.01
640

NAVTRAEQUIPCEN 81-C-0105-9
TABLE B-7. MEAN GLIDESLOPE RMS ERROR (IN FEET)FOR THE MIDDLE SEGMENT DURING TRAINING
Trial Means 1-5 6-10 11-15 16-20 21-25 26-30
Task (Ta)
Whole 74.9 32.0 23.7 24.1 22.3 17.4Part 56.1 37.2 27.0 16.4 15.3 15.8
FLOLS Size (FS)
Small 65.2 34.3 21.1 20.1 18.5 17.4Large 65.9 35.0 29.6 20.5 19.2 15.8
O FLOLS Type (FT)
Conventional (Cv) 58.9 35.5 26.7 18.1 14.1 13.5Rate (Ra) 78.5 32.4 23.1 18.7 17.9 16.6Command (Cm) 59.5 36.0 26.3 24.0 24.4 19.7
65
. , o •~~ . , . . .
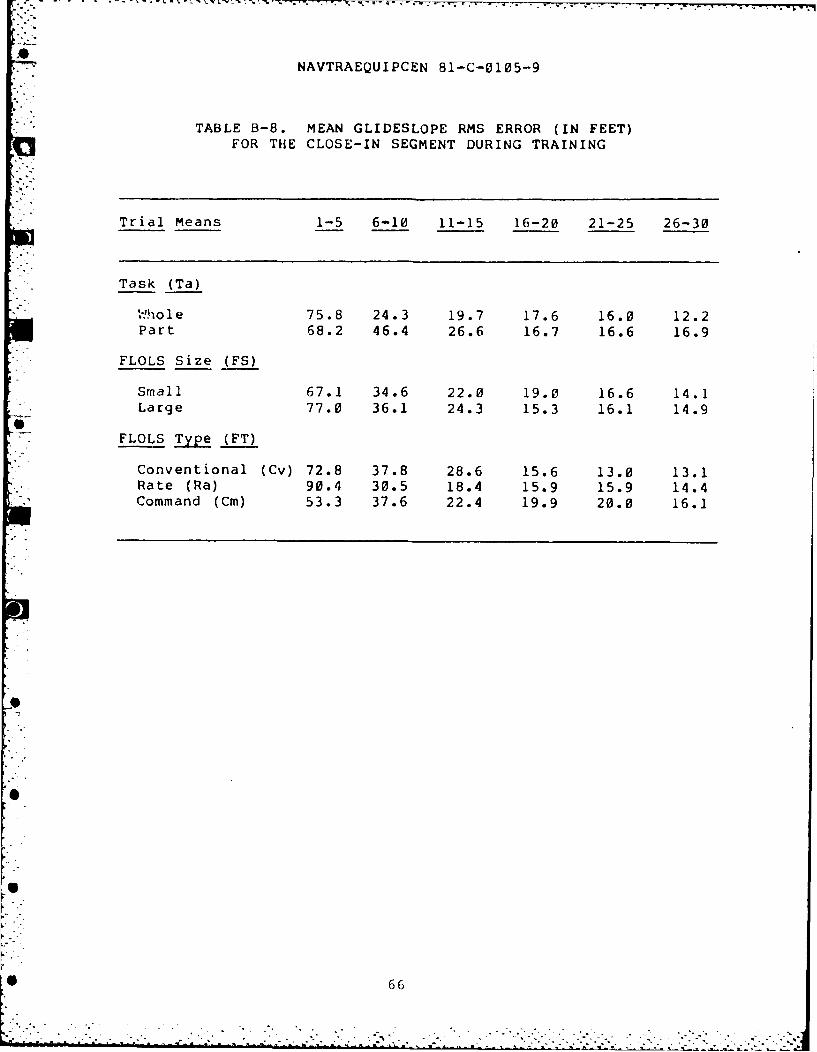
NAVTRAEQUIPCEN 81-C-0105-9
TABLE B-8. MEAN GLIDESLOPE RMS ERROR (IN FEET)FOR THE CLOSE-IN SEGMENT DURING TRAINING
Trial Means 1-5 6-10 11-15 16-20 21-25 26-30
Task (Ta)W ~ 9hole 75.8 24.3 19.7 17.6 16.0 12.2
Part 68.2 46.4 26.6 16.7 16.6 16.9
FLOLS Size (FS)
Small 67.1 34.6 22.0 19.0 16.6 14.1Large 77.0 36.1 24.3 15.3 16.1 14.9
FLOLS Type (FT)
Conventional (Cv) 72.8 37.8 28.6 15.6 13.0 13.1Rate (Ra) 90.4 30.5 18.4 15.9 15.9 14.4Command (Cm) 53.3 37.6 22.4 19.9 20.0 16.1
66
,. .

NAVTRAEQUIPCEN 81-C-0105-9
TABLE B-9. MEAN AVERAGE GLIDESLOPE ERROR (IN FEET, + HIGH)
FOR THE MIDDLE SEGMENT DURING TRAINING
Trial Means 1-5 6-10 11-15 16-20 21-25 26-30
Task (Ta)
Whole 52.9 17.6 9.2 7.8 1.4 1.6Part 29.2 14.9 10.5 1.3 1.3 - .7
FLOLS Size (FS)
Small 40.3 21.0 6.5 6.3 6.5 .9Large 41.9 11.5 13.2 2.8 -3.7 - .1
FLOLS Type (FT)
Conventional (Cv) 39.3 19.2 13.5 .4 3.0 -1.1Rate (Ra) 56.8 20.8 5.5 8.1 1.5 .1
Command (Cm) 27.5 8.8 10.6 5.3 -. 4 2.3
67
". " " " . ' ' . .' . . . .. . .

NAVTRAEQUIPCEN 81-C-0105-9
rABLE B-10. MEAN AVERAGE GLIDESLOPE ERROR (IN FEET, + = HIGH)FOR THE CLOSE-IN SEGMENT DURING TRAINING
5-Trial Means 1-5 6-10 11-15 16-20 21-25 26-30
Task (Ta)
Whole 61.9 13.9 9.0 9.2 3.5 2.5Part 38.4 21.6 10.8 3.9 1.8 -3.2
FLOLS Size (FS)
Small 41.4 17.2 9.0 9.8 5.4 - .6Large 58.9 18.3 10.8 3.3 - .1 - .2
FLOLS Type (FT)
Conventional (Cv) 56.4 25.4 18.9 5.9 2.8 -1.5Rate (Ra) 74.7 13.8 4.2 8.1 2.8 1.7Command (Cm) 19.9 14.1 6.5 5.7 2.4 -1.3
68
- .' - . -. •. . .

NAVTRAEQUIPCEN 81-C-0105-9
TABLE B-li. MEAN ANGLE-OF-ATTACK RMS ERROR (IN AOA UNITS)FOR THE MIDDLE SEGMENT DURING TRAINING
5-Trial Means 1-5 6-10 11-15 16-20 21-25 26-30
Task (Ta)
Whole .754 .716 .607 .601 .621 .546Part .811 .642 .478 .327 .291 .322
FLOLS Size (FS)
Small .791 .656 .583 .481 .450 .459Large .775 .702 .502 .446 .462 .409
FLOLS Type (FT)
Conventional (Cv) .720 .716 .523 .410 .353 .403Rate (Ra) .715 .540 .459 .438 .409 .401Command (Cm) .912 .781 .645 .543 .606 .498
69

NAVTRAEQUIPCEN 81-C-0105-9
TABLE B-12. MEAN ANGLE-OF-ATTACK RMS ERROR (IN AOA UNITS)FOR THE CLOSE-IN SEGMENT DURING TRAINING
5-Trial Means 1-5 6-10 11-15 16-20 21-25 26-30
Task (Ta)
Whole 1.05 .845 .755 .747 .899 .663Part .838 .717 .469 .321 .302 .345
FLOLS Size (FS)
Small .956 .750 .709 .523 .607 .536Large .934 .813 .515 .544 .594 .472
FLOLS Type (FT)
Conventional (Cv) .946 .834 .457 .441 .401 .460Rate (Ra) .954 .634 .589 .488 .630 .499Command (Cm) .934 .876 .791 .673 .769 .552
0
7
-
... .- ..

NAVTRAEQUIPCEN 81-C-0105-9
APPENDIX C
TRANSFER DATA SUMMARY TABLES
TABLE C-1. REPEATED MEASURES ANALYSIS OF COVARIANCE OFRMS GLIDESLOPE ERROR FOR THE MIDDLE SEGMENT DURING TRANSFER
Source of Sum of Mean ProportionVariance Squares df Squares F of Variance
* Between Factor
Task (Ta) .6-57 1 .657 4.90~** .13FLOLS Size (FS) .070 1 .070 .52 NSFLOLS Type (FT) .112 2 .05r6 .42 NETa x FS .020 1 .020 .15 NSTa x FT .439 2 .219 1.64 NSFS x FT .193 2 .096 .72 NSTa x F S x FT .322 2 .161 1.20 N SCovariate .100 1 .100 .75 NSError 3.085 23 .134
Within Factor
Blocks (B) 1.087 5 .217 9.54*** .21B x T a .302 5 .060 2.65** .06
*B x FS .131 5 .026 1.15 NSB x FT .152 10 .015 .67 NSB x Ta-, x FS .040 5 .008 .35 NSB x Ta x FT .424 10 .042 1.86* .08B x FS x FT .187 10 .019 .82 NSB x Ta x FS x FT .171 10 .017 .75 NS
*Error 2.734 120 .023
* P. 10**:P< .05
***<O
7 1

NAVTRAEQUIPCEN 81-C-0105-9
TABLE C-2. REPEATED MEASURES ANALYSIS OFCOVARIANCE OF RMS GLIDESLOPE ERROR FOR THE
CLOSE-IN SEGMENT DURING TRANSFER
Source of Sum of Mean ProportionVariance Squares df Squares F of Variance
Between Factor
Task (Ta) .550 1 .550 4.69** .10FLOLS Size (FS) .000 1 .000 .00 NSFLOLS Type (FT) .193 2 .096 .82 NSTa x FS .010 1 .010 .09 NSTa x FT .156 2 .078 .66 NSFS x FT .094 2 .047 .40 NSTa x FS x FT .853 2 .426 3.64** .15Covariate 1.061 1 1.061 9.05*** .19Error 2.695 23 .117
Within Factor
Blocks (B) 1.923 5 .385 19.24*** .35B x Ta .329 5 .066 3.29*** .07B x FS .105 5 .021 1.05 NSB x FT .270 10 .027 1.35 NSB x Ta x FS .053 5 .011 .54 NSB x Ta x FT .218 10 .022 1.09 NSB X FS X FT .113 10 .011 .56 NSB x Ta x FS x FT .084 10 .008 .42 NSError 2.398 120 .020
* < . 10
*** :p< . 01.0
* 72
. .k. .... A. '-..t ' . " *. ... .... 2 t -- 2: .2. . 2 ."" * . -- . - .' -'-> . - 2 .-: .- - -. . .. -2- . -.. . . 2 . . - ''" - ". - -

NAVTRAEQUIPCEN 81-C-0105-9
TABLE C-3. REPEATED MEASURES ANALYSIS OF COVARIANCE OF
AVERAGE GLIDESLOPE ERROR FOR THE MIDDLE SEGMENT DURING TRANSFER
Source of Sum of Mean ProportionVariance Squares df Squares F of Variance
Between Factor
Task (Ta) 7706 1 7706 9.58*** .23FLOLS Size (FS) 179 1 179 .22 NSFLOLS Type(FT) 2330 2 1165 1.45 NSTa x FS 17 1 17 .02 NSTa x FT 1919 2 960 1.19 NSFS x FT 917 2 459 .57 NSTa x FS x FT 947 2 474 .59 NSCovariate 354 1 355 .44 NSError 18493 23 804
Within Factor
Blocks (B) 6175 5 1235 5.71*** .13B x Ta 6696 5 1339 6.19*** .14B x FS 817 5 163 .76 NSB x FT 1800 10 180 .83 NSB x Ta x FS 445 5 89 .41 NSB x Ta x FT 2128 10 212 .98 NSB x FS x FT 1666 10 167 .77 NSB x Tax FS x FT 1201 10 120 .56 NS
Error 25945 120 216
*:p<.10** :p< .05
* : p< . 01
4 73
* . . .*. • -I .- *. ** -

NAVTRAEQUIPCEN 81-C-0105-9
TABLE C-4. REPEATED MEASURES ANALYSIS OF COVARIANCE OF*AVERAGE GLIDESLOPE ERROR FOR THE CLOSE-IN SEGMENT DURING TRANSFER
Source of Sum of Mean ProportionVariance Squares df Squares F of Variance
Between Factor
Task (Ta) 2498 1 2498 4.17* .12FLOLS Size (FS) 5 1 5 .01 NSFLOLS Type (FT) 1121 2 560 .94 NSTa x FS 545 1 545 .91 NSTa x FT 496 2 248 .41 NSFS x FT 297 2 149 .25 NSTa x FS x FT 892 2 446 .74 NSCovariate 421 1 421 .70 NSError 13766 23 599
Within Factor
Blocks (B) 8020 5 1604 8.18*** .18B x Ta 4853 5 970 4.95*** .11B x FS 533 5 107 .54 NSB x FT 1912 10 191 .97 NSB x Ta x FS 923 5 185 .94 NSB x Ta x FT 2370 10 237 1.21 NSB x FS x FT 938 10 94 .48 NSB x Ta x FS x FT 726 10 73 .37 NSError 23543 120 196
*:p<.10**:p<.05
*** :p<.01
74
. *-.

NAVTRAEQUIPCEN 81-C-0105-9
TABLE C-5. REPEATED MEASURES ANALYSIS OF COVARIANCE OF RMSANGLE-OF-ATTACK ERROR FOR THE MIDDLE SEGMENT DURING TRANSFER
Source of Sum of Mean ProportionVariance Squares df Squares F of Variance
Between Factor
Task (Ta) .0357 1 .0357 1.57 NSFLOLS Size (FS) .0121 1 .0121 .53 NSFLOLS Type (FT) .0491 2 .0245 1.08 NSTa x FS .0037 1 .0037 .16 NSTa x FT .0287 2 .0143 .63 NSFS x FT .0046 2 .0023 .10 NSTa x FS x FT .0353 2 .0177 .78 NS
4 Covariate .0037 1 .0037 .16 NSError .5227 23 .0227
Within Factor
Blocks (B) .0124 5 .0024 4.72*** .10B x Ta .0051 5 .0010 1.93* .04P x FS .0045 5 .0009 1.72 NSB x FT .0127 10 .0013 2.43** .10B x Ta x FS .0084 5 .0017 3.21*** .07B x Ta x FT .0045 10 .0004 .86 NSB x FS x FT .0068 10 .0007 1.29 NSB x Ta x FS x FT .0085 10 .0009 1.62 NSError .0629 120 .0005
* p< . 10** p< . 05
* ** :<. 1
7 5

NAVTRAEQUIPCEN 81-C-0105-9
TABLE C-6. REPEATED MEASURES ANALYSIS OF COVARIANCE OF RMSANGLE-OF-ATTACK ERROR FOR THE CLOSE-IN SEGMENT DURING TRANSFER
* Source of Sum of Mean ProportionVariance Squares df Squares F of Variance
*Between Factor
Task (Ta) .0116 1 .0116 .54 NSFLOLS Size (FS) .0017 1 .0017 .08 NSFLOLS Type (FT) .0482 2 .0241 1.12 NSTa x FS .0011 1 .0011 .05 NSTa x FT .0071 2 .0035 .16 NSFS x FT .0197 2 .0099 .46 NS
* Ta x FS x FT .0407 2 .0204 .95 NSCovariate .0687 1 .0687 3.20* .10Error .4939 23 .0215
Within Factor
Blocks (B) .0199 5 .0040 2.23* .05B x Ta .0054 5 .0011 .61 NSB x FS .0166 5 .0033 1.87 NSB x FT . 23 10 .0022 1.25 NS[3 x Ta x FS .0199 5 .0040 2.24* .05B x Ta x FT .0213 10 .0021 1.20 NSB x FS x FT .0238 10 .0024 1.34 NSB x Ta x FS x FT .0202 10 .0020 1.14 NSError .2134 120 .0018
K':X . 10
** :p<. (05
*** :p(<.01
-0 7 ()

NAVTRAEQUIPCEN 81-C-0105-9
TABLE C-7. REPEATED MEASURES ANALYSIS OF COVARIANCE OF RMSLINEUP ERROR FOR THE MIDDLE SEGMENT DURING TRANSFER
Source of Sum of Mean ProportionVariance Squares df Squares F of Variance
Between Factor
Task (Ta) .003 1 .003 .01 NSFLOLS Size (FS) .157 1 .157 .82 NSFLOLS Type (FT) 1.112 2 .556 2.91* .09Ta x FS .967 1 .067 .35 NSTa x FT .484 2 .242 1.27 NSFS x FT 1.616 2 .808 4.23** .14Ta x FS x FT .568 2 .284 1.49 NSCovariate 3.416 1 3.416 17.91*** .29Error 4.388 23 .191
-------------------------------------------------------------------------------
Within Factor
Blocks (B) .207 5 .041 1.16 NSB x Ta .153 5 .031 .86 NS8 x FS .108 5 .022 .61 NSB x FT .326 10 .032 .92 NSB x Ta x F'S .494 5 .099 2.78** .07B x Ta x FT .175 10 .018 .49 NS
* B x FS x FT .481 10 .048 1.35 NSB x Ta x FS x FT .400 10 .040 1.13 NSError 4.268 120 .036
*:p<.10" **:p<(05
***:p<.01
.
I: . 77
0 . :, . . -" . ". " z ' ". " . . ... . . , -. . .

NAVTRAEQUIPCEN 81-C-0105-9
TABLE C-8. REPEATED MEASURES ANALYSIS OF COVARIANCE OF RMS
LINEUP ERROR FOR THE CLOSE-IN SEGMENT DURING TRANSFER
Source of Sum of Mean ProportionVariance Squares df Squares F of Variance
Between Factor
Task (Ta) .323 1 .323 1.41 NSFLOLS Size (FS) .209 1 .209 .91 NSFLOLS Type (FT) .735 2 .368 1.61 NS
Ta x FS .019 1 .019 .08 NSTa x FT .668 2 .334 1.46 NSFS x FT 1.190 2 .595 2.60* .10Ta x FS x FT .868 2 .434 1.90 NSCovariate 3.101 1 3.101 13.55*** .25Error 5.263 23 .229
Within Factor
Blocks (B) .495 5 .099 4.25*** .10B x Ta .234 5 .047 2.01* .05B x FS .128 5 .026 1.09 NS
B x FT .447 10 .045 1.92** .09B x Ta x FS .159 5 .032 1.36 NSB x Ta x FT .249 10 .025 1.07 NSB x FS x FT .297 10 .030 1.27 NSB x Ta x FS x FT .338 10 .034 1.45 NSError 2.798 120 .023
• _ *:p< .10** :p<. 05
*** :p< .01
78
S.o. o'
- . .. . • , •. . . . . . . ..

, , --
NAVTRAEQUIPCEN 81-C-0105-9
TABLE C-9. MEAN GLIDESLOPE RMS ERROR(IN FEET) FOR THE MIDDLE SEGMENT DURING TRANSFER
5-Trial Means 1-5 6-10 11-15 16-20 21-25 26-30
Task (Ta)
Whole 23.4 20.5 20.4 21.2 16.6 15.2Part 47.6 29.6 23.9 21.4 20.7 20.6
FLOLS Size (FS)
Small 34.0 25.7 21.4 20.3 16.4 16.2Large 37.0 24.4 22.8 22.3 21.0 19.5
FLOLS Type (FT)
Conventional (Cv) 41.8 24.3 19.2 21.2 16.8 15.7Rate (Ra) 30.3 24.5 21.3 19.2 19.1 17.3Command (Cm) 34.4 26.3 25.9 23.5 20.1 20.7
* 79
-V,

NAVTRAEQUIPCEN 81-C-0105-9
TABLE C-10. MEAN GLIDESLOPE RMS ERROR (IN FEET)FOR THE CLOSE-IN SEGMENT DURING TRANSFER
5-Trial Means 1-5 6-10 11-15 16-20 21-25 26-30
Task (Ta)
Whole 17.7 12.8 14.4 13.2 10.6 11.1Part 44.6 21.6 19.3 15.8 14.7 14.8
FLOLS Size (FS)
Small 32.9 19.5 16.5 13.5 11.4 12.6Large 29.3 14.9 17.2 15.5 13.8 13.4
FLOLS Type (FT)
Conventional (Cv) 36.3 20.5 14.9 13.4 11.8 10.2Rate (Ra) 25.1 15.5 15.3 13.8 11.6 11.4Command (Cm) 32.1 15.7 20.3 15.8 14.4 17.4
80

NAVTRAEQUIPCEN 81-C-0105-9
TABLE C-11. MEAN AVERAGE GLIDESLOPE ERROR (IN FEET, + HIGH)FOR THE MIDDLE SEGMENT DURING TRANSFER
5-Trial Means 1-5 6-10 11-15 16-20 21-25 26-30
Task (Ta)
Whole 5./ 5.5 6.2 11.4 4.9 3.0
Part 39.1 20.9 17.8 11.4 8.8 8.4
FLOLS Size (FS)
Small 20.2 13.6 14.4 11.2 4.8 2.0Large 24.1 12.8 9.7 11.6 -8.9 9.3
FLOLS Type (FT)
Conventional (Cv) 31.0 19.4 12.4 13.8 6.5 3.6
Rate (Ra) 13.5 6.1 7.7 8.0 3.1 5.8Command (Cm) 22.0 14.1 15.9 12.5 10.9 7.7
~ji
I--
81
A - °

NAVTRAEQUIPCEN 81-C-0105-9
TABLE C-12. MEAN AVERAGE GLIDESLOPE ERROR (IN FEET, + HIGH)FOR THE CLOSE-IN SEGMENT DURING TRANSFER
- S-Trial Means 1-5 6-10 11-15 16-20 21-25 26-30
Task (Ta)
Whole 7.6 6.0 4.9 6.9 2.1 1.8Part 36.0 12.1 9.6 5.7 6.4 6.1
FLOLS Size (FS)
SmaLl 22.7 10.6 8.4 5.9 2.3 1.3Large 20.9 7.5 6.1 6.7 6.2 6.5
FLOLS Type (FT)
Conventional (Cv) 28.8 16.3 7.3 5.9 4.1 1.6Rate (Ra) 12.8 4.7 3.9 5.2 2.7 3.3Command (Cm) 23.9 6.1 10.5 7.8 6.0 6.8
0 82
. i-
-" h.........

NAVTRAEQUIPCEN 81-C-0105-9
TABLE C-13. MEAN ANGLE-OF-ATTACK RMS ERROR (IN AOA UNITS)
FOR THE MIDDLE SEGMENT DURING TRANSFER
5-Trial Means 1-5 6-10 11-15 16-20 21-25 26-30
Task (Ta)
Whole .611 .549 .533 .535 .510 .522
Part .498 .426 .438 .423 .423 .508
FLOLS Size (FS)
Small .505 .446 .453 .454 .448 .518Large .603 .529 .517 .504 .485 .511
FLOLS Type (FT)
Conventional (Cv) .551 .540 .484 .501 .465 .472Rate (Ra) .634 .542 .578 .528 .522 .557
Command (Cm) .478 .380 .393 .407 .413 .514
* 83I"

NAVTRAEQUIPCEN 81-C-0105-9
TABLE C-14. MEAN ANGLE-OF-ATTACK RMS ERROR (IN AQA UNITS)FOR THE CLOSE-IN SEGMENT DURING TRANSFER
5-Trial Means 1-5 6-10 11-15 16-20 21-25 26-30
Task (Ta)
Whole .778 .698 .644 .615 .649 .671Part .705 .617 .652 .652 .619 .721
FLOLS Size (FS)
Small .706 .624 .614 .617 .616 .776Large .777 .691 .682 .659 .651 .615
FLOLS Type (FT)
Conventional (Cv) .717 .629 .676 .685 .640 .623Rate (Ra) .899 .762 .693 .656 .675 .718Command (Cm) .607 .580 .576 .574 .586 .746
* 84

NAVTRAEQUIPCEN 81-C-0105-9
TABLE C-15. MEAN LINEUP RMS ERROR (IN FEET)FOR THE MIDDLE SEGMENT DURING TRANSFER
5-Trial Means 1-5 6-10 11-15 16-20 21-25 26-30
Task (Ta)
Whole 50.5 44.5 40.6 49.4 46.9 46.5Part 90.7 55.3 60.1 47.5 43.5 54.9
FLOLS Size (FS)
Small 63.4 49.2 45.8 39.4 40.7 49.1Large 77.8 50.7 54.8 57.6 49.6 52.3
FLOLS Type (FT)
Conventional (Cv) 84.7 44.2 57.9 39.5 40.7 40.5Rate (Ra) 53.4 46.8 41.5 38.1 39.3 38.5Command (Cm) 73.6 58.7 51.7 67.8 55.6 73.0
4
14 85

NAVTRAEQUIPCEN 81-C-0105-9
TABLE C-16. MEAN LINEUP RMS ERROR (IN FEET)FOR THE CLOSE-IN SEGMENT DURING TRANSFER
5-Trial Means 1-5 6-10 11-15 16-20 21-25 26-30
Task (Ta)
Whole 27.2 21.4 21.2 24.9 22.3 22.0Part 85.9 39.0 40.6 28.8 27.4 32.9
FLOLS Size (FS)
Small 51.9 32.0 28.8 21.5 24.1 25.7Large 61.2 28.4 33.0 32.2 25.7 29.2
FLOLS Type (FT)
Coventional (Cv) 77.1 32.6 42.9 25.0 26.3 26.7Rate (Ra) 33.4 25.2 22.5 21.7 20.8 20.6Command (Cm) 59.1 32.9 27.3 33.8 27.4 35.1
86

NAVTRAEQUIPCEN 81-C-0105-9
Chief of Naval Operations 1 Dr. Martin Tolcott
OP-115 Office of Naval ResearchWashington, D C 20350 800 N. Quincy Street
Code 442Arlington, VA 22217
Technical Library 1 CommanderNaval Training Equipment Naval Air Development CenterCenter Attn: Technical Library
Orlando, FL 32813 Warminster, PA 18974
Chief of Naval Operations 1 Naval Research Laboratory
OP-596 Attn: LibraryWashington, D C 20350 Washington, D C 20375
Commander 1 Chief of Naval Education 6Naval Air Test Center and Trng Liaison OfficeCT 176 AFHRL/OTLNPatuxent River, MD 20670 Williams AFB, AZ 85224
Office of Deputy Chief of 1 Dr. Donald W. ConnollyNaval Operations Research Psychologist
Manpower, Personnel and Federal Aviation Admin
Training (OP-01) FAA NAFEC ANA-230 Bldg. 3Washington, D C 20350 Atlantic City, NJ 08405
Assistant Secretary 1 Chief of Naval Materialof the Navy MAT 0722
Research, Engineering & Systems BCT-l, Room 503Washington, D C 20350 800 N. Quincy St.
Arlington, VA 22217
[IQ Marine Corps 1 Commanding OfficerCode APC Naval Education Training
Attn: LTC J. W. Biermas Program & Development CenterWashington, D C 20380 Attn: Technical Library
Pensacola, FL 32509
Chief of Naval Operations 1 CommanderOP-593B Naval Air Systems CommandWashington, D C 20350 Technical Library
AIR-950DWashington, D C 20361
3(cientific Advisor 1 Chief of Naval Educationfleadquarters U. S. Marine Corps and Training
Washington, D C 20380 Code 01APensacola, FL 32509
1
J .1lof 7

NAVTRAEQUIPCEN 81-C-0105-9
DISTRIBUTION LIST
Naval Training Equipment 1 The Van Evera Library
Center Human ResourcesOrlando, FL 32813 300 North Washington St
Alexandria, VA 22314
Commander 3 LibraryHQ, TRADOC Division of Public Documents
Attn: ATTNG-PA Government Printing Office
Ft. Monroe, VA 23651 Washington, D. C. 20402
Center Library 3 Director 2
Naval Personnel Research Training Analysis and
and Development Center Evaluation GroupSan Diego, CA 92152 Department of the Navy
Orlando, FL 32813
Dr. Ralph R. Canter 1 HumRRO/Western Division/
U. S. Army Research Institute Carmel Ofc
Field Unit 27857 Berwick Drive
P. 0. Box 16117 Carmel, CA 93923
Fort Harrison, IN 46216
Defense Technical 12 U. S. Coast Guard HQ
Information Center (G-P-1/2/42)Cameron Station 400 Seventh St., SWAlexandria, VA 22314 Washington, D C 20593
PERI-OU 1 Personnel & Training 3
U. S. Army Research Research ProgramInst for the Behavioral Office of Naval Research
and Social Sciences (Code 442)5001 Eisenhower Avenue Psychological Sciences Div.
Alexandria, VA 22333 800 N. Quincy StreetArlington, VA 22217
OASD (MRA -_L)/Training 2 National Aviation Facilities IRoom 3B922, Pentagon Experimental Center
Washington, D C 20301 LibraryAtlantic City, N J 08405
- Dr. Geoffrey Grossman 1 AFHRL/TSZ 2
* Head, Human Factors Branch Brooks AFB, TX 78235
Code 3152Naval Weapons CenterChina Lake, CA 93555
2 of 7: .- <-.. z . , -. .. --; . -;.. ... ,- - • - . - , .. • , , - , . / . :- .

NAVTRAEQUIPCEN 81-C-0105-9
American Psychological 1 AFOSR/NL (Dr. A. R. Fregicy)
Association Bolling AFB
Psyc. INFO Document Washington, D C 20332
Control Unit Bolling AFB
1200 Seventeenth Street, NW
Washington, D C 20036
Navy Domestic Tech. Transferl Human Factors Society 2
Fact Sheet Attn: Bulletin Editor
Code E411 P. 0. Box 1369
Naval Surface Weapons Center Santa Monica, CA 90406
Dahlgren, VA 22448
Center for Naval Analyses I National Defense University
Attn: Dr. R. F. Lockman Research Directorate
2000 N. Beauregard St Ft. McNair, D C 20319
Alexandria, VA 22311
Dr. J. Huddleston 1 Commanding Officer
Head of Personnel Psychology Air Force Office of
Army Personnel Research Scientific Research
Establishment Technical Library
c/o RAE, Farnborough Washington, D C 20301
Hants, ENGLAND
OUSDR&E (R&T) (E&LS) 1 Dr. D. G. Pearce
CDR Paul R. Chatelier Behavioral Science Division
Room 3D129, The Pentagon Defense and Civil Institute of
Washington, D C 20301 Environmental MedicineP. 0. Box 2000Downsview, Ontario M3M, CANADA
Dr. es- e Orlansky 1 Technical Library
Sc Ierce and Technology Division OUSDR&E
Institute for Defense Analyses Room 3D122
1801 N. Beauregard St. Washington, D C 20301
Alexandria, VA 22311
Chief of Naval Operations 1 Commander
()P-987H Naval Air Systems Commrano
Attn: I)r. R. G. Smith AIR 340F
Washington, D C 20350 Attn: CDR T. JonesWashington, D C 20361
S;cientific Technical Chief
Information Office ARI Field Unit
NASA P. 0. Box 476
Washington, D C 20546 Ft. Rucker, AL 36362
- : 3 of 7

NAVTRAEQUIPCEN 81-C-0105-9
Commander 1 Dr. David C. NagelPacific Missile Test Center LM-239-3Point Mugu, CA 93042 NASA Ames Research Center
Moffett Field, CA 94035
Commander 1 Federal Aviation AdminNaval Air Systems Command Technical LibraryAIR 413 Bureau Research & DevelopmentWashington, D C 20361 Washington, D C 20590
Commanding Officer 1 CommanderNaval Aerospace Medical Naval Weapons CenterResearch Laboratory Human Factors Branch
- Code L5 Code (3194)Department of Psychology Attn: Mr. Ronald A. EricksonPensacola, FL 32512 China Lake, CA 93555
Dr. Thomas Longridge 1 Mr. Robert WrightAFHRL/OTR USARI Field UnitWilliams AFB, AZ 85224 Ft. Rucker, AL 36362
Dr. Kenneth Boff 1 LTCOL Jefferson Koonce* ARAMRL/HEA USAFA/DFBL. WP AFB, Ohio 45433 USAF Academy, CO 80840
CAPT James Goodson 1 SuperintendentCode L-32 Code 602Naval Aerospace Medical Human Factors EngineeringResearch Laboratory Division
Pensacola, FL 32512 Naval Air Development Center
Warminster, PA 18974
Engineering Psychology 1 Dr. Will BickleyGroup USARI Field Unit
Office of Naval Research P. 0. Box 476800 N. Quincy Street Fort Rucker, AL 36362Arlington, VA 22217
Mr. Edward M. Connelly 1 CDR W. F. MoroneyPerformance Measurement Assoc. Systems Engineering Test410 Pine St., S. E. 300 Directorate (SY 70F)Vienna, VA 22180 Naval Air Test Center
Patuxent River, MD 20670
Mr. John 0. Duffy I CDR, Soldier Support Center iU. S. Army Test ATTN: ATZI-NCR--SI (MAJ Wildrick)
and Eval. Command Ft. Benjamin HarrisonAberdeen Proving Ground Indiana 46216Maryland 21005
4 of 7
.... -. . -- ,. . . ...** *.. " * " *-' " , 2 ',.. . . ..

AD-Aii53 622 VISUAL AND PART-TASK MANIPULATIONS FOR TEACHING 2/2SIMULATED CARRIER LANDING.-(U) CANYON RESEARCH GROUPINC WESTLAKE VILLAGE CA D J SHEPPARD 19 MAR 85
UNCLASSIFIED NAVTRAEQUIPC-Si-C-8i58-9 NMi39-i-C-iB5 F/G 5/9 NL
MEN...

1. 0 W' 8 3U.• Lo
-L,6 12.8
IIIIII11ILV25 111 .4I16
MICROCOPY RESOLUTION TEST CHARTNATIONAL BUREAU OF STANDAROS-1963-A
L
. , . . - , .. - :, - .-... a *.. . . .. . . . .. . - -,a

NAVTRAEQUIPCEN 81-C-0105-9
Mr. Heinz Friedrich 1 Chief, HEL DetachmentChief, Flight Simulation Branch Attn: DRXHE-MI (Mr. Nichols)Dornier GmbH U. S. Army Missile CommandPostfach 1426 Redstone Arsenal, AL 35898D7990 Friedrichshafen FRG
Mr. Clarence A. Fry 1 Mr. William A. BreitmaierU.S.Army Human Engineering Lab Code 6022Attn: DRXHE Naval Air Development CenterAberdeen Proving Ground Warminster, PA 18974Maryland 21005
Dr. Richard F. Gabriel 1 Dr. Clyde A. BrictsonDouglas Aircraft Co. Dunlap and Associates, Inc.3855 Lakewood Blvd. 920 Kline St., Suite 203Long Beach, CA 90846 La Jolla, CA 92037
Dr. Stanley Collyer Dr. W. Marvin BunkerNAVMAT 0722 General Electric Corp800 N. Quincy St. P. 0. Box 2500Arlington, VA 22219 Daytona Beach, FL 32015
Dr. Genevieve Haddad 1 Dr. Paul W. CaroAFOSR/NL Seville Research Corp
Bolling AFB, D C 20332 400 Plaza Bldg.Pensacola, FL 32505
Dr. Edward R. Jones 1 Mr. Vernon E. CarterChief, Human Factors Engr. Northrop Corp., Aircraft Div.McDonell Douglas Corp 3901 W. BroadwaySt. Louis, MO 63166 Hawthorne, CA 90250
Mr. Charles E. Kaul I Dr. Eric Haseltine7101 Galgate Drive Hughes Aircraft CorpSpringfield, VA 22153 Building R-1
M/S C-320Los Angeles, CA 90009
. Dr. William J. King I Dr. Robert T. HennessyErgonomics Associates, Inc. Committee on Human FactorsP. O. Box 20987 National Research CouncilOrlando, FL 32814 2101 Constitution Ave.
Washington, D C 20418
* Dr. Herschel W. Leibowitz 1 Dr. William M. Hinton, Jr.Professor of Psychology Allen Corporation614 Bruce V. Moore Building 3751 Maguire Blvd., Suite 270Pennsylvania State University Orlando, FL 32803University Park, PA 16802
5
..- 5 of 7;.- .-.'.. .2 .'/';. . ./....... . ...... .. .--.... .... •,.. ...... ..

NAVTRAEQUIPCEN 81-C-0105-9
Mr. James McGuinness 1 Mr. J. Thel Hooks, Jr.Person-System Integration Dunlap and Associates3012 Duke Street 920 Kline St., Suite 203Alexandria, VA 22314 La Jolla, CA 92037
Dr. Melvin D. Montemerlo 1 Ms. Joyce IavecchiaRTE-6 Naval Air Development CenterNASA Headquarters Code 6022Washington, D C 20546 Warminster,.PA 18974
Dr. Frederick A. Muckler 1 Dr. Richard S. JensenEssex Corporation Department of Aviation741 Lakefield Rd., Suite B Ohio State UniversityWestlake Village, CA 91361 Box 3022
Columbus, OH 43210
Dr. Kent A. Stevens 1 Mr. Henry R. JexDepartment of Computer and Systems Technology Inc.Information Science 13766 Hawthorne Blvd
University of Oregon Hawthorne, CA 90250Eugene, OR 97403
Dr. Paul E. Van Hemel 1 CDR, Naval Air ForceAllen Corporation of America U. S. Atlantic Fleet401 Wythe Street Attn: LCDR Robert DayAlexandria, VA 22314 Norfolk, VA 23511
Mr. Donald Vreuls 1 Dr. Wallace W. ProphetVreuls Research Corporation Seville Research Corp68 Long Court, Suite E 400 Plaza Bldg.Thousand Oaks, CA 91360 Pace Blvd. at Fairfield Dr
Pensacola, FL 32505
Mr. Lee Wooldridge 1 Professor Stanley N. RoscoeVreuls Research Corporation Department of Psychology6568 University Boulevard New Mexico State UniversityOrlando, FL 32807 Box 5095
Las Cruces, NM 88003
Dr. Laurence Young 1 R. F. SchifflerDept. of Aeronautics ASD/ENECHMassachusetts Inst. of Tech. Wright-Patterson AFB77 Massachusetts Ave. Ohio 45433Cambridge, MA 02139
6 of 7-J .... XL. ~ ~ 2~2pC ~

NAVTRAEQUIPCEN 81-C-0105-9
Mr. Moses Aronson Mr. John B. Sinacori3705 Wilder Lane P. O. Box 1043Orlando, FL 32804 Hollister, CA 95023
Dr. Kevin Berbaum 1 Dr. Harry L. SynderP.O. Box 435 VPI&SU, Dept. of Indus. Engr.West Branch, 1O 52358 and Operations Research
130 Whittemore HallBlacksburg, VA 24061
Dr. Edward A. Stark Dr. Diane DamosLink Division Department of PsychologyThe Singer Company Arizona State UniversityBinghamton, NY 13902 Tempe, AZ 85287
Dr. E. C. PoultonMRC Applied Psychology Unit15 Chaucer RoadCambridge CB2 2EF, England
L
7 of 7* .

.p . - . .. - . . -..
FILMED
6-85
DTIC, -
.. . .. .- . . -