Semi Annual Report and Unaudited Financial Statements for ...

Unaudited Semi-Annual Report – 30 June 2019
JPMorgan Investment FundsSICAV Range

This report is an abridged version of the unaudited semi-annual report established in conformity with the Luxembourg Law of 17 December 2010 on Undertakings for Collective Investment. The complete version is available on request from the Company’s registered office in Luxembourg and from JPMorgan Funds (Asia) Limited.
This report does not constitute an offer of shares. Subscriptions are only valid if made on the basis of the current Hong Kong Offering Document which is available free of charge on request, supplemented by the most recent audited annual report of the Fund and any subsequent unaudited semi-annual report, from JPMorgan Funds (Asia) Limited.
Certain of the sub-funds of the Fund are not authorised for offer or distribution in or from Hong Kong. Accordingly, no reference is made to these sub-funds in this unaudited semi-annual report. The attention of the investors is drawn to the fact that certain figures in this unaudited semi-annual report are expressed on a consolidated basis and, thus, include the assets of those sub-funds which are not registered in Hong Kong.

JPMorgan Investment Funds
Unaudited Semi-Annual Report
As at 30 June 2019
Contents
Board of Directors 1
Management and Administration 2
Unaudited Financial Statements and Statistical Information
Combined Statement of Net Assets 3
Combined Statement of Operations and Changes in Net Assets 5
Statement of Changes in the Number of Shares 7
Statistical Information 9
Notes to the Unaudited Financial Statements 11
Schedule of Investments
Equity Sub-Funds
JPMorgan Investment Funds - Europe Select Equity Fund 18
JPMorgan Investment Funds - Global Dividend Fund 21
Bond Sub-Funds
JPMorgan Investment Funds - Global High Yield Bond Fund 25
Appendix - Unaudited Additional Disclosures
1. Total Expense Ratios 34
2. Summary of Investment Objectives of the Sub-Funds 36
3. Performance and Volatility 37
4. Interest Rate Received/(Charged) on Bank Accounts 39
5. Sub-Fund Share Classes Subject to Taxe d’Abonnement Rate of 0.01% 39
6. Portfolio Turnover Ratio 39
7. Calculation Method of the Risk Exposure 39
8. Securities Financing Transactions 40
9. UCITS Remuneration Disclosures 43
10. Historical Statement of Changes in the Number of Shares 44

JPMorgan Investment Funds
Board of Directors
ChairmanIain O.S. SaundersDuine, ArdfernArgyll PA31 8QNUnited Kingdom
DirectorsJacques ElvingerElvinger Hoss Prussen, Société anonyme2, place Winston ChurchillB.P. 425, L-2014 LuxembourgGrand Duchy of Luxembourg
Massimo GrecoJPMorgan Asset Management (UK) Limited60 Victoria EmbankmentLondon EC4Y 0JPUnited Kingdom
John Li How CheongThe Directors’ Office19, rue de BitbourgL-1273 LuxembourgGrand Duchy of Luxembourg
Martin Porter (from 26 April 2019)Thornhill, Hammerwood RoadAshurst Wood, SussexRH19 3SLUnited Kingdom
Registered Office6, route de TrèvesL-2633 SenningerbergGrand Duchy of Luxembourg
Peter Thomas SchwichtHumboldtstraße 17D-60318 Frankfurt am MainGermany
Susanne van DootinghNekkedelle 6B-3090 OverijseBelgium
Daniel J. WatkinsJPMorgan Asset Management (Asia Pacific) Limited(previously JF Asset Management Limited)Level 21, Chater House8 Connaught Road, CentralHong Kong
1

JPMorgan Investment Funds
Management and Administration
Management Company, Registrar and Transfer Agent,Global Distributor and Domiciliary AgentJPMorgan Asset Management (Europe) S.à r.l.6, route de TrèvesL-2633 SenningerbergGrand Duchy of Luxembourg
Investment ManagersJPMorgan Asset Management (UK) Limited60 Victoria EmbankmentLondon EC4Y 0JPUnited Kingdom
J.P. Morgan Investment Management Inc.270 Park AvenueNew York, NY 10017United States of America
JPMorgan Asset Management (Japan) LimitedTokyo Building 7-3, Marunouchi 2-chome, Chiyoda-kuTokyo 100-6432Japan
JPMorgan Asset Management (Asia Pacific) Limited(previously JF Asset Management Limited)21st Floor, Chater House8 Connaught Road CentralHong Kong
Depositary, Corporate, Administrative and Listing AgentJ.P. Morgan Bank Luxembourg S.A.6, route de TrèvesL-2633 SenningerbergGrand Duchy of Luxembourg
Independent AuditorPricewaterhouseCoopers, Société coopérative2, rue Gerhard MercatorB.P. 1443, L-1014 LuxembourgGrand Duchy of Luxembourg
Luxembourg Legal AdviserElvinger Hoss Prussen, Société anonyme2, place Winston ChurchillB.P. 425, L-2014 LuxembourgGrand Duchy of Luxembourg
2

JPMorgan Investment Funds
Combined Statement of Net Assets
As at 30 June 2019
JPMorganInvestment Funds
CombinedUSD
AssetsInvestments in Securities at Market Value 56,404,118,239Acquisition Cost: 54,209,523,508Investment in TBAs at Market Value* 1,008,281Cash at Bank and at Brokers 1,213,232,879Amounts Receivable on Sale of Investments 162,272,907Amounts Receivable on Subscriptions 189,311,255Interest and Dividends Receivable, Net 378,878,142Tax Reclaims Receivable 34,935,359Fee Waiver** 639,965Other Receivables 37,295Net Unrealised Gain on Forward Currency Exchange Contracts 256,264,088Net Unrealised Gain on Financial Futures Contracts 5,155,748Other Derivative Instruments at Market Value 34,951,223
Total Assets 58,680,805,381
LiabilitiesBank and Broker Overdraft 19,076,194Amounts Payable on Purchase of Investments 254,122,064Amounts Payable on Purchase of TBAs* 1,003,839Amounts Payable on Redemptions 156,380,620Management and Advisory Fees Payable 48,564,066Fund Servicing Fees Payable 3,398,942Distribution Fees Payable 3,622,898Performance Fees Payable 853,402Other Payables*** 2,509,099Net Unrealised Loss on Forward Currency Exchange Contracts 5,506,011Net Unrealised Loss on Financial Futures Contracts 6,158,337Other Derivative Instruments at Market Value 2,391,734
Total Liabilities 503,587,206
Total Net Assets 58,177,218,175
Historical Total Net Assets31 December 2018 53,908,518,95031 December 2017 58,142,594,162
* Please refer to Note 2i).** Please refer to Note 3a), 3b), 3c) and 3d). To the extent that actual operating costs exceed the capped percentage, the amount borne by the Management Company will be separately disclosed as a“Fee Waiver” in the Combined Statement of Net Assets and the Combined Statement of Operations and Changes in Net Assets.*** Other Payables are principally comprised of Directors’ fees, audit and tax related fees and expenses, registration, publication, mailing, printing, legal and marketing expenses.The accompanying notes form an integral part of these Financial Statements.
3

JPMorgan Investment Funds
Combined Statement of Net Assets (continued)
As at 30 June 2019
EuropeSelect Equity
FundEUR
GlobalDividend
FundUSD
GlobalHigh Yield Bond
FundUSD
1,148,530,175 184,536,120 6,318,072,8291,057,257,419 169,427,316 6,344,607,170
- - -462,760 107,841 -
21,370,895 - 146,2502,202,033 601,130 20,685,8781,225,879 359,037 89,632,8962,577,152 234,821 -
- 29,385 -9,789 305 -
- 864,449 31,703,709- - -- - 7,500,369
1,176,378,683 186,733,088 6,467,741,931
- - 6,010,57234,731,368 - 52,505,000
- - -2,002,339 717,672 11,460,624
659,370 214,085 3,411,96792,067 14,832 464,232
7,083 72,505 342,668- - -
32,608 56,410 275,2722,018,975 - -
- - -- - -
39,543,810 1,075,504 74,470,335
1,136,834,873 185,657,584 6,393,271,596
861,032,608 174,402,644 5,294,437,2801,509,443,580 148,755,412 6,987,668,804
4

JPMorgan Investment Funds
Combined Statement of Operations and Changes in Net Assets
Period from 1 January 2019 to 30 June 2019
JPMorganInvestment Funds
CombinedUSD
Net Assets at the Beginning of the Period* 53,730,469,717
IncomeDividend Income, Net 378,986,673Interest Income, Net 693,450,831Securities Lending Income 3,320,836Bank Interest 784,376Interest on Swap Transactions 2,700,610
Total Income 1,079,243,326
ExpensesManagement and Advisory Fees 275,782,394Fund Servicing Fees 20,266,322Distribution Fees 20,892,192Depositary, Corporate, Administration and Domiciliary Agency Fees 8,405,590Registrar and Transfer Agency Fees 2,072,343Taxe d’abonnement 11,615,620Overdraft Interest 960,419Interest on Swap Transactions 1,523,358Sundry Fees** 5,504,035
347,022,273
Less: Fee Waiver*** 4,786,942
Total Expenses before Performance Fees 342,235,331
Performance Fees 853,402
Total Expenses 343,088,733
Net Investment Income/(Loss) 736,154,593
Net Realised Gain/(Loss) on Sale of Investments 566,068,557Net Realised Gain/(Loss) on Forward Currency Exchange Contracts (451,929,413)Net Realised Gain/(Loss) on Financial Futures Contracts (73,929,097)Net Realised Gain/(Loss) on Foreign Exchange 25,056,775Net Realised Gain/(Loss) on TBAs (1,339)Net Realised Gain/(Loss) on Other Derivative Instruments (74,771,523)
Net Realised Gain/(Loss) for the Period (9,506,040)
Net Change in Unrealised Gain/(Loss) on Investments 3,694,812,392Net Change in Unrealised Gain/(Loss) on Forward Currency Exchange Contracts 21,682,524Net Change in Unrealised Gain/(Loss) on Financial Futures Contracts (10,502,191)Net Change in Unrealised Gain/(Loss) on Foreign Exchange (7,042,562)Net Change in Unrealised Gain/(Loss) on TBAs 5,781Net Change in Unrealised Gain/(Loss) on Other Derivative Instruments 3,452,442
Net Change in Unrealised Gain/(Loss) for the Period 3,702,408,386
Increase/(Decrease) in Net Assets as a Result of Operations 4,429,056,939
Movements in Share CapitalSubscriptions 11,312,385,677Redemptions (10,573,895,077)
Increase/(Decrease) in Net Assets as a Result of Movements in Share Capital 738,490,600
Dividend Distribution (720,799,081)
Net Assets at the End of the Period 58,177,218,175
* The opening balance was combined using the foreign exchange rates as at 30 June 2019. The same net assets when combined using the foreign exchange rates ruling as at 31 December 2018 reflecteda figure of USD 53,908,518,950.** Sundry Fees are principally comprised of Directors’ fees, audit and tax related fees and expenses, registration, publication, mailing, printing, legal and marketing expenses.*** Please refer to Note 3a), 3b), 3c) and 3d). To the extent that actual operating costs exceed the capped percentage, the amount borne by the Management Company will be separately disclosed as a“Fee Waiver” in the Combined Statement of Net Assets and the Combined Statement of Operations and Changes in Net Assets.
The accompanying notes form an integral part of these Financial Statements.
5

JPMorgan Investment Funds
Combined Statement of Operations and Changes in Net Assets (continued)
Period from 1 January 2019 to 30 June 2019
EuropeSelect Equity
FundEUR
GlobalDividend
FundUSD
GlobalHigh Yield Bond
FundUSD
861,032,608 174,402,644 5,294,437,280
25,838,857 2,877,445 1,277,420- - 174,438,224
228,751 23,071 1,589,423- 320 15,757- - 1,388,889
26,067,608 2,900,836 178,709,713
3,426,927 1,291,103 18,366,555521,257 91,138 2,641,65944,557 447,588 1,630,835173,162 110,947 846,36754,321 77,137 254,668
152,473 45,681 1,217,9056,604 327 30,370
- - -102,657 94,255 1,051,071
4,481,958 2,158,176 26,039,430
99,215 162,221 580,282
4,382,743 1,995,955 25,459,148
- - -
4,382,743 1,995,955 25,459,148
21,684,865 904,881 153,250,565
(14,599,427) 671,960 19,375,1885,055,711 (1,927,746) (56,631,104)730,976 - -
(243,060) 10,684 333,092- - -- - -
(9,055,800) (1,245,102) (36,922,824)
136,556,458 26,433,391 361,075,619(3,317,724) 476,688 30,163,796
- - -5,644 (2,149) (7,046)
- - -- - 1,184,436
133,244,378 26,907,930 392,416,805
145,873,443 26,567,709 508,744,546
349,003,539 49,548,177 2,229,333,934(218,683,388) (63,296,538) (1,522,697,434)
130,320,151 (13,748,361) 706,636,500
(391,329) (1,564,408) (116,546,730)
1,136,834,873 185,657,584 6,393,271,596
6

JPMorgan Investment Funds
Statement of Changes in the Number of Shares (continued)
For the Period from 1 January 2019 to 30 June 2019
Shares Outstandingat the Beginning
of the PeriodShares
SubscribedShares
Redeemed
Shares Outstandingat the End
of the Period
JPMorgan Investment Funds - Europe Select Equity FundJPM Europe Select Equity A (acc) - CZK 75.475 1,238.249 - 1,313.724JPM Europe Select Equity A (acc) - EUR 171,728.374 105,575.392 15,359.389 261,944.377JPM Europe Select Equity A (acc) - USD 33,211.819 - 10,178.332 23,033.487JPM Europe Select Equity A (dist) - EUR 72,738.690 5,032.430 8,428.197 69,342.923JPM Europe Select Equity A (dist) - GBP 1,311.621 3.835 37.287 1,278.169JPM Europe Select Equity C (acc) - EUR 805,273.532 283,009.983 338,195.114 750,088.401JPM Europe Select Equity C (acc) - USD 200,165.929 56,690.760 81,536.956 175,319.733JPM Europe Select Equity C (dist) - EUR 17,913.287 - 15,280.628 2,632.659JPM Europe Select Equity C (dist) - GBP 19,262.931 176.306 8,439.453 10,999.784JPM Europe Select Equity D (acc) - EUR 110,763.798 4,101.338 19,926.828 94,938.308JPM Europe Select Equity D (acc) - USD 9.806 - - 9.806JPM Europe Select Equity I (acc) - EUR 1,012,574.927 172,232.775 110,471.957 1,074,335.745JPM Europe Select Equity I (acc) - USD (hedged) 36,024.268 36,823.799 18,564.019 54,284.048JPM Europe Select Equity I (dist) - EUR 4,291.868 - - 4,291.868JPM Europe Select Equity I2 (acc) - EUR 1,292,815.477 494,067.843 725,905.122 1,060,978.198JPM Europe Select Equity I2 (acc) - USD 24,532.995 8,188.718 1,082.016 31,639.697JPM Europe Select Equity I2 (acc) - USD (hedged)* 3,337.577 2,038.792 5,376.369 -JPM Europe Select Equity I2 (dist) - EUR 93,876.629 3,551.806 78,293.601 19,134.834JPM Europe Select Equity X (acc) - EUR 658,421.351 262,571.176 126,834.113 794,158.414JPM Europe Select Equity X (acc) - USD (hedged) 713,454.573 107,125.000 - 820,579.573JPM Europe Select Equity X (dist) - EUR* 12,992.627 8,731.711 21,724.338 -
JPMorgan Investment Funds - Global Dividend FundJPM Global Dividend A (acc) - EUR 33,511.581 15,827.170 2,718.301 46,620.450JPM Global Dividend A (acc) - EUR (hedged) 47,901.000 10,760.378 15,155.866 43,505.512JPM Global Dividend A (acc) - USD 135,773.617 112,352.114 152,666.055 95,459.676JPM Global Dividend A (dist) - EUR (hedged) 1,904.000 - - 1,904.000JPM Global Dividend A (dist) - USD 69,034.830 6,968.713 6,803.516 69,200.027JPM Global Dividend A (div) - EUR 65,538.228 25,882.452 12,508.605 78,912.075JPM Global Dividend A (div) - EUR (hedged) 22,287.598 17,453.682 1,276.890 38,464.390JPM Global Dividend A (div) - USD 12,626.871 1,574.735 1,444.417 12,757.189JPM Global Dividend A (mth) - USD (hedged) 33,479.735 12,293.159 23,200.423 22,572.471JPM Global Dividend C (acc) - EUR 30,135.328 2,757.071 2,292.551 30,599.848JPM Global Dividend C (acc) - USD 11,550.182 4,258.785 4,489.651 11,319.316JPM Global Dividend C (dist) - EUR 780.570 - - 780.570JPM Global Dividend C (dist) - EUR (hedged) 2,182.000 756.000 1,383.000 1,555.000JPM Global Dividend C (div) - EUR* 1,984.144 - 1,984.144 -JPM Global Dividend D (acc) - EUR (hedged) 230,494.242 49,147.314 44,369.413 235,272.143JPM Global Dividend D (acc) - USD 59,101.606 8,387.231 12,770.785 54,718.052JPM Global Dividend D (div) - EUR (hedged) 533,879.331 67,701.084 62,118.150 539,462.265JPM Global Dividend D (mth) - EUR (hedged) 16,606.241 2,867.459 3,179.787 16,293.913JPM Global Dividend F (mth) - USD (hedged) 182,433.594 46,968.905 127,031.796 102,370.703JPM Global Dividend I (acc) - EUR* 27,949.088 - 27,949.088 -JPM Global Dividend T (acc) - EUR (hedged) 102,434.847 22,855.746 32,368.029 92,922.564JPM Global Dividend X (acc) - USD 2,464.641 - 1,450.605 1,014.036JPM Global Dividend X (dist) - AUD 54,036.285 1,343.791 378.071 55,002.005
* Share Class inactive as at end of the period.
7

JPMorgan Investment Funds
Statement of Changes in the Number of Shares (continued)
For the Period from 1 January 2019 to 30 June 2019
Shares Outstandingat the Beginning
of the PeriodShares
SubscribedShares
Redeemed
Shares Outstandingat the End
of the Period
JPMorgan Investment Funds - Global High Yield Bond FundJPM Global High Yield Bond A (acc) - AUD (hedged) 987,584.547 1,287,994.874 366,799.411 1,908,780.010JPM Global High Yield Bond A (acc) - CHF (hedged) 5,526.000 12,787.793 800.000 17,513.793JPM Global High Yield Bond A (acc) - CZK (hedged) 5,078.080 - - 5,078.080JPM Global High Yield Bond A (acc) - EUR (hedged) 556,733.573 38,967.008 361,077.730 234,622.851JPM Global High Yield Bond A (acc) - HUF (hedged) 22,553.298 7,579.579 8,905.500 21,227.377JPM Global High Yield Bond A (acc) - USD 1,931,077.912 1,850,668.640 922,709.681 2,859,036.871JPM Global High Yield Bond A (dist) - EUR (hedged) 400,056.870 113,150.026 15,749.914 497,456.982JPM Global High Yield Bond A (dist) - USD 24,344.852 9,334.796 5,691.938 27,987.710JPM Global High Yield Bond A (irc) - AUD (hedged) 45,515,776.267 3,682,618.186 5,489,892.946 43,708,501.507JPM Global High Yield Bond A (irc) - CAD (hedged) 1,020,000.078 96,620.427 4,778.317 1,111,842.188JPM Global High Yield Bond A (irc) - NZD (hedged) 184,515.206 1,889,739.222 48,032.991 2,026,221.437JPM Global High Yield Bond A (irc) - RMB (hedged) 497,218.394 - - 497,218.394JPM Global High Yield Bond A (mth) - HKD 80,291,129.958 25,549,179.838 21,016,772.060 84,823,537.736JPM Global High Yield Bond A (mth) - SGD 463,888.138 76,765.419 73,888.129 466,765.428JPM Global High Yield Bond A (mth) - USD 22,758,280.716 5,734,171.187 3,760,969.800 24,731,482.103JPM Global High Yield Bond C (acc) - EUR (hedged) 498,422.163 141,858.909 265,823.728 374,457.344JPM Global High Yield Bond C (acc) - PLN (hedged) 37,104.865 4,090.091 6,516.088 34,678.868JPM Global High Yield Bond C (acc) - USD 2,098,378.727 449,471.596 649,614.777 1,898,235.546JPM Global High Yield Bond C (dist) - EUR (hedged) 78,235.733 23,074.329 4,357.297 96,952.765JPM Global High Yield Bond C (dist) - GBP (hedged) 524,081.875 47,006.589 391,234.717 179,853.747JPM Global High Yield Bond C (dist) - USD 295,517.570 38,789.783 46,138.017 288,169.336JPM Global High Yield Bond C (div) - EUR (hedged) 130,584.086 18,398.408 13,572.927 135,409.567JPM Global High Yield Bond C (irc) - CAD (hedged) 180,045.321 - - 180,045.321JPM Global High Yield Bond C (mth) - HKD 2,340,104.631 3,327,971.550 779,727.096 4,888,349.085JPM Global High Yield Bond C (mth) - USD 1,030,881.071 123,991.588 253,042.131 901,830.528JPM Global High Yield Bond D (acc) - EUR (hedged) 261,233.739 77,210.337 44,246.281 294,197.795JPM Global High Yield Bond D (acc) - PLN (hedged) 12,869.803 12,446.075 14,078.801 11,237.077JPM Global High Yield Bond D (acc) - USD 24,972.748 21,526.242 18,001.964 28,497.026JPM Global High Yield Bond D (div) - EUR (hedged) 4,989,410.760 370,119.918 486,303.564 4,873,227.114JPM Global High Yield Bond D (mth) - EUR (hedged) 72,396.038 23,092.538 6,725.408 88,763.168JPM Global High Yield Bond F (irc) - AUD (hedged) 1,982,174.256 3,149,162.182 235,038.357 4,896,298.081JPM Global High Yield Bond F (mth) - USD 593,419.416 1,965,118.581 227,998.358 2,330,539.639JPM Global High Yield Bond I (acc) - EUR (hedged) 1,160,979.222 740,214.568 79,822.688 1,821,371.102JPM Global High Yield Bond I (acc) - USD 423,710.383 194,702.193 167,201.584 451,210.992JPM Global High Yield Bond I (dist) - EUR (hedged) 881,148.488 80,800.000 12,723.544 949,224.944JPM Global High Yield Bond I (mth) - USD 1,396,806.928 1,599,556.116 452,771.381 2,543,591.663JPM Global High Yield Bond I2 (acc) - EUR (hedged) 1,075,607.070 1,494,527.167 887,753.430 1,682,380.807JPM Global High Yield Bond I2 (acc) - USD 995,229.941 28,996.853 932,929.035 91,297.759JPM Global High Yield Bond I2 (dist) - EUR (hedged)* 28,096.124 227.309 28,323.433 -JPM Global High Yield Bond I2 (dist) - GBP (hedged)* 53,476.150 2,050.095 55,526.245 -JPM Global High Yield Bond I2 (dist) - USD 161,329.476 2,128.957 135,299.183 28,159.250JPM Global High Yield Bond I2 (mth) - USD 10.000 - - 10.000JPM Global High Yield Bond P (acc) - USD 35,610.047 18,675.880 - 54,285.927JPM Global High Yield Bond P (dist) - EUR (hedged) 212,566.284 - - 212,566.284JPM Global High Yield Bond P (dist) - USD 15,544.234 - 8,547.739 6,996.495JPM Global High Yield Bond T (acc) - EUR (hedged) 169,601.971 40,888.580 24,349.639 186,140.912JPM Global High Yield Bond X (acc) - EUR (hedged) 1,560,019.404 631,046.000 402,746.408 1,788,318.996JPM Global High Yield Bond X (acc) - USD 2,034,561.446 1,739,410.071 764,498.993 3,009,472.524JPM Global High Yield Bond X (mth) - USD 162,177.440 95,154.248 73,164.555 184,167.133
* Share Class inactive as at end of the period.
The accompanying notes form an integral part of these Financial Statements.
8

JPMorgan Investment Funds
Statistical Information (continued)
Net Asset Value per Share in Share Class Currency
30 June 2019 31 December 2018 31 December 2017
JPMorgan Investment Funds - Europe Select Equity FundJPM Europe Select Equity A (acc) - CZK 1,038.45 905.56 -JPM Europe Select Equity A (acc) - EUR 1,414.35 1,217.59 1,395.55JPM Europe Select Equity A (acc) - USD 166.29 143.84 173.09JPM Europe Select Equity A (dist) - EUR 86.53 75.31 87.17JPM Europe Select Equity A (dist) - GBP 104.13 90.54 -JPM Europe Select Equity C (acc) - EUR 151.09 129.42 146.86JPM Europe Select Equity C (acc) - USD 135.42 116.53 138.68JPM Europe Select Equity C (dist) - EUR 119.92 104.93 120.45JPM Europe Select Equity C (dist) - GBP 131.36 114.69 130.34JPM Europe Select Equity D (acc) - EUR 122.32 105.71 122.18JPM Europe Select Equity D (acc) - USD 152.55 132.45 160.58JPM Europe Select Equity I (acc) - EUR 198.80 170.25 193.11JPM Europe Select Equity I (acc) - USD* - - 177.22JPM Europe Select Equity I (acc) - USD (hedged) 155.47 131.63 145.93JPM Europe Select Equity I (dist) - EUR 131.79 115.55 133.54JPM Europe Select Equity I2 (acc) - EUR 102.34 87.60 99.27JPM Europe Select Equity I2 (acc) - USD 98.68 84.85 100.83JPM Europe Select Equity I2 (acc) - USD (hedged)* - 90.08 99.77JPM Europe Select Equity I2 (dist) - EUR 99.94 87.59 99.27JPM Europe Select Equity X (acc) - EUR 218.88 186.98 211.01JPM Europe Select Equity X (acc) - USD (hedged) 144.86 122.34 134.93JPM Europe Select Equity X (dist) - EUR* - 110.19 127.86
JPMorgan Investment Funds - Global Dividend FundJPM Global Dividend A (acc) - EUR 156.21 132.84 140.61JPM Global Dividend A (acc) - EUR (hedged) 99.27 85.90 95.54JPM Global Dividend A (acc) - USD 140.21 119.78 132.97JPM Global Dividend A (dist) - EUR (hedged) 156.38 136.55 151.89JPM Global Dividend A (dist) - USD 156.96 135.20 152.36JPM Global Dividend A (div) - EUR 122.03 105.48 115.56JPM Global Dividend A (div) - EUR (hedged) 102.44 90.10 103.75JPM Global Dividend A (div) - USD 141.49 122.86 141.19JPM Global Dividend A (mth) - USD (hedged) 117.89 102.13 114.33JPM Global Dividend C (acc) - EUR 242.42 205.14 214.97JPM Global Dividend C (acc) - USD 134.00 113.91 125.19JPM Global Dividend C (dist) - EUR 125.90 108.52 117.16JPM Global Dividend C (dist) - EUR (hedged) 97.91 85.97 96.11JPM Global Dividend C (div) - EUR* - 90.42 -JPM Global Dividend D (acc) - EUR (hedged) 91.01 79.05 88.59JPM Global Dividend D (acc) - USD 128.54 110.21 123.28JPM Global Dividend D (div) - EUR (hedged) 96.65 85.33 99.00JPM Global Dividend D (mth) - EUR (hedged) 105.34 92.97 107.89JPM Global Dividend F (mth) - USD (hedged) 102.79 89.49 100.93JPM Global Dividend I (acc) - EUR* - 96.76 101.36JPM Global Dividend T (acc) - EUR (hedged) 129.48 112.46 126.03JPM Global Dividend X (acc) - EUR (hedged)* - - 138.12JPM Global Dividend X (acc) - USD 149.58 126.75 138.40JPM Global Dividend X (dist) - AUD 16.16 13.97 14.18
* Share Class inactive as at end of the period.
9

JPMorgan Investment Funds
Statistical Information (continued)
Net Asset Value per Share in Share Class Currency
30 June 2019 31 December 2018 31 December 2017
JPMorgan Investment Funds - Global High Yield Bond FundJPM Global High Yield Bond A (acc) - AUD (hedged) 12.82 11.74 12.08JPM Global High Yield Bond A (acc) - CHF (hedged) 115.23 106.88 113.11JPM Global High Yield Bond A (acc) - CZK (hedged) 1,067.36 979.18 1,024.84JPM Global High Yield Bond A (acc) - EUR (hedged) 230.03 212.94 224.31JPM Global High Yield Bond A (acc) - HUF (hedged) 26,560.64 24,552.34 25,803.72JPM Global High Yield Bond A (acc) - USD 183.42 167.25 171.43JPM Global High Yield Bond A (dist) - EUR (hedged) 74.88 73.05 80.47JPM Global High Yield Bond A (dist) - USD 97.92 94.10 101.39JPM Global High Yield Bond A (irc) - AUD (hedged) 8.33 7.84 8.60JPM Global High Yield Bond A (irc) - CAD (hedged) 8.81 8.30 9.10JPM Global High Yield Bond A (irc) - NZD (hedged) 10.50 9.88 10.84JPM Global High Yield Bond A (irc) - RMB (hedged) 8.68 8.18 8.99JPM Global High Yield Bond A (mth) - HKD 10.22 9.65 10.53JPM Global High Yield Bond A (mth) - SGD 12.14 11.51 12.36JPM Global High Yield Bond A (mth) - USD 91.76 86.34 94.45JPM Global High Yield Bond C (acc) - EUR (hedged) 260.05 240.21 251.93JPM Global High Yield Bond C (acc) - PLN (hedged) 477.31 436.57 448.46JPM Global High Yield Bond C (acc) - USD 195.21 177.58 181.17JPM Global High Yield Bond C (dist) - EUR (hedged) 66.41 65.29 71.97JPM Global High Yield Bond C (dist) - GBP (hedged) 62.35 60.73 66.33JPM Global High Yield Bond C (dist) - USD 101.71 97.55 105.70JPM Global High Yield Bond C (div) - EUR (hedged) 65.67 62.63 70.05JPM Global High Yield Bond C (irc) - CAD (hedged) 10.02 9.42 10.26JPM Global High Yield Bond C (mth) - HKD 10.12 9.53 10.35JPM Global High Yield Bond C (mth) - USD 94.83 89.02 96.91JPM Global High Yield Bond D (acc) - EUR (hedged) 212.54 197.16 208.56JPM Global High Yield Bond D (acc) - PLN (hedged) 422.83 388.55 402.96JPM Global High Yield Bond D (acc) - USD 160.94 147.09 151.50JPM Global High Yield Bond D (div) - EUR (hedged) 61.64 59.03 66.57JPM Global High Yield Bond D (mth) - EUR (hedged) 89.82 86.05 97.28JPM Global High Yield Bond F (irc) - AUD (hedged) 9.59 9.08 10.01JPM Global High Yield Bond F (mth) - USD 96.20 91.00 100.09JPM Global High Yield Bond I (acc) - EUR (hedged) 90.98 84.02 88.08JPM Global High Yield Bond I (acc) - USD 200.54 182.40 186.01JPM Global High Yield Bond I (dist) - EUR (hedged) 64.12 62.94 70.19JPM Global High Yield Bond I (dist) - GBP (hedged)* - - 64.94JPM Global High Yield Bond I (dist) - USD* - - 102.35JPM Global High Yield Bond I (mth) - USD 92.11 86.45 94.07JPM Global High Yield Bond I2 (acc) - EUR (hedged) 103.46 95.50 100.00JPM Global High Yield Bond I2 (acc) - USD 108.25 98.39 100.22JPM Global High Yield Bond I2 (dist) - EUR (hedged)* - 95.49 100.00JPM Global High Yield Bond I2 (dist) - GBP (hedged)* - 96.61 100.05JPM Global High Yield Bond I2 (dist) - USD 102.30 98.37 100.22JPM Global High Yield Bond I2 (mth) - USD 98.92 92.77 100.22JPM Global High Yield Bond P (acc) - USD 108.44 98.56 100.36JPM Global High Yield Bond P (dist) - EUR (hedged) 96.81 95.02 104.20JPM Global High Yield Bond P (dist) - USD 116.88 112.44 119.12JPM Global High Yield Bond T (acc) - EUR (hedged) 102.23 94.84 100.37JPM Global High Yield Bond X (acc) - EUR (hedged) 180.54 166.36 173.60JPM Global High Yield Bond X (acc) - USD 173.55 157.50 159.88JPM Global High Yield Bond X (mth) - USD 99.08 92.77 -
* Share Class inactive as at end of the period.
The accompanying notes form an integral part of these Financial Statements.
10

1. Organisation
JPMorgan Investment Funds (the “Fund” or the “SICAV”) is an investment company incorporated on 22 December 1994 under the name J.P. MorganInvestment Funds. The name of the SICAV was changed to JPMorgan Fleming Investment Funds on 19 November 2001 and then to JPMorgan InvestmentFunds on 12 September 2005.
It is organised under Part I of the Luxembourg Law of 17 December 2010 on Undertakings for Collective Investment, as amended, as a Société Anonymequalifying as a Société d’Investissement à Capital Variable (SICAV). As at 30 June 2019, it comprises 16 Sub-Funds each relating to a separate investmentportfolio consisting of securities, cash and other instruments.
On 12 September 2005, JPMorgan Asset Management (Europe) S.à r.l. was appointed by the SICAV to act as Management Company. From 1 July 2011,JPMorgan Asset Management (Europe) S.à r.l. is acting as a Chapter 15 Management Company under the Luxembourg Law of 17 December 2010, asamended, and complies with UCITS regulations.
The SICAV is registered with the Registre de Commerce et des Sociétés of Luxembourg, under number B 49 663.
Each Sub-Fund may contain A, C, D, F, I, I2, P, T, V and X Share Classes. These Share Classes may differ in the minimum subscription amount, minimumholding amount, currency and/or eligibility requirements, the fees and expenses, and the dividend policy applicable to them. Certain Share Classes maycharge a Performance Fee and are redenominated by the inclusion of “(perf)” in the name of the Share Class.
Within each Sub-Fund, individual Share Classes may have a currency of denomination that differs from the currency of denomination of the Sub-Fund. Thecurrency of denomination for each Share Class is indicated by a suffix in the name of the Share Class.
2. Significant Accounting Policies
The Financial Statements are prepared in accordance with Luxembourg regulations relating to Undertakings for Collective Investments.
a) Investment Valuation
Transferable securities which are admitted to an official exchange listing or dealt in on another regulated market are valued on the basis of the latestavailable price prevailing at the time of calculating the net asset value.
If securities are listed or dealt in on several exchanges or markets, the latest available price, or if appropriate, the average price on the principal exchange ormarket will be applied.
Transferable securities not admitted to an official exchange listing nor dealt in on another regulated market are valued at the latest available price. Thosesecurities for which no price is available or for which the latest available price is not representative are valued on the basis of their reasonably foreseeablesales price determined with prudence and in good faith by the Board of Directors.
Shares or Units in UCITS or other UCIs are valued at the latest available price or net asset value, as reported or provided by such undertakings or their agents.
Liquid assets and money market instruments may be valued at nominal values plus any accrued interest or on an amortised cost basis.
The Financial Statements are presented on the basis of the net asset values of the Sub-Funds calculated on 28 June 2019. In accordance with the Prospectus,the net asset values were calculated using the latest exchange rates known at the time of calculation.
b) Swing Pricing Adjustment
To protect the interests of Shareholders, a Sub-Fund’s NAV may be adjusted to compensate for dilutions that can arise in connection with large flows of cashinto or out of a Sub-Fund.
These adjustments are normally applied on any Valuation Day when the total volume of trading in a Sub-Fund’s Shares (meaning both purchases andredemptions) exceeds a certain threshold. The adjustments will seek to reflect the anticipated prices at which the Sub-Fund will be buying and selling assets,as well as estimated transaction costs. The NAV will be adjusted upward when there are large cash inflows into the Sub-Fund and downward when there arelarge outflows. For any given Valuation Day, the adjustment will never be larger than 2% of what the NAV would otherwise be. The swing factors typicallyinclude the estimated dealing costs, stamp duty and other taxes and market bid/offer spreads. The price adjustment applicable to a specific Sub-Fund isavailable on request from the Management Company at its registered office.
The Management Company makes, and periodically reviews, the operational decisions about swing pricing, including the thresholds that trigger it, theextent of the adjustment in each case, and which Sub-Funds will and will not be subject to swing pricing at any given time.
The official Net Asset Value per Share as at period end, disclosed in the Statistical Information section of this report may therefore include a swing pricingadjustment, which would not be recognised in the Combined Statement of Net Assets and in the Combined Statement of Operations and Changes in NetAssets.
During the period, the swing pricing mechanism was applied across all Sub-Funds.
As at period end, a swing pricing adjustment has been applied to JPMorgan Investment Funds - Europe Select Equity Fund.
Similarly, in order to protect the interests of Shareholders in a Sub-Fund that is being merged, the Management Company may adjust the final Net AssetValue per Share of the merging Sub-Fund, or make other appropriate adjustments in order to neutralise for the Sub-Fund being merged, the impact of anypricing adjustment made through the swing pricing mechanism in the absorbing Sub-Fund as a result of cash inflows or outflows in the absorbing Sub-Fundon the merger date.
The Management Company may consider it appropriate not to apply the swing pricing adjustment to the Net Asset Value per Share of a Sub-Fund where it isseeking to attract inflows so that the Sub-Fund reaches a certain size. If a decision is taken in relation to a Sub-Fund the Management Company will pay thedealing and other costs resulting from securities trades to avoid the Sub-Fund suffering dilution of the net asset value. Where this happens shareholders willsubscribe or redeem at a net asset value that will not have been adjusted upwards as would have been the case if the swing pricing mechanism had beenapplied.
As at period end, no Sub-Fund was scoped in the swing waiver mechanism.
c) Realised and Unrealised Gains and Losses on Investments
Investment transactions are accounted for on the trade date (the date the order to buy or sell is executed). For trades into other collective investmentschemes, transactions are accounted for on receipt of the trade confirmation from the underlying transfer agents.
Realised gains and losses on sales of investments are calculated on the average book cost. The associated foreign exchange movement between the date ofpurchase and date of sale of investments is included in realised gains and losses on investments. Unrealised gains and losses on holdings of investments arecalculated on the total book cost and include the associated unrealised gains and losses on foreign exchange.
11
JPMorgan Investment Funds
Notes to the Unaudited Financial Statements
As at 30 June 2019
d) Income Recognition
Interest income is accrued daily and includes the amortisation of premiums and accretion of discounts, where applicable. Bank interest income is recognisedon an accrual basis. Dividend income is accrued on the ex-dividend date. This income is shown net of any withholding taxes and adjusted accordingly whentax reclaims apply.
e) Conversion of Foreign Currencies
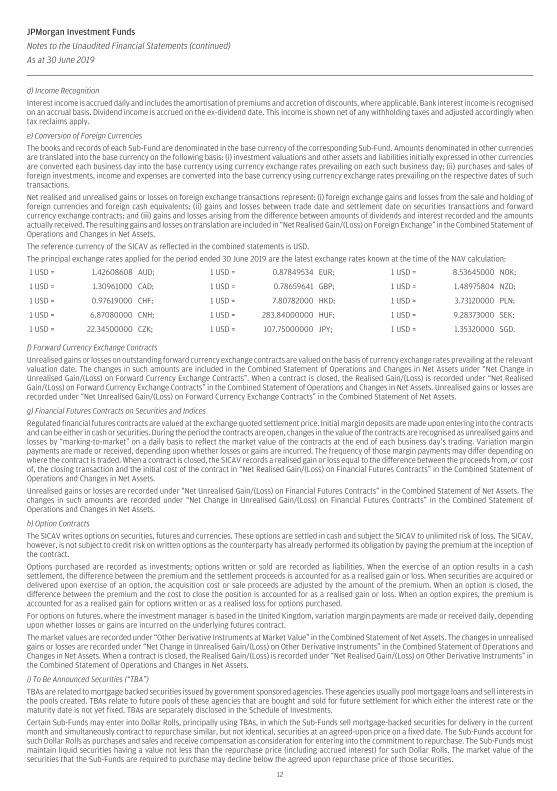
The books and records of each Sub-Fund are denominated in the base currency of the corresponding Sub-Fund. Amounts denominated in other currenciesare translated into the base currency on the following basis: (i) investment valuations and other assets and liabilities initially expressed in other currenciesare converted each business day into the base currency using currency exchange rates prevailing on each such business day; (ii) purchases and sales offoreign investments, income and expenses are converted into the base currency using currency exchange rates prevailing on the respective dates of suchtransactions.
Net realised and unrealised gains or losses on foreign exchange transactions represent: (i) foreign exchange gains and losses from the sale and holding offoreign currencies and foreign cash equivalents; (ii) gains and losses between trade date and settlement date on securities transactions and forwardcurrency exchange contracts; and (iii) gains and losses arising from the difference between amounts of dividends and interest recorded and the amountsactually received. The resulting gains and losses on translation are included in “Net Realised Gain/(Loss) on Foreign Exchange” in the Combined Statement ofOperations and Changes in Net Assets.
The reference currency of the SICAV as reflected in the combined statements is USD.
The principal exchange rates applied for the period ended 30 June 2019 are the latest exchange rates known at the time of the NAV calculation:
1 USD = 1.42608608 AUD; 1 USD = 0.87849534 EUR; 1 USD = 8.53645000 NOK;
1 USD = 1.30961000 CAD; 1 USD = 0.78659641 GBP; 1 USD = 1.48975804 NZD;
1 USD = 0.97619000 CHF; 1 USD = 7.80782000 HKD; 1 USD = 3.73120000 PLN;
1 USD = 6.87080000 CNH; 1 USD = 283.84000000 HUF; 1 USD = 9.28373000 SEK;
1 USD = 22.34500000 CZK; 1 USD = 107.75000000 JPY; 1 USD = 1.35320000 SGD.
f) Forward Currency Exchange Contracts
Unrealised gains or losses on outstanding forward currency exchange contracts are valued on the basis of currency exchange rates prevailing at the relevantvaluation date. The changes in such amounts are included in the Combined Statement of Operations and Changes in Net Assets under “Net Change inUnrealised Gain/(Loss) on Forward Currency Exchange Contracts”. When a contract is closed, the Realised Gain/(Loss) is recorded under “Net RealisedGain/(Loss) on Forward Currency Exchange Contracts” in the Combined Statement of Operations and Changes in Net Assets. Unrealised gains or losses arerecorded under “Net Unrealised Gain/(Loss) on Forward Currency Exchange Contracts” in the Combined Statement of Net Assets.
g) Financial Futures Contracts on Securities and Indices
Regulated financial futures contracts are valued at the exchange quoted settlement price. Initial margin deposits are made upon entering into the contractsand can be either in cash or securities. During the period the contracts are open, changes in the value of the contracts are recognised as unrealised gains andlosses by “marking-to-market” on a daily basis to reflect the market value of the contracts at the end of each business day’s trading. Variation marginpayments are made or received, depending upon whether losses or gains are incurred. The frequency of those margin payments may differ depending onwhere the contract is traded. When a contract is closed, the SICAV records a realised gain or loss equal to the difference between the proceeds from, or costof, the closing transaction and the initial cost of the contract in “Net Realised Gain/(Loss) on Financial Futures Contracts” in the Combined Statement ofOperations and Changes in Net Assets.
Unrealised gains or losses are recorded under “Net Unrealised Gain/(Loss) on Financial Futures Contracts” in the Combined Statement of Net Assets. Thechanges in such amounts are recorded under “Net Change in Unrealised Gain/(Loss) on Financial Futures Contracts” in the Combined Statement ofOperations and Changes in Net Assets.
h) Option Contracts
The SICAV writes options on securities, futures and currencies. These options are settled in cash and subject the SICAV to unlimited risk of loss. The SICAV,however, is not subject to credit risk on written options as the counterparty has already performed its obligation by paying the premium at the inception ofthe contract.
Options purchased are recorded as investments; options written or sold are recorded as liabilities. When the exercise of an option results in a cashsettlement, the difference between the premium and the settlement proceeds is accounted for as a realised gain or loss. When securities are acquired ordelivered upon exercise of an option, the acquisition cost or sale proceeds are adjusted by the amount of the premium. When an option is closed, thedifference between the premium and the cost to close the position is accounted for as a realised gain or loss. When an option expires, the premium isaccounted for as a realised gain for options written or as a realised loss for options purchased.
For options on futures, where the investment manager is based in the United Kingdom, variation margin payments are made or received daily, dependingupon whether losses or gains are incurred on the underlying futures contract.
The market values are recorded under “Other Derivative Instruments at Market Value” in the Combined Statement of Net Assets. The changes in unrealisedgains or losses are recorded under “Net Change in Unrealised Gain/(Loss) on Other Derivative Instruments” in the Combined Statement of Operations andChanges in Net Assets. When a contract is closed, the Realised Gain/(Loss) is recorded under “Net Realised Gain/(Loss) on Other Derivative Instruments” inthe Combined Statement of Operations and Changes in Net Assets.
i) To Be Announced Securities (“TBA”)
TBAs are related to mortgage backed securities issued by government sponsored agencies. These agencies usually pool mortgage loans and sell interests inthe pools created. TBAs relate to future pools of these agencies that are bought and sold for future settlement for which either the interest rate or thematurity date is not yet fixed. TBAs are separately disclosed in the Schedule of Investments.
Certain Sub-Funds may enter into Dollar Rolls, principally using TBAs, in which the Sub-Funds sell mortgage-backed securities for delivery in the currentmonth and simultaneously contract to repurchase similar, but not identical, securities at an agreed-upon price on a fixed date. The Sub-Funds account forsuch Dollar Rolls as purchases and sales and receive compensation as consideration for entering into the commitment to repurchase. The Sub-Funds mustmaintain liquid securities having a value not less than the repurchase price (including accrued interest) for such Dollar Rolls. The market value of thesecurities that the Sub-Funds are required to purchase may decline below the agreed upon repurchase price of those securities.
12
JPMorgan Investment Funds
Notes to the Unaudited Financial Statements (continued)
As at 30 June 2019

The Sub-Funds had TBA Dollar Rolls outstanding as at 30 June 2019, which are included in “Investment in TBAs at Market Value” and “Amounts payable onpurchase of TBAs” in the Combined Statement of Net Assets. The changes in unrealised gains or losses are included in the Combined Statement of Operationsand Changes in Net Assets under “Net Change in Unrealised Gain/(Loss) on TBAs”. When a contract is closed, the realised gains or losses are recorded under“Net Realised Gain/(Loss) on TBAs” in the Combined Statement of Operations and Changes in Net Assets.
j) Interest Rate Swap Contracts
An interest rate swap contract is a bilateral agreement in which each of the parties agree to exchange a series of interest payments for another series ofinterest payments (usually fixed/floating) based on a notional amount that serves as a computation basis and that is usually not exchanged.
The market values are recorded under “Other Derivative Instruments at Market Value” in the Combined Statement of Net Assets. The interest on interest rateswap contracts are recorded under “Interest on Swap Transactions” in the Combined Statement of Operations and Changes in Net Assets. The changes inunrealised gains or losses are included in the Combined Statement of Operations and Changes in Net Assets under “Net Change in Unrealised Gain/(Loss) onOther Derivative Instruments”. When a contract is closed, the realised gains or losses are recorded under “Net Realised Gain/(Loss) on Other DerivativeInstruments” in the Combined Statement of Operations and Changes in Net Assets.
k) Credit Default Swaps
A Credit Default Swap is a credit derivative transaction in which two parties enter into an agreement, whereby one party pays the other a fixed periodiccoupon for the specified life of the agreement. The other party makes no payments unless a credit event, relating to a predetermined reference asset,occurs. If such an event occurs, the party will then make a payment to the first party, and the swap will terminate. The value of the underlying securities shallbe taken into account for the calculation of the investment restrictions applicable to individual issuers.
The market values are recorded under “Other Derivative Instruments at Market Value” in the Combined Statement of Net Assets. The changes in unrealisedgains or losses are included in the Combined Statement of Operations and Changes in Net Assets under “Net Change in Unrealised Gain/(Loss) on OtherDerivative Instruments”. When a contract is closed, the realised gains or losses are recorded under “Net Realised Gain/(Loss) on Other DerivativeInstruments” in the Combined Statement of Operations and Changes in Net Assets.
3. Fees and Expenses
a) Charging Structures and Capped Expense Ratio
Unless stated otherwise in the Sub-Fund specific details, X Share Classes are designed to accommodate an alternative charging structure whereby a fee forthe management of the Sub-Fund is administratively levied and collected by the Management Company or through the relevant JPMorgan Chase and Co.entity directly from the Shareholder. The Management and Advisory Fee for X Share Classes is therefore listed as “Nil” in the Fees and Expenses tables in theProspectus.
Any exceptions to the charging structures detailed above are noted in the Prospectus.
The maximum total fees and expenses to be borne by shareholders on the Share Class of any Sub-Fund will not exceed a capped percentage of the total netassets attributable to that Share Class. These capped fees and expenses comprise Management and Advisory Fees, Distribution Fees and other Operatingand Administrative Expenses; it does not cover performance fees, if any.
No other costs are charged to these Share Classes and the Management Company absorbs any difference that may arise between the actual costs of theoperations of these Share Classes and the capped percentage.
This capped annual rate of fees and expenses is categorised as a Capped Expense Ratio as shown in the Appendix.
b) Management and Advisory Fees
The SICAV pays to the Management Company a management fee calculated as a percentage of the average daily net assets of each Sub-Fund or Share Classunder its management (“Management and Advisory Fees”). The Management and Advisory Fees are accrued daily and payable monthly in arrears at amaximum rate as specified in the Prospectus. The Management Company may at its absolute discretion and from time to time (which in certaincircumstances may be daily), decide to vary such rate between the maximum and 0.0%.
The maximum Management and Advisory Fee that can be charged on P Share Classes is stated in the Prospectus. However, the actual Management andAdvisory Fee charged may be lower as J.P. Morgan International Bank Limited will also charge and collect a separate and additional fee from their clients.
Charges for the management of the Sub-Funds in respect of the X Share Classes of the Sub-Funds are administratively levied and collected by theManagement Company or the appropriate JPMorgan Chase & Co. entity directly from the Shareholder.
Sub-Funds may invest in UCITS, other UCIs and closed ended investment undertakings qualifying as transferable securities within the meaning of UCITS rules(including investment trusts) (the “Undertakings”) managed by the Management Company, the Investment Managers or any other member of JPMorganChase & Co. In accordance with the Prospectus, no double charging of fees will occur with the exception of performance fees. The avoidance of adouble-charge of the Management and Advisory Fee on such assets is achieved by either a) excluding the assets from the net assets on which theManagement and Advisory Fee are calculated; or b) investing in Undertakings via share classes that do not accrue a Management and Advisory Fee or otherequivalent fees payable to the relevant Investment Manager’s group; or c) the Management and Advisory Fee being netted off by a rebate to the SICAV orSub-Fund of the Management and Advisory Fee (or equivalent) charged to the underlying Undertakings; or d) charging only the difference between theManagement and Advisory Fee of the SICAV or Sub-Fund as per the Prospectus and the Management and Advisory Fee (or equivalent) charged to theUndertakings or (e) if the underlying Undertakings combine management and other fees and charges into a single total expense ratio, such as in exchangetraded funds, the whole total expense ratio being waived.
Where a Sub-Fund invests in Undertakings managed by investment managers which are not members of JPMorgan Chase & Co. group, the Management andAdvisory Fee, as specified in the Prospectus, may be charged regardless of any fees reflected in the price of the shares or units of the Undertakings.
c) Operating and Administrative Expenses
The SICAV bears all its ordinary operating and administrative expenses at the rates set out in the Prospectus (“Operating and Administrative Expenses”) tomeet all fixed and variable costs, charges, fees, and other expenses incurred in the operation and administration of the SICAV from time to time. TheOperating and Administrative Expenses are capped for each Share Class at the maximum rate set out in the Prospectus. The Management Company will bearany Operating and Administrative Expenses which exceed the maximum rate specified in the Prospectus. At its discretion, the Management Company may ona temporary basis meet the Direct and/or Indirect Fund Expenses on a Sub-Fund’s behalf and/or waive all or part of the Fund Servicing Fee.
The Operating and Administrative Expenses are calculated as a percentage of the average daily net assets of each Sub-Fund or Share Class. They are accrueddaily and payable monthly in arrears and will not exceed the maximum rate as specified in the relevant section of the Prospectus.
13
JPMorgan Investment Funds
Notes to the Unaudited Financial Statements (continued)
As at 30 June 2019

The Operating and Administrative Expenses cover:
(i) A “Fund Servicing Fee” paid to the Management Company for the services that the Management Company provides to the SICAV. The Fund Servicing Feewill be reviewed annually and will not exceed 0.15% per annum.
(ii) Expenses directly contracted by the SICAV (“Direct Fund Expenses”) and expenses directly contracted by the Management Company on behalf of theSICAV (“Indirect Fund Expenses”) as detailed in the Prospectus.
Operating and Administrative Expenses do not include Transaction Fees and Extraordinary Expenses.
The SICAV’s formation expenses and the expenses relating to the creation of new Sub-Funds may be capitalised and amortised over a period not exceedingfive years, as permitted by Luxembourg law.
d) Performance Fees
Pursuant to the Investment Management Agreement, as set out in the Prospectus, the Investment Manager is entitled to receive from the net assets ofcertain Sub-Funds or Share Classes, an annual performance-based incentive fee (the “Performance Fee”) if the performance of the Sub-Fund exceeds thereturn from the benchmark, subject to the operation of a Claw-Back Mechanism or of a High Water Mark as defined in the Prospectus and as specified in theProspectus for each Sub-Fund. On each Valuation Day, an accrual for the previous Valuation Day’s Performance Fee is made, when appropriate, and theperformance fee accrual, if any, becomes payable to the Management Company on the last Dealing Day of the Financial Year, or under any of the followingcircumstances: on very significant orders for switching or redemption (applies to those Shares only) and when a Sub-Fund is merged or liquidated. Pursuantto the provisions of the relevant Investment Management Agreement, the Investment Manager may be entitled to receive the performance Fee from theManagement Company.
On each Valuation Day, the net asset value of each Share Class of each Sub-Fund for which a Performance Fee applies, which includes an accrual for all feesand expenses (including the Management and Advisory Fee, and the Operating and Administrative Expenses to be borne by the relevant Share Class at therate set out in the Prospectus), is adjusted for any dividend distributions and for subscriptions and redemptions dealt with on that Valuation Day, if any, andany Performance Fee accrued through that day in respect of such Share Class is added back (the “Adjusted net asset value”). For purposes of calculating thePerformance Fee, the “Share Class Return” is computed on each Valuation Day, as the difference between the net asset value (adjusted by adding back anyaccrued Performance Fee) on such day and the Adjusted net asset value on the previous Valuation Day, expressed as a return based on the previousValuation Day’s Adjusted net asset value for that Share Class.
Sub-Funds may invest in UCITS and other UCIs managed by the Management Company, the Investment Managers or any other member of JPMorgan Chase &Co. No double-charging of Performance Fees will occur. The avoidance of a double-charge of the Performance Fee is achieved by either a) where a Sub-Fundinvests in such UCITS and other UCIs, and these UCITS or UCIs charge performance fees, the Sub-Fund will not charge Performance Fees or b) where aSub-Fund charges a Performance Fee, it will not invest in UCITS and/or UCIs that charge performance fees.
Claw-Back mechanism
The purpose of the Claw-Back Mechanism is to ensure that the Management Company will only become entitled to a Performance Fee when it outperformsthe cumulative Benchmark Return (as defined in the Prospectus) accrued since the last Valuation Day of the last period in which a Performance Fee was paid.
High Water Mark Method
If the Share Class Return exceeds the Benchmark Return and the cumulative Share Class Return exceeds the High Water Mark Return (as set out in theProspectus), the Performance Fee accrual is increased by the Performance Fee Rate multiplied by the Excess Return multiplied by the previous ValuationDay’s Adjusted net asset value for that Class. If the Share Class Return does not exceed the Benchmark Return, the Performance Fee accrual is reduced (butnot below zero) by the Performance Fee Rate multiplied by the negative Excess Return multiplied by the previous Valuation Day’s Adjusted net asset valuefor that Class. Following a period of negative Excess Return whereby the Performance Fee accrual has been reduced to zero, no new Performance Fee isaccrued until such time as the cumulative Share Class Return exceeds the greater of the High Water Mark Return and the cumulative Benchmark Return sincethe beginning of the SICAV accounting period. The Performance Fee accrued on any Valuation Day is reflected in the Net Asset Value per Share on the basisof which subscriptions and redemptions may be accepted.
e) Distribution Fees
The SICAV pays to the Management Company a distribution fee (the “Distribution Fee”) in respect of D, F and T Share Classes. The Distribution Fee ratepayable for each Share Class is stated in the Prospectus. The Management Company may at its absolute discretion and from time to time (which in certaincircumstances may be daily) decide to vary such rate between the maximum and 0.0%. The Management Company may pay all or part of the Distribution Feeto certain Distributors for the services provided by them in relation to the distribution of the D, F and T Share Classes.
4. Dividend Policy
Share Classes suffixed “(acc)”
Share Classes with the suffix “(acc)” are accumulation Share Classes and will not normally pay dividends.
Share Classes suffixed “(dist)”
It is intended that all those Share Classes with the suffix “(dist)” will, if appropriate, pay reportable income annually and will have “UK Reporting Fund Status”.
Share Classes suffixed “(div)”
Share Classes with the suffix “(div)” will normally pay quarterly dividends which are calculated by the Management Company based on the estimated annualyield of the relevant Sub-Fund’s portfolio which is attributable to that Share Class. The Management Company will review the dividend rate for each ShareClass at least semi-annually, but may adjust the dividend rate more frequently to reflect changes in the portfolio’s expected yield.
Investors should be aware that “(div)” Share Classes give priority to dividends, rather than to capital growth. The expected yield for each Share Class will becalculated gross of both the Management and Advisory Fee and the Operating and Administrative Expenses, and such Share Classes will typically distributemore than the income received. Share Classes with the suffix “(div)” in issue at the dividend record date will be eligible for any dividends which will normallybe paid in the currency of the relevant Share Class.
Share Classes suffixed “(mth)”
Share Classes with the suffix “(mth)” will be available to Shareholders subscribing, and remaining subscribed, through specific Asian distribution networksand to other distributors at the sole discretion of the Management Company. Share Classes with the suffix “(mth)” will normally pay dividends on a monthlybasis. The monthly dividend rate per Share will be calculated by the Management Company based on the estimated annual yield of the relevant Sub-Fund’sportfolio which is attributable to that Share Class. The Management Company will review the dividend rate for each Share Class at least semi-annually, but
14
JPMorgan Investment Funds
Notes to the Unaudited Financial Statements (continued)
As at 30 June 2019

may adjust the dividend rate more frequently to reflect changes in the portfolio’s expected yield. Investors should be aware that “(mth)” Share Classes givepriority to dividends, rather than to capital growth. The expected yield for each Share Class will be calculated gross of both the Management and AdvisoryFee and the Operating and Administrative Expenses, and such Share Classes will typically distribute more than the income received. Dividend payments forthese Share Classes will normally be made to Shareholders each month and will be paid in the currency of the relevant Share Class. The ManagementCompany reserves the right to fix a minimum amount per Share Class, below which the actual payment of the dividend would not be economically efficientfor the SICAV. These payments will be deferred to the following month or reinvested in further Shares of the same Share Class and not paid directly to theShareholders. The net asset value of “(mth)” Share Classes may fluctuate more than other Share Classes due to more frequent distribution of income.
Share Classes suffixed “(fix)”
Share Classes with the suffix “(fix)” will normally pay a quarterly fixed dividend based on a total amount per Share per annum as defined in the Prospectus.
Share Classes with the suffix “(fix)” may be closed to further subscriptions, liquidated, not pay a dividend or reduce the dividend amount payable if thepayment of the dividend is believed not to be in the best interests of all Shareholders collectively in the Share Class.
Share Classes suffixed “(irc)”
Share Classes with the suffix “(irc)” will normally pay dividends on a monthly basis. The monthly dividend rate per Share will be variable and will be calculatedby the Management Company based on: the estimated gross annual yield of the relevant Sub-Fund’s portfolio attributable to that Share Class, which isrevised at least semi-annually; and the addition or deduction of the estimated interest rate carry depending on whether such carry is positive or negativerespectively. The interest rate carry is calculated using the average daily differential of the one month FX forward rate and the spot rate between these twocurrencies of the preceding calendar month.
Other Information
Shareholders should note that, where the dividend rate is in excess of the investment income of the Share Class, dividends will be paid out of the capitalattributed to the Share Class, as well as from realised and unrealised capital gains. This may be tax inefficient for Shareholders in certain countries.Shareholders should consult their local tax adviser about their own position. Share Classes with the suffix “(div)”, “(fix)” and “(mth)” do not distribute thereportable income in accordance with the United Kingdom tax legislation relating to offshore funds.
Details of dividends distributed during the period ended 30 June 2019 are available athttp://www.jpmorganassetmanagement.lu/en/showpage.aspx?pageID=18.
5. Taxation
The SICAV is not subject to taxation in Luxembourg on its income, profits or gains. The SICAV is not subject to net wealth tax in Luxembourg. The only tax towhich the SICAV in Luxembourg is subject is the subscription tax (“taxe d’abonnement”) up to a rate of 0.05% per annum based on the net asset valueattributed to each Share Class at the end of the relevant quarter, calculated and paid quarterly. A reduced tax rate of 0.01% per annum of the net assets willbe applicable to Share Classes as identified in the Appendix. The 0.01% and 0.05% rates described above, as appropriate, are not applicable for the portionof the assets of the SICAV invested in other Luxembourg collective investment undertakings which are themselves already subject to the taxe d’abonnement.
No stamp duty, capital duty or other tax is payable in Luxembourg upon the issue of the Shares of the SICAV. No tax is payable on realised or unrealisedcapital appreciation of the assets of the SICAV in the Grand Duchy of Luxembourg. Although the SICAV’s realised capital gains, whether short or long-term,are not expected to become taxable in another country, the shareholders must be aware and recognise that such a possibility is not totally excluded. Theregular income of the SICAV from some of its securities, as well as interest earned on cash deposits in certain countries, may be subject to withholding taxesat varying rates, which normally cannot be recovered.
Following case law precedent within Europe, the SICAV has instigated proceedings to reclaim tax withheld by certain Member States of the European Unionon dividend payments it has received. The decision to initiate proceedings against any particular Member State is the result of an analysis of the likely costsand potential benefits of doing so and the likelihood of successfully reclaiming such amounts together with the estimated time to complete proceedingsvaries across Member States. Any costs associated with this decision have been charged to the relevant Sub-Funds and have been included within total costsfor the purposes of determining the relevant expense cap or TER and no amount has been recorded in the SICAV for any possible amounts to be receivedunder this action.
6. Statement of Changes in Investments
A list, specifying for each investment within each Sub-Fund the total purchases and sales which occurred during the financial period, may be obtained free ofcharge upon request at the registered office of the SICAV. Additional information on investments within each Sub-Fund’s portfolio is available toshareholders at the registered office of the SICAV.
7. Value of Financial Instruments and Associated Risks
The SICAV entered into forward currency exchange contracts, financial futures contracts, options and swaps which, to varying degrees, represent a marketrisk in excess of the amount reflected on the Combined Statement of Net Assets. The amount of the contracts represents the extent of the SICAV’sparticipation in these financial instruments. Market risks associated with such contracts arise due to the possible movements in foreign exchange rates,indices, and security values underlying these instruments. Other market and credit risks include the possibility that there may be an illiquid market for thecontracts, that a change in the value of the contracts may not directly correlate with changes in the value of the underlying currencies, indices, or securities,or that the counterparty to a contract defaults on its obligation to perform under the terms of the contract.
8. Collateral received with respect to Financial Techniques and Financial Derivative Instruments
Assets received from counterparties in securities lending activities and OTC derivative transactions other than currency forwards constitute collateral.
The SICAV will only enter into transactions with counterparties which the Management Company believes to be creditworthy. Approved counterparties willtypically have a public rating of A- or above. Counterparties will comply with prudential rules considered by the CSSF as equivalent to EU prudential rules. Thecounterparty does not have discretion over the composition or management of a Sub-Fund’s portfolio or over the underlying of financial derivativeinstruments used by a Sub-Fund. Counterparty approval is not required in relation to any investment decision made by a Sub-Fund.
Collateral may be offset against gross counterparty exposure provided it meets a range of standards, including those for liquidity, valuation, issuer creditquality, correlation and diversification. In offsetting collateral its value is reduced by a percentage (a “haircut”) which provides, inter alia, for short termfluctuations in the value of the exposure and of the collateral. Collateral levels are maintained to ensure that net counterparty exposure does not exceed thelimits per counterparty as set out in the Prospectus. If any, collateral is received in the form of securities and cash. Non-cash collateral received is not sold,reinvested or pledged.
15
JPMorgan Investment Funds
Notes to the Unaudited Financial Statements (continued)
As at 30 June 2019

9. Securities Lending
The SICAV may lend portions of its securities portfolio to third parties for the purpose of generating additional income or for reducing costs or risk, to themaximum extent allowed by and within the limits set forth in (i) article 11 of the Grand Ducal regulation of 8 February 2008 relating to certain definitions ofthe Luxembourg Law, (ii) CSSF Circular 08/356 relating to the rules applicable to undertakings for collective investments when they use certain techniquesand instruments relating to transferable securities and money market instruments (“CSSF Circular 08/356”) and (iii) any other applicable laws, regulations,circulars or CSSF positions.
Borrowers of securities lent by participating Sub-Funds are approved by the Management Company after appropriate assessment of such borrowers’ statusand financial standing. 90% of any incremental income earned from securities lending is accrued to the applicable Sub-Fund, whilst the remaining 10%income is paid to JPMorgan Chase Bank, N.A. for its role as securities lending agent for the SICAV. The income earned from the securities lending program isdetailed in the Combined Statement of Operations and Changes in Net Assets.
As at 30 June 2019, the SICAV valuation of securities on loan is USD 1,818,585,505 as detailed below and received collateral with a market value ofUSD 1,895,457,229.
Market Valueof Securities
on LoanCash
Collateral**Non Cash
Collateral* Base CurrencyLending
Income (Gross)Lending Agent
FeeLending
Income (Net)
Sub-Fund USD USD USD Base Currency Base Currency Base Currency
JPMorgan Investment Funds - Europe Select Equity Fund 25,405,819 - 26,766,806 EUR 254,167 25,416 228,751
JPMorgan Investment Funds - Global Dividend Fund 2,396,962 2,517,140 - USD 25,634 2,563 23,071
JPMorgan Investment Funds - Global High Yield Bond Fund 446,559,796 204,885,006 258,828,400 USD 1,766,025 176,602 1,589,423
* The securities received as collateral are in the form of government securities (US, UK, Eurozone and other government securities). These securities are issued and guaranteed as to principal andinterest by the governments of the relevant countries.** Cash collateral may be reinvested into Reverse Repurchase Transactions with high quality government bonds as collateral. Income earned is recorded under the “Securities Lending Income” in theCombined Statement of Operations and Changes in Net Assets.
10. Transactions with Connected Parties
All transactions with connected parties were carried out on an arm’s length basis.
JPMorgan Chase & Co. and its affiliates are counterparties for all securities lending activity and for certain forward foreign exchange contracts, financialfutures contracts and swaps contracts.The Management Company, Registrar and Transfer Agent, Domiciliary Agent and Global Distributor, InvestmentManagers, Depositary, Corporate and Administrative Agent and other related Agents of the SICAV are considered as connected parties as they are affiliatedentities of JPMorgan Chase & Co. In addition Elvinger Hoss Prussen, société anonyme (of which Mr Jacques Elvinger who is on the Board of Directors of theSICAV, is a partner) is compensated for legal services to the SICAV.
11. Commission Sharing Arrangements
The Investment Managers may enter into commission sharing arrangements only where there is a direct and identifiable benefit to the clients of theInvestment Managers, including the SICAV, and where the Investment Managers are satisfied that the transactions generating the shared commissions aremade in good faith, in strict compliance with applicable regulatory requirements and in the best interests of the SICAV and the Shareholders. Any sucharrangements must be made by the Investment Manager on terms commensurate with best market practice. Depending on local regulation, an InvestmentManager can pay for research or execution services using soft commissions or other similar arrangements.
12. Information for German Registered Shareholders
A list, specifying for each investment within each Sub-Fund the total purchases and sales which occurred during the financial period, may be obtained free ofcharge upon request at the registered office of the SICAV and at the office of the German paying and information agent, JPMorgan Asset Management(Europe) S.à r.l., Frankfurt Branch, Taunustor 1, D-60310, Frankfurt am Main, Germany. Additional information on investments within each Sub-Fund’sportfolio is available to shareholders at the registered office of the SICAV and at the office of the German paying and information agent.
13. Information for Investors in Switzerland
Representative in Switzerland: JPMorgan Asset Management (Switzerland) LLC, Dreikönigstrasse 37, 8002 Zürich.
Paying Agent in Switzerland: J.P. Morgan (Suisse) SA, 8 Rue de la Confédération, 1204 Geneva.
The Prospectus, the Key Investor Information Documents, the articles of incorporation, the annual and semi-annual financial report as well as a list of thepurchases and sales which the SICAV has undertaken during the financial period may be obtained free of charge from the representative.
14. Authorisation of Sub-Funds in Hong Kong
Certain Share Classes of the following Sub-Funds are authorised in Hong Kong and are available to Hong Kong residents:
- JPMorgan Investment Funds - Europe Select Equity Fund;
- JPMorgan Investment Funds - Global Dividend Fund;
- JPMorgan Investment Funds - Global High Yield Bond Fund.
15. Directors’ Fees
The only remuneration paid to Directors is an annual fee. This is waived by Mr Daniel Watkins and Mr Massimo Greco. The total Directors’ fee for the periodamounted to EUR 119,510 of which EUR 28,266 was due to the Chairman.
16
JPMorgan Investment Funds
Notes to the Unaudited Financial Statements (continued)
As at 30 June 2019

16. Transaction Costs
For the period ended 30 June 2019, the SICAV incurred transaction costs which have been defined as brokerage fees included with the “Net RealisedGain/(Loss) for the Period” in the Combined Statement of Operations and Changes in Net Assets relating to purchase or sale of transferable securities,derivatives (except OTC derivatives) or other eligible assets. The SICAV also incurred transaction costs charged by the depositary agent included within“Depositary, Corporate, Administration and Domiciliary Agency Fees” in the Combined Statement of Operations and Changes in Net Assets relating topurchase and sale of transferable securities as follows:
Sub-Fund Base Currency Depositary Transaction Costs andBrokerage Fees
(in Base Currency)
JPMorgan Investment Funds - Europe Select Equity Fund EUR 1,839,860
JPMorgan Investment Funds - Global Dividend Fund USD 140,178
JPMorgan Investment Funds - Global High Yield Bond Fund USD 35,507
For fixed income securities, transaction costs are not separately identifiable from the purchase price of the security and therefore cannot be disclosed separately.
17. Significant Events during the period
a) Securities Lending Program
With effect from 1 January 2019, 90% of any incremental income will be accrued to the applicable Sub-Fund and 10% will be paid to the securities lendingagent.
18. Subsequent Events after the period
a) Investment Policy update
With effect from 2 July 2019, the investment policy of JPMorgan Investment Funds - Global Dividend Fund was updated to remove the reference to anapproximate stock concentration range of 40 to 90 companies.
17
JPMorgan Investment Funds
Notes to the Unaudited Financial Statements (continued)
As at 30 June 2019

Transferable securities and money market instruments admitted to an official exchangelisting
Equities
AustriaErste Group Bank AG EUR 375,396 12,190,985 1.07
12,190,985 1.07
BelgiumKBC Group NV EUR 181,429 10,424,910 0.92
10,424,910 0.92
DenmarkNovo Nordisk A/S ‘B’ DKK 789,195 35,347,574 3.11
35,347,574 3.11
FinlandUPM-Kymmene OYJ EUR 591,547 13,703,186 1.21
13,703,186 1.21
FranceAccor SA EUR 482,994 18,182,309 1.60Air Liquide SA EUR 112,908 13,850,989 1.22Alstom SA EUR 153,177 6,218,986 0.55BNP Paribas SA EUR 421,849 17,571,065 1.54Capgemini SE EUR 96,556 10,654,955 0.94LVMH Moet Hennessy Louis Vuitton SE EUR 88,424 32,873,833 2.89Pernod Ricard SA EUR 106,111 17,123,663 1.51Schneider Electric SE EUR 298,986 23,826,194 2.09TOTAL SA EUR 438,269 21,540,921 1.89Valeo SA EUR 263,433 7,499,938 0.66Vinci SA EUR 272,694 24,528,825 2.16
193,871,678 17.05
Germanyadidas AG EUR 46,530 12,554,957 1.10Allianz SE EUR 97,612 20,525,363 1.81Deutsche Boerse AG EUR 88,633 10,974,981 0.97Deutsche Post AG EUR 752,670 21,656,198 1.90Infineon Technologies AG EUR 1,001,932 15,661,199 1.38MuenchenerRueckversicherungs-Gesellschaft AG EUR 98,812 21,783,106 1.92RWE AG EUR 376,570 8,120,732 0.71SAP SE EUR 144,396 17,246,658 1.52Volkswagen AG Preference EUR 140,444 20,687,401 1.82
149,210,595 13.13
IrelandCRH plc EUR 522,965 14,922,806 1.31Kerry Group plc ‘A’ EUR 89,055 9,310,700 0.82Kingspan Group plc EUR 156,994 7,466,635 0.66Ryanair Holdings plc EUR 1,705,855 17,139,578 1.51
48,839,719 4.30
ItalyEnel SpA EUR 2,698,875 16,584,587 1.46FinecoBank Banca Fineco SpA EUR 977,894 9,588,251 0.84UniCredit SpA EUR 861,189 9,324,954 0.82
35,497,792 3.12
JerseyFerguson plc GBP 230,072 14,391,857 1.26Glencore plc GBP 7,244,854 22,016,369 1.94
36,408,226 3.20
NetherlandsAirbus SE EUR 194,420 24,143,076 2.12Akzo Nobel NV EUR 254,080 20,988,278 1.85ASML Holding NV EUR 127,757 23,425,523 2.06Heineken NV EUR 152,708 14,918,045 1.31ING Groep NV EUR 1,981,606 20,234,179 1.78Koninklijke Ahold Delhaize NV EUR 996,220 19,732,130 1.74STMicroelectronics NV EUR 1,099,425 17,098,807 1.50Unilever NV, CVA EUR 215,844 11,452,683 1.01
151,992,721 13.37
NorwayTelenor ASA NOK 1,308,936 24,556,544 2.16
24,556,544 2.16
SpainAmadeus IT Group SA EUR 144,554 10,020,483 0.88Iberdrola SA EUR 1,836,869 16,034,030 1.41Industria de Diseno Textil SA EUR 355,688 9,416,840 0.83Repsol SA EUR 908,077 12,422,493 1.09Repsol SA Rights 04/07/2019 EUR 908,077 443,596 0.04
48,337,442 4.25
SwitzerlandAdecco Group AG CHF 173,853 9,136,927 0.80Cie Financiere Richemont SA CHF 317,863 23,602,156 2.08Credit Suisse Group AG CHF 990,173 10,430,079 0.92LafargeHolcim Ltd. CHF 122,166 5,237,539 0.46Lonza Group AG CHF 53,514 15,740,590 1.38Nestle SA CHF 31,185 2,833,069 0.25Novartis AG CHF 442,239 35,549,637 3.13Roche Holding AG CHF 98,419 24,201,608 2.13
126,731,605 11.15
United Kingdom3i Group plc GBP 1,119,669 13,914,729 1.22Beazley plc GBP 1,392,666 8,589,546 0.76Diageo plc GBP 672,373 25,343,789 2.23HSBC Holdings plc GBP 1,136,768 8,318,909 0.73Imperial Brands plc GBP 437,063 9,003,964 0.79Prudential plc GBP 1,602,066 30,663,052 2.70RELX plc GBP 600,930 12,793,555 1.13Rio Tinto plc GBP 585,855 31,853,013 2.80Royal Dutch Shell plc ‘A’ GBP 1,380,182 39,637,877 3.49SSE plc GBP 858,413 10,715,895 0.94Taylor Wimpey plc GBP 6,749,313 11,845,720 1.04Tesco plc GBP 6,140,855 15,599,198 1.37Unilever plc GBP 465,946 25,278,905 2.22
243,558,152 21.42
Total Equities 1,130,671,129 99.46
Total Transferable securities and money market instrumentsadmitted to an official exchange listing
1,130,671,129 99.46
Units of authorised UCITS or other collective investment undertakings
Collective Investment Schemes - UCITS
LuxembourgJPMorgan EUR Liquidity LVNAV Fund -JPM EUR Liquidity LVNAV X (flex dist.)† EUR 1,788 17,859,046 1.57
17,859,046 1.57
Total Collective Investment Schemes - UCITS 17,859,046 1.57
Total Units of authorised UCITS or other collective investmentundertakings
17,859,046 1.57
Total Investments 1,148,530,175 101.03
Cash 462,760 0.04
Other Assets/(Liabilities) (12,158,062) (1.07)
Total Net Assets 1,136,834,873 100.00
† Related Party Fund.
18
JPMorgan Investment Funds - Europe Select Equity Fund
Schedule of Investments
As at 30 June 2019
Investments Currency
Quantity/Nominal
Value
MarketValue
EUR
%of
NetAssets Investments Currency
Quantity/Nominal
Value
MarketValue
EUR
%of
NetAssets

Geographic Allocation of Portfolio as at 30 June 2019 % of Net Assets
United Kingdom 21.42France 17.05Netherlands 13.37Germany 13.13Switzerland 11.15Ireland 4.30Spain 4.25Jersey 3.20Italy 3.12Denmark 3.11Norway 2.16Luxembourg 1.57Finland 1.21Austria 1.07Belgium 0.92Total Investments 101.03Cash and Other Assets/(Liabilities) (1.03)
Total 100.00
Geographic Allocation of Portfolio as at 31 December 2018 % of Net Assets
United Kingdom 24.55France 18.42Germany 13.65Switzerland 10.81Netherlands 8.98Ireland 3.52Jersey 3.48Spain 3.33Denmark 3.09Italy 2.63Finland 2.33Norway 1.86Austria 1.02Luxembourg 0.89Belgium 0.67Total Investments 99.23Cash and Other Assets/(Liabilities) 0.77
Total 100.00
19
JPMorgan Investment Funds - Europe Select Equity Fund
Schedule of Investments (continued)
As at 30 June 2019
Investments Currency
Quantity/Nominal
Value
MarketValue
EUR
%of
NetAssets Investments Currency
Quantity/Nominal
Value
MarketValue
EUR
%of
NetAssets

JPMorgan Investment Funds - Europe Select Equity Fund
Schedule of Investments (continued)
As at 30 June 2019
Forward Currency Exchange Contracts
CurrencyPurchased
AmountPurchased Currency Sold Amount Sold
MaturityDate Counterparty
UnrealisedGain/(Loss)
EUR
%of
NetAssets
DKK 24,880,720 EUR 3,333,474 03/07/2019 Standard Chartered 54 -EUR 30,133,604 GBP 26,743,980 03/07/2019 HSBC 266,043 0.03EUR 2,514,486 NOK 24,415,482 05/08/2019 BNP Paribas 6,192 -EUR 1,067,847 USD 1,196,726 03/07/2019 BNP Paribas 16,616 -EUR 1,741,016 USD 1,950,502 03/07/2019 Citibank 27,652 -EUR 820,427 USD 920,569 03/07/2019 Credit Suisse 11,779 -GBP 26,110,252 EUR 29,066,689 03/07/2019 Citibank 93,127 0.01GBP 559,132 USD 710,036 05/08/2019 Standard Chartered 1,760 -SEK 11,232,470 USD 1,194,581 03/07/2019 Barclays 13,545 -USD 125,717,291 EUR 110,098,305 05/08/2019 Citibank 26,996 -USD 856,810 GBP 671,694 03/07/2019 Barclays 2,496 -
Total Unrealised Gain on Forward Currency Exchange Contracts 466,260 0.04
CHF 14,423,864 EUR 12,991,604 03/07/2019 Standard Chartered (11,088) -EUR 12,195,253 CHF 13,673,847 03/07/2019 State Street (110,298) (0.01)EUR 3,331,656 DKK 24,880,720 03/07/2019 Standard Chartered (1,873) -EUR 3,334,128 DKK 24,880,720 05/08/2019 Standard Chartered (82) -EUR 29,035,097 GBP 26,110,252 05/08/2019 Citibank (91,987) (0.01)EUR 2,490,690 NOK 24,415,482 03/07/2019 HSBC (21,810) -EUR 1,055,220 SEK 11,232,470 03/07/2019 Standard Chartered (7,671) -EUR 110,394,530 USD 125,717,291 03/07/2019 Citibank (38,333) (0.01)GBP 938,970 EUR 1,063,389 03/07/2019 ANZ (14,752) -GBP 873,762 USD 1,110,901 03/07/2019 Barclays (26) -GBP 587,265 USD 748,824 05/08/2019 Merrill Lynch (832) -NOK 24,415,482 EUR 2,518,476 03/07/2019 BNP Paribas (5,976) -USD 753,109 CHF 750,017 03/07/2019 State Street (13,417) -USD 124,653,486 EUR 111,600,172 03/07/2019 Citibank (2,101,779) (0.19)USD 1,372,053 EUR 1,215,518 03/07/2019 Credit Suisse (10,276) -USD 694,226 EUR 621,742 03/07/2019 Goldman Sachs (11,918) -USD 2,379,353 EUR 2,121,366 03/07/2019 Merrill Lynch (31,289) -USD 737,441 EUR 652,198 03/07/2019 RBC (4,413) -USD 966,034 EUR 851,470 05/08/2019 BNP Paribas (5,248) -USD 899,675 EUR 789,482 05/08/2019 Goldman Sachs (1,389) -USD 644,090 GBP 507,310 03/07/2019 Merrill Lynch (778) -
Total Unrealised Loss on Forward Currency Exchange Contracts (2,485,235) (0.22)
Net Unrealised Loss on Forward Currency Exchange Contracts (2,018,975) (0.18)
20
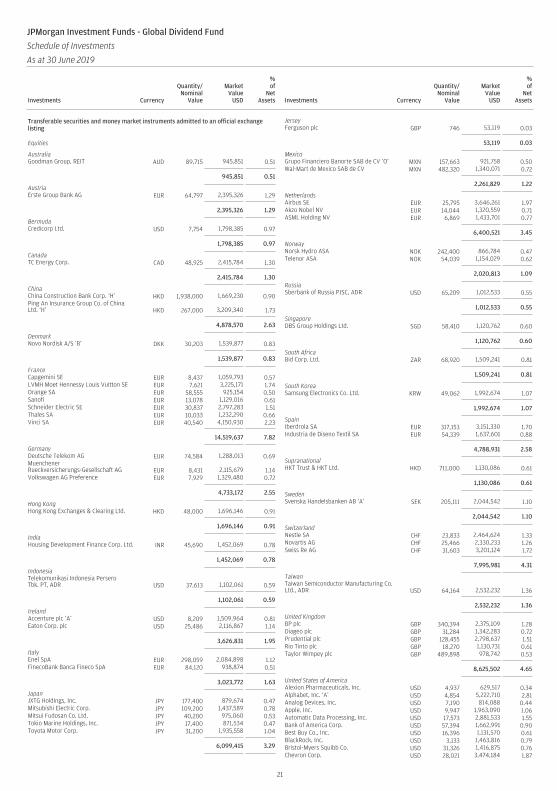
Transferable securities and money market instruments admitted to an official exchangelisting
Equities
AustraliaGoodman Group, REIT AUD 89,715 945,851 0.51
945,851 0.51
AustriaErste Group Bank AG EUR 64,797 2,395,326 1.29
2,395,326 1.29
BermudaCredicorp Ltd. USD 7,754 1,798,385 0.97
1,798,385 0.97
CanadaTC Energy Corp. CAD 48,925 2,415,784 1.30
2,415,784 1.30
ChinaChina Construction Bank Corp. ‘H’ HKD 1,938,000 1,669,230 0.90Ping An Insurance Group Co. of ChinaLtd. ‘H’ HKD 267,000 3,209,340 1.73
4,878,570 2.63
DenmarkNovo Nordisk A/S ‘B’ DKK 30,203 1,539,877 0.83
1,539,877 0.83
FranceCapgemini SE EUR 8,437 1,059,793 0.57LVMH Moet Hennessy Louis Vuitton SE EUR 7,621 3,225,171 1.74Orange SA EUR 58,555 925,154 0.50Sanofi EUR 13,078 1,129,016 0.61Schneider Electric SE EUR 30,837 2,797,283 1.51Thales SA EUR 10,033 1,232,290 0.66Vinci SA EUR 40,540 4,150,930 2.23
14,519,637 7.82
GermanyDeutsche Telekom AG EUR 74,584 1,288,013 0.69MuenchenerRueckversicherungs-Gesellschaft AG EUR 8,431 2,115,679 1.14Volkswagen AG Preference EUR 7,929 1,329,480 0.72
4,733,172 2.55
Hong KongHong Kong Exchanges & Clearing Ltd. HKD 48,000 1,696,146 0.91
1,696,146 0.91
IndiaHousing Development Finance Corp. Ltd. INR 45,690 1,452,069 0.78
1,452,069 0.78
IndonesiaTelekomunikasi Indonesia PerseroTbk. PT, ADR USD 37,613 1,102,061 0.59
1,102,061 0.59
IrelandAccenture plc ‘A’ USD 8,209 1,509,964 0.81Eaton Corp. plc USD 25,486 2,116,867 1.14
3,626,831 1.95
ItalyEnel SpA EUR 298,059 2,084,898 1.12FinecoBank Banca Fineco SpA EUR 84,120 938,874 0.51
3,023,772 1.63
JapanJXTG Holdings, Inc. JPY 177,400 879,674 0.47Mitsubishi Electric Corp. JPY 109,200 1,437,589 0.78Mitsui Fudosan Co. Ltd. JPY 40,200 975,060 0.53Tokio Marine Holdings, Inc. JPY 17,400 871,534 0.47Toyota Motor Corp. JPY 31,200 1,935,558 1.04
6,099,415 3.29
JerseyFerguson plc GBP 746 53,119 0.03
53,119 0.03
MexicoGrupo Financiero Banorte SAB de CV ‘O’ MXN 157,663 921,758 0.50Wal-Mart de Mexico SAB de CV MXN 482,320 1,340,071 0.72
2,261,829 1.22
NetherlandsAirbus SE EUR 25,795 3,646,261 1.97Akzo Nobel NV EUR 14,044 1,320,559 0.71ASML Holding NV EUR 6,869 1,433,701 0.77
6,400,521 3.45
NorwayNorsk Hydro ASA NOK 242,400 866,784 0.47Telenor ASA NOK 54,039 1,154,029 0.62
2,020,813 1.09
RussiaSberbank of Russia PJSC, ADR USD 65,209 1,012,533 0.55
1,012,533 0.55
SingaporeDBS Group Holdings Ltd. SGD 58,410 1,120,762 0.60
1,120,762 0.60
South AfricaBid Corp. Ltd. ZAR 68,920 1,509,241 0.81
1,509,241 0.81
South KoreaSamsung Electronics Co. Ltd. KRW 49,062 1,992,674 1.07
1,992,674 1.07
SpainIberdrola SA EUR 317,153 3,151,330 1.70Industria de Diseno Textil SA EUR 54,339 1,637,601 0.88
4,788,931 2.58
SupranationalHKT Trust & HKT Ltd. HKD 711,000 1,130,086 0.61
1,130,086 0.61
SwedenSvenska Handelsbanken AB ‘A’ SEK 205,111 2,044,542 1.10
2,044,542 1.10
SwitzerlandNestle SA CHF 23,833 2,464,624 1.33Novartis AG CHF 25,466 2,330,233 1.26Swiss Re AG CHF 31,603 3,201,124 1.72
7,995,981 4.31
TaiwanTaiwan Semiconductor Manufacturing Co.Ltd., ADR USD 64,164 2,532,232 1.36
2,532,232 1.36
United KingdomBP plc GBP 340,394 2,375,109 1.28Diageo plc GBP 31,284 1,342,283 0.72Prudential plc GBP 128,455 2,798,637 1.51Rio Tinto plc GBP 18,270 1,130,731 0.61Taylor Wimpey plc GBP 489,898 978,742 0.53
8,625,502 4.65
United States of AmericaAlexion Pharmaceuticals, Inc. USD 4,937 629,517 0.34Alphabet, Inc. ‘A’ USD 4,854 5,222,710 2.81Analog Devices, Inc. USD 7,190 814,088 0.44Apple, Inc. USD 9,947 1,963,090 1.06Automatic Data Processing, Inc. USD 17,573 2,881,533 1.55Bank of America Corp. USD 57,394 1,662,991 0.90Best Buy Co., Inc. USD 16,396 1,131,570 0.61BlackRock, Inc. USD 3,133 1,463,816 0.79Bristol-Myers Squibb Co. USD 31,326 1,416,875 0.76Chevron Corp. USD 28,021 3,474,184 1.87
21
JPMorgan Investment Funds - Global Dividend Fund
Schedule of Investments
As at 30 June 2019
Investments Currency
Quantity/Nominal
Value
MarketValue
USD
%of
NetAssets Investments Currency
Quantity/Nominal
Value
MarketValue
USD
%of
NetAssets

Citigroup, Inc. USD 52,453 3,643,123 1.96Coca-Cola Co. (The) USD 85,958 4,397,181 2.37Comcast Corp. ‘A’ USD 71,841 3,018,400 1.63Diamondback Energy, Inc. USD 6,576 715,370 0.39DuPont de Nemours, Inc. USD 15,217 1,127,275 0.61Eli Lilly & Co. USD 15,325 1,697,857 0.91EOG Resources, Inc. USD 11,391 1,045,124 0.56Home Depot, Inc. (The) USD 18,073 3,776,082 2.03Honeywell International, Inc. USD 6,207 1,082,439 0.58Intercontinental Exchange, Inc. USD 22,683 1,938,943 1.04Johnson & Johnson USD 3,866 538,998 0.29Marathon Petroleum Corp. USD 34,520 1,891,006 1.02Merck & Co., Inc. USD 28,290 2,375,228 1.28Microsoft Corp. USD 52,338 6,987,646 3.76Morgan Stanley USD 71,093 3,148,353 1.70NextEra Energy, Inc. USD 17,768 3,642,440 1.96Norfolk Southern Corp. USD 10,862 2,132,917 1.15Pfizer, Inc. USD 79,883 3,481,301 1.88Philip Morris International, Inc. USD 25,142 1,960,196 1.06Prologis, Inc., REIT USD 9,139 728,881 0.39Regeneron Pharmaceuticals, Inc. USD 1,775 556,436 0.30salesforce.com, Inc. USD 9,322 1,399,185 0.75Stanley Black & Decker, Inc. USD 8,538 1,219,653 0.66Texas Instruments, Inc. USD 42,026 4,871,654 2.62United Parcel Service, Inc. ‘B’ USD 19,820 2,039,280 1.10UnitedHealth Group, Inc. USD 16,205 3,873,562 2.09Ventas, Inc., REIT USD 22,766 1,570,399 0.85Walt Disney Co. (The) USD 21,332 2,961,095 1.59
88,480,398 47.66
Total Equities 182,196,060 98.14
Total Transferable securities and money market instrumentsadmitted to an official exchange listing
182,196,060 98.14
Units of authorised UCITS or other collective investment undertakings
Collective Investment Schemes - UCITS
LuxembourgJPMorgan USD Liquidity LVNAV Fund -JPM USD Liquidity LVNAV X (dist.)† USD 2,340,060 2,340,060 1.26
2,340,060 1.26
Total Collective Investment Schemes - UCITS 2,340,060 1.26
Total Units of authorised UCITS or other collective investmentundertakings
2,340,060 1.26
Total Investments 184,536,120 99.40
Cash 107,841 0.06
Other Assets/(Liabilities) 1,013,623 0.54
Total Net Assets 185,657,584 100.00
† Related Party Fund.
Geographic Allocation of Portfolio as at 30 June 2019 % of Net Assets
United States of America 47.66France 7.82United Kingdom 4.65Switzerland 4.31Netherlands 3.45Japan 3.29China 2.63Spain 2.58Germany 2.55Ireland 1.95Italy 1.63Taiwan 1.36Canada 1.30Austria 1.29Luxembourg 1.26Mexico 1.22Sweden 1.10Norway 1.09South Korea 1.07Bermuda 0.97Hong Kong 0.91Denmark 0.83South Africa 0.81India 0.78Supranational 0.61Singapore 0.60Indonesia 0.59Russia 0.55Australia 0.51Jersey 0.03Total Investments 99.40Cash and Other Assets/(Liabilities) 0.60
Total 100.00
Geographic Allocation of Portfolio as at 31 December 2018 % of Net Assets
United States of America 44.15United Kingdom 9.13France 7.40Switzerland 4.96Japan 3.49Spain 2.94Netherlands 2.73Ireland 2.49Germany 2.33Jersey 1.85Canada 1.58China 1.52Finland 1.43Denmark 1.27Luxembourg 1.08Singapore 1.07Italy 0.99South Korea 0.98Hong Kong 0.97Norway 0.93Austria 0.87South Africa 0.73Sweden 0.68Brazil 0.66Bermuda 0.65India 0.65Australia 0.56Indonesia 0.55Supranational 0.45Mexico 0.45Russia 0.41Total Investments 99.95Cash and Other Assets/(Liabilities) 0.05
Total 100.00
22
JPMorgan Investment Funds - Global Dividend Fund
Schedule of Investments (continued)
As at 30 June 2019
Investments Currency
Quantity/Nominal
Value
MarketValue
USD
%of
NetAssets Investments Currency
Quantity/Nominal
Value
MarketValue
USD
%of
NetAssets

JPMorgan Investment Funds - Global Dividend Fund
Schedule of Investments (continued)
As at 30 June 2019
Forward Currency Exchange Contracts (continued)
CurrencyPurchased
AmountPurchased Currency Sold Amount Sold
MaturityDate Counterparty
UnrealisedGain/(Loss)
USD
%of
NetAssets
AUD 4,436,745 USD 3,051,442 01/07/2019 BNP Paribas 59,692 0.03AUD 586,198 USD 404,899 01/07/2019 RBC 6,154 -AUD 3,751,668 USD 2,629,647 08/07/2019 HSBC 1,657 -AUD 5,022,943 USD 3,510,675 29/07/2019 BNP Paribas 14,931 0.01CAD 1,921,391 USD 1,446,842 02/07/2019 Merrill Lynch 20,305 0.01CAD 3,501,393 USD 2,602,441 02/07/2019 Standard Chartered 71,174 0.04CAD 5,422,784 USD 4,123,892 29/07/2019 HSBC 19,570 0.01CHF 911,468 USD 904,964 01/07/2019 HSBC 28,734 0.02CHF 963,738 USD 969,337 01/07/2019 State Street 17,907 0.01DKK 2,572,718 USD 391,612 01/07/2019 BNP Paribas 754 -DKK 4,957,730 USD 756,431 08/07/2019 HSBC 76 -EUR 410,770 USD 460,238 01/07/2019 Barclays 7,345 0.01EUR 16,547,389 USD 18,806,462 01/07/2019 BNP Paribas 29,595 0.02EUR 982,922 USD 1,111,522 01/07/2019 State Street 7,348 0.01EUR 2,433,790 USD 2,736,050 08/07/2019 Barclays 35,742 0.02EUR 1,244,147 USD 1,408,161 08/07/2019 BNP Paribas 8,772 0.01EUR 62,970 USD 70,604 08/07/2019 Citibank 1,112 -EUR 749,213 USD 843,746 08/07/2019 Goldman Sachs 9,516 0.01EUR 82,432,334 USD 92,167,098 08/07/2019 HSBC 1,713,330 0.92EUR 411,230 USD 466,409 29/07/2019 BNP Paribas 2,774 -EUR 859,534 USD 975,366 08/08/2019 RBC 6,100 -GBP 414,392 USD 524,697 01/07/2019 HSBC 2,119 -GBP 1,061,401 USD 1,348,347 01/07/2019 State Street 1,012 -GBP 4,666,784 USD 5,916,355 08/07/2019 Citibank 18,361 0.01GBP 611,868 USD 777,174 29/07/2019 Goldman Sachs 1,777 -HKD 5,556,201 USD 708,169 02/07/2019 Toronto-Dominion Bank 3,451 -HKD 41,667,622 USD 5,336,136 08/07/2019 HSBC 730 -HKD 5,556,201 USD 711,344 29/07/2019 Barclays 359 -INR 93,952,778 USD 1,359,369 08/07/2019 Standard Chartered 1,034 -JPY 947,169,350 USD 8,626,857 01/07/2019 BNP Paribas 163,578 0.09MXN 35,440,455 USD 1,842,983 08/07/2019 Barclays 4,517 -RUB 35,194,819 USD 557,357 08/07/2019 Standard Chartered 1,180 -USD 4,046,720 CAD 5,292,196 08/08/2019 HSBC 2,301 -USD 2,143,422 CHF 2,084,111 29/07/2019 BNP Paribas 2,846 -USD 3,627,526 CHF 3,525,417 08/08/2019 HSBC 3,196 -USD 96,219,039 EUR 84,419,950 08/07/2019 Barclays 74,958 0.04USD 1,312,910 EUR 1,149,039 08/08/2019 Barclays 869 -USD 7,955,279 JPY 854,437,451 01/07/2019 Citibank 25,465 0.02USD 9,262,364 JPY 994,411,055 08/08/2019 Merrill Lynch 6,548 -USD 1,141,990 KRW 1,317,696,785 08/08/2019 J.P. Morgan 2,612 -USD 885,278 NOK 7,528,216 29/07/2019 BNP Paribas 2,559 -USD 857,322 NOK 7,292,197 08/08/2019 HSBC 2,030 -USD 863,768 SEK 7,988,859 29/07/2019 BNP Paribas 1,420 -USD 668,069 SEK 6,180,188 08/08/2019 HSBC 461 -USD 1,062,754 SGD 1,436,915 08/08/2019 HSBC 206 -USD 1,490,676 TWD 46,062,479 08/08/2019 J.P. Morgan 157 -ZAR 11,310,968 USD 796,730 08/07/2019 Citibank 3,341 -
Total Unrealised Gain on Forward Currency Exchange Contracts 2,389,675 1.29
CAD 5,292,196 USD 4,044,038 08/07/2019 HSBC (2,414) -CHF 2,084,111 USD 2,137,795 01/07/2019 BNP Paribas (2,851) -CHF 3,525,417 USD 3,617,133 08/07/2019 HSBC (3,663) -EUR 1,149,039 USD 1,309,637 08/07/2019 Barclays (1,020) -EUR 84,419,950 USD 96,459,527 08/08/2019 Barclays (63,860) (0.04)GBP 1,697,973 USD 2,169,529 01/07/2019 Citibank (10,896) (0.01)GBP 364,520 USD 463,817 01/07/2019 Standard Chartered (402) -GBP 575,140 USD 735,200 01/07/2019 State Street (4,024) -JPY 994,411,055 USD 9,240,965 08/07/2019 Merrill Lynch (7,490) -JPY 854,437,451 USD 7,972,278 29/07/2019 Citibank (25,253) (0.01)KRW 1,317,696,785 USD 1,141,041 08/07/2019 Merrill Lynch (2,513) -NOK 7,528,216 USD 884,431 01/07/2019 BNP Paribas (2,541) -NOK 7,292,197 USD 856,489 08/07/2019 HSBC (2,073) -SEK 7,988,859 USD 861,959 01/07/2019 BNP Paribas (1,437) -SEK 6,180,188 USD 666,540 08/07/2019 HSBC (537) -SGD 1,436,915 USD 1,062,225 08/07/2019 HSBC (212) -TWD 46,062,479 USD 1,488,508 08/07/2019 Merrill Lynch (576) -USD 3,507,320 AUD 5,022,943 01/07/2019 BNP Paribas (14,868) (0.01)USD 2,593,408 AUD 3,751,668 08/07/2019 BNP Paribas (37,896) (0.02)USD 2,632,326 AUD 3,751,668 08/08/2019 HSBC (1,787) -USD 4,121,283 CAD 5,422,784 02/07/2019 HSBC (19,479) (0.01)USD 3,426,183 CAD 4,640,725 08/07/2019 HSBC (117,916) (0.06)USD 481,139 CAD 651,470 08/07/2019 Toronto-Dominion Bank (16,386) (0.01)USD 3,936,149 CHF 3,959,317 01/07/2019 Merrill Lynch (119,739) (0.07)USD 3,453,109 CHF 3,457,788 08/07/2019 HSBC (91,043) (0.05)USD 68,158 CHF 67,629 08/07/2019 State Street (1,160) -USD 384,837 DKK 2,572,718 01/07/2019 Citibank (7,529) (0.01)USD 742,270 DKK 4,957,730 08/07/2019 Barclays (14,237) (0.01)USD 392,574 DKK 2,572,718 29/07/2019 BNP Paribas (759) -USD 758,462 DKK 4,957,730 08/08/2019 HSBC (174) -USD 699,612 EUR 626,191 01/07/2019 BNP Paribas (13,187) (0.01)USD 3,619,831 EUR 3,231,420 01/07/2019 Merrill Lynch (58,526) (0.03)
23

JPMorgan Investment Funds - Global Dividend Fund
Schedule of Investments (continued)
As at 30 June 2019
Forward Currency Exchange Contracts (continued)
CurrencyPurchased
AmountPurchased Currency Sold Amount Sold
MaturityDate Counterparty
UnrealisedGain/(Loss)
USD
%of
NetAssets
USD 15,735,272 EUR 14,083,470 01/07/2019 State Street (296,082) (0.16)USD 921,296 EUR 821,687 08/07/2019 Citibank (14,506) (0.01)USD 1,197,085 EUR 1,071,262 08/07/2019 Goldman Sachs (22,953) (0.01)USD 1,362,009 EUR 1,216,903 08/07/2019 HSBC (23,897) (0.01)USD 607,644 EUR 541,691 08/07/2019 RBC (9,276) (0.01)USD 18,177,010 EUR 15,947,935 29/07/2019 BNP Paribas (18,413) (0.01)USD 854,776 EUR 749,654 08/08/2019 BNP Paribas (1,223) -USD 4,432,749 GBP 3,501,557 01/07/2019 Citibank (18,781) (0.01)USD 776,094 GBP 611,868 01/07/2019 Goldman Sachs (1,774) -USD 5,881,716 GBP 4,666,784 08/07/2019 Toronto-Dominion Bank (53,001) (0.03)USD 5,925,053 GBP 4,666,784 08/08/2019 Citibank (18,800) (0.01)USD 711,382 HKD 5,556,201 02/07/2019 Barclays (238) -USD 5,314,616 HKD 41,667,622 08/07/2019 HSBC (22,249) (0.01)USD 5,336,730 HKD 41,667,622 08/08/2019 HSBC (776) -USD 1,340,325 INR 93,952,778 08/07/2019 J.P. Morgan (20,077) (0.01)USD 1,353,835 INR 93,952,778 08/08/2019 Standard Chartered (660) -USD 855,052 JPY 92,731,899 01/07/2019 ANZ (5,569) -USD 9,168,518 JPY 994,411,055 08/07/2019 BNP Paribas (64,957) (0.04)USD 1,107,587 KRW 1,317,696,785 08/07/2019 HSBC (30,941) (0.02)USD 191,055 MXN 3,779,514 08/07/2019 BNP Paribas (5,969) -USD 1,604,572 MXN 31,660,942 08/07/2019 HSBC (45,902) (0.03)USD 1,833,684 MXN 35,440,455 08/08/2019 Barclays (4,119) -USD 860,379 NOK 7,528,216 01/07/2019 Merrill Lynch (21,511) (0.01)USD 831,667 NOK 7,292,197 08/07/2019 HSBC (22,749) (0.01)USD 533,908 RUB 35,194,819 08/07/2019 Goldman Sachs (24,629) (0.01)USD 554,905 RUB 35,194,819 08/08/2019 Standard Chartered (1,063) -USD 381,486 SEK 3,600,662 01/07/2019 Goldman Sachs (6,360) -USD 456,028 SEK 4,388,197 01/07/2019 Merrill Lynch (16,648) (0.01)USD 648,918 SEK 6,180,188 08/07/2019 HSBC (17,085) (0.01)USD 1,042,474 SGD 1,436,915 08/07/2019 HSBC (19,539) (0.01)USD 1,457,489 TWD 46,062,479 08/07/2019 BNP Paribas (30,444) (0.02)USD 764,682 ZAR 11,310,968 08/07/2019 Merrill Lynch (35,390) (0.02)USD 793,690 ZAR 11,310,968 08/08/2019 Citibank (3,197) -
Total Unrealised Loss on Forward Currency Exchange Contracts (1,525,226) (0.82)
Net Unrealised Gain on Forward Currency Exchange Contracts 864,449 0.47
24

Transferable securities and money market instruments admitted to an official exchangelisting
Bonds
CanadaPrecision Drilling Corp. 6.5%15/12/2021 USD 719,145 719,228 0.01
719,228 0.01
FranceAltice France SA, 144A 6.25%15/05/2024 USD 3,037,000 3,132,939 0.05Altice France SA, 144A 7.375%01/05/2026 USD 15,315,000 15,669,313 0.25
18,802,252 0.30
ItalyTelecom Italia SpA, 144A 5.303%30/05/2024 USD 4,820,000 5,007,088 0.08Wind Tre SpA, 144A 5% 20/01/2026 USD 13,420,000 12,965,599 0.20
17,972,687 0.28
LuxembourgAltice Financing SA, 144A 6.625%15/02/2023 USD 7,980,000 8,175,231 0.13Altice Financing SA, 144A 7.5%15/05/2026 USD 13,840,000 13,940,202 0.22Altice Luxembourg SA, 144A 7.75%15/05/2022 USD 7,457,000 7,580,712 0.12Altice Luxembourg SA, 144A 10.5%15/05/2027 USD 17,500,000 17,923,412 0.28Intelsat Jackson Holdings SA 5.5%01/08/2023 USD 18,081,000 16,498,912 0.26Telecom Italia Capital SA 6.375%15/11/2033 USD 7,460,000 7,753,141 0.12Telecom Italia Capital SA 6%30/09/2034 USD 5,894,000 5,970,563 0.09
77,842,173 1.22
SupranationalStarfruit Finco BV, 144A 8%01/10/2026 USD 11,160,000 11,467,346 0.18
11,467,346 0.18
United KingdomInternational Game Technology plc,144A 6.25% 15/01/2027 USD 6,340,000 6,935,865 0.11
6,935,865 0.11
United States of AmericaAES Corp. 5.5% 15/04/2025 USD 8,179,000 8,541,043 0.14AES Corp. 6% 15/05/2026 USD 1,630,000 1,732,576 0.03Ally Financial, Inc. 4.125% 13/02/2022 USD 17,563,000 17,988,112 0.28Ally Financial, Inc. 4.625% 19/05/2022 USD 10,890,000 11,347,053 0.18Ally Financial, Inc. 3.875% 21/05/2024 USD 2,405,000 2,469,418 0.04Ally Financial, Inc. 4.625% 30/03/2025 USD 7,925,000 8,393,526 0.13Ally Financial, Inc. 5.75% 20/11/2025 USD 6,965,000 7,719,275 0.12AMC Entertainment Holdings, Inc.5.75% 15/06/2025 USD 10,525,000 9,748,465 0.15AMC Entertainment Holdings, Inc.5.875% 15/11/2026 USD 401,000 361,866 0.01American Axle & Manufacturing, Inc.6.625% 15/10/2022 USD 1,223,000 1,247,539 0.02American Axle & Manufacturing, Inc.6.25% 01/04/2025 USD 20,785,000 20,690,532 0.32American Axle & Manufacturing, Inc.6.25% 15/03/2026 USD 9,465,000 9,367,889 0.15American Axle & Manufacturing, Inc.6.5% 01/04/2027 USD 9,110,000 9,087,635 0.14AmeriGas Partners LP 5.5%20/05/2025 USD 9,480,000 9,976,515 0.16AmeriGas Partners LP 5.875%20/08/2026 USD 4,360,000 4,629,622 0.07Andeavor Logistics LP 6.25%15/10/2022 USD 4,037,000 4,137,925 0.07Andeavor Logistics LP 6.375%01/05/2024 USD 7,180,000 7,521,050 0.12Andeavor Logistics LP 5.25%15/01/2025 USD 2,990,000 3,160,953 0.05Anixter, Inc. 5.5% 01/03/2023 USD 4,035,000 4,272,056 0.07Antero Resources Corp. 5.625%01/06/2023 USD 6,880,000 6,648,522 0.10Antero Resources Corp. 5.125%01/12/2022 USD 14,927,000 14,314,321 0.23Archrock Partners LP 6% 01/10/2022 USD 3,997,000 4,064,909 0.06Arconic, Inc. 5.87% 23/02/2022 USD 1,810,000 1,925,179 0.03
Arconic, Inc. 5.9% 01/02/2027 USD 10,890,000 11,839,172 0.19Ashland LLC 4.75% 15/08/2022 USD 18,520,000 19,431,832 0.30Ashtead Capital, Inc., 144A 5.625%01/10/2024 USD 4,101,000 4,244,535 0.07Boyd Gaming Corp. 6.875%15/05/2023 USD 6,375,000 6,603,767 0.10Brazos Valley Longhorn LLC 6.875%01/02/2025 USD 15,623,000 14,900,436 0.23CenturyLink, Inc. 7.5% 01/04/2024 USD 6,615,000 7,311,923 0.11CenturyLink, Inc. 6.75% 01/12/2023 USD 18,320,000 19,767,188 0.31Chemours Co. (The) 6.625%15/05/2023 USD 16,601,000 17,191,332 0.27Chesapeake Energy Corp. 8%15/01/2025 USD 17,345,000 16,133,712 0.25Chesapeake Energy Corp. 8%15/06/2027 USD 3,180,000 2,817,083 0.04Cinemark USA, Inc. 4.875%01/06/2023 USD 12,390,000 12,603,666 0.20Clear Channel Worldwide Holdings, Inc.6.5% 15/11/2022 USD 86,275,000 88,319,286 1.38CoreCivic, Inc., REIT 5% 15/10/2022 USD 2,019,000 2,013,953 0.03CoreCivic, Inc., REIT 4.625%01/05/2023 USD 13,307,000 13,007,593 0.20Crestwood Midstream Partners LP6.25% 01/04/2023 USD 14,570,000 14,897,825 0.23Dana, Inc. 6% 15/09/2023 USD 13,687,000 14,049,021 0.22Dana, Inc. 5.5% 15/12/2024 USD 2,975,000 3,047,962 0.05DaVita, Inc. 5% 01/05/2025 USD 23,770,000 23,552,623 0.37Encompass Health Corp. 5.75%01/11/2024 USD 6,905,000 7,041,650 0.11Encompass Health Corp. 5.75%15/09/2025 USD 12,952,000 13,518,520 0.21EnLink Midstream LLC 5.375%01/06/2029 USD 2,932,000 2,996,211 0.05EnLink Midstream Partners LP 4.4%01/04/2024 USD 10,564,000 10,656,963 0.17EnLink Midstream Partners LP 4.85%15/07/2026 USD 4,515,000 4,548,863 0.07Ford Motor Credit Co. LLC 4.687%09/06/2025 USD 28,780,000 29,681,102 0.46Freeport-McMoRan, Inc. 3.875%15/03/2023 USD 21,520,000 21,536,032 0.34GEO Group, Inc. (The), REIT 5.875%15/01/2022 USD 14,745,000 14,486,962 0.23GEO Group, Inc. (The), REIT 5.125%01/04/2023 USD 8,575,000 7,822,286 0.12GEO Group, Inc. (The), REIT 5.875%15/10/2024 USD 10,893,000 9,694,770 0.15HCA, Inc. 7.5% 15/02/2022 USD 11,983,000 13,236,961 0.21HCA, Inc. 5.375% 01/02/2025 USD 76,894,000 83,105,882 1.30HCA, Inc. 5.875% 15/02/2026 USD 73,470,000 81,243,861 1.27HCA, Inc. 5.25% 15/06/2026 USD 4,650,000 5,150,177 0.08HCA, Inc. 5.375% 01/09/2026 USD 14,226,000 15,333,636 0.24HCA, Inc. 5.625% 01/09/2028 USD 14,240,000 15,375,426 0.24HCA, Inc. 5.875% 01/02/2029 USD 314,000 343,959 0.01Hertz Corp. (The) 6.25% 15/10/2022 USD 4,147,000 4,196,100 0.07Hilton Domestic Operating Co., Inc.4.25% 01/09/2024 USD 1,360,000 1,378,700 0.02Hilton Grand Vacations Borrower LLC6.125% 01/12/2024 USD 2,905,000 3,093,825 0.05Hilton Worldwide Finance LLC 4.625%01/04/2025 USD 6,871,000 7,031,060 0.11Hilton Worldwide Finance LLC 4.875%01/04/2027 USD 1,374,000 1,422,090 0.02Huntsman International LLC 5.125%15/11/2022 USD 11,532,000 12,210,889 0.19Iron Mountain, Inc., REIT 6%15/08/2023 USD 11,340,000 11,671,185 0.18Iron Mountain, Inc., REIT 5.75%15/08/2024 USD 2,530,000 2,566,065 0.04JC Penney Corp., Inc. 6.375%15/10/2036 USD 12,012,000 3,243,240 0.05L Brands, Inc. 6.75% 01/07/2036 USD 11,190,000 9,793,544 0.15Laredo Petroleum, Inc. 5.625%15/01/2022 USD 7,059,000 6,600,165 0.10Level 3 Financing, Inc. 5.625%01/02/2023 USD 95,000 96,031 0.00Level 3 Financing, Inc. 5.125%01/05/2023 USD 1,955,000 1,973,084 0.03Level 3 Financing, Inc. 5.375%15/01/2024 USD 6,500,000 6,647,452 0.10Level 3 Financing, Inc. 5.375%01/05/2025 USD 15,765,000 16,287,767 0.25Level 3 Parent LLC 5.75% 01/12/2022 USD 11,245,000 11,345,474 0.18MagnaChip Semiconductor Corp.6.625% 15/07/2021 USD 9,160,000 9,028,875 0.14Marriott Ownership Resorts, Inc. 6.5%15/09/2026 USD 12,010,000 12,865,712 0.20
25
JPMorgan Investment Funds - Global High Yield Bond Fund
Schedule of Investments
As at 30 June 2019
Investments Currency
Quantity/Nominal
Value
MarketValue
USD
%of
NetAssets Investments Currency
Quantity/Nominal
Value
MarketValue
USD
%of
NetAssets
MGM Growth Properties OperatingPartnership LP, REIT 5.625%01/05/2024 USD 4,120,000 4,446,695 0.07MGM Growth Properties OperatingPartnership LP, REIT 4.5% 01/09/2026 USD 3,005,000 3,091,935 0.05MGM Resorts International 6%15/03/2023 USD 50,141,000 54,426,802 0.85MGM Resorts International 5.75%15/06/2025 USD 30,327,000 32,928,147 0.52MGM Resorts International 4.625%01/09/2026 USD 3,315,000 3,351,399 0.05MGM Resorts International 5.5%15/04/2027 USD 20,270,000 21,283,703 0.33NRG Energy, Inc. 7.25% 15/05/2026 USD 4,619,000 5,081,847 0.08NRG Energy, Inc. 6.625% 15/01/2027 USD 6,855,000 7,458,411 0.12Oasis Petroleum, Inc. 6.875%15/01/2023 USD 17,470,000 17,468,690 0.27Oasis Petroleum, Inc. 6.875%15/03/2022 USD 4,776,000 4,766,663 0.08Range Resources Corp. 4.875%15/05/2025 USD 15,265,000 13,410,913 0.21Reynolds Group Issuer, Inc. 5.75%15/10/2020 USD 33,657,111 33,746,975 0.53RHP Hotel Properties LP, REIT 5%15/04/2021 USD 7,132,000 7,172,474 0.11RHP Hotel Properties LP, REIT 5%15/04/2023 USD 10,020,000 10,195,350 0.16Scotts Miracle-Gro Co. (The) 6%15/10/2023 USD 17,762,000 18,501,787 0.29Scotts Miracle-Gro Co. (The) 5.25%15/12/2026 USD 10,425,000 10,632,457 0.17Service Corp. International 7.5%01/04/2027 USD 23,516,000 28,219,200 0.44Service Corp. International 5.125%01/06/2029 USD 7,075,000 7,451,885 0.12SM Energy Co. 6.125% 15/11/2022 USD 2,620,000 2,608,040 0.04SM Energy Co. 5.625% 01/06/2025 USD 5,720,000 5,255,250 0.08SM Energy Co. 6.625% 15/01/2027 USD 6,186,000 5,735,566 0.09Southwestern Energy Co. 6.2%23/01/2025 USD 12,502,000 11,447,206 0.18Southwestern Energy Co. 7.5%01/04/2026 USD 5,415,000 5,171,677 0.08Southwestern Energy Co. 7.75%01/10/2027 USD 5,415,000 5,182,345 0.08Spectrum Brands, Inc. 6.625%15/11/2022 USD 3,134,000 3,210,689 0.05Spectrum Brands, Inc. 6.125%15/12/2024 USD 1,000,000 1,030,000 0.02Spectrum Brands, Inc. 5.75%15/07/2025 USD 15,478,000 16,109,657 0.25Springleaf Finance Corp. 6.625%15/01/2028 USD 4,290,000 4,519,107 0.07Sprint Capital Corp. 8.75% 15/03/2032 USD 62,385,000 72,451,444 1.13Sprint Corp. 7.625% 15/02/2025 USD 68,937,000 73,093,901 1.14Sprint Corp. 7.625% 01/03/2026 USD 3,460,000 3,696,387 0.06Sprint Corp. 7.875% 15/09/2023 USD 59,310,000 64,418,963 1.01Sprint Corp. 7.125% 15/06/2024 USD 4,795,000 5,085,050 0.08Summit Midstream Holdings LLC 5.75%15/04/2025 USD 5,731,000 5,059,613 0.08Targa Resources Partners LP 6.75%15/03/2024 USD 28,472,000 29,673,376 0.46Targa Resources Partners LP 5.875%15/04/2026 USD 8,400,000 8,941,506 0.14TEGNA, Inc. 6.375% 15/10/2023 USD 8,529,000 8,832,462 0.14Tempur Sealy International, Inc.5.625% 15/10/2023 USD 11,940,000 12,366,736 0.19Tempur Sealy International, Inc. 5.5%15/06/2026 USD 12,584,000 13,064,709 0.20Tenet Healthcare Corp. 4.5%01/04/2021 USD 6,985,000 7,117,261 0.11Tenet Healthcare Corp. 8.125%01/04/2022 USD 14,887,000 15,659,263 0.25Tenet Healthcare Corp. 6.75%15/06/2023 USD 50,691,000 51,288,140 0.80Tenet Healthcare Corp. 4.625%15/07/2024 USD 12,375,000 12,571,886 0.20Tenneco, Inc. 5.375% 15/12/2024 USD 5,820,000 4,931,955 0.08Tenneco, Inc. 5% 15/07/2026 USD 8,294,000 6,614,465 0.10Triumph Group, Inc. 4.875%01/04/2021 USD 8,477,000 8,386,042 0.13Triumph Group, Inc. 7.75% 15/08/2025 USD 7,380,000 7,152,917 0.11United Rentals North America, Inc.4.625% 15/10/2025 USD 8,440,000 8,569,976 0.14United Rentals North America, Inc.5.875% 15/09/2026 USD 7,220,000 7,702,946 0.12United Rentals North America, Inc.6.5% 15/12/2026 USD 18,725,000 20,297,338 0.32United Rentals North America, Inc.5.5% 15/05/2027 USD 15,445,000 16,239,645 0.25
United Rentals North America, Inc.4.875% 15/01/2028 USD 9,445,000 9,633,711 0.15United States Cellular Corp. 6.7%15/12/2033 USD 14,936,000 15,945,076 0.25Vista Outdoor, Inc. 5.875% 01/10/2023 USD 26,401,000 25,740,975 0.40Welbilt, Inc. 9.5% 15/02/2024 USD 9,650,000 10,349,625 0.16Whiting Petroleum Corp. 5.75%15/03/2021 USD 3,175,000 3,199,321 0.05Whiting Petroleum Corp. 6.25%01/04/2023 USD 8,375,000 8,381,993 0.13Whiting Petroleum Corp. 6.625%15/01/2026 USD 6,170,000 5,972,961 0.09WPX Energy, Inc. 6% 15/01/2022 USD 1,982,000 2,075,996 0.03WPX Energy, Inc. 8.25% 01/08/2023 USD 13,565,000 15,471,968 0.24WPX Energy, Inc. 5.75% 01/06/2026 USD 4,778,000 4,980,754 0.08Zayo Group LLC 6% 01/04/2023 USD 13,449,000 13,800,490 0.22Zayo Group LLC 6.375% 15/05/2025 USD 13,116,000 13,413,340 0.21
1,854,390,470 29.00
Total Bonds 1,988,130,021 31.10
Equities
United States of AmericaCaesars Entertainment Corp. USD 921,516 10,721,839 0.17Clear Channel Outdoor Holdings, Inc. USD 935,116 4,324,912 0.07Halcon Resources Corp. USD 1,326,990 237,199 0.00iHeartMedia, Inc. ‘A’ USD 45,010 697,655 0.01VICI Properties, Inc., REIT USD 3,170,864 68,982,146 1.08
84,963,751 1.33
Total Equities 84,963,751 1.33
Total Transferable securities and money market instrumentsadmitted to an official exchange listing
2,073,093,772 32.43
Transferable securities and money market instruments dealt in on another regulatedmarket
Bonds
CanadaBausch Health Cos., Inc., 144A 6.5%15/03/2022 USD 7,245,000 7,514,768 0.12Bausch Health Cos., Inc., 144A 5.875%15/05/2023 USD 8,098,000 8,187,078 0.13Bausch Health Cos., Inc., 144A 7%15/03/2024 USD 14,315,000 15,227,009 0.24Bausch Health Cos., Inc., 144A 6.125%15/04/2025 USD 74,040,000 75,571,517 1.18Bausch Health Cos., Inc., 144A 5.5%01/11/2025 USD 7,560,000 7,877,104 0.12Bausch Health Cos., Inc., 144A 9%15/12/2025 USD 24,490,000 27,308,554 0.43Bausch Health Cos., Inc., 144A 7%15/01/2028 USD 9,110,000 9,420,970 0.15Bombardier, Inc., 144A 7.5%15/03/2025 USD 16,420,000 16,406,454 0.26MEG Energy Corp., 144A 6.375%30/01/2023 USD 5,955,000 5,664,694 0.09MEG Energy Corp., 144A 7%31/03/2024 USD 20,935,000 19,966,756 0.31MEG Energy Corp., 144A 6.5%15/01/2025 USD 16,466,000 16,468,470 0.26NOVA Chemicals Corp., 144A 4.875%01/06/2024 USD 12,290,000 12,704,787 0.20NOVA Chemicals Corp., 144A 5.25%01/06/2027 USD 6,385,000 6,774,166 0.11Precision Drilling Corp., 144A 7.125%15/01/2026 USD 6,590,000 6,375,825 0.10Precision Drilling Corp. 7.75%15/12/2023 USD 8,050,000 8,211,000 0.13Quebecor Media, Inc. 5.75%15/01/2023 USD 20,898,000 22,416,344 0.35Videotron Ltd., 144A 5.375%15/06/2024 USD 9,117,000 9,789,379 0.15Videotron Ltd., 144A 5.125%15/04/2027 USD 9,105,000 9,480,172 0.15
285,365,047 4.48
Cayman IslandsTransocean Guardian Ltd., 144A5.875% 15/01/2024 USD 6,356,070 6,469,113 0.10Transocean Pontus Ltd., 144A 6.125%01/08/2025 USD 2,723,490 2,812,998 0.04Transocean, Inc., 144A 7.25%01/11/2025 USD 7,375,000 7,046,776 0.11
26
JPMorgan Investment Funds - Global High Yield Bond Fund
Schedule of Investments (continued)
As at 30 June 2019
Investments Currency
Quantity/Nominal
Value
MarketValue
USD
%of
NetAssets Investments Currency
Quantity/Nominal
Value
MarketValue
USD
%of
NetAssets

Transocean, Inc., 144A 7.5%15/01/2026 USD 9,385,000 8,989,188 0.14UPCB Finance IV Ltd., 144A 5.375%15/01/2025 USD 21,508,000 22,216,043 0.35
47,534,118 0.74
FranceAltice France SA, 144A 8.125%01/02/2027 USD 8,600,000 9,028,839 0.14
9,028,839 0.14
IrelandJames Hardie International FinanceDAC, 144A 4.75% 15/01/2025 USD 4,670,000 4,728,375 0.07
4,728,375 0.07
JerseyAdient Global Holdings Ltd., 144A4.875% 15/08/2026 USD 21,260,000 16,834,837 0.26Delphi Technologies plc, 144A 5%01/10/2025 USD 24,792,000 21,909,930 0.34
38,744,767 0.60
LuxembourgDana Financing Luxembourg Sarl,144A 6.5% 01/06/2026 USD 14,205,000 14,933,006 0.23INEOS Group Holdings SA, 144A5.625% 01/08/2024 USD 38,330,000 39,153,137 0.61Intelsat Jackson Holdings SA, 144A 8%15/02/2024 USD 14,630,000 15,266,039 0.24Intelsat Jackson Holdings SA, 144A8.5% 15/10/2024 USD 25,595,000 25,400,350 0.40Intelsat Jackson Holdings SA, 144A9.75% 15/07/2025 USD 22,050,000 22,491,000 0.35Mallinckrodt International Finance SA,144A 5.625% 15/10/2023 USD 12,090,000 9,188,219 0.14Mallinckrodt International Finance SA,144A 5.5% 15/04/2025 USD 7,280,000 4,841,200 0.08Nielsen Co. Luxembourg SARL (The),144A 5.5% 01/10/2021 USD 3,893,000 3,914,762 0.06Trinseo Materials Operating SCA, 144A5.375% 01/09/2025 USD 14,675,000 14,175,610 0.22
149,363,323 2.33
NetherlandsAlcoa Nederland Holding BV, 144A6.75% 30/09/2024 USD 13,268,000 13,995,418 0.22Alcoa Nederland Holding BV, 144A 7%30/09/2026 USD 5,160,000 5,527,134 0.09Constellium NV, 144A 6.625%01/03/2025 USD 7,185,000 7,510,876 0.12NXP BV, 144A 4.625% 01/06/2023 USD 15,305,000 16,165,753 0.25Sensata Technologies BV, 144A4.875% 15/10/2023 USD 5,850,000 6,111,349 0.10Sensata Technologies BV, 144A5.625% 01/11/2024 USD 885,000 958,012 0.02Stars Group Holdings BV, 144A 7%15/07/2026 USD 5,501,000 5,837,936 0.09
56,106,478 0.89
SupranationalArdagh Packaging Finance plc, 144A7.25% 15/05/2024 USD 14,975,000 15,840,705 0.25Ardagh Packaging Finance plc, 144A6% 15/02/2025 USD 27,695,000 28,741,733 0.45Endo Dac, 144A 6% 15/07/2023 USD 18,043,000 12,990,960 0.20Panther BF Aggregator 2 LP, 144A6.25% 15/05/2026 USD 4,870,000 5,047,244 0.08Venator Finance Sarl, 144A 5.75%15/07/2025 USD 7,495,000 6,876,663 0.11
69,497,305 1.09
United KingdomInternational Game Technology plc,144A 6.5% 15/02/2025 USD 14,769,000 16,229,728 0.25Sensata Technologies UK Financing Co.plc, 144A 6.25% 15/02/2026 USD 29,009,000 30,841,063 0.48Virgin Media Secured Finance plc,144A 5.25% 15/01/2026 USD 3,640,000 3,723,101 0.06Virgin Media Secured Finance plc,144A 5.5% 15/08/2026 USD 5,220,000 5,420,135 0.08
56,214,027 0.87
United States of AmericaACCO Brands Corp., 144A 5.25%15/12/2024 USD 18,215,000 18,397,150 0.29ACI Worldwide, Inc., 144A 5.75%15/08/2026 USD 9,080,000 9,465,900 0.15Adient US LLC, 144A 7% 15/05/2026 USD 8,075,000 8,301,342 0.13ADT Security Corp. (The) 4.125%15/06/2023 USD 1,080,000 1,082,068 0.02Air Medical Group Holdings, Inc., 144A6.375% 15/05/2023 USD 16,025,000 14,382,437 0.23Albertsons Cos. LLC 5.75% 15/03/2025 USD 9,280,000 9,364,634 0.15Allison Transmission, Inc., 144A 5%01/10/2024 USD 5,580,000 5,709,149 0.09Allison Transmission, Inc., 144A 4.75%01/10/2027 USD 6,581,000 6,553,459 0.10Allison Transmission, Inc., 144A5.875% 01/06/2029 USD 5,100,000 5,375,782 0.08AMC Networks, Inc. 5% 01/04/2024 USD 10,555,000 10,877,297 0.17American Woodmark Corp., 144A4.875% 15/03/2026 USD 14,075,000 13,863,875 0.22Anixter, Inc., 144A 6% 01/12/2025 USD 5,470,000 5,921,275 0.09Antero Midstream Partners LP, 144A5.75% 15/01/2028 USD 155,000 153,256 0.00Antero Midstream Partners LP 5.375%15/09/2024 USD 9,805,000 9,831,081 0.15Aramark Services, Inc., 144A 5%01/02/2028 USD 9,910,000 10,178,016 0.16Ascend Learning LLC, 144A 6.875%01/08/2025 USD 5,510,000 5,606,425 0.09Ascend Learning LLC, 144A 6.875%01/08/2025 USD 7,260,000 7,396,125 0.12Ashtead Capital, Inc., 144A 4.125%15/08/2025 USD 1,525,000 1,544,985 0.02Ashtead Capital, Inc., 144A 4.375%15/08/2027 USD 3,224,000 3,233,801 0.05Avantor, Inc., 144A 6% 01/10/2024 USD 17,835,000 19,030,391 0.30Avis Budget Car Rental LLC, 144A6.375% 01/04/2024 USD 30,223,000 31,583,035 0.48Avis Budget Car Rental LLC, 144A5.25% 15/03/2025 USD 6,700,000 6,733,500 0.10Axalta Coating Systems LLC, 144A4.875% 15/08/2024 USD 9,072,000 9,344,160 0.15Bausch Health Americas, Inc., 144A8.5% 31/01/2027 USD 12,744,000 13,993,231 0.22BCPE Cycle Merger Sub II, Inc., 144A10.625% 15/07/2027 USD 11,025,000 11,300,625 0.18Berry Global Escrow Corp., 144A4.875% 15/07/2026 USD 14,315,000 14,644,531 0.23Berry Global Escrow Corp., 144A5.625% 15/07/2027 USD 5,045,000 5,245,766 0.08Blue Racer Midstream LLC, 144A6.125% 15/11/2022 USD 23,065,000 23,497,815 0.37Blue Racer Midstream LLC, 144A6.625% 15/07/2026 USD 4,980,000 5,017,350 0.08Boyd Gaming Corp. 6% 15/08/2026 USD 7,320,000 7,716,598 0.12Boyne USA, Inc., 144A 7.25%01/05/2025 USD 3,035,000 3,285,388 0.05BWAY Holding Co., 144A 5.5%15/04/2024 USD 15,014,000 14,993,881 0.23BWX Technologies, Inc., 144A 5.375%15/07/2026 USD 4,050,000 4,181,625 0.06Calfrac Holdings LP, 144A 8.5%15/06/2026 USD 7,147,000 5,038,635 0.08Calpine Corp., 144A 5.25% 01/06/2026 USD 4,185,000 4,268,177 0.07Carrizo Oil & Gas, Inc. 6.25%15/04/2023 USD 9,195,000 8,919,150 0.14Carrizo Oil & Gas, Inc. 8.25%15/07/2025 USD 4,745,000 4,661,963 0.07CCO Holdings LLC, 144A 5.875%01/04/2024 USD 66,638,000 69,670,695 1.09CCO Holdings LLC, 144A 5.375%01/05/2025 USD 3,680,000 3,815,461 0.06CCO Holdings LLC, 144A 5.75%15/02/2026 USD 55,836,000 58,769,903 0.92CCO Holdings LLC, 144A 5.5%01/05/2026 USD 21,190,000 22,192,499 0.35CCO Holdings LLC, 144A 5.125%01/05/2027 USD 27,245,000 28,234,538 0.44CCO Holdings LLC, 144A 5%01/02/2028 USD 9,230,000 9,410,447 0.15CDK Global, Inc., 144A 5.25%15/05/2029 USD 4,695,000 4,860,640 0.08CDK Global, Inc. 5.875% 15/06/2026 USD 3,050,000 3,244,072 0.05CDW LLC 5% 01/09/2023 USD 1,450,000 1,484,981 0.02CDW LLC 5% 01/09/2025 USD 1,415,000 1,479,899 0.02Cedar Fair LP, 144A 5.25% 15/07/2029 USD 1,680,000 1,715,784 0.03Central Garden & Pet Co. 6.125%15/11/2023 USD 10,965,000 11,433,260 0.18
27
JPMorgan Investment Funds - Global High Yield Bond Fund
Schedule of Investments (continued)
As at 30 June 2019
Investments Currency
Quantity/Nominal
Value
MarketValue
USD
%of
NetAssets Investments Currency
Quantity/Nominal
Value
MarketValue
USD
%of
NetAssets

Central Garden & Pet Co. 5.125%01/02/2028 USD 14,815,000 14,561,812 0.23Cheniere Corpus Christi Holdings LLC5.875% 31/03/2025 USD 10,020,000 11,158,973 0.17Cheniere Corpus Christi Holdings LLC5.125% 30/06/2027 USD 7,640,000 8,313,008 0.13Cincinnati Bell, Inc., 144A 7%15/07/2024 USD 5,882,000 5,201,894 0.08Cincinnati Bell, Inc., 144A 8%15/10/2025 USD 2,135,000 1,836,100 0.03Citigroup, Inc., FRN 5.8% Perpetual USD 8,820,000 8,867,187 0.14Citigroup, Inc., FRN 5.95% Perpetual USD 1,120,000 1,171,621 0.02Citigroup, Inc., FRN 5.875% Perpetual USD 7,550,000 7,646,187 0.12Clean Harbors, Inc., 144A 4.875%15/07/2027 USD 2,930,000 2,970,756 0.05Clear Channel Worldwide Holdings,Inc., 144A 9.25% 15/02/2024 USD 30,935,000 33,525,806 0.52Clear Channel Worldwide Holdings, Inc.6.5% 15/11/2022 USD 9,275,000 9,479,328 0.15Cogent Communications Group, Inc.,144A 5.625% 15/04/2021 USD 17,225,000 17,531,605 0.27Cogent Communications Group, Inc.,144A 5.375% 01/03/2022 USD 15,935,000 16,492,725 0.26Colfax Corp., 144A 6% 15/02/2024 USD 850,000 898,348 0.01Colfax Corp., 144A 6.375% 15/02/2026 USD 2,000,000 2,149,490 0.03CommScope Technologies LLC, 144A6% 15/06/2025 USD 31,534,000 29,588,983 0.46CommScope, Inc., 144A 6%01/03/2026 USD 11,400,000 11,685,000 0.18CommScope, Inc., 144A 8.25%01/03/2027 USD 13,065,000 13,254,443 0.21Community Health Systems, Inc., 144A8.625% 15/01/2024 USD 7,580,000 7,620,174 0.12Constellation Merger Sub, Inc., 144A8.5% 15/09/2025 USD 12,620,000 11,673,500 0.18Cooper-Standard Automotive, Inc.,144A 5.625% 15/11/2026 USD 21,817,000 19,362,588 0.30Coty, Inc., 144A 6.5% 15/04/2026 USD 9,835,000 9,586,863 0.15Covey Park Energy LLC, 144A 7.5%15/05/2025 USD 11,480,000 8,323,000 0.13Crestwood Midstream Partners LP,144A 5.625% 01/05/2027 USD 6,435,000 6,386,738 0.10CSC Holdings LLC, 144A 6.625%15/10/2025 USD 8,555,000 9,142,087 0.14CSC Holdings LLC, 144A 10.875%15/10/2025 USD 11,981,000 13,732,622 0.21CSC Holdings LLC, 144A 6.5%01/02/2029 USD 5,500,000 5,983,368 0.09DCP Midstream Operating LP 5.375%15/07/2025 USD 3,614,000 3,807,909 0.06Dell International LLC, 144A 5.875%15/06/2021 USD 4,395,000 4,461,268 0.07Dell International LLC, 144A 5.45%15/06/2023 USD 10,000,000 10,767,300 0.17Dell International LLC, 144A 6.02%15/06/2026 USD 16,945,000 18,617,133 0.29Denbury Resources, Inc., 144A 9.25%31/03/2022 USD 11,635,000 11,043,011 0.17DISH DBS Corp. 5% 15/03/2023 USD 74,758,000 71,989,711 1.13DISH DBS Corp. 7.75% 01/07/2026 USD 14,255,000 13,909,530 0.22DISH DBS Corp. 5.875% 15/11/2024 USD 68,509,000 64,687,568 1.01Energizer Holdings, Inc., 144A 5.5%15/06/2025 USD 17,020,000 17,105,100 0.27Energizer Holdings, Inc., 144A 7.75%15/01/2027 USD 14,175,000 15,360,951 0.24EnPro Industries, Inc. 5.75%15/10/2026 USD 7,790,000 7,906,850 0.12Entegris, Inc., 144A 4.625%10/02/2026 USD 15,067,000 15,104,668 0.24Entercom Media Corp., 144A 7.25%01/11/2024 USD 9,146,000 9,603,300 0.15Entercom Media Corp., 144A 6.5%01/05/2027 USD 4,860,000 5,039,699 0.08Envision Healthcare Corp., 144A 8.75%15/10/2026 USD 24,785,000 16,853,800 0.26EP Energy LLC, 144A 9.375%01/05/2024 USD 21,142,000 5,285,500 0.08EP Energy LLC, 144A 8% 29/11/2024 USD 7,305,000 4,935,660 0.08EP Energy LLC, 144A 8% 15/02/2025 USD 4,510,000 999,461 0.02EP Energy LLC, 144A 7.75%15/05/2026 USD 34,245,000 30,478,050 0.48Equinix, Inc., REIT 5.375% 01/04/2023 USD 975,000 995,685 0.02Equinix, Inc., REIT 5.75% 01/01/2025 USD 3,495,000 3,641,842 0.06Equinix, Inc., REIT 5.875% 15/01/2026 USD 22,435,000 23,915,149 0.37ESH Hospitality, Inc., REIT, 144A 5.25%01/05/2025 USD 15,298,000 15,700,031 0.25Fair Isaac Corp., 144A 5.25%15/05/2026 USD 3,560,000 3,738,000 0.06First Data Corp., 144A 5.375%15/08/2023 USD 37,901,000 38,588,903 0.60
First Data Corp., 144A 5.75%15/01/2024 USD 81,900,000 84,224,731 1.32Frontier Communications Corp., 144A8.5% 01/04/2026 USD 9,485,000 9,232,509 0.14Frontier Communications Corp., 144A8% 01/04/2027 USD 9,925,000 10,321,007 0.16Frontier Communications Corp.6.875% 15/01/2025 USD 11,385,000 6,364,841 0.10Frontier Communications Corp. 11%15/09/2025 USD 26,965,000 16,656,685 0.26Gartner, Inc., 144A 5.125% 01/04/2025 USD 6,165,000 6,319,125 0.10Gates Global LLC, 144A 6% 15/07/2022 USD 20,073,000 20,123,182 0.31GCI LLC, 144A 6.625% 15/06/2024 USD 5,880,000 6,115,200 0.10GCI LLC 6.75% 01/06/2021 USD 15,472,000 15,499,076 0.24GCI LLC 6.875% 15/04/2025 USD 3,965,000 4,123,600 0.06GCP Applied Technologies, Inc., 144A5.5% 15/04/2026 USD 15,055,000 15,280,825 0.24GLP Capital LP, REIT 5.25%01/06/2025 USD 6,913,000 7,419,965 0.12GLP Capital LP, REIT 5.75%01/06/2028 USD 9,680,000 10,726,408 0.17Gray Television, Inc., 144A 7%15/05/2027 USD 7,030,000 7,625,546 0.12Greif, Inc., 144A 6.5% 01/03/2027 USD 9,675,000 9,989,437 0.16Gulfport Energy Corp. 6% 15/10/2024 USD 3,070,000 2,374,875 0.04Gulfport Energy Corp. 6.375%15/05/2025 USD 2,801,000 2,156,056 0.03Gulfport Energy Corp. 6.375%15/01/2026 USD 8,270,000 6,297,729 0.10Halcon Resources Corp. 6.75%15/02/2025 USD 14,310,000 4,647,101 0.07Hanesbrands, Inc., 144A 4.875%15/05/2026 USD 5,070,000 5,268,136 0.08Herc Holdings, Inc., 144A 5.5%15/07/2027 USD 13,695,000 13,754,094 0.22Herc Rentals, Inc. ‘A’, 144A 7.75%01/06/2024 USD 16,378,000 17,357,666 0.27Herc Rentals, Inc., 144A 7.5%01/06/2022 USD 5,067,000 5,263,093 0.08Hertz Corp. (The), 144A 7.625%01/06/2022 USD 19,150,000 19,877,891 0.31Hertz Corp. (The), 144A 5.5%15/10/2024 USD 36,070,000 34,340,804 0.54Hess Infrastructure Partners LP, 144A5.625% 15/02/2026 USD 6,070,000 6,244,512 0.10Hexion, Inc., 144A 7.875% 15/07/2027 USD 2,720,000 2,740,400 0.04High Ridge Brands Co., 144A 8.875%15/03/2025 USD 10,865,000 1,032,175 0.02Hillman Group, Inc. (The), 144A 6.375%15/07/2022 USD 19,027,000 16,838,895 0.26Hill-Rom Holdings, Inc., 144A 5.75%01/09/2023 USD 13,927,000 14,394,251 0.23Hill-Rom Holdings, Inc., 144A 5%15/02/2025 USD 3,030,000 3,136,050 0.05Hilton Domestic Operating Co., Inc.5.125% 01/05/2026 USD 16,190,000 16,928,588 0.26Hologic, Inc., 144A 4.375% 15/10/2025 USD 8,445,000 8,563,103 0.13Hughes Satellite Systems Corp. 5.25%01/08/2026 USD 4,965,000 5,113,255 0.08Hughes Satellite Systems Corp. 6.625%01/08/2026 USD 2,535,000 2,656,972 0.04iHeartCommunications, Inc. 6.375%01/05/2026 USD 2,166,890 2,298,897 0.04iHeartCommunications, Inc. 8.375%01/05/2027 USD 3,927,486 4,142,634 0.06Infor US, Inc. 6.5% 15/05/2022 USD 58,076,000 59,187,575 0.93Informatica LLC, 144A 7.125%15/07/2023 USD 19,141,000 19,475,967 0.30IQVIA, Inc., 144A 5% 15/10/2026 USD 14,205,000 14,732,503 0.23Jack Ohio Finance LLC, 144A 6.75%15/11/2021 USD 19,772,000 20,362,491 0.32Jagged Peak Energy LLC 5.875%01/05/2026 USD 4,595,000 4,491,612 0.07JELD-WEN, Inc., 144A 4.625%15/12/2025 USD 7,425,000 7,276,500 0.11JELD-WEN, Inc., 144A 4.875%15/12/2027 USD 6,760,000 6,523,400 0.10Kinetic Concepts, Inc., 144A 7.875%15/02/2021 USD 14,755,000 15,142,319 0.24Kratos Defense & Security Solutions,Inc., 144A 6.5% 30/11/2025 USD 780,000 836,550 0.01Kronos Acquisition Holdings, Inc., 144A9% 15/08/2023 USD 3,977,000 3,479,875 0.05LABL Escrow Issuer LLC, 144A 6.75%15/07/2026 USD 10,035,000 10,122,806 0.16LABL Escrow Issuer LLC, 144A 10.5%15/07/2027 USD 7,530,000 7,567,424 0.12Live Nation Entertainment, Inc., 144A4.875% 01/11/2024 USD 8,730,000 8,970,075 0.14LTF Merger Sub, Inc., 144A 8.5%15/06/2023 USD 16,889,000 17,247,891 0.27
28
JPMorgan Investment Funds - Global High Yield Bond Fund
Schedule of Investments (continued)
As at 30 June 2019
Investments Currency
Quantity/Nominal
Value
MarketValue
USD
%of
NetAssets Investments Currency
Quantity/Nominal
Value
MarketValue
USD
%of
NetAssets

Mattel, Inc., 144A 6.75% 31/12/2025 USD 28,623,000 29,344,156 0.46Meredith Corp. 6.875% 01/02/2026 USD 12,130,000 12,870,658 0.20MGM Growth Properties OperatingPartnership LP, REIT, 144A 5.75%01/02/2027 USD 4,740,000 5,104,624 0.08MGM Growth Properties OperatingPartnership LP, REIT 4.5% 15/01/2028 USD 2,565,000 2,552,060 0.04MSCI, Inc., 144A 5.375% 15/05/2027 USD 7,210,000 7,712,970 0.12Mueller Water Products, Inc., 144A5.5% 15/06/2026 USD 4,715,000 4,881,770 0.08Nabors Industries, Inc. 5.75%01/02/2025 USD 11,460,000 10,195,389 0.16Neiman Marcus Group Ltd. LLC, 144A14% 25/04/2024 USD 16,207,311 13,492,586 0.21Neiman Marcus Group Ltd. LLC, 144A8% 25/10/2024 USD 15,022,000 6,270,483 0.10Neiman Marcus Group Ltd. LLC, 144A8.75% 25/10/2024 USD 24,277,058 10,317,750 0.16Netflix, Inc., 144A 5.375% 15/11/2029 USD 5,120,000 5,422,106 0.08Netflix, Inc. 4.875% 15/04/2028 USD 15,300,000 15,834,200 0.25Netflix, Inc. 5.875% 15/11/2028 USD 11,359,000 12,546,867 0.20Nexstar Broadcasting, Inc., 144A6.125% 15/02/2022 USD 3,867,000 3,920,171 0.06Nexstar Broadcasting, Inc., 144A5.625% 01/08/2024 USD 1,145,000 1,189,008 0.02Nexstar Escrow, Inc., 144A 5.625%15/07/2027 USD 6,800,000 6,974,284 0.11NGPL PipeCo LLC, 144A 4.375%15/08/2022 USD 8,405,000 8,745,655 0.14NGPL PipeCo LLC, 144A 4.875%15/08/2027 USD 2,515,000 2,665,900 0.04Nielsen Finance LLC, 144A 5%15/04/2022 USD 18,410,000 18,445,439 0.29Novelis Corp., 144A 6.25% 15/08/2024 USD 7,545,000 7,903,387 0.12Novelis Corp., 144A 5.875%30/09/2026 USD 5,550,000 5,622,122 0.09Oasis Petroleum, Inc., 144A 6.25%01/05/2026 USD 7,305,000 7,113,463 0.11Outfront Media Capital LLC, 144A 5%15/08/2027 USD 6,825,000 6,988,390 0.11Par Pharmaceutical, Inc., 144A 7.5%01/04/2027 USD 14,275,000 14,016,480 0.22Parsley Energy LLC, 144A 6.25%01/06/2024 USD 1,100,000 1,152,266 0.02Parsley Energy LLC, 144A 5.375%15/01/2025 USD 1,920,000 1,960,685 0.03Parsley Energy LLC, 144A 5.25%15/08/2025 USD 7,385,000 7,520,958 0.12Parsley Energy LLC, 144A 5.625%15/10/2027 USD 5,420,000 5,680,675 0.09PetSmart, Inc., 144A 7.125%15/03/2023 USD 28,347,000 26,207,085 0.41PetSmart, Inc., 144A 5.875%01/06/2025 USD 16,130,000 15,390,714 0.24PetSmart, Inc., 144A 8.875%01/06/2025 USD 11,160,000 10,560,541 0.17PGT Escrow Issuer, Inc., 144A 6.75%01/08/2026 USD 7,055,000 7,451,844 0.12Plantronics, Inc., 144A 5.5%31/05/2023 USD 11,865,000 11,805,675 0.18Post Holdings, Inc., 144A 5.5%01/03/2025 USD 11,590,000 12,011,007 0.19Post Holdings, Inc., 144A 5.75%01/03/2027 USD 2,159,000 2,233,151 0.04Post Holdings, Inc., 144A 5.625%15/01/2028 USD 4,565,000 4,690,766 0.07Prestige Brands, Inc., 144A 6.375%01/03/2024 USD 9,880,000 10,367,874 0.16Rain CII Carbon LLC, 144A 7.25%01/04/2025 USD 14,805,000 13,768,650 0.21RBS Global, Inc., 144A 4.875%15/12/2025 USD 4,750,000 4,816,001 0.08Refinitiv US Holdings, Inc., 144A 6.25%15/05/2026 USD 5,470,000 5,653,327 0.09Reynolds Group Issuer, Inc., FRN, 144A6.097% 15/07/2021 USD 800,000 802,000 0.01Reynolds Group Issuer, Inc. 6.875%15/02/2021 USD 887,136 890,720 0.01Rite Aid Corp., 144A 6.125%01/04/2023 USD 23,922,000 19,795,455 0.31Sabre GLBL, Inc., 144A 5.375%15/04/2023 USD 4,130,000 4,233,250 0.07Sabre GLBL, Inc., 144A 5.25%15/11/2023 USD 15,599,000 16,144,965 0.25SBA Communications Corp., REIT4.875% 01/09/2024 USD 12,770,000 13,158,591 0.21Sinclair Television Group, Inc., 144A5.625% 01/08/2024 USD 6,781,000 6,978,395 0.11Sinclair Television Group, Inc., 144A5.125% 15/02/2027 USD 2,095,000 2,066,990 0.03
Sinclair Television Group, Inc. 6.125%01/10/2022 USD 17,230,000 17,583,043 0.28Sirius XM Radio, Inc., 144A 4.625%15/07/2024 USD 8,795,000 8,991,656 0.14Sirius XM Radio, Inc., 144A 6%15/07/2024 USD 32,034,000 33,070,941 0.52Sirius XM Radio, Inc., 144A 5.375%15/04/2025 USD 25,377,000 26,216,344 0.41Sirius XM Radio, Inc., 144A 5.375%15/07/2026 USD 11,575,000 12,007,731 0.19Six Flags Entertainment Corp., 144A4.875% 31/07/2024 USD 6,465,000 6,553,894 0.10Springleaf Finance Corp. 7.125%15/03/2026 USD 3,360,000 3,669,910 0.06SPX FLOW, Inc., 144A 5.625%15/08/2024 USD 6,142,000 6,387,680 0.10SPX FLOW, Inc., 144A 5.875%15/08/2026 USD 6,665,000 6,998,250 0.11Standard Industries, Inc., 144A 4.75%15/01/2028 USD 16,920,000 16,793,523 0.26Staples, Inc., 144A 7.5% 15/04/2026 USD 17,020,000 16,902,987 0.26Staples, Inc., 144A 10.75% 15/04/2027 USD 14,575,000 14,386,982 0.23Stevens Holding Co., Inc., 144A 6.125%01/10/2026 USD 4,980,000 5,241,450 0.08Syneos Health, Inc., 144A 7.5%01/10/2024 USD 11,201,000 11,705,045 0.18Tallgrass Energy Partners LP, 144A5.5% 15/01/2028 USD 5,280,000 5,326,200 0.08Targa Resources Partners LP, 144A6.5% 15/07/2027 USD 5,296,000 5,749,920 0.09Targa Resources Partners LP, 144A6.875% 15/01/2029 USD 6,928,000 7,689,941 0.12Targa Resources Partners LP 4.25%15/11/2023 USD 1,250,000 1,255,981 0.02Targa Resources Partners LP 5%15/01/2028 USD 8,205,000 8,285,491 0.13Tenet Healthcare Corp., 144A 6.25%01/02/2027 USD 13,180,000 13,692,570 0.21Terex Corp., 144A 5.625% 01/02/2025 USD 17,750,000 18,126,300 0.28T-Mobile USA, Inc. 6.5% 15/01/2024 USD 21,746,000 22,604,315 0.35T-Mobile USA, Inc. 6.375% 01/03/2025 USD 12,186,000 12,652,297 0.20T-Mobile USA, Inc. 6.5% 15/01/2026 USD 17,755,000 19,156,580 0.30T-Mobile USA, Inc. 4.5% 01/02/2026 USD 1,740,000 1,786,127 0.03T-Mobile USA, Inc. 4.75% 01/02/2028 USD 25,844,000 26,633,276 0.42TreeHouse Foods, Inc., 144A 6%15/02/2024 USD 14,849,000 15,331,593 0.24TriMas Corp., 144A 4.875% 15/10/2025 USD 7,925,000 8,019,109 0.13Uniti Group LP, REIT, 144A 6%15/04/2023 USD 5,935,000 5,682,763 0.09Uniti Group LP, REIT, 144A 7.125%15/12/2024 USD 1,470,000 1,315,650 0.02Uniti Group LP, REIT 8.25% 15/10/2023 USD 17,365,000 16,322,232 0.26US Treasury Bill 0% 02/07/2019 USD 110,000,000 109,975,798 1.72US Treasury Bill 0% 05/07/2019 USD 79,000,000 78,970,043 1.24US Treasury Bill 0% 09/07/2019 USD 185,079,000 184,968,008 2.89US Treasury Bill 0% 16/07/2019 USD 105,000,000 104,894,335 1.64US Treasury Bill 0% 23/07/2019 USD 120,000,000 119,828,945 1.87VICI Properties 1 LLC, REIT 8%15/10/2023 USD 18,143,229 19,821,478 0.31Wabash National Corp., 144A 5.5%01/10/2025 USD 7,845,000 7,433,138 0.12William Carter Co. (The), 144A 5.625%15/03/2027 USD 8,505,000 8,908,988 0.14Windstream Services LLC, 144A 9%30/06/2025§ USD 52,864,000 36,856,781 0.58Wynn Las Vegas LLC, 144A 5.5%01/03/2025 USD 31,940,000 32,906,984 0.51XPO Logistics, Inc., 144A 6.5%15/06/2022 USD 9,919,000 10,117,380 0.16XPO Logistics, Inc., 144A 6.125%01/09/2023 USD 6,836,000 7,089,992 0.11
3,403,935,798 53.24
Total Bonds 4,120,518,077 64.45
Convertible Bonds
United States of AmericaChesapeake Energy Corp. 5.5%15/09/2026 USD 2,505,000 1,992,727 0.03DISH Network Corp. 3.375%15/08/2026 USD 11,375,000 11,067,875 0.17
13,060,602 0.20
Total Convertible Bonds 13,060,602 0.20
29
JPMorgan Investment Funds - Global High Yield Bond Fund
Schedule of Investments (continued)
As at 30 June 2019
Investments Currency
Quantity/Nominal
Value
MarketValue
USD
%of
NetAssets Investments Currency
Quantity/Nominal
Value
MarketValue
USD
%of
NetAssets

Equities
United States of AmericaMYT Holding Co. Preference, 144A USD 10,699,095 9,869,915 0.15
9,869,915 0.15
Total Equities 9,869,915 0.15
Total Transferable securities and money market instrumentsdealt in on another regulated market
4,143,448,594 64.80
Other transferable securities and money market instruments
Bonds
United States of America21st Century Oncology, Inc., FRN 10%30/04/2023 * USD 7,770,413 6,993,372 0.11Clear Channel CommunicationsInternational, Inc. 9% 01/03/2021 * USD 28,470,000 0 0.00iHeartCommunications, Inc. 10.625%15/03/2023 §* USD 7,810,000 0 0.00Reichhold Industries, Inc., 144A9.075% 08/05/2017 §* USD 4,799,657 5 0.00
6,993,377 0.11
Total Bonds 6,993,377 0.11
Equities
United States of America21st Century Oncology Holdings, Inc. * USD 29,334 1,066,291 0.0221st Oncology Preferred * USD 37,168 7,826,466 0.12Claires Holdings GmbH * USD 12,631 8,210,150 0.13Claire’s Stores, Inc. Preference * USD 7,446 11,913,600 0.19Computershare, Inc. * USD 524,507 12,063,661 0.19Reichhold , Inc. * USD 7,978 6,166,994 0.10Remington LLC * USD 24,499,000 0 0.00Remington Outdoor Co., Inc. * USD 251,768 377,652 0.00
47,624,814 0.75
Total Equities 47,624,814 0.75
Warrants
United States of AmericaJack Cooper Enterprises, Inc.26/04/2027 * USD 32,001 0 0.00Jack Cooper Enterprises, Inc.29/10/2027 * USD 17,531 0 0.00Remington Outdoor Co., Inc.15/05/2022 * USD 253,884 2,539 0.00
2,539 0.00
Total Warrants 2,539 0.00
Total Other transferable securities and money marketinstruments
54,620,730 0.86
Units of authorised UCITS or other collective investment undertakings
Collective Investment Schemes - UCITS
LuxembourgJPMorgan Europe High Yield BondFund - JPM Europe High Yield Bond X(acc) - EUR† EUR 317,819 46,909,733 0.73
46,909,733 0.73
Total Collective Investment Schemes - UCITS 46,909,733 0.73
Total Units of authorised UCITS or other collective investmentundertakings
46,909,733 0.73
Total Investments 6,318,072,829 98.82
Cash (6,010,572) (0.09)
Other Assets/(Liabilities) 81,209,339 1.27
Total Net Assets 6,393,271,596 100.00
* Security is valued at its fair value under the direction of the Board of Directors.† Related Party Fund.§ Security is currently in default.
Geographic Allocation of Portfolio as at 30 June 2019 % of Net Assets
United States of America 84.78Canada 4.49Luxembourg 4.28Supranational 1.27United Kingdom 0.98Netherlands 0.89Cayman Islands 0.74Jersey 0.60France 0.44Italy 0.28Ireland 0.07Total Investments 98.82Cash and Other Assets/(Liabilities) 1.18
Total 100.00
Geographic Allocation of Portfolio as at 31 December 2018 % of Net Assets
United States of America 82.97Canada 5.29Luxembourg 4.44United Kingdom 1.10Netherlands 0.96Cayman Islands 0.86Ireland 0.84Supranational 0.63Jersey 0.52France 0.45Italy 0.32Germany 0.12Bermuda 0.06Total Investments 98.56Cash and Other Assets/(Liabilities) 1.44
Total 100.00
30
JPMorgan Investment Funds - Global High Yield Bond Fund
Schedule of Investments (continued)
As at 30 June 2019
Investments Currency
Quantity/Nominal
Value
MarketValue
USD
%of
NetAssets Investments Currency
Quantity/Nominal
Value
MarketValue
USD
%of
NetAssets

JPMorgan Investment Funds - Global High Yield Bond Fund
Schedule of Investments (continued)
As at 30 June 2019
Forward Currency Exchange Contracts (continued)
CurrencyPurchased
AmountPurchased Currency Sold Amount Sold
MaturityDate Counterparty
UnrealisedGain/(Loss)
USD
%of
NetAssets
AUD 1,377,996 USD 963,185 01/07/2019 ANZ 3,094 -AUD 1,090,092 USD 763,253 02/07/2019 State Street 1,141 -AUD 1,178,273 USD 819,392 03/07/2019 ANZ 6,866 -AUD 1,982 USD 1,369 03/07/2019 Barclays 21 -AUD 1,645,951 USD 1,148,390 03/07/2019 Citibank 5,825 -AUD 2,153,919 USD 1,502,650 03/07/2019 Goldman Sachs 7,774 -AUD 434,395,450 USD 300,256,402 03/07/2019 Merrill Lynch 4,361,149 0.07AUD 3,265,698 USD 2,258,614 03/07/2019 Standard Chartered 31,439 -AUD 1,670,809 USD 1,157,166 06/08/2019 Barclays 15,872 -AUD 437,276,351 USD 306,785,654 06/08/2019 BNP Paribas 216,171 0.01AUD 829,882 USD 578,983 06/08/2019 Citibank 3,658 -AUD 1,064,093 USD 742,755 06/08/2019 Goldman Sachs 4,321 -AUD 4,524 USD 3,165 06/08/2019 Merrill Lynch 11 -AUD 2,100 USD 1,473 06/08/2019 State Street 1 -CAD 2,762 USD 2,069 03/07/2019 BNP Paribas 40 -CAD 32,085 USD 24,196 03/07/2019 Citibank 304 -CAD 32,370 USD 24,354 03/07/2019 Goldman Sachs 364 -CAD 268,995 USD 200,588 03/07/2019 HSBC 4,818 -CAD 40,757 USD 30,749 03/07/2019 Merrill Lynch 373 -CAD 11,268,359 USD 8,318,269 03/07/2019 RBC 286,298 0.01CAD 39,720 USD 29,964 03/07/2019 Toronto-Dominion Bank 367 -CAD 11,638,546 USD 8,873,367 06/08/2019 State Street 20,801 -CHF 6,314 USD 6,360 03/07/2019 Citibank 108 -CHF 5,769 USD 5,838 03/07/2019 Goldman Sachs 72 -CHF 1,798,167 USD 1,795,054 03/07/2019 Merrill Lynch 47,147 -CHF 115,999 USD 117,395 03/07/2019 State Street 1,444 -CHF 34,651 USD 35,511 05/08/2019 ANZ 103 -CHF 7,180 USD 7,338 05/08/2019 Barclays 42 -CHF 65,212 USD 66,999 05/08/2019 State Street 24 -CNH 27,767 USD 4,000 03/07/2019 BNP Paribas 41 -CNH 4,296,646 USD 619,041 03/07/2019 HSBC 6,311 -CNH 11,808 USD 1,702 03/07/2019 RBC 16 -CNH 4,315,179 USD 627,425 05/08/2019 HSBC 559 -CNH 16,331 USD 2,375 05/08/2019 State Street 2 -CZK 56,148 USD 2,468 03/07/2019 BNP Paribas 45 -CZK 5,370,420 USD 232,055 03/07/2019 HSBC 8,290 -CZK 5,435,018 USD 243,354 05/08/2019 Barclays 40 -EUR 1,430,063 USD 1,607,923 03/07/2019 BNP Paribas 20,068 -EUR 1,289,880,647 USD 1,441,985,593 03/07/2019 Citibank 26,420,664 0.41EUR 8,243,376 USD 9,303,243 03/07/2019 Credit Suisse 81,055 -EUR 4,270,233 USD 4,846,555 03/07/2019 Merrill Lynch 14,699 -EUR 5,124,663 USD 5,745,373 03/07/2019 RBC 88,567 -EUR 73,840,430 USD 83,564,295 03/07/2019 State Street 496,002 0.01EUR 305,796 USD 346,458 03/07/2019 Toronto-Dominion Bank 1,661 -EUR 5,810,395 USD 6,596,775 05/08/2019 BNP Paribas 36,284 -EUR 1,382 USD 1,575 05/08/2019 Citibank 2 -EUR 106,643 USD 121,188 05/08/2019 HSBC 554 -GBP 237,723 USD 300,762 03/07/2019 Barclays 1,471 -GBP 30,469 USD 38,703 03/07/2019 BNP Paribas 34 -GBP 207,863 USD 263,831 03/07/2019 Merrill Lynch 438 -GBP 14,534 USD 18,470 03/07/2019 State Street 8 -GBP 10,603,201 USD 13,363,839 03/07/2019 Toronto-Dominion Bank 116,704 -GBP 21,400 USD 27,226 05/08/2019 Barclays 26 -GBP 11,160,982 USD 14,168,119 05/08/2019 Citibank 45,234 -GBP 42,008 USD 53,309 05/08/2019 Merrill Lynch 188 -HUF 4,510,550 USD 15,740 03/07/2019 BNP Paribas 152 -HUF 15,206,540 USD 53,083 03/07/2019 Citibank 495 -HUF 556,041,187 USD 1,915,084 03/07/2019 State Street 44,036 -HUF 11,167,390 USD 39,260 05/08/2019 Citibank 171 -HUF 560,332,968 USD 1,975,058 05/08/2019 HSBC 3,449 -NZD 54,042 USD 35,431 03/07/2019 ANZ 846 -NZD 8,489 USD 5,590 03/07/2019 Barclays 108 -NZD 3,391,316 USD 2,214,629 03/07/2019 Goldman Sachs 61,848 -NZD 17,989,370 USD 11,702,887 03/07/2019 Merrill Lynch 372,773 0.01NZD 63,971 USD 42,097 03/07/2019 State Street 845 -NZD 21,198,391 USD 14,229,187 05/08/2019 BNP Paribas 11,195 -NZD 80,153 USD 52,679 05/08/2019 Merrill Lynch 1,165 -NZD 51,074 USD 33,980 05/08/2019 State Street 330 -PLN 136,457 USD 36,246 03/07/2019 BNP Paribas 327 -PLN 63,129 USD 16,720 03/07/2019 Citibank 200 -PLN 20,818,510 USD 5,420,657 03/07/2019 HSBC 159,083 -PLN 67,263 USD 17,798 03/07/2019 Merrill Lynch 230 -PLN 71,153 USD 18,699 03/07/2019 Toronto-Dominion Bank 371 -PLN 127,514 USD 33,977 05/08/2019 Citibank 230 -PLN 422,181 USD 113,220 05/08/2019 HSBC 35 -PLN 20,817,267 USD 5,579,973 05/08/2019 Merrill Lynch 4,474 -USD 14,410 CAD 18,854 06/08/2019 Citibank 2 -USD 1,961,552 CHF 1,912,466 03/07/2019 Merrill Lynch 2,253 -USD 564,777,545 EUR 496,028,056 03/07/2019 Citibank 96,849 -USD 350,722 EUR 307,178 05/08/2019 Citibank 53 -USD 708,512 EUR 620,464 05/08/2019 HSBC 201 -
31

JPMorgan Investment Funds - Global High Yield Bond Fund
Schedule of Investments (continued)
As at 30 June 2019
Forward Currency Exchange Contracts (continued)
CurrencyPurchased
AmountPurchased Currency Sold Amount Sold
MaturityDate Counterparty
UnrealisedGain/(Loss)
USD
%of
NetAssets
USD 38,881 GBP 30,551 03/07/2019 Merrill Lynch 41 -USD 28,459 HUF 8,058,583 05/08/2019 Goldman Sachs 5 -
Total Unrealised Gain on Forward Currency Exchange Contracts 33,120,378 0.52
CHF 4,454 USD 4,587 05/08/2019 BNP Paribas (9) -CHF 1,912,466 USD 1,967,623 05/08/2019 Merrill Lynch (2,040) -CNH 13,096 USD 1,908 03/07/2019 Merrill Lynch (2) -EUR 620,464 USD 706,494 01/07/2019 HSBC (214) -EUR 496,028,056 USD 566,297,375 05/08/2019 Citibank (39,263) -EUR 3,185,024 USD 3,640,676 05/08/2019 Credit Suisse (4,702) -GBP 94,627 USD 120,576 03/07/2019 Barclays (271) -GBP 54,697 USD 69,788 03/07/2019 Citibank (248) -GBP 63,122 USD 80,354 03/07/2019 Merrill Lynch (102) -GBP 15,078 USD 19,236 05/08/2019 Toronto-Dominion Bank (35) -HUF 3,534,555 USD 12,496 03/07/2019 BNP Paribas (43) -HUF 1,512,631 USD 5,333 03/07/2019 Citibank (4) -HUF 767,954 USD 2,712 05/08/2019 Citibank - -HUF 1,355,724 USD 4,792 05/08/2019 HSBC (5) -USD 216,123 AUD 312,468 03/07/2019 ANZ (2,993) -USD 306,435,833 AUD 437,276,351 03/07/2019 BNP Paribas (201,934) (0.01)USD 668,464 AUD 961,045 03/07/2019 Citibank (5,464) -USD 631,394 AUD 911,049 03/07/2019 Goldman Sachs (7,474) -USD 169,536 AUD 245,710 03/07/2019 HSBC (2,767) -USD 1,562,966 AUD 2,268,183 03/07/2019 Merrill Lynch (27,585) -USD 463,446 AUD 666,469 03/07/2019 State Street (3,912) -USD 964,348 AUD 1,377,996 06/08/2019 ANZ (3,112) -USD 2,069 AUD 2,988 06/08/2019 BNP Paribas (29) -USD 573,602 AUD 818,985 06/08/2019 Citibank (1,389) -USD 1,054,539 AUD 1,514,275 06/08/2019 Standard Chartered (8,599) -USD 764,139 AUD 1,090,092 06/08/2019 State Street (1,190) -USD 17,409 CAD 23,389 03/07/2019 ANZ (451) -USD 17,730 CAD 23,946 03/07/2019 BNP Paribas (555) -USD 13,687 CAD 18,522 03/07/2019 Merrill Lynch (456) -USD 8,851,353 CAD 11,619,191 03/07/2019 State Street (21,110) -USD 16,672 CAD 21,859 06/08/2019 Merrill Lynch (32) -USD 66,786 CHF 65,212 02/07/2019 State Street (17) -USD 10,170 CHF 10,134 03/07/2019 Merrill Lynch (213) -USD 3,644 CHF 3,648 03/07/2019 Standard Chartered (93) -USD 3,784 CHF 3,695 05/08/2019 Merrill Lynch (13) -USD 1,327 CNH 9,193 03/07/2019 Citibank (11) -USD 631,058 CNH 4,340,124 03/07/2019 HSBC (623) -USD 1,226 CNH 8,431 05/08/2019 HSBC (1) -USD 241,458 CZK 5,395,751 03/07/2019 Barclays (21) -USD 483 CZK 11,148 03/07/2019 BNP Paribas (16) -USD 851 CZK 19,668 03/07/2019 Citibank (29) -USD 872,386 EUR 767,016 02/07/2019 BNP Paribas (716) -USD 5,423,164 EUR 4,839,127 03/07/2019 BNP Paribas (85,721) -USD 2,713,154 EUR 2,426,001 03/07/2019 Goldman Sachs (48,618) -USD 3,244,348 EUR 2,891,086 03/07/2019 Merrill Lynch (46,878) -USD 2,345,040 EUR 2,084,865 03/07/2019 Standard Chartered (28,381) -USD 41,371,749 EUR 37,017,265 03/07/2019 State Street (768,881) (0.01)USD 304,554 EUR 271,212 03/07/2019 Toronto-Dominion Bank (4,196) -USD 2,865,621 EUR 2,513,746 05/08/2019 Citibank (4,033) -USD 39,866,602 EUR 34,940,749 05/08/2019 State Street (21,228) -USD 14,200,826 GBP 11,204,615 03/07/2019 Citibank (44,335) -USD 88,241 GBP 69,671 03/07/2019 Merrill Lynch (336) -USD 1,778 GBP 1,399 03/07/2019 Toronto-Dominion Bank (1) -USD 32,973 GBP 25,965 05/08/2019 Standard Chartered (93) -USD 31,823 HUF 9,060,378 02/07/2019 Citibank (98) -USD 10,460 HUF 3,033,380 03/07/2019 BNP Paribas (228) -USD 20,600 HUF 5,930,268 03/07/2019 Citibank (294) -USD 4,143 HUF 1,195,837 03/07/2019 Goldman Sachs (70) -USD 1,970,980 HUF 560,332,968 03/07/2019 HSBC (3,262) -USD 29,004 HUF 8,248,055 03/07/2019 Standard Chartered (57) -USD 7,105 HUF 2,064,955 03/07/2019 State Street (171) -USD 3,710 HUF 1,053,356 05/08/2019 BNP Paribas (9) -USD 4,664 NZD 7,157 03/07/2019 Barclays (141) -USD 14,218,990 NZD 21,198,391 03/07/2019 BNP Paribas (10,777) -USD 49,407 NZD 75,385 03/07/2019 HSBC (1,196) -USD 4,604 NZD 7,018 03/07/2019 Merrill Lynch (107) -USD 5,338 NZD 8,100 03/07/2019 Standard Chartered (100) -USD 138,346 NZD 211,137 03/07/2019 State Street (3,383) -USD 27,035 NZD 40,391 05/08/2019 Merrill Lynch (99) -USD 24,790 PLN 94,233 03/07/2019 BNP Paribas (466) -USD 36,163 PLN 137,631 03/07/2019 Citibank (724) -USD 5,594,112 PLN 20,889,766 03/07/2019 Merrill Lynch (4,726) -
32

JPMorgan Investment Funds - Global High Yield Bond Fund
Schedule of Investments (continued)
As at 30 June 2019
Forward Currency Exchange Contracts (continued)
CurrencyPurchased
AmountPurchased Currency Sold Amount Sold
MaturityDate Counterparty
UnrealisedGain/(Loss)
USD
%of
NetAssets
USD 9,066 PLN 34,882 03/07/2019 Toronto-Dominion Bank (283) -USD 10,895 PLN 40,742 05/08/2019 Barclays (34) -
Total Unrealised Loss on Forward Currency Exchange Contracts (1,416,669) (0.02)
Net Unrealised Gain on Forward Currency Exchange Contracts 31,703,709 0.50
Credit Default Swap Contracts
NominalAmount Currency Counterparty Reference Entity Buy/Sell
Interest(Paid)/
ReceivedMaturity
Date
MarketValue
USD
UnrealisedGain/(Loss)
USD
%of
NetAssets
100,000,000 USD Citigroup CDX.NA.HY.32-V1 Sell 5.00% 20/06/2024 7,500,369 1,184,436 0.12
Total Unrealised Gain on Credit Default Swap Contracts 7,500,369 1,184,436 0.12
Net Unrealised Gain on Credit Default Swap Contracts 7,500,369 1,184,436 0.12
33

1. Total Expense Ratios (continued)For theperiodended
30 Jun 19+
For theperiodended
30 Jun 19 (a)
For theperiodended
30 Jun 19 (b)
For theperiodended
30 Jun 19 (c)
For theyear
ended31 Dec 18+
For theyear
ended31 Dec 17+
CappedExpense
Ratio30 Jun 19+
InceptionDate
JPMorgan Investment Funds - Europe Select Equity FundJPM Europe Select Equity A (acc) - CZK 1.80% 1.80% 1.80% 1.80% 1.80% - 1.80% 16-Feb-18JPM Europe Select Equity A (acc) - EUR 1.72% 1.72% 1.72% 1.72% 1.70% 1.71% 1.80% 29-Aug-97JPM Europe Select Equity A (acc) - USD 1.76% 1.76% 1.76% 1.76% 1.80% 1.80% 1.80% 20-Dec-07JPM Europe Select Equity A (dist) - EUR 1.80% 1.80% 1.80% 1.80% 1.80% 1.80% 1.80% 15-May-06JPM Europe Select Equity A (dist) - GBP 1.80% 1.80% 1.80% 1.80% 1.80% - 1.80% 23-Feb-18JPM Europe Select Equity C (acc) - EUR 0.70% 0.70% 0.70% 0.70% 0.70% 0.70% 0.70% 07-Jan-98JPM Europe Select Equity C (acc) - USD 0.70% 0.70% 0.70% 0.70% 0.70% 0.70% 0.70% 16-Oct-15JPM Europe Select Equity C (dist) - EUR 0.70% 0.70% 0.70% 0.70% 0.70% 0.70% 0.70% 29-Sep-15JPM Europe Select Equity C (dist) - GBP 0.70% 0.70% 0.70% 0.70% 0.70% 0.70% 0.70% 25-Jan-13JPM Europe Select Equity D (acc) - EUR 2.50% 2.50% 2.50% 2.50% 2.53% 2.55% 2.55% 19-Mar-07JPM Europe Select Equity D (acc) - USD 2.54% 2.54% 2.54% 2.54% 2.53% 2.55% 2.55% 20-Dec-07JPM Europe Select Equity I (acc) - EUR 0.66% 0.66% 0.66% 0.66% 0.66% 0.66% 0.66% 13-Apr-10JPM Europe Select Equity I (acc) - USD* - - - - 0.66% 0.66% 0.66% 09-Oct-13JPM Europe Select Equity I (acc) - USD (hedged) 0.66% 0.66% 0.66% 0.66% 0.66% 0.66% 0.66% 27-Jan-15JPM Europe Select Equity I (dist) - EUR 0.66% 0.66% 0.66% 0.66% 0.65% 0.66% 0.66% 11-Oct-13JPM Europe Select Equity I2 (acc) - EUR 0.56% 0.56% 0.56% 0.56% 0.56% 0.56% 0.56% 18-Dec-17JPM Europe Select Equity I2 (acc) - USD 0.56% 0.56% 0.56% 0.56% 0.56% 0.43% 0.56% 18-Dec-17JPM Europe Select Equity I2 (acc) - USD (hedged)* 0.56% 0.56% 0.56% 0.56% 0.56% 0.43% 0.56% 18-Dec-17JPM Europe Select Equity I2 (dist) - EUR 0.56% 0.56% 0.56% 0.56% 0.56% 0.56% 0.56% 18-Dec-17JPM Europe Select Equity X (acc) - EUR 0.15% 0.15% 0.15% 0.15% 0.15% 0.15% 0.15% 21-May-01JPM Europe Select Equity X (acc) - USD (hedged) 0.15% 0.15% 0.15% 0.15% 0.15% 0.15% 0.15% 29-Apr-15JPM Europe Select Equity X (dist) - EUR* 0.14% 0.14% 0.14% 0.14% 0.15% 0.15% 0.15% 06-Nov-13
JPMorgan Investment Funds - Global Dividend FundJPM Global Dividend A (acc) - EUR 1.80% 1.80% 1.80% 1.80% 1.80% 1.80% 1.80% 04-Oct-10JPM Global Dividend A (acc) - EUR (hedged) 1.80% 1.80% 1.80% 1.80% 1.80% 1.80% 1.80% 28-Nov-07JPM Global Dividend A (acc) - USD 1.80% 1.80% 1.80% 1.80% 1.80% 1.80% 1.80% 28-Nov-07JPM Global Dividend A (dist) - EUR (hedged) 1.80% 1.80% 1.80% 1.80% 1.80% 1.80% 1.80% 12-Feb-09JPM Global Dividend A (dist) - USD 1.80% 1.80% 1.80% 1.80% 1.80% 1.80% 1.80% 12-Oct-09JPM Global Dividend A (div) - EUR 1.80% 1.80% 1.80% 1.80% 1.80% 1.80% 1.80% 01-Dec-11JPM Global Dividend A (div) - EUR (hedged) 1.80% 1.80% 1.80% 1.80% 1.80% 1.80% 1.80% 22-Feb-12JPM Global Dividend A (div) - USD 1.80% 1.80% 1.80% 1.80% 1.80% 1.80% 1.80% 13-Jan-12JPM Global Dividend A (mth) - USD (hedged) 1.80% 1.80% 1.80% 1.80% 1.80% 1.80% 1.80% 15-Sep-14JPM Global Dividend C (acc) - EUR 0.80% 0.80% 0.80% 0.80% 0.80% 0.80% 0.80% 02-Apr-09JPM Global Dividend C (acc) - USD 0.80% 0.80% 0.80% 0.80% 0.80% 0.80% 0.80% 08-Nov-12JPM Global Dividend C (dist) - EUR 0.80% 0.80% 0.80% 0.80% 0.80% 0.80% 0.80% 14-Jul-11JPM Global Dividend C (dist) - EUR (hedged) 0.80% 0.80% 0.80% 0.80% 0.80% 0.80% 0.80% 24-Sep-13JPM Global Dividend C (div) - EUR* 0.80% 0.80% 0.80% 0.80% 0.80% 0.80% 0.80% 01-Dec-11JPM Global Dividend D (acc) - EUR (hedged) 2.55% 2.55% 2.55% 2.55% 2.55% 2.55% 2.55% 28-Nov-07JPM Global Dividend D (acc) - USD 2.55% 2.55% 2.55% 2.55% 2.55% 2.55% 2.55% 28-Nov-07JPM Global Dividend D (div) - EUR (hedged) 2.55% 2.55% 2.55% 2.55% 2.55% 2.55% 2.55% 22-Feb-12JPM Global Dividend D (mth) - EUR (hedged) 2.55% 2.55% 2.55% 2.55% 2.55% 2.55% 2.55% 27-Feb-17JPM Global Dividend F (mth) - USD (hedged) 2.80% 2.80% 2.80% 2.80% 2.80% 2.74% 2.80% 14-Dec-17JPM Global Dividend I (acc) - EUR* 0.76% 0.76% 0.76% 0.76% 0.76% 0.76% 0.76% 04-Oct-13JPM Global Dividend T (acc) - EUR (hedged) 2.55% 2.55% 2.55% 2.55% 2.55% 2.55% 2.55% 17-Aug-12JPM Global Dividend X (acc) - EUR (hedged)* - - - - 0.15% 0.15% 0.15% 22-Nov-12JPM Global Dividend X (acc) - USD 0.15% 0.15% 0.15% 0.15% 0.15% 0.15% 0.15% 13-Jan-10JPM Global Dividend X (dist) - AUD 0.15% 0.15% 0.15% 0.15% 0.15% 0.15% 0.15% 19-Dec-13
* Share Class inactive as at end of the period.+ Expense ratios are calculated in accordance with the guidelines dated 16 May 2008 issued by the Swiss Funds & Asset Management Association. The Total Expense Ratio (“TER”) represents the totaloperating costs as a percentage of the Fund’s average daily net assets. The total operating cost comprises investment management and advisory fees, depositary fees, taxe d’abonnement and otherexpenses, as summarised in the Combined Statement of Operations and Changes in Net Assets. Overdraft interest and Performance Fees are excluded from the calculation.
The capped expense ratios and total expense ratios for some Share Classes may have changed over the previous two years. All details concerning these changes have been disclosed in previous years’Financial Statements. All TER figures are annualised.
(a) These figures include Fee Waivers on Management and Advisory Fees or Operating and Administrative expenses, where applicable.(b) These figures include Performance Fees, where applicable.(c) These figures include i) Fee Waivers on Management and Advisory Fees or Operating and Administrative expenses and ii) Performance Fees, where applicable.
34
JPMorgan Investment Funds
Appendix - Unaudited Additional Disclosures

1. Total Expense Ratios (continued)For theperiodended
30 Jun 19+
For theperiodended
30 Jun 19 (a)
For theperiodended
30 Jun 19 (b)
For theperiodended
30 Jun 19 (c)
For theyear
ended31 Dec 18+
For theyear
ended31 Dec 17+
CappedExpense
Ratio30 Jun 19+
InceptionDate
JPMorgan Investment Funds - Global High Yield Bond FundJPM Global High Yield Bond A (acc) - AUD (hedged) 1.15% 1.15% 1.15% 1.15% 1.15% 1.15% 1.15% 03-Apr-14JPM Global High Yield Bond A (acc) - CHF (hedged) 1.15% 1.15% 1.15% 1.15% 1.15% 1.15% 1.15% 25-Sep-12JPM Global High Yield Bond A (acc) - CZK (hedged) 1.15% 1.15% 1.15% 1.15% 1.15% 1.15% 1.15% 09-Jan-17JPM Global High Yield Bond A (acc) - EUR (hedged) 1.03% 1.03% 1.03% 1.03% 1.04% 1.07% 1.15% 24-Mar-00JPM Global High Yield Bond A (acc) - HUF (hedged) 1.15% 1.15% 1.15% 1.15% 1.15% 1.15% 1.15% 24-Jul-14JPM Global High Yield Bond A (acc) - USD 1.07% 1.07% 1.07% 1.07% 1.07% 1.06% 1.15% 02-Sep-08JPM Global High Yield Bond A (dist) - EUR (hedged) 1.07% 1.07% 1.07% 1.07% 1.06% 1.08% 1.15% 15-May-06JPM Global High Yield Bond A (dist) - USD 1.15% 1.15% 1.15% 1.15% 1.15% 1.15% 1.15% 17-Oct-12JPM Global High Yield Bond A (irc) - AUD (hedged) 1.08% 1.08% 1.08% 1.08% 1.08% 1.08% 1.15% 12-Mar-13JPM Global High Yield Bond A (irc) - CAD (hedged) 1.15% 1.15% 1.15% 1.15% 1.15% 1.15% 1.15% 19-Mar-13JPM Global High Yield Bond A (irc) - NZD (hedged) 1.15% 1.15% 1.15% 1.15% 1.15% 1.15% 1.15% 14-Mar-13JPM Global High Yield Bond A (irc) - RMB (hedged) 1.15% 1.15% 1.15% 1.15% 1.15% 1.15% 1.15% 17-Mar-14JPM Global High Yield Bond A (mth) - HKD 1.09% 1.09% 1.09% 1.09% 1.09% 1.09% 1.15% 01-Feb-12JPM Global High Yield Bond A (mth) - SGD 1.15% 1.15% 1.15% 1.15% 1.15% 1.15% 1.15% 15-Nov-12JPM Global High Yield Bond A (mth) - USD 1.07% 1.07% 1.07% 1.07% 1.07% 1.08% 1.15% 17-Sep-08JPM Global High Yield Bond C (acc) - EUR (hedged) 0.60% 0.60% 0.60% 0.60% 0.60% 0.60% 0.60% 24-Mar-00JPM Global High Yield Bond C (acc) - PLN (hedged) 0.60% 0.60% 0.60% 0.60% 0.60% 0.60% 0.60% 18-Sep-12JPM Global High Yield Bond C (acc) - USD 0.60% 0.60% 0.60% 0.60% 0.60% 0.60% 0.60% 18-Aug-08JPM Global High Yield Bond C (dist) - EUR (hedged) 0.60% 0.60% 0.60% 0.60% 0.60% 0.60% 0.60% 12-Feb-13JPM Global High Yield Bond C (dist) - GBP (hedged) 0.60% 0.60% 0.60% 0.60% 0.60% 0.60% 0.60% 20-Jan-15JPM Global High Yield Bond C (dist) - USD 0.60% 0.60% 0.60% 0.60% 0.60% 0.60% 0.60% 29-May-12JPM Global High Yield Bond C (div) - EUR (hedged) 0.60% 0.60% 0.60% 0.60% 0.60% 0.60% 0.60% 04-May-12JPM Global High Yield Bond C (irc) - CAD (hedged) 0.60% 0.60% 0.60% 0.60% 0.60% 0.60% 0.60% 16-Oct-15JPM Global High Yield Bond C (mth) - HKD 0.60% 0.60% 0.60% 0.60% 0.60% 0.60% 0.60% 23-Oct-15JPM Global High Yield Bond C (mth) - USD 0.60% 0.60% 0.60% 0.60% 0.60% 0.60% 0.60% 13-Jul-12JPM Global High Yield Bond D (acc) - EUR (hedged) 1.46% 1.46% 1.46% 1.46% 1.46% 1.46% 1.55% 18-Apr-01JPM Global High Yield Bond D (acc) - PLN (hedged) 1.55% 1.55% 1.55% 1.55% 1.55% 1.55% 1.55% 18-Sep-12JPM Global High Yield Bond D (acc) - USD 1.55% 1.55% 1.55% 1.55% 1.55% 1.55% 1.55% 17-Sep-10JPM Global High Yield Bond D (div) - EUR (hedged) 1.43% 1.43% 1.43% 1.43% 1.43% 1.44% 1.55% 31-Oct-12JPM Global High Yield Bond D (mth) - EUR (hedged) 1.55% 1.55% 1.55% 1.55% 1.55% 1.55% 1.55% 27-Feb-17JPM Global High Yield Bond F (irc) - AUD (hedged) 2.15% 2.15% 2.15% 2.15% 2.15% 2.15% 2.15% 14-Dec-17JPM Global High Yield Bond F (mth) - USD 2.12% 2.12% 2.12% 2.12% 2.15% 2.15% 2.15% 14-Dec-17JPM Global High Yield Bond I (acc) - EUR (hedged) 0.56% 0.56% 0.56% 0.56% 0.56% 0.56% 0.56% 03-Oct-13JPM Global High Yield Bond I (acc) - USD 0.56% 0.56% 0.56% 0.56% 0.56% 0.56% 0.56% 19-Nov-09JPM Global High Yield Bond I (dist) - EUR (hedged) 0.56% 0.56% 0.56% 0.56% 0.56% 0.56% 0.56% 18-Oct-13JPM Global High Yield Bond I (dist) - GBP (hedged)* - - - - 0.56% 0.56% 0.56% 24-Jun-15JPM Global High Yield Bond I (dist) - USD* - - - - 0.56% 0.56% 0.56% 16-Oct-13JPM Global High Yield Bond I (mth) - USD 0.56% 0.56% 0.56% 0.56% 0.56% 0.56% 0.56% 04-Dec-12JPM Global High Yield Bond I2 (acc) - EUR (hedged) 0.45% 0.45% 0.45% 0.45% 0.45% 0.31% 0.45% 18-Dec-17JPM Global High Yield Bond I2 (acc) - USD 0.45% 0.45% 0.45% 0.45% 0.45% 0.36% 0.45% 18-Dec-17JPM Global High Yield Bond I2 (dist) - EUR (hedged)* 0.45% 0.45% 0.45% 0.45% 0.45% 0.31% 0.45% 18-Dec-17JPM Global High Yield Bond I2 (dist) - GBP (hedged)* 0.45% 0.45% 0.45% 0.45% 0.45% 0.45% 0.45% 18-Dec-17JPM Global High Yield Bond I2 (dist) - USD 0.45% 0.45% 0.45% 0.45% 0.45% 0.36% 0.45% 18-Dec-17JPM Global High Yield Bond I2 (mth) - USD 0.37% 0.37% 0.37% 0.37% 0.37% 0.36% 0.45% 18-Dec-17JPM Global High Yield Bond P (acc) - USD 0.41% 0.41% 0.41% 0.41% 0.41% 0.41% 0.60% 11-Oct-17JPM Global High Yield Bond P (dist) - EUR (hedged) 0.41% 0.41% 0.41% 0.41% 0.41% 0.41% 0.60% 27-Jan-17JPM Global High Yield Bond P (dist) - USD 0.41% 0.41% 0.41% 0.41% 0.41% 0.41% 0.60% 14-Apr-14JPM Global High Yield Bond T (acc) - EUR (hedged) 1.49% 1.49% 1.49% 1.49% 1.49% 1.55% 1.55% 17-Aug-12JPM Global High Yield Bond X (acc) - EUR (hedged) 0.10% 0.10% 0.10% 0.10% 0.10% 0.10% 0.10% 24-Mar-00JPM Global High Yield Bond X (acc) - USD 0.10% 0.10% 0.10% 0.10% 0.10% 0.10% 0.10% 06-Jan-11JPM Global High Yield Bond X (mth) - USD 0.10% 0.10% 0.10% 0.10% 0.10% - 0.10% 12-Jan-18
* Share Class inactive as at end of the period.+ Expense ratios are calculated in accordance with the guidelines dated 16 May 2008 issued by the Swiss Funds & Asset Management Association. The Total Expense Ratio (“TER”) represents the totaloperating costs as a percentage of the Fund’s average daily net assets. The total operating cost comprises investment management and advisory fees, depositary fees, taxe d’abonnement and otherexpenses, as summarised in the Combined Statement of Operations and Changes in Net Assets. Overdraft interest and Performance Fees are excluded from the calculation.
The capped expense ratios and total expense ratios for some Share Classes may have changed over the previous two years. All details concerning these changes have been disclosed in previous years’Financial Statements. All TER figures are annualised.
(a) These figures include Fee Waivers on Management and Advisory Fees or Operating and Administrative expenses, where applicable.(b) These figures include Performance Fees, where applicable.(c) These figures include i) Fee Waivers on Management and Advisory Fees or Operating and Administrative expenses and ii) Performance Fees, where applicable.
35
JPMorgan Investment Funds
Appendix - Unaudited Additional Disclosures (continued)

Equity Sub-FundsJPMorgan Investment Funds - Europe Select Equity FundTo achieve a return in excess of the European equity markets by investing primarily in European companies.
JPMorgan Investment Funds - Global Dividend FundTo provide long-term capital growth by investing primarily in companies, globally, that generate high and rising income.
Bond Sub-FundsJPMorgan Investment Funds - Global High Yield Bond FundTo achieve a return in excess of global bond markets by investing primarily in global below investment grade corporate debt securities, using financialderivative instruments where appropriate.
36
JPMorgan Investment Funds
Appendix - Unaudited Additional Disclosures (continued)
2. Summary of Investment Objectives of the Sub-Funds

Performance
Returns for periods greater than one year are annualised. SICAV performance includes reinvestment of income and is net of all expenses.
Past performance is no indication of current or future performance.
The performance data does not take into account the commissions and costs incurred on the issue and redemption of units.
Volatility
The standard deviation (D) of the price is calculated on a daily basis throughout each SICAV’s financial year.
The details below relate to the period from 1 January 2019 to 30 June 2019.
If D is equal to or less than 0.1 then volatility will be Low.If D is greater than 0.1 but less than or equal to 1.0 then volatility will be Medium.If D is greater than 1.0 but less than or equal to 2.4 then volatility will be High.If D is greater than 2.4 then volatility will be Very High.
Share Class 3 Months 6 Months 9 Months 1 Year 2 Years 3 Years Volatility
JPMorgan Investment Funds - Europe Select Equity FundJPM Europe Select Equity A (acc) - CZK 1.43% 14.67% 1.58% 0.41% - - MediumJPM Europe Select Equity A (acc) - EUR 2.98% 16.16% 2.93% 2.76% 2.19% 8.88% MediumJPM Europe Select Equity A (acc) - USD 4.40% 15.61% 1.13% 0.39% 1.93% 9.78% MediumJPM Europe Select Equity A (dist) - EUR 4.00% 16.05% 2.81% 3.48% 3.40% 9.59% MediumJPM Europe Select Equity A (dist) - GBP 7.90% 16.26% 3.37% 3.78% - - MediumJPM Europe Select Equity C (acc) - EUR 3.25% 16.74% 3.71% 3.80% 3.21% 10.08% MediumJPM Europe Select Equity C (acc) - USD 4.67% 16.21% 1.94% 1.48% 3.04% 11.12% MediumJPM Europe Select Equity C (dist) - EUR 5.36% 16.63% 3.62% 4.82% 4.56% 10.01% MediumJPM Europe Select Equity C (dist) - GBP 9.14% 16.78% 4.12% 5.65% 5.42% 15.01% MediumJPM Europe Select Equity D (acc) - EUR 2.79% 15.71% 2.32% 1.93% 1.34% 7.85% MediumJPM Europe Select Equity D (acc) - USD 4.19% 15.18% 0.55% -0.36% 1.16% 8.86% MediumJPM Europe Select Equity I (acc) - EUR 3.26% 16.77% 3.74% 3.84% 3.25% 10.14% MediumJPM Europe Select Equity I (acc) - USD (hedged) 4.90% 18.11% 5.93% 6.60% 6.22% 14.05% MediumJPM Europe Select Equity I (dist) - EUR 5.47% 16.56% 3.57% 5.64% 4.62% 11.00% MediumJPM Europe Select Equity I2 (acc) - EUR 3.28% 16.83% 3.82% 3.95% - - MediumJPM Europe Select Equity I2 (acc) - USD 4.71% 16.30% 2.06% 1.63% - - MediumJPM Europe Select Equity I2 (acc) - USD (hedged)* - - - - - - MediumJPM Europe Select Equity I2 (dist) - EUR 5.59% 16.67% 3.68% 3.82% - - MediumJPM Europe Select Equity X (acc) - EUR 3.38% 17.06% 4.14% 4.37% 3.83% 10.90% MediumJPM Europe Select Equity X (acc) - USD (hedged) 5.04% 18.41% 6.33% 7.15% 6.83% 14.88% MediumJPM Europe Select Equity X (dist) - EUR* - - - - - - Medium
JPMorgan Investment Funds - Global Dividend FundJPM Global Dividend A (acc) - EUR 3.30% 17.59% 5.72% 9.67% 8.53% 10.92% MediumJPM Global Dividend A (acc) - EUR (hedged) 3.72% 15.56% 2.14% 5.23% 6.29% 9.70% MediumJPM Global Dividend A (acc) - USD 4.73% 17.06% 3.91% 7.21% 8.34% 11.98% MediumJPM Global Dividend A (dist) - EUR (hedged) 4.60% 15.50% 2.07% 5.17% 7.71% 10.26% MediumJPM Global Dividend A (dist) - USD 5.54% 16.99% 3.85% 8.69% 9.62% 12.44% MediumJPM Global Dividend A (div) - EUR 3.23% 17.44% 5.61% 12.06% 9.46% 11.22% MediumJPM Global Dividend A (div) - EUR (hedged) 3.66% 15.45% 2.09% 7.78% 7.34% 10.32% MediumJPM Global Dividend A (div) - USD 4.65% 16.91% 3.83% 9.71% 9.29% 12.29% MediumJPM Global Dividend A (mth) - USD (hedged) 4.52% 17.23% 4.50% 10.89% 10.53% 13.22% MediumJPM Global Dividend C (acc) - EUR 3.56% 18.17% 6.51% 10.76% 9.71% 12.26% MediumJPM Global Dividend C (acc) - USD 4.99% 17.64% 4.70% 8.28% 9.53% - MediumJPM Global Dividend C (dist) - EUR 5.37% 18.04% 6.40% 13.51% 11.02% 12.78% MediumJPM Global Dividend C (dist) - EUR (hedged) 5.89% 15.99% 2.77% 7.64% 8.90% 11.64% MediumJPM Global Dividend C (div) - EUR* - - - - - - MediumJPM Global Dividend D (acc) - EUR (hedged) 3.51% 15.13% 1.56% 4.43% 5.45% 8.74% MediumJPM Global Dividend D (acc) - USD 4.53% 16.63% 3.33% 6.42% 7.48% 10.97% MediumJPM Global Dividend D (div) - EUR (hedged) 3.46% 15.02% 1.53% 7.02% 6.55% 9.47% MediumJPM Global Dividend D (mth) - EUR (hedged) 3.51% 15.13% 1.55% 6.99% 5.30% - MediumJPM Global Dividend F (mth) - USD (hedged) 4.27% 16.67% 3.74% 7.93% - - MediumJPM Global Dividend I (acc) - EUR* - - - - - - MediumJPM Global Dividend T (acc) - EUR (hedged) 3.52% 15.13% 1.56% 4.44% 5.45% 8.74% MediumJPM Global Dividend X (acc) - USD 5.16% 18.01% 5.20% 8.99% 10.30% 14.27% MediumJPM Global Dividend X (dist) - AUD 8.82% 18.40% 8.10% 17.45% 17.26% 17.47% Medium
* Share Class inactive as at end of the period.
37
JPMorgan Investment Funds
Appendix - Unaudited Additional Disclosures (continued)
3. Performance and Volatility
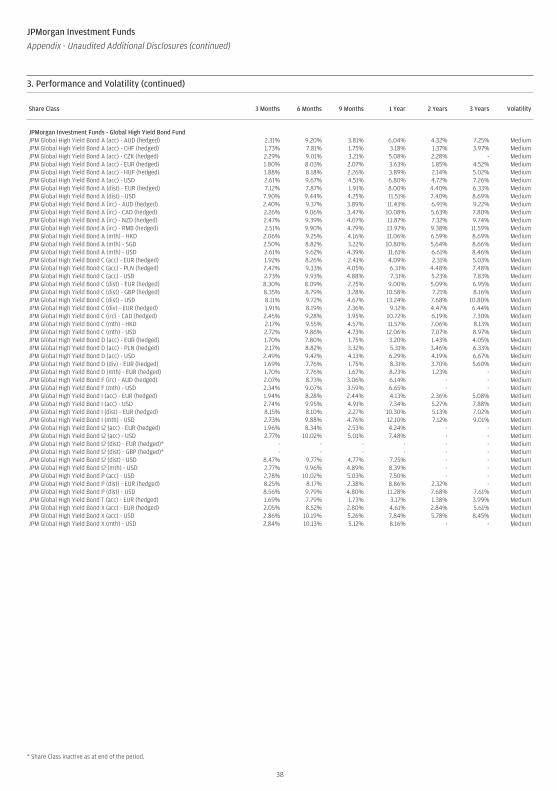
Share Class 3 Months 6 Months 9 Months 1 Year 2 Years 3 Years Volatility
JPMorgan Investment Funds - Global High Yield Bond FundJPM Global High Yield Bond A (acc) - AUD (hedged) 2.31% 9.20% 3.81% 6.04% 4.32% 7.25% MediumJPM Global High Yield Bond A (acc) - CHF (hedged) 1.73% 7.81% 1.75% 3.18% 1.37% 3.97% MediumJPM Global High Yield Bond A (acc) - CZK (hedged) 2.29% 9.01% 3.21% 5.08% 2.28% - MediumJPM Global High Yield Bond A (acc) - EUR (hedged) 1.80% 8.03% 2.07% 3.63% 1.85% 4.52% MediumJPM Global High Yield Bond A (acc) - HUF (hedged) 1.88% 8.18% 2.26% 3.89% 2.14% 5.02% MediumJPM Global High Yield Bond A (acc) - USD 2.61% 9.67% 4.51% 6.80% 4.72% 7.26% MediumJPM Global High Yield Bond A (dist) - EUR (hedged) 7.12% 7.87% 1.91% 8.00% 4.40% 6.33% MediumJPM Global High Yield Bond A (dist) - USD 7.90% 9.44% 4.25% 11.51% 7.40% 8.69% MediumJPM Global High Yield Bond A (irc) - AUD (hedged) 2.40% 9.37% 3.89% 11.43% 6.91% 9.22% MediumJPM Global High Yield Bond A (irc) - CAD (hedged) 2.26% 9.06% 3.47% 10.08% 5.63% 7.80% MediumJPM Global High Yield Bond A (irc) - NZD (hedged) 2.47% 9.39% 4.07% 11.87% 7.32% 9.74% MediumJPM Global High Yield Bond A (irc) - RMB (hedged) 2.51% 9.90% 4.79% 13.97% 9.38% 11.59% MediumJPM Global High Yield Bond A (mth) - HKD 2.06% 9.25% 4.16% 11.06% 6.59% 8.69% MediumJPM Global High Yield Bond A (mth) - SGD 2.50% 8.82% 3.22% 10.80% 5.64% 8.66% MediumJPM Global High Yield Bond A (mth) - USD 2.61% 9.62% 4.39% 11.61% 6.61% 8.46% MediumJPM Global High Yield Bond C (acc) - EUR (hedged) 1.92% 8.26% 2.41% 4.09% 2.31% 5.03% MediumJPM Global High Yield Bond C (acc) - PLN (hedged) 2.42% 9.33% 4.05% 6.31% 4.48% 7.48% MediumJPM Global High Yield Bond C (acc) - USD 2.73% 9.93% 4.88% 7.31% 5.23% 7.83% MediumJPM Global High Yield Bond C (dist) - EUR (hedged) 8.30% 8.09% 2.25% 9.00% 5.09% 6.95% MediumJPM Global High Yield Bond C (dist) - GBP (hedged) 8.35% 8.79% 3.28% 10.58% 7.21% 8.16% MediumJPM Global High Yield Bond C (dist) - USD 8.11% 9.72% 4.67% 13.24% 7.68% 10.80% MediumJPM Global High Yield Bond C (div) - EUR (hedged) 1.91% 8.19% 2.36% 9.12% 4.47% 6.44% MediumJPM Global High Yield Bond C (irc) - CAD (hedged) 2.45% 9.28% 3.95% 10.72% 6.19% 7.30% MediumJPM Global High Yield Bond C (mth) - HKD 2.17% 9.55% 4.57% 11.57% 7.06% 8.13% MediumJPM Global High Yield Bond C (mth) - USD 2.72% 9.86% 4.73% 12.06% 7.07% 8.97% MediumJPM Global High Yield Bond D (acc) - EUR (hedged) 1.70% 7.80% 1.75% 3.20% 1.43% 4.05% MediumJPM Global High Yield Bond D (acc) - PLN (hedged) 2.17% 8.82% 3.32% 5.31% 3.46% 6.33% MediumJPM Global High Yield Bond D (acc) - USD 2.49% 9.42% 4.13% 6.29% 4.19% 6.67% MediumJPM Global High Yield Bond D (div) - EUR (hedged) 1.69% 7.76% 1.75% 8.31% 3.70% 5.60% MediumJPM Global High Yield Bond D (mth) - EUR (hedged) 1.70% 7.76% 1.67% 8.23% 1.23% - MediumJPM Global High Yield Bond F (irc) - AUD (hedged) 2.07% 8.73% 3.06% 6.14% - - MediumJPM Global High Yield Bond F (mth) - USD 2.34% 9.07% 3.59% 6.65% - - MediumJPM Global High Yield Bond I (acc) - EUR (hedged) 1.94% 8.28% 2.44% 4.13% 2.36% 5.08% MediumJPM Global High Yield Bond I (acc) - USD 2.74% 9.95% 4.91% 7.34% 5.27% 7.88% MediumJPM Global High Yield Bond I (dist) - EUR (hedged) 8.15% 8.10% 2.27% 10.30% 5.13% 7.02% MediumJPM Global High Yield Bond I (mth) - USD 2.73% 9.88% 4.76% 12.10% 7.12% 9.01% MediumJPM Global High Yield Bond I2 (acc) - EUR (hedged) 1.96% 8.34% 2.53% 4.24% - - MediumJPM Global High Yield Bond I2 (acc) - USD 2.77% 10.02% 5.01% 7.48% - - MediumJPM Global High Yield Bond I2 (dist) - EUR (hedged)* - - - - - - MediumJPM Global High Yield Bond I2 (dist) - GBP (hedged)* - - - - - - MediumJPM Global High Yield Bond I2 (dist) - USD 8.47% 9.77% 4.77% 7.25% - - MediumJPM Global High Yield Bond I2 (mth) - USD 2.77% 9.96% 4.89% 8.39% - - MediumJPM Global High Yield Bond P (acc) - USD 2.78% 10.02% 5.03% 7.50% - - MediumJPM Global High Yield Bond P (dist) - EUR (hedged) 8.25% 8.17% 2.38% 8.86% 2.32% - MediumJPM Global High Yield Bond P (dist) - USD 8.56% 9.79% 4.80% 11.28% 7.68% 7.61% MediumJPM Global High Yield Bond T (acc) - EUR (hedged) 1.69% 7.79% 1.73% 3.17% 1.38% 3.99% MediumJPM Global High Yield Bond X (acc) - EUR (hedged) 2.05% 8.52% 2.80% 4.61% 2.84% 5.61% MediumJPM Global High Yield Bond X (acc) - USD 2.86% 10.19% 5.26% 7.84% 5.78% 8.45% MediumJPM Global High Yield Bond X (mth) - USD 2.84% 10.13% 5.12% 8.16% - - Medium
* Share Class inactive as at end of the period.
38
JPMorgan Investment Funds
Appendix - Unaudited Additional Disclosures (continued)
3. Performance and Volatility (continued)

Basis for Bank Interest Rates
The rates are based on the JPMorgan Chase Treasury rates and consequently may change on a daily basis. The bank interest amount is posted to each of theSICAV’s bank accounts on a monthly basis on the first business day of the subsequent month based on the bank balances from the prior month.
5. Sub-Fund Share Classes Subject to Taxe d’Abonnement Rate of 0.01%The following Sub-Fund Share Classes are subject to an asset based tax of 0.01% per annum:
6. Portfolio Turnover RatioThe Portfolio Turnover Ratio is an indicator of the relevance of the additional costs incurred by a fund when buying and selling investments according to itsinvestment policy. The Portfolio Turnover Ratio is calculated in accordance with the CSSF Circular 03/122 as outlined below:
(Total securities’ purchases and sales - total subscriptions and redemptions of Sub-Fund shares)
Average net Sub-Fund assets in Sub-Fund currency
The Portfolio Turnover Ratio is expressed as a percentage and in the case the outcome of the calculation is negative, a zero value has been published.Sub-Fund Portfolio Turnover Ratio (%)
JPMorgan Investment Funds - Europe Select Equity Fund 78.82
JPMorgan Investment Funds - Global Dividend Fund 59.30
JPMorgan Investment Funds - Global High Yield Bond Fund -
7. Calculation Method of the Risk ExposureGlobal exposure using the commitment approach
Sub-Fund Name Fund BenchmarkJPMorgan Investment Funds - Europe Select Equity Fund MSCI Europe Index (Total Return Net)
JPMorgan Investment Funds - Global Dividend Fund MSCI All Country World Index (Total Return Net)
JPMorgan Investment Funds - Global High Yield Bond Fund ICE BofAML US High Yield Constrained Index (Total Return Gross)
39
JPMorgan Investment Funds
Appendix - Unaudited Additional Disclosures (continued)
4. Interest Rate Received/(Charged) on Bank Accounts
Share Class Name
JPM Europe Select Equity I (acc) - EUR
JPM Europe Select Equity I (acc) - USD (hedged)
JPM Europe Select Equity I (dist) - EUR
JPM Europe Select Equity I2 (acc) - EUR
JPM Europe Select Equity I2 (acc) - USD
JPM Europe Select Equity I2 (dist) - EUR
JPM Europe Select Equity X (acc) - EUR
JPM Europe Select Equity X (acc) - USD (hedged)
JPM Global Dividend X (acc) - USD
JPM Global Dividend X (dist) - AUD
JPM Global High Yield Bond I (acc) - EUR (hedged)
Share Class Name
JPM Global High Yield Bond I (acc) - USD
JPM Global High Yield Bond I (dist) - EUR (hedged)
JPM Global High Yield Bond I (mth) - USD
JPM Global High Yield Bond I2 (acc) - EUR (hedged)
JPM Global High Yield Bond I2 (acc) - USD
JPM Global High Yield Bond I2 (dist) - USD
JPM Global High Yield Bond I2 (mth) - USD
JPM Global High Yield Bond X (acc) - EUR (hedged)
JPM Global High Yield Bond X (acc) - USD
JPM Global High Yield Bond X (mth) - USD

The SICAV engages in Securities Financing Transactions (as defined in Article 3 of Regulation (EU) 2015/2365, Securities Financing Transactions includerepurchase transactions, securities or commodities lending and securities or commodities borrowing, buy-sell back transactions or sell-buy backtransactions and margin lending transactions) through its exposure on securities lending transactions during the period. In accordance with Article 13 of theRegulation, the information on securities lending transactions are detailed below.
Collaterals received or granted with respect to Securities Financing Transactions are disclosed on a trade date basis of accounting.
Global Data
Amount of securities on loan
The total value of securities on loan as a proportion of the Sub-Funds’ total lendable assets as at the reporting date is detailed below. Total lendable assetsrepresents the aggregate value of asset types forming part of the Sub-Funds’ securities lending programme.Sub-Fund % of Total Lendable Assets
JPMorgan Investment Funds - Europe Select Equity Fund 2.01
JPMorgan Investment Funds - Global Dividend Fund 1.35
JPMorgan Investment Funds - Global High Yield Bond Fund 7.13
Amount of assets engaged in securities lending transactions
The following table represents the total value of assets engaged in securities lending as at the reporting date.
Sub-Fund Sub-Fund CurrencyMarket Value of Securities
on Loan (in Sub-Fund Currency) % of AUM
JPMorgan Investment Funds - Europe Select Equity Fund EUR 22,318,894 1.96
JPMorgan Investment Funds - Global Dividend Fund USD 2,396,962 1.29
JPMorgan Investment Funds - Global High Yield Bond Fund USD 446,559,796 6.98
Concentration Data
Ten largest collateral issuers
The following table lists the ten largest issuers by value of non-cash collaterals received by the Sub-Funds across securities lending as at the reporting date:JPMorgan Investment Funds - Europe Select Equity Fund JPMorgan Investment Funds - Global High Yield Bond Fund
IssuerNon-Cash Collateral Value
EUR IssuerNon-Cash Collateral Value
USDAustria Government 9,600,148 US Treasury 176,622,554
UK Treasury 7,490,545 UK Treasury 54,670,757
France Government 7,012,716 France Government 19,573,371
US Treasury 1,392,318 Netherlands Government 6,408,858
Belgium Government 952,696 Finland Government 810,877
Netherlands Government 257,485 Austria Government 741,982
Germany Government 19
In cases where less than 10 issuers are disclosed, a total of less than 10 issuers is available for that Sub-Fund.
Top ten counterparties
As disclosed in Note 9, JPMorgan Chase Bank, N.A. is the only counterparty in respect of securities lending transactions as at the reporting date.
Aggregate Transaction Data
Type and quality of non-cash collateral
Collaterals received by the Sub-Funds in respect of securities lending as at the reporting date are in the form of debt securities having investment gradecredit rating.
Sub-Fund Sub-Fund CurrencyNon-cash Collateral
(in Sub-Fund Currency)% of Non-Cash Collateral
deemed Investment Grade
JPMorgan Investment Funds - Europe Select Equity Fund EUR 26,705,927 100.00
JPMorgan Investment Funds - Global High Yield Bond Fund USD 258,828,399 100.00
40
JPMorgan Investment Funds
Appendix - Unaudited Additional Disclosures (continued)
8. Securities Financing Transactions

Maturity tenor of collateral
The following table provides an analysis of the maturity tenor of collaterals received in relation securities lending transactions as at the reporting date.
JPMorgan Investment Funds -Europe Select Equity Fund
JPMorgan Investment Funds -Global Dividend Fund
JPMorgan Investment Funds -Global High Yield Bond Fund
Maturity EUR USD USD
Cash
less than 1 day - 2,517,140 204,885,006
Non-Cash
1 to 7 days - - -
1 to 4 weeks 917,339 - 831,801
1 to 3 months 280,272 - 1,282,869
3 to 12 months 46,869 - 34,362,945
more than 1 year 25,461,447 - 222,350,784
26,705,927 2,517,140 463,713,405
Currency of collateral
The following table provides currency of collaterals received in relation to securities lending transactions as at the reporting date.Collateral Value (in Sub-Fund Currency)
Sub-FundSub-FundCurrency EUR GBP USD JPY Total
JPMorgan Investment Funds - Europe Select Equity Fund EUR 17,823,063 7,490,545 1,392,319 - 26,705,927
JPMorgan Investment Funds - Global Dividend Fund USD - - 2,517,140 - 2,517,140
JPMorgan Investment Funds - Global High Yield Bond Fund USD 27,535,088 54,670,757 381,507,560 - 463,713,405
Maturity tenor of securities lending agreements
The SICAV’s securities lending transactions have open maturity.
Country in which counterparties are established
JPMorgan Chase Bank, N.A. was incorporated in United States of America.
Settlement and clearing
All Sub-Funds engaged in securities lending agreements utilise bi-lateral settlement and clearing with their respective counterparty.
Reuse of collateral
Share of collateral received that is reused and reinvestment return
Non-cash collateral received by way of title transfer collateral arrangement in relation to securities lending transactions, reverse repurchase agreementsand OTC derivative transactions, cannot be sold, reinvested or pledged.
Securities lending transactions
As at the period end, all of the cash collateral received in respect of securities lending was re-invested into Reverse Repurchase Transactions with highquality government bonds as collateral. This is managed by the Securities Lending Agent based solely on the approved guidelines and agreement issued byJPMorgan Asset Management (Europe) S.à r.l..
Income earned by the SICAV from the reinvestment of cash collateral in the form of Reverse Repurchase Transactions, net of any interest payable to therelevant counterparty, amounted to USD 1,974,109 for the period ended 30 June 2019 and is recorded under the “Securities Lending Income” in theCombined Statement of Operations and Changes in Net Assets.
Details relating to the permitted reuse of cash collateral are disclosed in the latest Prospectus available from http://www.jpmorganassetmanagement.lu.
41
JPMorgan Investment Funds
Appendix - Unaudited Additional Disclosures (continued)
8. Securities Financing Transactions (continued)

Safekeeping of Collateral
Collateral received
The following tables provide an analysis of collateral received held at each custodian as at the reporting date:
Securities lending transactions
Sub-Fund Custodian Sub-Fund CurrencyCollateral Value
(in Sub-Fund Currency)
JPMorgan Investment Funds - Europe Select Equity Fund JPMorgan Bank Luxembourg S.A. EUR 26,705,927
JPMorgan Investment Funds - Global Dividend Fund JPMorgan Bank Luxembourg S.A. USD 2,517,140
JPMorgan Investment Funds - Global High Yield Bond Fund JPMorgan Bank Luxembourg S.A. USD 463,713,405
Collateral granted
As at the reporting date, there was no collateral granted with respect to securities lending transactions.
Return and cost
The total income earned from securities lending transactions is split between the relevant Sub-Funds and the securities lending agent. Detail of this split isdisclosed in Note 9 to the financial statements.
42
JPMorgan Investment Funds
Appendix - Unaudited Additional Disclosures (continued)
8. Securities Financing Transactions (continued)

JPMorgan Asset Management (Europe) S.à r.l. (the “Management Company”) is the authorised manager of JPMorgan Investment Funds (the “Company”)and is part of the J.P. Morgan Chase & Co. group of companies. In this section, the terms “J.P. Morgan” or “Firm” refer to that group, and each of the entities inthat group globally, unless otherwise specified.
This section of the semi-annual report has been prepared in accordance with the Undertakings for Collective Investment in Transferable Securities (the“UCITS Directive”) and the ‘Guidelines on sound remuneration policies’ issued by the European Securities and Markets Authority under the UCITS Directive.The information in this section is in respect of the most recent complete remuneration period (“Performance Year”) as at the reporting date.
Remuneration Policy
A summary of the Remuneration Policy applying to the Management Company (the “Remuneration Policy Statement”) can be found athttp://www.jpmorganassetmanagement.lu/legal/emea-remuneration-policy. This Remuneration Policy Statement includes details of how remunerationand benefits are calculated, including the financial and non-financial criteria used to evaluate performance, the responsibilities and composition of theFirm’s Compensation and Management Development Committee, and the measures adopted to avoid or manage conflicts of interest. A copy of this policycan be requested free of charge from the Management Company.
The Remuneration Policy applies to all employees of the Management Company, including individuals whose professional activities may have a materialimpact on the risk profile of the Management Company or the UCITS Funds it manages (“UCITS Identified Staff”). The UCITS Identified Staff include membersof the Board of the Management Company (the “Board”), senior management, the heads of relevant Control Functions, and holders of other key functions.Individuals are notified of their identification and the implications of this status on at least an annual basis.
The Board reviews and adopts the Remuneration Policy on an annual basis, and oversees its implementation, including the classification of UCITS IdentifiedStaff. The Board last reviewed and adopted the Remuneration Policy that applied to the 2018 Performance Year in June 2018 with no material changes andwas satisfied with its implementation.
Quantitative Disclosures
The table below provides an overview of the aggregate total remuneration paid to staff of the Management Company in respect of the 2018 PerformanceYear and the number of beneficiaries.
Due to the Firm’s operational structure, the information needed to provide a further breakdown of remuneration attributable to the Company is not readilyavailable and would not be relevant or reliable. However, for context, the Management Company manages 3 Alternative Investment Funds (with8 Sub-Funds) and 7 UCITS (with 161 Sub-Funds) as at 30 June 2019, with a combined AUM as at that date of USD 2,121m and USD 316,230m respectively.
Fixed remuneration Variable remuneration Total remuneration Number of beneficiaries
All staff (USD ‘000s) 45,003 22,256 67,259 331
The aggregate total remuneration paid to UCITS Identified Staff in respect of the 2018 Performance Year was USD 130,876k, of which USD 9,240k relates toSenior Management and USD 121,636k relates to other UCITS Identified Staff(1).
(1) Since 2017, the UCITS Identified Staff disclosures includes employees of companies to which portfolio management has been formally delegated, in line with the latest ESMA guidance.
43
JPMorgan Investment Funds
Appendix - Unaudited Additional Disclosures (continued)
9. UCITS Remuneration Disclosures

JPMorgan Investment Funds
Appendix - Unaudited Additional Disclosures (continued)
10. Historical Statement of Changes in the Number of Shares (continued)
Shares Outstandingat the Beginning
of the Year
Shares Subscribed Shares Redeemed Shares Outstandingat the End
of the Year
For the year ended 31 December 2018 (continued)
JPMorgan Investment Funds - Europe Select Equity FundJPM Europe Select Equity A (acc) - CZK - 76.475 1.000 75.475JPM Europe Select Equity A (acc) - EUR 270,547.484 27,622.026 126,441.136 171,728.374JPM Europe Select Equity A (acc) - USD 33,173.026 3,181.213 3,142.420 33,211.819JPM Europe Select Equity A (dist) - EUR 108,841.377 18,980.091 55,082.778 72,738.690JPM Europe Select Equity A (dist) - GBP - 1,333.798 22.177 1,311.621JPM Europe Select Equity C (acc) - EUR 1,551,482.121 572,795.080 1,319,003.669 805,273.532JPM Europe Select Equity C (acc) - USD 130,235.184 182,896.339 112,965.594 200,165.929JPM Europe Select Equity C (dist) - EUR 16,473.395 1,990.348 550.456 17,913.287JPM Europe Select Equity C (dist) - GBP 10,999.784 15,906.070 7,642.923 19,262.931JPM Europe Select Equity D (acc) - EUR 94,734.890 68,966.185 52,937.277 110,763.798JPM Europe Select Equity D (acc) - USD 9.805 0.001 - 9.806JPM Europe Select Equity I (acc) - EUR 2,773,985.247 494,692.829 2,256,103.149 1,012,574.927JPM Europe Select Equity I (acc) - USD* 17,748.881 - 17,748.881 -JPM Europe Select Equity I (acc) - USD (hedged) 129,822.059 8,078.001 101,875.792 36,024.268JPM Europe Select Equity I (dist) - EUR 458,548.778 10,046.753 464,303.663 4,291.868JPM Europe Select Equity I2 (acc) - EUR 10.000 5,461,675.989 4,168,870.512 1,292,815.477JPM Europe Select Equity I2 (acc) - USD 10.000 35,638.239 11,115.244 24,532.995JPM Europe Select Equity I2 (acc) - USD (hedged) 10.000 59,059.914 55,732.337 3,337.577JPM Europe Select Equity I2 (dist) - EUR 10.000 724,387.060 630,520.431 93,876.629JPM Europe Select Equity X (acc) - EUR 809,590.251 186,435.676 337,604.576 658,421.351JPM Europe Select Equity X (acc) - USD (hedged) 610,100.573 110,946.000 7,592.000 713,454.573JPM Europe Select Equity X (dist) - EUR 36,680.844 1,471.266 25,159.483 12,992.627
JPMorgan Investment Funds - Global Dividend FundJPM Global Dividend A (acc) - EUR 29,847.372 8,185.351 4,521.142 33,511.581JPM Global Dividend A (acc) - EUR (hedged) 38,093.941 38,552.889 28,745.830 47,901.000JPM Global Dividend A (acc) - USD 90,578.730 204,983.065 159,788.178 135,773.617JPM Global Dividend A (dist) - EUR (hedged) 1,603.000 301.000 - 1,904.000JPM Global Dividend A (dist) - USD 75,987.164 10,714.581 17,666.915 69,034.830JPM Global Dividend A (div) - EUR 42,174.520 33,315.834 9,952.126 65,538.228JPM Global Dividend A (div) - EUR (hedged) 15,563.010 11,704.908 4,980.320 22,287.598JPM Global Dividend A (div) - USD 12,770.059 723.201 866.389 12,626.871JPM Global Dividend A (mth) - USD (hedged) 4,054.309 101,581.612 72,156.186 33,479.735JPM Global Dividend C (acc) - EUR 25,884.211 16,129.625 11,878.508 30,135.328JPM Global Dividend C (acc) - USD 8,640.295 5,939.053 3,029.166 11,550.182JPM Global Dividend C (dist) - EUR 885.000 255.570 360.000 780.570JPM Global Dividend C (dist) - EUR (hedged) 1,709.000 1,931.000 1,458.000 2,182.000JPM Global Dividend C (div) - EUR** - 1,984.144 - 1,984.144JPM Global Dividend D (acc) - EUR (hedged) 189,972.202 97,470.965 56,948.925 230,494.242JPM Global Dividend D (acc) - USD 75,865.125 16,099.945 32,863.464 59,101.606JPM Global Dividend D (div) - EUR (hedged) 405,854.861 240,215.398 112,190.928 533,879.331JPM Global Dividend D (mth) - EUR (hedged) 7,276.276 12,880.230 3,550.265 16,606.241JPM Global Dividend F (mth) - USD (hedged) 20.000 300,307.205 117,893.611 182,433.594JPM Global Dividend I (acc) - EUR 56,720.643 - 28,771.555 27,949.088JPM Global Dividend T (acc) - EUR (hedged) 70,696.728 44,211.313 12,473.194 102,434.847JPM Global Dividend X (acc) - EUR (hedged)* 505.542 - 505.542 -JPM Global Dividend X (acc) - USD 2,895.708 331.406 762.473 2,464.641JPM Global Dividend X (dist) - AUD 52,992.849 1,620.051 576.615 54,036.285
* Share Class inactive as at end of the year.** Share Class reactivated during the year.
44
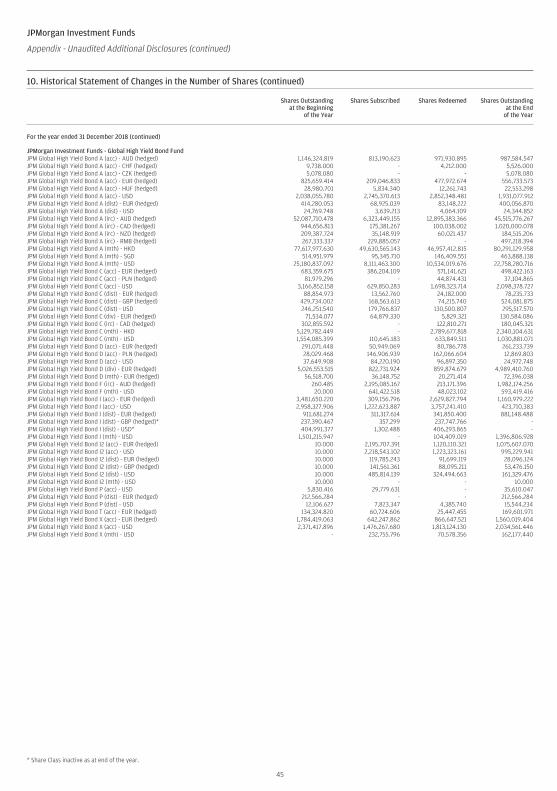
JPMorgan Investment Funds
Appendix - Unaudited Additional Disclosures (continued)
10. Historical Statement of Changes in the Number of Shares (continued)
Shares Outstandingat the Beginning
of the Year
Shares Subscribed Shares Redeemed Shares Outstandingat the End
of the Year
For the year ended 31 December 2018 (continued)
JPMorgan Investment Funds - Global High Yield Bond FundJPM Global High Yield Bond A (acc) - AUD (hedged) 1,146,324.819 813,190.623 971,930.895 987,584.547JPM Global High Yield Bond A (acc) - CHF (hedged) 9,738.000 - 4,212.000 5,526.000JPM Global High Yield Bond A (acc) - CZK (hedged) 5,078.080 - - 5,078.080JPM Global High Yield Bond A (acc) - EUR (hedged) 825,659.414 209,046.833 477,972.674 556,733.573JPM Global High Yield Bond A (acc) - HUF (hedged) 28,980.701 5,834.340 12,261.743 22,553.298JPM Global High Yield Bond A (acc) - USD 2,038,055.780 2,745,370.613 2,852,348.481 1,931,077.912JPM Global High Yield Bond A (dist) - EUR (hedged) 414,280.053 68,925.039 83,148.222 400,056.870JPM Global High Yield Bond A (dist) - USD 24,769.748 3,639.213 4,064.109 24,344.852JPM Global High Yield Bond A (irc) - AUD (hedged) 52,087,710.478 6,323,449.155 12,895,383.366 45,515,776.267JPM Global High Yield Bond A (irc) - CAD (hedged) 944,656.813 175,381.267 100,038.002 1,020,000.078JPM Global High Yield Bond A (irc) - NZD (hedged) 209,387.724 35,148.919 60,021.437 184,515.206JPM Global High Yield Bond A (irc) - RMB (hedged) 267,333.337 229,885.057 - 497,218.394JPM Global High Yield Bond A (mth) - HKD 77,617,977.630 49,630,565.143 46,957,412.815 80,291,129.958JPM Global High Yield Bond A (mth) - SGD 514,951.979 95,345.710 146,409.551 463,888.138JPM Global High Yield Bond A (mth) - USD 25,180,837.092 8,111,463.300 10,534,019.676 22,758,280.716JPM Global High Yield Bond C (acc) - EUR (hedged) 683,359.675 386,204.109 571,141.621 498,422.163JPM Global High Yield Bond C (acc) - PLN (hedged) 81,979.296 - 44,874.431 37,104.865JPM Global High Yield Bond C (acc) - USD 3,166,852.158 629,850.283 1,698,323.714 2,098,378.727JPM Global High Yield Bond C (dist) - EUR (hedged) 88,854.973 13,562.760 24,182.000 78,235.733JPM Global High Yield Bond C (dist) - GBP (hedged) 429,734.002 168,563.613 74,215.740 524,081.875JPM Global High Yield Bond C (dist) - USD 246,251.540 179,766.837 130,500.807 295,517.570JPM Global High Yield Bond C (div) - EUR (hedged) 71,534.077 64,879.330 5,829.321 130,584.086JPM Global High Yield Bond C (irc) - CAD (hedged) 302,855.592 - 122,810.271 180,045.321JPM Global High Yield Bond C (mth) - HKD 5,129,782.449 - 2,789,677.818 2,340,104.631JPM Global High Yield Bond C (mth) - USD 1,554,085.399 110,645.183 633,849.511 1,030,881.071JPM Global High Yield Bond D (acc) - EUR (hedged) 291,071.448 50,949.069 80,786.778 261,233.739JPM Global High Yield Bond D (acc) - PLN (hedged) 28,029.468 146,906.939 162,066.604 12,869.803JPM Global High Yield Bond D (acc) - USD 37,649.908 84,220.190 96,897.350 24,972.748JPM Global High Yield Bond D (div) - EUR (hedged) 5,026,553.515 822,731.924 859,874.679 4,989,410.760JPM Global High Yield Bond D (mth) - EUR (hedged) 56,518.700 36,148.752 20,271.414 72,396.038JPM Global High Yield Bond F (irc) - AUD (hedged) 260.485 2,195,085.167 213,171.396 1,982,174.256JPM Global High Yield Bond F (mth) - USD 20.000 641,422.518 48,023.102 593,419.416JPM Global High Yield Bond I (acc) - EUR (hedged) 3,481,650.220 309,156.796 2,629,827.794 1,160,979.222JPM Global High Yield Bond I (acc) - USD 2,958,327.906 1,222,623.887 3,757,241.410 423,710.383JPM Global High Yield Bond I (dist) - EUR (hedged) 911,681.274 311,317.614 341,850.400 881,148.488JPM Global High Yield Bond I (dist) - GBP (hedged)* 237,390.467 357.299 237,747.766 -JPM Global High Yield Bond I (dist) - USD* 404,991.377 1,302.488 406,293.865 -JPM Global High Yield Bond I (mth) - USD 1,501,215.947 - 104,409.019 1,396,806.928JPM Global High Yield Bond I2 (acc) - EUR (hedged) 10.000 2,195,707.391 1,120,110.321 1,075,607.070JPM Global High Yield Bond I2 (acc) - USD 10.000 2,218,543.102 1,223,323.161 995,229.941JPM Global High Yield Bond I2 (dist) - EUR (hedged) 10.000 119,785.243 91,699.119 28,096.124JPM Global High Yield Bond I2 (dist) - GBP (hedged) 10.000 141,561.361 88,095.211 53,476.150JPM Global High Yield Bond I2 (dist) - USD 10.000 485,814.139 324,494.663 161,329.476JPM Global High Yield Bond I2 (mth) - USD 10.000 - - 10.000JPM Global High Yield Bond P (acc) - USD 5,830.416 29,779.631 - 35,610.047JPM Global High Yield Bond P (dist) - EUR (hedged) 212,566.284 - - 212,566.284JPM Global High Yield Bond P (dist) - USD 12,106.627 7,823.347 4,385.740 15,544.234JPM Global High Yield Bond T (acc) - EUR (hedged) 134,324.820 60,724.606 25,447.455 169,601.971JPM Global High Yield Bond X (acc) - EUR (hedged) 1,784,419.063 642,247.862 866,647.521 1,560,019.404JPM Global High Yield Bond X (acc) - USD 2,371,417.896 1,476,267.680 1,813,124.130 2,034,561.446JPM Global High Yield Bond X (mth) - USD - 232,755.796 70,578.356 162,177.440
* Share Class inactive as at end of the year.
45

JPMorgan Investment Funds
Appendix - Unaudited Additional Disclosures (continued)
10. Historical Statement of Changes in the Number of Shares (continued)
Shares Outstandingat the Beginning
of the Year
Shares Subscribed Shares Redeemed Shares Outstandingat the End
of the Year
For the year ended 31 December 2017 (continued)
JPMorgan Investment Funds - Europe Select Equity FundJPM Europe Select Equity A (acc) - EUR 192,251.949 244,817.268 166,521.733 270,547.484JPM Europe Select Equity A (acc) - USD 61,958.369 585.557 29,370.900 33,173.026JPM Europe Select Equity A (dist) - EUR 95,721.240 31,811.888 18,691.751 108,841.377JPM Europe Select Equity C (acc) - EUR 1,432,856.715 1,262,294.896 1,143,669.490 1,551,482.121JPM Europe Select Equity C (acc) - USD 11,017.525 189,486.834 70,269.175 130,235.184JPM Europe Select Equity C (dist) - EUR 10.000 16,473.395 10.000 16,473.395JPM Europe Select Equity C (dist) - GBP 12,391.524 - 1,391.740 10,999.784JPM Europe Select Equity D (acc) - EUR 81,481.688 48,850.153 35,596.951 94,734.890JPM Europe Select Equity D (acc) - USD 18.751 5.495 14.441 9.805JPM Europe Select Equity I (acc) - EUR 2,174,357.832 1,493,182.685 893,555.270 2,773,985.247JPM Europe Select Equity I (acc) - USD 20,466.800 3,786.753 6,504.672 17,748.881JPM Europe Select Equity I (acc) - USD (hedged) 85,791.019 101,518.911 57,487.871 129,822.059JPM Europe Select Equity I (dist) - EUR 472,407.769 176,994.394 190,853.385 458,548.778JPM Europe Select Equity I2 (acc) - EUR - 10.000 - 10.000JPM Europe Select Equity I2 (acc) - USD - 10.000 - 10.000JPM Europe Select Equity I2 (acc) - USD (hedged) - 10.000 - 10.000JPM Europe Select Equity I2 (dist) - EUR - 10.000 - 10.000JPM Europe Select Equity X (acc) - EUR 646,800.098 397,417.665 234,627.512 809,590.251JPM Europe Select Equity X (acc) - USD (hedged) 493,000.573 367,244.000 250,144.000 610,100.573JPM Europe Select Equity X (dist) - EUR 44,378.600 8,499.586 16,197.342 36,680.844
JPMorgan Investment Funds - Global Dividend FundJPM Global Dividend A (acc) - EUR 39,440.783 16,836.873 26,430.284 29,847.372JPM Global Dividend A (acc) - EUR (hedged) 18,579.339 26,852.384 7,337.782 38,093.941JPM Global Dividend A (acc) - USD 112,360.679 8,498.862 30,280.811 90,578.730JPM Global Dividend A (dist) - EUR (hedged)^ 48.673 1,563.000 8.673 1,603.000JPM Global Dividend A (dist) - USD^ 76,928.070 12,332.366 13,273.272 75,987.164JPM Global Dividend A (div) - EUR 39,026.462 15,415.637 12,267.579 42,174.520JPM Global Dividend A (div) - EUR (hedged) 11,431.508 6,414.917 2,283.415 15,563.010JPM Global Dividend A (div) - USD 14,650.716 941.909 2,822.566 12,770.059JPM Global Dividend A (mth) - USD (hedged) 4,081.633 6,352.603 6,379.927 4,054.309JPM Global Dividend C (acc) - EUR 12,589.780 44,812.925 31,518.494 25,884.211JPM Global Dividend C (acc) - USD 1,353.074 54,265.654 46,978.433 8,640.295JPM Global Dividend C (dist) - EUR 841.073 525.000 481.073 885.000JPM Global Dividend C (dist) - EUR (hedged)^ 1,801.488 1,127.000 1,219.488 1,709.000JPM Global Dividend C (div) - EUR* 8,580.000 - 8,580.000 -JPM Global Dividend D (acc) - EUR (hedged) 167,248.962 83,132.034 60,408.794 189,972.202JPM Global Dividend D (acc) - USD 66,265.676 34,850.269 25,250.820 75,865.125JPM Global Dividend D (div) - EUR (hedged) 307,308.400 209,604.539 111,058.078 405,854.861JPM Global Dividend D (mth) - EUR (hedged) - 7,891.643 615.367 7,276.276JPM Global Dividend F (mth) - USD (hedged) - 20.000 - 20.000JPM Global Dividend I (acc) - EUR** - 56,720.643 - 56,720.643JPM Global Dividend I (dist) - EUR (hedged)*^ 9.948 - 9.948 -JPM Global Dividend T (acc) - EUR (hedged) 24,123.280 57,603.718 11,030.270 70,696.728JPM Global Dividend X (acc) - EUR (hedged) 1,328.492 - 822.950 505.542JPM Global Dividend X (acc) - USD 1,534.856 1,370.764 9.912 2,895.708JPM Global Dividend X (dist) - AUD 52,014.140 2,210.500 1,231.791 52,992.849
* Share Class inactive as at end of the year.** Share Class reactivated during the year.^ Share Class renamed from “(inc)” to “(dist)” Share Class with the same Sub-Fund.
46

JPMorgan Investment Funds
Appendix - Unaudited Additional Disclosures (continued)
10. Historical Statement of Changes in the Number of Shares (continued)
Shares Outstandingat the Beginning
of the Year
Shares Subscribed Shares Redeemed Shares Outstandingat the End
of the Year
For the year ended 31 December 2017 (continued)
JPMorgan Investment Funds - Global High Yield Bond FundJPM Global High Yield Bond A (acc) - AUD (hedged) 750,050.990 2,356,958.944 1,960,685.115 1,146,324.819JPM Global High Yield Bond A (acc) - CHF (hedged) 17,426.000 2,557.000 10,245.000 9,738.000JPM Global High Yield Bond A (acc) - CZK (hedged) - 5,078.080 - 5,078.080JPM Global High Yield Bond A (acc) - EUR (hedged) 349,887.320 660,767.297 184,995.203 825,659.414JPM Global High Yield Bond A (acc) - HUF (hedged) 22,752.082 12,101.383 5,872.764 28,980.701JPM Global High Yield Bond A (acc) - USD 3,042,864.958 2,405,843.402 3,410,652.580 2,038,055.780JPM Global High Yield Bond A (dist) - EUR (hedged)^ 338,942.442 175,652.082 100,314.471 414,280.053JPM Global High Yield Bond A (dist) - USD 38,602.044 4,999.821 18,832.117 24,769.748JPM Global High Yield Bond A (irc) - AUD (hedged) 60,464,522.025 17,426,421.222 25,803,232.769 52,087,710.478JPM Global High Yield Bond A (irc) - CAD (hedged) 1,286,294.017 149,714.660 491,351.864 944,656.813JPM Global High Yield Bond A (irc) - NZD (hedged) 153,450.480 143,537.262 87,600.018 209,387.724JPM Global High Yield Bond A (irc) - RMB (hedged) 216,850.840 50,482.497 - 267,333.337JPM Global High Yield Bond A (mth) - HKD 69,952,794.905 77,579,020.813 69,913,838.088 77,617,977.630JPM Global High Yield Bond A (mth) - SGD 403,712.572 211,101.986 99,862.579 514,951.979JPM Global High Yield Bond A (mth) - USD 27,468,959.753 8,952,929.212 11,241,051.873 25,180,837.092JPM Global High Yield Bond C (acc) - EUR (hedged) 1,041,180.562 389,144.447 746,965.334 683,359.675JPM Global High Yield Bond C (acc) - PLN (hedged) 28,889.877 69,196.595 16,107.176 81,979.296JPM Global High Yield Bond C (acc) - USD 2,529,578.231 2,171,224.256 1,533,950.329 3,166,852.158JPM Global High Yield Bond C (dist) - EUR (hedged) 13,658.882 86,639.655 11,443.564 88,854.973JPM Global High Yield Bond C (dist) - GBP (hedged) 515,540.235 89,685.621 175,491.854 429,734.002JPM Global High Yield Bond C (dist) - USD 141,771.498 181,443.782 76,963.740 246,251.540JPM Global High Yield Bond C (div) - EUR (hedged) 42,562.322 35,446.801 6,475.046 71,534.077JPM Global High Yield Bond C (inc) - EUR (hedged)*** 42,063.702 8,800.000 50,863.702 -JPM Global High Yield Bond C (irc) - CAD (hedged) 147,674.923 155,180.669 - 302,855.592JPM Global High Yield Bond C (irc) - RMB (hedged)* 639.280 - 639.280 -JPM Global High Yield Bond C (mth) - HKD 774.606 5,129,782.449 774.606 5,129,782.449JPM Global High Yield Bond C (mth) - USD 1,014,025.253 826,375.715 286,315.569 1,554,085.399JPM Global High Yield Bond D (acc) - EUR (hedged) 232,309.408 132,159.547 73,397.507 291,071.448JPM Global High Yield Bond D (acc) - PLN (hedged) 24,977.373 367,850.426 364,798.331 28,029.468JPM Global High Yield Bond D (acc) - USD 86,996.754 226,780.422 276,127.268 37,649.908JPM Global High Yield Bond D (div) - EUR (hedged) 2,740,356.023 2,844,456.091 558,258.599 5,026,553.515JPM Global High Yield Bond D (mth) - EUR (hedged) - 59,224.663 2,705.963 56,518.700JPM Global High Yield Bond F (irc) - AUD (hedged) - 260.485 - 260.485JPM Global High Yield Bond F (mth) - USD - 20.000 - 20.000JPM Global High Yield Bond I (acc) - EUR (hedged) 3,203,010.326 2,386,690.085 2,108,050.191 3,481,650.220JPM Global High Yield Bond I (acc) - USD 2,695,924.313 3,117,119.147 2,854,715.554 2,958,327.906JPM Global High Yield Bond I (dist) - EUR (hedged) 77,638.548 999,083.264 165,040.538 911,681.274JPM Global High Yield Bond I (dist) - GBP (hedged) 204,120.662 165,475.357 132,205.552 237,390.467JPM Global High Yield Bond I (dist) - USD 702,812.985 211,966.539 509,788.147 404,991.377JPM Global High Yield Bond I (inc) - EUR (hedged)*** 943,604.837 196,297.482 1,139,902.319 -JPM Global High Yield Bond I (mth) - USD 1,856,512.894 20,052.187 375,349.134 1,501,215.947JPM Global High Yield Bond I2 (acc) - EUR (hedged) - 10.000 - 10.000JPM Global High Yield Bond I2 (acc) - USD - 10.000 - 10.000JPM Global High Yield Bond I2 (dist) - EUR (hedged) - 10.000 - 10.000JPM Global High Yield Bond I2 (dist) - GBP (hedged) - 10.000 - 10.000JPM Global High Yield Bond I2 (dist) - USD - 10.000 - 10.000JPM Global High Yield Bond I2 (mth) - USD - 10.000 - 10.000JPM Global High Yield Bond P (acc) - USD - 5,830.416 - 5,830.416JPM Global High Yield Bond P (dist) - EUR (hedged) - 212,566.284 - 212,566.284JPM Global High Yield Bond P (dist) - USD 12,660.731 8,547.739 9,101.843 12,106.627JPM Global High Yield Bond T (acc) - EUR (hedged) 53,341.000 103,847.772 22,863.952 134,324.820JPM Global High Yield Bond V (acc) - USD (hedged to BRL)* 35,905.262 - 35,905.262 -JPM Global High Yield Bond X (acc) - EUR (hedged) 1,731,597.610 717,945.329 665,123.876 1,784,419.063JPM Global High Yield Bond X (acc) - USD 2,785,059.305 1,267,470.854 1,681,112.263 2,371,417.896JPM Global High Yield Bond X (dist) - USD* 10.000 - 10.000 -
* Share Class inactive as at end of the year.*** Share Class closed as at the end of the year. With respect to Share Classes “(inc)” these were merged into the equivalent “(dist)” Share Classes within the same Sub-Fund.^ Share Class renamed from “(inc)” to “(dist)” Share Class with the same Sub-Fund.
47

Language Disclaimer Semi-Annual
This page has been left blank intentionally


www.jpmorganam.com.hk
FR/DP/0819(HK version)

Audited Annual Report – 31 December 2018
JPMorgan Investment FundsSICAV Range

This report is an abridged version of the audited annual report established in conformity with the Luxembourg Law of 17 December 2010 on Undertakings for Collective Investment. The complete version is available on request from the Company’s registered office in Luxembourg and from JPMorgan Funds (Asia) Limited.
This report does not constitute an offer of shares. Subscriptions are only valid if made on the basis of the current Hong Kong Offering Document which is available free of charge on request, supplemented by the most recent audited annual report of the Fund and any subsequent unaudited semi-annual report, from JPMorgan Funds (Asia) Limited.
Certain of the sub-funds of the Fund are not authorised for offer or distribution in or from Hong Kong. Accordingly, no reference is made to these sub-funds in this audited annual report. The attention of the investors is drawn to the fact that certain figures in this audited annual report are expressed on a consolidated basis and, thus, include the assets of those sub-funds which are not registered in Hong Kong.

JPMorgan Investment Funds
Audited Annual Report
As at 31 December 2018
Contents
Board of Directors 1Management and Administration 2Board of Directors’ Report 3Investment Managers’ Report 7Audit Report 8
Financial Statements and Statistical InformationCombined Statement of Net Assets 11Combined Statement of Operations and Changes in Net Assets 12Statement of Changes in the Number of Shares 13Statistical Information 15
Notes to the Financial Statements 17
Schedule of InvestmentsJPMorgan Investment Funds - Europe Select Equity Fund 25JPMorgan Investment Funds - Global Dividend Fund 28JPMorgan Investment Funds - Global High Yield Bond Fund 32
Appendix - Unaudited Additional Disclosures1. Total Expense Ratios 412. Summary of Investment Objectives of the Sub-Funds 433. Performance and Volatility 444. Interest Rate Received/(Charged) on Bank Accounts 555. Sub-Fund Share Classes Subject to Taxe d’Abonnement Rate of 0.01% 556. Portfolio Turnover Ratio 467. Calculation Method of the Risk Exposure 468. Securities Financing Transactions 479. UCITS Remuneration Disclosures 4910. Historical Statement of Changes in the Number of Shares 50
JPMorgan Investment Funds
Board of Directors
ChairmanIain O.S. SaundersDuine, ArdfernArgyll PA31 8QNUnited Kingdom
DirectorsJacques ElvingerElvinger Hoss Prussen, Société anonyme2, place Winston ChurchillB.P. 425, L-2014 LuxembourgGrand Duchy of Luxembourg
Massimo GrecoJPMorgan Asset Management (UK) Limited60 Victoria EmbankmentLondon EC4Y 0JPUnited Kingdom
John Li How CheongThe Directors’ Office19, rue de BitbourgL-1273 LuxembourgGrand Duchy of Luxembourg
Registered Office6, route de TrèvesL-2633 SenningerbergGrand Duchy of Luxembourg
Peter Thomas SchwichtHumboldtstraße 17D-60318 Frankfurt am MainGermany
Susanne van DootinghNekkedelle 6B-3090 OverijseBelgium
Daniel WatkinsJF Asset Management LimitedLevel 21, Chater House8 Connaught Road, Central99077 Hong Kong
1

JPMorgan Investment Funds
Management and Administration
Management Company, Registrar and Transfer Agent,Global Distributor and Domiciliary AgentJPMorgan Asset Management (Europe) S.à r.l.6, route de TrèvesL-2633 SenningerbergGrand Duchy of Luxembourg
Investment ManagersJPMorgan Asset Management (UK) Limited60 Victoria EmbankmentLondon EC4Y 0JPUnited Kingdom
J.P. Morgan Investment Management Inc.270 Park AvenueNew York, NY 10017United States of America
JPMorgan Asset Management (Japan) LimitedTokyo Building 7-3, Marunouchi 2-chome, Chiyoda-kuTokyo 100-6432Japan
JF Asset Management Limited21st Floor, Chater House8 Connaught Road CentralHong Kong
Depositary, Corporate, Administrative and Listing AgentJ.P. Morgan Bank Luxembourg S.A.6, route de TrèvesL-2633 SenningerbergGrand Duchy of Luxembourg
Independent AuditorPricewaterhouseCoopers, Société coopérative2, rue Gerhard MercatorB.P. 1443, L-1014 LuxembourgGrand Duchy of Luxembourg
Luxembourg Legal AdviserElvinger Hoss Prussen, Société anonyme2, place Winston ChurchillB.P. 425, L-2014 LuxembourgGrand Duchy of Luxembourg
2

ChairmanIain O.S. SaundersIndependent Non-Executive Director and Chairman. A member of the Board since November 1996.
Mr Saunders graduated in Economics from Bristol University and joined Robert Fleming in 1970. He held several senior positions with the group in HongKong, Japan and the US, before returning to the UK in 1988. He was appointed Deputy Chairman of Fleming Asset Management and retired in 2001 followingthe merger of the Robert Fleming group with JP Morgan. Mr Saunders is currently Chairman of several JPMorgan managed Luxembourg-domiciledinvestment funds and MB Asia Select Fund.
DirectorsJacques ElvingerNon-Executive Director. A member of the Board since January 2009.
Mr Elvinger became a member of the Luxembourg Bar in 1984 and has been a partner of the Luxembourg law firm Elvinger Hoss Prussen since 1987. MrElvinger practices general corporate and banking law and specializes in the field of investment and pension funds. He is a member of the High Committee forthe Development of the Financial Sector instituted by the Luxembourg Government. He is also a member of the Advisory Committees to the LuxembourgCommission for the Supervision of the Financial Sector in the area of investment funds. He is a member of the Board of Directors of the Association of theLuxembourg Fund Industry (ALFI) and is currently chairman of ALFI’s Regulatory Board. Mr Elvinger currently holds a number of board mandates withLuxembourg investment funds including several JPMorgan managed Luxembourg-domiciled investment funds.
Massimo GrecoExecutive Director. A member of the Board since November 2015.
Mr Greco, Managing Director, is responsible for JPMorgan Asset Management’s Global Funds business in Europe, based in London. He took on his currentresponsibilities in 2012. Mr Greco has been a JPMorgan employee since 1992, initially with the Investment Banking unit, moving to Asset Management in1998. Before that, he worked for Goldman Sachs International in London. Mr Greco holds a degree in Economics from the University of Turin and an MBA(Major in Finance) from the Anderson Graduate School of Management at UCLA. Mr Greco is a Member of the Board of JPMorgan Asset Management (Europe)S.à r.l. as well as other Luxembourg domiciled SICAVs and is on the Board of European Fund Asset Management Association (“EFAMA”).
John Li How CheongIndependent Non-Executive Director. A member of the Board since June 2012.
Mr Li is a fellow of the Institute of Chartered Accountants in England & Wales. Mr Li moved to Luxembourg in 1987 and has since been working in the financialsector. Mr Li was a Partner at KPMG Luxembourg for more than 20 years during which he was Managing Partner for 8 years before taking on the role ofChairman of the Supervisory Board for 3 years. Mr Li was also a member of the Global Investment Management Practice of KPMG. During these years Mr Li’sexperience included auditing and advising clients such as banks, investment funds, insurance companies from Europe, US, Japan and Asia offering Mr Li anextensive experience in dealing with international companies. Mr Li is a board member of the Institut Luxembourgeois des Administrateurs. Mr Li currentlyholds a number of board mandates with financial institutions including several JPMorgan managed Luxembourg-domiciled investment funds.
Peter Thomas SchwichtIndependent Non-Executive Director. A member of the Board since June 2012.
Mr Schwicht obtained a Business Economics degree from the University of Mannheim in Germany after having studied business, tax and accounting inHamburg, Norway and the USA and was an employee of JPMorgan Asset Management from 1987 until October 2014. Prior to his retirement Mr Schwicht wasthe Chief Executive of Investment Management - EMEA, JPMorgan Asset Management. He had previously held positions as the Head of the ContinentalEurope Institutional business and the Investment Management Country Head for Institutional and Retail business in Germany where he first developed thebusiness and then went on to expand this throughout Continental Europe. Mr Schwicht is currently a Director of several JPMorgan managedLuxembourg-domiciled investment funds.
Susanne van DootinghIndependent Non-Executive Director. A member of the Board since December 2017.
Ms van Dootingh was at State Street Global Advisors from 2002 to 2017 with her final position being as Senior Managing Director, Head of EuropeanGovernance and Regulatory Strategy, EMEA. In addition, she was the Chair of the SSGA Sicav and Management Company and has been a member of variousESMA consultative working groups since 2013. Prior to this she held positions within State Street Global Investors as the Global Head of Institutional ProductDevelopment and Research, Head of European Product Development and Management, EMEA, Head of Fixed Income Product Engineering, EMEA and SeniorFixed Income Strategist and Product Engineer. Before 2002 Ms van Dootingh worked at Fortis Investment Management as Senior Product Manager,European Fixed Income, at Barclays Global Investors as Product Manager, Fixed Income, and at ABN AMRO Asset Management as Portfolio Manager GlobalFixed Income. She graduated from Vrije Universiteit Amsterdam with a Master of Arts Financial Sector Management. Ms van Dootingh currently holds anumber of board mandates with financial institutions including several JPMorgan managed Luxembourg-domiciled investment funds.
Daniel WatkinsExecutive Director. A member of the Board since December 2014.
Mr Watkins is the Chief Executive Officer of Asia Pacific, J.P. Morgan Asset Management. He is responsible for overseeing the Asset Management Asia Pacificbusiness, which operates in seven locations and includes more than 1,400 employees. Mr Watkins is a member of the Asset Management OperatingCommittee and the firm-wide Asia Pacific Management team. Mr Watkins has been an employee since 1997. Prior to taking his current role in 2019, he wasDeputy CEO of JPMorgan Asset Management Europe and Global Head of AM Client Services and Business Platform. Mr Watkins has also held a number ofpositions at JPMorgan namely Head of Europe COO and Global IM Operations, Head of the European Operations Team, Head of the European TransferAgency, Head of Luxembourg Operations, manager of European Transfer Agency and London Investment Operations and manager of the FlemingsInvestment Operations Teams. Mr Watkins obtained a BA in Politics from the University of York and is a qualified Financial Advisor. Mr Watkins is currently aDirector of several JPMorgan managed Luxembourg and Irish domiciled investment funds and also several UK legal entities.
3
JPMorgan Investment Funds
Board of Directors’ Report

The Board of Directors (the “Board”) is pleased to present the Audited Annual Report of JPMorgan Investment Funds (the ‘Fund’) for the year ended 31December 2018, and considers that taken as a whole they are fair and balanced and provide the information necessary for shareholders to assess the Fund’sposition and performance.
Structure of the Fund
The Fund is a variable capital open-ended investment company, organised as a “Société Anonyme”, under the laws of the Grand Duchy of Luxembourg. TheBoard has appointed JPMorgan Asset Management (Europe) S.à r.l. (JPMAME) as Management Company of the Fund. The Fund is organised as an “umbrella”with a number of Sub-Funds each of which has its own investment objective, policies and restrictions.
The objective of the Fund is to place the money available to it in transferable securities and other permitted assets of any kind, in accordance with the Fund’sProspectus, with the purpose of spreading investment risks and affording shareholders the results of the management of their portfolios.
The Fund qualifies as an Undertaking for Collective Investment in Transferable Securities (UCITS) under the EC Directive 2009/65/EC of 13 July 2009 and issubject to the Luxembourg law of 17 December 2010, as amended, on undertakings for collective investment. The Fund may therefore be offered for sale inEuropean Union Member States, subject to notification in countries other than the Grand Duchy of Luxembourg. In addition, applications to register the Fundand its Sub-Funds may be made in other countries.
The Fund currently has 16 Sub-Funds. All of the Sub-Funds and Share Classes are registered for offer and distribution in the Grand Duchy of Luxembourg anda number of the Sub-Funds and Share Classes are registered for distribution in the following jurisdictions: Austria, Bahrain, Belgium, Chile, Czech Republic,Croatia, Curacao and Sint Maarten, Denmark, Estonia, Finland, France, Germany, Greece, Hong Kong, Hungary, Iceland, Ireland, Italy, Jersey, Korea,Liechtenstein, Macau, The Netherlands, Norway, Poland, Portugal, Singapore, Slovakia, Spain, Sweden, Switzerland, Taiwan and the United Kingdom.
Role and Responsibility of the Board
The responsibility of the Board is governed exclusively by Luxembourg law. With respect to the annual accounts of the Fund, the duties of the Directors aregoverned by the law of 10 December 2010 on, inter alia, the accounting and annual accounts of undertakings for collective investment and by the law of 17December 2010, as amended, relating to undertakings for collective investment.
A management agreement between the Fund and JPMorgan Asset Management (Europe) S.à r.l. sets out the matters over which the Management Companyhas authority under Chapter 15 of the Law of 17 December 2010. This includes management of the Fund’s assets and the provision of administration,registration, domiciliation agent and marketing services. All other matters are reserved for approval by the Board and a schedule setting out such mattersfor clarity is in place between the Board and the Management Company. The matters reserved for the Board include determination of each Sub-Fund’sinvestment objective and policies, investment restrictions and powers, amendments to the Prospectus, reviewing and approving key investment andfinancial data, including the annual accounts, as well as the appointment of, and review of the services provided by, the Management Company, Auditor andDepositary.
Prior to each Board meeting the Directors receive detailed and timely information allowing them to be prepared for the items under discussion during themeeting. For each quarterly meeting the Board requests, and receives, reports from, amongst others, the Management Company, the investment managers,risk management as well as proposals for changes to existing Sub-Funds or proposals to launch new ones as appropriate. Senior representatives of each ofthese functions attend Board meetings by invitation to enable the Directors to question the reports presented to them.
The Directors take decisions in the interests of the Fund and its shareholders as a whole and refrain from taking part in any deliberation or decision whichcreates a conflict of interest between their personal interests and those of the Fund and its shareholders. The subject of conflicts of interest is documented inthe Prospectus and the Management Company’s policy on conflicts of interest is available for inspection on the website:
http://www.jpmorganassetmanagement.lu/ENG/Document_Library
The Board can take independent professional advice if necessary and at the Fund’s expense.
Board Composition
The Board is chaired by Mr. Saunders and consists of four Independent Non-Executive Directors, one Non-Executive Director and two Executive Directors.
The Board defines an Executive Director as someone who is employed by JPMorgan Chase & Co or any of its affiliates, a Non-Executive Director as someonewho has a business, family or other relationship with the Fund or JPMorgan Chase & Co or any of its affiliates, and an Independent Non-Executive Director assomeone who is free of any business, family or other relationship with the Fund or JPMorgan Chase & Co or any of its affiliates. All Board meetings require amajority of Non-Executive Directors to be in attendance.
In appointing a Director the Board takes into account the relative mix and composition of the Board, which as a whole has a breadth of investmentknowledge, financial skills, as well as legal and other experience relevant to the Fund’s business.
The Board does not limit the number of years of Directors’ service and it does take into account the nature and requirements of the fund industry and of theFund’s business when making recommendation to shareholders that Directors be elected. The terms of each Director’s appointment are set out in a contractfor services and these are available at the Fund’s registered office for inspection.
At the forthcoming Annual General Meeting shareholders are being asked to consider appointing Martin Porter to the Board as an independentnon-executive director. Mr Porter was formally the Chief Investment Officer of the Equities business within JPMorgan Asset Management until July 2016 andtherefore has extensive experience relevant for the oversight of the business of the Fund. A summary of his biography is given below. The Boardrecommend that shareholders vote for his appointment.
Mr Porter joined Robert Fleming Asset Management in 1984, and ran equity portfolios in both London and Japan. During his tenure in Japan, he became aholding board director of Jardine Fleming, responsible for the Japanese business. Returning to the UK in 2000, he took up the role of Chief InvestmentOfficer, Equity and Balanced of Fleming Asset Management, before becoming Global Head of Equities of JP Morgan Asset Management, a position he heldfrom 2003 to 2016 when he retired.
Induction and Training
All new Directors will receive an induction incorporating relevant information regarding the Fund and their duties and responsibilities as a Director. Inaddition, the Board takes active steps to keep up to date with developments relevant to the Fund and have ensured that a formal training programme is inplace.
Board Evaluation
The Board carries out a biennial review of its performance.
4
JPMorgan Investment Funds
Board of Directors’ Report (continued)

Board Remuneration
The Board believes that the remuneration of its members should reflect the responsibilities and experience of the Board as a whole and be fair andappropriate given the size, complexity and investment objectives of the Fund. The remuneration is reviewed on an annual basis. The Chairman is paidEUR 56,000 per annum and the other Directors EUR 45,000 per annum pro rata apart from the Connected Directors who have agreed to waive theirremuneration. No element of the remuneration paid by the Fund to the Directors is performance related.
Board Meetings and Committees
The Board meets quarterly but if necessary additional meetings will be arranged. Given the scope and nature of the business of the Fund, the Board does notcurrently consider it necessary to have a formal Audit or Remuneration Committee or indeed any other standing committees. However, this is kept underreview. All Board related matters are therefore currently approved by the Board or, where there are specific matters that need further consideration, aSub-Committee of the Board could be formed for this specific purpose. Such circumstances could be where the Board requests some amendments to theProspectus and where it is not appropriate to wait till the next quarterly Board meeting for this to be approved. These Sub-Committee meetings are usuallyformed of a minimum of two Directors.
There were six Board meetings held during the year. Four of these were quarterly Board meetings where, amongst other matters, the agenda included thoseitems highlighted under the section above called ‘Role and Responsibility of the Board’ and two were ad hoc Board meetings. In addition to the Boardmeeting where the Auditors present the report on the audit of the Fund accounts, the Non-Executive Directors also meet with them annually without theExecutive Directors being in attendance.
Internal Control
Investment management and all administrative services are provided by the Management Company and custody of assets is provided by J.P. Morgan BankLuxembourg S.A. The Board’s system of internal control therefore mainly comprises monitoring the services provided by the Management Company and theDepositary, including the operational and compliance controls established by them to meet the Fund’s obligations to shareholders as set out in theProspectus, Articles of Incorporation as well as all relevant regulations. The Management Company formally reports to the Board on a quarterly basis on thevarious activities it is responsible for and in addition shall inform the Board without delay of any material administrative or accounting matters.
Corporate Governance and ALFI Code of Conduct
The Board is responsible for ensuring that a high level of corporate governance is met and considers that the Fund has complied with the best practices in theLuxembourg funds industry.
In particular the Board has adopted the ALFI Code of Conduct (the “Code”) which sets out principles of good governance. These principles are set out below:
1. The Board should ensure that high standards of corporate governance are applied at all times;
2. The Board should have good professional standing and appropriate experience and to ensure that it is collectively competent to fulfil its responsibilities;
3. The Board should act fairly and independently in the best interests of the investors;
4. The Board should act with due care and diligence in the performance of their duties;
5. The Board should ensure compliance with all applicable laws and regulations and with the Fund’s constitutional documents;
6. The Board should ensure that investors are properly informed, are fairly and equitably treated, and receive the benefits and services to which they areentitled;
7. The Board should ensure that an effective risk management process and appropriate internal controls are in place;
8. The Board should identify and manage fairly and effectively, to the best of its ability, any actual, potential or apparent conflict of interest and ensureappropriate disclosure;
9. The Board should ensure that shareholder rights are exercised in a considered way and in the best interests of the Fund;
10. The Board should ensure that the remuneration of the Board members is reasonable and fair and adequately disclosed.
The Board considers that the Fund has been in compliance with the principles of the Code in all material aspects throughout the financial year ended31 December 2018. The Board undertakes an annual review of ongoing compliance with the principles of the Code.
Proxy Voting Policy
The Board delegates responsibility for proxy voting to the Management Company. The Management Company manages the voting rights of the sharesentrusted in a prudent and diligent manner, based exclusively on the reasonable judgement of what will best serve the financial interests of clients. So far asis practicable, the Management Company will vote at all of the meetings called by companies in which they are invested.
A copy of the proxy voting policy is available from the Fund’s registered office upon request or on the website:
https://am.jpmorgan.com/uk/institutional/corporate-governance
Directors and Officers Indemnity Insurance
The Fund’s Articles of Incorporation indemnify the Directors against expenses reasonably incurred in connection with any claim against them arising in thecourse of their duties or responsibilities as long as they have not acted fraudulently or dishonestly. To protect shareholders against any such claim, the Boardhas taken out Directors and Officers Indemnity Insurance which indemnifies the Directors against certain liabilities arising in the course of their duties andresponsibilities but does not cover against any fraudulent or dishonest actions on their part.
Independent Auditor
PricewaterhouseCoopers, Société coopérative, has been the Fund’s Auditor since December 1994. The provision of audit services was last put to competitivetender in 2016. The Board reviewed the services of PwC in 2016 and decided that, subject to any other influencing factor, they should continue to be proposedto the Shareholders to be appointed as Auditor.
5
JPMorgan Investment Funds
Board of Directors’ Report (continued)

Annual General Meetings
The next Annual General Meeting of the Fund will be held on 26 April 2019 at the Registered Office of the Fund to consider matters relating to the year endingon 31 December 2018. At this meeting shareholders will be requested to consider the usual matters at such meetings including:
1. The adoption of the financial statements and approval of the allocation of the results;
2. The approval of Directors’ fees;
3. The election of certain Directors;
4. The election of the Auditor;
5. The discharge of Directors duties.
No special business is being proposed by the Board.
Discharge of Directors
One of the resolutions in the AGM is, as required under Luxembourg Law, for shareholders to vote on the discharge the directors of their duties for the fiscalyear in question. This discharge is only valid where the annual accounts contain no omission or false information concealing the real financial situation of theFund.
Privacy Policy
The Management Company complies with a privacy policy that has been issued by J.P. Morgan Asset Management which can be accessed atwww.jpmorgan.com/emea-privacy-policy. This policy was updated during the year to comply with the General Data Protection Regulation.
Board of Directors
Luxembourg, 22 March 2019
6
JPMorgan Investment Funds
Board of Directors’ Report (continued)

7
Review
Global equity markets posted negative returns for the year amid rising U.S. interest rates, slowing economic growth in the Europe and China, andgeo-political concerns about trade tensions between the U.S. and China. During most of the year, U.S. equity provided positive returns and outperformedother developed and emerging market equities. However, prices plummeted in the final month of the year and erased gains made in the previous elevenmonths. While bonds markets generally had lackluster performance during 2018, government bonds provided investors with some protection against theequity market downturn.
The MSCI World Index returned -8.20% for the reporting period and the Bloomberg Barclays Multiverse Index returned -1.36%. (performance in USD terms, 1January 2018 - 31 December 2018, source: J.P. Morgan Asset Management).
During most of 2018, U.S. equity prices were generally supported by record corporate earnings, the lowest unemployment rates in decades and strong levelsof consumer and business confidence. The U.S. Federal Reserve raised interest rates four times during the year in response to tightening labor markets.Meanwhile, following record gains in January, U.S. financial markets endured a sharp sell in February that spread to other markets and increased financialmarket volatility. While financial markets recovered somewhat in subsequent months, volatility remained elevated and U.S. equity prices didn’t return torecord highs until August. Though U.S. gross domestic product and corporate earnings continued to rise in the second and third quarters of 2018, investorsappeared to grow concerned about the durability of the late-cycle economic expansion and the receding benefits of tax cuts enacted at the end of 2017.
By the end of December, negative investor sentiment had pushed U.S. equity prices sharply lower and erased gains made during the year. U.S. Treasurybonds provided investors with some protection from the equity sell-off in later 2018.
In Europe, economic growth slowed during the year with a notable decline in manufacturing exports due to weaker demand from China. Political factors alsoweighed on European financial markets during 2018. A new government in Italy initially threatened a confrontation with the European Union (EU) overbudget deficit limits, which led to a spike in borrowing costs in Italy. In the end, the Italy submitted a budget with a lower projected deficit and borrowing costsfell. In France, a higher tax on petroleum sparked widespread protests that forced President Emmanuel Macron to rescind the fuel duty. Even as businesssentiment grew worse during the year, the European Central Bank ended its quantitative easing program in December, citing improved wage growth acrossthe region.
The U.K. also experience accelerating wage growth in 2018, even as uncertainty about Brexit negotiations weighed on business sentiment. Though PrimeMinister Theresa May’s proposed Brexit plan suffered a stinging defeat in the U.K. Parliament, she later survived a no-confidence vote and continued to pushfor an acceptable agreement with the EU to avoid a so-called hard Brexit that would significant hurt the U.K. economy.
During the latter part of 2018, China’s economic expansion slowed amid weakness in global exports. In the face of reciprocal trade tariffs between the U.S.and China, the government in Beijing sought to stimulate growth with a combination of monetary and fiscal measures. Further, ongoing negotiationsbetween the U.S. and China fed investor optimism that trade tensions would be reduced, limited the impact of tariffs on the global economy.
In other emerging markets, rising U.S. interest rates put pressure on the currencies of nations most reliant on foreign lending, including Argentina, Brazil,Turkey, South Africa and Indonesia. Emerging markets debt, which had notably underperformed other asset classes in the first half of 2018, reboundingsomewhat in later part of the year.
Outlook
The global economy stands to benefit from Chinese economic stimulus, a negotiated Brexit agreement, a reduction in U.S.-China trade tariffs and thepotential for lower global oil prices. At the same time, the risk of economic recession the Europe has grown and economists generally expect the U.S.economy will slow in 2019-2020. Uncertainty over the ability of U.K. politicians to resolve the Brexit issue has already hurt business sentiment and drivensome corporations to relocate key operations outside the U.K. Emerging markets remain vulnerable to rising U.S. interest rates, slowing global growth, andin some nations, weakness in oil prices.
Overall, the global economy is in the late stages of an economic expansion and the risks to this expansion continuing appear to be higher than in previousyears.
The Investment Managers
22 March 2019
The information stated in this report is historical and not necessarily indicative of future performance.
JPMorgan Investment Funds
Investment Managers’ Report

Audit Report
To the Shareholders ofJPMorgan Investment Funds
Our opinion
In our opinion, the accompanying financial statements give a true and fair view of the financial position of JPMorgan Investment Funds and of each of itsSub-Funds (the “Fund”) as at 31 December 2018, and of the results of their operations and changes in their net assets for the year then ended in accordancewith Luxembourg legal and regulatory requirements relating to the preparation and presentation of the financial statements.
What we have audited
The Fund’s financial statements comprise:
- the Combined Statement of Net Assets for the Fund and the Statement of Net Assets for each of the Sub-Funds as at 31 December 2018;
- the Schedule of Investments as at 31 December 2018;
- the Combined Statement of Operations and Changes in Net Assets for the Fund and the Statement of Operations and Changes in Net Assets for each of theSub-Funds for the year then ended; and
- the Notes to the Financial Statements, which include a summary of significant accounting policies.
Basis for opinion
We conducted our audit in accordance with the Law of 23 July 2016 on the audit profession (Law of 23 July 2016) and with International Standards on Auditing(ISAs) as adopted for Luxembourg by the “Commission de Surveillance du Secteur Financier” (CSSF). Our responsibilities under the Law of 23 July 2016 andISAs as adopted for Luxembourg by the CSSF are further described in the “Responsibilities of the “Réviseur d’entreprises agréé” for the audit of the financialstatements” section of our report.
We believe that the audit evidence we have obtained is sufficient and appropriate to provide a basis for our opinion.
We are independent of the Fund in accordance with the International Ethics Standards Board for Accountants’ Code of Ethics for Professional Accountants(IESBA Code) as adopted for Luxembourg by the CSSF together with the ethical requirements that are relevant to our audit of the financial statements. Wehave fulfilled our other ethical responsibilities under those ethical requirements.
Other information
The Board of Directors of the Fund is responsible for the other information. The other information comprises the information stated in the annual report butdoes not include the financial statements and our audit report thereon.
Our opinion on the financial statements does not cover the other information and we do not express any form of assurance conclusion thereon.
In connection with our audit of the financial statements, our responsibility is to read the other information identified above and, in doing so, considerwhether the other information is materially inconsistent with the financial statements or our knowledge obtained in the audit, or otherwise appears to bematerially misstated. If, based on the work we have performed, we conclude that there is a material misstatement of this other information, we are requiredto report that fact. We have nothing to report in this regard.
Responsibilities of the Board of Directors of the Fund for the financial statements
The Board of Directors of the Fund is responsible for the preparation and fair presentation of the financial statements in accordance with Luxembourg legaland regulatory requirements relating to the preparation and presentation of the financial statements, and for such internal control as the Board of Directorsof the Fund determines is necessary to enable the preparation of financial statements that are free from material misstatement, whether due to fraud orerror.
In preparing the financial statements, the Board of Directors of the Fund is responsible for assessing the Fund’s ability to continue as a going concern,disclosing, as applicable, matters related to going concern and using the going concern basis of accounting unless the Board of Directors of the Fund eitherintends to liquidate the Fund or to cease operations, or has no realistic alternative but to do so.
PricewaterhouseCoopers, Société coopérative, 2 rue Gerhard Mercator, B.P. 1443, L-1014 LuxembourgT:+352 494848 1, F:+352 494848 2900, www.pwc.lu
Cabinet de révision agréé. Expert-comptable (autorisation gouvernementale n° 10028256)R.C.S. Luxembourg B 65 477 - TVA LU25482518
8
Responsibilities of the “Réviseur d’entreprises agréé” for the audit of the financial statements
The objectives of our audit are to obtain reasonable assurance about whether the financial statements as a whole are free from material misstatement,whether due to fraud or error, and to issue an audit report that includes our opinion. Reasonable assurance is a high level of assurance, but is not a guaranteethat an audit conducted in accordance with the Law of 23 July 2016 and with ISAs as adopted for Luxembourg by the CSSF will always detect a materialmisstatement when it exists. Misstatements can arise from fraud or error and are considered material if, individually or in the aggregate, they couldreasonably be expected to influence the economic decisions of users taken on the basis of these financial statements.
As part of an audit in accordance with the Law of 23 July 2016 and with ISAs as adopted for Luxembourg by the CSSF, we exercise professional judgment andmaintain professional scepticism throughout the audit.
We also:
· identify and assess the risks of material misstatement of the financial statements, whether due to fraud or error, design and perform audit proceduresresponsive to those risks, and obtain audit evidence that is sufficient and appropriate to provide a basis for our opinion. The risk of not detecting a materialmisstatement resulting from fraud is higher than for one resulting from error, as fraud may involve collusion, forgery, intentional omissions,misrepresentations, or the override of internal control;
· obtain an understanding of internal control relevant to the audit in order to design audit procedures that are appropriate in the circumstances, but not forthe purpose of expressing an opinion on the effectiveness of the Fund’s internal control;
· evaluate the appropriateness of accounting policies used and the reasonableness of accounting estimates and related disclosures made by the Board ofDirectors of the Fund;
· conclude on the appropriateness of the Board of Directors of the Fund’s use of the going concern basis of accounting and, based on the audit evidenceobtained, whether a material uncertainty exists related to events or conditions that may cast significant doubt on the Fund’s ability to continue as a goingconcern. If we conclude that a material uncertainty exists, we are required to draw attention in our audit report to the related disclosures in the financialstatements or, if such disclosures are inadequate, to modify our opinion. Our conclusions are based on the audit evidence obtained up to the date of our auditreport. However, future events or conditions may cause the Fund to cease to continue as a going concern;
· evaluate the overall presentation, structure and content of the financial statements, including the disclosures, and whether the financial statementsrepresent the underlying transactions and events in a manner that achieves a fair presentation.
We communicate with those charged with governance regarding, among other matters, the planned scope and timing of the audit and significant auditfindings, including any significant deficiencies in internal control that we identify during our audit.
PricewaterhouseCoopers, Société coopérative Luxembourg, 22 March 2019
Represented by
Emmanuel Chataignier
9

This page has been left blank intentionally
10

JPMorgan Investment Funds
Combined Statement of Net Assets
As at 31 December 2018
JPMorganInvestment Funds
CombinedUSD
EuropeSelect Equity
FundEUR
GlobalDividend
FundUSD
GlobalHigh Yield Bond
FundUSD
AssetsInvestments in Securities at Market Value 52,138,477,621 854,392,708 174,318,647 5,218,163,655Acquisition Cost: 53,641,977,519 899,676,410 185,643,234 5,605,773,615Cash at Bank and at Brokers 1,079,514,443 870,271 589,353 18,183,155Time Deposits 111,199,999 - - -Amounts Receivable on Sale of Investments 109,247,943 - - -Amounts Receivable on Subscriptions 187,899,550 7,052,611 452,712 24,486,642Interest and Dividends Receivable, Net 357,296,753 437,156 210,225 91,237,567Tax Reclaims Receivable 37,925,432 2,291,333 243,180 -Fee Waiver* 698,677 7,016 30,796 10,270Other Receivables 46,683 - - 7,642Net Unrealised Gain on Forward Currency Exchange Contracts 249,038,709 1,298,749 387,761 1,539,913Net Unrealised Gain on Financial Futures Contracts 13,192,498 - - -Other Derivative Instruments at Market Value, Net 29,680,154 - - -
Total Assets 54,314,218,462 866,349,844 176,232,674 5,353,628,844
LiabilitiesBank and Broker Overdraft 6,919,188 - - -Amounts Payable on Purchase of Investments 7,780,163 - - -Amounts Payable on Redemptions 307,656,154 4,653,854 1,446,323 54,929,229Management and Advisory Fees Payable 47,852,782 485,175 220,791 3,138,728Fund Servicing Fees Payable 3,365,067 75,977 15,400 415,996Distribution Fees Payable 3,396,715 7,642 76,546 202,399Other Payables** 6,092,992 94,588 70,970 505,212Net Unrealised Loss on Forward Currency Exchange Contracts 18,957,026 - - -Net Unrealised Loss on Financial Futures Contracts 3,635,823 - - -Other Derivative Instruments at Market Value, Net 43,602 - - -
Total Liabilities 405,699,512 5,317,236 1,830,030 59,191,564
Total Net Assets 53,908,518,950 861,032,608 174,402,644 5,294,437,280
Historical Total Net Assets31 December 2017 58,142,594,162 1,509,443,580 148,755,412 6,987,668,80431 December 2016 45,466,102,298 1,091,013,474 95,462,031 6,604,812,831
* Please refer to Note 3a), 3b), 3c) and 3d). To the extent that actual operating costs exceed the capped percentage, the amount borne by the Management Company will be separately disclosed as a “FeeWaiver” in the Combined Statement of Net Assets and the Combined Statement of Operations and Changes in Net Assets.** Other Payables are principally comprised of Directors’ fees, audit and tax related fees and expenses, registration, publication, mailing, printing, legal and marketing expenses.
The accompanying notes form an integral part of these Financial Statements.
11

JPMorgan Investment Funds
Combined Statement of Operations and Changes in Net Assets
For the Year Ended 31 December 2018
JPMorganInvestment Funds
CombinedUSD
EuropeSelect Equity
FundEUR
GlobalDividend
FundUSD
GlobalHigh Yield Bond
FundUSD
Net Assets at the Beginning of the Year* 56,154,505,525 1,509,443,580 148,755,412 6,987,668,804
IncomeDividend Income, Net 803,741,519 40,103,848 4,670,058 2,981,063Interest Income, Net 1,399,921,116 - - 364,170,900Securities Lending Income 2,863,958 249,538 14,961 696,274Bank Interest 1,681,909 172 1,478 38,307Interest on Swap Transactions 1,989,567 - - -Other Income 87,325 12,107 - -
Total Income 2,210,285,394 40,365,665 4,686,497 367,886,544
ExpensesManagement and Advisory Fees 567,172,265 8,505,665 2,556,645 38,741,706Fund Servicing Fees 41,643,063 1,376,545 178,745 5,459,511Distribution Fees 39,594,727 110,112 859,097 2,161,896Depositary, Corporate, Administration and Domiciliary Agency Fees 18,403,988 527,638 224,815 1,685,736Registrar and Transfer Agency Fees 4,179,382 128,090 152,362 509,624Taxe d’Abonnement 23,084,775 316,706 85,922 2,326,254Overdraft Interest 3,616,501 9,085 515 3,741Interest on Swap Transactions 5,945,730 - - 61,875Sundry Fees** 14,674,999 239,723 251,247 2,221,067
718,315,430 11,213,564 4,309,348 53,171,410
Less: Fee Waiver*** 10,351,819 206,144 364,367 1,200,201
Total Expenses 707,963,611 11,007,420 3,944,981 51,971,209
Net Investment Income/(Loss) 1,502,321,783 29,358,245 741,516 315,915,335
Net Realised Gain/(Loss) on Sale of Investments 516,284,222 4,832,579 10,002,994 34,981,425Net Realised Gain/(Loss) on Forward Currency Exchange Contracts (1,741,077,443) 3,066,009 (3,409,962) (120,975,073)Net Realised Gain/(Loss) on Financial Futures Contracts 273,848,595 (773,524) - -Net Realised Gain/(Loss) on Foreign Exchange 50,901,594 147,790 (31,458) (376,870)Net Realised Gain/(Loss) on TBAs (21,509) - - -Net Realised Gain/(Loss) on Other Derivative Instruments 51,677,355 - - 1,027,090
Net Realised Gain/(Loss) for the Year (848,387,186) 7,272,854 6,561,574 (85,343,428)
Net Change in Unrealised Gain/(Loss) on Investments (3,838,811,656) (173,137,583) (32,382,673) (474,734,818)Net Change in Unrealised Gain/(Loss) on Forward Currency Exchange Contracts (46,759,439) 2,545,283 (299,381) (20,393,081)Net Change in Unrealised Gain/(Loss) on Financial Futures Contracts 4,823,609 - - -Net Change in Unrealised Gain/(Loss) on Foreign Exchange 1,396,232 (29,483) (14,828) (1,943)Net Change in Unrealised Gain/(Loss) on TBAs 153 - - -Net Change in Unrealised Gain/(Loss) on Other Derivative Instruments 29,271,664 - - (699,498)
Net Change in Unrealised Gain/(Loss) for the Year (3,850,079,437) (170,621,783) (32,696,882) (495,829,340)
Increase/(Decrease) in Net Assets as a Result of Operations (3,196,144,840) (133,990,684) (25,393,792) (265,257,433)
Movements in Share CapitalSubscriptions 27,197,686,634 931,850,494 135,316,299 3,119,553,576Redemptions (24,819,483,702) (1,445,996,312) (81,265,014) (4,323,698,560)
Increase/(Decrease) in Net Assets as a Result of Movements in Share Capital 2,378,202,932 (514,145,818) 54,051,285 (1,204,144,984)
Dividend Distribution (1,428,044,667) (274,470) (3,010,261) (223,829,107)
Net Assets at the End of the Year 53,908,518,950 861,032,608 174,402,644 5,294,437,280
* The opening balance was combined using the foreign exchange rates as at 31 December 2018. The same net assets when combined using the foreign exchange rates ruling as at 31 December 2017reflected a figure of USD 58,142,594,162.** Sundry Fees are principally comprised of Directors’ fees, audit and tax related fees and expenses, registration, publication, mailing, printing, legal and marketing expenses.*** Please refer to Note 3a), 3b), 3c) and 3d). To the extent that actual operating costs exceed the capped percentage, the amount borne by the Management Company will be separately disclosed as a“Fee Waiver” in the Combined Statement of Net Assets and the Combined Statement of Operations and Changes in Net Assets.
The accompanying notes form an integral part of these Financial Statements.
12

JPMorgan Investment Funds
Statement of Changes in the Number of Shares (continued)
For the Year Ended 31 December 2018
Shares Outstandingat the Beginning
of the YearShares
SubscribedShares
Redeemed
Shares Outstandingat the End
of the Year
JPMorgan Investment Funds - Europe Select Equity FundJPM Europe Select Equity A (acc) - CZK - 76.475 1.000 75.475JPM Europe Select Equity A (acc) - EUR 270,547.484 27,622.026 126,441.136 171,728.374JPM Europe Select Equity A (acc) - USD 33,173.026 3,181.213 3,142.420 33,211.819JPM Europe Select Equity A (dist) - EUR 108,841.377 18,980.091 55,082.778 72,738.690JPM Europe Select Equity A (dist) - GBP - 1,333.798 22.177 1,311.621JPM Europe Select Equity C (acc) - EUR 1,551,482.121 572,795.080 1,319,003.669 805,273.532JPM Europe Select Equity C (acc) - USD 130,235.184 182,896.339 112,965.594 200,165.929JPM Europe Select Equity C (dist) - EUR 16,473.395 1,990.348 550.456 17,913.287JPM Europe Select Equity C (dist) - GBP 10,999.784 15,906.070 7,642.923 19,262.931JPM Europe Select Equity D (acc) - EUR 94,734.890 68,966.185 52,937.277 110,763.798JPM Europe Select Equity D (acc) - USD 9.805 0.001 - 9.806JPM Europe Select Equity I (acc) - EUR 2,773,985.247 494,692.829 2,256,103.149 1,012,574.927JPM Europe Select Equity I (acc) - USD* 17,748.881 - 17,748.881 -JPM Europe Select Equity I (acc) - USD (hedged) 129,822.059 8,078.001 101,875.792 36,024.268JPM Europe Select Equity I (dist) - EUR 458,548.778 10,046.753 464,303.663 4,291.868JPM Europe Select Equity I2 (acc) - EUR 10.000 5,461,675.989 4,168,870.512 1,292,815.477JPM Europe Select Equity I2 (acc) - USD 10.000 35,638.239 11,115.244 24,532.995JPM Europe Select Equity I2 (acc) - USD (hedged) 10.000 59,059.914 55,732.337 3,337.577JPM Europe Select Equity I2 (dist) - EUR 10.000 724,387.060 630,520.431 93,876.629JPM Europe Select Equity X (acc) - EUR 809,590.251 186,435.676 337,604.576 658,421.351JPM Europe Select Equity X (acc) - USD (hedged) 610,100.573 110,946.000 7,592.000 713,454.573JPM Europe Select Equity X (dist) - EUR 36,680.844 1,471.266 25,159.483 12,992.627
JPMorgan Investment Funds - Global Dividend FundJPM Global Dividend A (acc) - EUR 29,847.372 8,185.351 4,521.142 33,511.581JPM Global Dividend A (acc) - EUR (hedged) 38,093.941 38,552.889 28,745.830 47,901.000JPM Global Dividend A (acc) - USD 90,578.730 204,983.065 159,788.178 135,773.617JPM Global Dividend A (dist) - EUR (hedged) 1,603.000 301.000 - 1,904.000JPM Global Dividend A (dist) - USD 75,987.164 10,714.581 17,666.915 69,034.830JPM Global Dividend A (div) - EUR 42,174.520 33,315.834 9,952.126 65,538.228JPM Global Dividend A (div) - EUR (hedged) 15,563.010 11,704.908 4,980.320 22,287.598JPM Global Dividend A (div) - USD 12,770.059 723.201 866.389 12,626.871JPM Global Dividend A (mth) - USD (hedged) 4,054.309 101,581.612 72,156.186 33,479.735JPM Global Dividend C (acc) - EUR 25,884.211 16,129.625 11,878.508 30,135.328JPM Global Dividend C (acc) - USD 8,640.295 5,939.053 3,029.166 11,550.182JPM Global Dividend C (dist) - EUR 885.000 255.570 360.000 780.570JPM Global Dividend C (dist) - EUR (hedged) 1,709.000 1,931.000 1,458.000 2,182.000JPM Global Dividend C (div) - EUR** - 1,984.144 - 1,984.144JPM Global Dividend D (acc) - EUR (hedged) 189,972.202 97,470.965 56,948.925 230,494.242JPM Global Dividend D (acc) - USD 75,865.125 16,099.945 32,863.464 59,101.606JPM Global Dividend D (div) - EUR (hedged) 405,854.861 240,215.398 112,190.928 533,879.331JPM Global Dividend D (mth) - EUR (hedged) 7,276.276 12,880.230 3,550.265 16,606.241JPM Global Dividend F (mth) - USD (hedged) 20.000 300,307.205 117,893.611 182,433.594JPM Global Dividend I (acc) - EUR 56,720.643 - 28,771.555 27,949.088JPM Global Dividend T (acc) - EUR (hedged) 70,696.728 44,211.313 12,473.194 102,434.847JPM Global Dividend X (acc) - EUR (hedged)* 505.542 - 505.542 -JPM Global Dividend X (acc) - USD 2,895.708 331.406 762.473 2,464.641JPM Global Dividend X (dist) - AUD 52,992.849 1,620.051 576.615 54,036.285
* Share Class inactive as at end of the year.** Share Class reactivated during the year.
13

JPMorgan Investment Funds
Statement of Changes in the Number of Shares (continued)
For the Year Ended 31 December 2018
Shares Outstandingat the Beginning
of the YearShares
SubscribedShares
Redeemed
Shares Outstandingat the End
of the Year
JPMorgan Investment Funds - Global High Yield Bond FundJPM Global High Yield Bond A (acc) - AUD (hedged) 1,146,324.819 813,190.623 971,930.895 987,584.547JPM Global High Yield Bond A (acc) - CHF (hedged) 9,738.000 - 4,212.000 5,526.000JPM Global High Yield Bond A (acc) - CZK (hedged) 5,078.080 - - 5,078.080JPM Global High Yield Bond A (acc) - EUR (hedged) 825,659.414 209,046.833 477,972.674 556,733.573JPM Global High Yield Bond A (acc) - HUF (hedged) 28,980.701 5,834.340 12,261.743 22,553.298JPM Global High Yield Bond A (acc) - USD 2,038,055.780 2,745,370.613 2,852,348.481 1,931,077.912JPM Global High Yield Bond A (dist) - EUR (hedged) 414,280.053 68,925.039 83,148.222 400,056.870JPM Global High Yield Bond A (dist) - USD 24,769.748 3,639.213 4,064.109 24,344.852JPM Global High Yield Bond A (irc) - AUD (hedged) 52,087,710.478 6,323,449.155 12,895,383.366 45,515,776.267JPM Global High Yield Bond A (irc) - CAD (hedged) 944,656.813 175,381.267 100,038.002 1,020,000.078JPM Global High Yield Bond A (irc) - NZD (hedged) 209,387.724 35,148.919 60,021.437 184,515.206JPM Global High Yield Bond A (irc) - RMB (hedged) 267,333.337 229,885.057 - 497,218.394JPM Global High Yield Bond A (mth) - HKD 77,617,977.630 49,630,565.143 46,957,412.815 80,291,129.958JPM Global High Yield Bond A (mth) - SGD 514,951.979 95,345.710 146,409.551 463,888.138JPM Global High Yield Bond A (mth) - USD 25,180,837.092 8,111,463.300 10,534,019.676 22,758,280.716JPM Global High Yield Bond C (acc) - EUR (hedged) 683,359.675 386,204.109 571,141.621 498,422.163JPM Global High Yield Bond C (acc) - PLN (hedged) 81,979.296 - 44,874.431 37,104.865JPM Global High Yield Bond C (acc) - USD 3,166,852.158 629,850.283 1,698,323.714 2,098,378.727JPM Global High Yield Bond C (dist) - EUR (hedged) 88,854.973 13,562.760 24,182.000 78,235.733JPM Global High Yield Bond C (dist) - GBP (hedged) 429,734.002 168,563.613 74,215.740 524,081.875JPM Global High Yield Bond C (dist) - USD 246,251.540 179,766.837 130,500.807 295,517.570JPM Global High Yield Bond C (div) - EUR (hedged) 71,534.077 64,879.330 5,829.321 130,584.086JPM Global High Yield Bond C (irc) - CAD (hedged) 302,855.592 - 122,810.271 180,045.321JPM Global High Yield Bond C (mth) - HKD 5,129,782.449 - 2,789,677.818 2,340,104.631JPM Global High Yield Bond C (mth) - USD 1,554,085.399 110,645.183 633,849.511 1,030,881.071JPM Global High Yield Bond D (acc) - EUR (hedged) 291,071.448 50,949.069 80,786.778 261,233.739JPM Global High Yield Bond D (acc) - PLN (hedged) 28,029.468 146,906.939 162,066.604 12,869.803JPM Global High Yield Bond D (acc) - USD 37,649.908 84,220.190 96,897.350 24,972.748JPM Global High Yield Bond D (div) - EUR (hedged) 5,026,553.515 822,731.924 859,874.679 4,989,410.760JPM Global High Yield Bond D (mth) - EUR (hedged) 56,518.700 36,148.752 20,271.414 72,396.038JPM Global High Yield Bond F (irc) - AUD (hedged) 260.485 2,195,085.167 213,171.396 1,982,174.256JPM Global High Yield Bond F (mth) - USD 20.000 641,422.518 48,023.102 593,419.416JPM Global High Yield Bond I (acc) - EUR (hedged) 3,481,650.220 309,156.796 2,629,827.794 1,160,979.222JPM Global High Yield Bond I (acc) - USD 2,958,327.906 1,222,623.887 3,757,241.410 423,710.383JPM Global High Yield Bond I (dist) - EUR (hedged) 911,681.274 311,317.614 341,850.400 881,148.488JPM Global High Yield Bond I (dist) - GBP (hedged)* 237,390.467 357.299 237,747.766 -JPM Global High Yield Bond I (dist) - USD* 404,991.377 1,302.488 406,293.865 -JPM Global High Yield Bond I (mth) - USD 1,501,215.947 - 104,409.019 1,396,806.928JPM Global High Yield Bond I2 (acc) - EUR (hedged) 10.000 2,195,707.391 1,120,110.321 1,075,607.070JPM Global High Yield Bond I2 (acc) - USD 10.000 2,218,543.102 1,223,323.161 995,229.941JPM Global High Yield Bond I2 (dist) - EUR (hedged) 10.000 119,785.243 91,699.119 28,096.124JPM Global High Yield Bond I2 (dist) - GBP (hedged) 10.000 141,561.361 88,095.211 53,476.150JPM Global High Yield Bond I2 (dist) - USD 10.000 485,814.139 324,494.663 161,329.476JPM Global High Yield Bond I2 (mth) - USD 10.000 - - 10.000JPM Global High Yield Bond P (acc) - USD 5,830.416 29,779.631 - 35,610.047JPM Global High Yield Bond P (dist) - EUR (hedged) 212,566.284 - - 212,566.284JPM Global High Yield Bond P (dist) - USD 12,106.627 7,823.347 4,385.740 15,544.234JPM Global High Yield Bond T (acc) - EUR (hedged) 134,324.820 60,724.606 25,447.455 169,601.971JPM Global High Yield Bond X (acc) - EUR (hedged) 1,784,419.063 642,247.862 866,647.521 1,560,019.404JPM Global High Yield Bond X (acc) - USD 2,371,417.896 1,476,267.680 1,813,124.130 2,034,561.446JPM Global High Yield Bond X (mth) - USD - 232,755.796 70,578.356 162,177.440
* Share Class inactive as at end of the year.The accompanying notes form an integral part of these Financial Statements.
14
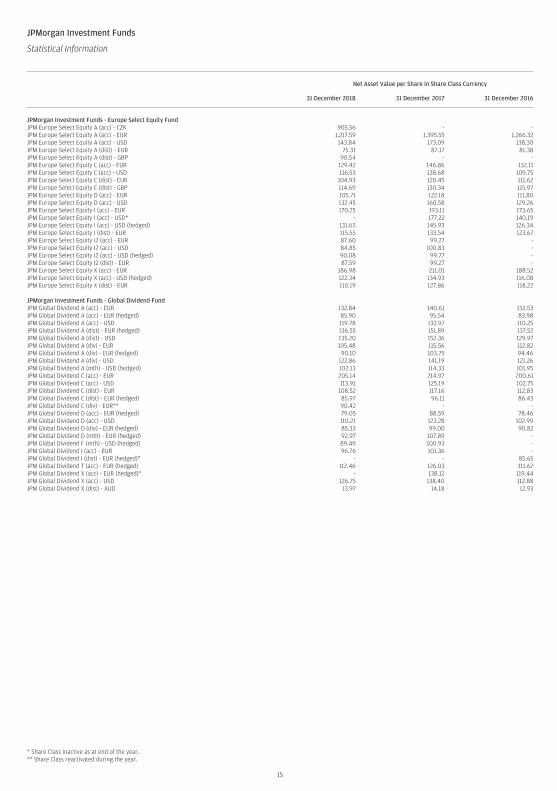
JPMorgan Investment Funds
Statistical Information (continued)
Net Asset Value per Share in Share Class Currency
31 December 2018 31 December 2017 31 December 2016
JPMorgan Investment Funds - Europe Select Equity FundJPM Europe Select Equity A (acc) - CZK 905.56 - -JPM Europe Select Equity A (acc) - EUR 1,217.59 1,395.55 1,266.32JPM Europe Select Equity A (acc) - USD 143.84 173.09 138.30JPM Europe Select Equity A (dist) - EUR 75.31 87.17 81.38JPM Europe Select Equity A (dist) - GBP 90.54 - -JPM Europe Select Equity C (acc) - EUR 129.42 146.86 132.11JPM Europe Select Equity C (acc) - USD 116.53 138.68 109.75JPM Europe Select Equity C (dist) - EUR 104.93 120.45 111.62JPM Europe Select Equity C (dist) - GBP 114.69 130.34 115.97JPM Europe Select Equity D (acc) - EUR 105.71 122.18 111.80JPM Europe Select Equity D (acc) - USD 132.45 160.58 129.26JPM Europe Select Equity I (acc) - EUR 170.25 193.11 173.65JPM Europe Select Equity I (acc) - USD* - 177.22 140.19JPM Europe Select Equity I (acc) - USD (hedged) 131.63 145.93 126.34JPM Europe Select Equity I (dist) - EUR 115.55 133.54 123.67JPM Europe Select Equity I2 (acc) - EUR 87.60 99.27 -JPM Europe Select Equity I2 (acc) - USD 84.85 100.83 -JPM Europe Select Equity I2 (acc) - USD (hedged) 90.08 99.77 -JPM Europe Select Equity I2 (dist) - EUR 87.59 99.27 -JPM Europe Select Equity X (acc) - EUR 186.98 211.01 188.52JPM Europe Select Equity X (acc) - USD (hedged) 122.34 134.93 116.08JPM Europe Select Equity X (dist) - EUR 110.19 127.86 118.22
JPMorgan Investment Funds - Global Dividend FundJPM Global Dividend A (acc) - EUR 132.84 140.61 132.53JPM Global Dividend A (acc) - EUR (hedged) 85.90 95.54 83.98JPM Global Dividend A (acc) - USD 119.78 132.97 110.25JPM Global Dividend A (dist) - EUR (hedged) 136.55 151.89 137.52JPM Global Dividend A (dist) - USD 135.20 152.36 129.97JPM Global Dividend A (div) - EUR 105.48 115.56 112.82JPM Global Dividend A (div) - EUR (hedged) 90.10 103.75 94.46JPM Global Dividend A (div) - USD 122.86 141.19 121.26JPM Global Dividend A (mth) - USD (hedged) 102.13 114.33 101.95JPM Global Dividend C (acc) - EUR 205.14 214.97 200.61JPM Global Dividend C (acc) - USD 113.91 125.19 102.75JPM Global Dividend C (dist) - EUR 108.52 117.16 112.83JPM Global Dividend C (dist) - EUR (hedged) 85.97 96.11 86.43JPM Global Dividend C (div) - EUR** 90.42 - -JPM Global Dividend D (acc) - EUR (hedged) 79.05 88.59 78.46JPM Global Dividend D (acc) - USD 110.21 123.28 102.99JPM Global Dividend D (div) - EUR (hedged) 85.33 99.00 90.82JPM Global Dividend D (mth) - EUR (hedged) 92.97 107.89 -JPM Global Dividend F (mth) - USD (hedged) 89.49 100.93 -JPM Global Dividend I (acc) - EUR 96.76 101.36 -JPM Global Dividend I (dist) - EUR (hedged)* - - 85.65JPM Global Dividend T (acc) - EUR (hedged) 112.46 126.03 111.62JPM Global Dividend X (acc) - EUR (hedged)* - 138.12 119.44JPM Global Dividend X (acc) - USD 126.75 138.40 112.88JPM Global Dividend X (dist) - AUD 13.97 14.18 12.93
* Share Class inactive as at end of the year.** Share Class reactivated during the year.
15

JPMorgan Investment Funds
Statistical Information (continued)
Net Asset Value per Share in Share Class Currency
31 December 2018 31 December 2017 31 December 2016
JPMorgan Investment Funds - Global High Yield Bond FundJPM Global High Yield Bond A (acc) - AUD (hedged) 11.74 12.08 11.27JPM Global High Yield Bond A (acc) - CHF (hedged) 106.88 113.11 108.70JPM Global High Yield Bond A (acc) - CZK (hedged) 979.18 1,024.84 -JPM Global High Yield Bond A (acc) - EUR (hedged) 212.94 224.31 214.43JPM Global High Yield Bond A (acc) - HUF (hedged) 24,552.34 25,803.72 24,577.39JPM Global High Yield Bond A (acc) - USD 167.25 171.43 160.60JPM Global High Yield Bond A (dist) - EUR (hedged) 73.05 80.47 81.19JPM Global High Yield Bond A (dist) - USD 94.10 101.39 101.01JPM Global High Yield Bond A (irc) - AUD (hedged) 7.84 8.60 8.58JPM Global High Yield Bond A (irc) - CAD (hedged) 8.30 9.10 9.09JPM Global High Yield Bond A (irc) - NZD (hedged) 9.88 10.84 10.82JPM Global High Yield Bond A (irc) - RMB (hedged) 8.18 8.99 9.00JPM Global High Yield Bond A (mth) - HKD 9.65 10.53 10.41JPM Global High Yield Bond A (mth) - SGD 11.51 12.36 13.33JPM Global High Yield Bond A (mth) - USD 86.34 94.45 94.16JPM Global High Yield Bond C (acc) - EUR (hedged) 240.21 251.93 239.71JPM Global High Yield Bond C (acc) - PLN (hedged) 436.57 448.46 418.14JPM Global High Yield Bond C (acc) - USD 177.58 181.17 168.96JPM Global High Yield Bond C (dist) - EUR (hedged) 65.29 71.97 72.61JPM Global High Yield Bond C (dist) - GBP (hedged) 60.73 66.33 67.66JPM Global High Yield Bond C (dist) - USD 97.55 105.70 104.23JPM Global High Yield Bond C (div) - EUR (hedged) 62.63 70.05 70.99JPM Global High Yield Bond C (inc) - EUR (hedged)*** - - 71.76JPM Global High Yield Bond C (irc) - CAD (hedged) 9.42 10.26 10.20JPM Global High Yield Bond C (irc) - RMB (hedged)* - - 10.19JPM Global High Yield Bond C (mth) - HKD 9.53 10.35 10.21JPM Global High Yield Bond C (mth) - USD 89.02 96.91 96.15JPM Global High Yield Bond D (acc) - EUR (hedged) 197.16 208.56 200.16JPM Global High Yield Bond D (acc) - PLN (hedged) 388.55 402.96 379.29JPM Global High Yield Bond D (acc) - USD 147.09 151.50 142.63JPM Global High Yield Bond D (div) - EUR (hedged) 59.03 66.57 68.05JPM Global High Yield Bond D (mth) - EUR (hedged) 86.05 97.28 -JPM Global High Yield Bond F (irc) - AUD (hedged) 9.08 10.01 -JPM Global High Yield Bond F (mth) - USD 91.00 100.09 -JPM Global High Yield Bond I (acc) - EUR (hedged) 84.02 88.08 83.78JPM Global High Yield Bond I (acc) - USD 182.40 186.01 173.40JPM Global High Yield Bond I (dist) - EUR (hedged) 62.94 70.19 70.82JPM Global High Yield Bond I (dist) - GBP (hedged)* - 64.94 65.26JPM Global High Yield Bond I (dist) - USD* - 102.35 100.89JPM Global High Yield Bond I (inc) - EUR (hedged)*** - - 65.89JPM Global High Yield Bond I (mth) - USD 86.45 94.07 93.29JPM Global High Yield Bond I2 (acc) - EUR (hedged) 95.50 100.00 -JPM Global High Yield Bond I2 (acc) - USD 98.39 100.22 -JPM Global High Yield Bond I2 (dist) - EUR (hedged) 95.49 100.00 -JPM Global High Yield Bond I2 (dist) - GBP (hedged) 96.61 100.05 -JPM Global High Yield Bond I2 (dist) - USD 98.37 100.22 -JPM Global High Yield Bond I2 (mth) - USD 92.77 100.22 -JPM Global High Yield Bond P (acc) - USD 98.56 100.36 -JPM Global High Yield Bond P (dist) - EUR (hedged) 95.02 104.20 -JPM Global High Yield Bond P (dist) - USD 112.44 119.12 116.60JPM Global High Yield Bond T (acc) - EUR (hedged) 94.84 100.37 96.41JPM Global High Yield Bond V (acc) - USD (hedged to BRL)* - - 108.03JPM Global High Yield Bond X (acc) - EUR (hedged) 166.36 173.60 164.36JPM Global High Yield Bond X (acc) - USD 157.50 159.88 148.36JPM Global High Yield Bond X (dist) - USD* - - 106.49JPM Global High Yield Bond X (mth) - USD 92.77 - -
* Share Class inactive as at end of the year.*** Share Class closed as at the end of the year.The accompanying notes form an integral part of these Financial Statements.
16

1. Organisation
JPMorgan Investment Funds (the “Fund” or the “SICAV”) is an investment company incorporated on 22 December 1994 under the name J.P. MorganInvestment Funds. The name of the SICAV was changed to JPMorgan Fleming Investment Funds on 19 November 2001 and then to JPMorgan InvestmentFunds on 12 September 2005.
It is organised under Part I of the Luxembourg Law of 17 December 2010 on Undertakings for Collective Investment, as amended, as a Société Anonymequalifying as a Société d’Investissement à Capital Variable (SICAV). As at 31 December 2018, it comprises 16 Sub-Funds each relating to a separateinvestment portfolio consisting of securities, cash and other instruments.
On 12 September 2005, JPMorgan Asset Management (Europe) S.à r.l. was appointed by the SICAV to act as Management Company. From 1 July 2011,JPMorgan Asset Management (Europe) S.à r.l. is acting as a Chapter 15 Management Company under the Luxembourg Law of 17 December 2010, asamended, and complies with UCITS regulations.
The SICAV is registered with the Registre de Commerce et des Sociétés of Luxembourg, under number B 49 663.
Each Sub-Fund may contain A, C, D, F, I, I2, P, T, V and X Share Classes. These Share Classes may differ in the minimum subscription amount, minimumholding amount, currency and/or eligibility requirements, the fees and expenses, and the dividend policy applicable to them. Certain Share Classes maycharge a Performance Fee and are redenominated by the inclusion of “(perf)” in the name of the Share Class.
Within each Sub-Fund, individual Share Classes may have a currency of denomination that differs from the currency of denomination of the Sub-Fund. Thecurrency of denomination for each Share Class is indicated by a suffix in the name of the Share Class.
2. Significant Accounting Policies
The Financial Statements are prepared in accordance with Luxembourg regulations relating to Undertakings for Collective Investments.
a) Investment Valuation
Transferable securities which are admitted to an official exchange listing or dealt in on another regulated market are valued on the basis of the latestavailable price prevailing at the time of calculating the net asset value.
If securities are listed or dealt in on several exchanges or markets, the latest available price, or if appropriate, the average price on the principal exchange ormarket will be applied.
Transferable securities not admitted to an official exchange listing nor dealt in on another regulated market are valued at the latest available price. Thosesecurities for which no price is available or for which the latest available price is not representative are valued on the basis of their reasonably foreseeablesales price determined with prudence and in good faith by the Board of Directors.
Shares or Units in UCITS or other UCIs are valued at the latest available price or net asset value, as reported or provided by such undertakings or their agents.
Liquid assets and money market instruments may be valued at nominal values plus any accrued interest or on an amortised cost basis.
The Financial Statements are presented on the basis of the net asset values of the Sub-Funds calculated on 31 December 2018. In accordance with theProspectus, the net asset values were calculated using the latest exchange rates known at the time of calculation.
b) Swing Pricing Adjustment
A Sub-Fund may suffer dilution of the Net Asset Value per Share due to investors buying or selling Shares in a Sub-Fund at a price that does not reflect thedealing and other costs that arise when security trades are undertaken by the Investment Manager to accommodate cash inflows or outflows.
In order to counter this impact, a swing pricing mechanism may be adopted to protect the interests of Shareholders of the Sub-Fund. If on any Valuation Day,the aggregate net transactions in Shares of a Sub-Fund exceed a pre-determined threshold, as determined and reviewed for each Sub-Fund on a periodicbasis by the Management Company, the Net Asset Value per Share may be adjusted upwards or downwards to reflect net inflows and net outflowsrespectively.
The net inflows and net outflows will be determined by the Management Company based on the latest available information at the time of calculation of theNet Asset Value per Share. The Swing Pricing mechanism may be applied across all Sub-Funds. The extent of the price adjustment will be set by theManagement Company to reflect dealing and other costs. Such adjustment may vary from Sub-Fund to Sub-Fund and will not exceed 2% of the original NetAsset Value per Share. The price adjustment applicable to a specific Sub-Fund is available on request from the Management Company at its registered office.
The official Net Asset Value per Share as at year end, disclosed in the Statistical Information section of this report may therefore include a swing pricingadjustment, which would not be recognised in the Combined Statement of Net Assets and in the Combined Statement of Operations and Changes in NetAssets.
Similarly, in order to protect the interests of Shareholders in a Sub-Fund that is being merged, the Management Company may adjust the final Net AssetValue per Share of the merging Sub-Fund, or make other appropriate adjustments in order to neutralise for the Sub-Fund being merged, the impact of anypricing adjustment made through the swing pricing mechanism in the absorbing Sub-Fund as a result of cash inflows or outflows in the absorbing Sub-Fundon the merger date.
The Management Company may consider it appropriate not to apply the swing pricing adjustment to the Net Asset Value per Share of a Sub-Fund where it isseeking to attract inflows so that the Sub-Fund reaches a certain size. If a decision is taken in relation to a Sub-Fund the Management Company will pay thedealing and other costs resulting from securities trades to avoid the Sub-Fund suffering dilution of the net asset value. Where this happens shareholders willsubscribe or redeem at a net asset value that will not have been adjusted upwards as would have been the case if the swing pricing mechanism had beenapplied.
c) Realised and Unrealised Gains and Losses on Investments
Investment transactions are accounted for on the trade date (the date the order to buy or sell is executed). For trades into other collective investmentschemes, transactions are accounted for on receipt of the trade confirmation from the underlying transfer agents.
Realised gains and losses on sales of investments are calculated on the average book cost. The associated foreign exchange movement between the date ofpurchase and date of sale of investments is included in realised gains and losses on investments. Unrealised gains and losses on holdings of investments arecalculated on the total book cost and include the associated unrealised gains and losses on foreign exchange.
d) Income Recognition
Interest income is accrued daily and includes the amortisation of premiums and accretion of discounts, where applicable. Bank interest income is recognisedon an accrual basis. Dividend income is accrued on the ex-dividend date. This income is shown net of any withholding taxes and adjusted accordingly whentax reclaims apply.
17
JPMorgan Investment Funds
Notes to the Financial Statements
As at 31 December 2018

e) Conversion of Foreign Currencies
The books and records of each Sub-Fund are denominated in the base currency of the corresponding Sub-Fund. Amounts denominated in other currenciesare translated into the base currency on the following basis: (i) investment valuations and other assets and liabilities initially expressed in other currenciesare converted each business day into the base currency using currency exchange rates prevailing on each such business day; (ii) purchases and sales offoreign investments, income and expenses are converted into the base currency using currency exchange rates prevailing on the respective dates of suchtransactions.
Net realised and unrealised gains or losses on foreign exchange transactions represent: (i) foreign exchange gains and losses from the sale and holding offoreign currencies and foreign cash equivalents; (ii) gains and losses between trade date and settlement date on securities transactions and forwardcurrency exchange contracts; and (iii) gains and losses arising from the difference between amounts of dividends and interest recorded and the amountsactually received. The resulting gains and losses on translation are included in “Net Realised Gain/(Loss) on Foreign Exchange” in the Combined Statement ofOperations and Changes in Net Assets.
The reference currency of the SICAV as reflected in the combined statements is USD.
The principal exchange rates applied for the year ended 31 December 2018 are the latest exchange rates known at the time of the NAV calculation:
1 USD = 1.41890273 AUD; 1 USD = 0.87451576 EUR; 1 USD = 8.69897000 NOK;
1 USD = 1.36426000 CAD; 1 USD = 0.78118898 GBP; 1 USD = 1.49220337 NZD;
1 USD = 0.98661000 CHF; 1 USD = 7.83298000 HKD; 1 USD = 3.76440000 PLN;
1 USD = 6.87290000 CNH; 1 USD = 280.61000000 HUF; 1 USD = 8.94831000 SEK;
1 USD = 22.52140000 CZK; 1 USD = 110.01500000 JPY; 1 USD = 1.36326000 SGD.
f) Forward Currency Exchange Contracts
Unrealised gains or losses on outstanding forward currency exchange contracts are valued on the basis of currency exchange rates prevailing at the relevantvaluation date. The changes in such amounts are included in the Combined Statement of Operations and Changes in Net Assets under “Net Change inUnrealised Gain/(Loss) on Forward Currency Exchange Contracts”. When a contract is closed, the Realised Gain/(Loss) is recorded under “Net RealisedGain/(Loss) on Forward Currency Exchange Contracts” in the Combined Statement of Operations and Changes in Net Assets. Unrealised gains or losses arerecorded under “Net Unrealised Gain/(Loss) on Forward Currency Exchange Contracts” in the Combined Statement of Net Assets.
g) Financial Futures Contracts on Securities and Indices
Regulated financial futures contracts are valued at the exchange quoted settlement price. Initial margin deposits are made upon entering into the contractsand can be either in cash or securities. During the period the contracts are open, changes in the value of the contracts are recognised as unrealised gains andlosses by “marking-to-market” on a daily basis to reflect the market value of the contracts at the end of each business day’s trading. Variation marginpayments are made or received, depending upon whether losses or gains are incurred. The frequency of those margin payments may differ depending onwhere the contract is traded. When a contract is closed, the SICAV records a realised gain or loss equal to the difference between the proceeds from, or costof, the closing transaction and the initial cost of the contract in “Net Realised Gain/(Loss) on Financial Futures Contracts” in the Combined Statement ofOperations and Changes in Net Assets.
Unrealised gains or losses are recorded under “Net Unrealised Gain/(Loss) on Financial Futures Contracts” in the Combined Statement of Net Assets. Thechanges in such amounts are recorded under “Net Change in Unrealised Gain/(Loss) on Financial Futures Contracts” in the Combined Statement ofOperations and Changes in Net Assets.
h) Option Contracts
The SICAV writes options on securities, futures and currencies. These options are settled in cash and subject the SICAV to unlimited risk of loss. The SICAV,however, is not subject to credit risk on written options as the counterparty has already performed its obligation by paying the premium at the inception ofthe contract.
Options purchased are recorded as investments; options written or sold are recorded as liabilities. When the exercise of an option results in a cashsettlement, the difference between the premium and the settlement proceeds is accounted for as a realised gain or loss. When securities are acquired ordelivered upon exercise of an option, the acquisition cost or sale proceeds are adjusted by the amount of the premium. When an option is closed, thedifference between the premium and the cost to close the position is accounted for as a realised gain or loss. When an option expires, the premium isaccounted for as a realised gain for options written or as a realised loss for options purchased.
For options on futures, where the investment manager is based in the United Kingdom, variation margin payments are made or received daily, dependingupon whether losses or gains are incurred on the underlying futures contract.
The market values are recorded under “Other Derivative Instruments at Market Value” in the Combined Statement of Net Assets. The changes in unrealisedgains or losses are recorded under “Net Change in Unrealised Gain/(Loss) on Other Derivative Instruments” in the Combined Statement of Operations andChanges in Net Assets. When a contract is closed, the Realised Gain/(Loss) is recorded under “Net Realised Gain/(Loss) on Other Derivative Instruments” inthe Combined Statement of Operations and Changes in Net Assets.
i) Interest Rate Swap Contracts
An interest rate swap contract is a bilateral agreement in which each of the parties agree to exchange a series of interest payments for another series ofinterest payments (usually fixed/floating) based on a notional amount that serves as a computation basis and that is usually not exchanged.
The market values are recorded under “Other Derivative Instruments at Market Value” in the Combined Statement of Net Assets. The interest on interest rateswap contracts are recorded under “Interest on Swap Transactions” in the Combined Statement of Operations and Changes in Net Assets. The changes inunrealised gains or losses are included in the Combined Statement of Operations and Changes in Net Assets under “Net Change in Unrealised Gain/(Loss) onOther Derivative Instruments”. When a contract is closed, the realised gains or losses are recorded under “Net Realised Gain/(Loss) on Other DerivativeInstruments” in the Combined Statement of Operations and Changes in Net Assets.
j) Credit Default Swaps
A Credit Default Swap is a credit derivative transaction in which two parties enter into an agreement, whereby one party pays the other a fixed periodiccoupon for the specified life of the agreement. The other party makes no payments unless a credit event, relating to a predetermined reference asset,occurs. If such an event occurs, the party will then make a payment to the first party, and the swap will terminate. The value of the underlying securities shallbe taken into account for the calculation of the investment restrictions applicable to individual issuers.
18
JPMorgan Investment Funds
Notes to the Financial Statements (continued)
As at 31 December 2018

The market values are recorded under “Other Derivative Instruments at Market Value” in the Combined Statement of Net Assets. The changes in unrealisedgains or losses are included in the Combined Statement of Operations and Changes in Net Assets under “Net Change in Unrealised Gain/(Loss) on OtherDerivative Instruments”. When a contract is closed, the realised gains or losses are recorded under “Net Realised Gain/(Loss) on Other DerivativeInstruments” in the Combined Statement of Operations and Changes in Net Assets.
3. Fees and Expenses
a) Charging Structures and Capped Expense Ratio
P Share Classes are subject to an additional fee charged and collected by J.P. Morgan International Bank Limited.
Unless stated otherwise in the Sub-Fund specific details, X Share Classes are designed to accommodate an alternative charging structure whereby a fee forthe management of the Sub-Fund is administratively levied and collected by the Management Company or through the relevant JPMorgan Chase and Co.entity directly from the Shareholder. The Management and Advisory Fee for X Share Classes is therefore listed as “Nil” in the Fees and Expenses tables in theProspectus.
Any exceptions to the charging structures detailed above are noted in the Prospectus.
The maximum total fees and expenses to be borne by shareholders on the Share Class of any Sub-Fund will not exceed a capped percentage of the total netassets attributable to that Share Class. These capped fees and expenses comprise Management and Advisory Fees, Distribution Fees and other Operatingand Administrative Expenses; it does not cover performance fees, if any.
No other costs are charged to these Share Classes and the Management Company absorbs any difference that may arise between the actual costs of theoperations of these Share Classes and the capped percentage.
This capped annual rate of fees and expenses is categorised as a Capped Expense Ratio as shown in the Appendix.
b) Management and Advisory Fees
The SICAV pays to the Management Company a management fee calculated as a percentage of the average daily net assets of each Sub-Fund or Share Classunder its management (“Management and Advisory Fees”). The Management and Advisory Fees are accrued daily and payable monthly in arrears at amaximum rate as specified in the Prospectus. The Management Company may at its absolute discretion and from time to time (which in certaincircumstances may be daily), decide to vary such rate between the maximum and 0.0%.
The maximum Management and Advisory Fee that can be charged on P Share Classes is stated in the Prospectus. However, the actual Management andAdvisory Fee charged may be lower as J.P. Morgan International Bank Limited will also charge and collect a separate and additional fee from their clients.
Charges for the management of the Sub-Funds in respect of the X Share Classes of the Sub-Funds are administratively levied and collected by theManagement Company or the appropriate JPMorgan Chase & Co. entity directly from the Shareholder.
Sub-Funds may invest in UCITS, other UCIs and closed ended investment undertakings qualifying as transferable securities within the meaning of UCITS rules(including investment trusts) (the “Undertakings”) managed by the Management Company, the Investment Managers or any other member of JPMorganChase & Co. In accordance with the Prospectus, no double charging of fees will occur with the exception of performance fees. The avoidance of adouble-charge of the Management and Advisory Fee on such assets is achieved by either a) excluding the assets from the net assets on which theManagement and Advisory Fee are calculated; or b) investing in Undertakings via share classes that do not accrue a Management and Advisory Fee or otherequivalent fees payable to the relevant Investment Manager’s group; or c) the Management and Advisory Fee being netted off by a rebate to the SICAV orSub-Fund of the Management and Advisory Fee (or equivalent) charged to the underlying Undertakings; or d) charging only the difference between theManagement and Advisory Fee of the SICAV or Sub-Fund as per the Prospectus and the Management and Advisory Fee (or equivalent) charged to theUndertakings.
Where a Sub-Fund invests in Undertakings managed by investment managers which are not members of JPMorgan Chase & Co. group, the Management andAdvisory Fee, as specified in the Prospectus, may be charged regardless of any fees reflected in the price of the shares or units of the Undertakings.
c) Operating and Administrative Expenses
The SICAV bears all its ordinary operating and administrative expenses at the rates set out in the Prospectus (“Operating and Administrative Expenses”) tomeet all fixed and variable costs, charges, fees, and other expenses incurred in the operation and administration of the SICAV from time to time. TheOperating and Administrative Expenses are capped for each Share Class at the maximum rate set out in the Prospectus. The Management Company will bearany Operating and Administrative Expenses which exceed the maximum rate specified in the Prospectus. At its discretion, the Management Company mayon a temporary basis meet the Direct and/or Indirect Fund Expenses on a Sub-Fund’s behalf and/or waive all or part of the Fund Servicing Fee.
The Operating and Administrative Expenses are calculated as a percentage of the average daily net assets of each Sub-Fund or Share Class. They are accrueddaily and payable monthly in arrears and will not exceed the maximum rate as specified in the relevant section of the Prospectus.
The Operating and Administrative Expenses cover:
(i) A “Fund Servicing Fee” paid to the Management Company for the services that the Management Company provides to the SICAV. The Fund Servicing Feewill be reviewed annually and will not exceed 0.15% per annum.
(ii) Expenses directly contracted by the SICAV (“Direct Fund Expenses”) and expenses directly contracted by the Management Company on behalf of theSICAV (“Indirect Fund Expenses”) as detailed in the Prospectus.
Operating and Administrative Expenses do not include Transaction Fees and Extraordinary Expenses.
The SICAV’s formation expenses and the expenses relating to the creation of new Sub-Funds may be capitalised and amortised over a period not exceedingfive years, as permitted by Luxembourg law.
d) Performance Fees
Pursuant to the Investment Management Agreement, as set out in the Prospectus, the Investment Manager is entitled to receive from the net assets ofcertain Sub-Funds or Share Classes, an annual performance-based incentive fee (the “Performance Fee”) if the performance of the Sub-Fund exceeds thereturn from the benchmark, subject to the operation of a Claw-Back Mechanism or of a High Water Mark as defined in the Prospectus and as specified in theProspectus for each Sub-Fund. On each Valuation Day, an accrual for the previous Valuation Day’s Performance Fee is made, when appropriate, and theperformance fee accrual, if any, becomes payable to the Management Company on the last Dealing Day of the Financial Year, or under any of the followingcircumstances: on very significant orders for switching or redemption (applies to those Shares only) and when a Sub-Fund is merged or liquidated. Pursuantto the provisions of the relevant Investment Management Agreement, the Investment Manager may be entitled to receive the performance Fee from theManagement Company.
19
JPMorgan Investment Funds
Notes to the Financial Statements (continued)
As at 31 December 2018

On each Valuation Day, the net asset value of each Share Class of each Sub-Fund for which a Performance Fee applies, which includes an accrual for all feesand expenses (including the Management and Advisory Fee, and the Operating and Administrative Expenses to be borne by the relevant Share Class at therate set out in the Prospectus), is adjusted for any dividend distributions and for subscriptions and redemptions dealt with on that Valuation Day, if any, andany Performance Fee accrued through that day in respect of such Share Class is added back (the “Adjusted net asset value”). For purposes of calculating thePerformance Fee, the “Share Class Return” is computed on each Valuation Day, as the difference between the net asset value (adjusted by adding back anyaccrued Performance Fee) on such day and the Adjusted net asset value on the previous Valuation Day, expressed as a return based on the previousValuation Day’s Adjusted net asset value for that Share Class.
Sub-Funds may invest in UCITS and other UCIs managed by the Management Company, the Investment Managers or any other member of JPMorgan Chase &Co. No double-charging of Performance Fees will occur. The avoidance of a double-charge of the Performance Fee is achieved by either a) where a Sub-Fundinvests in such UCITS and other UCIs, and these UCITS or UCIs charge performance fees, the Sub-Fund will not charge Performance Fees or b) where aSub-Fund charges a Performance Fee, it will not invest in UCITS and/or UCIs that charge performance fees.
Claw-Back mechanism
The purpose of the Claw-Back Mechanism is to ensure that the Management Company will only become entitled to a Performance Fee when it outperformsthe cumulative Benchmark Return (as defined in the Prospectus) accrued since the last Valuation Day of the last year in which a Performance Fee was paid.
High Water Mark Method
If the Share Class Return exceeds the Benchmark Return and the cumulative Share Class Return exceeds the High Water Mark Return (as set out in theProspectus), the Performance Fee accrual is increased by the Performance Fee Rate multiplied by the Excess Return multiplied by the previous ValuationDay’s Adjusted net asset value for that Class. If the Share Class Return does not exceed the Benchmark Return, the Performance Fee accrual is reduced (butnot below zero) by the Performance Fee Rate multiplied by the negative Excess Return multiplied by the previous Valuation Day’s Adjusted net asset valuefor that Class. Following a period of negative Excess Return whereby the Performance Fee accrual has been reduced to zero, no new Performance Fee isaccrued until such time as the cumulative Share Class Return exceeds the greater of the High Water Mark Return and the cumulative Benchmark Return sincethe beginning of the SICAV accounting year. The Performance Fee accrued on any Valuation Day is reflected in the Net Asset Value per Share on the basis ofwhich subscriptions and redemptions may be accepted.
No performance fees were charged during the year under review.
e) Distribution Fees
The SICAV pays to the Management Company a distribution fee (the “Distribution Fee”) in respect of D, F and T Share Classes. The Distribution Fee ratepayable for each Share Class is stated in the Prospectus. The Management Company may at its absolute discretion and from time to time (which in certaincircumstances may be daily) decide to vary such rate between the maximum and 0.0%. The Management Company may pay all or part of the Distribution Feeto certain Distributors for the services provided by them in relation to the distribution of the D, F and T Share Classes.
4. Dividend Policy
Share Classes suffixed “(acc)”
Share Classes with the suffix “(acc)” are accumulation Share Classes and will not normally pay dividends.
Share Classes suffixed “(dist)”
It is intended that all those Share Classes with the suffix “(dist)” will, if appropriate, pay reportable income annually and will have “UK Reporting Fund Status”.
Share Classes suffixed “(div)”
Share Classes with the suffix “(div)” will normally pay quarterly dividends which are calculated by the Management Company based on the estimated annualyield of the relevant Sub-Fund’s portfolio which is attributable to that Share Class. The Management Company will review the dividend rate for each ShareClass at least semi-annually, but may adjust the dividend rate more frequently to reflect changes in the portfolio’s expected yield.
Investors should be aware that “(div)” Share Classes give priority to dividends, rather than to capital growth. The expected yield for each Share Class will becalculated gross of both the Management and Advisory Fee and the Operating and Administrative Expenses, and such Share Classes will typically distributemore than the income received. Share Classes with the suffix “(div)” in issue at the dividend record date will be eligible for any dividends which will normallybe paid in the currency of the relevant Share Class.
Share Classes suffixed “(mth)”
Share Classes with the suffix “(mth)” will be available to Shareholders subscribing, and remaining subscribed, through specific Asian distribution networksand to other distributors at the sole discretion of the Management Company. Share Classes with the suffix “(mth)” will normally pay dividends on a monthlybasis. The monthly dividend rate per Share will be calculated by the Management Company based on the estimated annual yield of the relevant Sub-Fund’sportfolio which is attributable to that Share Class. The Management Company will review the dividend rate for each Share Class at least semi-annually, butmay adjust the dividend rate more frequently to reflect changes in the portfolio’s expected yield. Investors should be aware that “(mth)” Share Classes givepriority to dividends, rather than to capital growth. The expected yield for each Share Class will be calculated gross of both the Management and AdvisoryFee and the Operating and Administrative Expenses, and such Share Classes will typically distribute more than the income received. Dividend payments forthese Share Classes will normally be made to Shareholders each month and will be paid in the currency of the relevant Share Class. The ManagementCompany reserves the right to fix a minimum amount per Share Class, below which the actual payment of the dividend would not be economically efficientfor the SICAV. These payments will be deferred to the following month or reinvested in further Shares of the same Share Class and not paid directly to theShareholders. The net asset value of “(mth)” Share Classes may fluctuate more than other Share Classes due to more frequent distribution of income.
Share Classes suffixed “(fix)”
Share Classes with the suffix “(fix)” will normally pay a quarterly fixed dividend based on a total amount per Share per annum as defined in the Prospectus.
Share Classes with the suffix “(fix)” may be closed to further subscriptions, liquidated, not pay a dividend or reduce the dividend amount payable if thepayment of the dividend is believed not to be in the best interests of all Shareholders collectively in the Share Class.
Share Classes suffixed “(irc)”
Share Classes with the suffix “(irc)” will normally pay dividends on a monthly basis. The monthly dividend rate per Share will be variable and will be calculatedby the Management Company based on: the estimated gross annual yield of the relevant Sub-Fund’s portfolio attributable to that Share Class, which isrevised at least semi-annually; and the addition or deduction of the estimated interest rate carry depending on whether such carry is positive or negativerespectively. The interest rate carry is calculated using the average daily differential of the one month FX forward rate and the spot rate between these twocurrencies of the preceding calendar month.
20
JPMorgan Investment Funds
Notes to the Financial Statements (continued)
As at 31 December 2018

Other Information
Shareholders should note that, where the dividend rate is in excess of the investment income of the Share Class, dividends will be paid out of the capitalattributed to the Share Class, as well as from realised and unrealised capital gains. This may be tax inefficient for Shareholders in certain countries.Shareholders should consult their local tax adviser about their own position. Share Classes with the suffix “(div)”, “(fix)” and “(mth)” do not distribute thereportable income in accordance with the United Kingdom tax legislation relating to offshore funds.
During the year ended 31 December 2018, the SICAV paid dividends as follows:
Class Name CurrencyDividendAmount
per SharePayment
DateJPM Global Dividend A (mth) - USD (hedged) USD 0.31 17/01/18JPM Global Dividend D (mth) - EUR (hedged) EUR 0.30 17/01/18JPM Global High Yield Bond A (irc) - AUD (hedged) AUD 0.05 17/01/18JPM Global High Yield Bond A (irc) - CAD (hedged) CAD 0.04 17/01/18JPM Global High Yield Bond A (irc) - NZD (hedged) NZD 0.06 17/01/18JPM Global High Yield Bond A (irc) - RMB (hedged) CNH 0.07 17/01/18JPM Global High Yield Bond A (mth) - HKD HKD 0.06 17/01/18JPM Global High Yield Bond A (mth) - SGD SGD 0.07 17/01/18JPM Global High Yield Bond A (mth) - USD USD 0.51 17/01/18JPM Global High Yield Bond C (irc) - CAD (hedged) CAD 0.05 17/01/18JPM Global High Yield Bond C (mth) - HKD HKD 0.06 17/01/18JPM Global High Yield Bond C (mth) - USD USD 0.52 17/01/18JPM Global High Yield Bond D (mth) - EUR (hedged) EUR 0.53 17/01/18JPM Global High Yield Bond I (mth) - USD USD 0.51 17/01/18JPM Global Dividend A (div) - EUR EUR 0.98 22/02/18JPM Global Dividend A (div) - EUR (hedged) EUR 0.89 22/02/18JPM Global Dividend A (div) - USD USD 1.23 22/02/18JPM Global Dividend A (mth) - USD (hedged) USD 0.33 22/02/18JPM Global Dividend D (div) - EUR (hedged) EUR 0.85 22/02/18JPM Global Dividend D (mth) - EUR (hedged) EUR 0.31 22/02/18JPM Global Dividend F (mth) - USD (hedged) USD 0.30 22/02/18JPM Global High Yield Bond A (irc) - AUD (hedged) AUD 0.05 22/02/18JPM Global High Yield Bond A (irc) - CAD (hedged) CAD 0.05 22/02/18JPM Global High Yield Bond A (irc) - NZD (hedged) NZD 0.06 22/02/18JPM Global High Yield Bond A (irc) - RMB (hedged) CNH 0.07 22/02/18JPM Global High Yield Bond A (mth) - HKD HKD 0.06 22/02/18JPM Global High Yield Bond A (mth) - SGD SGD 0.07 22/02/18JPM Global High Yield Bond A (mth) - USD USD 0.51 22/02/18JPM Global High Yield Bond C (div) - EUR (hedged) EUR 1.13 22/02/18JPM Global High Yield Bond C (irc) - CAD (hedged) CAD 0.05 22/02/18JPM Global High Yield Bond C (mth) - HKD HKD 0.06 22/02/18JPM Global High Yield Bond C (mth) - USD USD 0.53 22/02/18JPM Global High Yield Bond D (div) - EUR (hedged) EUR 1.07 22/02/18JPM Global High Yield Bond D (mth) - EUR (hedged) EUR 0.53 22/02/18JPM Global High Yield Bond F (irc) - AUD (hedged) AUD 0.06 22/02/18JPM Global High Yield Bond F (mth) - USD USD 0.54 22/02/18JPM Global High Yield Bond I (mth) - USD USD 0.51 22/02/18JPM Global High Yield Bond I2 (mth) - USD USD 0.54 22/02/18JPM Global Dividend A (mth) - USD (hedged) USD 0.33 16/03/18JPM Global Dividend D (mth) - EUR (hedged) EUR 0.31 16/03/18JPM Global Dividend F (mth) - USD (hedged) USD 0.30 16/03/18JPM Global High Yield Bond A (irc) - AUD (hedged) AUD 0.05 16/03/18JPM Global High Yield Bond A (irc) - CAD (hedged) CAD 0.05 16/03/18JPM Global High Yield Bond A (irc) - NZD (hedged) NZD 0.06 16/03/18JPM Global High Yield Bond A (irc) - RMB (hedged) CNH 0.06 16/03/18JPM Global High Yield Bond A (mth) - HKD HKD 0.06 16/03/18JPM Global High Yield Bond A (mth) - SGD SGD 0.07 16/03/18JPM Global High Yield Bond A (mth) - USD USD 0.51 16/03/18JPM Global High Yield Bond C (irc) - CAD (hedged) CAD 0.05 16/03/18JPM Global High Yield Bond C (mth) - HKD HKD 0.06 16/03/18JPM Global High Yield Bond C (mth) - USD USD 0.53 16/03/18JPM Global High Yield Bond D (mth) - EUR (hedged) EUR 0.53 16/03/18JPM Global High Yield Bond F (irc) - AUD (hedged) AUD 0.06 16/03/18JPM Global High Yield Bond F (mth) - USD USD 0.54 16/03/18JPM Global High Yield Bond I (mth) - USD USD 0.51 16/03/18JPM Global High Yield Bond I2 (mth) - USD USD 0.54 16/03/18JPM Global High Yield Bond X (mth) - USD USD 0.54 16/03/18JPM Europe Select Equity A (dist) - EUR EUR 0.73 22/03/18JPM Europe Select Equity C (dist) - EUR EUR 1.33 22/03/18JPM Europe Select Equity C (dist) - GBP GBP 1.05 22/03/18JPM Europe Select Equity I (dist) - EUR EUR 2.57 22/03/18JPM Europe Select Equity I2 (dist) - EUR EUR 0.01 22/03/18JPM Europe Select Equity X (dist) - EUR EUR 3.38 22/03/18JPM Global Dividend A (dist) - EUR (hedged) EUR 0.01 22/03/18
Class Name CurrencyDividendAmount
per SharePayment
DateJPM Global Dividend A (dist) - USD USD 2.26 22/03/18JPM Global Dividend C (dist) - EUR EUR 3.32 22/03/18JPM Global Dividend C (dist) - EUR (hedged) EUR 1.41 22/03/18JPM Global Dividend X (dist) - AUD AUD 0.42 22/03/18JPM Global High Yield Bond A (dist) - EUR (hedged) EUR 3.45 22/03/18JPM Global High Yield Bond A (dist) - USD USD 4.82 22/03/18JPM Global High Yield Bond C (dist) - EUR (hedged) EUR 3.45 22/03/18JPM Global High Yield Bond C (dist) - GBP (hedged) GBP 3.33 22/03/18JPM Global High Yield Bond C (dist) - USD USD 6.14 22/03/18JPM Global High Yield Bond I (dist) - EUR (hedged) EUR 4.15 22/03/18JPM Global High Yield Bond I2 (dist) - EUR (hedged) EUR 0.01 22/03/18JPM Global High Yield Bond I2 (dist) - GBP (hedged) GBP 0.01 22/03/18JPM Global High Yield Bond I2 (dist) - USD USD 0.01 22/03/18JPM Global High Yield Bond P (dist) - EUR (hedged) EUR 4.69 22/03/18JPM Global High Yield Bond P (dist) - USD USD 4.60 22/03/18JPM Global Dividend A (mth) - USD (hedged) USD 0.33 18/04/18JPM Global Dividend D (mth) - EUR (hedged) EUR 0.31 18/04/18JPM Global Dividend F (mth) - USD (hedged) USD 0.30 18/04/18JPM Global High Yield Bond A (irc) - AUD (hedged) AUD 0.05 18/04/18JPM Global High Yield Bond A (irc) - CAD (hedged) CAD 0.04 18/04/18JPM Global High Yield Bond A (irc) - NZD (hedged) NZD 0.06 18/04/18JPM Global High Yield Bond A (irc) - RMB (hedged) CNH 0.06 18/04/18JPM Global High Yield Bond A (mth) - HKD HKD 0.06 18/04/18JPM Global High Yield Bond A (mth) - SGD SGD 0.07 18/04/18JPM Global High Yield Bond A (mth) - USD USD 0.51 18/04/18JPM Global High Yield Bond C (irc) - CAD (hedged) CAD 0.05 18/04/18JPM Global High Yield Bond C (mth) - HKD HKD 0.06 18/04/18JPM Global High Yield Bond C (mth) - USD USD 0.53 18/04/18JPM Global High Yield Bond D (mth) - EUR (hedged) EUR 0.53 18/04/18JPM Global High Yield Bond F (irc) - AUD (hedged) AUD 0.05 18/04/18JPM Global High Yield Bond F (mth) - USD USD 0.54 18/04/18JPM Global High Yield Bond I (mth) - USD USD 0.51 18/04/18JPM Global High Yield Bond I2 (mth) - USD USD 0.54 18/04/18JPM Global High Yield Bond X (mth) - USD USD 0.54 18/04/18JPM Global Dividend A (mth) - USD (hedged) USD 0.33 17/05/18JPM Global Dividend D (mth) - EUR (hedged) EUR 0.31 17/05/18JPM Global Dividend F (mth) - USD (hedged) USD 0.29 17/05/18JPM Global High Yield Bond A (irc) - AUD (hedged) AUD 0.05 17/05/18JPM Global High Yield Bond A (irc) - CAD (hedged) CAD 0.04 17/05/18JPM Global High Yield Bond A (irc) - NZD (hedged) NZD 0.06 17/05/18JPM Global High Yield Bond A (irc) - RMB (hedged) CNH 0.06 17/05/18JPM Global High Yield Bond A (mth) - HKD HKD 0.06 17/05/18JPM Global High Yield Bond A (mth) - SGD SGD 0.06 17/05/18JPM Global High Yield Bond A (mth) - USD USD 0.50 17/05/18JPM Global High Yield Bond C (irc) - CAD (hedged) CAD 0.05 17/05/18JPM Global High Yield Bond C (mth) - HKD HKD 0.06 17/05/18JPM Global High Yield Bond C (mth) - USD USD 0.51 17/05/18JPM Global High Yield Bond D (mth) - EUR (hedged) EUR 0.51 17/05/18JPM Global High Yield Bond F (irc) - AUD (hedged) AUD 0.05 17/05/18JPM Global High Yield Bond F (mth) - USD USD 0.53 17/05/18JPM Global High Yield Bond I (mth) - USD USD 0.49 17/05/18JPM Global High Yield Bond I2 (mth) - USD USD 0.53 17/05/18JPM Global High Yield Bond X (mth) - USD USD 0.53 17/05/18JPM Global Dividend A (div) - EUR EUR 1.00 23/05/18JPM Global Dividend A (div) - EUR (hedged) EUR 0.89 23/05/18JPM Global Dividend A (div) - USD USD 1.21 23/05/18JPM Global Dividend D (div) - EUR (hedged) EUR 0.85 23/05/18JPM Global High Yield Bond C (div) - EUR (hedged) EUR 1.09 23/05/18JPM Global High Yield Bond D (div) - EUR (hedged) EUR 1.03 23/05/18JPM Global Dividend A (mth) - USD (hedged) USD 0.33 19/06/18JPM Global Dividend D (mth) - EUR (hedged) EUR 0.31 19/06/18JPM Global Dividend F (mth) - USD (hedged) USD 0.29 19/06/18JPM Global High Yield Bond A (irc) - AUD (hedged) AUD 0.04 19/06/18JPM Global High Yield Bond A (irc) - CAD (hedged) CAD 0.04 19/06/18
21
JPMorgan Investment Funds
Notes to the Financial Statements (continued)
As at 31 December 2018

Class Name CurrencyDividendAmount
per SharePayment
DateJPM Global High Yield Bond A (irc) - NZD (hedged) NZD 0.06 19/06/18JPM Global High Yield Bond A (irc) - RMB (hedged) CNH 0.06 19/06/18JPM Global High Yield Bond A (mth) - HKD HKD 0.06 19/06/18JPM Global High Yield Bond A (mth) - SGD SGD 0.06 19/06/18JPM Global High Yield Bond A (mth) - USD USD 0.50 19/06/18JPM Global High Yield Bond C (irc) - CAD (hedged) CAD 0.05 19/06/18JPM Global High Yield Bond C (mth) - HKD HKD 0.06 19/06/18JPM Global High Yield Bond C (mth) - USD USD 0.51 19/06/18JPM Global High Yield Bond D (mth) - EUR (hedged) EUR 0.51 19/06/18JPM Global High Yield Bond F (irc) - AUD (hedged) AUD 0.05 19/06/18JPM Global High Yield Bond F (mth) - USD USD 0.53 19/06/18JPM Global High Yield Bond I (mth) - USD USD 0.49 19/06/18JPM Global High Yield Bond I2 (mth) - USD USD 0.53 19/06/18JPM Global High Yield Bond X (mth) - USD USD 0.53 19/06/18JPM Global Dividend A (mth) - USD (hedged) USD 0.33 18/07/18JPM Global Dividend D (mth) - EUR (hedged) EUR 0.31 18/07/18JPM Global Dividend F (mth) - USD (hedged) USD 0.29 18/07/18JPM Global High Yield Bond A (irc) - AUD (hedged) AUD 0.04 18/07/18JPM Global High Yield Bond A (irc) - CAD (hedged) CAD 0.04 18/07/18JPM Global High Yield Bond A (irc) - NZD (hedged) NZD 0.06 18/07/18JPM Global High Yield Bond A (irc) - RMB (hedged) CNH 0.06 18/07/18JPM Global High Yield Bond A (mth) - HKD HKD 0.06 18/07/18JPM Global High Yield Bond A (mth) - SGD SGD 0.06 18/07/18JPM Global High Yield Bond A (mth) - USD USD 0.50 18/07/18JPM Global High Yield Bond C (irc) - CAD (hedged) CAD 0.05 18/07/18JPM Global High Yield Bond C (mth) - HKD HKD 0.06 18/07/18JPM Global High Yield Bond C (mth) - USD USD 0.51 18/07/18JPM Global High Yield Bond D (mth) - EUR (hedged) EUR 0.51 18/07/18JPM Global High Yield Bond F (irc) - AUD (hedged) AUD 0.05 18/07/18JPM Global High Yield Bond F (mth) - USD USD 0.53 18/07/18JPM Global High Yield Bond I (mth) - USD USD 0.49 18/07/18JPM Global High Yield Bond I2 (mth) - USD USD 0.53 18/07/18JPM Global High Yield Bond X (mth) - USD USD 0.53 18/07/18JPM Global Dividend A (mth) - USD (hedged) USD 0.33 17/08/18JPM Global Dividend D (mth) - EUR (hedged) EUR 0.31 17/08/18JPM Global Dividend F (mth) - USD (hedged) USD 0.29 17/08/18JPM Global High Yield Bond A (irc) - AUD (hedged) AUD 0.04 17/08/18JPM Global High Yield Bond A (irc) - CAD (hedged) CAD 0.04 17/08/18JPM Global High Yield Bond A (irc) - NZD (hedged) NZD 0.06 17/08/18JPM Global High Yield Bond A (irc) - RMB (hedged) CNH 0.05 17/08/18JPM Global High Yield Bond A (mth) - HKD HKD 0.06 17/08/18JPM Global High Yield Bond A (mth) - SGD SGD 0.06 17/08/18JPM Global High Yield Bond A (mth) - USD USD 0.49 17/08/18JPM Global High Yield Bond C (irc) - CAD (hedged) CAD 0.05 17/08/18JPM Global High Yield Bond C (mth) - HKD HKD 0.05 17/08/18JPM Global High Yield Bond C (mth) - USD USD 0.50 17/08/18JPM Global High Yield Bond D (mth) - EUR (hedged) EUR 0.50 17/08/18JPM Global High Yield Bond F (irc) - AUD (hedged) AUD 0.05 17/08/18JPM Global High Yield Bond F (mth) - USD USD 0.52 17/08/18JPM Global High Yield Bond I (mth) - USD USD 0.49 17/08/18JPM Global High Yield Bond I2 (mth) - USD USD 0.52 17/08/18JPM Global High Yield Bond X (mth) - USD USD 0.52 17/08/18JPM Global Dividend A (div) - EUR EUR 1.04 23/08/18JPM Global Dividend A (div) - EUR (hedged) EUR 0.91 23/08/18JPM Global Dividend A (div) - USD USD 1.23 23/08/18JPM Global Dividend D (div) - EUR (hedged) EUR 0.87 23/08/18JPM Global High Yield Bond C (div) - EUR (hedged) EUR 1.09 23/08/18JPM Global High Yield Bond D (div) - EUR (hedged) EUR 1.03 23/08/18JPM Global Dividend A (mth) - USD (hedged) USD 0.33 18/09/18JPM Global Dividend D (mth) - EUR (hedged) EUR 0.31 18/09/18JPM Global Dividend F (mth) - USD (hedged) USD 0.29 18/09/18JPM Global High Yield Bond A (irc) - AUD (hedged) AUD 0.04 18/09/18JPM Global High Yield Bond A (irc) - CAD (hedged) CAD 0.04 18/09/18JPM Global High Yield Bond A (irc) - NZD (hedged) NZD 0.06 18/09/18JPM Global High Yield Bond A (irc) - RMB (hedged) CNH 0.05 18/09/18JPM Global High Yield Bond A (mth) - HKD HKD 0.06 18/09/18JPM Global High Yield Bond A (mth) - SGD SGD 0.06 18/09/18JPM Global High Yield Bond A (mth) - USD USD 0.49 18/09/18JPM Global High Yield Bond C (irc) - CAD (hedged) CAD 0.05 18/09/18JPM Global High Yield Bond C (mth) - HKD HKD 0.05 18/09/18JPM Global High Yield Bond C (mth) - USD USD 0.50 18/09/18
Class Name CurrencyDividendAmount
per SharePayment
DateJPM Global High Yield Bond D (mth) - EUR (hedged) EUR 0.50 18/09/18JPM Global High Yield Bond F (irc) - AUD (hedged) AUD 0.05 18/09/18JPM Global High Yield Bond F (mth) - USD USD 0.52 18/09/18JPM Global High Yield Bond I (mth) - USD USD 0.49 18/09/18JPM Global High Yield Bond I2 (mth) - USD USD 0.52 18/09/18JPM Global High Yield Bond X (mth) - USD USD 0.52 18/09/18JPM Global Dividend A (mth) - USD (hedged) USD 0.33 18/10/18JPM Global Dividend D (mth) - EUR (hedged) EUR 0.31 18/10/18JPM Global Dividend F (mth) - USD (hedged) USD 0.29 18/10/18JPM Global High Yield Bond A (irc) - AUD (hedged) AUD 0.04 18/10/18JPM Global High Yield Bond A (irc) - CAD (hedged) CAD 0.04 18/10/18JPM Global High Yield Bond A (irc) - NZD (hedged) NZD 0.06 18/10/18JPM Global High Yield Bond A (irc) - RMB (hedged) CNH 0.06 18/10/18JPM Global High Yield Bond A (mth) - HKD HKD 0.06 18/10/18JPM Global High Yield Bond A (mth) - SGD SGD 0.06 18/10/18JPM Global High Yield Bond A (mth) - USD USD 0.49 18/10/18JPM Global High Yield Bond C (irc) - CAD (hedged) CAD 0.05 18/10/18JPM Global High Yield Bond C (mth) - HKD HKD 0.05 18/10/18JPM Global High Yield Bond C (mth) - USD USD 0.50 18/10/18JPM Global High Yield Bond D (mth) - EUR (hedged) EUR 0.50 18/10/18JPM Global High Yield Bond F (irc) - AUD (hedged) AUD 0.05 18/10/18JPM Global High Yield Bond F (mth) - USD USD 0.52 18/10/18JPM Global High Yield Bond I (mth) - USD USD 0.49 18/10/18JPM Global High Yield Bond I2 (mth) - USD USD 0.52 18/10/18JPM Global High Yield Bond X (mth) - USD USD 0.52 18/10/18JPM Global Dividend A (mth) - USD (hedged) USD 0.31 16/11/18JPM Global Dividend D (mth) - EUR (hedged) EUR 0.29 16/11/18JPM Global Dividend F (mth) - USD (hedged) USD 0.27 16/11/18JPM Global High Yield Bond A (irc) - AUD (hedged) AUD 0.04 16/11/18JPM Global High Yield Bond A (irc) - CAD (hedged) CAD 0.04 16/11/18JPM Global High Yield Bond A (irc) - NZD (hedged) NZD 0.05 16/11/18JPM Global High Yield Bond A (irc) - RMB (hedged) CNH 0.06 16/11/18JPM Global High Yield Bond A (mth) - HKD HKD 0.05 16/11/18JPM Global High Yield Bond A (mth) - SGD SGD 0.07 16/11/18JPM Global High Yield Bond A (mth) - USD USD 0.49 16/11/18JPM Global High Yield Bond C (irc) - CAD (hedged) CAD 0.05 16/11/18JPM Global High Yield Bond C (mth) - HKD HKD 0.05 16/11/18JPM Global High Yield Bond C (mth) - USD USD 0.50 16/11/18JPM Global High Yield Bond D (mth) - EUR (hedged) EUR 0.49 16/11/18JPM Global High Yield Bond F (irc) - AUD (hedged) AUD 0.05 16/11/18JPM Global High Yield Bond F (mth) - USD USD 0.51 16/11/18JPM Global High Yield Bond I (mth) - USD USD 0.49 16/11/18JPM Global High Yield Bond I2 (mth) - USD USD 0.52 16/11/18JPM Global High Yield Bond X (mth) - USD USD 0.52 16/11/18JPM Global Dividend A (div) - EUR EUR 0.93 21/11/18JPM Global Dividend A (div) - EUR (hedged) EUR 0.80 21/11/18JPM Global Dividend A (div) - USD USD 1.09 21/11/18JPM Global Dividend C (div) - EUR* EUR 0.79 21/11/18JPM Global Dividend D (div) - EUR (hedged) EUR 0.76 21/11/18JPM Global High Yield Bond C (div) - EUR (hedged) EUR 1.05 21/11/18JPM Global High Yield Bond D (div) - EUR (hedged) EUR 0.99 21/11/18JPM Global Dividend A (mth) - USD (hedged) USD 0.31 11/12/18JPM Global Dividend D (mth) - EUR (hedged) EUR 0.29 11/12/18JPM Global Dividend F (mth) - USD (hedged) USD 0.27 11/12/18JPM Global High Yield Bond A (irc) - AUD (hedged) AUD 0.04 11/12/18JPM Global High Yield Bond A (irc) - CAD (hedged) CAD 0.04 11/12/18JPM Global High Yield Bond A (irc) - NZD (hedged) NZD 0.05 11/12/18JPM Global High Yield Bond A (irc) - RMB (hedged) CNH 0.05 11/12/18JPM Global High Yield Bond A (mth) - HKD HKD 0.05 11/12/18JPM Global High Yield Bond A (mth) - SGD SGD 0.07 11/12/18JPM Global High Yield Bond A (mth) - USD USD 0.49 11/12/18JPM Global High Yield Bond C (irc) - CAD (hedged) CAD 0.05 11/12/18JPM Global High Yield Bond C (mth) - HKD HKD 0.05 11/12/18JPM Global High Yield Bond C (mth) - USD USD 0.50 11/12/18JPM Global High Yield Bond D (mth) - EUR (hedged) EUR 0.49 11/12/18JPM Global High Yield Bond F (irc) - AUD (hedged) AUD 0.05 11/12/18JPM Global High Yield Bond F (mth) - USD USD 0.51 11/12/18JPM Global High Yield Bond I (mth) - USD USD 0.49 11/12/18JPM Global High Yield Bond I2 (mth) - USD USD 0.52 11/12/18JPM Global High Yield Bond X (mth) - USD USD 0.52 11/12/18
22
JPMorgan Investment Funds
Notes to the Financial Statements (continued)
As at 31 December 2018
* Share Class reactivated during the year.

5. Taxation
The SICAV is not subject to taxation in Luxembourg on its income, profits or gains. The SICAV is not subject to net wealth tax in Luxembourg. The only tax towhich the SICAV in Luxembourg is subject is the subscription tax (“taxe d’abonnement”) up to a rate of 0.05% per annum based on the net asset valueattributed to each Share Class at the end of the relevant quarter, calculated and paid quarterly. A reduced tax rate of 0.01% per annum of the net assets willbe applicable to Share Classes as identified in the Appendix. The 0.01% and 0.05% rates described above, as appropriate, are not applicable for the portionof the assets of the SICAV invested in other Luxembourg collective investment undertakings which are themselves already subject to the taxe d’abonnement.
No stamp duty, capital duty or other tax is payable in Luxembourg upon the issue of the Shares of the SICAV. No tax is payable on realised or unrealisedcapital appreciation of the assets of the SICAV in the Grand Duchy of Luxembourg. Although the SICAV’s realised capital gains, whether short or long-term,are not expected to become taxable in another country, the shareholders must be aware and recognise that such a possibility is not totally excluded. Theregular income of the SICAV from some of its securities, as well as interest earned on cash deposits in certain countries, may be subject to withholding taxesat varying rates, which normally cannot be recovered.
Following case law precedent within Europe, the SICAV has instigated proceedings to reclaim tax withheld by certain Member States of the European Unionon dividend payments it has received. The decision to initiate proceedings against any particular Member State is the result of an analysis of the likely costsand potential benefits of doing so and the likelihood of successfully reclaiming such amounts together with the estimated time to complete proceedingsvaries across Member States. Any costs associated with this decision have been charged to the relevant Sub-Funds and have been included within total costsfor the purposes of determining the relevant expense cap or TER and no amount has been recorded in the SICAV for any possible amounts to be receivedunder this action.
6. Statement of Changes in Investments
A list, specifying for each investment within each Sub-Fund the total purchases and sales which occurred during the financial year, may be obtained free ofcharge upon request at the registered office of the SICAV. Additional information on investments within each Sub-Fund’s portfolio is available toshareholders at the registered office of the SICAV.
7. Value of Financial Instruments and Associated Risks
The SICAV entered into forward currency exchange contracts, financial futures contracts, options and swaps which, to varying degrees, represent a marketrisk in excess of the amount reflected on the Combined Statement of Net Assets. The amount of the contracts represents the extent of the SICAV’sparticipation in these financial instruments. Market risks associated with such contracts arise due to the possible movements in foreign exchange rates,indices, and security values underlying these instruments. Other market and credit risks include the possibility that there may be an illiquid market for thecontracts, that a change in the value of the contracts may not directly correlate with changes in the value of the underlying currencies, indices, or securities,or that the counterparty to a contract defaults on its obligation to perform under the terms of the contract.
8. Collateral received with respect to Financial Techniques and Financial Derivative Instruments
Assets received from counterparties in securities lending activities and OTC derivative transactions other than currency forwards constitute collateral.
The SICAV will only enter into transactions with counterparties which the Management Company believes to be creditworthy. Approved counterparties willtypically have a public rating of A- or above. Counterparties will comply with prudential rules considered by the CSSF as equivalent to EU prudential rules. Thecounterparty does not have discretion over the composition or management of a Sub-Fund’s portfolio or over the underlying of financial derivativeinstruments used by a Sub-Fund. Counterparty approval is not required in relation to any investment decision made by a Sub-Fund.
Collateral may be offset against gross counterparty exposure provided it meets a range of standards, including those for liquidity, valuation, issuer creditquality, correlation and diversification. In offsetting collateral its value is reduced by a percentage (a “haircut”) which provides, inter alia, for short termfluctuations in the value of the exposure and of the collateral. Collateral levels are maintained to ensure that net counterparty exposure does not exceed thelimits per counterparty as set out in the Prospectus. If any, collateral is received in the form of securities and cash. Non-cash collateral received is not sold,reinvested or pledged.
Collateral received with respect to financial derivative instruments are shown in the Appendix.
9. Securities Lending
The SICAV may lend portions of its securities portfolio to third parties for the purpose of generating additional income or for reducing costs or risk, to themaximum extent allowed by and within the limits set forth in (i) article 11 of the Grand Ducal regulation of 8 February 2008 relating to certain definitions ofthe Luxembourg Law, (ii) CSSF Circular 08/356 relating to the rules applicable to undertakings for collective investments when they use certain techniquesand instruments relating to transferable securities and money market instruments (“CSSF Circular 08/356”) and (iii) any other applicable laws, regulations,circulars or CSSF positions.
A significant proportion of the income generated from the securities lending program is credited to participating Sub-Funds, with a portion of the incomebeing paid to JPMorgan Chase Bank, N.A. for its role as securities lending agent for the SICAV. Borrowers of securities lent by participating Sub-Funds areapproved by the Management Company after appropriate assessment of such borrowers’ status and financial standing. The Management Company waivesthe incremental income previously received from the portion of income generated from the securities lending program; for its oversight of the program;hence, 85% of any incremental income earned from securities lending is accrued to the applicable Sub-Fund, whilst the remaining 15% income is paid to thesecurities lending agent which arranges the transaction. The income earned from the securities lending program is detailed in the Combined Statement ofOperations and Changes in Net Assets.
As at 31 December 2018, the SICAV valuation of securities on loan is USD 617,486,453 as detailed below and received collateral with a market value of USD637,060,262.
Market Valueof Securities
on LoanCash
Collateral**Non Cash
Collateral* Base CurrencyLending
Income (Gross)Lending Agent
FeeLending
Income (Net)
Sub-Fund USD USD USD Base Currency Base Currency Base Currency
JPMorgan Investment Funds - Europe Select Equity Fund 9,652,016 - 10,164,836 EUR 293,574 44,036 249,538
JPMorgan Investment Funds - Global Dividend Fund 3,404,084 1,703,796 1,853,537 USD 17,602 2,641 14,961
JPMorgan Investment Funds - Global High Yield Bond Fund 454,628,590 334,750,826 130,352,274 USD 819,146 122,872 696,274
* The securities received as collateral are in the form of government securities (US, UK, Eurozone and other government securities). These securities are issued and guaranteed as to principal andinterest by the governments of the relevant countries.** Cash collateral may be reinvested into Reverse Repurchase Transactions with high quality government bonds as collateral. Income earned is recorded under the “Securities Lending Income” in theCombined Statement of Operations and Changes in Net Assets.
23
JPMorgan Investment Funds
Notes to the Financial Statements (continued)
As at 31 December 2018

10. Transactions with Connected Parties
All transactions with connected parties were carried out on an arm’s length basis.
JPMorgan Chase & Co. and its affiliates are counterparties for all securities lending activity and for certain forward foreign exchange contracts, financialfutures contracts and swaps contracts.The Management Company, Registrar and Transfer Agent, Domiciliary Agent and Global Distributor, InvestmentManagers, Custodian, Corporate and Administrative Agent and other related Agents of the SICAV are considered as connected parties as they are affiliatedentities of JPMorgan Chase & Co. In addition Elvinger Hoss Prussen, société anonyme (of which Mr Jacques Elvinger who is on the Board of Directors of theSICAV, is a partner) is compensated for legal services to the SICAV.
The following is a summary of transactions entered into during the year between the SICAV and the Manager and its Connected Persons. Connected Personsof the Manager are those as defined in the Code on Unit Trusts and Mutual Funds established by the Securities & Futures Commission of Hong Kong. All suchtransactions were entered into in the ordinary course of business and on normal commercial terms.
Investment transactions with Connected Persons of the Manager
All the amounts are in Sub-Fund Currency.
Authorised Sub-FundTotal purchases
and salesCurrency of
the Sub-FundPercentage of Sub-Fund’s total
transactions* for the yearTotal brokerage
commission paidAverage rate of
commission paid
JPMorgan Investment Funds - Europe Select Equity Fund 109,867 EUR - 88 0.08
JPMorgan Investment Funds - Global Dividend Fund - USD - - -
JPMorgan Investment Funds - Global High Yield Bond Fund 2,200,950 USD 0.12 - -
* Total transactions is the total value in Sub-Fund currency of purchases and sales dealt during the year to 31 December 2018.
11. Commission Sharing Arrangements
The Investment Managers may enter into commission sharing arrangements only where there is a direct and identifiable benefit to the clients of theInvestment Managers, including the SICAV, and where the Investment Managers are satisfied that the transactions generating the shared commissions aremade in good faith, in strict compliance with applicable regulatory requirements and in the best interests of the SICAV and the Shareholders. Any sucharrangements must be made by the Investment Manager on terms commensurate with best market practice. Due to their local regulatory rights, certainInvestment Managers may make use of soft commission to pay for research or execution services. Other jurisdictions may have other arrangements in placeto pay for such services in accordance with local regulatory obligations.
12. Information for German Registered Shareholders
A list, specifying for each investment within each Sub-Fund the total purchases and sales which occurred during the financial year, may be obtained free ofcharge upon request at the registered office of the SICAV and at the office of the German paying and information agent, JPMorgan Asset Management(Europe) S.à r.l., Frankfurt Branch, Taunustor 1, D-60310, Frankfurt am Main, Germany. Additional information on investments within each Sub-Fund’sportfolio is available to shareholders at the registered office of the SICAV and at the office of the German paying and information agent.
13. Information for Investors in Switzerland
Representative in Switzerland: JPMorgan Asset Management (Switzerland) LLC, Dreikönigstrasse 37, 8002 Zürich.
Paying Agent in Switzerland: J.P. Morgan (Suisse) SA, 8 Rue de la Confédération, 1204 Geneva.
The Prospectus, the Key Investor Information Documents, the articles of incorporation, the annual and semi-annual financial report as well as a list of thepurchases and sales which the SICAV has undertaken during the financial year may be obtained free of charge from the representative.
14. Authorisation of Sub-Funds in Hong Kong
Certain Share Classes of the following Sub-Funds are authorised in Hong Kong and are available to Hong Kong residents:
- JPMorgan Investment Funds - Europe Select Equity Fund;
- JPMorgan Investment Funds - Global Dividend Fund;
- JPMorgan Investment Funds - Global High Yield Bond Fund.
15. Directors’ Fees
The only remuneration paid to Directors is an annual fee. This is waived by Mr Daniel Watkins and Mr Massimo Greco. The total Directors’ fees for the yearamounted to EUR 236,000 of which EUR 56,000 was due to the Chairman.
16. Transaction Costs
For the year ended 31 December 2018, the SICAV incurred transaction costs which have been defined as brokerage fees relating to purchase or sale oftransferable securities, derivatives (except OTC derivatives) or other eligible assets. The SICAV also incurred transaction costs charged by the custodianagent and relating to purchase and sale of transferable securities as follows:
Sub-Fund Base Currency Custodian Transaction Costs andBrokerage Fees
(in Base Currency)
JPMorgan Investment Funds - Europe Select Equity Fund EUR 3,807,034
JPMorgan Investment Funds - Global Dividend Fund USD 369,281
JPMorgan Investment Funds - Global High Yield Bond Fund USD 51,814
For fixed income securities, transaction costs are not separately identifiable from the purchase price of the security and therefore cannot be disclosed separately.
24
JPMorgan Investment Funds
Notes to the Financial Statements (continued)
As at 31 December 2018

Transferable securities and money market instruments admitted to an official exchangelisting
Equities
AustriaErste Group Bank AG EUR 302,951 8,761,343 1.02
8,761,343 1.02
BelgiumKBC Group NV EUR 102,434 5,804,935 0.67
5,804,935 0.67
DenmarkNovo Nordisk A/S ‘B’ DKK 666,964 26,565,034 3.09
26,565,034 3.09
FinlandNordea Bank Abp SEK 1,454,202 10,607,032 1.23Wartsila OYJ Abp EUR 679,557 9,427,155 1.10
20,034,187 2.33
FranceAccor SA EUR 339,533 12,562,721 1.46Air Liquide SA EUR 109,115 11,808,971 1.37Alstom SA EUR 209,373 7,368,883 0.86BNP Paribas SA EUR 285,949 11,289,981 1.31Capgemini SE EUR 86,863 7,529,285 0.87LVMH Moet Hennessy Louis Vuitton SE EUR 74,310 19,188,700 2.23Natixis SA EUR 1,451,176 5,968,687 0.69Pernod Ricard SA EUR 90,595 12,946,026 1.50Publicis Groupe SA EUR 116,849 5,833,102 0.68Renault SA EUR 199,920 10,906,636 1.27Thales SA EUR 100,182 10,193,518 1.18TOTAL SA EUR 437,215 20,192,775 2.35Valeo SA EUR 215,165 5,488,859 0.64Vinci SA EUR 239,892 17,291,415 2.01
158,569,559 18.42
Germanyadidas AG EUR 47,239 8,623,479 1.00Deutsche Boerse AG EUR 63,967 6,690,948 0.78Deutsche Post AG EUR 417,092 9,976,841 1.16Infineon Technologies AG EUR 930,564 16,233,689 1.88Merck KGaA EUR 75,336 6,763,666 0.79MuenchenerRueckversicherungs-Gesellschaft AG EUR 91,100 17,347,718 2.01RWE AG EUR 442,504 8,428,595 0.98SAP SE EUR 202,566 17,669,832 2.05United Internet AG EUR 136,495 5,222,981 0.61Volkswagen AG Preference EUR 148,312 20,616,851 2.39
117,574,600 13.65
IrelandCRH plc EUR 494,086 11,314,569 1.32Kerry Group plc ‘A’ EUR 82,903 7,092,352 0.82Ryanair Holdings plc EUR 1,103,863 11,905,163 1.38
30,312,084 3.52
ItalyEnel SpA EUR 2,374,246 11,973,322 1.39FinecoBank Banca Fineco SpA EUR 490,460 4,304,277 0.50UniCredit SpA EUR 641,678 6,347,479 0.74
22,625,078 2.63
JerseyFerguson plc GBP 217,580 12,211,571 1.42Glencore plc GBP 5,442,025 17,744,970 2.06
29,956,541 3.48
NetherlandsAirbus SE EUR 136,164 11,431,649 1.33Akzo Nobel NV EUR 153,245 10,754,734 1.25ASML Holding NV EUR 121,064 16,601,506 1.93Heineken NV EUR 212,656 16,402,157 1.90Koninklijke Ahold Delhaize NV EUR 586,637 12,963,211 1.50Unilever NV, CVA EUR 194,176 9,207,341 1.07
77,360,598 8.98
NorwayTelenor ASA NOK 949,535 15,984,385 1.86
15,984,385 1.86
SpainIberdrola SA EUR 1,800,935 12,633,559 1.47Industria de Diseno Textil SA EUR 213,548 4,777,069 0.55Repsol SA EUR 776,658 10,958,644 1.27Repsol SA Rights 09/01/2019 EUR 776,658 311,673 0.04
28,680,945 3.33
SwitzerlandAdecco Group AG CHF 124,542 5,071,412 0.59Cie Financiere Richemont SA CHF 184,485 10,300,417 1.20Credit Suisse Group AG CHF 1,253,707 11,998,899 1.39Lonza Group AG CHF 33,535 7,567,960 0.88Nestle SA CHF 30,772 2,176,338 0.25Novartis AG CHF 387,672 28,874,929 3.35Roche Holding AG CHF 125,485 27,070,103 3.15
93,060,058 10.81
United Kingdom3i Group plc GBP 905,791 7,851,431 0.91Antofagasta plc GBP 714,905 6,269,652 0.73Aviva plc GBP 1,385,202 5,823,612 0.67Beazley plc GBP 1,296,481 7,322,154 0.85Carnival plc GBP 200,060 8,424,281 0.98Diageo plc GBP 591,064 18,495,527 2.15HSBC Holdings plc GBP 1,922,992 13,924,916 1.62Imperial Brands plc GBP 629,879 16,785,599 1.95Lloyds Banking Group plc GBP 10,030,542 5,817,676 0.67Prudential plc GBP 1,265,261 19,861,731 2.31RELX plc GBP 589,280 10,665,374 1.24Rio Tinto plc GBP 572,573 23,906,837 2.78Royal Dutch Shell plc ‘A’ GBP 1,008,572 26,050,322 3.02Standard Chartered plc GBP 1,696,028 11,570,364 1.34Taylor Wimpey plc GBP 6,372,907 9,732,918 1.13Unilever plc GBP 410,734 18,916,312 2.20
211,418,706 24.55
Total Equities 846,708,053 98.34
Total Transferable securities and money market instrumentsadmitted to an official exchange listing
846,708,053 98.34
Units of authorised UCITS or other collective investment undertakings
Collective Investment Schemes - UCITS
LuxembourgJPMorgan EUR Liquidity LVNAV Fund -JPM EUR Liquidity LVNAV X (flex dist.)† EUR 7,684,655 7,684,655 0.89
7,684,655 0.89
Total Collective Investment Schemes - UCITS 7,684,655 0.89
Total Units of authorised UCITS or other collective investmentundertakings
7,684,655 0.89
Total Investments 854,392,708 99.23
Cash 870,271 0.10
Other Assets/(Liabilities) 5,769,629 0.67
Total Net Assets 861,032,608 100.00
† Related Party Fund.
25
JPMorgan Investment Funds - Europe Select Equity Fund
Schedule of Investments
As at 31 December 2018
Investments Currency
Quantity/Nominal
Value
MarketValue
EUR
%of
NetAssets Investments Currency
Quantity/Nominal
Value
MarketValue
EUR
%of
NetAssets

Geographic Allocation of Portfolio as at 31 December 2018 % of Net AssetsUnited Kingdom 24.55France 18.42Germany 13.65Switzerland 10.81Netherlands 8.98Ireland 3.52Jersey 3.48Spain 3.33Denmark 3.09Italy 2.63Finland 2.33Norway 1.86Austria 1.02Luxembourg 0.89Belgium 0.67Total Investments 99.23Cash and Other Assets/(Liabilities) 0.77
Total 100.00
Geographic Allocation of Portfolio as at 30 June 2018(Unaudited)
% of Net Assets
United Kingdom 24.60France 17.46Germany 13.18Netherlands 11.15Switzerland 9.03Jersey 4.87Ireland 4.12Denmark 2.92Spain 2.82Italy 2.72Norway 1.64Luxembourg 1.53Sweden 1.26Austria 1.13Finland 1.09Total Investments 99.52Cash and Other Assets/(Liabilities) 0.48
Total 100.00
26
JPMorgan Investment Funds - Europe Select Equity Fund
Schedule of Investments (continued)
As at 31 December 2018
Investments Currency
Quantity/Nominal
Value
MarketValue
EUR
%of
NetAssets Investments Currency
Quantity/Nominal
Value
MarketValue
EUR
%of
NetAssets

JPMorgan Investment Funds - Europe Select Equity Fund
Schedule of Investments (continued)
As at 31 December 2018
Forward Currency Exchange Contracts
CurrencyPurchased
AmountPurchased Currency Sold Amount Sold
MaturityDate Counterparty
UnrealisedGain/(Loss)
EUR
%of
NetAssets
CHF 570,690 USD 570,040 17/01/2019 Goldman Sachs 8,013 -CHF 466,999 USD 471,898 17/01/2019 Merrill Lynch 1,812 -CHF 515,135 USD 518,514 17/01/2019 Standard Chartered 3,769 -EUR 970,575 CHF 1,093,318 17/01/2019 Merrill Lynch 1,345 -EUR 2,295,042 DKK 17,113,542 17/01/2019 Citibank 3,092 -EUR 26,700,268 GBP 23,353,603 17/01/2019 Goldman Sachs 569,565 0.07EUR 1,437,992 NOK 13,803,639 17/01/2019 Standard Chartered 51,041 0.01EUR 2,477,239 USD 2,825,263 17/01/2019 BNP Paribas 9,490 -EUR 1,504,453 USD 1,714,867 17/01/2019 Goldman Sachs 6,588 -EUR 302,123 USD 343,191 17/01/2019 Merrill Lynch 2,360 -EUR 1,093,999 USD 1,248,309 17/01/2019 State Street 3,653 -GBP 616,692 EUR 682,239 17/01/2019 Barclays 7,788 -GBP 1,377,718 USD 1,758,754 17/01/2019 BNP Paribas 5,352 -GBP 441,944 USD 563,571 17/01/2019 Merrill Lynch 2,242 -GBP 881,157 USD 1,126,414 17/01/2019 Morgan Stanley 2,064 -USD 1,479,207 EUR 1,291,718 17/01/2019 Goldman Sachs 308 -USD 577,552 EUR 504,111 17/01/2019 Standard Chartered 356 -USD 98,661,682 EUR 85,383,640 17/01/2019 Toronto-Dominion Bank 793,226 0.09USD 503,210 GBP 391,600 17/01/2019 Merrill Lynch 1,366 -
Total Unrealised Gain on Forward Currency Exchange Contracts 1,473,430 0.17
CHF 579,357 USD 588,379 17/01/2019 Merrill Lynch (323) -EUR 8,650,107 CHF 9,895,722 17/01/2019 Standard Chartered (122,483) (0.02)EUR 545,972 GBP 490,769 17/01/2019 RBC (3,158) -EUR 1,096,321 SEK 11,232,470 17/01/2019 Standard Chartered (1,419) -EUR 616,092 USD 705,798 17/01/2019 Goldman Sachs (393) -EUR 1,122,264 USD 1,287,324 17/01/2019 Toronto-Dominion Bank (2,160) -GBP 447,542 CHF 568,756 17/01/2019 Citibank (3,443) -GBP 679,352 EUR 764,970 17/01/2019 ANZ (4,833) -GBP 703,009 EUR 791,822 17/01/2019 Morgan Stanley (5,215) -GBP 424,169 USD 545,232 17/01/2019 State Street (1,628) -USD 546,241 EUR 482,565 17/01/2019 Goldman Sachs (5,446) -USD 895,375 EUR 789,407 17/01/2019 Morgan Stanley (7,334) -USD 682,553 EUR 596,945 17/01/2019 RBC (763) -USD 654,610 EUR 576,613 17/01/2019 Standard Chartered (4,839) -USD 539,752 EUR 472,002 17/01/2019 Toronto-Dominion Bank (551) -USD 476,989 GBP 377,325 17/01/2019 HSBC (5,565) -USD 621,570 GBP 487,603 17/01/2019 Merrill Lynch (2,671) -USD 645,205 GBP 505,862 17/01/2019 Standard Chartered (2,457) -
Total Unrealised Loss on Forward Currency Exchange Contracts (174,681) (0.02)
Net Unrealised Gain on Forward Currency Exchange Contracts 1,298,749 0.15
27

Transferable securities and money market instruments admitted to an official exchangelisting
Equities
AustraliaGoodman Group, REIT AUD 131,007 982,389 0.56
982,389 0.56
AustriaErste Group Bank AG EUR 46,039 1,522,497 0.87
1,522,497 0.87
BermudaCredicorp Ltd. USD 5,169 1,133,820 0.65
1,133,820 0.65
BrazilLojas Renner SA BRL 104,502 1,143,205 0.66
1,143,205 0.66
CanadaTransCanada Corp. CAD 76,844 2,750,142 1.58
2,750,142 1.58
ChinaChina Construction Bank Corp. ‘H’ HKD 1,747,000 1,439,667 0.83Ping An Insurance Group Co. of ChinaLtd. ‘H’ HKD 137,000 1,209,007 0.69
2,648,674 1.52
DenmarkNovo Nordisk A/S ‘B’ DKK 48,726 2,219,224 1.27
2,219,224 1.27
FinlandKonecranes OYJ EUR 26,595 801,485 0.46Nordea Bank Abp SEK 147,664 1,231,618 0.70Outokumpu OYJ EUR 127,876 466,896 0.27
2,499,999 1.43
FranceCie Generale des Etablissements MichelinSCA EUR 14,068 1,391,653 0.80LVMH Moet Hennessy Louis Vuitton SE EUR 9,271 2,737,520 1.57Orange SA EUR 90,993 1,473,082 0.84Sanofi EUR 20,286 1,753,333 1.01Schneider Electric SE EUR 31,077 2,122,579 1.22Thales SA EUR 7,080 823,759 0.47Vinci SA EUR 31,557 2,601,015 1.49
12,902,941 7.40
GermanyBASF SE EUR 9,547 660,254 0.38Continental AG EUR 3,313 456,026 0.26MuenchenerRueckversicherungs-Gesellschaft AG EUR 6,117 1,331,971 0.76Volkswagen AG Preference EUR 10,155 1,614,204 0.93
4,062,455 2.33
Hong KongHong Kong Exchanges & Clearing Ltd. HKD 58,500 1,691,598 0.97
1,691,598 0.97
IndiaHousing Development Finance Corp. Ltd. INR 40,187 1,131,931 0.65
1,131,931 0.65
IndonesiaTelekomunikasi Indonesia PerseroTbk. PT, ADR USD 36,629 966,090 0.55
966,090 0.55
IrelandAccenture plc ‘A’ USD 7,883 1,109,374 0.63CRH plc GBP 41,935 1,111,465 0.64Medtronic plc USD 23,476 2,123,287 1.22
4,344,126 2.49
ItalyEnel SpA EUR 300,392 1,732,246 0.99
1,732,246 0.99
JapanJXTG Holdings, Inc. JPY 172,100 903,011 0.52Marui Group Co. Ltd. JPY 53,200 1,032,181 0.59Nippon Telegraph & Telephone Corp. JPY 22,600 921,235 0.53Sumitomo Mitsui Financial Group, Inc. JPY 31,300 1,037,596 0.59Tokio Marine Holdings, Inc. JPY 14,300 680,782 0.39Toyota Motor Corp. JPY 25,900 1,509,058 0.87
6,083,863 3.49
JerseyFerguson plc GBP 30,453 1,954,407 1.12Glencore plc GBP 338,511 1,262,176 0.73
3,216,583 1.85
MexicoBanco Santander Mexico SA Institucionde Banca Multiple Grupo FinancieroSantand ‘B’ MXN 623,652 775,381 0.45
775,381 0.45
NetherlandsAirbus SE EUR 25,994 2,495,468 1.43ASML Holding NV EUR 4,943 775,096 0.44Unilever NV, CVA EUR 27,544 1,493,475 0.86
4,764,039 2.73
NorwayNorsk Hydro ASA NOK 358,745 1,616,812 0.93
1,616,812 0.93
RussiaSberbank of Russia PJSC, ADR USD 65,268 715,664 0.41
715,664 0.41
SingaporeDBS Group Holdings Ltd. SGD 107,610 1,871,568 1.07
1,871,568 1.07
South AfricaBid Corp. Ltd. ZAR 69,458 1,278,696 0.73
1,278,696 0.73
South KoreaSamsung Electronics Co. Ltd. KRW 49,443 1,715,216 0.98
1,715,216 0.98
SpainIberdrola SA EUR 464,530 3,726,266 2.14Industria de Diseno Textil SA EUR 54,763 1,400,830 0.80
5,127,096 2.94
SupranationalHKT Trust & HKT Ltd. HKD 550,000 791,334 0.45
791,334 0.45
SwedenSvenska Handelsbanken AB ‘A’ SEK 108,469 1,185,869 0.68
1,185,869 0.68
SwitzerlandNovartis AG CHF 39,719 3,382,884 1.94Roche Holding AG CHF 11,755 2,899,700 1.66Swiss Re AG CHF 25,985 2,372,760 1.36
8,655,344 4.96
United Kingdom3i Group plc GBP 215,997 2,140,922 1.23Aviva plc GBP 253,700 1,219,641 0.70BAE Systems plc GBP 178,190 1,049,037 0.60Diageo plc GBP 25,902 926,825 0.53Imperial Brands plc GBP 39,492 1,203,431 0.69Prudential plc GBP 170,152 3,054,263 1.75
28
JPMorgan Investment Funds - Global Dividend Fund
Schedule of Investments
As at 31 December 2018
Investments Currency
Quantity/Nominal
Value
MarketValue
USD
%of
NetAssets Investments Currency
Quantity/Nominal
Value
MarketValue
USD
%of
NetAssets

Rio Tinto plc GBP 42,152 2,012,527 1.16Royal Dutch Shell plc ‘A’ GBP 102,818 3,036,741 1.74Taylor Wimpey plc GBP 731,681 1,277,790 0.73
15,921,177 9.13
United States of AmericaAlphabet, Inc. ‘A’ USD 3,585 3,752,384 2.15Analog Devices, Inc. USD 30,729 2,640,697 1.51Apple, Inc. USD 9,744 1,538,675 0.88AT&T, Inc. USD 17,917 506,962 0.29Automatic Data Processing, Inc. USD 8,745 1,138,949 0.65AvalonBay Communities, Inc., REIT USD 5,252 908,255 0.52Bank of America Corp. USD 45,440 1,114,870 0.64Bank of New York Mellon Corp. (The) USD 25,309 1,195,091 0.69Chevron Corp. USD 17,221 1,880,275 1.08Citigroup, Inc. USD 53,767 2,788,894 1.60Coca-Cola Co. (The) USD 60,944 2,879,909 1.65Comcast Corp. ‘A’ USD 82,811 2,806,879 1.61CVS Health Corp. USD 15,902 1,043,887 0.60DowDuPont, Inc. USD 39,270 2,097,607 1.20Home Depot, Inc. (The) USD 11,452 1,967,167 1.13International Business Machines Corp. USD 16,431 1,866,397 1.07Johnson & Johnson USD 10,518 1,350,722 0.77Marathon Petroleum Corp. USD 31,864 1,866,752 1.07Microsoft Corp. USD 80,859 8,164,333 4.68Mondelez International, Inc. ‘A’ USD 43,003 1,719,905 0.99Morgan Stanley USD 61,846 2,448,174 1.40NextEra Energy, Inc. USD 17,406 3,002,100 1.72Norfolk Southern Corp. USD 13,532 2,017,621 1.16Occidental Petroleum Corp. USD 31,737 1,941,828 1.11PepsiCo, Inc. USD 11,725 1,289,516 0.74Pfizer, Inc. USD 108,505 4,716,712 2.71Philip Morris International, Inc. USD 24,633 1,650,657 0.95Principal Financial Group, Inc. USD 31,818 1,391,242 0.80Prologis, Inc., REIT USD 13,946 815,144 0.47Stanley Black & Decker, Inc. USD 16,430 1,970,696 1.13Texas Instruments, Inc. USD 32,450 3,059,548 1.75United Parcel Service, Inc. ‘B’ USD 13,980 1,355,291 0.78UnitedHealth Group, Inc. USD 12,086 3,009,293 1.73Ventas, Inc., REIT USD 15,545 913,191 0.52Verizon Communications, Inc. USD 10,916 602,618 0.35Vornado Realty Trust, REIT USD 12,339 769,090 0.44Walt Disney Co. (The) USD 25,795 2,807,141 1.61
76,988,472 44.15
Total Equities 172,438,451 98.87
Total Transferable securities and money market instrumentsadmitted to an official exchange listing
172,438,451 98.87
Units of authorised UCITS or other collective investment undertakings
Collective Investment Schemes - UCITS
LuxembourgJPMorgan USD Liquidity LVNAV Fund -JPM USD Liquidity LVNAV X (dist.)† USD 1,880,196 1,880,196 1.08
1,880,196 1.08
Total Collective Investment Schemes - UCITS 1,880,196 1.08
Total Units of authorised UCITS or other collective investmentundertakings
1,880,196 1.08
Total Investments 174,318,647 99.95
Cash 589,353 0.34
Other Assets/(Liabilities) (505,356) (0.29)
Total Net Assets 174,402,644 100.00
† Related Party Fund.
Geographic Allocation of Portfolio as at 31 December 2018 % of Net AssetsUnited States of America 44.15United Kingdom 9.13France 7.40Switzerland 4.96Japan 3.49Spain 2.94Netherlands 2.73Ireland 2.49Germany 2.33Jersey 1.85Canada 1.58China 1.52Finland 1.43Denmark 1.27Luxembourg 1.08Singapore 1.07Italy 0.99South Korea 0.98Hong Kong 0.97Norway 0.93Austria 0.87South Africa 0.73Sweden 0.68Brazil 0.66Bermuda 0.65India 0.65Australia 0.56Indonesia 0.55Supranational 0.45Mexico 0.45Russia 0.41Total Investments 99.95Cash and Other Assets/(Liabilities) 0.05
Total 100.00
Geographic Allocation of Portfolio as at 30 June 2018(Unaudited)
% of Net Assets
United States of America 43.59United Kingdom 9.72Netherlands 5.81Ireland 5.28Japan 4.57France 3.61Switzerland 3.51Luxembourg 3.00Spain 2.50Jersey 1.61Canada 1.56Germany 1.50Sweden 1.50South Korea 1.24Hong Kong 1.10Italy 1.09Denmark 0.93Finland 0.88Norway 0.82Australia 0.79Bermuda 0.71China 0.66Supranational 0.65India 0.57Indonesia 0.50Russia 0.49Singapore 0.49South Africa 0.44Total Investments 99.12Cash and Other Assets/(Liabilities) 0.88
Total 100.00
29
JPMorgan Investment Funds - Global Dividend Fund
Schedule of Investments (continued)
As at 31 December 2018
Investments Currency
Quantity/Nominal
Value
MarketValue
USD
%of
NetAssets Investments Currency
Quantity/Nominal
Value
MarketValue
USD
%of
NetAssets

JPMorgan Investment Funds - Global Dividend Fund
Schedule of Investments (continued)
As at 31 December 2018
Forward Currency Exchange Contracts (continued)
CurrencyPurchased
AmountPurchased Currency Sold Amount Sold
MaturityDate Counterparty
UnrealisedGain/(Loss)
USD
%of
NetAssets
AUD 3,274,932 USD 2,307,461 07/01/2019 BNP Paribas 802 -CHF 2,472,331 USD 2,498,919 07/01/2019 Merrill Lynch 7,904 0.01CHF 708,211 USD 712,904 07/01/2019 State Street 5,187 -CHF 103,769 USD 104,857 17/01/2019 Merrill Lynch 461 -EUR 675,213 GBP 599,257 07/01/2019 State Street 5,093 -EUR 751,552 USD 853,506 07/01/2019 ANZ 6,170 -EUR 544,854 USD 622,896 07/01/2019 Barclays 345 -EUR 80,921,359 USD 91,923,715 07/01/2019 Citibank 639,566 0.37EUR 487,949 USD 552,966 07/01/2019 RBC 5,182 -EUR 102,114 USD 116,606 17/01/2019 Barclays 302 -EUR 55,101 USD 62,695 17/01/2019 BNP Paribas 389 -EUR 84,201 USD 96,077 17/01/2019 State Street 322 -EUR 76,540,572 USD 87,571,286 05/02/2019 Barclays 205,643 0.12GBP 485,840 EUR 536,192 05/02/2019 BNP Paribas 8,078 0.01GBP 3,734,683 USD 4,722,477 07/01/2019 Citibank 59,233 0.03GBP 82,708 USD 105,728 17/01/2019 Morgan Stanley 222 -JPY 60,553,025 EUR 478,094 05/02/2019 Deutsche Bank 3,605 -JPY 891,088,362 USD 7,951,730 07/01/2019 BNP Paribas 150,962 0.09JPY 822,141,823 USD 7,268,079 07/01/2019 Goldman Sachs 207,681 0.12JPY 27,391,122 USD 245,864 17/01/2019 Merrill Lynch 3,411 -JPY 822,141,823 USD 7,442,373 05/02/2019 BNP Paribas 50,688 0.03KRW 1,153,366,263 USD 1,025,807 07/01/2019 Merrill Lynch 8,662 0.01SEK 12,281,963 USD 1,366,276 07/01/2019 BNP Paribas 6,741 -SGD 1,244,273 USD 906,343 07/01/2019 RBC 6,473 -USD 2,371,748 AUD 3,274,932 07/01/2019 BNP Paribas 63,485 0.04USD 426,892 AUD 590,716 17/01/2019 National Australia Bank 10,453 0.01USD 592,668 BRL 2,297,868 05/02/2019 BNP Paribas 1,174 -USD 2,974,588 CAD 3,944,168 07/01/2019 Citibank 83,212 0.05USD 656,492 CAD 870,696 17/01/2019 BNP Paribas 18,031 0.01USD 2,903,937 CAD 3,944,168 05/02/2019 BNP Paribas 10,312 0.01USD 4,292,338 CHF 4,215,224 05/02/2019 Citibank 6,291 -USD 677,141 DKK 4,407,840 05/02/2019 Toronto-Dominion Bank 79 -USD 1,210,064 EUR 1,055,795 07/01/2019 Standard Chartered 2,374 -USD 734,741 EUR 640,392 05/02/2019 Goldman Sachs 338 -USD 1,131,658 EUR 986,223 05/02/2019 Merrill Lynch 655 -USD 445,828 GBP 347,735 07/01/2019 Merrill Lynch 605 -USD 4,993,164 HKD 39,033,704 07/01/2019 HSBC 9,373 0.01USD 771,391 HKD 6,030,415 17/01/2019 HSBC 1,192 -USD 3,662,612 HKD 28,649,259 08/02/2019 Standard Chartered 996 -USD 749,341 NOK 6,428,466 07/01/2019 BNP Paribas 10,212 0.01USD 198,739 NOK 1,706,696 17/01/2019 State Street 2,411 -USD 740,874 NOK 6,428,466 05/02/2019 Toronto-Dominion Bank 701 -USD 460,660 RUB 31,039,242 11/01/2019 Goldman Sachs 14,097 0.01USD 61,760 RUB 4,155,577 17/01/2019 Goldman Sachs 2,029 -USD 445,263 RUB 31,039,242 05/02/2019 Goldman Sachs 385 -USD 672,407 ZAR 9,375,127 07/01/2019 Goldman Sachs 21,383 0.01USD 138,156 ZAR 1,935,841 17/01/2019 Goldman Sachs 3,897 -ZAR 9,375,127 USD 645,214 07/01/2019 Barclays 5,809 -
Total Unrealised Gain on Forward Currency Exchange Contracts 1,652,616 0.95
AUD 4,436,745 USD 3,213,148 07/01/2019 BNP Paribas (86,007) (0.05)BRL 2,297,868 USD 593,913 07/01/2019 BNP Paribas (1,066) -CAD 3,944,168 USD 2,901,790 07/01/2019 BNP Paribas (10,414) (0.01)CAD 3,501,393 USD 2,640,658 07/01/2019 Citibank (73,870) (0.04)CHF 4,215,224 USD 4,280,739 07/01/2019 Citibank (6,706) -DKK 4,407,840 USD 675,327 07/01/2019 Toronto-Dominion Bank (113) -EUR 405,505 USD 464,067 07/01/2019 State Street (223) -EUR 98,353 USD 112,674 17/01/2019 Goldman Sachs (72) -EUR 102,573 USD 117,932 17/01/2019 Merrill Lynch (499) -EUR 651,518 USD 747,274 05/02/2019 Merrill Lynch (111) -GBP 896,504 CHF 1,145,458 07/01/2019 Standard Chartered (13,598) (0.01)GBP 755,289 EUR 846,490 07/01/2019 Merrill Lynch (1,236) -GBP 452,426 EUR 507,151 07/01/2019 Standard Chartered (848) -HKD 23,241,380 USD 2,972,157 07/01/2019 HSBC (4,718) -HKD 28,649,259 USD 3,659,180 07/01/2019 Standard Chartered (1,267) -NOK 6,428,466 USD 739,908 07/01/2019 Toronto-Dominion Bank (779) -RUB 31,039,242 USD 446,812 11/01/2019 Goldman Sachs (250) -USD 2,308,522 AUD 3,274,932 05/02/2019 BNP Paribas (1,094) -USD 588,880 BRL 2,297,868 07/01/2019 Goldman Sachs (3,967) -USD 115,323 BRL 450,423 17/01/2019 BNP Paribas (819) -USD 6,280,296 CHF 6,250,308 07/01/2019 RBC (57,213) (0.03)USD 626,318 CHF 622,597 17/01/2019 State Street (5,578) -USD 2,505,745 CHF 2,472,331 05/02/2019 Merrill Lynch (8,125) (0.01)USD 670,843 DKK 4,407,840 07/01/2019 BNP Paribas (4,370) -USD 391,768 DKK 2,572,718 07/01/2019 Standard Chartered (2,333) -USD 159,575 DKK 1,049,291 17/01/2019 BNP Paribas (1,312) -USD 368,006 EUR 322,693 07/01/2019 ANZ (1,112) -USD 87,938,078 EUR 77,051,205 07/01/2019 Barclays (198,261) (0.11)USD 1,634,262 EUR 1,435,550 07/01/2019 BNP Paribas (7,817) (0.01)USD 16,343,637 EUR 14,387,840 07/01/2019 Citibank (114,141) (0.07)USD 613,235 EUR 539,368 07/01/2019 Goldman Sachs (3,731) -
30

JPMorgan Investment Funds - Global Dividend Fund
Schedule of Investments (continued)
As at 31 December 2018
Forward Currency Exchange Contracts (continued)
CurrencyPurchased
AmountPurchased Currency Sold Amount Sold
MaturityDate Counterparty
UnrealisedGain/(Loss)
USD
%of
NetAssets
USD 663,425 EUR 581,962 07/01/2019 Merrill Lynch (2,262) -USD 698,314 EUR 611,854 07/01/2019 RBC (1,565) -USD 129,508 EUR 113,615 17/01/2019 BNP Paribas (567) -USD 114,961 EUR 101,355 17/01/2019 Morgan Stanley (1,078) -USD 2,022,449 EUR 1,780,257 17/01/2019 RBC (15,724) (0.01)USD 756,727 EUR 661,180 05/02/2019 Merrill Lynch (1,516) -USD 485,736 GBP 383,017 07/01/2019 Barclays (4,660) -USD 894,899 GBP 700,118 07/01/2019 Citibank (1,499) -USD 17,172,763 GBP 13,417,856 07/01/2019 HSBC (6,820) (0.01)USD 1,039,438 GBP 813,980 17/01/2019 Toronto-Dominion Bank (3,286) -USD 4,729,219 GBP 3,734,683 05/02/2019 Citibank (59,704) (0.04)USD 7,425,246 JPY 822,141,823 07/01/2019 BNP Paribas (50,513) (0.03)USD 7,877,595 JPY 891,088,362 07/01/2019 Goldman Sachs (225,097) (0.13)USD 109,246 JPY 12,345,390 17/01/2019 Merrill Lynch (3,104) -USD 1,654,091 JPY 187,444,532 17/01/2019 National Australia Bank (51,762) (0.03)USD 7,969,466 JPY 891,088,362 05/02/2019 BNP Paribas (151,978) (0.09)USD 1,021,908 KRW 1,153,366,263 07/01/2019 Standard Chartered (12,561) (0.01)USD 226,355 KRW 255,306,152 17/01/2019 Standard Chartered (2,649) -USD 1,026,885 KRW 1,153,366,263 07/02/2019 J.P. Morgan (8,136) (0.01)USD 1,357,304 SEK 12,281,963 07/01/2019 Goldman Sachs (15,713) (0.01)USD 249,696 SEK 2,261,083 17/01/2019 Toronto-Dominion Bank (3,291) -USD 1,369,410 SEK 12,281,963 05/02/2019 BNP Paribas (6,990) (0.01)USD 904,637 SGD 1,244,273 07/01/2019 Standard Chartered (8,179) (0.01)USD 236,700 SGD 325,796 17/01/2019 HSBC (2,361) -USD 906,915 SGD 1,244,273 07/02/2019 RBC (6,514) -USD 642,937 ZAR 9,375,127 05/02/2019 Barclays (5,676) -
Total Unrealised Loss on Forward Currency Exchange Contracts (1,264,855) (0.73)
Net Unrealised Gain on Forward Currency Exchange Contracts 387,761 0.22
31

Transferable securities and money market instruments admitted to an official exchangelisting
Bonds
BermudaWeatherford International Ltd. 9.875%15/02/2024 USD 5,445,000 3,278,952 0.06
3,278,952 0.06
CanadaPrecision Drilling Corp. 6.5%15/12/2021 USD 1,030,127 963,168 0.02
963,168 0.02
FranceAltice France SA, 144A 6.25%15/05/2024 USD 4,385,000 4,094,713 0.08Altice France SA, 144A 7.375%01/05/2026 USD 12,515,000 11,525,439 0.22
15,620,152 0.30
ItalyTelecom Italia SpA, 144A 5.303%30/05/2024 USD 4,820,000 4,595,870 0.09Wind Tre SpA, 144A 5% 20/01/2026 USD 14,580,000 12,095,349 0.23
16,691,219 0.32
LuxembourgAltice Financing SA, 144A 6.625%15/02/2023 USD 7,980,000 7,682,466 0.15Altice Financing SA, 144A 7.5%15/05/2026 USD 13,840,000 12,594,400 0.24Altice Luxembourg SA, 144A 7.75%15/05/2022 USD 33,710,000 30,601,938 0.58Intelsat Jackson Holdings SA 5.5%01/08/2023 USD 18,081,000 15,742,584 0.30Telecom Italia Capital SA 6.375%15/11/2033 USD 3,475,000 3,124,251 0.06
69,745,639 1.33
NetherlandsConstellium NV, 144A 5.75%15/05/2024 USD 3,600,000 3,312,000 0.06Schaeffler Finance BV, 144A 4.75%15/05/2023 USD 2,930,000 2,805,475 0.05
6,117,475 0.11
SupranationalStarfruit Finco BV, 144A 8%01/10/2026 USD 7,190,000 6,722,650 0.13
6,722,650 0.13
United KingdomInternational Game Technology plc,144A 6.25% 15/01/2027 USD 6,340,000 6,086,400 0.12
6,086,400 0.12
United States of AmericaAECOM 5.875% 15/10/2024 USD 3,895,000 3,875,077 0.07AECOM 5.125% 15/03/2027 USD 3,145,000 2,723,743 0.05AES Corp. 5.5% 15/04/2025 USD 3,759,000 3,745,167 0.07AES Corp. 6% 15/05/2026 USD 1,630,000 1,672,559 0.03Ally Financial, Inc. 4.125% 13/02/2022 USD 17,563,000 17,079,227 0.32Ally Financial, Inc. 4.625% 19/05/2022 USD 10,890,000 10,738,683 0.20Ally Financial, Inc. 4.625% 30/03/2025 USD 8,925,000 8,701,206 0.16Ally Financial, Inc. 5.75% 20/11/2025 USD 9,370,000 9,386,772 0.18AMC Entertainment Holdings, Inc.5.75% 15/06/2025 USD 10,525,000 9,365,829 0.18AMC Entertainment Holdings, Inc.5.875% 15/11/2026 USD 401,000 345,965 0.01American Axle & Manufacturing, Inc.6.625% 15/10/2022 USD 2,998,000 2,979,337 0.06American Axle & Manufacturing, Inc.6.25% 01/04/2025 USD 18,010,000 16,460,059 0.31American Axle & Manufacturing, Inc.6.25% 15/03/2026 USD 9,465,000 8,568,049 0.16American Axle & Manufacturing, Inc.6.5% 01/04/2027 USD 9,110,000 8,236,533 0.16AmeriGas Partners LP 5.5%20/05/2025 USD 9,480,000 8,731,080 0.17AmeriGas Partners LP 5.875%20/08/2026 USD 4,360,000 3,981,683 0.08Andeavor Logistics LP 6.25%15/10/2022 USD 4,037,000 4,117,740 0.08
Andeavor Logistics LP 6.375%01/05/2024 USD 7,180,000 7,485,150 0.14Andeavor Logistics LP 5.25%15/01/2025 USD 2,990,000 3,013,636 0.06Anixter, Inc. 5.5% 01/03/2023 USD 4,035,000 4,014,825 0.08Antero Resources Corp. 5.625%01/06/2023 USD 3,225,000 3,069,765 0.06Antero Resources Corp. 5.125%01/12/2022 USD 14,927,000 14,031,380 0.27Arconic, Inc. 5.87% 23/02/2022 USD 1,810,000 1,839,874 0.03Arconic, Inc. 5.9% 01/02/2027 USD 10,890,000 10,413,345 0.20Ashland LLC 4.75% 15/08/2022 USD 18,520,000 18,265,535 0.35Ashtead Capital, Inc., 144A 5.625%01/10/2024 USD 4,101,000 4,111,252 0.08Boyd Gaming Corp. 6.875% 15/05/2023 USD 6,375,000 6,406,811 0.12CenturyLink, Inc. 7.5% 01/04/2024 USD 6,615,000 6,425,546 0.12CenturyLink, Inc. 6.75% 01/12/2023 USD 18,320,000 17,633,000 0.33Chemours Co. (The) 6.625% 15/05/2023 USD 16,601,000 16,808,596 0.32Chesapeake Energy Corp. 8%15/01/2025 USD 24,800,000 22,169,836 0.42Chesapeake Energy Corp. 7.5%01/10/2026 USD 13,630,000 11,653,650 0.22Chesapeake Energy Corp. 8%15/06/2027 USD 6,705,000 5,730,328 0.11Cinemark USA, Inc. 4.875% 01/06/2023 USD 12,390,000 11,953,067 0.23Clear Channel Worldwide Holdings, Inc.6.5% 15/11/2022 USD 83,285,000 83,883,403 1.58Clear Channel Worldwide Holdings, Inc.7.625% 15/03/2020 USD 48,735,000 48,176,741 0.91CoreCivic, Inc., REIT 5% 15/10/2022 USD 4,700,000 4,500,250 0.09CoreCivic, Inc., REIT 4.625%01/05/2023 USD 13,307,000 12,308,975 0.23Crestwood Midstream Partners LP6.181% 01/04/2023 USD 14,570,000 13,840,771 0.26Dana, Inc. 6% 15/09/2023 USD 18,607,000 18,537,224 0.35Dana, Inc. 5.5% 15/12/2024 USD 2,975,000 2,802,926 0.05DaVita, Inc. 5.125% 15/07/2024 USD 2,210,000 2,079,179 0.04DaVita, Inc. 5% 01/05/2025 USD 21,565,000 19,572,286 0.37Encompass Health Corp. 5.75%01/11/2024 USD 7,533,000 7,501,776 0.14Encompass Health Corp. 5.75%15/09/2025 USD 12,952,000 12,595,820 0.24EnLink Midstream Partners LP 4.4%01/04/2024 USD 8,699,000 8,176,016 0.15EnLink Midstream Partners LP 4.85%15/07/2026 USD 4,515,000 4,065,848 0.08Ford Motor Credit Co. LLC 4.687%09/06/2025 USD 12,920,000 12,073,998 0.23Freeport-McMoRan, Inc. 3.875%15/03/2023 USD 21,520,000 19,846,174 0.38GEO Group, Inc. (The), REIT 5.875%15/01/2022 USD 14,745,000 14,358,681 0.27GEO Group, Inc. (The), REIT 5.125%01/04/2023 USD 9,295,000 8,365,500 0.16GEO Group, Inc. (The), REIT 5.875%15/10/2024 USD 10,893,000 9,613,073 0.18HCA, Inc. 7.5% 15/02/2022 USD 24,233,000 25,775,309 0.49HCA, Inc. 5.375% 01/02/2025 USD 82,794,000 81,285,493 1.54HCA, Inc. 5.875% 15/02/2026 USD 76,235,000 76,631,803 1.45HCA, Inc. 5.25% 15/06/2026 USD 13,618,000 13,510,826 0.26HCA, Inc. 5.375% 01/09/2026 USD 14,226,000 13,845,099 0.26HCA, Inc. 5.625% 01/09/2028 USD 15,245,000 14,738,332 0.28Hertz Corp. (The) 6.25% 15/10/2022 USD 7,472,000 6,409,855 0.12Hilton Domestic Operating Co., Inc.4.25% 01/09/2024 USD 1,360,000 1,288,600 0.02Hilton Grand Vacations Borrower LLC6.125% 01/12/2024 USD 2,905,000 2,875,950 0.05Hilton Worldwide Finance LLC 4.625%01/04/2025 USD 5,500,000 5,270,815 0.10Hilton Worldwide Finance LLC 4.875%01/04/2027 USD 2,745,000 2,583,731 0.05Huntsman International LLC 5.125%15/11/2022 USD 13,532,000 13,652,367 0.26Iron Mountain, Inc., REIT 6%15/08/2023 USD 11,340,000 11,522,687 0.22JC Penney Corp, Inc. 6.375%15/10/2036 USD 12,012,000 3,783,780 0.07L Brands, Inc. 6.75% 01/07/2036 USD 11,190,000 9,172,667 0.17Laredo Petroleum, Inc. 5.625%15/01/2022 USD 7,059,000 6,300,158 0.12Level 3 Financing, Inc. 5.625%01/02/2023 USD 95,000 93,423 0.00Level 3 Financing, Inc. 5.125%01/05/2023 USD 1,955,000 1,888,696 0.04Level 3 Financing, Inc. 5.375%15/01/2024 USD 6,500,000 6,237,400 0.12Level 3 Financing, Inc. 5.375%01/05/2025 USD 15,765,000 14,917,395 0.28Level 3 Parent LLC 5.75% 01/12/2022 USD 11,245,000 11,051,192 0.21
32
JPMorgan Investment Funds - Global High Yield Bond Fund
Schedule of Investments
As at 31 December 2018
Investments Currency
Quantity/Nominal
Value
MarketValue
USD
%of
NetAssets Investments Currency
Quantity/Nominal
Value
MarketValue
USD
%of
NetAssets

MagnaChip Semiconductor Corp.6.625% 15/07/2021 USD 19,085,000 17,136,899 0.32MGM Growth Properties OperatingPartnership LP, REIT 5.625%01/05/2024 USD 5,070,000 5,039,783 0.10MGM Growth Properties OperatingPartnership LP, REIT 4.5% 01/09/2026 USD 3,005,000 2,742,423 0.05MGM Resorts International 7.75%15/03/2022 USD 14,337,000 15,239,084 0.29MGM Resorts International 6%15/03/2023 USD 44,571,000 44,837,757 0.85MGM Resorts International 5.75%15/06/2025 USD 24,455,000 23,742,748 0.45MGM Resorts International 4.625%01/09/2026 USD 2,940,000 2,654,761 0.05NRG Energy, Inc. 6.625% 15/01/2027 USD 6,855,000 6,963,446 0.13Oasis Petroleum, Inc. 6.875%15/01/2023 USD 17,470,000 16,072,400 0.30Oasis Petroleum, Inc. 6.875%15/03/2022 USD 7,133,000 6,770,394 0.13Qwest Capital Funding, Inc. 7.75%15/02/2031 USD 7,120,000 6,069,800 0.11Range Resources Corp. 5% 15/08/2022 USD 2,550,000 2,286,126 0.04Range Resources Corp. 5% 15/03/2023 USD 7,060,000 6,249,088 0.12Range Resources Corp. 4.875%15/05/2025 USD 8,320,000 6,887,546 0.13Reynolds Group Issuer, Inc. 5.75%15/10/2020 USD 30,337,917 30,324,568 0.57RHP Hotel Properties LP, REIT 5%15/04/2021 USD 7,132,000 7,078,510 0.13RHP Hotel Properties LP, REIT 5%15/04/2023 USD 6,325,000 6,166,875 0.12Scotts Miracle-Gro Co. (The) 6%15/10/2023 USD 17,762,000 17,673,190 0.33Scotts Miracle-Gro Co. (The) 5.25%15/12/2026 USD 2,485,000 2,263,686 0.04Service Corp. International 7.5%01/04/2027 USD 23,516,000 25,549,429 0.48SM Energy Co. 6.125% 15/11/2022 USD 2,620,000 2,486,419 0.05SM Energy Co. 5.625% 01/06/2025 USD 5,720,000 4,976,400 0.09SM Energy Co. 6.625% 15/01/2027 USD 6,186,000 5,498,333 0.10Southwestern Energy Co. 6.2%23/01/2025 USD 12,502,000 11,260,801 0.21Southwestern Energy Co. 7.5%01/04/2026 USD 5,415,000 5,143,059 0.10Southwestern Energy Co. 7.75%01/10/2027 USD 5,415,000 5,186,839 0.10Spectrum Brands Holdings, Inc. 7.75%15/01/2022 USD 9,987,000 10,148,889 0.19Spectrum Brands, Inc. 6.625%15/11/2022 USD 5,695,000 5,815,535 0.11Spectrum Brands, Inc. 5.75%15/07/2025 USD 6,080,000 5,799,773 0.11Sprint Capital Corp. 8.75% 15/03/2032 USD 59,155,000 61,934,102 1.17Sprint Corp. 7.625% 15/02/2025 USD 68,937,000 69,657,392 1.32Sprint Corp. 7.625% 01/03/2026 USD 3,460,000 3,477,975 0.07Sprint Corp. 7.875% 15/09/2023 USD 60,800,000 62,564,416 1.18Sprint Corp. 7.125% 15/06/2024 USD 4,795,000 4,767,141 0.09Summit Midstream Holdings LLC 5.75%15/04/2025 USD 5,731,000 5,215,210 0.10Targa Resources Partners LP 6.75%15/03/2024 USD 28,472,000 29,145,932 0.55TEGNA, Inc. 6.375% 15/10/2023 USD 8,529,000 8,552,625 0.16Tempur Sealy International, Inc. 5.625%15/10/2023 USD 12,990,000 12,550,224 0.24Tempur Sealy International, Inc. 5.5%15/06/2026 USD 12,584,000 11,475,664 0.22Tenet Healthcare Corp. 4.5%01/04/2021 USD 6,985,000 6,845,125 0.13Tenet Healthcare Corp. 8.125%01/04/2022 USD 24,957,000 24,875,640 0.47Tenet Healthcare Corp. 6.75%15/06/2023 USD 45,316,000 42,590,243 0.80Tenet Healthcare Corp. 4.625%15/07/2024 USD 11,965,000 11,214,376 0.21Tenneco, Inc. 5.375% 15/12/2024 USD 5,820,000 5,071,490 0.10Tenneco, Inc. 5% 15/07/2026 USD 7,219,000 5,577,616 0.11TransDigm, Inc. 6.5% 15/05/2025 USD 9,485,000 9,124,143 0.17Triumph Group, Inc. 4.875%01/04/2021 USD 8,477,000 7,608,107 0.14Triumph Group, Inc. 7.75% 15/08/2025 USD 9,000,000 7,942,500 0.15United Rentals North America, Inc.5.75% 15/11/2024 USD 6,405,000 6,182,939 0.12United Rentals North America, Inc.4.625% 15/10/2025 USD 4,730,000 4,243,567 0.08United Rentals North America, Inc.5.875% 15/09/2026 USD 7,220,000 6,854,018 0.13United Rentals North America, Inc.6.5% 15/12/2026 USD 12,695,000 12,479,312 0.24United Rentals North America, Inc.5.5% 15/05/2027 USD 15,445,000 14,311,569 0.27
United Rentals North America, Inc.4.875% 15/01/2028 USD 12,220,000 10,781,767 0.20United States Cellular Corp. 6.7%15/12/2033 USD 16,336,000 15,872,221 0.30Vista Outdoor, Inc. 5.875% 01/10/2023 USD 26,551,000 24,161,410 0.46Vistra Energy Corp. 7.375% 01/11/2022 USD 10,460,000 10,801,937 0.20Vistra Energy Corp. 7.625% 01/11/2024 USD 3,923,000 4,160,498 0.08Welbilt, Inc. 9.5% 15/02/2024 USD 9,650,000 10,313,438 0.19Whiting Petroleum Corp. 5.75%15/03/2021 USD 3,450,000 3,294,750 0.06Whiting Petroleum Corp. 6.25%01/04/2023 USD 8,505,000 7,888,430 0.15Whiting Petroleum Corp. 6.625%15/01/2026 USD 6,070,000 5,225,967 0.10WildHorse Resource Development Corp.6.875% 01/02/2025 USD 13,750,000 12,890,625 0.24WPX Energy, Inc. 6% 15/01/2022 USD 1,982,000 1,927,644 0.04WPX Energy, Inc. 8.25% 01/08/2023 USD 13,565,000 14,383,105 0.27WPX Energy, Inc. 5.25% 15/09/2024 USD 1,945,000 1,789,342 0.03WPX Energy, Inc. 5.75% 01/06/2026 USD 4,778,000 4,342,438 0.08Zayo Group LLC 6% 01/04/2023 USD 13,449,000 12,740,238 0.24Zayo Group LLC 6.375% 15/05/2025 USD 12,836,000 11,895,250 0.22
1,805,663,471 34.13
Total Bonds 1,930,889,126 36.52
Equities
United States of AmericaCaesars Entertainment Corp. USD 1,065,586 7,091,475 0.13Halcon Resources Corp. USD 1,326,990 2,262,518 0.04VICI Properties, Inc., REIT USD 4,165,694 77,273,624 1.46
86,627,617 1.63
Total Equities 86,627,617 1.63
Total Transferable securities and money market instrumentsadmitted to an official exchange listing
2,017,516,743 38.15
Transferable securities and money market instruments dealt in on another regulatedmarket
Bonds
CanadaBausch Health Cos., Inc., 144A 6.5%15/03/2022 USD 7,245,000 7,301,040 0.14Bausch Health Cos., Inc., 144A 5.875%15/05/2023 USD 40,795,000 37,678,874 0.71Bausch Health Cos., Inc., 144A 7%15/03/2024 USD 14,315,000 14,566,729 0.28Bausch Health Cos., Inc., 144A 6.125%15/04/2025 USD 71,725,000 62,815,679 1.19Bausch Health Cos., Inc., 144A 5.5%01/11/2025 USD 7,560,000 7,109,764 0.13Bausch Health Cos., Inc., 144A 9%15/12/2025 USD 14,670,000 14,688,631 0.28Bombardier, Inc., 144A 7.5%15/03/2025 USD 16,420,000 15,540,134 0.29MEG Energy Corp., 144A 6.375%30/01/2023 USD 6,835,000 6,518,881 0.12MEG Energy Corp., 144A 7%31/03/2024 USD 27,130,000 26,044,800 0.49MEG Energy Corp., 144A 6.5%15/01/2025 USD 16,466,000 16,612,218 0.31NOVA Chemicals Corp., 144A 4.875%01/06/2024 USD 12,290,000 11,289,041 0.21NOVA Chemicals Corp., 144A 5.25%01/06/2027 USD 6,385,000 5,697,687 0.11Precision Drilling Corp., 144A 7.125%15/01/2026 USD 6,590,000 5,667,400 0.11Precision Drilling Corp. 7.75%15/12/2023 USD 8,050,000 7,325,500 0.14Quebecor Media, Inc. 5.75% 15/01/2023 USD 22,223,000 22,510,899 0.43Videotron Ltd., 144A 5.375%15/06/2024 USD 9,117,000 9,117,000 0.17Videotron Ltd., 144A 5.125%15/04/2027 USD 9,105,000 8,626,987 0.16
279,111,264 5.27
Cayman IslandsTransocean Guardian Ltd., 144A 5.875%15/01/2024 USD 6,726,000 6,456,960 0.12Transocean Pontus Ltd., 144A 6.125%01/08/2025 USD 2,882,000 2,766,720 0.05Transocean, Inc., 144A 7.25%01/11/2025 USD 7,375,000 6,459,578 0.12
33
JPMorgan Investment Funds - Global High Yield Bond Fund
Schedule of Investments (continued)
As at 31 December 2018
Investments Currency
Quantity/Nominal
Value
MarketValue
USD
%of
NetAssets Investments Currency
Quantity/Nominal
Value
MarketValue
USD
%of
NetAssets

Transocean, Inc., 144A 7.5%15/01/2026 USD 9,385,000 8,343,781 0.16UPCB Finance IV Ltd., 144A 5.375%15/01/2025 USD 22,913,000 21,556,207 0.41
45,583,246 0.86
FranceAltice France SA, 144A 8.125%01/02/2027 USD 8,600,000 8,138,653 0.15
8,138,653 0.15
GermanyIHO Verwaltungs GmbH, 144A 4.5%15/09/2023 USD 7,035,000 6,347,329 0.12
6,347,329 0.12
IrelandArdagh Packaging Finance plc, 144A7.25% 15/05/2024 USD 14,975,000 14,964,742 0.28Ardagh Packaging Finance plc, 144A6% 15/02/2025 USD 27,695,000 25,634,907 0.48James Hardie International FinanceDAC, 144A 4.75% 15/01/2025 USD 4,670,000 4,226,350 0.08
44,825,999 0.84
JerseyAdient Global Holdings Ltd., 144A4.875% 15/08/2026 USD 13,460,000 10,296,900 0.19Delphi Technologies plc, 144A 5%01/10/2025 USD 20,925,000 17,577,000 0.33
27,873,900 0.52
LuxembourgDana Financing Luxembourg Sarl, 144A6.5% 01/06/2026 USD 7,295,000 6,984,962 0.13INEOS Group Holdings SA, 144A 5.625%01/08/2024 USD 38,245,000 33,885,070 0.64Intelsat Jackson Holdings SA, 144A 8%15/02/2024 USD 3,000,000 3,098,925 0.06Intelsat Jackson Holdings SA, 144A8.5% 15/10/2024 USD 25,595,000 24,786,582 0.47Intelsat Jackson Holdings SA, 144A9.75% 15/07/2025 USD 22,050,000 22,342,383 0.42Mallinckrodt International Finance SA,144A 5.75% 01/08/2022 USD 3,331,000 2,834,481 0.05Mallinckrodt International Finance SA,144A 5.625% 15/10/2023 USD 9,790,000 7,425,128 0.14Mallinckrodt International Finance SA,144A 5.5% 15/04/2025 USD 7,280,000 5,005,000 0.09Nielsen Co. Luxembourg SARL (The),144A 5.5% 01/10/2021 USD 3,893,000 3,874,742 0.07Trinseo Materials Operating SCA, 144A5.375% 01/09/2025 USD 12,860,000 11,239,640 0.21
121,476,913 2.28
NetherlandsAlcoa Nederland Holding BV, 144A6.75% 30/09/2024 USD 7,073,000 7,304,358 0.14Alcoa Nederland Holding BV, 144A 7%30/09/2026 USD 2,590,000 2,642,953 0.05Alcoa Nederland Holding BV, 144A6.125% 15/05/2028 USD 2,570,000 2,486,436 0.05Constellium NV, 144A 6.625%01/03/2025 USD 380,000 354,350 0.01Constellium NV, 144A 5.875%15/02/2026 USD 1,960,000 1,777,504 0.03NXP BV, 144A 4.625% 01/06/2023 USD 18,305,000 17,984,663 0.34Sensata Technologies BV, 144A 4.875%15/10/2023 USD 5,850,000 5,706,851 0.11Sensata Technologies BV, 144A 5.625%01/11/2024 USD 885,000 875,044 0.02Stars Group Holdings BV, 144A 7%15/07/2026 USD 5,501,000 5,294,713 0.10
44,426,872 0.85
SupranationalEndo Dac, 144A 6% 15/07/2023 USD 22,055,000 16,643,144 0.31Endo Dac, 144A 5.875% 15/10/2024 USD 4,330,000 4,091,850 0.08Venator Finance Sarl, 144A 5.75%15/07/2025 USD 7,495,000 5,996,000 0.11
26,730,994 0.50
United KingdomInternational Game Technology plc,144A 6.5% 15/02/2025 USD 14,769,000 14,785,098 0.28Merlin Entertainments plc, 144A 5.75%15/06/2026 USD 5,215,000 5,149,812 0.10Sensata Technologies UK Financing Co.plc, 144A 6.25% 15/02/2026 USD 24,009,000 24,069,023 0.45Virgin Media Secured Finance plc, 144A5.25% 15/01/2026 USD 3,640,000 3,367,510 0.06Virgin Media Secured Finance plc, 144A5.5% 15/08/2026 USD 5,220,000 4,850,607 0.09
52,222,050 0.98
United States of AmericaACCO Brands Corp., 144A 5.25%15/12/2024 USD 6,415,000 5,773,500 0.11ACI Worldwide, Inc., 144A 5.75%15/08/2026 USD 9,080,000 8,921,100 0.17ADT Security Corp. (The) 3.5%15/07/2022 USD 9,782,000 9,075,740 0.17ADT Security Corp. (The) 4.125%15/06/2023 USD 1,965,000 1,805,462 0.03Air Medical Group Holdings, Inc., 144A6.375% 15/05/2023 USD 18,095,000 15,199,800 0.29Albertsons Cos. LLC 5.75% 15/03/2025 USD 9,280,000 8,167,467 0.15Allison Transmission, Inc., 144A 5%01/10/2024 USD 4,090,000 3,926,400 0.07Allison Transmission, Inc., 144A 4.75%01/10/2027 USD 3,130,000 2,785,700 0.05AMC Networks, Inc. 5% 01/04/2024 USD 12,165,000 11,634,910 0.22American Woodmark Corp., 144A4.875% 15/03/2026 USD 10,625,000 9,403,125 0.18Amkor Technology, Inc. 6.375%01/10/2022 USD 18,838,000 18,834,703 0.36Anixter, Inc., 144A 6% 01/12/2025 USD 5,470,000 5,415,300 0.10Antero Midstream Partners LP 5.375%15/09/2024 USD 12,115,000 11,266,950 0.21Aramark Services, Inc., 144A 5%01/02/2028 USD 7,025,000 6,607,574 0.13Ascend Learning LLC, 144A 6.875%01/08/2025 USD 5,510,000 5,262,050 0.10Ashtead Capital, Inc., 144A 4.125%15/08/2025 USD 1,525,000 1,400,507 0.03Ashtead Capital, Inc., 144A 4.375%15/08/2027 USD 3,224,000 2,911,611 0.06Avantor, Inc., 144A 6% 01/10/2024 USD 12,610,000 12,307,234 0.23Avis Budget Car Rental LLC, 144A6.375% 01/04/2024 USD 30,223,000 28,711,850 0.54Avis Budget Car Rental LLC, 144A5.25% 15/03/2025 USD 1,700,000 1,466,250 0.03Avis Budget Car Rental LLC 5.5%01/04/2023 USD 4,803,000 4,670,341 0.09Axalta Coating Systems LLC, 144A4.875% 15/08/2024 USD 7,352,000 6,947,640 0.13Blue Racer Midstream LLC, 144A6.125% 15/11/2022 USD 22,125,000 21,299,737 0.40Blue Racer Midstream LLC, 144A6.625% 15/07/2026 USD 4,980,000 4,631,400 0.09Boyd Gaming Corp. 6% 15/08/2026 USD 7,320,000 6,959,087 0.13Boyne USA, Inc., 144A 7.25%01/05/2025 USD 2,845,000 2,930,350 0.06BWAY Holding Co., 144A 5.5%15/04/2024 USD 15,014,000 14,228,092 0.27BWX Technologies, Inc., 144A 5.375%15/07/2026 USD 4,050,000 3,896,910 0.07Calfrac Holdings LP, 144A 8.5%15/06/2026 USD 7,147,000 5,074,370 0.10Calpine Corp., 144A 5.25% 01/06/2026 USD 6,845,000 6,412,225 0.12Carrizo Oil & Gas, Inc. 6.25%15/04/2023 USD 9,195,000 8,487,904 0.16Carrizo Oil & Gas, Inc. 8.25%15/07/2025 USD 4,745,000 4,650,100 0.09CBS Radio, Inc., 144A 7.25% 01/11/2024 USD 9,146,000 8,505,780 0.16CCO Holdings LLC, 144A 5.875%01/04/2024 USD 59,098,000 58,855,107 1.11CCO Holdings LLC, 144A 5.375%01/05/2025 USD 3,680,000 3,536,020 0.07CCO Holdings LLC, 144A 5.75%15/02/2026 USD 52,436,000 51,447,581 0.97CCO Holdings LLC, 144A 5.5%01/05/2026 USD 14,980,000 14,550,448 0.28CCO Holdings LLC, 144A 5.125%01/05/2027 USD 23,555,000 21,946,429 0.41CCO Holdings LLC, 144A 5%01/02/2028 USD 17,080,000 15,762,961 0.30CDW LLC 5% 01/09/2025 USD 1,415,000 1,351,325 0.03Central Garden & Pet Co. 6.125%15/11/2023 USD 10,965,000 10,965,000 0.21Central Garden & Pet Co. 5.125%01/02/2028 USD 10,275,000 9,196,125 0.17
34
JPMorgan Investment Funds - Global High Yield Bond Fund
Schedule of Investments (continued)
As at 31 December 2018
Investments Currency
Quantity/Nominal
Value
MarketValue
USD
%of
NetAssets Investments Currency
Quantity/Nominal
Value
MarketValue
USD
%of
NetAssets

Cheniere Corpus Christi Holdings LLC5.875% 31/03/2025 USD 9,150,000 9,178,639 0.17Cheniere Corpus Christi Holdings LLC5.125% 30/06/2027 USD 7,640,000 7,276,603 0.14Citigroup, Inc., FRN 5.8% Perpetual USD 8,820,000 8,637,779 0.16Citigroup, Inc., FRN 5.95% Perpetual USD 1,120,000 1,025,903 0.02Citigroup, Inc., FRN 5.875% Perpetual USD 7,550,000 7,344,602 0.14Clear Channel Worldwide Holdings, Inc.6.5% 15/11/2022 USD 9,275,000 9,317,155 0.18Clear Channel Worldwide Holdings, Inc.7.625% 15/03/2020 USD 1,845,000 1,803,487 0.03Cogent Communications Finance, Inc.,144A 5.625% 15/04/2021 USD 17,225,000 17,181,937 0.32Cogent Communications Group, Inc.,144A 5.375% 01/03/2022 USD 15,935,000 15,815,487 0.30CommScope Technologies LLC, 144A6% 15/06/2025 USD 36,794,000 33,482,540 0.63Community Health Systems, Inc., 144A8.625% 15/01/2024 USD 7,580,000 7,544,222 0.14Constellation Merger Sub, Inc., 144A8.5% 15/09/2025 USD 12,620,000 11,326,450 0.21Cooper-Standard Automotive, Inc.,144A 5.625% 15/11/2026 USD 18,163,000 15,983,440 0.30Core & Main LP, 144A 6.125%15/08/2025 USD 5,735,000 5,046,800 0.10Coty, Inc., 144A 6.5% 15/04/2026 USD 15,500,000 13,333,952 0.25Covey Park Energy LLC, 144A 7.5%15/05/2025 USD 11,480,000 10,016,300 0.19CSC Holdings LLC, 144A 10.125%15/01/2023 USD 8,495,000 9,140,280 0.17CSC Holdings LLC, 144A 6.625%15/10/2025 USD 8,555,000 8,661,938 0.16CSC Holdings LLC, 144A 10.875%15/10/2025 USD 11,981,000 13,478,625 0.25DCP Midstream Operating LP 5.375%15/07/2025 USD 3,614,000 3,578,782 0.07Dell International LLC, 144A 5.875%15/06/2021 USD 4,395,000 4,394,055 0.08Dell International LLC, 144A 5.45%15/06/2023 USD 10,000,000 10,216,300 0.19Dell International LLC, 144A 6.02%15/06/2026 USD 16,945,000 17,084,373 0.32Denbury Resources, Inc., 144A 9.25%31/03/2022 USD 11,635,000 10,762,375 0.20Diamondback Energy, Inc. 5.375%31/05/2025 USD 2,861,000 2,815,067 0.05DISH DBS Corp. 5.875% 15/07/2022 USD 22,620,000 20,752,832 0.39DISH DBS Corp. 5% 15/03/2023 USD 52,458,000 43,517,583 0.82DISH DBS Corp. 7.75% 01/07/2026 USD 14,255,000 11,770,425 0.22DISH DBS Corp. 5.875% 15/11/2024 USD 68,509,000 55,125,082 1.04DJO Finance LLC, 144A 8.125%15/06/2021 USD 30,355,000 31,265,650 0.59Energizer Gamma Acquisition, Inc.,144A 6.375% 15/07/2026 USD 5,020,000 4,641,090 0.09Energizer Holdings, Inc., 144A 5.5%15/06/2025 USD 17,215,000 15,579,575 0.29EnPro Industries, Inc., 144A 5.75%15/10/2026 USD 7,790,000 7,536,825 0.14Entegris, Inc., 144A 4.625% 10/02/2026 USD 13,100,000 11,855,500 0.22Envision Healthcare Corp., 144A 8.75%15/10/2026 USD 17,875,000 15,439,531 0.29EP Energy LLC, 144A 9.375%01/05/2024 USD 26,622,000 11,414,183 0.22EP Energy LLC, 144A 8% 29/11/2024 USD 6,435,000 4,633,200 0.09EP Energy LLC, 144A 8% 15/02/2025 USD 4,510,000 1,847,860 0.04EP Energy LLC, 144A 7.75% 15/05/2026 USD 30,805,000 27,434,779 0.52Equinix, Inc., REIT 5.375% 01/04/2023 USD 975,000 972,943 0.02Equinix, Inc., REIT 5.75% 01/01/2025 USD 3,495,000 3,521,842 0.07Equinix, Inc., REIT 5.875% 15/01/2026 USD 6,945,000 7,007,713 0.13ESH Hospitality, Inc., REIT, 144A 5.25%01/05/2025 USD 5,470,000 5,205,225 0.10Extraction Oil & Gas, Inc., 144A 5.625%01/02/2026 USD 630,000 459,900 0.01Fair Isaac Corp., 144A 5.25%15/05/2026 USD 3,560,000 3,453,200 0.07First Data Corp., 144A 5.375%15/08/2023 USD 37,901,000 37,465,518 0.71First Data Corp., 144A 5.75%15/01/2024 USD 81,900,000 80,108,028 1.51Frontier Communications Corp., 144A8.5% 01/04/2026 USD 9,485,000 8,339,781 0.16Frontier Communications Corp. 6.875%15/01/2025 USD 11,385,000 5,777,888 0.11Frontier Communications Corp. 11%15/09/2025 USD 35,810,000 22,600,049 0.43Gartner, Inc., 144A 5.125% 01/04/2025 USD 6,165,000 5,983,934 0.11Gates Global LLC, 144A 6% 15/07/2022 USD 9,688,000 9,530,570 0.18GCI LLC 6.75% 01/06/2021 USD 15,472,000 15,545,956 0.29GCI LLC 6.875% 15/04/2025 USD 7,345,000 7,124,650 0.13
GCP Applied Technologies, Inc., 144A5.5% 15/04/2026 USD 11,595,000 11,348,606 0.21GLP Capital LP, REIT 5.25% 01/06/2025 USD 6,913,000 6,881,269 0.13GLP Capital LP, REIT 5.75% 01/06/2028 USD 9,680,000 9,766,442 0.18Goodyear Tire & Rubber Co. (The) 5%31/05/2026 USD 3,755,000 3,397,956 0.06Gray Escrow, Inc., 144A 7% 15/05/2027 USD 9,195,000 9,060,201 0.17Gulfport Energy Corp. 6% 15/10/2024 USD 3,070,000 2,707,019 0.05Gulfport Energy Corp. 6.375%15/05/2025 USD 2,801,000 2,485,355 0.05Gulfport Energy Corp. 6.375%15/01/2026 USD 2,200,000 1,892,000 0.04Halcon Resources Corp. 6.75%15/02/2025 USD 14,310,000 10,410,525 0.20Hanesbrands, Inc., 144A 4.625%15/05/2024 USD 2,445,000 2,279,963 0.04Herc Rentals, Inc. ‘A’, 144A 7.75%01/06/2024 USD 16,378,000 17,074,065 0.32Herc Rentals, Inc., 144A 7.5%01/06/2022 USD 5,067,000 5,282,348 0.10Hertz Corp. (The), 144A 7.625%01/06/2022 USD 19,150,000 18,099,623 0.34Hertz Corp. (The), 144A 5.5%15/10/2024 USD 36,070,000 26,240,925 0.50Hess Infrastructure Partners LP, 144A5.625% 15/02/2026 USD 6,070,000 5,872,725 0.11Hexion, Inc. 6.625% 15/04/2020 USD 21,627,000 17,032,776 0.32High Ridge Brands Co., 144A 8.875%15/03/2025 USD 10,865,000 4,780,600 0.09Hillman Group, Inc. (The), 144A 6.375%15/07/2022 USD 20,702,000 16,794,498 0.32Hill-Rom Holdings, Inc., 144A 5.75%01/09/2023 USD 13,927,000 13,892,183 0.26Hill-Rom Holdings, Inc., 144A 5%15/02/2025 USD 3,030,000 2,893,650 0.05Hilton Domestic Operating Co., Inc.,144A 5.125% 01/05/2026 USD 14,805,000 14,289,416 0.27Hologic, Inc., 144A 4.375% 15/10/2025 USD 8,445,000 7,899,073 0.15Hughes Satellite Systems Corp. 5.25%01/08/2026 USD 4,965,000 4,585,848 0.09Hughes Satellite Systems Corp. 6.625%01/08/2026 USD 2,535,000 2,348,297 0.04iHeartCommunications, Inc. 9%01/03/2021§ USD 28,470,000 18,932,550 0.36iHeartCommunications, Inc. 10.625%15/03/2023§ USD 7,810,000 5,232,700 0.10Infor Software Parent LLC, 144A 7.125%01/05/2021 USD 21,895,000 21,457,100 0.41Infor US, Inc. 6.5% 15/05/2022 USD 54,956,000 53,340,568 1.01Informatica LLC, 144A 7.125%15/07/2023 USD 19,141,000 18,662,475 0.35IQVIA, Inc., 144A 5% 15/10/2026 USD 14,205,000 13,530,263 0.26Jack Ohio Finance LLC, 144A 6.75%15/11/2021 USD 19,772,000 19,969,720 0.38Jagged Peak Energy LLC, 144A 5.875%01/05/2026 USD 4,595,000 4,158,475 0.08JELD-WEN, Inc., 144A 4.625%15/12/2025 USD 4,260,000 3,716,850 0.07JELD-WEN, Inc., 144A 4.875%15/12/2027 USD 6,470,000 5,467,150 0.10Kinetic Concepts, Inc., 144A 7.875%15/02/2021 USD 16,857,000 17,025,570 0.32Kratos Defense & Security Solutions,Inc., 144A 6.5% 30/11/2025 USD 2,345,000 2,388,969 0.05Kronos Acquisition Holdings, Inc., 144A9% 15/08/2023 USD 11,757,000 9,126,371 0.17Live Nation Entertainment, Inc., 144A4.875% 01/11/2024 USD 2,060,000 1,981,071 0.04LTF Merger Sub, Inc., 144A 8.5%15/06/2023 USD 16,889,000 17,072,077 0.32Marriott Ownership Resorts, Inc., 144A6.5% 15/09/2026 USD 12,010,000 11,559,625 0.22Mattel, Inc., 144A 6.75% 31/12/2025 USD 25,898,000 23,237,110 0.44Meredith Corp., 144A 6.875%01/02/2026 USD 7,050,000 6,939,773 0.13MGM Growth Properties OperatingPartnership LP, REIT 4.5% 15/01/2028 USD 2,565,000 2,270,705 0.04MSCI, Inc., 144A 5.375% 15/05/2027 USD 7,210,000 7,155,997 0.14Mueller Water Products, Inc., 144A5.5% 15/06/2026 USD 4,715,000 4,549,975 0.09Nabors Industries, Inc. 5.75%01/02/2025 USD 11,460,000 8,797,326 0.17Neiman Marcus Group Ltd. LLC, 144A8% 15/10/2021 USD 18,990,000 7,690,950 0.15Neiman Marcus Group Ltd. LLC, 144A8.654% 15/10/2021 USD 23,763,681 9,921,337 0.19Netflix, Inc., 144A 5.875% 15/11/2028 USD 11,359,000 11,017,378 0.21Netflix, Inc. 4.875% 15/04/2028 USD 15,300,000 13,950,770 0.26Nexstar Broadcasting, Inc., 144A6.125% 15/02/2022 USD 3,867,000 3,847,665 0.07
35
JPMorgan Investment Funds - Global High Yield Bond Fund
Schedule of Investments (continued)
As at 31 December 2018
Investments Currency
Quantity/Nominal
Value
MarketValue
USD
%of
NetAssets Investments Currency
Quantity/Nominal
Value
MarketValue
USD
%of
NetAssets

NGPL PipeCo LLC, 144A 4.375%15/08/2022 USD 8,405,000 8,215,887 0.16NGPL PipeCo LLC, 144A 4.875%15/08/2027 USD 2,515,000 2,370,388 0.04Nielsen Finance LLC, 144A 5%15/04/2022 USD 18,410,000 17,702,136 0.33Novelis Corp., 144A 6.25% 15/08/2024 USD 7,545,000 7,148,359 0.14Novelis Corp., 144A 5.875%30/09/2026 USD 5,550,000 4,919,187 0.09Oasis Petroleum, Inc., 144A 6.25%01/05/2026 USD 7,305,000 6,166,406 0.12Parsley Energy LLC, 144A 5.375%15/01/2025 USD 1,920,000 1,756,800 0.03Parsley Energy LLC, 144A 5.25%15/08/2025 USD 7,385,000 6,646,500 0.13Parsley Energy LLC, 144A 5.625%15/10/2027 USD 5,420,000 4,905,100 0.09PetSmart, Inc., 144A 7.125%15/03/2023 USD 28,347,000 16,157,790 0.31PetSmart, Inc., 144A 5.875%01/06/2025 USD 16,130,000 11,613,600 0.22PetSmart, Inc., 144A 8.875%01/06/2025 USD 11,160,000 6,361,200 0.12PGT Escrow Issuer, Inc., 144A 6.75%01/08/2026 USD 5,985,000 5,895,225 0.11Plantronics, Inc., 144A 5.5%31/05/2023 USD 11,865,000 11,034,450 0.21Post Holdings, Inc., 144A 5.5%01/03/2025 USD 11,590,000 11,074,593 0.21Post Holdings, Inc., 144A 5.75%01/03/2027 USD 2,159,000 2,027,560 0.04Post Holdings, Inc., 144A 5.625%15/01/2028 USD 4,565,000 4,254,580 0.08Prestige Brands, Inc., 144A 6.375%01/03/2024 USD 8,245,000 7,956,425 0.15Rain CII Carbon LLC, 144A 7.25%01/04/2025 USD 14,805,000 13,472,550 0.25RBS Global, Inc., 144A 4.875%15/12/2025 USD 4,750,000 4,367,673 0.08Refinitiv US Holdings, Inc., 144A 6.25%15/05/2026 USD 5,470,000 5,293,975 0.10Reynolds Group Issuer, Inc., FRN, 144A5.936% 15/07/2021 USD 800,000 798,000 0.02Reynolds Group Issuer, Inc. 6.726%15/02/2021 USD 887,136 884,918 0.02Rite Aid Corp., 144A 6.375%01/04/2023 USD 23,072,000 18,198,040 0.34Sabra Health Care LP, REIT 5.125%15/08/2026 USD 7,750,000 7,162,162 0.14Sabre GLBL, Inc., 144A 5.375%15/04/2023 USD 8,670,000 8,643,470 0.16Sabre GLBL, Inc., 144A 5.25%15/11/2023 USD 15,599,000 15,501,506 0.29SBA Communications Corp., REIT4.875% 01/09/2024 USD 10,960,000 10,466,088 0.20Sinclair Television Group, Inc., 144A5.625% 01/08/2024 USD 5,091,000 4,771,794 0.09Sinclair Television Group, Inc., 144A5.125% 15/02/2027 USD 2,095,000 1,851,456 0.04Sinclair Television Group, Inc. 6.125%01/10/2022 USD 17,230,000 17,387,396 0.33Sirius XM Radio, Inc., 144A 6%15/07/2024 USD 32,034,000 32,190,646 0.61Sirius XM Radio, Inc., 144A 5.375%15/04/2025 USD 25,377,000 24,298,478 0.46Sirius XM Radio, Inc., 144A 5.375%15/07/2026 USD 9,080,000 8,674,215 0.16Sirius XM Radio, Inc., 144A 5%01/08/2027 USD 2,485,000 2,274,347 0.04Six Flags Entertainment Corp., 144A4.875% 31/07/2024 USD 4,820,000 4,548,875 0.09SPX FLOW, Inc., 144A 5.625%15/08/2024 USD 6,142,000 5,819,545 0.11SPX FLOW, Inc., 144A 5.875%15/08/2026 USD 6,665,000 6,215,113 0.12Standard Industries, Inc., 144A 4.75%15/01/2028 USD 16,920,000 14,154,595 0.27Staples, Inc., 144A 8.5% 15/09/2025 USD 29,435,000 26,366,401 0.50Stevens Holding Co., Inc., 144A 6.125%01/10/2026 USD 4,980,000 4,892,850 0.09Sunoco LP 4.875% 15/01/2023 USD 3,135,000 3,073,679 0.06Sunoco LP 5.5% 15/02/2026 USD 4,370,000 4,140,575 0.08Syneos Health, Inc., 144A 7.5%01/10/2024 USD 11,201,000 11,705,045 0.22Tallgrass Energy Partners LP, 144A5.5% 15/01/2028 USD 15,365,000 14,673,575 0.28Targa Resources Partners LP, 144A5.875% 15/04/2026 USD 8,400,000 8,190,000 0.15Targa Resources Partners LP 4.25%15/11/2023 USD 1,250,000 1,166,350 0.02
Targa Resources Partners LP 5.125%01/02/2025 USD 140,000 132,120 0.00Targa Resources Partners LP 5%15/01/2028 USD 8,205,000 7,466,550 0.14Tenet Healthcare Corp., 144A 7.5%01/01/2022 USD 5,625,000 5,766,975 0.11Terex Corp., 144A 5.625% 01/02/2025 USD 11,931,000 11,153,815 0.21T-Mobile USA, Inc. 6.5% 15/01/2024 USD 21,746,000 22,383,484 0.42T-Mobile USA, Inc. 6.375% 01/03/2025 USD 10,596,000 10,742,066 0.20T-Mobile USA, Inc. 6.5% 15/01/2026 USD 16,895,000 17,289,752 0.33T-Mobile USA, Inc. 4.5% 01/02/2026 USD 1,740,000 1,620,645 0.03T-Mobile USA, Inc. 4.75% 01/02/2028 USD 22,494,000 20,863,522 0.39TreeHouse Foods, Inc., 144A 6%15/02/2024 USD 17,774,000 17,688,507 0.33TriMas Corp., 144A 4.875% 15/10/2025 USD 7,925,000 7,291,000 0.14Uniti Group LP, REIT, 144A 6%15/04/2023 USD 5,935,000 5,411,058 0.10Uniti Group LP, REIT, 144A 7.125%15/12/2024 USD 1,940,000 1,585,950 0.03Uniti Group LP, REIT 8.25% 15/10/2023 USD 24,830,000 21,503,897 0.41US Treasury Bill 0% 08/01/2019 USD 17,000,000 16,991,609 0.32US Treasury Bill 0% 29/01/2019 USD 2,000,000 1,996,180 0.04Valeant Pharmaceuticals International,Inc., 144A 8.5% 31/01/2027 USD 8,244,000 8,033,242 0.15VICI Properties 1 LLC, REIT 8%15/10/2023 USD 18,143,229 19,481,473 0.36Wabash National Corp., 144A 5.5%01/10/2025 USD 7,845,000 6,717,281 0.13Windstream Services LLC, 144A 10.5%30/06/2024 USD 3,375,000 2,565,000 0.05Windstream Services LLC, 144A 9%30/06/2025 USD 53,279,000 36,096,523 0.68Wynn Las Vegas LLC, 144A 5.5%01/03/2025 USD 28,095,000 26,555,815 0.50XPO Logistics, Inc., 144A 6.5%15/06/2022 USD 9,919,000 9,745,418 0.18XPO Logistics, Inc., 144A 6.125%01/09/2023 USD 5,656,000 5,489,233 0.10
2,429,817,069 45.88
Total Bonds 3,086,554,289 58.25
Convertible Bonds
United States of AmericaChesapeake Energy Corp. 5.47%15/09/2026 USD 2,505,000 2,034,060 0.04DISH Network Corp. 3.375%15/08/2026 USD 11,375,000 9,162,904 0.17
11,196,964 0.21
Total Convertible Bonds 11,196,964 0.21
Total Transferable securities and money market instrumentsdealt in on another regulated market
3,097,751,253 58.46
Other transferable securities and money market instruments
Bonds
United States of America21st Century Oncology, Inc., FRN 0%30/04/2023* USD 7,324,361 6,591,925 0.12Noranda Aluminum Acquisition Corp.11% 01/06/2019§* USD 4,530,000 0 0.00Reichhold Industries, Inc., 144A 9.075%08/05/2017§* USD 4,799,657 5 0.00
6,591,930 0.12
Total Bonds 6,591,930 0.12
Equities
United States of America21st Century Oncology Holdings, Inc.* USD 23,970 886,890 0.0221st Century Oncology Holdings, Inc.Preference* USD 37,168 10,035,360 0.19Claires Holdings GmbH* USD 12,631 10,946,909 0.21Claire’s Stores, Inc. Preference* USD 7,185 11,436,149 0.22Reichhold , Inc.* USD 7,978 6,900,970 0.13Remington LLC* USD 24,499,000 0 0.00Remington Outdoor Co., Inc.* USD 251,768 2,072,050 0.04UCI International, Inc.* USD 524,507 10,227,886 0.19
52,506,214 1.00
Total Equities 52,506,214 1.00
36
JPMorgan Investment Funds - Global High Yield Bond Fund
Schedule of Investments (continued)
As at 31 December 2018
Investments Currency
Quantity/Nominal
Value
MarketValue
USD
%of
NetAssets Investments Currency
Quantity/Nominal
Value
MarketValue
USD
%of
NetAssets

Warrants
United States of AmericaJack Cooper Enterprises, Inc.26/04/2027* USD 32,001 0 0.00Jack Cooper Enterprises, Inc.29/10/2027* USD 17,531 0 0.00Remington Outdoor Co., Inc.15/05/2022* USD 253,884 2,539 0.00
2,539 0.00
Total Warrants 2,539 0.00
Total Other transferable securities and money marketinstruments
59,100,683 1.12
Units of authorised UCITS or other collective investment undertakings
Collective Investment Schemes - UCITS
LuxembourgJPMorgan Europe High Yield Bond Fund- JPM Europe High Yield Bond X (acc) -EUR† EUR 317,819 43,794,976 0.83
43,794,976 0.83
Total Collective Investment Schemes - UCITS 43,794,976 0.83
Total Units of authorised UCITS or other collective investmentundertakings
43,794,976 0.83
Total Investments 5,218,163,655 98.56
Cash 18,183,155 0.34
Other Assets/(Liabilities) 58,090,470 1.10
Total Net Assets 5,294,437,280 100.00
§ Security is currently in default.* Security is valued at its fair value under the direction of the Board of Directors.† Related Party Fund.
Geographic Allocation of Portfolio as at 31 December 2018 % of Net AssetsUnited States of America 82.97Canada 5.29Luxembourg 4.44United Kingdom 1.10Netherlands 0.96Cayman Islands 0.86Ireland 0.84Supranational 0.63Jersey 0.52France 0.45Italy 0.32Germany 0.12Bermuda 0.06Total Investments 98.56Cash and Other Assets/(Liabilities) 1.44
Total 100.00
Geographic Allocation of Portfolio as at 30 June 2018(Unaudited)
% of Net Assets
United States of America 83.61Canada 5.02Luxembourg 4.90United Kingdom 1.24Netherlands 0.93Ireland 0.79France 0.73Cayman Islands 0.62Supranational 0.43Jersey 0.42Italy 0.20Germany 0.11Bermuda 0.04Australia 0.03Total Investments 99.07Cash and Other Assets/(Liabilities) 0.93
Total 100.00
37
JPMorgan Investment Funds - Global High Yield Bond Fund
Schedule of Investments (continued)
As at 31 December 2018
Investments Currency
Quantity/Nominal
Value
MarketValue
USD
%of
NetAssets Investments Currency
Quantity/Nominal
Value
MarketValue
USD
%of
NetAssets

JPMorgan Investment Funds - Global High Yield Bond Fund
Schedule of Investments (continued)
As at 31 December 2018
Forward Currency Exchange Contracts (continued)
CurrencyPurchased
AmountPurchased Currency Sold Amount Sold
MaturityDate Counterparty
UnrealisedGain/(Loss)
USD
%of
NetAssets
AUD 662,056 USD 464,658 03/01/2019 BNP Paribas 1,940 -AUD 345,404 USD 243,525 05/02/2019 ANZ 67 -CHF 4,746 USD 4,782 07/01/2019 Merrill Lynch 31 -CHF 672,219 USD 675,498 07/01/2019 RBC 6,099 -CHF 2,586 USD 2,608 07/01/2019 State Street 13 -CNH 17,464 USD 2,512 07/01/2019 Societe Generale 29 -CNH 4,257,472 USD 614,519 17/01/2019 BNP Paribas 4,927 -CNH 38,953 USD 5,612 17/01/2019 Merrill Lynch 55 -CNH 15,829 USD 2,273 17/01/2019 Standard Chartered 30 -CNH 11,502 USD 1,673 11/02/2019 Merrill Lynch 1 -CZK 22,079 USD 970 07/01/2019 Citibank 10 -CZK 25,100 USD 1,101 07/01/2019 Deutsche Bank 14 -CZK 5,099,328 USD 223,107 07/01/2019 HSBC 3,335 -EUR 5,074 USD 5,787 02/01/2019 BNP Paribas 15 -EUR 365,007 USD 417,069 03/01/2019 RBC 313 -EUR 1,082 USD 1,236 07/01/2019 ANZ 1 -EUR 1,937,014 USD 2,193,202 07/01/2019 Barclays 22,484 -EUR 1,235,571,955 USD 1,403,528,171 07/01/2019 Citibank 9,801,951 0.19EUR 4,753,362 USD 5,435,451 07/01/2019 HSBC 1,764 -EUR 320,352 USD 365,765 07/01/2019 Merrill Lynch 675 -EUR 23,221 USD 26,483 07/01/2019 National Australia Bank 79 -EUR 5,618,725 USD 6,410,916 07/01/2019 Societe Generale 16,159 -EUR 7,376,448 USD 8,398,471 07/01/2019 Standard Chartered 39,205 -EUR 8,400 USD 9,502 07/01/2019 Toronto-Dominion Bank 106 -EUR 3,354 USD 3,836 05/02/2019 ANZ 11 -GBP 101,844 USD 128,684 03/01/2019 BNP Paribas 1,686 -GBP 1,246 USD 1,577 07/01/2019 ANZ 17 -GBP 11,940 USD 15,140 07/01/2019 BNP Paribas 148 -GBP 38,000,724 USD 48,634,999 07/01/2019 HSBC 19,314 -GBP 6,038 USD 7,603 07/01/2019 Morgan Stanley 128 -GBP 68,906 USD 86,960 07/01/2019 RBC 1,264 -GBP 1,123 USD 1,413 07/01/2019 Standard Chartered 25 -GBP 10,336 USD 13,228 07/01/2019 State Street 6 -GBP 106,099 USD 135,467 05/02/2019 BNP Paribas 582 -HUF 328,906 USD 1,166 02/01/2019 Citibank 6 -HUF 589,363,402 USD 2,061,650 07/01/2019 BNP Paribas 39,227 -HUF 3,000,729 USD 10,591 07/01/2019 Citibank 105 -HUF 6,517,794 USD 22,967 07/01/2019 HSBC 267 -HUF 896,968 USD 3,201 05/02/2019 Citibank 3 -PLN 77,322 USD 20,525 07/01/2019 HSBC 16 -PLN 24,206,797 USD 6,380,565 07/01/2019 Merrill Lynch 50,169 -PLN 35,756 USD 9,401 07/01/2019 Morgan Stanley 98 -USD 18,091 AUD 25,659 02/01/2019 Goldman Sachs 7 -USD 5,721 AUD 8,098 03/01/2019 BNP Paribas 14 -USD 41,350 AUD 58,195 07/01/2019 ANZ 332 -USD 4,157,168 AUD 5,837,954 07/01/2019 Barclays 42,415 -USD 3,391,752 AUD 4,691,931 07/01/2019 Citibank 84,748 -USD 2,235,982 AUD 3,146,754 07/01/2019 Deutsche Bank 18,063 -USD 3,655,057 AUD 5,144,808 07/01/2019 Goldman Sachs 28,852 -USD 1,552,613 AUD 2,153,973 07/01/2019 Merrill Lynch 34,432 -USD 455,966 AUD 631,565 07/01/2019 Standard Chartered 10,821 -USD 1,313,646 AUD 1,816,701 07/01/2019 State Street 33,185 -USD 340,025 AUD 471,438 07/01/2019 Toronto-Dominion Bank 7,743 -USD 479,770 AUD 666,717 07/01/2019 UBS 9,849 -USD 1,693,801 AUD 2,400,395 05/02/2019 Merrill Lynch 943 -USD 34,879 CAD 46,995 07/01/2019 BNP Paribas 428 -USD 11,869 CAD 15,864 07/01/2019 Deutsche Bank 240 -USD 128,830 CAD 174,448 07/01/2019 Merrill Lynch 946 -USD 26,688 CAD 35,716 07/01/2019 RBC 505 -USD 122,256 CAD 164,049 07/01/2019 State Street 1,996 -USD 12,304 CAD 16,485 07/01/2019 Toronto-Dominion Bank 219 -USD 45,524 CAD 61,902 05/02/2019 Merrill Lynch 110 -USD 604,558 CHF 594,409 07/01/2019 Merrill Lynch 1,856 -USD 3,517 CHF 3,455 05/02/2019 Goldman Sachs 4 -USD 987 CZK 22,211 07/01/2019 BNP Paribas 1 -USD 1,722 CZK 38,730 07/01/2019 Citibank 2 -USD 4,775 EUR 4,163 03/01/2019 ANZ 15 -USD 179,998 EUR 157,344 07/01/2019 BNP Paribas 18 -USD 6,147,578 EUR 5,370,687 07/01/2019 Merrill Lynch 4,226 -USD 12,881,340 EUR 11,233,751 07/01/2019 Standard Chartered 31,421 -USD 8,067,874 EUR 7,023,268 05/02/2019 Standard Chartered 13,572 -USD 327,685 EUR 285,558 05/02/2019 State Street 207 -USD 114,009 GBP 88,948 07/01/2019 Barclays 125 -USD 15,320 HUF 4,290,266 07/01/2019 HSBC 27 -USD 11,543 HUF 3,227,253 05/02/2019 HSBC 14 -USD 1,223,523 NZD 1,822,772 07/01/2019 BNP Paribas 1,905 -USD 10,982 NZD 15,968 07/01/2019 Goldman Sachs 280 -USD 4,509 NZD 6,575 07/01/2019 HSBC 103 -USD 21,141 NZD 31,228 07/01/2019 Merrill Lynch 212 -USD 13,826 NZD 20,378 07/01/2019 Standard Chartered 168 -USD 21,866 NZD 31,896 07/01/2019 State Street 489 -USD 7,355 NZD 10,958 05/02/2019 Merrill Lynch 7 -USD 26,850 PLN 100,567 07/01/2019 BNP Paribas 134 -
38

JPMorgan Investment Funds - Global High Yield Bond Fund
Schedule of Investments (continued)
As at 31 December 2018
Forward Currency Exchange Contracts (continued)
CurrencyPurchased
AmountPurchased Currency Sold Amount Sold
MaturityDate Counterparty
UnrealisedGain/(Loss)
USD
%of
NetAssets
USD 46,073 PLN 172,309 07/01/2019 HSBC 297 -USD 21,311 PLN 80,008 07/01/2019 Societe Generale 56 -USD 101,884 PLN 383,044 07/01/2019 Toronto-Dominion Bank 125 -USD 268,239 PLN 1,007,959 05/02/2019 Citibank 315 -
Total Unrealised Gain on Forward Currency Exchange Contracts 10,343,802 0.19
AUD 2,686,290 USD 1,898,960 02/01/2019 Barclays (5,743) -AUD 102,155 USD 73,315 07/01/2019 ANZ (1,314) -AUD 4,101,771 USD 2,993,556 07/01/2019 Barclays (102,514) -AUD 405,989,086 USD 294,023,979 07/01/2019 BNP Paribas (7,871,529) (0.15)AUD 576,814 USD 419,266 07/01/2019 National Australia Bank (12,711) -AUD 2,315 USD 1,670 07/01/2019 Standard Chartered (38) -AUD 439,993 USD 317,755 07/01/2019 State Street (7,635) -AUD 233,282 USD 170,551 07/01/2019 Toronto-Dominion Bank (6,127) -AUD 1,148,301 USD 810,686 05/02/2019 BNP Paribas (858) -AUD 25,659 USD 18,099 05/02/2019 Goldman Sachs (3) -CAD 120,880 USD 90,978 07/01/2019 ANZ (2,363) -CAD 10,387,206 USD 7,833,757 07/01/2019 Citibank (219,143) -CAD 33,878 USD 25,486 07/01/2019 Merrill Lynch (651) -CAD 2,479 USD 1,849 07/01/2019 National Australia Bank (32) -CAD 70,230 USD 52,989 07/01/2019 RBC (1,505) -CAD 29,664 USD 21,801 05/02/2019 Merrill Lynch (38) -CHF 591,455 USD 603,204 05/02/2019 Merrill Lynch (1,812) -CNH 16,111 USD 2,357 07/01/2019 RBC (13) -CZK 14,089 USD 628 05/02/2019 HSBC (2) -EUR 285,558 USD 326,812 04/01/2019 State Street (253) -EUR 5,425 USD 6,226 07/01/2019 Morgan Stanley (20) -EUR 4,163 USD 4,788 05/02/2019 ANZ (14) -EUR 3,403,365 USD 3,908,407 05/02/2019 Merrill Lynch (5,419) -GBP 194,700 USD 249,769 07/01/2019 Barclays (485) -GBP 173,636 USD 222,413 07/01/2019 Morgan Stanley (98) -HUF 1,566,546 USD 5,601 05/02/2019 HSBC (5) -NZD 7,233 USD 5,032 07/01/2019 Barclays (185) -NZD 5,360 USD 3,642 07/01/2019 HSBC (50) -NZD 6,605 USD 4,535 07/01/2019 Merrill Lynch (108) -NZD 1,907,085 USD 1,295,620 07/01/2019 Toronto-Dominion Bank (17,496) -NZD 2,535 USD 1,744 07/01/2019 UBS (45) -NZD 1,828,050 USD 1,227,700 05/02/2019 BNP Paribas (1,878) -PLN 878,034 USD 233,467 04/01/2019 Citibank (218) -PLN 91,612 USD 24,403 07/01/2019 Toronto-Dominion Bank (66) -PLN 60,730 USD 16,204 05/02/2019 Societe Generale (62) -USD 243,380 AUD 345,404 04/01/2019 ANZ (55) -USD 464,889 AUD 662,056 05/02/2019 BNP Paribas (2,021) -USD 2,693 CHF 2,664 07/01/2019 Goldman Sachs (8) -USD 68,988 CHF 68,240 07/01/2019 HSBC (204) -USD 13,127 CHF 13,030 07/01/2019 Merrill Lynch (85) -USD 1,219 CHF 1,207 07/01/2019 Standard Chartered (6) -USD 3,358 CNH 23,150 07/01/2019 Citibank (10) -USD 7,908 CNH 54,617 07/01/2019 HSBC (39) -USD 11,613 CNH 80,144 07/01/2019 Societe Generale (49) -USD 4,287 CNH 29,833 17/01/2019 ANZ (54) -USD 3,397 CNH 23,618 17/01/2019 BNP Paribas (39) -USD 4,692 CNH 32,619 17/01/2019 Citibank (54) -USD 1,408 CNH 9,829 17/01/2019 Merrill Lynch (22) -USD 1,453 CNH 10,100 17/01/2019 Morgan Stanley (16) -USD 2,119 CNH 14,765 17/01/2019 Standard Chartered (29) -USD 3,490 CNH 24,022 11/02/2019 HSBC (5) -USD 1,925 CZK 43,646 07/01/2019 BNP Paribas (14) -USD 1,388 CZK 31,474 07/01/2019 Citibank (10) -USD 1,283 CZK 28,929 07/01/2019 Goldman Sachs (2) -USD 452 CZK 10,281 07/01/2019 HSBC (5) -USD 1,300 CZK 29,267 05/02/2019 Citibank (1) -USD 3,825 EUR 3,354 02/01/2019 ANZ (10) -USD 1,205,971 EUR 1,063,331 07/01/2019 ANZ (10,339) -USD 2,186,040 EUR 1,918,762 07/01/2019 Barclays (8,769) -USD 639,712 EUR 563,265 07/01/2019 BNP Paribas (4,589) -USD 46,116 EUR 40,471 07/01/2019 Citibank (178) -USD 2,505 EUR 2,196 07/01/2019 Deutsche Bank (7) -USD 4,710,867 EUR 4,129,278 07/01/2019 HSBC (12,477) -USD 4,333,283 EUR 3,806,799 07/01/2019 National Australia Bank (21,189) -USD 7,080,175 EUR 6,212,895 07/01/2019 RBC (26,552) -USD 20,615,598 EUR 18,119,268 07/01/2019 Standard Chartered (110,437) -USD 17,490,460 EUR 15,325,246 07/01/2019 State Street (39,585) -USD 768,514 EUR 674,001 07/01/2019 Toronto-Dominion Bank (2,453) -USD 39,772,576 EUR 34,940,749 31/01/2019 State Street (280,920) (0.01)USD 418,237 EUR 365,007 05/02/2019 RBC (354) -USD 15,137 GBP 11,940 02/01/2019 BNP Paribas (148) -USD 164,560 GBP 128,726 07/01/2019 Barclays (254) -USD 77,209 GBP 60,347 07/01/2019 BNP Paribas (56) -USD 25,458 GBP 19,884 07/01/2019 Citibank (1) -USD 419,802 GBP 331,589 07/01/2019 HSBC (4,748) -
39

JPMorgan Investment Funds - Global High Yield Bond Fund
Schedule of Investments (continued)
As at 31 December 2018
Forward Currency Exchange Contracts (continued)
CurrencyPurchased
AmountPurchased Currency Sold Amount Sold
MaturityDate Counterparty
UnrealisedGain/(Loss)
USD
%of
NetAssets
USD 789,741 GBP 622,519 07/01/2019 Merrill Lynch (7,302) -USD 193,187 GBP 152,585 07/01/2019 Toronto-Dominion Bank (2,175) -USD 128,900 GBP 101,844 05/02/2019 BNP Paribas (1,693) -USD 281,814 GBP 222,424 05/02/2019 Standard Chartered (3,396) -USD 3,194 HUF 896,968 04/01/2019 Citibank (2) -USD 36,398 HUF 10,308,622 07/01/2019 BNP Paribas (349) -USD 1,166 HUF 328,906 07/01/2019 Citibank (6) -USD 49,842 HUF 14,160,620 07/01/2019 Goldman Sachs (635) -USD 24,004 HUF 6,778,320 07/01/2019 HSBC (159) -USD 12,561 HUF 3,571,759 07/01/2019 RBC (171) -USD 4,041 HUF 1,135,675 07/01/2019 State Street (7) -USD 19,995 HUF 5,706,635 07/01/2019 Toronto-Dominion Bank (347) -USD 9,115 PLN 34,610 07/01/2019 Citibank (79) -USD 337,974 PLN 1,276,872 07/01/2019 Goldman Sachs (1,237) -USD 26,104 PLN 98,513 07/01/2019 HSBC (67) -USD 42,306 PLN 159,354 07/01/2019 Societe Generale (28) -USD 9,449 PLN 35,603 07/01/2019 Toronto-Dominion Bank (9) -
Total Unrealised Loss on Forward Currency Exchange Contracts (8,803,889) (0.16)
Net Unrealised Gain on Forward Currency Exchange Contracts 1,539,913 0.03
40

1. Total Expense Ratios (continued)For the
yearended
31 Dec 18+
For theyear
ended31 Dec 18 (a)
For theyear
ended31 Dec 18 (b)
For theyear
ended31 Dec 18 (c)
For theyear
ended31 Dec 17+
For theyear
ended31 Dec 16+
CappedExpense
Ratio31 Dec 18+
InceptionDate
JPMorgan Investment Funds - Europe Select Equity FundJPM Europe Select Equity A (acc) - CZK 1.80% 1.80% 1.80% 1.80% - - 1.80% 16-Feb-18JPM Europe Select Equity A (acc) - EUR 1.70% 1.70% 1.70% 1.70% 1.71% 1.71% 1.80% 29-Aug-97JPM Europe Select Equity A (acc) - USD 1.80% 1.80% 1.80% 1.80% 1.80% 1.80% 1.80% 20-Dec-07JPM Europe Select Equity A (dist) - EUR 1.80% 1.80% 1.80% 1.80% 1.80% 1.80% 1.80% 15-May-06JPM Europe Select Equity A (dist) - GBP 1.80% 1.80% 1.80% 1.80% - - 1.80% 23-Feb-18JPM Europe Select Equity C (acc) - EUR 0.70% 0.70% 0.70% 0.70% 0.70% 0.85% 0.70% 07-Jan-98JPM Europe Select Equity C (acc) - USD 0.70% 0.70% 0.70% 0.70% 0.70% 0.85% 0.70% 16-Oct-15JPM Europe Select Equity C (dist) - EUR 0.70% 0.70% 0.70% 0.70% 0.70% 0.74% 0.70% 29-Sep-15JPM Europe Select Equity C (dist) - GBP 0.70% 0.70% 0.70% 0.70% 0.70% 0.85% 0.70% 25-Jan-13JPM Europe Select Equity D (acc) - EUR 2.53% 2.53% 2.53% 2.53% 2.55% 2.55% 2.55% 19-Mar-07JPM Europe Select Equity D (acc) - USD 2.53% 2.53% 2.53% 2.53% 2.55% 2.55% 2.55% 20-Dec-07JPM Europe Select Equity I (acc) - EUR 0.66% 0.66% 0.66% 0.66% 0.66% 0.81% 0.66% 13-Apr-10JPM Europe Select Equity I (acc) - USD* 0.66% 0.66% 0.66% 0.66% 0.66% 0.81% 0.66% 09-Oct-13JPM Europe Select Equity I (acc) - USD (hedged) 0.66% 0.66% 0.66% 0.66% 0.66% 0.81% 0.66% 27-Jan-15JPM Europe Select Equity I (dist) - EUR 0.65% 0.65% 0.65% 0.65% 0.66% 0.81% 0.66% 11-Oct-13JPM Europe Select Equity I2 (acc) - EUR 0.56% 0.56% 0.56% 0.56% 0.56% - 0.56% 18-Dec-17JPM Europe Select Equity I2 (acc) - USD 0.56% 0.56% 0.56% 0.56% 0.43% - 0.56% 18-Dec-17JPM Europe Select Equity I2 (acc) - USD (hedged) 0.56% 0.56% 0.56% 0.56% 0.43% - 0.56% 18-Dec-17JPM Europe Select Equity I2 (dist) - EUR 0.56% 0.56% 0.56% 0.56% 0.56% - 0.56% 18-Dec-17JPM Europe Select Equity X (acc) - EUR 0.15% 0.15% 0.15% 0.15% 0.15% 0.15% 0.15% 21-May-01JPM Europe Select Equity X (acc) - USD (hedged) 0.15% 0.15% 0.15% 0.15% 0.15% 0.15% 0.15% 29-Apr-15JPM Europe Select Equity X (dist) - EUR 0.15% 0.15% 0.15% 0.15% 0.15% 0.15% 0.15% 06-Nov-13
JPMorgan Investment Funds - Global Dividend FundJPM Global Dividend A (acc) - EUR 1.80% 1.80% 1.80% 1.80% 1.80% 1.80% 1.80% 04-Oct-10JPM Global Dividend A (acc) - EUR (hedged) 1.80% 1.80% 1.80% 1.80% 1.80% 1.80% 1.80% 28-Nov-07JPM Global Dividend A (acc) - USD 1.80% 1.80% 1.80% 1.80% 1.80% 1.80% 1.80% 28-Nov-07JPM Global Dividend A (dist) - EUR (hedged) 1.80% 1.80% 1.80% 1.80% 1.80% 1.80% 1.80% 12-Feb-09JPM Global Dividend A (dist) - USD 1.80% 1.80% 1.80% 1.80% 1.80% 1.80% 1.80% 12-Oct-09JPM Global Dividend A (div) - EUR 1.80% 1.80% 1.80% 1.80% 1.80% 1.80% 1.80% 01-Dec-11JPM Global Dividend A (div) - EUR (hedged) 1.80% 1.80% 1.80% 1.80% 1.80% 1.80% 1.80% 22-Feb-12JPM Global Dividend A (div) - USD 1.80% 1.80% 1.80% 1.80% 1.80% 1.80% 1.80% 13-Jan-12JPM Global Dividend A (mth) - USD (hedged) 1.80% 1.80% 1.80% 1.80% 1.80% 1.80% 1.80% 15-Sep-14JPM Global Dividend C (acc) - EUR 0.80% 0.80% 0.80% 0.80% 0.80% 0.80% 0.80% 02-Apr-09JPM Global Dividend C (acc) - USD 0.80% 0.80% 0.80% 0.80% 0.80% 0.80% 0.80% 08-Nov-12JPM Global Dividend C (dist) - EUR 0.80% 0.80% 0.80% 0.80% 0.80% 0.80% 0.80% 14-Jul-11JPM Global Dividend C (dist) - EUR (hedged) 0.80% 0.80% 0.80% 0.80% 0.80% 0.80% 0.80% 24-Sep-13JPM Global Dividend C (div) - EUR** 0.80% 0.80% 0.80% 0.80% 0.80% 0.80% 0.80% 01-Dec-11JPM Global Dividend D (acc) - EUR (hedged) 2.55% 2.55% 2.55% 2.55% 2.55% 2.55% 2.55% 28-Nov-07JPM Global Dividend D (acc) - USD 2.55% 2.55% 2.55% 2.55% 2.55% 2.55% 2.55% 28-Nov-07JPM Global Dividend D (div) - EUR (hedged) 2.55% 2.55% 2.55% 2.55% 2.55% 2.55% 2.55% 22-Feb-12JPM Global Dividend D (mth) - EUR (hedged) 2.55% 2.55% 2.55% 2.55% 2.55% - 2.55% 27-Feb-17JPM Global Dividend F (mth) - USD (hedged) 2.80% 2.80% 2.80% 2.80% 2.74% - 2.80% 14-Dec-17JPM Global Dividend I (acc) - EUR 0.76% 0.76% 0.76% 0.76% 0.76% - 0.76% 04-Oct-13JPM Global Dividend I (dist) - EUR (hedged)* - - - - 0.74% 0.76% 0.76% 15-Oct-13JPM Global Dividend T (acc) - EUR (hedged) 2.55% 2.55% 2.55% 2.55% 2.55% 2.55% 2.55% 17-Aug-12JPM Global Dividend X (acc) - EUR (hedged)* 0.15% 0.15% 0.15% 0.15% 0.15% 0.15% 0.15% 22-Nov-12JPM Global Dividend X (acc) - USD 0.15% 0.15% 0.15% 0.15% 0.15% 0.15% 0.15% 13-Jan-10JPM Global Dividend X (dist) - AUD 0.15% 0.15% 0.15% 0.15% 0.15% 0.15% 0.15% 19-Dec-13
* Share Class inactive as at end of the year.** Share Class reactivated during the year.+ Expense ratios are calculated in accordance with the guidelines dated 16 May 2008 issued by the Swiss Funds & Asset Management Association. The Total Expense Ratio (“TER”) represents the totaloperating costs as a percentage of the Fund’s average daily net assets. The total operating cost comprises investment management and advisory fees, custodian/depositary fees, taxe d’abonnementand other expenses, as summarised in the Combined Statement of Operations and Changes in Net Assets. Overdraft interest and Performance Fees are excluded from the calculation.
The capped expense ratios and total expense ratios for some Share Classes may have changed over the previous two years. All details concerning these changes have been disclosed in previous years’Financial Statements. All TER figures are annualised.
(a) These figures include Fee Waivers on Management and Advisory Fees or Operating and Administrative expenses, where applicable.(b) These figures include Performance Fees, where applicable.(c) These figures include i) Fee Waivers on Management and Advisory Fees or Operating and Administrative expenses and ii) Performance Fees, where applicable.
41
JPMorgan Investment Funds
Appendix - Unaudited Additional Disclosures

1. Total Expense Ratios (continued)For the
yearended
31 Dec 18+
For theyear
ended31 Dec 18 (a)
For theyear
ended31 Dec 18 (b)
For theyear
ended31 Dec 18 (c)
For theyear
ended31 Dec 17+
For theyear
ended31 Dec 16+
CappedExpense
Ratio31 Dec 18+
InceptionDate
JPMorgan Investment Funds - Global High Yield Bond FundJPM Global High Yield Bond A (acc) - AUD (hedged) 1.15% 1.15% 1.15% 1.15% 1.15% 1.15% 1.15% 03-Apr-14JPM Global High Yield Bond A (acc) - CHF (hedged) 1.15% 1.15% 1.15% 1.15% 1.15% 1.15% 1.15% 25-Sep-12JPM Global High Yield Bond A (acc) - CZK (hedged) 1.15% 1.15% 1.15% 1.15% 1.15% - 1.15% 09-Jan-17JPM Global High Yield Bond A (acc) - EUR (hedged) 1.04% 1.04% 1.04% 1.04% 1.07% 1.07% 1.15% 24-Mar-00JPM Global High Yield Bond A (acc) - HUF (hedged) 1.15% 1.15% 1.15% 1.15% 1.15% 1.15% 1.15% 24-Jul-14JPM Global High Yield Bond A (acc) - USD 1.07% 1.07% 1.07% 1.07% 1.06% 1.05% 1.15% 02-Sep-08JPM Global High Yield Bond A (dist) - EUR (hedged) 1.06% 1.06% 1.06% 1.06% 1.08% 1.13% 1.15% 15-May-06JPM Global High Yield Bond A (dist) - USD 1.15% 1.15% 1.15% 1.15% 1.15% 1.07% 1.15% 17-Oct-12JPM Global High Yield Bond A (irc) - AUD (hedged) 1.08% 1.08% 1.08% 1.08% 1.08% 1.08% 1.15% 12-Mar-13JPM Global High Yield Bond A (irc) - CAD (hedged) 1.15% 1.15% 1.15% 1.15% 1.15% 1.15% 1.15% 19-Mar-13JPM Global High Yield Bond A (irc) - NZD (hedged) 1.15% 1.15% 1.15% 1.15% 1.15% 1.15% 1.15% 14-Mar-13JPM Global High Yield Bond A (irc) - RMB (hedged) 1.15% 1.15% 1.15% 1.15% 1.15% 1.15% 1.15% 17-Mar-14JPM Global High Yield Bond A (mth) - HKD 1.09% 1.09% 1.09% 1.09% 1.09% 1.08% 1.15% 01-Feb-12JPM Global High Yield Bond A (mth) - SGD 1.15% 1.15% 1.15% 1.15% 1.15% 1.15% 1.15% 15-Nov-12JPM Global High Yield Bond A (mth) - USD 1.07% 1.07% 1.07% 1.07% 1.08% 1.07% 1.15% 17-Sep-08JPM Global High Yield Bond C (acc) - EUR (hedged) 0.60% 0.60% 0.60% 0.60% 0.60% 0.60% 0.60% 24-Mar-00JPM Global High Yield Bond C (acc) - PLN (hedged) 0.60% 0.60% 0.60% 0.60% 0.60% 0.60% 0.60% 18-Sep-12JPM Global High Yield Bond C (acc) - USD 0.60% 0.60% 0.60% 0.60% 0.60% 0.60% 0.60% 18-Aug-08JPM Global High Yield Bond C (dist) - EUR (hedged) 0.60% 0.60% 0.60% 0.60% 0.60% 0.60% 0.60% 12-Feb-13JPM Global High Yield Bond C (dist) - GBP (hedged) 0.60% 0.60% 0.60% 0.60% 0.60% 0.60% 0.60% 20-Jan-15JPM Global High Yield Bond C (dist) - USD 0.60% 0.60% 0.60% 0.60% 0.60% 0.60% 0.60% 29-May-12JPM Global High Yield Bond C (div) - EUR (hedged) 0.60% 0.60% 0.60% 0.60% 0.60% 0.60% 0.60% 04-May-12JPM Global High Yield Bond C (inc) - EUR (hedged)*** - - - - 0.60% 0.60% 0.60% 22-Feb-13JPM Global High Yield Bond C (irc) - CAD (hedged) 0.60% 0.60% 0.60% 0.60% 0.60% 0.60% 0.60% 16-Oct-15JPM Global High Yield Bond C (irc) - RMB (hedged)* - - - - 0.60% 0.60% 0.60% 23-Oct-15JPM Global High Yield Bond C (mth) - HKD 0.60% 0.60% 0.60% 0.60% 0.60% 0.60% 0.60% 23-Oct-15JPM Global High Yield Bond C (mth) - USD 0.60% 0.60% 0.60% 0.60% 0.60% 0.60% 0.60% 13-Jul-12JPM Global High Yield Bond D (acc) - EUR (hedged) 1.46% 1.46% 1.46% 1.46% 1.46% 1.48% 1.55% 18-Apr-01JPM Global High Yield Bond D (acc) - PLN (hedged) 1.55% 1.55% 1.55% 1.55% 1.55% 1.55% 1.55% 18-Sep-12JPM Global High Yield Bond D (acc) - USD 1.55% 1.55% 1.55% 1.55% 1.55% 1.55% 1.55% 17-Sep-10JPM Global High Yield Bond D (div) - EUR (hedged) 1.43% 1.43% 1.43% 1.43% 1.44% 1.47% 1.55% 31-Oct-12JPM Global High Yield Bond D (mth) - EUR (hedged) 1.55% 1.55% 1.55% 1.55% 1.55% - 1.55% 27-Feb-17JPM Global High Yield Bond F (irc) - AUD (hedged) 2.15% 2.15% 2.15% 2.15% 2.15% - 2.15% 14-Dec-17JPM Global High Yield Bond F (mth) - USD 2.15% 2.15% 2.15% 2.15% 2.15% - 2.15% 14-Dec-17JPM Global High Yield Bond I (acc) - EUR (hedged) 0.56% 0.56% 0.56% 0.56% 0.56% 0.56% 0.56% 03-Oct-13JPM Global High Yield Bond I (acc) - USD 0.56% 0.56% 0.56% 0.56% 0.56% 0.56% 0.56% 19-Nov-09JPM Global High Yield Bond I (dist) - EUR (hedged) 0.56% 0.56% 0.56% 0.56% 0.56% 0.56% 0.56% 18-Oct-13JPM Global High Yield Bond I (dist) - GBP (hedged)* 0.56% 0.56% 0.56% 0.56% 0.56% 0.56% 0.56% 24-Jun-15JPM Global High Yield Bond I (dist) - USD* 0.56% 0.56% 0.56% 0.56% 0.56% 0.56% 0.56% 16-Oct-13JPM Global High Yield Bond I (inc) - EUR (hedged)*** - - - - 0.56% 0.56% 0.56% 09-Mar-07JPM Global High Yield Bond I (mth) - USD 0.56% 0.56% 0.56% 0.56% 0.56% 0.56% 0.56% 04-Dec-12JPM Global High Yield Bond I2 (acc) - EUR (hedged) 0.45% 0.45% 0.45% 0.45% 0.31% - 0.45% 18-Dec-17JPM Global High Yield Bond I2 (acc) - USD 0.45% 0.45% 0.45% 0.45% 0.36% - 0.45% 18-Dec-17JPM Global High Yield Bond I2 (dist) - EUR (hedged) 0.45% 0.45% 0.45% 0.45% 0.31% - 0.45% 18-Dec-17JPM Global High Yield Bond I2 (dist) - GBP (hedged) 0.45% 0.45% 0.45% 0.45% 0.45% - 0.45% 18-Dec-17JPM Global High Yield Bond I2 (dist) - USD 0.45% 0.45% 0.45% 0.45% 0.36% - 0.45% 18-Dec-17JPM Global High Yield Bond I2 (mth) - USD 0.37% 0.37% 0.37% 0.37% 0.36% - 0.45% 18-Dec-17JPM Global High Yield Bond P (acc) - USD 0.41% 0.41% 0.41% 0.41% 0.41% - 0.60% 11-Oct-17JPM Global High Yield Bond P (dist) - EUR (hedged) 0.41% 0.41% 0.41% 0.41% 0.41% - 0.60% 27-Jan-17JPM Global High Yield Bond P (dist) - USD 0.41% 0.41% 0.41% 0.41% 0.41% 0.41% 0.60% 14-Apr-14JPM Global High Yield Bond T (acc) - EUR (hedged) 1.49% 1.49% 1.49% 1.49% 1.55% 1.55% 1.55% 17-Aug-12JPM Global High Yield Bond V (acc) - USD (hedged to BRL)* - - - - 0.56% 0.56% 0.56% 21-Jul-16JPM Global High Yield Bond X (acc) - EUR (hedged) 0.10% 0.10% 0.10% 0.10% 0.10% 0.10% 0.10% 24-Mar-00JPM Global High Yield Bond X (acc) - USD 0.10% 0.10% 0.10% 0.10% 0.10% 0.10% 0.10% 06-Jan-11JPM Global High Yield Bond X (dist) - USD* - - - - - - 0.10% 11-Aug-15JPM Global High Yield Bond X (mth) - USD 0.10% 0.10% 0.10% 0.10% - - 0.10% 12-Jan-18
* Share Class inactive as at end of the year.*** Share Class closed as at the end of the year.+ Expense ratios are calculated in accordance with the guidelines dated 16 May 2008 issued by the Swiss Funds & Asset Management Association. The Total Expense Ratio (“TER”) represents the totaloperating costs as a percentage of the Fund’s average daily net assets. The total operating cost comprises investment management and advisory fees, custodian/depositary fees, taxe d’abonnementand other expenses, as summarised in the Combined Statement of Operations and Changes in Net Assets. Overdraft interest and Performance Fees are excluded from the calculation.
The capped expense ratios and total expense ratios for some Share Classes may have changed over the previous two years. All details concerning these changes have been disclosed in previous years’Financial Statements. All TER figures are annualised.
(a) These figures include Fee Waivers on Management and Advisory Fees or Operating and Administrative expenses, where applicable.(b) These figures include Performance Fees, where applicable.(c) These figures include i) Fee Waivers on Management and Advisory Fees or Operating and Administrative expenses and ii) Performance Fees, where applicable.
42
JPMorgan Investment Funds
Appendix - Unaudited Additional Disclosures (continued)

JPMorgan Investment Funds - Europe Select Equity FundTo achieve a return in excess of the European equity markets by investing primarily in European companies.
JPMorgan Investment Funds - Global Dividend FundTo provide long-term capital growth by investing primarily in companies, globally, that generate high and rising income.
JPMorgan Investment Funds - Global High Yield Bond FundTo achieve a return in excess of global bond markets by investing primarily in global below investment grade corporate debt securities, using financialderivative instruments where appropriate.
43
JPMorgan Investment Funds
Appendix - Unaudited Additional Disclosures (continued)
2. Summary of Investment Objectives of the Sub-Funds

Performance
Returns for periods greater than one year are annualised. SICAV performance includes reinvestment of income and is net of all expenses.
Past performance is no indication of current or future performance.
The performance data does not take into account the commissions and costs incurred on the issue and redemption of units.
Volatility
The standard deviation (D) of the price is calculated on a daily basis throughout each SICAV’s financial year.
The details below relate to the year ended 31 December 2018.
If D is equal to or less than 0.1 then volatility will be Low.If D is greater than 0.1 but less than or equal to 1.0 then volatility will be Medium.If D is greater than 1.0 but less than or equal to 2.4 then volatility will be High.If D is greater than 2.4 then volatility will be Very High.
Share Class 3 Months 6 Months 9 Months 1 Year 2 Years 3 Years Volatility
JPMorgan Investment Funds - Europe Select Equity FundJPM Europe Select Equity A (acc) - CZK -11.42% -12.44% -7.44% - - - MediumJPM Europe Select Equity A (acc) - EUR -11.39% -11.54% -8.65% -12.75% -1.92% -0.63% MediumJPM Europe Select Equity A (acc) - USD -12.53% -13.17% -15.31% -16.90% 2.00% 0.93% MediumJPM Europe Select Equity A (dist) - EUR -11.41% -11.58% -8.72% -12.77% -1.87% -0.66% MediumJPM Europe Select Equity A (dist) - GBP -11.09% -10.74% -7.02% - - - MediumJPM Europe Select Equity C (acc) - EUR -11.16% -11.09% -7.96% -11.88% -1.02% 0.27% MediumJPM Europe Select Equity C (acc) - USD -12.28% -12.67% -14.60% -15.97% 3.09% 1.98% MediumJPM Europe Select Equity C (dist) - EUR -11.16% -11.09% -7.96% -11.78% -0.90% 0.40% MediumJPM Europe Select Equity C (dist) - GBP -10.84% -10.24% -6.25% -11.20% 1.44% 7.17% MediumJPM Europe Select Equity D (acc) - EUR -11.58% -11.91% -9.22% -13.48% -2.72% -1.44% MediumJPM Europe Select Equity D (acc) - USD -12.70% -13.49% -15.79% -17.52% 1.23% 0.20% MediumJPM Europe Select Equity I (acc) - EUR -11.16% -11.07% -7.93% -11.84% -0.98% 0.31% MediumJPM Europe Select Equity I (acc) - USD* - - - - - - MediumJPM Europe Select Equity I (acc) - USD (hedged) -10.32% -9.74% -5.99% -9.80% 2.09% 4.35% MediumJPM Europe Select Equity I (dist) - EUR -11.15% -11.07% -7.99% -11.55% -0.74% 0.40% MediumJPM Europe Select Equity I2 (acc) - EUR -11.13% -11.02% -7.86% -11.76% - - MediumJPM Europe Select Equity I2 (acc) - USD -12.25% -12.62% -14.51% -15.85% - - MediumJPM Europe Select Equity I2 (acc) - USD (hedged) -10.30% -9.69% -5.93% -9.71% - - MediumJPM Europe Select Equity I2 (dist) - EUR -11.13% -11.02% -7.86% -11.76% - - MediumJPM Europe Select Equity X (acc) - EUR -11.04% -10.84% -7.57% -11.39% -0.41% 0.93% MediumJPM Europe Select Equity X (acc) - USD (hedged) -10.20% -9.51% -5.62% -9.33% 2.70% 5.04% MediumJPM Europe Select Equity X (dist) - EUR -11.04% -10.84% -7.57% -11.18% -0.22% 0.92% Medium
JPMorgan Investment Funds - Global Dividend FundJPM Global Dividend A (acc) - EUR -10.10% -6.74% -0.20% -5.53% 0.12% 2.47% MediumJPM Global Dividend A (acc) - EUR (hedged) -11.62% -8.95% -6.00% -10.09% 1.14% 2.73% MediumJPM Global Dividend A (acc) - USD -11.23% -8.41% -7.40% -9.92% 4.32% 4.28% MediumJPM Global Dividend A (dist) - EUR (hedged) -11.62% -8.95% -6.00% -10.09% 1.14% 2.64% MediumJPM Global Dividend A (dist) - USD -11.23% -8.41% -7.40% -9.78% 4.32% 4.16% MediumJPM Global Dividend A (div) - EUR -10.04% -6.59% 0.01% -5.30% 0.27% 2.42% MediumJPM Global Dividend A (div) - EUR (hedged) -11.56% -8.78% -5.75% -9.79% 1.37% 2.74% MediumJPM Global Dividend A (div) - USD -11.17% -8.25% -7.16% -9.61% 4.51% 4.23% MediumJPM Global Dividend A (mth) - USD (hedged) -10.77% -7.33% -3.82% -7.26% 3.80% 4.81% MediumJPM Global Dividend C (acc) - EUR -9.87% -6.27% 0.56% -4.57% 1.13% 3.56% MediumJPM Global Dividend C (acc) - USD -11.00% -7.95% -6.70% -9.01% 5.43% - MediumJPM Global Dividend C (dist) - EUR -9.87% -6.27% 0.57% -4.54% 1.16% 3.43% MediumJPM Global Dividend C (dist) - EUR (hedged) -11.40% -8.49% -5.29% -9.08% 2.20% 3.71% MediumJPM Global Dividend C (div) - EUR** -9.81% - - - - - MediumJPM Global Dividend D (acc) - EUR (hedged) -11.78% -9.29% -6.53% -10.77% 0.38% 1.93% MediumJPM Global Dividend D (acc) - USD -11.41% -8.76% -7.93% -10.60% 3.51% 3.44% MediumJPM Global Dividend D (div) - EUR (hedged) -11.73% -9.12% -6.28% -10.44% 0.63% 1.98% MediumJPM Global Dividend D (mth) - EUR (hedged) -11.72% -9.14% -6.29% -10.44% - - MediumJPM Global Dividend F (mth) - USD (hedged) -10.99% -7.79% -4.54% -8.19% - - MediumJPM Global Dividend I (acc) - EUR -9.86% -6.25% 0.59% -4.54% - - MediumJPM Global Dividend T (acc) - EUR (hedged) -11.79% -9.29% -6.53% -10.77% 0.38% 1.93% MediumJPM Global Dividend X (acc) - EUR (hedged)* - - - - - - MediumJPM Global Dividend X (acc) - USD -10.85% -7.64% -6.24% -8.42% 6.14% - MediumJPM Global Dividend X (dist) - AUD -8.69% -3.25% 2.12% 1.48% 7.27% 7.17% Medium
* Share Class inactive as at end of the year.** Share Class reactivated during the year.
44
JPMorgan Investment Funds
Appendix - Unaudited Additional Disclosures (continued)
3. Performance and Volatility
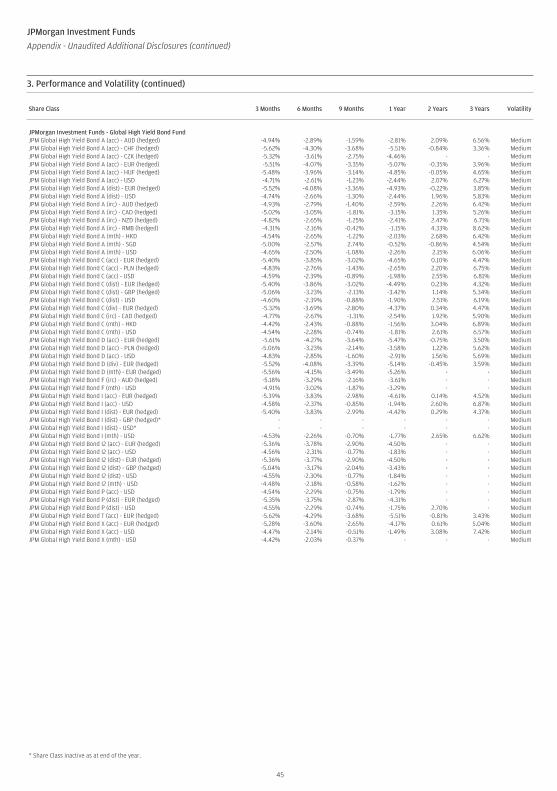
Share Class 3 Months 6 Months 9 Months 1 Year 2 Years 3 Years Volatility
JPMorgan Investment Funds - Global High Yield Bond FundJPM Global High Yield Bond A (acc) - AUD (hedged) -4.94% -2.89% -1.59% -2.81% 2.09% 6.56% MediumJPM Global High Yield Bond A (acc) - CHF (hedged) -5.62% -4.30% -3.68% -5.51% -0.84% 3.36% MediumJPM Global High Yield Bond A (acc) - CZK (hedged) -5.32% -3.61% -2.75% -4.46% - - MediumJPM Global High Yield Bond A (acc) - EUR (hedged) -5.51% -4.07% -3.35% -5.07% -0.35% 3.96% MediumJPM Global High Yield Bond A (acc) - HUF (hedged) -5.48% -3.96% -3.14% -4.85% -0.05% 4.65% MediumJPM Global High Yield Bond A (acc) - USD -4.71% -2.61% -1.23% -2.44% 2.07% 6.27% MediumJPM Global High Yield Bond A (dist) - EUR (hedged) -5.52% -4.08% -3.36% -4.93% -0.22% 3.85% MediumJPM Global High Yield Bond A (dist) - USD -4.74% -2.66% -1.30% -2.44% 1.96% 5.83% MediumJPM Global High Yield Bond A (irc) - AUD (hedged) -4.93% -2.79% -1.40% -2.59% 2.26% 6.42% MediumJPM Global High Yield Bond A (irc) - CAD (hedged) -5.02% -3.05% -1.81% -3.15% 1.35% 5.26% MediumJPM Global High Yield Bond A (irc) - NZD (hedged) -4.82% -2.65% -1.25% -2.41% 2.47% 6.71% MediumJPM Global High Yield Bond A (irc) - RMB (hedged) -4.31% -2.16% -0.42% -1.15% 4.33% 8.62% MediumJPM Global High Yield Bond A (mth) - HKD -4.54% -2.65% -1.22% -2.03% 2.68% 6.42% MediumJPM Global High Yield Bond A (mth) - SGD -5.00% -2.57% 2.74% -0.52% -0.86% 4.54% MediumJPM Global High Yield Bond A (mth) - USD -4.65% -2.50% -1.08% -2.26% 2.15% 6.06% MediumJPM Global High Yield Bond C (acc) - EUR (hedged) -5.40% -3.85% -3.02% -4.65% 0.10% 4.47% MediumJPM Global High Yield Bond C (acc) - PLN (hedged) -4.83% -2.76% -1.43% -2.65% 2.20% 6.75% MediumJPM Global High Yield Bond C (acc) - USD -4.59% -2.39% -0.89% -1.98% 2.55% 6.81% MediumJPM Global High Yield Bond C (dist) - EUR (hedged) -5.40% -3.86% -3.02% -4.49% 0.23% 4.32% MediumJPM Global High Yield Bond C (dist) - GBP (hedged) -5.06% -3.23% -2.13% -3.42% 1.14% 5.34% MediumJPM Global High Yield Bond C (dist) - USD -4.60% -2.39% -0.88% -1.90% 2.51% 6.19% MediumJPM Global High Yield Bond C (div) - EUR (hedged) -5.32% -3.69% -2.80% -4.37% 0.34% 4.47% MediumJPM Global High Yield Bond C (irc) - CAD (hedged) -4.77% -2.67% -1.31% -2.54% 1.92% 5.90% MediumJPM Global High Yield Bond C (mth) - HKD -4.42% -2.43% -0.88% -1.56% 3.04% 6.89% MediumJPM Global High Yield Bond C (mth) - USD -4.54% -2.28% -0.74% -1.81% 2.61% 6.57% MediumJPM Global High Yield Bond D (acc) - EUR (hedged) -5.61% -4.27% -3.64% -5.47% -0.75% 3.50% MediumJPM Global High Yield Bond D (acc) - PLN (hedged) -5.06% -3.23% -2.14% -3.58% 1.22% 5.62% MediumJPM Global High Yield Bond D (acc) - USD -4.83% -2.85% -1.60% -2.91% 1.56% 5.69% MediumJPM Global High Yield Bond D (div) - EUR (hedged) -5.52% -4.08% -3.39% -5.14% -0.45% 3.59% MediumJPM Global High Yield Bond D (mth) - EUR (hedged) -5.56% -4.15% -3.49% -5.26% - - MediumJPM Global High Yield Bond F (irc) - AUD (hedged) -5.18% -3.29% -2.16% -3.61% - - MediumJPM Global High Yield Bond F (mth) - USD -4.91% -3.02% -1.87% -3.29% - - MediumJPM Global High Yield Bond I (acc) - EUR (hedged) -5.39% -3.83% -2.98% -4.61% 0.14% 4.52% MediumJPM Global High Yield Bond I (acc) - USD -4.58% -2.37% -0.85% -1.94% 2.60% 6.87% MediumJPM Global High Yield Bond I (dist) - EUR (hedged) -5.40% -3.83% -2.99% -4.42% 0.29% 4.37% MediumJPM Global High Yield Bond I (dist) - GBP (hedged)* - - - - - - MediumJPM Global High Yield Bond I (dist) - USD* - - - - - - MediumJPM Global High Yield Bond I (mth) - USD -4.53% -2.26% -0.70% -1.77% 2.65% 6.62% MediumJPM Global High Yield Bond I2 (acc) - EUR (hedged) -5.36% -3.78% -2.90% -4.50% - - MediumJPM Global High Yield Bond I2 (acc) - USD -4.56% -2.31% -0.77% -1.83% - - MediumJPM Global High Yield Bond I2 (dist) - EUR (hedged) -5.36% -3.77% -2.90% -4.50% - - MediumJPM Global High Yield Bond I2 (dist) - GBP (hedged) -5.04% -3.17% -2.04% -3.43% - - MediumJPM Global High Yield Bond I2 (dist) - USD -4.55% -2.30% -0.77% -1.84% - - MediumJPM Global High Yield Bond I2 (mth) - USD -4.48% -2.18% -0.58% -1.62% - - MediumJPM Global High Yield Bond P (acc) - USD -4.54% -2.29% -0.75% -1.79% - - MediumJPM Global High Yield Bond P (dist) - EUR (hedged) -5.35% -3.75% -2.87% -4.31% - - MediumJPM Global High Yield Bond P (dist) - USD -4.55% -2.29% -0.74% -1.75% 2.70% - MediumJPM Global High Yield Bond T (acc) - EUR (hedged) -5.62% -4.29% -3.68% -5.51% -0.81% 3.43% MediumJPM Global High Yield Bond X (acc) - EUR (hedged) -5.28% -3.60% -2.65% -4.17% 0.61% 5.04% MediumJPM Global High Yield Bond X (acc) - USD -4.47% -2.14% -0.51% -1.49% 3.08% 7.42% MediumJPM Global High Yield Bond X (mth) - USD -4.42% -2.03% -0.37% - - - Medium
* Share Class inactive as at end of the year.
45
JPMorgan Investment Funds
Appendix - Unaudited Additional Disclosures (continued)
3. Performance and Volatility (continued)

Basis for Bank Interest Rates
The rates are based on the JPMorgan Chase Treasury rates and consequently may change on a daily basis. The bank interest amount is posted to each of theSICAV’s bank accounts on a monthly basis on the first business day of the subsequent month based on the bank balances from the prior month.
5. Sub-Fund Share Classes Subject to Taxe d’Abonnement Rate of 0.01%The following Sub-Fund Share Classes are subject to an asset based tax of 0.01% per annum:
Share Class Name Share Class Name
JPM Europe Select Equity I (acc) - EUR JPM Global High Yield Bond I (acc) - EUR (hedged)
JPM Europe Select Equity I (acc) - USD (hedged) JPM Global High Yield Bond I (acc) - USD
JPM Europe Select Equity I (dist) - EUR JPM Global High Yield Bond I (dist) - EUR (hedged)
JPM Europe Select Equity I2 (acc) - EUR JPM Global High Yield Bond I (mth) - USD
JPM Europe Select Equity I2 (acc) - USD JPM Global High Yield Bond I2 (acc) - EUR (hedged)
JPM Europe Select Equity I2 (acc) - USD (hedged) JPM Global High Yield Bond I2 (acc) - USD
JPM Europe Select Equity I2 (dist) - EUR JPM Global High Yield Bond I2 (dist) - EUR (hedged)
JPM Europe Select Equity X (acc) - EUR JPM Global High Yield Bond I2 (dist) - GBP (hedged)
JPM Europe Select Equity X (acc) - USD (hedged) JPM Global High Yield Bond I2 (dist) - USD
JPM Europe Select Equity X (dist) - EUR JPM Global High Yield Bond I2 (mth) - USD
JPM Global Dividend I (acc) - EUR JPM Global High Yield Bond X (acc) - EUR (hedged)
JPM Global Dividend X (acc) - USD JPM Global High Yield Bond X (acc) - USD
JPM Global Dividend X (dist) - AUD JPM Global High Yield Bond X (mth) - USD
6. Portfolio Turnover RatioThe Portfolio Turnover Ratio is an indicator of the relevance of the additional costs incurred by a fund when buying and selling investments according to itsinvestment policy. The Portfolio Turnover Ratio is calculated in accordance with the CSSF Circular 03/122 as outlined below:
(Total securities’ purchases and sales - total subscriptions and redemptions of Sub-Fund shares)
Average net Sub-Fund assets in Sub-Fund currency
The Portfolio Turnover Ratio is expressed as a percentage and in the case the outcome of the calculation is negative, a zero value has been published.
Sub-Fund Portfolio Turnover Ratio (%)
JPMorgan Investment Funds - Europe Select Equity Fund 13.91
JPMorgan Investment Funds - Global Dividend Fund 74.12
JPMorgan Investment Funds - Global High Yield Bond Fund -
7. Calculation Method of the Risk Exposure
Global exposure using the VaR approach
Sub-Fund NameMarketRisk Limit
Minimum Maximum Average
Usage of Reg Limit Over Last 12Months to 31/12/18 Fund Benchmark Model
ConfidenceInterval
HoldingPeriod
EffectiveObservation
Period
Leverage-Average
Over Last 12Months to
31/12/18
JPMorgan Investment Funds -Global High Yield Bond Fund
Relative 200% 49% 60% 53% ICE BofAML US High Yield Master IIConstrained Index (Total Return Gross)
Historical 99% 20 days 250 days 1%
Global exposure using the commitment approach
Sub-Fund Name Fund BenchmarkJPMorgan Investment Funds - Europe Select Equity Fund MSCI Europe Index (Total Return Net)
JPMorgan Investment Funds - Global Dividend Fund MSCI All Country World Index (Total Return Net)
46
JPMorgan Investment Funds
Appendix - Unaudited Additional Disclosures (continued)
4. Interest Rate Received/(Charged) on Bank Accounts

The SICAV engages in Securities Financing Transactions (as defined in Article 3 of Regulation (EU) 2015/2365, Securities Financing Transactions includerepurchase transactions, securities or commodities lending and securities or commodities borrowing, buy-sell back transactions or sell-buy backtransactions and margin lending transactions) through its exposure on securities lending transactions during the year. In accordance with Article 13 of theRegulation, the information on securities lending transactions are detailed below.
Collaterals received or granted with respect to Securities Financing Transactions are disclosed on a trade date basis of accounting.
Global Data
Amount of securities on loan
The total value of securities on loan as a proportion of the Sub-Funds’ total lendable assets as at the reporting date is detailed below. Total lendable assetsrepresents the aggregate value of asset types forming part of the Sub-Funds’ securities lending programme.Sub-Fund % of Total Lendable Assets
JPMorgan Investment Funds - Europe Select Equity Fund 1.00
JPMorgan Investment Funds - Global Dividend Fund 2.04
JPMorgan Investment Funds - Global High Yield Bond Fund 8.65
Amount of assets engaged in securities lending transactions
The following table represents the total value of assets engaged in securities lending as at the reporting date.
Sub-Fund Sub-Fund CurrencyMarket Value of Securities
on Loan (in Sub-Fund Currency) % of AUM
JPMorgan Investment Funds - Europe Select Equity Fund EUR 8,440,840 0.98
JPMorgan Investment Funds - Global Dividend Fund USD 3,404,084 1.95
JPMorgan Investment Funds - Global High Yield Bond Fund USD 454,628,590 8.59
Concentration Data
Ten largest collateral issuers
The following table lists the ten largest issuers by value of non-cash collaterals received by the Sub-Funds across securities lending as at the reporting date:JPMorgan Investment Funds - Europe Select Equity Fund JPMorgan Investment Funds - Global Dividend Fund
IssuerNon-Cash Collateral Value
EUR IssuerNon-Cash Collateral Value
USDJapan Government 8,889,309 Japan Government 1,389,565
UK Treasury 368,384
US Treasury 39,677
France Government 36,356
Belgium Government 8,233
Austria Government 6,498
Netherlands Government 2,176
Germany Government 1,980
Finland Government 668
JPMorgan Investment Funds - Global High Yield Bond FundNon-Cash Collateral Value
USDUS Treasury 130,017,738
UK Treasury 160,914
Belgium Government 51,215
France Government 43,506
Austria Government 39,948
Netherlands Government 20,393
Germany Government 18,560
In cases where less than 10 issuers are disclosed, a total of less than 10 issuers is available for that Sub-Fund.
Top ten counterparties
As disclosed in Note 9, JPMorgan Chase Bank, N.A. is the only counterparty in respect of securities lending transactions as at the reporting date.
Aggregate Transaction Data
Type and quality of non-cash collateral
Collaterals received by the Sub-Funds in respect of securities lending as at the reporting date are in the form of debt securities having investment gradecredit rating.
Sub-Fund Sub-Fund CurrencyNon-cash Collateral
(in Sub-Fund Currency)% of Non-Cash Collateral
deemed Investment Grade
JPMorgan Investment Funds - Europe Select Equity Fund EUR 8,889,309 100.00
JPMorgan Investment Funds - Global Dividend Fund USD 1,853,537 100.00
JPMorgan Investment Funds - Global High Yield Bond Fund USD 130,352,274 100.00
47
JPMorgan Investment Funds
Appendix - Unaudited Additional Disclosures (continued)
8. Securities Financing Transactions

Maturity tenor of collateral
The following table provides an analysis of the maturity tenor of collaterals received in relation securities lending transactions as at the reporting date.JPMorgan Investment Funds -
Europe Select Equity FundJPMorgan Investment Funds -
Global Dividend FundJPMorgan Investment Funds -
Global High Yield Bond Fund
Maturity EUR USD USD
Cash
less than 1 day - 1,703,796 334,750,826
Non-Cash
1 to 7 days - - -
1 to 4 weeks - - 68,155
1 to 3 months - - -
3 to 12 months - 15,514 14,146,059
more than 1 year 8,889,309 1,838,023 116,138,060
8,889,309 3,557,333 465,103,100
Currency of collateral
The following table provides currency of cash and non-cash collaterals received in relation to securities lending transactions as at the reporting date.Collateral Value (in Sub-Fund Currency)
Sub-Fund Sub-Fund Currency EUR GBP USD JPY CAD TotalJPMorgan Investment Funds - Europe Select Equity Fund EUR - - - 8,889,309 - 8,889,309
JPMorgan Investment Funds - Global Dividend Fund USD 184,470 212,789 1,770,509 1,389,565 - 3,557,333
JPMorgan Investment Funds - Global High Yield Bond Fund USD 173,623 160,914 464,768,563 - - 465,103,100
Maturity tenor of securities lending agreements
The SICAV’s securities lending transactions have open maturity.
Country in which counterparties are established
JPMorgan Chase Bank, N.A. was incorporated in United States of America.
Settlement and clearing
All Sub-Funds engaged in securities lending agreements utilise bi-lateral settlement and clearing with their respective counterparty.
Reuse of collateral
Share of collateral received that is reused and reinvestment return
Non-cash collateral received by way of title transfer collateral arrangement in relation to securities lending transactions, reverse repurchase agreementsand OTC derivative transactions, cannot be sold, reinvested or pledged.
Securities lending transactions
As at the year end, all of the cash collateral received in respect of securities lending was re-invested into Reverse Repurchase Transactions with high qualitygovernment bonds as collateral. This is managed by the Securities Lending Agent based solely on the approved guidelines and agreement issued byJPMorgan Asset Management (Europe) S.à r.l..
Income earned by the SICAV from the reinvestment of cash collateral in the form of Reverse Repurchase Transactions, net of any interest payable to therelevant counterparty, amounted to USD 208,570 for the year ended 31 December 2018 and is recorded under the “Securities Lending Income” in theCombined Statement of Operations and Changes in Net Assets.
Details relating to the permitted reuse of cash collateral are disclosed in the latest Prospectus available from http://www.jpmorganassetmanagement.lu.
Safekeeping of Collateral
Collateral received
The following tables provide an analysis of collateral received held at each custodian as at the reporting date:
Securities lending transactions
Sub-Fund Custodian Sub-Fund CurrencyCollateral Value
(in Sub-Fund Currency)
JPMorgan Investment Funds - Europe Select Equity Fund JPMorgan Bank Luxembourg S.A. EUR 8,889,309
JPMorgan Investment Funds - Global Dividend Fund JPMorgan Bank Luxembourg S.A. USD 3,557,333
JPMorgan Investment Funds - Global High Yield Bond Fund JPMorgan Bank Luxembourg S.A. USD 465,103,100
Collateral granted
As at the reporting date, there was no collateral granted with respect to securities lending transactions.
Return and cost
The total income earned from securities lending transactions is split between the relevant Sub-Funds and the securities lending agent. Detail of this split isdisclosed in Note 9 to the financial statements.
48
JPMorgan Investment Funds
Appendix - Unaudited Additional Disclosures (continued)
8. Securities Financing Transactions (continued)

JPMorgan Asset Management (Europe) S.à r.l. (the “Management Company”) is the authorised manager of JPMorgan Investment Funds (the “Company”)and is part of the J.P. Morgan Chase & Co. group of companies. In this section, the terms “J.P. Morgan” or “Firm” refer to that group, and each of the entities inthat group globally, unless otherwise specified.
This section of the annual report has been prepared in accordance with the Undertakings for Collective Investment in Transferable Securities (the “UCITSDirective”) and the ‘Guidelines on sound remuneration policies’ issued by the European Securities and Markets Authority under the UCITS Directive. Theinformation in this section is in respect of the most recent complete remuneration period (“Performance Year”) as at the reporting date.
Remuneration Policy
A summary of the Remuneration Policy applying to the Management Company (the “Remuneration Policy Statement”) can be found athttp://www.jpmorganassetmanagement.lu/legal/emea-remuneration-policy. This Remuneration Policy Statement includes details of how remunerationand benefits are calculated, including the financial and non-financial criteria used to evaluate performance, the responsibilities and composition of theFirm’s Compensation and Management Development Committee, and the measures adopted to avoid or manage conflicts of interest. A copy of this policycan be requested free of charge from the Management Company.
The Remuneration Policy applies to all employees of the Management Company, including individuals whose professional activities may have a materialimpact on the risk profile of the Management Company or the UCITS Funds it manages (“UCITS Identified Staff”). The UCITS Identified Staff include membersof the Board of the Management Company (the “Board”), senior management, the heads of relevant Control Functions, and holders of other key functions.Individuals are notified of their identification and the implications of this status on at least an annual basis.
The Board reviews and adopts the Remuneration Policy on an annual basis, and oversees its implementation, including the classification of UCITS IdentifiedStaff. The Board last reviewed and adopted the Remuneration Policy that applied to the 2018 Performance Year in June 2018 with no material changes andwas satisfied with its implementation.
Quantitative Disclosures
The table below provides an overview of the aggregate total remuneration paid to staff of the Management Company in respect of the 2018 PerformanceYear and the number of beneficiaries.
Due to the Firm’s operational structure, the information needed to provide a further breakdown of remuneration attributable to the Company is not readilyavailable and would not be relevant or reliable. However, for context, the Management Company manages 3 Alternative Investment Funds (with8 Sub-Funds) and 7 UCITS (with 161 Sub-Funds) as at 31 December 2018, with a combined AUM as at that date of USD 2,121m and USD 316,230m respectively.
Fixed remuneration Variable remuneration Total remuneration Number of beneficiaries
All staff (USD ‘000s) 45,003 22,256 67,259 331
The aggregate total remuneration paid to UCITS Identified Staff in respect of the 2018 Performance Year was USD 130,876k, of which USD 9,240k relates toSenior Management and USD 121,636k relates to other UCITS Identified Staff(1).
(1) Since 2017, the UCITS Identified Staff disclosures includes employees of companies to which portfolio management has been formally delegated, in line with the latest ESMA guidance.
49
JPMorgan Investment Funds
Appendix - Unaudited Additional Disclosures (continued)
9. UCITS Remuneration Disclosures

JPMorgan Investment Funds
Appendix - Unaudited Additional Disclosures (continued)
10. Historical Statement of Changes in the Number of Shares (continued)
Shares Outstandingat the Beginning
of the Year
Shares Subscribed Shares Redeemed Shares Outstandingat the End
of the Year
For the year ended 31 December 2017 (continued)
JPMorgan Investment Funds - Europe Select Equity FundJPM Europe Select Equity A (acc) - EUR 192,251.949 244,817.268 166,521.733 270,547.484JPM Europe Select Equity A (acc) - USD 61,958.369 585.557 29,370.900 33,173.026JPM Europe Select Equity A (dist) - EUR 95,721.240 31,811.888 18,691.751 108,841.377JPM Europe Select Equity C (acc) - EUR 1,432,856.715 1,262,294.896 1,143,669.490 1,551,482.121JPM Europe Select Equity C (acc) - USD 11,017.525 189,486.834 70,269.175 130,235.184JPM Europe Select Equity C (dist) - EUR 10.000 16,473.395 10.000 16,473.395JPM Europe Select Equity C (dist) - GBP 12,391.524 - 1,391.740 10,999.784JPM Europe Select Equity D (acc) - EUR 81,481.688 48,850.153 35,596.951 94,734.890JPM Europe Select Equity D (acc) - USD 18.751 5.495 14.441 9.805JPM Europe Select Equity I (acc) - EUR 2,174,357.832 1,493,182.685 893,555.270 2,773,985.247JPM Europe Select Equity I (acc) - USD 20,466.800 3,786.753 6,504.672 17,748.881JPM Europe Select Equity I (acc) - USD (hedged) 85,791.019 101,518.911 57,487.871 129,822.059JPM Europe Select Equity I (dist) - EUR 472,407.769 176,994.394 190,853.385 458,548.778JPM Europe Select Equity I2 (acc) - EUR - 10.000 - 10.000JPM Europe Select Equity I2 (acc) - USD - 10.000 - 10.000JPM Europe Select Equity I2 (acc) - USD (hedged) - 10.000 - 10.000JPM Europe Select Equity I2 (dist) - EUR - 10.000 - 10.000JPM Europe Select Equity X (acc) - EUR 646,800.098 397,417.665 234,627.512 809,590.251JPM Europe Select Equity X (acc) - USD (hedged) 493,000.573 367,244.000 250,144.000 610,100.573JPM Europe Select Equity X (dist) - EUR 44,378.600 8,499.586 16,197.342 36,680.844
JPMorgan Investment Funds - Global Dividend FundJPM Global Dividend A (acc) - EUR 39,440.783 16,836.873 26,430.284 29,847.372JPM Global Dividend A (acc) - EUR (hedged) 18,579.339 26,852.384 7,337.782 38,093.941JPM Global Dividend A (acc) - USD 112,360.679 8,498.862 30,280.811 90,578.730JPM Global Dividend A (dist) - EUR (hedged)^ 48.673 1,563.000 8.673 1,603.000JPM Global Dividend A (dist) - USD^ 76,928.070 12,332.366 13,273.272 75,987.164JPM Global Dividend A (div) - EUR 39,026.462 15,415.637 12,267.579 42,174.520JPM Global Dividend A (div) - EUR (hedged) 11,431.508 6,414.917 2,283.415 15,563.010JPM Global Dividend A (div) - USD 14,650.716 941.909 2,822.566 12,770.059JPM Global Dividend A (mth) - USD (hedged) 4,081.633 6,352.603 6,379.927 4,054.309JPM Global Dividend C (acc) - EUR 12,589.780 44,812.925 31,518.494 25,884.211JPM Global Dividend C (acc) - USD 1,353.074 54,265.654 46,978.433 8,640.295JPM Global Dividend C (dist) - EUR 841.073 525.000 481.073 885.000JPM Global Dividend C (dist) - EUR (hedged)^ 1,801.488 1,127.000 1,219.488 1,709.000JPM Global Dividend C (div) - EUR* 8,580.000 - 8,580.000 -JPM Global Dividend D (acc) - EUR (hedged) 167,248.962 83,132.034 60,408.794 189,972.202JPM Global Dividend D (acc) - USD 66,265.676 34,850.269 25,250.820 75,865.125JPM Global Dividend D (div) - EUR (hedged) 307,308.400 209,604.539 111,058.078 405,854.861JPM Global Dividend D (mth) - EUR (hedged) - 7,891.643 615.367 7,276.276JPM Global Dividend F (mth) - USD (hedged) - 20.000 - 20.000JPM Global Dividend I (acc) - EUR** - 56,720.643 - 56,720.643JPM Global Dividend I (dist) - EUR (hedged)*^ 9.948 - 9.948 -JPM Global Dividend T (acc) - EUR (hedged) 24,123.280 57,603.718 11,030.270 70,696.728JPM Global Dividend X (acc) - EUR (hedged) 1,328.492 - 822.950 505.542JPM Global Dividend X (acc) - USD 1,534.856 1,370.764 9.912 2,895.708JPM Global Dividend X (dist) - AUD 52,014.140 2,210.500 1,231.791 52,992.849
* Share Class inactive as at end of the year.** Share Class reactivated during the year.^ Share Class renamed from “(inc)” to “(dist)” Share Class with the same Sub-Fund.
50

JPMorgan Investment Funds
Appendix - Unaudited Additional Disclosures (continued)
10. Historical Statement of Changes in the Number of Shares (continued)
Shares Outstandingat the Beginning
of the Year
Shares Subscribed Shares Redeemed Shares Outstandingat the End
of the Year
For the year ended 31 December 2017 (continued)
JPMorgan Investment Funds - Global High Yield Bond FundJPM Global High Yield Bond A (acc) - AUD (hedged) 750,050.990 2,356,958.944 1,960,685.115 1,146,324.819JPM Global High Yield Bond A (acc) - CHF (hedged) 17,426.000 2,557.000 10,245.000 9,738.000JPM Global High Yield Bond A (acc) - CZK (hedged) - 5,078.080 - 5,078.080JPM Global High Yield Bond A (acc) - EUR (hedged) 349,887.320 660,767.297 184,995.203 825,659.414JPM Global High Yield Bond A (acc) - HUF (hedged) 22,752.082 12,101.383 5,872.764 28,980.701JPM Global High Yield Bond A (acc) - USD 3,042,864.958 2,405,843.402 3,410,652.580 2,038,055.780JPM Global High Yield Bond A (dist) - EUR (hedged)^ 338,942.442 175,652.082 100,314.471 414,280.053JPM Global High Yield Bond A (dist) - USD 38,602.044 4,999.821 18,832.117 24,769.748JPM Global High Yield Bond A (irc) - AUD (hedged) 60,464,522.025 17,426,421.222 25,803,232.769 52,087,710.478JPM Global High Yield Bond A (irc) - CAD (hedged) 1,286,294.017 149,714.660 491,351.864 944,656.813JPM Global High Yield Bond A (irc) - NZD (hedged) 153,450.480 143,537.262 87,600.018 209,387.724JPM Global High Yield Bond A (irc) - RMB (hedged) 216,850.840 50,482.497 - 267,333.337JPM Global High Yield Bond A (mth) - HKD 69,952,794.905 77,579,020.813 69,913,838.088 77,617,977.630JPM Global High Yield Bond A (mth) - SGD 403,712.572 211,101.986 99,862.579 514,951.979JPM Global High Yield Bond A (mth) - USD 27,468,959.753 8,952,929.212 11,241,051.873 25,180,837.092JPM Global High Yield Bond C (acc) - EUR (hedged) 1,041,180.562 389,144.447 746,965.334 683,359.675JPM Global High Yield Bond C (acc) - PLN (hedged) 28,889.877 69,196.595 16,107.176 81,979.296JPM Global High Yield Bond C (acc) - USD 2,529,578.231 2,171,224.256 1,533,950.329 3,166,852.158JPM Global High Yield Bond C (dist) - EUR (hedged) 13,658.882 86,639.655 11,443.564 88,854.973JPM Global High Yield Bond C (dist) - GBP (hedged) 515,540.235 89,685.621 175,491.854 429,734.002JPM Global High Yield Bond C (dist) - USD 141,771.498 181,443.782 76,963.740 246,251.540JPM Global High Yield Bond C (div) - EUR (hedged) 42,562.322 35,446.801 6,475.046 71,534.077JPM Global High Yield Bond C (inc) - EUR (hedged)*** 42,063.702 8,800.000 50,863.702 -JPM Global High Yield Bond C (irc) - CAD (hedged) 147,674.923 155,180.669 - 302,855.592JPM Global High Yield Bond C (irc) - RMB (hedged)* 639.280 - 639.280 -JPM Global High Yield Bond C (mth) - HKD 774.606 5,129,782.449 774.606 5,129,782.449JPM Global High Yield Bond C (mth) - USD 1,014,025.253 826,375.715 286,315.569 1,554,085.399JPM Global High Yield Bond D (acc) - EUR (hedged) 232,309.408 132,159.547 73,397.507 291,071.448JPM Global High Yield Bond D (acc) - PLN (hedged) 24,977.373 367,850.426 364,798.331 28,029.468JPM Global High Yield Bond D (acc) - USD 86,996.754 226,780.422 276,127.268 37,649.908JPM Global High Yield Bond D (div) - EUR (hedged) 2,740,356.023 2,844,456.091 558,258.599 5,026,553.515JPM Global High Yield Bond D (mth) - EUR (hedged) - 59,224.663 2,705.963 56,518.700JPM Global High Yield Bond F (irc) - AUD (hedged) - 260.485 - 260.485JPM Global High Yield Bond F (mth) - USD - 20.000 - 20.000JPM Global High Yield Bond I (acc) - EUR (hedged) 3,203,010.326 2,386,690.085 2,108,050.191 3,481,650.220JPM Global High Yield Bond I (acc) - USD 2,695,924.313 3,117,119.147 2,854,715.554 2,958,327.906JPM Global High Yield Bond I (dist) - EUR (hedged) 77,638.548 999,083.264 165,040.538 911,681.274JPM Global High Yield Bond I (dist) - GBP (hedged) 204,120.662 165,475.357 132,205.552 237,390.467JPM Global High Yield Bond I (dist) - USD 702,812.985 211,966.539 509,788.147 404,991.377JPM Global High Yield Bond I (inc) - EUR (hedged)*** 943,604.837 196,297.482 1,139,902.319 -JPM Global High Yield Bond I (mth) - USD 1,856,512.894 20,052.187 375,349.134 1,501,215.947JPM Global High Yield Bond I2 (acc) - EUR (hedged) - 10.000 - 10.000JPM Global High Yield Bond I2 (acc) - USD - 10.000 - 10.000JPM Global High Yield Bond I2 (dist) - EUR (hedged) - 10.000 - 10.000JPM Global High Yield Bond I2 (dist) - GBP (hedged) - 10.000 - 10.000JPM Global High Yield Bond I2 (dist) - USD - 10.000 - 10.000JPM Global High Yield Bond I2 (mth) - USD - 10.000 - 10.000JPM Global High Yield Bond P (acc) - USD - 5,830.416 - 5,830.416JPM Global High Yield Bond P (dist) - EUR (hedged) - 212,566.284 - 212,566.284JPM Global High Yield Bond P (dist) - USD 12,660.731 8,547.739 9,101.843 12,106.627JPM Global High Yield Bond T (acc) - EUR (hedged) 53,341.000 103,847.772 22,863.952 134,324.820JPM Global High Yield Bond V (acc) - USD (hedged to BRL)* 35,905.262 - 35,905.262 -JPM Global High Yield Bond X (acc) - EUR (hedged) 1,731,597.610 717,945.329 665,123.876 1,784,419.063JPM Global High Yield Bond X (acc) - USD 2,785,059.305 1,267,470.854 1,681,112.263 2,371,417.896JPM Global High Yield Bond X (dist) - USD* 10.000 - 10.000 -
* Share Class inactive as at end of the year.*** Share Class closed as at the end of the year. With respect to Share Classes “(inc)” these were merged into the equivalent “(dist)” Share Classes within the same Sub-Fund.^ Share Class renamed from “(inc)” to “(dist)” Share Class with the same Sub-Fund.
51

JPMorgan Investment Funds
Appendix - Unaudited Additional Disclosures (continued)
10. Historical Statement of Changes in the Number of Shares (continued)
Shares Outstandingat the Beginning
of the Year
Shares Subscribed Shares Redeemed Shares Outstandingat the End
of the Year
For the year ended 31 December 2016 (continued)
JPMorgan Investment Funds - Europe Select Equity FundJPM Europe Select Equity A (acc) - EUR 208,185.980 84,812.893 100,746.924 192,251.949JPM Europe Select Equity A (acc) - USD 102,098.604 11,102.666 51,242.901 61,958.369JPM Europe Select Equity A (dist) - EUR 104,107.150 20,697.024 29,082.934 95,721.240JPM Europe Select Equity C (acc) - EUR 1,905,344.541 557,568.000 1,030,055.826 1,432,856.715JPM Europe Select Equity C (acc) - USD 240.955 11,017.525 240.955 11,017.525JPM Europe Select Equity C (dist) - EUR 10.000 - - 10.000JPM Europe Select Equity C (dist) - GBP 33,742.626 - 21,351.102 12,391.524JPM Europe Select Equity D (acc) - EUR 109,247.619 18,139.633 45,905.564 81,481.688JPM Europe Select Equity D (acc) - USD 518.297 8.946 508.492 18.751JPM Europe Select Equity I (acc) - EUR 2,839,262.821 763,508.656 1,428,413.645 2,174,357.832JPM Europe Select Equity I (acc) - USD 58,132.599 - 37,665.799 20,466.800JPM Europe Select Equity I (acc) - USD (hedged) 781,615.142 149,160.716 844,984.839 85,791.019JPM Europe Select Equity I (dist) - EUR 810,584.631 126,410.356 464,587.218 472,407.769JPM Europe Select Equity P (dist) - EUR* 2,870.034 - 2,870.034 -JPM Europe Select Equity X (acc) - EUR 1,347,303.660 214,193.080 914,696.642 646,800.098JPM Europe Select Equity X (acc) - USD (hedged) 555,170.441 217,037.000 279,206.868 493,000.573JPM Europe Select Equity X (dist) - EUR 193,492.451 11,855.585 160,969.436 44,378.600
JPMorgan Investment Funds - Global Dividend FundJPM Global Dividend A (acc) - EUR 45,976.162 17,205.407 23,740.786 39,440.783JPM Global Dividend A (acc) - EUR (hedged) 25,051.275 3,715.438 10,187.374 18,579.339JPM Global Dividend A (acc) - USD 154,753.655 91,206.052 133,599.028 112,360.679JPM Global Dividend A (div) - EUR 46,278.466 16,840.733 24,092.737 39,026.462JPM Global Dividend A (div) - EUR (hedged) 10,458.220 4,132.057 3,158.769 11,431.508JPM Global Dividend A (div) - USD 15,034.217 3,130.865 3,514.366 14,650.716JPM Global Dividend A (inc) - EUR (hedged) 48.673 - - 48.673JPM Global Dividend A (inc) - USD 90,342.662 13,396.882 26,811.474 76,928.070JPM Global Dividend A (mth) - USD (hedged) 3,581.717 7,702.258 7,202.342 4,081.633JPM Global Dividend C (acc) - EUR 108,448.425 7,499.173 103,357.818 12,589.780JPM Global Dividend C (acc) - USD** - 1,372.619 19.545 1,353.074JPM Global Dividend C (acc) - USD (hedged)* 10.000 - 10.000 -JPM Global Dividend C (dist) - EUR 841.073 - - 841.073JPM Global Dividend C (div) - EUR 8,593.484 - 13.484 8,580.000JPM Global Dividend C (inc) - EUR (hedged) 2,023.488 306.000 528.000 1,801.488JPM Global Dividend D (acc) - EUR (hedged) 181,394.584 61,264.175 75,409.797 167,248.962JPM Global Dividend D (acc) - USD 64,669.570 33,925.146 32,329.040 66,265.676JPM Global Dividend D (div) - EUR (hedged) 236,374.707 139,836.223 68,902.530 307,308.400JPM Global Dividend I (inc) - EUR (hedged) 9.948 - - 9.948JPM Global Dividend T (acc) - EUR (hedged) 14,283.914 23,550.911 13,711.545 24,123.280JPM Global Dividend X (acc) - EUR (hedged) 1,642.995 - 314.503 1,328.492JPM Global Dividend X (acc) - USD** - 1,534.857 0.001 1,534.856JPM Global Dividend X (dist) - AUD 50,967.444 1,645.022 598.326 52,014.140
* Share Class inactive as at the end of the year.** Share Class reactivated during the year.
52

JPMorgan Investment Funds
Appendix - Unaudited Additional Disclosures (continued)
10. Historical Statement of Changes in the Number of Shares (continued)
Shares Outstandingat the Beginning
of the Year
Shares Subscribed Shares Redeemed Shares Outstandingat the End
of the Year
For the year ended 31 December 2016 (continued)
JPMorgan Investment Funds - Global High Yield Bond FundJPM Global High Yield Bond A (acc) - AUD (hedged) 308,936.163 2,190,388.410 1,749,273.583 750,050.990JPM Global High Yield Bond A (acc) - CHF (hedged) 10,157.011 9,070.000 1,801.011 17,426.000JPM Global High Yield Bond A (acc) - EUR (hedged) 382,119.431 193,007.201 225,239.312 349,887.320JPM Global High Yield Bond A (acc) - HUF (hedged) 20,181.270 9,615.990 7,045.178 22,752.082JPM Global High Yield Bond A (acc) - USD 2,683,258.651 2,991,241.724 2,631,635.417 3,042,864.958JPM Global High Yield Bond A (dist) - USD 121,340.231 13,165.433 95,903.620 38,602.044JPM Global High Yield Bond A (inc) - EUR (hedged) 339,309.208 126,275.486 126,642.252 338,942.442JPM Global High Yield Bond A (irc) - AUD (hedged) 59,991,405.791 32,485,340.664 32,012,224.430 60,464,522.025JPM Global High Yield Bond A (irc) - CAD (hedged) 1,109,107.631 356,585.608 179,399.222 1,286,294.017JPM Global High Yield Bond A (irc) - NZD (hedged) 120,179.608 57,033.479 23,762.607 153,450.480JPM Global High Yield Bond A (irc) - RMB (hedged) 362,445.537 921,779.835 1,067,374.532 216,850.840JPM Global High Yield Bond A (mth) - HKD 56,411,508.878 50,961,637.435 37,420,351.408 69,952,794.905JPM Global High Yield Bond A (mth) - SGD 445,262.027 73,207.890 114,757.345 403,712.572JPM Global High Yield Bond A (mth) - USD 28,060,119.056 12,894,674.706 13,485,834.009 27,468,959.753JPM Global High Yield Bond C (acc) - EUR (hedged) 517,242.980 1,295,804.308 771,866.726 1,041,180.562JPM Global High Yield Bond C (acc) - PLN (hedged) 45,590.268 9,571.762 26,272.153 28,889.877JPM Global High Yield Bond C (acc) - USD 2,926,609.223 2,643,672.400 3,040,703.392 2,529,578.231JPM Global High Yield Bond C (dist) - EUR (hedged) 10,552.116 7,208.766 4,102.000 13,658.882JPM Global High Yield Bond C (dist) - GBP (hedged) 482,904.282 251,780.687 219,144.734 515,540.235JPM Global High Yield Bond C (dist) - USD 477,377.771 162,203.720 497,809.993 141,771.498JPM Global High Yield Bond C (div) - EUR (hedged) 26,185.606 16,376.716 - 42,562.322JPM Global High Yield Bond C (inc) - EUR (hedged) 79,913.702 366,092.000 403,942.000 42,063.702JPM Global High Yield Bond C (irc) - CAD (hedged) 129.132 147,674.923 129.132 147,674.923JPM Global High Yield Bond C (irc) - RMB (hedged) 639.280 - - 639.280JPM Global High Yield Bond C (mth) - HKD 774.606 - - 774.606JPM Global High Yield Bond C (mth) - USD 841,662.732 545,585.392 373,222.871 1,014,025.253JPM Global High Yield Bond D (acc) - EUR (hedged) 151,771.593 150,912.162 70,374.347 232,309.408JPM Global High Yield Bond D (acc) - PLN (hedged) 13,005.267 132,126.813 120,154.707 24,977.373JPM Global High Yield Bond D (acc) - USD 55,397.364 379,540.859 347,941.469 86,996.754JPM Global High Yield Bond D (div) - EUR (hedged) 675,246.593 2,365,848.843 300,739.413 2,740,356.023JPM Global High Yield Bond I (acc) - EUR (hedged) 1,054,630.516 2,534,765.208 386,385.398 3,203,010.326JPM Global High Yield Bond I (acc) - USD 3,348,867.807 2,018,197.037 2,671,140.531 2,695,924.313JPM Global High Yield Bond I (dist) - EUR (hedged) 35,580.956 70,310.544 28,252.952 77,638.548JPM Global High Yield Bond I (dist) - GBP (hedged) 19,366.277 201,985.079 17,230.694 204,120.662JPM Global High Yield Bond I (dist) - USD 263,712.332 701,979.200 262,878.547 702,812.985JPM Global High Yield Bond I (inc) - EUR (hedged) 1,066,284.234 242,022.140 364,701.537 943,604.837JPM Global High Yield Bond I (mth) - USD 2,424,497.005 - 567,984.111 1,856,512.894JPM Global High Yield Bond P (dist) - USD** - 12,660.731 - 12,660.731JPM Global High Yield Bond T (acc) - EUR (hedged) 11,793.367 47,531.121 5,983.488 53,341.000JPM Global High Yield Bond V (acc) - USD (hedged to BRL) - 55,269.024 19,363.762 35,905.262JPM Global High Yield Bond X (acc) - EUR (hedged) 1,965,993.601 689,676.342 924,072.333 1,731,597.610JPM Global High Yield Bond X (acc) - USD 1,721,054.022 2,298,276.506 1,234,271.223 2,785,059.305JPM Global High Yield Bond X (dist) - USD 10.000 - - 10.000
** Share Class reactivated during the year.
53

Language Disclaimer Annual
This page has been left blank intentionally


FR/DP/0419
www.jpmorganam.com.hk
(HK version)