UK-US Roadshow Presentation - Coca-Cola HBC · Roadshow 1 Presentation ... This document and any...
39
UK- US Roadshow 1 Roadshow Presentation February 2013
Transcript of UK-US Roadshow Presentation - Coca-Cola HBC · Roadshow 1 Presentation ... This document and any...

UK- US Roadshow
1
RoadshowPresentation
February 2013

DisclaimerDisclaimerDisclaimerDisclaimer
Disclaimer
This document is an advertisement and not a prospectus and in vestors should not subscribe for or purchase any transferab lesecurities referred to in this document except on the basis o f information contained in a prospectus or offering circula r prepared forthat purpose and published in connection with the admission of any ordinary shares of Coca Cola HBC AG to the premium segme nt ofthe Official List of the United Kingdom Listing Authority an d to trading on the London Stock Exchange plc’s main market fo r listedsecurities. Copies of any such prospectus or offering circu lar are expected, following publication, to be available fr om Coca Cola HBCAG’s website at http://www.coca-colahbcag.com .
This document has not been issued for circulation to the general public. The distribution of this document in certain jurisdictions may be restrictedby law and therefore persons into whose possession this document comes should inform themselves about and observe any such restrictions.
This document and any accompanying oral presentation (together, the "Presentation") does not constitute or form part of, and should not beconstrued as, an offer or invitation to subscribe for, purchase, sell or exchange any securities of Coca-Cola Hellenic Bottling Company S.A.
2
construed as, an offer or invitation to subscribe for, purchase, sell or exchange any securities of Coca-Cola Hellenic Bottling Company S.A.(“Coca-Cola Hellenic”) or Coca-Cola HBC AG (including without limitation an offering prospectus within the meaning of Article 652a of the SwissCode of Obligations) and shall not form the basis of, or be relied on in connection with, any offer or commitment whatsoever. Any potential offerof securities would be based on a prospectus or offering circular prepared for that purpose.
This Presentation is being made solely to and directed solely at a limited number of invited institutions who: (A) if in the United States arequalified institutional buyers (as defined in Rule 144A under the U.S. Securities Act of 1933 (the “Securities Act”)); (B) if in the EuropeanEconomic Area, are persons who are “qualified investors” within the meaning of Article 2(1)(e) of the Prospectus Directive (Directive 2003/71/EC,as amended) (“Qualified Investors”); and (C) if in the United Kingdom are persons (i) having professional experience in matters relating toinvestments so as to qualify them as “investment professionals” under Article 19(5) of the Financial Services and Markets Act 2000 (FinancialPromotion) Order 2005 (the “Order”); and (ii) falling within Article 49(2)(a) to (d) of the Order; and/or (D) are other persons to whom it mayotherwise lawfully be communicated (all such persons referred to in (A), (B), (C) and (D) together being “Relevant Persons”). If you have receiveda copy of this document and you are not a qualified institutional buyer (as so defined), Qualified Investor or Relevant Person you must return itimmediately to Coca-Cola Hellenic or Coca-Cola HBC AG.Any securities that may be offered or sold may not be registered under the Securities Act or the securities laws of any U.S. state and may beplaced in reliance on exemptions from the registration requirements of the Securities Act and such state laws. Any securities so placed would besubject to restrictions on transferability and resale and would not be permitted to be transferred or resold except as permitted under theSecurities Act and such state laws pursuant to registration or exemption therefrom. No securities of Coca-Cola HBC AG or Coca-Cola Hellenichave been approved or disapproved by the U.S. Securities and Exchange Commission, any U.S. state securities commission or any otherregulatory authority, nor have any of the foregoing authorities passed upon or endorsed the merits of any offering of securities of Coca-Cola HBCAG or Coca-Cola Hellenic or the accuracy or adequacy of the Presentation. Any representation to the contrary may be a criminal offense in theUnited States.

DisclaimerDisclaimerDisclaimerDisclaimer
The Presentation is being provided for informational purposes only and is subject to updating, revision, verification and amendment. The information and opinions contained or discussed in this Presentation do not purport to be full or complete and do not constitute investment advice. No reliance may be placed for any purpose on the information and opinions contained or discussed in this Presentation. No representation, warranty or undertaking, express or implied, is made as to the fairness, accuracy or completeness of the information or opinions contained or discussed in this Presentation, or any accompanying oral presentation, by or on behalf of Coca-Cola Hellenic or Coca-Cola HBC AG (including, without limitation, their directors, officers, employees, partners, agents, representatives, members, affiliates and advisers) and (to the fullest extent permitted under law) no liability or responsibility is accepted by such persons for the accuracy, fairness or completeness of any such information or opinion. The Presentation contains forward-looking statements that involve risks and uncertainties. These statements may generally, but not always, be identified by the use of words such as “believe,” “outlook,” “guidance,” “intend,” “expect,” “anticipate,” “plan,” “target” and similar expressions to identify forward-looking statements. All statements other than statements of historical facts, including, among others, statements regarding completion of the exchange offer and any plans following such completion; Coca Cola Hellenic’s future financial position and results; Coca Cola Hellenic’s outlook for 2013 and future years; business strategy; the effects of the global economic slowdown; the impact of the sovereign debt crisis, currency volatility, Coca Cola Hellenic’s recent acquisitions, and restructuring initiatives on Coca Cola Hellenic’s business and financial condition; Coca Cola Hellenic’s future dealings with The Coca Cola Company; budgets; projected levels of consumption and production; projected raw material and other costs; estimates of capital expenditure and
3
Cola Company; budgets; projected levels of consumption and production; projected raw material and other costs; estimates of capital expenditure and plans and objectives of management for future operations, are forward-looking statements. You should not place undue reliance on such forward-looking statements. By their nature, forward-looking statements involve risk and uncertainty because they reflect current expectations and assumptions as to future events and circumstances that may not prove accurate. Actual results and events could differ materially from those anticipated in the forward-looking statements for many reasons. Unless otherwise specified, all financial information presented herein is based on Coca-Cola Hellenic's IFRS financial statements.
Although Coca Cola HBC AG and Coca-Cola Hellenic believe that, as of the date of this document, the expectations reflected in the forward-looking statements are reasonable, Coca Cola HBC AG and Coca-Cola Hellenic cannot assure you that future events will meet these expectations. Moreover, neither Coca Cola HBC AG nor Coca-Cola Hellenic nor any other person assumes responsibility for the accuracy and completeness of the forward-looking statements. After the date of the Presentation, neither Coca-Cola HBC AG nor Coca Cola Hellenic will necessarily update any of these forward-looking statements to conform them either to actual results or to changes in expectations, unless required by law or the rules of the United Kingdom Financial Services Authority.
No copy of this document will be left behind after this meeting. By attending the presentation to which this document relates or by accepting this document you will be deemed to have represented, warranted and undertaken that: (i) you are a qualified institutional buyer (as so defined), Qualified Investor or Relevant Person (as defined above); and (ii) you have read and agree to be bound by the foregoing limitations.

Hellenic is one of the largest CocaHellenic is one of the largest CocaHellenic is one of the largest CocaHellenic is one of the largest Coca----Cola Cola Cola Cola bottlers globallybottlers globallybottlers globallybottlers globally
Volume 2.1bn ucSales $9.0bn
Volume 1.4bn ucSales $8.3bn
4
Coca-Cola Icecek
Coca-Cola Amatil
Coca-Cola Femsa
Coca-Cola Enterprises
Coca-Cola Hellenic
Volume 2.6bn ucSales $9.1bn
Volume 0.6bn uc2011 Sales $5.0bn
Volume 0.8bn ucSales $1.9bn
FY 2011 results based on publicly available information

The CocaThe CocaThe CocaThe Coca----Cola System: Partners in growthCola System: Partners in growthCola System: Partners in growthCola System: Partners in growth
Bottling productionBrand ownership
5
Bottling production
Sales distribution
Customer management
Channel development
In-outlet execution
Demand Fulfillment
Investment in production facilities, equipment, vehicles
Brand ownership
Concentrate supply
Brand development
Consumer marketing
Creating demand
Leveraging Leveraging the unique the unique strength of strength of the Systemthe System
60 years of successful partnership

Free float54%
Kar-Tess Holding23%
Shareholder structureShareholder structureShareholder structureShareholder structure
6
The Coca-Cola Company23%
Bottlers’ agreements in place for each of the countries in which we operate until December 2013, with commitment by The Coca-Cola Company to renew these
agreements until 2023

A diverse and balanced country portfolio A diverse and balanced country portfolio A diverse and balanced country portfolio A diverse and balanced country portfolio
Population: 78 mio
Population: 401 mio
7
Total = €453 M
Total = €7,045 M
Total = 2,085 M UC
2020202012121212 Market SplitMarket SplitMarket SplitMarket Split
Population: 89 mio
35%
39%
33%
6%
16%
19%
59%
45%
48%
Comparable EBIT
Net sales revenue
Volume unit cases
*
(*) Financial indicators on a comparable basis exclude the recognition of restructuring costs and unrealised commodity hedging results.

Our extensive territorial reach offers a Our extensive territorial reach offers a Our extensive territorial reach offers a Our extensive territorial reach offers a balanced volume profilebalanced volume profilebalanced volume profilebalanced volume profile
2012 volume by country
Russia
18%
Other established
8%
Other developing
7%
Other emerging
6%
8
Italy
15%
Nigeria
9%
Poland
8%Romania
8%
Greece
5%
Ukraine
4%
Serbia & Montenegro
4%
Hungary
4%
Switzerland
4%

We have a diverse geographical footprint We have a diverse geographical footprint We have a diverse geographical footprint We have a diverse geographical footprint offering attractive growth potentialoffering attractive growth potentialoffering attractive growth potentialoffering attractive growth potential
310324
352 352
427
465
612
2011 Total sparkling category servings per capita
9
38
124 128
178193 196
216 225245
287 293310
324Established
Developing
Emerging
311
206
175
Source: The Coca-Cola Company

Meeting consumer needs with a diverse Meeting consumer needs with a diverse Meeting consumer needs with a diverse Meeting consumer needs with a diverse product portfolioproduct portfolioproduct portfolioproduct portfolio
2001
Water 6%
Still beverages 4%
Juice 9%
Other Still 1%
2012Water 20%
Juice 6%
Tea5%
10
2001
Sparkling beverages 90%
1.2bn u.c
Low-caloriesparkling beverages 6%
Regular sparkling beverages 62%
2.1 bn u.c1.1 bn u.c

Play to WinPlay to WinPlay to WinPlay to WinPlay to WinPlay to WinPlay to WinPlay to Win
11

We have a clear framework to achieve our We have a clear framework to achieve our We have a clear framework to achieve our We have a clear framework to achieve our strategic prioritiesstrategic prioritiesstrategic prioritiesstrategic priorities
12

The 4C’s are key elements in our The 4C’s are key elements in our The 4C’s are key elements in our The 4C’s are key elements in our strategy executionstrategy executionstrategy executionstrategy execution
• Brand Priorities Brand Priorities Brand Priorities Brand Priorities (Purpose driven (Purpose driven (Purpose driven (Purpose driven Brands)Brands)Brands)Brands)
• OBPPCOBPPCOBPPCOBPPC
• Joint Value Joint Value Joint Value Joint Value CreationCreationCreationCreation
• Customer Care Customer Care Customer Care Customer Care CentersCentersCentersCenters
• Consumer Based Consumer Based Consumer Based Consumer Based MarketingMarketingMarketingMarketing
• Social EquitySocial EquitySocial EquitySocial Equity
• Infrastructure Infrastructure Infrastructure Infrastructure
optimizationoptimizationoptimizationoptimization
• Cost OwnershipCost OwnershipCost OwnershipCost Ownership
Cost LeadershipCost LeadershipCost LeadershipCost Leadership Community TrustCommunity TrustCommunity TrustCommunity TrustConsumer Consumer Consumer Consumer RelevanceRelevanceRelevanceRelevance
CustomerCustomerCustomerCustomerPreferencePreferencePreferencePreference
13
• OBPPCOBPPCOBPPCOBPPC
• Single ServesSingle ServesSingle ServesSingle Serves
• InnovationInnovationInnovationInnovation
CentersCentersCentersCenters
• Marketplace Marketplace Marketplace Marketplace Execution (RED, Execution (RED, Execution (RED, Execution (RED, Hellenic Hellenic Hellenic Hellenic Goodmorning Goodmorning Goodmorning Goodmorning Meeting)Meeting)Meeting)Meeting)
• Community Community Community Community ContributionContributionContributionContribution
• CSR LeadershipCSR LeadershipCSR LeadershipCSR Leadership
• Market the Market the Market the Market the CategoryCategoryCategoryCategory
• SAP Wave II SAP Wave II SAP Wave II SAP Wave II exploitationexploitationexploitationexploitation
• Shared ServicesShared ServicesShared ServicesShared Services
• Management of Management of Management of Management of Working CapitalWorking CapitalWorking CapitalWorking Capital

Consumer relevanceConsumer relevanceConsumer relevanceConsumer relevanceConsumer relevanceConsumer relevanceConsumer relevanceConsumer relevance
14

Purpose driven brandsPurpose driven brandsPurpose driven brandsPurpose driven brands
SparklingSparklingSparklingSparklingSparklingSparklingSparklingSparkling• Leverage Trademark Coca-Cola with
focus on Regular and Zero
• Increase per capita consumption
• Further grow Fanta, focusing on orange flavour
• Drive Sprite
• Single-serve focus, OBPPC
NesteaNesteaNesteaNesteaNesteaNesteaNesteaNestea
JuiceJuiceJuiceJuiceJuiceJuiceJuiceJuice
• Selective approach
• Focus on increasing market penetration and trial
• Bring new people to the category through sampling, innovation
Beverages Drive Growth
15
burn burn burn burn ---- MonsterMonsterMonsterMonsterburn burn burn burn ---- MonsterMonsterMonsterMonster
• Single-serve focus, OBPPC
WaterWaterWaterWaterWaterWaterWaterWater
JuiceJuiceJuiceJuiceJuiceJuiceJuiceJuice
• Focus on profitability, capitalising on strong local brands
• Single serve packs
• Flavoured water and HORECA
• Deliver best tasting products with premium quality
• Leverage strong brand equity in Cappy, Amita, Dobry
• Innovation
Selective approach driven by stage of development of local energy category
Selective approach driven by stage of development of local energy category

�
Our OBPPC strategy is a key tool of Our OBPPC strategy is a key tool of Our OBPPC strategy is a key tool of Our OBPPC strategy is a key tool of revenue growth managementrevenue growth managementrevenue growth managementrevenue growth management
Defines the right price point by
package and product targeting different
consumption occasions to increase
1More shoppers INCIDENCE
The 3 key objectives:
occasions to increase category revenue
OOOOccasion
BBBBrand
PPPPackage
PPPPrice
CCCChannel
�2
�3
More often
More volume per purchase
FREQUENCY
UPSIZE
16

Customer preferenceCustomer preferenceCustomer preferenceCustomer preferenceCustomer preferenceCustomer preferenceCustomer preferenceCustomer preference
17

CustomerCustomerCustomerCustomer----CentricityCentricityCentricityCentricity
Our Customer-centric vision: “Coca-Cola Hellenic is easy to do business with, gets everything right the first time, adds value
on every occasion, and is my # 1 supplier of choicemy # 1 supplier of choicemy # 1 supplier of choicemy # 1 supplier of choice”
18
„The Customer at the Heart of
everything we do! „

Creating a valueCreating a valueCreating a valueCreating a value----based mindset that leads to based mindset that leads to based mindset that leads to based mindset that leads to better business resultsbetter business resultsbetter business resultsbetter business results
Joint Value Joint Value Joint Value Joint Value CreationCreationCreationCreation
CCCCollaborationollaborationollaborationollaborationAn advanced program and process to collaborate with customers and create joint value
19
Right Execution Right Execution Right Execution Right Execution DailyDailyDailyDaily
EEEExecutionxecutionxecutionxecution
A 360o process for measuring and improving in-market execution

Cost leadershipCost leadershipCost leadershipCost leadershipCost leadershipCost leadershipCost leadershipCost leadership
20

FY 2012 cost structureFY 2012 cost structureFY 2012 cost structureFY 2012 cost structure
Concentrate;
34%
Depreciation;
4%
Overheads;
18%
Sales; 38%
Administration;
Marketing;
10%
21
34%
Sugar; 14%
PET; 9%Aluminium;
5%
Other raw
materials;
16%
Warehouses &
Distribution;
31%
Administration;
21%

OptimisingOptimisingOptimisingOptimising our cost base to enhance our cost base to enhance our cost base to enhance our cost base to enhance competitivenesscompetitivenesscompetitivenesscompetitiveness
Infrastructure optimisation Warehouse/ Logisitics excellence
Manage OPEX and Working Capital
22
SAP is a key enabler for enhancing capabilities and improving efficiencies

Moving transactional processes to Moving transactional processes to Moving transactional processes to Moving transactional processes to shared servicesshared servicesshared servicesshared services
Benefits:
• Leverage SAP benefits
• Improve productivity
• Enhance business support
• Improve internal control / governance
• Enable local management to focus on value added activities
23
added activities
Roll Out:
• Live in 19 countries for key Finance and HR functions
• Integration of more countries and processes planned – followed by best practice application

Community trustCommunity trustCommunity trustCommunity trustCommunity trustCommunity trustCommunity trustCommunity trust
24

An industry leader in sustainabilityAn industry leader in sustainabilityAn industry leader in sustainabilityAn industry leader in sustainability
For a fourth consecutive year Coca-Cola Hellenic is included in the Dow Jones Sustainability Indexes (DJSI) – both the Dow Jones Sustainability World Index and Dow Jones STOXX Sustainability Index. Launched in 1999, the DJSI are the first global indexes tracking the financial performance of the leading sustainability driven companies worldwide.
Member 2010/11
accepted corporate social responsibility standards to facilitate investment in ethical and socially responsible companies.
Coca-Cola Hellenic is listed on the FTSE4Good index, which recognises the performance of companies that meet globally
25
leading sustainability driven companies worldwide.
With our 2010 Social Responsibility Report, we were the only European non-alcoholic ready-to-drink beverage company to achieve GRI A+ ranking for comprehensiveness and transparency. In 2011 we established a cross sector external stakeholder panel to review and provide critical assessment of our sustainability reporting.
GRI A+GRI A+GRI A+GRI A+GRI A+GRI A+GRI A+GRI A+
For more information please see our sustainability reports at http://www.coca-colahellenic.com/sustainability/
Coca-Cola Hellenic is included in the new indices of French agency Vigeo, one of the world's leading ESG (Environment, social, governance) analysts and providers of information to investors. We are the only beverage company to be included in the Europe120 list of the top 120 companies across Europe (all sectors).

Cash Cash Cash Cash Cash Cash Cash Cash –––––––– Financing & Financing & Financing & Financing & Financing & Financing & Financing & Financing & GovernanceGovernanceGovernanceGovernanceGovernanceGovernanceGovernanceGovernanceGovernanceGovernanceGovernanceGovernanceGovernanceGovernanceGovernanceGovernance
26

Strong and sustainable cash flow generationStrong and sustainable cash flow generationStrong and sustainable cash flow generationStrong and sustainable cash flow generation
We expect to generate
€€€€1.3bn 1.3bn 1.3bn 1.3bn cumulative
free cash flow in the
3yr period ending December 2015.
262546 537 427 341
Free Cash Flow
27
Capital Expenditure Guidance
5.5%-6.5% of Net Sales Revenue
over the medium-term
Free Cash Flow in Million Euros
Note:Note:Note:Note: The financial information for fiscal years 2012, 2011 and 2010 reflects the Group’s early adoption of IFRS 10 Consolidated Financial Statements, IFRS 11 Joint Arrangements, IFRS 12 Disclosure of Interest in Other Entities and the revised IAS 19 Employee Benefits in 2012 (and retrospective adjustments in 2011 and 2010 to reflect the same).
2008 2009 2010 2011 2012

Net debt/EBITDACredit ratings
Conservative financial profileConservative financial profileConservative financial profileConservative financial profile
• Moody’s: L/T Baa1, S/T P2, negative outlook
• S&P: L/T BBB+, S/T A2, credit watch negative
2.1 2.1
1.72.0 2.1
2008 2009 2010 2011 2012
28
Diversified bond maturity profileGearing ratio
Notes: Gearing ratio: Net debt to Total Net Capital; ratios based on comparable figures; The financial information for fiscal years 2012, 2011 reflects the Group’s early adoption of IFRS 10 Consolidated Financial Statements, IFRS 11 Joint Arrangements, IFRS12 Disclosure of Interest in Other Entities and the revised IAS 19 Employee Benefits in 2012 (and retrospective adjustments in 2011 to reflect the same).
2008 2009 2010 2011 2012
42%46%
38% 38% 36%
2008 2009 2010 2011 2012
500 € 500400
€ 600
2013 2014 2015 2016
$
$

Solid track record of returning Solid track record of returning Solid track record of returning Solid track record of returning value to shareholdersvalue to shareholdersvalue to shareholdersvalue to shareholders
In the last 12 years we have returned to our shareholders, whether in the form of
dividends or capital returns,total cash of approximately
€€€€2.0 billion2.0 billion2.0 billion2.0 billion
29
In million Euros

Corporate governanceCorporate governanceCorporate governanceCorporate governance
� ADR program on NYSE since 2002
� Full SOX compliance history
� Enhancement of corporate governance upon settlement of the
share exchange offers through:
30
1. appointment of an additional independent non-executive
director
2. nominations committee, majority members independent
3. no shareholders or relationship agreements
4. board members subject to re-election on an annual basis

In summaryIn summaryIn summaryIn summaryIn summaryIn summaryIn summaryIn summary
31

Key strategic priorities in 2013Key strategic priorities in 2013Key strategic priorities in 2013Key strategic priorities in 2013
Continue to Revenue Cost
Leadership /
32
Continue to win in the
marketplace
Revenue Growth
Management
Leadership / Free Cash
Flow Generation

LongLongLongLong----term growth driversterm growth driversterm growth driversterm growth drivers
Most known brand in the world!
Low per capita consumption offers growth prospects.
Diverse geographic footprint with
Strong focus on cost leadership and cash generation
33
Diverse geographic footprint with strong emerging market exposure
Solid track record of winning in the marketplace
For further information on Coca-Cola Hellenic please visit our website at:
www.coca-colahellenic.comor contact our Investor Relations team
[email protected]+30.210.6183 100
34

Appendix:Appendix:Appendix:Appendix:Appendix:Appendix:Appendix:Appendix:Full Year 2012 FinancialsFull Year 2012 FinancialsFull Year 2012 FinancialsFull Year 2012 FinancialsFull Year 2012 FinancialsFull Year 2012 FinancialsFull Year 2012 FinancialsFull Year 2012 FinancialsFull Year 2012 FinancialsFull Year 2012 FinancialsFull Year 2012 FinancialsFull Year 2012 FinancialsFull Year 2012 FinancialsFull Year 2012 FinancialsFull Year 2012 FinancialsFull Year 2012 Financials
35
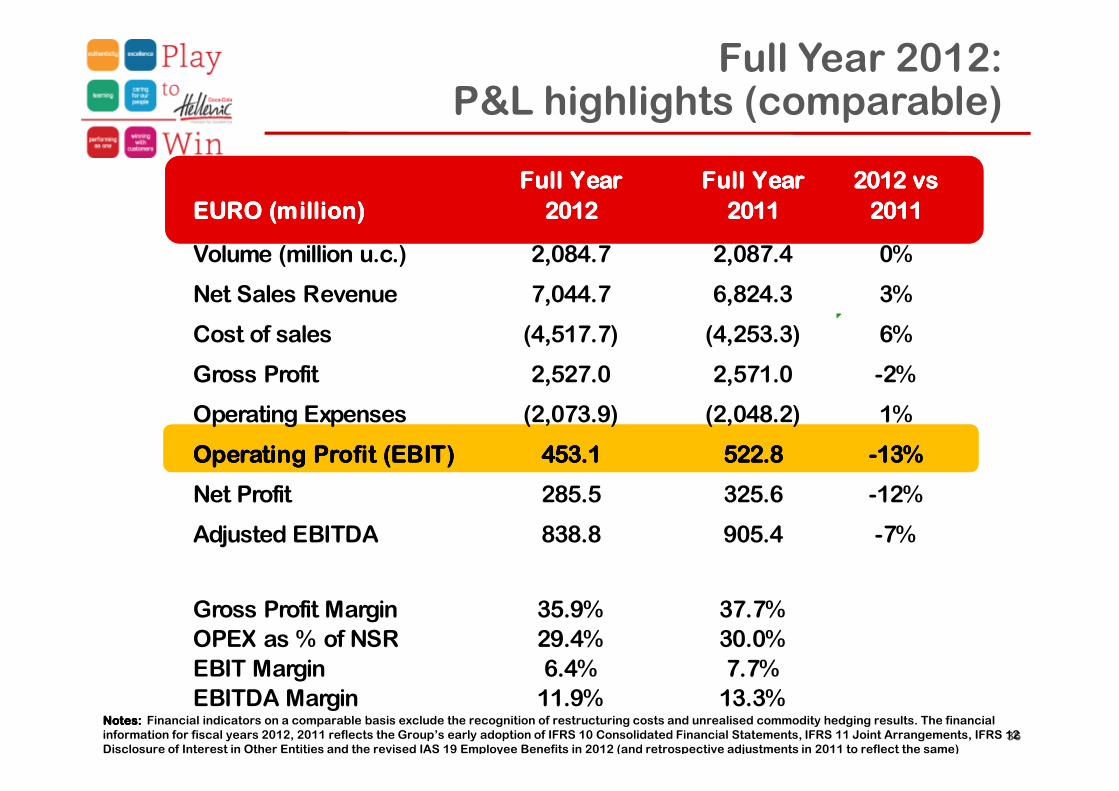
Full Year 2012:P&L highlights (comparable)
EURO (million)EURO (million)EURO (million)EURO (million)
Full Year Full Year Full Year Full Year
2012201220122012
Full Year Full Year Full Year Full Year
2011201120112011
2012 vs 2012 vs 2012 vs 2012 vs
2011201120112011
Volume (million u.c.) 2,084.7 2,087.4 0%
Net Sales Revenue 7,044.7 6,824.3 3%
Cost of sales (4,517.7) (4,253.3) 6%
Gross Profit 2,527.0 2,571.0 -2%
36
Notes: Notes: Notes: Notes: Financial indicators on a comparable basis exclude the recognition of restructuring costs and unrealised commodity hedging results. The financial information for fiscal years 2012, 2011 reflects the Group’s early adoption of IFRS 10 Consolidated Financial Statements, IFRS 11 Joint Arrangements, IFRS 12 Disclosure of Interest in Other Entities and the revised IAS 19 Employee Benefits in 2012 (and retrospective adjustments in 2011 to reflect the same)
Operating Expenses (2,073.9) (2,048.2) 1%
Operating Profit (EBIT)Operating Profit (EBIT)Operating Profit (EBIT)Operating Profit (EBIT) 453.1453.1453.1453.1 522.8522.8522.8522.8 -13%-13%-13%-13%
Net Profit 285.5 325.6 -12%
Adjusted EBITDA 838.8 905.4 -7%
Gross Profit Margin 35.9% 37.7%OPEX as % of NSR 29.4% 30.0%EBIT Margin 6.4% 7.7%EBITDA Margin 11.9% 13.3%

Full Year 2012:Net Profit (comparable)
EURO (million)EURO (million)EURO (million)EURO (million)
Full Year Full Year Full Year Full Year
2012201220122012
Full Year Full Year Full Year Full Year
2011201120112011
2012 vs 2012 vs 2012 vs 2012 vs
2011201120112011
Operating profit (EBIT) 453.1 522.8 -13%
Finance costs & other (79.1) (85.8) -8%
37
Profit before tax 374.0 437.0 -14%
Tax (85.5) (110.0) -22%
Minority interests (3.0) (1.3) >100%
Net ProfitNet ProfitNet ProfitNet Profit 285.5285.5285.5285.5 325.7325.7325.7325.7 -12%-12%-12%-12%
Earnings per Share (in euros)Earnings per Share (in euros)Earnings per Share (in euros)Earnings per Share (in euros) 0.780.780.780.78 0.900.900.900.90 -13%-13%-13%-13%
Notes: Notes: Notes: Notes: Financial indicators on a comparable basis exclude the recognition of restructuring costs and unrealised commodity hedging results. The financial information for fiscal years 2012, 2011 reflects the Group’s early adoption of IFRS 10 Consolidated Financial Statements, IFRS 11 Joint Arrangements, IFRS 12 Disclosure of Interest in Other Entities and the revised IAS 19 Employee Benefits in 2012 (and retrospective adjustments in 2011 to reflect the same)

Full Year 2012:Free Cash Flow
EURO (million)EURO (million)EURO (million)EURO (million)
Full Year Full Year Full Year Full Year
2012201220122012
Full Year Full Year Full Year Full Year
2011201120112011
2012 vs 2012 vs 2012 vs 2012 vs
2011201120112011
Adjusted EBITDA*Adjusted EBITDA*Adjusted EBITDA*Adjusted EBITDA* 757.6757.6757.6757.6 852.2852.2852.2852.2 (94.6)(94.6)(94.6)(94.6)
Cash from Working Capital 84.1 61.3 22.8
38
Notes:Notes:Notes:Notes: We define adjusted EBITDA as operating profit before deductions for depreciation (included both in cost of goods sold and in operating expenses), impairment of property, plant and equipment, employee share options, impairment of intangible assets, amortisation of and adjustments to intangible assets and other non-cash items.
The financial information for fiscal years 2012, 2011 reflects the Group’s early adoption of IFRS 10 Consolidated Financial Statements, IFRS 11 Joint Arrangements, IFRS 12 Disclosure of Interest in Other Entities and the revised IAS 19 Employee Benefits in 2012 (and retrospective adjustments in 2011 to reflect the same)
Tax paid (95.0) (88.4) (6.6)
Loss / (Gain) on asset disp. 6.9 3.2 3.7
Cash Flow from operationsCash Flow from operationsCash Flow from operationsCash Flow from operations 753.6753.6753.6753.6 828.3828.3828.3828.3 (74.7)(74.7)(74.7)(74.7)
Net capital expenditure (412.3) (401.1) (11.2)
Free Cash FlowFree Cash FlowFree Cash FlowFree Cash Flow 341.3341.3341.3341.3 427.2427.2427.2427.2 (85.9)(85.9)(85.9)(85.9)
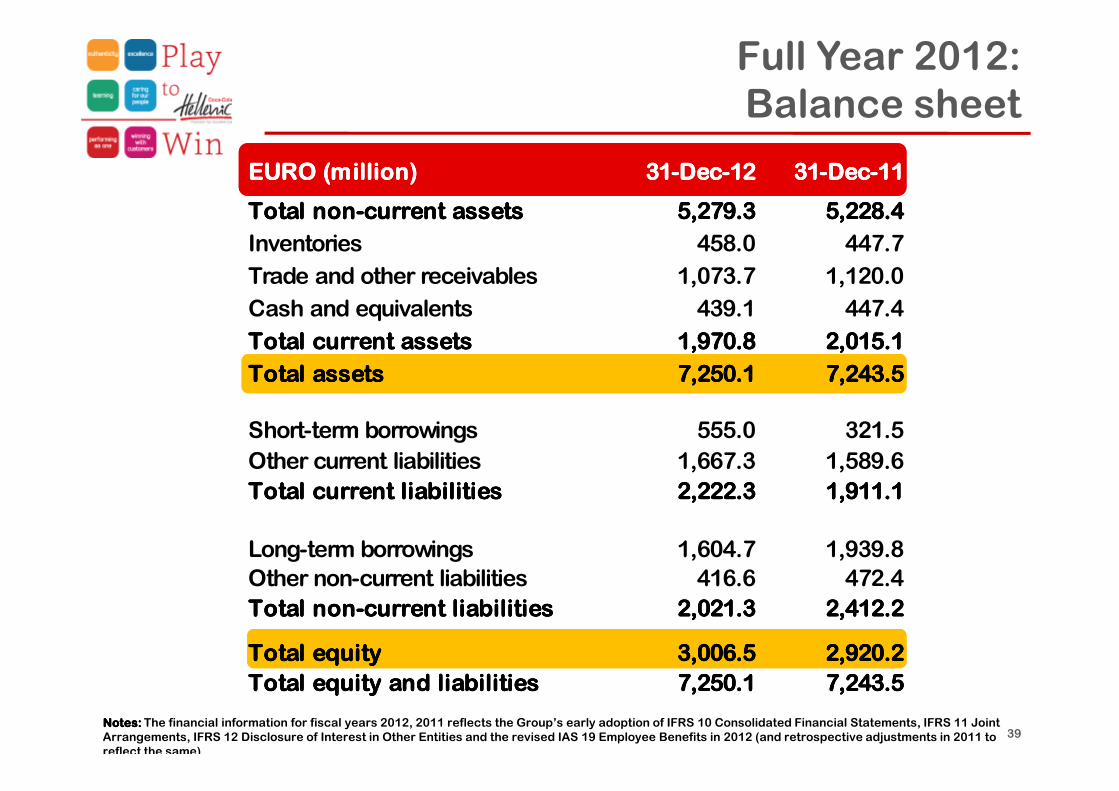
Full Year 2012:Balance sheet
EURO (million)EURO (million)EURO (million)EURO (million) 31-Dec-1231-Dec-1231-Dec-1231-Dec-12 31-Dec-1131-Dec-1131-Dec-1131-Dec-11
Total non-current assetsTotal non-current assetsTotal non-current assetsTotal non-current assets 5,279.35,279.35,279.35,279.3 5,228.45,228.45,228.45,228.4
Inventories 458.0 447.7
Trade and other receivables 1,073.7 1,120.0
Cash and equivalents 439.1 447.4
Total current assetsTotal current assetsTotal current assetsTotal current assets 1,970.81,970.81,970.81,970.8 2,015.12,015.12,015.12,015.1
Total assetsTotal assetsTotal assetsTotal assets 7,250.17,250.17,250.17,250.1 7,243.57,243.57,243.57,243.5
39
Short-term borrowings 555.0 321.5
Other current liabilities 1,667.3 1,589.6
Total current liabilitiesTotal current liabilitiesTotal current liabilitiesTotal current liabilities 2,222.32,222.32,222.32,222.3 1,911.11,911.11,911.11,911.1
Long-term borrowings 1,604.7 1,939.8Other non-current liabilities 416.6 472.4
Total non-current liabilitiesTotal non-current liabilitiesTotal non-current liabilitiesTotal non-current liabilities 2,021.32,021.32,021.32,021.3 2,412.22,412.22,412.22,412.2
Total equityTotal equityTotal equityTotal equity 3,006.53,006.53,006.53,006.5 2,920.22,920.22,920.22,920.2
Total equity and liabilitiesTotal equity and liabilitiesTotal equity and liabilitiesTotal equity and liabilities 7,250.17,250.17,250.17,250.1 7,243.57,243.57,243.57,243.5
Notes: Notes: Notes: Notes: The financial information for fiscal years 2012, 2011 reflects the Group’s early adoption of IFRS 10 Consolidated Financial Statements, IFRS 11 Joint Arrangements, IFRS 12 Disclosure of Interest in Other Entities and the revised IAS 19 Employee Benefits in 2012 (and retrospective adjustments in 2011 to reflect the same)