UG1-0502-00EN
206
QuantiQa Client U SER M ANUAL Part 1: The Main Window, Menus, Toolbars, Tools, Default And Result Windows Software Release 2.0 UG1-0502-00EN
-
Upload
fortune-myambo -
Category
Documents
-
view
33 -
download
0
Transcript of UG1-0502-00EN

QuantiQa ClientUSER MANUAL
Part 1: The Main Window, Menus,Toolbars, Tools, Default And
Result Windows
Software Release 2.0
UG1-0502-00EN

Copyright © 2009 CommProve Limited. All rights reserved.
While every effort has been made to ensure that the information containedin this document is true and correct at the time of going to press, theproducts, specifications and services described here, together with thedocument content in general, are subject to continuous improvement.CommProve reserves the right to make such changes as it sees fit, withoutprior notice, and cannot accept liability for any loss or damage, of anynature whatsoever, arising or resulting from the use of the information orparticulars contained here.
CommProve does not warrant that the material contained in this document isfree of errors. Any errors found in this document should be reported toCommProve in writing.
The information in this document is confidential, and is meant for use onlyby the intended recipient in connection with, and subject to, the terms of itscontractual relationship with CommProve. This document is the soleproperty of CommProve, and no part may be reproduced or transmitted inany form, or by any means, for any purpose, without the express writtenpermission of CommProve.
All trademarks not owned by CommProve that appear in this document, arethe property of their respective owners.


Conventions Used In ThisDocument
The following list explains the meaning of graphic symbols and devices,together with the typographical conventions used in CommProvedocumentation.
Convention Description
> Used to show a step in a path to a window or dialog box.For example:
File > Save As…
Bold Used for window component names, buttons, menuoptions and similar. For example:
Click Cancel.
Bold Italics Used to emphasize important words or phrases. For example:
JavaScript
<CAPITALS> Used for keyboard key names, or key strokes. For example:
Press <ENTER>.
Computer Computer generated text. For example:
<?xml version="1.0"?>
“Marks” Used to highlight references to chapters within otherdocuments.
“Marks” Used to highlight references to other chapters or sectionswithin the same document.
Information bar, used to highlight important information, such as theoutcome of a described action.
Caution bar, used to highlight for example, actions that could lead toundesirable results.
Warning bar, used to highlight for example, actions thatcould lead to data loss, or system instability.
i

QuantiQa Client User Manual Part 1
SPELLING AND TERMINOLOGY
CommProve English language documentation uses US English spellingconventions and terminology.
ii

Contents
Conventions Used In This Document....................................iSPELLING AND TERMINOLOGY....................................................................II
Overview.........................................................................................1BEFORE YOU RUN QUANTIQA CLIENT.......................................................1
QuantiQa Client Main Window................................................3THE MAIN WINDOW AFTER YOU START QUANTIQA CLIENT FOR THE FIRST TIME..............................................................................3
THE MAIN WINDOW COMPONENTS.............................................................5
Title Bar................................................................................................5
Main Menu (Menu Bar).......................................................................5
Toolbars................................................................................................5
Windows And Panels..........................................................................5
The Status Bar....................................................................................5
REARRANGING QUANTIQA CLIENT'S APPEARANCE.......................................6
Move The Main Menu, A Toolbar, Or A Window..............................6
The Main Menu.............................................................................7DISPLAY A MAIN MENU DROPDOWN LIST...................................................7
THE NEW MENU.....................................................................................8
New Menu Commands.......................................................................8
New Procedure List.....................................................................................8New Protocol Analyzer................................................................................9New Trace Diagram.....................................................................................9New Map Result Window............................................................................9New Table Result Window...........................................................................9New Chart Result Window...........................................................................9New Chart Builder Window..........................................................................9New Preset Editor........................................................................................9Exit...............................................................................................................9
Select A New Menu Command........................................................10
THE VIEW MENU...................................................................................10
The View Menu List..........................................................................11
Toolbars List..............................................................................................12Windows List.............................................................................................12
Display, Hide, Or Locate A View Menu Item.................................13
iii

QuantiQa Client User Manual Part 1
THE TOOLS MENU.................................................................................13
Tool Menu Commands......................................................................13
Options......................................................................................................14Import PA Symbols....................................................................................14User Administration...................................................................................14Change User..............................................................................................14Change Password.....................................................................................14KPM Rules.................................................................................................14IMSI List Configuration..............................................................................14Alarm Configuration...................................................................................15
Select A Tools Menu Command......................................................15
THE HELP MENU..................................................................................15
The Help Menu List..........................................................................16
User Guide................................................................................................16A Interface Ticket Description....................................................................16Abis Interface Ticket Description...............................................................16About QuantiQa.........................................................................................16
Select A Help Menu Item.................................................................16
Toolbars........................................................................................17THE NEW TOOLBAR...............................................................................17
New Toolbar Buttons........................................................................17
TIME GRID TOOLBAR.............................................................................18
The Mode Button...............................................................................18
The ROP Selection Button...............................................................19
The Time Slot Selection Grid..........................................................20
Define A Query Time Interval..........................................................20
Windows and Panels................................................................23TYPES OF WINDOW..............................................................................23
Dialog, Or Default Windows............................................................23
Show Or Hide A Default Window...............................................................23Current Windows List................................................................................23Panels........................................................................................................24
User Defined Windows.....................................................................24
The User Defined Window Title Bar..........................................................24Windows With Tables.......................................................................24
Row Alphabetical Order.............................................................................24Column Order............................................................................................24Column Width............................................................................................25Column Grouping......................................................................................25The Field Chooser.....................................................................................27
Other Windows..................................................................................27
Information Windows.................................................................................27Dialogs.......................................................................................................27
iv

Tools..............................................................................................29OPTIONS..............................................................................................29
Protocol Analyzer..............................................................................30
Protocol Analyzer Fonts And Colors..............................................32
Ticket Viewer.....................................................................................33
Application.........................................................................................34
Map Results.......................................................................................36
IMPORT PA SYMBOLS............................................................................37
Store Name Resolution Definitions On A Server..........................38
Manually Download Definitions From A Server............................38
Automatically Download Definitions From A Server.....................39
CHANGE USER......................................................................................39
CHANGE PASSWORD..............................................................................40
KPM RULES........................................................................................41
IMSI LIST CONFIGURATION....................................................................41
ALARM CONFIGURATION..........................................................................42
Default Windows........................................................................43DISPLAY A DEFAULT WINDOW:................................................................43
The Main Selection Window..................................................45THE MAIN SELECTION WINDOW CONTROL PANELS....................................45
Expand Or Collapse A Control Panel.............................................46
THE SERVER SELECTION PANEL..............................................................46
Access A Server................................................................................47
Unsuccessful Server Access...........................................................47
THE DATE SELECTION PANEL ................................................................48
THE CALENDAR SELECTION PANEL..........................................................49
Calendar Selection Panel Control Buttons....................................49
The Calendar Selection Panel Calendar Display.........................49
Select A Calendar Date Range.......................................................50
Change The Month....................................................................................50Select A Date Or Date Range....................................................................50
THE DAY TIME SLOT PANEL...................................................................51
THE AGGREGATION MODE SELECTION PANEL............................................52
Time Based Aggregation..................................................................52
v
QuantiQa Client User Manual Part 1
MO Hierarchy, Hierarchy Level And Property Based Aggregation.............................................................................................................52
Hierarchical Levels....................................................................................53Example Of Hierarchical Levels................................................................54Re-homing Management...........................................................................54Naming Hierarchical Levels.......................................................................55
The MO Selection Window.....................................................57DISPLAY THE MO SELECTION WINDOW...................................................57
THE MO SELECTION WINDOW................................................................57
The Managed Object List.................................................................58
Viewing Managed Objects...............................................................59
The MO Selection Toolbar...............................................................59
Global MO List ..........................................................................................60Result Window MO List ............................................................................60Highlight All................................................................................................60Remove Highlight From All........................................................................60Invert Highlighting......................................................................................61Toggle Visibility..........................................................................................61Lock Visibility.............................................................................................61Select All Highlighted MOs........................................................................61Deselect All Highlighted MOs....................................................................61Toggle Selection of All Highlighted MOs....................................................62Find MO.....................................................................................................62Column or Field Chooser ..........................................................................62Collapse All Groups ..................................................................................62Expand all Groups ....................................................................................62Query Server to Expand All MOs...............................................................62
MO Selection Filter...........................................................................63
SELECTING MANAGED OBJECTS..............................................................63
MO Visibility.......................................................................................66
MO Profile And Group Toolbar........................................................67
The MO Profile Tool...................................................................................68The MO Group Tool...................................................................................69
Find A Managed Object....................................................................70
The Column Drag & Drop Area.......................................................70
The Preset Selection Window...............................................71EDIT A PRESET.....................................................................................72
EXECUTE A PRESET...............................................................................72
DELETE A PRESET.................................................................................72
The Counters Selection Window..........................................73
vi

The Ticket Finder Window.....................................................75THE TICKET FINDER TOOL BUTTONS BAR................................................76
TREE VIEW LIST...................................................................................79
TICKET TYPE FIELDS LIST......................................................................80
ADVANCED TICKET FILTERING..................................................................80
DD SERVER ADVANCED TICKET FILTERING...............................................81
The Drill Down Filter Window...............................................83MO FILTER..........................................................................................85
PROTOCOLS AND MESSAGE TYPES .........................................................85
THE DRILL DOWN FILTER TOOL BUTTONS BAR.........................................86
The Preset Editor......................................................................89
The Chart Builder......................................................................95Pie, Bar and XY Charts..................................................................100
Co-ordinate Values..................................................................................104
Query Results...........................................................................113MAPS.................................................................................................113
TABLES...............................................................................................113
CHARTS.............................................................................................113
The Map Result Window.......................................................115MAP TITLE BAR..................................................................................115
MAP TOP TOOLBAR.............................................................................116
Map Top Toolbar Buttons...............................................................116
Dragger....................................................................................................117Auto Refresh............................................................................................117Global Dropdown List..............................................................................118Lock Drilldown Layer...............................................................................118Drilldown Drop List...................................................................................118Autoscale.................................................................................................119Print.........................................................................................................119Pixel.........................................................................................................119Show Only Expanded Rows ...................................................................119Main Layer Threshold..............................................................................119Drilldown Layer Threshold.......................................................................119
THE MAP TOOLS TOOLBAR...................................................................121
Map Tools Toolbar Buttons............................................................121
vii

QuantiQa Client User Manual Part 1
Selection Pointer............................................................................122
Zoom In ...........................................................................................122
Zoom Out.........................................................................................123
Zoom Extent....................................................................................123
Pan...................................................................................................123
Drill Down........................................................................................124
Disable Drill Down..........................................................................124
Show Neighbor Cells......................................................................124
Distance Measurement..................................................................126
Rectangle Selection.......................................................................126
Polygon Selection...........................................................................127
Layer Manager................................................................................127
Projection.........................................................................................127
File Manager...................................................................................128
ACTIVATE A MAP WINDOW ..................................................................129
THE MAP RESULTS PANEL...................................................................129
Cell Location And Cell Sector.......................................................130
Multiple MOs At The Same Cell Sector.......................................132
MAP COLOR SCALE.............................................................................133
MAP BOTTOM TOOLBAR.......................................................................134
Distance Measurement Label.......................................................135
Blending Tools.................................................................................135
Map (Blending Tool).................................................................................136Feat (Blending Tool)................................................................................136
Image Sizing Tools.........................................................................137
ROP Tools........................................................................................137
Previous Button (ROP Tools)...................................................................137Speed/Play Button (ROP Tools)..............................................................138Next Button (ROP Tools).........................................................................138
MAP WITH A NOT A NUMBER (NAN) RESULT........................................138
AN EXAMPLE OF USING DRILLDOWN.....................................................139
The Table Result Window.....................................................141TABLE GRID.......................................................................................141
Table/Record Title Bar...................................................................142
Table/Record Toolbar.....................................................................142
Dragger............................................................................................143
Auto Refresh...................................................................................143
viii

Export to Clipboard.........................................................................144
Export to Disk..................................................................................144
Export to Excel................................................................................145
Individual Cell Selection................................................................145
Table Options..................................................................................145
Column/Field Chooser...................................................................145
Collapse All Groups........................................................................146
Expand All Groups..........................................................................146
Normalization Dropdown List........................................................146
Table/Record Drag Area And Columns........................................147
Table/Record With NAN.................................................................147
The Chart Result Window....................................................149CHART LAYOUT AND RESULTSET...........................................................149
Chart Title Bar.................................................................................150
Chart Top Toolbar...........................................................................151
Dragger............................................................................................151
Auto Refresh...................................................................................152
Save Layout.....................................................................................153
Load Layout.....................................................................................153
Edit Layout (Unlock Chart)............................................................153
Zoom In............................................................................................154
Zoom Out.........................................................................................154
Scroll................................................................................................154
Save..................................................................................................155
Print..................................................................................................157
Autoscale With Data Dropdown List............................................158
Disable Items..................................................................................158
Cumulative.......................................................................................159
Normalization Dropdown List........................................................159
AUTOSCALE EXAMPLES........................................................................160
WIDGETS: SLIDERS AND DROPDOWN LISTS............................................161
PIE CHART.........................................................................................165
Pie Angle..........................................................................................165
Pie Color..........................................................................................166
Pie Height........................................................................................166
ix

QuantiQa Client User Manual Part 1
Pie Displacement............................................................................167
Pie With A NAN...............................................................................167
Two Dimensional Bar Chart...........................................................168
Three Dimensional Bar And Line Chart.......................................169
Three Dimensional Bar And Line Chart With NAN.....................170
Gauge Chart....................................................................................172
The Ticket List Window........................................................173THE TITLE BAR...................................................................................174
TOOLBAR............................................................................................174
Field Chooser..................................................................................174
Export...............................................................................................174
Show Details...................................................................................174
TABLE FACILITIES................................................................................174
The Protocol Analyzer Window..........................................177TITLE BAR..........................................................................................177
PROTOCOL ANALYSIS TOOLBAR.............................................................177
Protocol Analyzer View..................................................................178
Trace Diagram View.......................................................................178
Mixed View......................................................................................178
Find Text..........................................................................................178
Column Chooser.............................................................................178
Refresh.............................................................................................178
Export...............................................................................................178
PDU LIST PANEL...............................................................................180
TRACE THE PDU PROCEDURES...........................................................180
Drill Up To Ticket.............................................................................182
PDU Contents Panel......................................................................182
PDU Bytes Panel............................................................................183
Trace Diagram Panel.....................................................................184
Table Of Figures......................................................................185
x

Overview
To get the most out of this manual, and before reading further, pleaseensure that you have installed QuantiQa Client, as described in the“QuantiQa Client Software Installation Guide”.
The following pages provide detailed information about:
• The QuantiQa Client Main Window.
• The Main Menu.
• Toolbars.
• Windows and Panels.
• Tools.
• Default Windows.
• The Preset Editor.
• The Chart Builder.
• Result Windows.
The "QuantiQa Client User Manual Part 2" contains the appendices to thismanual, and includes information about the Server Configuration File,formulas and syntax. For information about getting started with QuantiQaClient, please refer to the "QuantiQa Client Getting Started Guide".
The availability of certain QuantiQa Client functions to individual users,depends upon their particular User Rights. For further information about therights available to you, please contact your system administrator. ThisQuantiQa Client User Manual does not include, in detail, how to define UserRights.
NOTE:
The examples of screens, menus and dialog boxes shown in thismanual, may differ slightly from those displayed by your system,depending upon which Microsoft Windows version you are using, andyour local settings.
BEFORE YOU RUN QUANTIQA CLIENT
QuantiQa Client accesses servers using the settings defined in theserver.cfg file.
If any of these settings are not formatted correctly, missing,or wrong, connections with one, several, or all servers, willfail.
1
1

QuantiQa Client User Manual Part 1
A correctly configured server.cfg file is provided with the QuantiQa ClientSoftware Distribution Package. This is copied to the QuantiQa Clientsoftware root directory, during installation. Under normal circumstances, youshould not need to change these settings.
If however, you are unsure about the server configuration settings, youshould check that the server.cfg file entries are correct, before starting aQuantiQa Client session. For further information about the server.cfg file,please refer to the "QuantiQa Client User Manual Part 2".
2

QuantiQa Client MainWindow
This chapter introduces the QuantiQa Client Main Window, which displaysafter you have successfully logged on to the application. The Main Windowis the primary user interface, and provides access to all of QuantiQa Client'stoolbars, windows, panels, controls and dialog boxes. These enable you to:
• Create reports from data stored on the connected server.
• Manage tickets, and analyze transactions in detail.
• Access the protocol analyzer, to review protocol messages and Packet Data Units (PDU).
• Manage, set, upload and run alarms, as well as retrieve data aboutalarms that have been previously defined.
THE MAIN WINDOW AFTER YOU START QUANTIQA CLIENT FORTHE FIRST TIME
When you start QuantiQa Client for the first time, the Main Windowdisplays, as shown in Figure 1: The QuantiQa Client Main Window. Itincludes all of the controls needed to build a query, and manage theapplication's advanced features. All toolbars, windows, panels and controlsdisplay in their default location.
3
2

QuantiQa Client User Manual Part 1
Title BarAnd Standard
Windows Controls
Ticket FinderWindow
Docking AreaFor OtherWindows
Tabbed WindowsStatus Bar
Main MenuToolbarsTime Grid ToolbarMain SelectionWindow
Panels
FI G U R E 2.1: QU A N T I QA CL I E N T M A I N WI N D O W.
4

THE MAIN WINDOW COMPONENTS
The QuantiQa Client Main Window is made up of the following:
• The Title Bar.
• The Main Menu.
• Toolbars.
• Windows and Panels.
• The Status Bar.
TITLE BA RThe Title Bar displays the name of the application, and includes standardWindows control buttons, to minimize, restore and close the Main Window.
MAIN MENU (MENU BAR)The Main Menu , also referred to as the Menu Bar, provides access to arange of dropdown lists, in a similar way to the main menus of otherMicrosoft Windows based applications. These lists enable you to, forexample, open windows, change passwords, or display documentation. TheMain Menu is treated in many ways like a Toolbar in QuantiQa Client, andcan be relocated, or hidden, as required.
TOOLBARSAll QuantiQa Client toolbars, apart from the Map Tools toolbar, display bydefault, at the top of the Main Window, and provide access to several of theapplications tools and advanced functions. Toolbars can be hidden, orrelocated as required, with the exception of the Map Tools toolbar, which ispermanently docked within the Map Results window.
WINDOWS AN D PANELSThe QuantiQa Client windows act, together with the toolbars, as the mainuser interface. Certain windows also include collapsible panels. Windows,together with any panels that they might include, can be hidden, or relocatedas required. Panels can only be collapsed or expanded, within the parentwindow, and cannot be individually repositioned.
THE STATU S BARThe Status Bar displays information about any current application activity,and for example, whether the keyboard Number Lock is on, and so on. Ingeneral, it functions in a similar way to the status bars of many otherMicrosoft Windows based applications. The position of the Status Bar isfixed, and it cannot be relocated elsewhere, although it may be hidden.
5
QuantiQa Client Main Window

QuantiQa Client User Manual Part 1
REARRANGING QUANTIQA CLIENT'S APPEARANCE
You can customize QuantiQa Client's appearance, and rearrange the MainMenu, toolbars and control windows (which can be docked, floating, orhidden), to a layout that suits your personal needs. This new layout is thenstored by QuantiQa Client when you exit, and applied the next time that youlog on. The same is true for any layout created by other users.
MOVE TH E MA IN MENU, A TOOLBAR, OR A WIN DOWTo move the Main Menu, a toolbar, or a window:
1. Click and hold the Toolbar Control Handle, or the Window Title bar.
FI G U R E 2 .2: TO O L B A R C O N T R O L H A N D L E S.
2. Drag to the required location on your screen, and release the mousebutton.
Result: The Main Menu, toolbar, or window, displays in its newlocation during the current session, where it remains afterrestarting QuantiQa Client, until you relocate it again.
NOTE:
When you drag a Default window (please refer to “Chapter 5,Windows And Panels, Dialog, Or Default Windows” for furtherdetails about Default windows), docking areas display, on either side,at the top, or at the bottom of the Main Window.
If you drag a toolbar, or Default window, outside the boundaries of theMain Window, it becomes a floating toolbar, or window.
The following chapters describe in detail, the features and functions of eachof the QuantiQa Client Main Window components, with the exception ofthe Title Bar and Status Bar. Please refer to Microsoft Windowsdocumentation for information about these two bars.
6
ToolbarControlHandles

The Main Menu
This chapter describes the Main Menu, which by default, displays at the topleft of the Main Window, beneath the Title Bar. You can however, repositionthe Main Menu anywhere on your screen, as described in “Chapter 2,QuantiQa Client Main Window, Move The Main Menu, A Toolbar, or AWindow”.
The Main Menu provides access to the following selectable dropdown lists:
• New.
• View.
• Tools.
• Help.
FI G U R E 3 .1: TH E MA I N M E N U.
DISPLAY A MAIN MENU DROPDOWN LIST
To display a Main Menu dropdown list:
1. Click New, View, Tools, or Help.
Result: The appropriate dropdown list displays.
NOTE:
The User Group that you belong to, and your assigned User Rights,determine whether or not you can access individual windows, dialogsand so on, through menu lists. For further information, please contactyour system administrator.
7
3

QuantiQa Client User Manual Part 1
THE NEW MENU
FI G U R E 3 .2: TH E NE W M E N U.
The New menu is a selectable list of commands, which enable you to opennew tool dialogs and result windows or, for example, create charts andpresets. The resultant windows are referred to here, as User Definedwindows. In addition, the New Menu also includes the QuantiQa Client Exitcommand.
NEW MENU COM MA ND SThe New menu includes the following:
• New Procedure List.
• New Protocol Analyzer.
• New Trace Diagram.
• New Map Result Window.
• New Table Result Window.
• New Chart Result Window.
• New Chart Builder.
• New Preset Editor.
• Exit.
NOTE:
Please refer to Figure 3.2: The New Menu, for the icon that isassociated with each New Menu command.
NE W PR O C E D U R E L I S T
When clicked, a new Ticket List window displays. This is used, for example,with the Ticket Finder tool, or a drill-down from a Table Result window, todisplay Tickets, which have been generated and stored by Netledge.
8

NE W PR O TO C O L AN A LY Z E R
When clicked, a new Protocol Analyzer window displays. This may only beused however, in conjunction with a Ticket List window, to displaymessages/Packet Data Units (PDU), which have been generated andstored by Netledge.
NE W TR A C E DI A G R A M
When clicked, a new Trace Diagram window displays. From there, selectthe Trace Diagram View button, in the window's toolbar. This can then beused, to display procedures, which have been monitored and stored byNetledge.
NE W MA P RE S U LT WI N D O W
When clicked, a new Map Result window displays. This can be used todisplay a map showing, for example, cell locations and their associateddata. A Map Result window can be populated automatically, prior to runninga query, by selecting Managed Objects (MO) in the MO Selection window.In addition, the Map Result window can also be populated, by draggingresult data from another window, or a Preset from the Preset Selectionwindow.
NE W TA B L E RE S U LT WI N D O W
When clicked, a new Table Result window displays. This can be used todisplay a table showing, for example, results of a query. You can populatethe Table Result window, once Managed Objects have been selected, bydragging a Preset from the Preset Selection window.
NE W CH A R T RE S U LT WI N D O W
When clicked, a new Chart Result window displays. This can be used todisplay a chart showing, for example, results of a query. You can populatethe Chart Result window, once Managed Objects have been selected, bydragging result data from another window.
NE W CH A R T BU I L D E R WI N D O W
When clicked, a new Chart Builder window, consisting of the Chart BuilderWizard displays, which can be used to define a new chart format. You cando this, for example, by dragging result data from another window, or aPreset from the Preset Selection window. This data is then be used in bythe Chart Builder Wizard, as the basis for you to use to construct the newchart layout.
NE W PR E S E T ED I TO R
When clicked, a new Preset Editor window displays, which can be used todefine a new Preset. This can be done, for example, by dragging an existingPreset from the Preset Selection window, and editing it accordingly, beforesaving the new definition under a new name.
EX I T
When clicked, the QuantiQa Client application closes.
9
The Main Menu

QuantiQa Client User Manual Part 1
NOTE:
For further details about each of the dialogs and windows listed in theNew menu, please refer to the appropriate chapter, or section, in thisManual.
SELEC T A NEW MENU COM MA NDTo select from the New menu:
1. Click New.
Result: The New menu displays.
2. Click the required command.
Result: The appropriate tool dialog, or result window, displays, or you exit QuantiQa Client.
THE VIEW MENU
FI G U R E 3.3: TH E V I E W ME N U .
The View menu is a selectable list of all the toolbars and windows that areavailable within the Main Window. This list enables you to display, or hide,any QuantiQa Client window or toolbar, or to locate one, for example, if itcannot immediately be seen on your screen.
10

User Defined windows, created using the New menu commands, are alsoincluded in a separate dropdown list, accessible through the Windows listitem. You cannot however, use the View menu to hide User Definedwindows.
View menu list items, which are already displayed on your screen, havetheir icon highlighted with, for example, a blue background.
THE VIEW MENU LISTThe View menu includes the following:
• Toolbars.
• Console.
• (Drill Down Config.).
• Drill Down Filter.
• Drill Down Ticket Finder.
• Alarm List.
• Alarm Log.
• (Table Tester).
• Main Selection.
• MO Selection.
• Counters Selection.
• Preset Selection.
• Dashboard.
• Windows.
NOTE:
For further details about each of the windows and dialogs listed in theView menu, please refer to the appropriate chapter, or section, in thisManual.
IMPORTANT:
Although they display in the View menu, the Drill Down Config. andTable Tester items are currently for development purposes only, andare not available for use by QuantiQa Client users, at the presenttime. No further information about these items is provided here.
Details of the Alarm List and Alarm Log windows, as well as theDashboard, are given in separate documentation to this QuantiQaClient User Manual, and are not described further here. For moreinformation, please contact your CommProve representative.
11
The Main Menu

QuantiQa Client User Manual Part 1
NOTE:
Please refer to Figure 3.3: The View Menu, for the icon that isassociated with each View menu item.
TO O L B A R S L I S T
F I G U R E 3 .4: TH E TO O L B A R S L I S T.
The Toolbars list includes all QuantiQa Client toolbars:
• Menu Bar (Main Menu).
• New.
• Status Bar.
• Time Grid.
NOTE:
For further details about each of the toolbars listed under Toolbars,please refer to the appropriate chapter, or section, in this Manual.
If a toolbar is visible, a highlighted check mark ( ) displays, next its name inthe Toolbars list, with the exception of the Time Grid (which has its ownicon). If a toolbar is active, but hidden, it will reappear in its stored location,when QuantiQa Client is restarted.
WI N D O W S LI S T
FI G U R E 3.5: AN EX AM P L E OF A WI N D O W S SE L E C TAB L E L I S T.
The Windows list includes any User Defined windows that you havecreated in the current session. Windows are added automatically to the list,as they are generated. Figure 3.5 is an example of how the Windows listappears.
12
DISPLAY, HIDE, OR LOCATE A VIEW MENU ITEMTo toggle the display of, or locate, a View menu item:
1. Click View.
Result: The View menu displays.
2. Click the required item.
3. If you have clicked either Toolbars, or Windows, click the requireditem, in the additional dropdown list.
Result: The item displays if it is not already visible, or is hidden(except for User Defined windows), or its window TitleBar is highlighted, to make it easier to locate.
THE TOOLS MENU
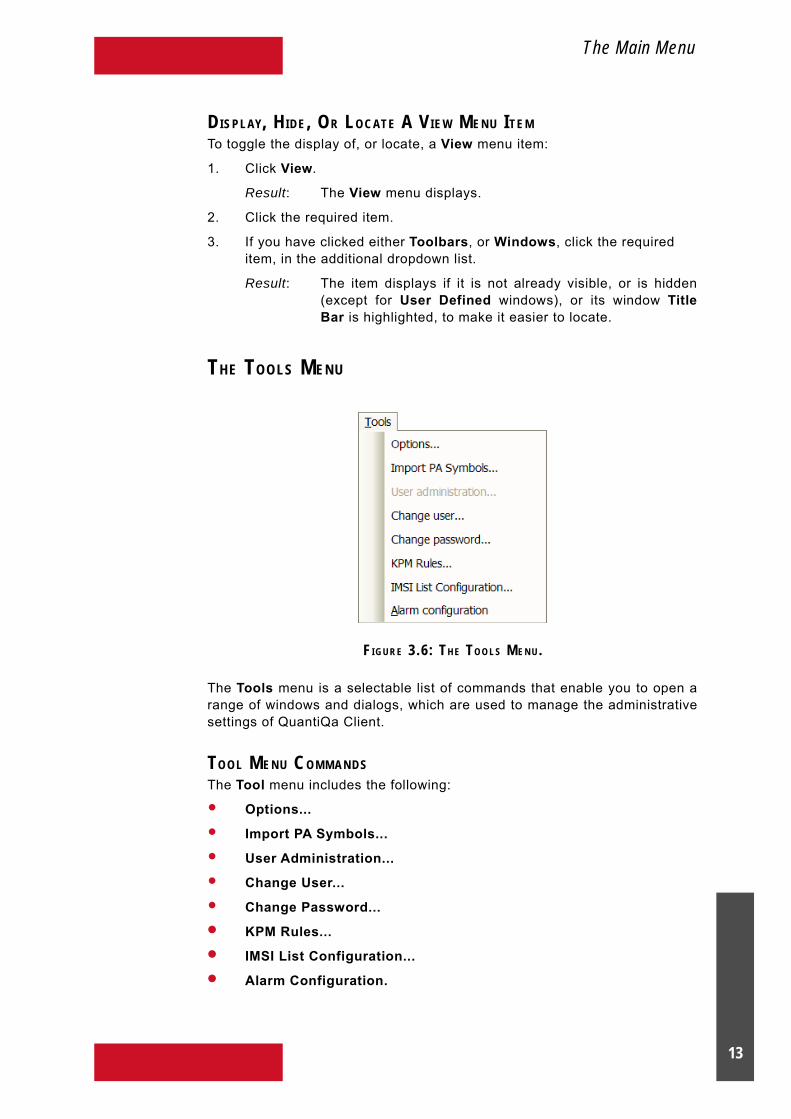
FI G U R E 3 .6: TH E TO O L S M E N U.
The Tools menu is a selectable list of commands that enable you to open arange of windows and dialogs, which are used to manage the administrativesettings of QuantiQa Client.
TOOL MENU COM M ANDSThe Tool menu includes the following:
• Options...
• Import PA Symbols...
• User Administration...
• Change User...
• Change Password...
• KPM Rules...
• IMSI List Configuration...
• Alarm Configuration.
13
The Main Menu

QuantiQa Client User Manual Part 1
OP T I O N S. . .When clicked, the Options window displays. This enables you to manage,for example, different Protocol Analyzer and Application settings.
IM P O R T PA SY M B O L S. . .When clicked, the Import PA Symbols window displays. This enables you,for example, to load a file containing name definitions for point code pairs.
US E R AD M I N I S T R AT I O N . . .When clicked, the User Administration window displays. This enables you,for example, to create User Groups, and define User Rights. In Figure 7,User Administration... appears gray, which indicates that the current userdoes not have the User Rights to access the User Administration window.
This QuantiQa Client User Guide does not include, in detail,information about how to define User Rights. For further information,please contact your system administrator, or your CommProverepresentative.
CH A N G E US E R.. .When clicked, the QuantiQa Client System Login dialog displays. Thisenables a different user to log on and use the QuantiQa Client application.
CH A N G E PA S S W O R D.. .When clicked, the Please Change Password dialog displays. This enablesyou to change your Password.
KPM RU L E S. . .
Details of the KPM Rules functionality are provided in separatedocumentation to this QuantiQa Client User Manual, and are notdescribed further here. For more information, please contact yourCommProve representative.
IMSI L I S T CO N F I G U R AT I O N. . .
Details of the IMSI List Configuration functionality are provided inseparate documentation to this QuantiQa Client User Manual, andare not described further here. For more information, please contactyour CommProve representative.
14

AL A R M CO N F I G U R AT I O N.
Details of the Alarm Configuration functionality are provided inseparate documentation to this QuantiQa Client User Manual, andare not described further here. For more information, please contactyour CommProve representative.
NOTE:
For further details about each of the windows and dialogs listed in theTools menu, except for those described in other documentation, asexplained previously, please refer to the Tools chapter, in this Manual.
SELECT A TOOLS MENU COMM A NDTo select from the New menu:
1. Click Tools.
Result: The Tools menu displays.
2. Click the required command.
Result: The appropriate tool window or dialog displays.
THE HELP MENU
FI G U R E 3.7: TH E HE L P ME N U.
The Help menu is a selectable list, which enables you to access a range ofQuantiQa Client documentation.
NOTE:
Some documentation may be client specific, and only available tothem.
You can also display information about the version of QuantiQa Client thatyou are using.
15
The Main Menu

QuantiQa Client User Manual Part 1
TH E HELP MENU LISTThe Help menu list includes the following:
• User Guide.
• A Interface Ticket Description.
• Abis Interface Ticket Description.
• About QuantiQa.
US E R GU I DE
When clicked, the QuantiQa Client User Manual displays, in *.pdf format.
A IN T E R FA C E TI C K E T DE S C R I PT I O N
When clicked, A Interface Ticket Description documentation displays, in *.pdfformat.
AB I S IN T E R FA C E TI C KE T DE S C R I PT I O N
When clicked, Abis Interface Ticket Description documentation displays, in*.pdf format.
AB O U T QU A N T IQA
When clicked, details about the version of QuantiQa Client that you areusing, display.
NOTE:
For further details about the contents of each document in the Helpmenu list, please refer to the document itself.
SELEC T A HELP MENU ITEMTo select from the Help menu:
1. Click Help.
Result: The Help menu displays.
2. Click the required document, or About QuantiQa.
Result: The appropriate document, or the QuantiQa ClientVersion Information window displays.
16

Toolbars
This chapter describes the QuantiQa Client Toolbars. By default, thesedisplay beneath the Main Menu. You can however, reposition the toolbarsanywhere on your screen, as described in “Chapter 2, QuantiQa ClientMain Window, Move The Main Menu, A Toolbar, or A Window”.
QuantiQa Client includes the following toolbars:
• New.
• Time Grid.
THE NEW TOOLBAR
FI G U R E 4 .1: TH E N E W TO O L B A R .
The New toolbar functions in a similar way to the New menu, in the MainMenu, and enables you to open new tool dialogs and result windows or, forexample, create charts and presets. The resultant windows are referred tohere, as User Defined windows.
The New toolbar consists of a series of buttons, together with a downwardsfacing arrow, which provides access to a list of current User Definedwindows.
NEW TOOLBAR BUTTON SThe New toolbar includes the following buttons:
• Procedure List.
• Protocol Analyzer.
• Trace Diagram.
• Map Result Window.
• Table Result Window.
• Chart Result Window.
• Chart Builder.
• Preset Editor.
17
4

QuantiQa Client User Manual Part 1
NOTE:
For a description of the results of clicking individual toolbar buttons,please refer to, for example, New Procedure List, or New MapResult Window and so on, under “The New Menu, New MenuCommands”, in “Chapter 3, The Main Menu”.
TIME GRID TOOLBAR
FI G U R E 4.2: TH E T I M E G R I D TO O L B A R.
The Time Grid toolbar enables you to configure the Result Output Period(ROP), and the query time interval(s) on a daily basis, for example, from3pm to 6pm and 8pm to 10pm. It consists of:
• The Mode button.
• The ROP Selection button.
• The Time Slot Selection grid.
TH E MODE BUTTON
FI G U R E 4.3: T H E MO D E BU T T O N .
The Mode button turns the defined time slots on, or off. To use:
1. Click the Mode button.
Result: The defined time slots are activated, the button icon ishighlighted, and the Time Slot Selection grid appearsgray, to indicate that it cannot be changed.
2. Click the Mode button again.
Result: The defined time slots are deactivated, the button icon isno longer highlighted, and the Time Slot Selection gridis available to define time slots.
18

THE ROP SELEC TION BUTTON
FI G U R E 4.4: AN EX A M P L E OF TH E ROP SE L E C T I O N B U T T O N.
The ROP Selection button allows you to select the ROP that is suitable foryour network configuration. Its appearance changes, according to the ROPcurrently selected. Possible ROP options are:
• 1 hour ROP.
• 30 minutes ROP.
• 15 minutes ROP.
• 5 minutes ROP.
To use:
1. Click the ROP Selection button.
Result: A dropdown list of ROP selection options displays.
FI G U R E 4 .5: TH E ROP SE L E C T I O N DR O P D O W N L I S T.
2. Select the desired ROP.
Result: The dropdown list closes, and the ROP Selection buttonchanges, to reflect the chosen ROP.
NOTE:
Exactly how data is displayed for the selected ROP, depends on theactual ROP duration that is acquired from the server.
19
Toolbars

QuantiQa Client User Manual Part 1
TH E TIME SLOT SELECTION GRID
The Time Slot Selection grid with a 1 hour ROP selected.
The Time Slot Selection grid with a 30 minute ROP selected.
The Time Slot Selection grid with a 15 minute ROP selected.
The Time Slot Selection grid with a 5 minute ROP selected.
FI G U R E 4 .6: E X A M P L E S O F T I M E SL O T SE L E C T I O N GR I D .
NOTE:
The Time Slot Selection grid displays a scroll bar, as required, toallow you to see the full 24 hour period.
The Time Slot Selection grid enables you to define the query timeinterval(s) for the selected day. A 24 hour period is subdivided into differentnumbers of selectable time slots, according to the ROP that has beenchosen.
• A 1 hour ROP results in 24 time slots.
• A 30 minute ROP results in 48 time slots.
• A 15 minute ROP results in 96 time slots.
• A 5 minute ROP results in 288 time slots.
DEFINE A QUERY TIME INTERVALTo define a query time interval:
1. Do one of the following:
I. Click, within the Time Slot Selection grid, on an individual timeslot when the query should start.
II. Press <CTRL> and click further time slots as required.
III. Release <CTRL> when finished.
or:
I. Click and hold the left mouse button, over the first time slot in atime interval, then drag your mouse, until you come to the lasttime slot of the required period.
II. Release the left mouse button.
20

3. Press <CTRL> and repeat step 1, until you have defined all requiredquery time intervals for the selected day.
Result: All time slots, which make up each individual query timeinterval, are highlighted in red, to show that they havebeen selected.
NOTE:
When you use the Time Slot Selection grid to define query selectionintervals for a particular day, they do not have to be consecutive, andcan take place any time during the 24 hour period.
21
Toolbars

QuantiQa Client User Manual Part 1
22

Windows and Panels
This chapter describes the features common to most QuantiQa ClientWindows and Panels. For details about individual windows, please refer tothe appropriate chapter, or section, in this QuantiQa Client User Manual.
By default, windows display within the Main Window, in the area beneaththe toolbars. Windows may however, be docked within the Main Window, orfloating, allowing you to reposition them anywhere on your screen, asdescribed in “Chapter 2, QuantiQa Client Main Window, Move The MainMenu, A Toolbar, or A Window”.
TYPES OF WINDOW
The QuantiQa Client has two main types of window:
• Dialog, or Default windows.
• User Defined windows.
DIALOG, OR DEFAULT WINDOWSDialog, or Default windows are where you make selections, or entercommands, which allow you, for example, to access a server, or configure aquery. They are available as soon as you have logged on, and cannot beclosed, although they may be hidden.
SH O W OR HI D E A DE FA U LT WI N D O W
The visibility of Default windows is controlled by using the View menu. Forfurther details please refer to “Chapter 3, The Main Menu, The ViewMenu”. You may also do the following:
1. Click the X button, positioned to the left of the window's Title Bar.
Result: The Default window is hidden.
As an alternative, you can follow the steps given in the next section,Current Windows list.
CU R R EN T WI N D O W S LI S T
You can access a selectable list of all current windows from the Title Bar ofa Default window.
1. Right click the window's Title Bar.
Result: The list of all current windows displays.
2. Select a window.
Result: If the window is hidden, it displays. If it is already visible, itis hidden.
23
5

QuantiQa Client User Manual Part 1
PA N E L S
Certain windows, especially the Main Selection window, include collapsiblePanels. These allow you to configure, for example, individual elements of aquery, such as the date, or time slot. Panels are docked within their parentwindow, and move, or are hidden, with them.
USER DEFINED WIN DOWSThese are the windows created by you, the user, during a QuantiQa Clientsession. They are, for example, tool dialog and result windows, or windowsand wizards that are used to define new charts and presets. User Definedwindows are only valid for the current session, and may be closed prior toits end, when you have finished using them.
User Defined windows are created, for example, by using the New menu.For further details please refer to “Chapter 3, The Main Menu, The NewMenu”.
You can display a hidden User Defined window from the View menu. Youcannot however, hide such a window from the View menu. You can alsodisplay a hidden window by using the Current Window list, as described inthe previous section, Dialog, Or Default Windows.
TH E US E R DE F I NE D WI N D O W TI T L E BA R
Focus State Icon
Options Button
Close Button
FI G U R E 5 .1: TH E U S E R DE F I N E D W I N D O W T I T L E B A R.
Besides the window's name, the User Defined window Title Bar includes:
• The Close button.
This button permanently closes the User Defined window. It you needit again in the future, you must recreate it.
• The Options button.
This button enables you to hide the User Defined window, change itspositioning setting, or check its current state. To use, do the following:
1. Click the Options button.
Result: The Options dropdown list displays.
FI G U R E 5.2: T H E OP T I O N S DR O P D O W N L I S T.
24

2. Select one of the following:
○ Floating.
Changes the window to a floating window, which can bepositioned as required.
○ Dockable.
Displays the Main Window docking areas when the window isdragged.
○ Tabbed.
Positions the window in a fixed location, within the Main Window,and displays it as a tabbed window. To see the positioning oftabbed windows, please refer to Chapter 1, QuantiQa ClientMain Window, Figure 1: QuantiQa Client Main Window.
○ Autohide.
Appears gray, to indicate that this feature is not currentlyavailable.
○ Hide.
Hides the window.
You can also display the Options dropdown list as follows:
1. Right click the window's Title Bar.
Result: The Options dropdown list displays.
• The Focus State icon.
The Focus State icon has three states, and changes its appearanceaccordingly:
○ The window is not in focus.
○ The window is still being loaded with data.
○ The window is ready and in focus.
25
Windows And Panels

QuantiQa Client User Manual Part 1
WIN DOWS WITH TABLES
Column Chooser Button Drag and Drop Area
FI G U R E 5 .3: E X A M P L E OF A TA B L E W I N D O W.
Table windows are laid out in a grid, with the top row displaying the headingfor each column. When a table is initially generated, the order of the rows isdetermined by the alphabetical order of the contents of the first column. Youmay however, rearrange the table contents in the following ways:
RO W AL P H A BE T I C A L OR DE R
The table can be sorted according to the contents of any column, inascending, or descending alphabetical order, as follows:
1. Click the heading of the appropriate column.
Result: The table is sorted according to the alphabetical order ofthat column.
CO L U M N OR DE R
The column order can be rearranged as follows:
1. Click and hold the mouse on a column heading.
2. Drag the heading to the place you want it, in the column order.
3. Release the mouse button.
Result: The column order is rearranged.
To hide a column:
1. Click and hold the mouse on a column heading.
2. Drag the heading outside the Table window.
24

3. Release the mouse button.
Result: The column is hidden.
NOTE:
The column can be restored, by using the Field Chooser, asdescribed later in this chapter.
CO L U M N WI D T H
To adjust the column width:
1. In the heading row, click and drag the column boundary line.
Result: The column width is changed accordingly.
CO L U M N GR O U P I N G
Columns may be ordered in a hierarchical group, to reorganize the table asrequired, by doing the following:
1. Click and hold the mouse on a column heading.
2. Drag the heading to the window's Drag and Drop Area.
3. Release the mouse button.
Result: The column is removed from the current table, anddisplays as a box, in the hierarchy shown in the Drag andDrop Area. This is the top level of the group, and the tabledisplay changes to represent the hierarchy.
4. Repeat steps 1 to 3 with other headings, positioning them as desired,in the hierarchy.
Result: The structure of the hierarchy is reflected in the tabledisplay, with each descending level of the group,representing a column, indented beneath its immediateparent.
The information listed within each hierarchical layer, can be displayed inascending or descending alphabetical order. To change the order:
1. Click the arrowhead, positioned to the right of the box that representsa column, in the Drag and Drop Area.
Result: The order of the information changes accordingly.
Each row in the hierarchy can be expanded, to show further information ifavailable, or collapsed, as follows:
1. Click "+", positioned to the left of the relevant row in the display, toexpand it, or "-", to collapse it.
Result: The information displayed, changes accordingly.
Columns can be returned to the original table, from the hierarchical group,as required.
25
Windows And Panels

QuantiQa Client User Manual Part 1
1. Do one of the following:
I. Click and hold the box representing the column in the Drag andDrop Area.
a. Drag the box back to the table column heading row.
b. Release the mouse button.
or:
II. Use the Field Chooser, as described in the following section.
Result: The column is returned to the table, and its headingdisplays in the column heading row.
FI G U R E 5 .4: EX A M P L E S OF CO L U M N GR O U P I N G .
26

TH E F I E L D CH O O S ER
FI G U R E 5 .5: TH E F I E L D C H O O S E R WI N D O W.
The Field Chooser displays a selectable list of all of those columns that arein the Drag and Drop Area, as well as any that are hidden. It can be used,for example, to restore columns to the table.
To restore a column:
1. Click the Column Chooser button, located in the toolbar at the top ofthe table window.
Result: The Field Chooser window displays.
2. Click and hold the Field Chooser list entry, which you want to restore.
3. Drag the entry to the desired position in column heading row.
4. Release the mouse button.
Result: The column is returned to the table, and it's headingdisplays in the column heading row.
OTH ER WINDOWSIn addition to the main types of window, QuantiQa Client displays, asrequired:
IN F O R M AT I O N WI N D O W S
These provide information only. They require no user interaction, apart from,perhaps, the need to click an OK, or Close button to continue.
DI A L O G S
These allow you to make selections, or enter commands, while you areusing the toolbars and the main types of window.
27
Windows And Panels

QuantiQa Client User Manual Part 1
28

Tools
This chapter describes the windows and dialogs that belong to the toolslisted in the Tools menu. For further information about the Tools menu andhow to use it, please refer to "Chapter 3, The Main Menu, The ToolsMenu".
The Tools menu provides access to the following windows and dialogs:
• Options...
• Import PA Symbols...
• User Administration...
• Change User...
• Change Password...
• KPM Rules...
• IMSI List Configuration...
• Alarm Configuration.
OPTIONS
FI G U R E 6.1: TH E O P T I O N S WI N D O W.
29
6

QuantiQa Client User Manual Part 1
The Options window initially displays a selection list, formatted in a treestructure, positioned to the left. The list includes:
• Protocol Analyzer.
○ General.
○ Fonts and Colors.
• Ticket Viewer.
NOTE:
The Ticket Viewer also includes a sub-category called General.However, this opens the same window as its parent list entry.
• Application.
To use:
1. Click a list item.
Result: The Options window refreshes, and in addition to theselection list tree, displays the controls for the list item,which you have selected.
PROTOC OL ANA LYZER
FI G U R E 6 .2: TH E OP T I O N S W I N D O W, W I T H TH E P R O T O C O L A N A LY Z E R L I S T I T E M S E L E C T E D .
NOTE:
If you select the Protocol Analyzer sub-category General, the samewindow as the one opened for its parent list entry displays.
30

The Options Protocol Analyzer, and Options Protocol Analyzer Generalwindows, display controls to the right, which are used to set the PDU CyclicBuffer and Range Buffer sizes.
The windows also include the following check boxes:
• Show filter msg in alphabetical order.
• Use "lamp" style check boxes in msg filters.
• Resolve NEID names in summary view.Provided that name resolution data is loaded locally, for example, froma *.csv file, or remotely from a GSP server, select this to enable nameresolution, if required, in the Protocol Analysis Summary.
NOTE:
For real-time protocol analysis, name resolution on an individual PDUbasis, may increase the time required to process data.
To use the Options Protocol Analyzer, and Options Protocol AnalyzerGeneral windows:
1. Click the arrowhead to the right of the box under PDU Cyclic BufferSize.
Result: A dropdown list of buffer sizes displays.
2. Select an appropriate buffer size from the dropdown list.
Result: The dropdown list closes, and the box is updated with thenew buffer size.
3. Click the arrowhead to the right of the box under PDU Range BufferSize.
Result: A dropdown list of buffer sizes displays.
4. Select an appropriate buffer size from the dropdown list.
Result: The dropdown list closes, and the box is updated with thenew buffer size.
5. Select the check boxes that you require.
6. Click OK to proceed (or Cancel to abort).
Result: The Options Protocol Analyzer, or Options ProtocolAnalyzer General window closes, and the applicationsettings are updated.
31
Tools

QuantiQa Client User Manual Part 1
PROTOC OL ANA LYZER FON TS AND COLORS
FI G U R E 6 .3: TH E OP T I O N S W I N D O W, W I T H TH E P R O T O C O L A N A LY Z E R FO N T S A N D C O L O R S L I S T I T E M SE L E C T E D .
The Options Protocol Analyzer Fonts and Colors window displayscontrols to the right, which are used to set the downlink and uplinkbackground, and foreground colors. To use:
1. Click the arrowhead to the right of the Background box underDownlink Colors.
Result: A color selection dialog displays.
2. Select a color as required, or define a custom color.
Result: The dropdown list closes, and the box is updated todisplay the chosen color.
3. Repeat steps 1 and 2 as required, for the Downlink Colors,Foreground, and Uplink Colors, Background and Foregroundselections.
4. Click OK to proceed (or Cancel to abort).
Result: The Options Protocol Analyzer Fonts and Colorswindow closes, and the application settings are updated.
32

TICKET VIEWER
FI G U R E 6 .4: TH E O P T I O N S W I N D O W, W I T H TH E T I C K E T V I E W E R L I S T I T E M S E L E C T E D .
The Options Ticket Viewer window displays controls to the right, which areused to set the Ticket Cyclic Buffer and Ticket Range Buffer sizes.
If the Flatten All Fields check-box is selected, tickets display in a formatsimilar to that of earlier versions of QuantiQa Client. The hierarchical ticketview, which is available when using the advanced ticket filteringfunctionality, is disabled.
NOTE:
For further details about advanced ticket filtering, please refer tothe “QuantiQa Client User Manual, Part 2”.
To use the Options Ticket Viewer window:
1. Click the arrowhead to the right of the box under Ticket Cyclic Buffer.
Result: A dropdown list of buffer sizes displays.
2. Select an appropriate buffer size from the dropdown list.
Result: The dropdown list closes, and the box is updated with thenew buffer size.
3. Click the arrowhead to the right of the box under Ticket Range Buffer.
Result: A dropdown list of buffer sizes displays.
4. Select an appropriate buffer size from the dropdown list.
Result: The dropdown list closes, and the box is updated with thenew buffer size.
33
Tools

QuantiQa Client User Manual Part 1
5. Select Flatten All Fields, if required.
6. Click OK to proceed (or Cancel to abort).
Result: The Options Ticket Viewer window closes, and theapplication settings are updated.
APPLICATION
FI G U R E 6 .5: TH E O P T I O N S W I N D O W, W I T H TH E AP P L I C AT I O N L I S T I T E M S E L E C T E D .
The Options Application window displays, with the following check boxesto the right:
• Use cache.
This check box is redundant, and no longer functions.
• Auto Sync Ticket definition at login.
Enables auto-synchronization of ticket definitions, when logging on toa GSP server. Users who do not require the ticket analysisfunctionality, can disable this feature, and so avoid the extra waitingtime, during login.
• Auto Sync PDU NEID at login.
Enables auto-synchronization of PDU NEID, when logging on to aGSP server. Users who do not require the ticket analysis functionality,can disable this feature, and avoid downloading the NEID list for PDUanalysis.
34

• Auto Sync PDU NEID Symbols at login.
Enables auto-synchronization of name resolution data, for pointcodepairs, to MSC, BSC and LACs to BSCs, when logging on. For furtherinformation, please refer to the Import PA Symbols section, later inthis chapter.
• Use SSL with stats server.
Provided to support SSL related developments.
• Use SSL with ddserver.
Provided to support SSL related developments.
Ticket Definition And PDU NEID Sync enables you to set a timeout, inseconds, which is applied when the system synchronizes PDU NEIDs andticket definitions. In this way, potentially long waits can be avoided.
To use the Options Application window:
1. Select the check boxes that you require.
2. If you want to set a timeout for PDU NEIDs and ticket definitionsynchronization:
I. Click the arrowhead, positioned to the right of the drop-down list,in the Ticket Definition And PDU NEID Sync field.
II. Select a timeout setting from the list.
3. Click OK to proceed (or Cancel to abort).
Result: The Options Application window closes, and theapplication settings are updated.
35
Tools

QuantiQa Client User Manual Part 1
MAP RESULTS
FI G U R E 6 .6: TH E O P T I O N S W I N D O W, W I T H TH E MA P RE S U LT S L I S T I T E M S E L E C T E D .
The Options Map Results window displays, with the following TimingAdvance Radius and NaN painting selection choices to the right:
• 2G timing advance.
Allows you to choose either the default timing advance radius settingof 550 meters, or define a custom setting.
• 3G propagation distance.
Allows you to choose the preset propagation distances, of 117 meters,or 234 meters, or define a custom setting.
• Suppress NaN painting on maps.
The settings are saved and applied to existing and future maps, includingthose generated in new sessions, until the settings are changed.
To use the Options Map Results window:
1. To select the 2G timing advance, do one of the following:
I. Click 550 to accept the default setting.
or:
I. Click Other.
II. Enter the required setting in the text box.
36

2. To select the 3G propagation distance, do one of the following:
I. Click either 117 or 234 to accept a default setting.
or:
I. Click Other.
II. Enter the required setting in the text box.
3. Select the check box to suppress NaN painting on maps, if required.
3. Click OK to proceed (or Cancel to abort).
Result: The Options Map Results window closes, and themap results settings are updated, together with any existing maps.
IMPORT PA SYMBOLS
FI G U R E 6.7: TH E IM P O R T PA SY M B O L S WI N D O W.
The Import PA Symbols window displays controls that are used load alocally stored *.csv formatted file, which contains the name resolutiondefinitions for pointcode pairs, to MSC, BSC and LACs to BSCs. As a result,names display instead of numbers, when the the NEID list isresynchronized.
Once a file has been loaded locally, an administrator with the appropriateUser Rights, can store the name resolution definitions on a GSP server.Other users may then receive them automatically, when they log on to thatserver.
37
Tools

QuantiQa Client User Manual Part 1
To use the Import PA Symbols window:
Complete the following steps, to load a *.csv formatted file locally, using thecontrols within the A Interface Point Codes panel, or the A-bis InterfaceLAC/CI panel, according to the type of interface in question.
1. Click ..., positioned to the right of the Import File input field.
Result: A Windows Explorer window displays.
2. Navigate to the folder where the *.csv formatted file is stored on yourcomputer.
4. Select the appropriate file.
5. Click Open.
Result: The path to the *.csv formatted file displays in the ImportFile input field.
6. Click Load.
Result: The definitions contained in the *.csv formatted file areloaded, and the list to the right of the window, is updated.
7. Repeat steps 1 to 5, to add further definitions, and click Add eachtime, to load them.
8. Click OK to proceed (or Cancel to abort).
Result: The Import PA Symbols window closes, and theapplication settings are updated.
STOR E NA ME RESOLUTION DEFIN IT ION S ON A SERVERTo store the name resolution definitions on a server:
1. When you have completed steps 1 to 7 above, select the definitionsyou require, from the list to the right of the window.
2. Click Store.
Result: The definitions are uploaded to the server.
3. Click OK to proceed (or Cancel to abort).
Result: The Import PA Symbols window closes, and theapplication settings are updated.
MANU ALLY DOWNLOA D DEFIN IT IONS FROM A SERVERTo manually download definitions from the server:
1. Click Retrieve.
Result: The definitions are downloaded from the server, andstored locally.
2. Click OK to proceed (or Cancel to abort).
Result: The Import PA Symbols window closes, and theapplication settings are updated.
38

AUTOMATIC ALLY DOWNLOA D DEFIN IT IONS FROM A SERVERTo automatically download name resolution definitions from a server:
1. Click Tools, in the Main Menu.
Result: The Tools menu displays.
2. Select Options.
Result: The Options window displays.
3. Select Application from the list in the Options window.
Result: The Application check box list displays.
4. Select Auto Sync PDU NEID Symbols at login.
5. Click OK to proceed (or Cancel to abort).
Result: The Options Application window closes, and theapplication settings are updated to automatically downloadname resolution definitions from a server.
CHANGE USER
FI G U R E 6.8: TH E S Y S T E M LO G I N D I A L O G.
The Change User tool opens the System Login dialog, and allows adifferent user to enter their user name, and password, to log on to QuantiQaClient.
39
Tools

QuantiQa Client User Manual Part 1
CHANGE PASSWORD
FI G U R E 6.9: TH E P L E A S E C H A N G E PA S S W O R D D I A L O G.
The Please Change Password dialog and allows you to define a newpassword. To use:
1. Type your old password in the Old entry field.
2. Type your new password in the New Password entry field.
3. Retype your new password in the Confirm New entry field.
4. Click OK to proceed (or Cancel to abort).
Result: The Please Change Password dialog closes, and yourpassword is changed.
NOTE:
Passwords must include at least one uppercase character, and aspecial character or number.
40

KPM RULES
FI G U R E 6.10: TH E KPM RU L E AD M I N I S T R AT I O N W I N D O W.
Details of the KPM Rules functionality are provided in separatedocumentation to this QuantiQa Client User Manual, and are notdescribed further here. For more information, please contact yourCommProve representative.
IMSI LIST CONFIGURATION
FI G U R E 6.11: TH E IMSI L I S T C O N F I G U R AT I O N W I N D O W.
Details of the IMSI List Configuration functionality are provided inseparate documentation to this QuantiQa Client User Manual, andare not described further here. For more information, please contactyour CommProve representative.
41
Tools

QuantiQa Client User Manual Part 1
ALARM CONFIGURATION
FI G U R E 6.12: TH E AL A R M AN D RE P O R T CO N F I G U R AT I O N WI N D O W.
Details of the Alarm Configuration functionality are provided inseparate documentation to this QuantiQa Client User Manual, andare not described further here. For more information, please contactyour CommProve representative.
42

Default Windows
Default windows are the main user input interface with the QuantiQa Clientapplication. They are accessible as soon as you log on, and are alwaysavailable while QuantiQa Client is running. The Default windows include:
• The Main Selection window.
• The MO Selection window.
• The Preset Selection window.
• The Counters Selection window.
• The Ticket Finder window.
• The Drill-Down Filter window.
The Default windows are presented in the following chapters, in the logicalsequence in which they are generally used.
DISPLAY A DEFAULT WINDOW:If a default window cannot be found:
1. Do one of the following:
I. Click View > Window Name.
or:
I. Right-click the Title Bar of any other default window.
II. Select the Window Name in the drop-down list.
Result: The windows displays.
43
7

QuantiQa Client User Manual Part 1
44
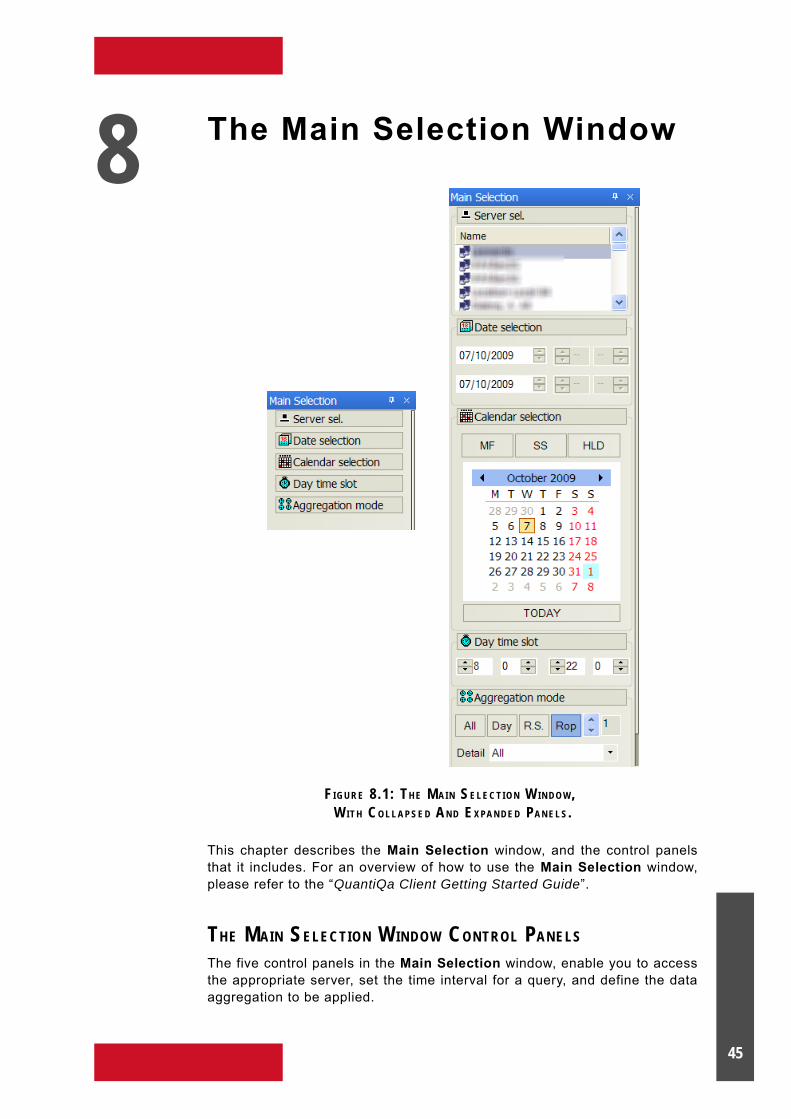
The Main Selection Window
FI G U R E 8.1: TH E M A I N S E L E C T I O N W I N D O W, W I T H CO L L A P S E D A N D E X PA N D E D PA N E L S.
This chapter describes the Main Selection window, and the control panelsthat it includes. For an overview of how to use the Main Selection window,please refer to the “QuantiQa Client Getting Started Guide”.
THE MAIN SELECTION WINDOW CONTROL PANELS
The five control panels in the Main Selection window, enable you to accessthe appropriate server, set the time interval for a query, and define the dataaggregation to be applied.
45
8

QuantiQa Client User Manual Part 1
The panels are:
• Server Selection.
Access the appropriate server and database.
• Date Selection.
Select the query start and end dates, using input fields.
• Calendar Selection.
Select the query start and end dates, using a calendar display.
• Day Time Slot.
Select the time interval for a query, for the selected day.
NOTE:
The Day Time Slot panel can only be used to select a continuous timeinterval. To define multiple time intervals for the same day, the TimeGrid Toolbar should be used. For further information about the TimeGrid Toolbar, please refer to the “Toolbars” chapter of this Manual.
• Aggregation Mode.
Define the required level of Result Output Period (ROP) aggregation.
EXPAN D OR COLLA PSE A CONTROL PANELTo toggle the visibility of a control panel:
1. Click the panel's Title Bar.
Result: The panel expands or collapses accordingly.
THE SERVER SELECTION PANEL
FI G U R E 8.2: T H E SE R V E R SE L E C T I O N PA N E L .
The Server Selection panel displays at the top of the Main Selectionwindow, and consists of the Server Selection list. This is populated whenyou start QuantiQa Client, and contains information extracted from theserver.cfg file, related to available servers.
NOTE:
Even if a server is listed as being available, this does not mean that itis currently accessible.
46

ACCESS A SERVERTo access a server:
1. Set a valid query date, using either the Date Selection panel, or theCalendar Selection panel.
NOTE:
By setting a valid query date before selecting a server, and providedthat the server connection is successful, you ensure that the MOSelection window is populated with a list of all relevant managedobjects.
For further information about the Date Selection panel, or the CalendarSelection panel, please refer to the relevant sections, later in this chapter.For further information about the MO Selection window, please refer to the"MO Selection Window" chapter, later in this Manual.
2. Double left-click the Server Name in the Server Selection list.
Result: If the connection is successful, the Monitor Icon next tothe Server Name is highlighted, and QuantiQa Client isready to access and process the network data.
NOTE:
There may be a slight delay between clicking the Server Name, andthe Monitor Icon being highlighted. This is due to several factors,including the network configuration, available bandwidth, and so on.
UNSU CC ESSFU L SERVER ACCESSIf the connection is not successful:
1. Check that the server is running, and/or connected to the rightnetwork.
2. Check that the workstation is connected to the right network, and/orthat its network configuration parameters are correct.
If the server that you wish to access is not displayed in the Server List, orthe list is empty, as a first step:
1. Ensure that the server.cfg file contains all the details for the requiredserver(s).
2. Ensure that the server.cfg file table is correctly aligned and tabbed.
You must restart QuantiQa Client, after making any changes to theserver.cfg file.
For further information about the server.cfg file, please refer to “Appendix1: The Server Configuration File”.
47
The Main Selection Window

QuantiQa Client User Manual Part 1
THE DATE SELECTION PANEL
FI G U R E 8 .3: TH E D AT E SE L E C T I O N PA N E L .
The Date Selection panel displays beneath the Server Selection panel,within the Main Selection window. It consists of two directly editable, oralternatively, scrollable date fields, which enable you to define the queryStart and End dates. The query End date can be the same as the Startdate, or later. To use:
1. Do one of the following:
I. Type the Start date in the top date field, using the format dd/mm/yyyy.
II. Type the End date in the lower date field.
or:
I. Scroll to the Start date, using the up and/or down arrowheads,positioned to the right of the top date field.
II. Scroll to the End date, using the up and/or down arrowheads,positioned to the right of the lower date field.
Result: The Start and End dates are set, and the CalendarSelection panel is automatically updated accordingly.
NOTE:
The Date Selection panel is used to define a single, continuous rangeof dates only. If you want to select multiple date ranges, or a group ofnon-continuous dates, you must use the Calendar Selection panel.
The Date Selection panel includes 2 additional scrollable fields,positioned to the right of each date field. These are currently inactive.
48

THE CALENDAR SELECTION PANEL
FI G U R E 8.4: T H E CA L E N D A R SE L E C T I O N PA N E L .
NOTE:
Not all of the Calendar Selection panel controls are described indetail here. Their use is generally very intuitive however, and requirelittle, if any explanation.
CALEN DA R SELECTION PANEL CONTR OL BUT TON SThe Calendar Selection panel includes the following buttons, positioned atthe top of the panel:
• MF button, representing Monday to Friday.
• SS button, representing Saturday and Sunday.
• HLD button, representing holidays.
If the selected calendar range covers a long period, these buttons may beused to exclude their relevant days from the query. The buttons arehighlighted, when active.
In addition, the Calendar Selection panel includes the Today button,positioned at the bottom of the panel. This is used to select today's date.
THE CALEN DA R SELEC TION PA NEL CALEND AR DISPLAYThe Calendar display is the main query date selection interface. When acalendar date range is selected, it is highlighted on the Calendar display inorange. If the current month is displayed, today's date is highlighted by asquare, with no fill color, unless today's date is part of a selection, in whichcase, the fill color will also be orange.
49
The Main Selection Window

QuantiQa Client User Manual Part 1
SELEC T A CALEND AR DAT E RANGEThe following are examples of how you can select a calendar date range.
CH A N G E TH E MO N T H
1. Do one of the following:
I. Click the left, or right facing arrowhead, positioned on either sideof the month’s name.
Result: The month scrolls accordingly.
or:
I. Click and hold the left mouse button over the month’s name.
Result: A selectable list of months displays.
II. Scroll up, or down the list, while still holding the mouse button.
III. Release the mouse button, when it is over the appropriatemonth.
Result: The chosen month displays.
SE L EC T A DAT E OR DAT E RA N G E
To select, or deselect a date:
1. Click the date in the Calendar display.
Result: The date is selected or deselected accordingly.
To select a range of dates:
1. Do one of the following:
I. Click one date in the Calendar display.
II. Press and hold <SHIFT> while clicking further dates.
III. Release <SHIFT> when finished.
Result: The range of dates is selected.
or:
I. Click and hold the left mouse button over one date in theCalendar display.
II. Drag the mouse, while still holding the left button, to includefurther dates.
III. Release the mouse when finished.
Result: A continuous range of dates is selected.
IV. Repeat steps I. to III. to select further date ranges.
NOTE:
When a calendar date range is selected, the Date Selection panel isautomatically updated. However, if the calendar date range is notcontinuous, the Date Selection panel is disabled, as it cannot be usedto define non-continuous ranges of dates.
50

THE DAY TIME SLOT PANEL
FI G U R E 8 .5: TH E D AY T I M E S L O T S E L E C T I O N PA N E L .
The Day Time Slot Selection panel is used to define a single, continuousquery time interval, for each date selected. It consists of two directlyeditable, or alternatively, scrollable time selection fields, which enable youto define the query Start and End times. The start and end times aredisplayed in hours and minutes. To use:
1. Select the Result Output Period (ROP) that is suitable for yournetwork configuration, using the ROP Selection button on the TimeGrid toolbar.
NOTE:
The ROP determines the data retrieval frequency. For example, if theROP is 1 hour, the data retrieval interval can only be set in multiples ofone hour. But if the ROP is 30, 15, or 5 minutes, the data retrievalinterval can be set to multiples of the respective, and as a result,shorter time unit.
If the Result Output Period (ROP) is set to 1 hour, the minute selectiondisplay appears gray.
For further information about selecting the ROP, please refer to the“Toolbars” chapter of this Manual, or the “QuantiQa Client Getting StartedGuide”.
2. Do one of the following:
I. Type the Start time in the left-hand time field.
II. Type the End time in the right-hand time field.
or:
I. Scroll to the Start time, using the up and/or down arrowheads,positioned to the right of the left-hand time field.
II. Scroll to the End time, using the up and/or down arrowheads,positioned to the right of the right-hand time field.
Result: The Start and End times are set, and the Time Grid toolbardisplays the query time interval selected, as a red band.
NOTE:
The Day Time Slot panel can only be used to configure a single,continuous interval. If you require multiple time intervals for the sameday, you must use the Time Slot Selection grid to define them.
For further information about the Time Slot Selection grid, please refer tothe “Toolbars” chapter of this Manual, or the “QuantiQa Client GettingStarted Guide”.
51
The Main Selection Window

QuantiQa Client User Manual Part 1
THE AGGREGATION MODE SELECTION PANEL
FI G U R E 8.6: T H E AG G R E G AT I O N MO D E SE L E C T I O N PA N E L .
The Aggregation Mode Selection panel is used to define the requiredamount of ROP aggregation. The statistical data, which is retrieved from theserver during each time interval, is accumulated according to the settingsmade in this panel.
TIME BASED AGGREGATIONThe Aggregation Mode Selection panel has the following buttons, to definetime based aggregation:
• All.
Accumulate the data as one value for the whole time interval.
• Day.
Accumulate the data as one value for each day of the time interval.
• Hour.
Accumulate the data for each ROP, throughout the whole time interval.
NOTE:
This results in no more than 24 values, when the ROP is set to 1 hour.
• ROP, together with a scrollable numeric field.
Accumulate the data based on the value set in the scrollable numericfield, for the time interval. For example, a setting of 1 accumulatesdata for every ROP, 2 aggregates data for 2 consecutive ROPs, andso on.
MO HIERARC H Y, HIERARC H Y LEVEL AN D PROPER TY BA SEDAGGREGATIONThe Aggregation Mode Selection panel includes a selectable dropdownlist, positioned to the right of the Detail field. This enables you to defineaggregation according to the hierarchical structure of the database, the levelwithin the hierarchy. or Managed Object properties. The contents of thedropdown list vary, according to the individual network configuration.
52

FI G U R E 8.7: AG G R E G AT I O N MO D E SE L E C T I O N PA N E L DR O P D O W N LI S T.
Many networks are subdivided into hierarchical groups. These may include,for example, networks, clusters, and members, or be far more complex,according to each individual operator's specific environment. QuantiQaClient allows data to be collected from each level of the hierarchy, andenables you to aggregate the results as required.
For example, you may want a report that summarizes the results of a queryat the cluster hierarchical level. QuantiQa Client adds all cluster memberdata together, and presents the cluster totals in the report. Aggregation atthe network level is carried out in the same way, while individual memberinformation remains available from the database, if required.
HI E R A R C H I C A L LE V E L S
The hierarchical levels that are supported vary according to each cellularnetwork, combined with the type of data being monitored, and the collectionmethods being deployed. However, one common hierarchy that is supportedfor most networks is:
Controller > Cell Sector > TRX.
These hierarchy levels in particular, provide essential quality and locationinformation, within the radio network. Other hierarchies may include, forexample, cell neighbor relationships, or other interactions with networkequipment, such as Mobile Switching Centers (MSC) and Home LocationRegisters (HLR).
53
The Main Selection Window

QuantiQa Client User Manual Part 1
EX A M PL E OF HI E R A R C H I C A L LE V E L S
In the following example, a BSC > Cell > TRX hierarchy is described. TheDetail dropdown list displays the following entries:
• BSC.
Query results are reported at BSC level (one result for each uniqueBSC selected).
• Cell.
Query results are reported at Cell level (one result for each uniqueCell selected).
• TRX.
Query results are reported at TRX level (one result for each uniqueTRX selected).
• All.
Query results are reported as one single value, which includes theresults for all the Managed Objects selected.
RE-H O M I N G MA N A G E M E N T
An additional hierarchical level, Cell NOREHOM, may also be displayed inthe Aggregation Mode Selection dropdown list. This level enables you tomanage the re-parenting or re-homing of a cell, and allows measurements tobe displayed independent of the current parent MO.
FI G U R E 8.8: CE L L LE V E L AG G R E G AT I O N, DI S P L AY I N G TH E CE L L WI T H TW O PA R E N T MOS.
54

FI G U R E 8.9: CE L L NOREHOM LE V E L AG G R E G ATI O N, SH O W I N G TH E CE L L
IN D E P E N D E N T OF TH E PA R E N T MOS.
If cell measurements for each parent MO overlap, the sum of themeasurements is displayed.
NOTE:
If cell measurements are made, and then Cell NOREHOM is selected,only those measurements made following its selection are displayed.
NA M I N G HI E R A R C H I C A L LE V E L S
When a server connection entry is added to the Server Configuration file,you can specify a name for each of the hierarchical levels supported by therelevant database. These names subsequently display in the AggregationMode Selection panel dropdown list, and are included in any report that isgenerated.
The names for the hierarchical levels are added to the @smoplm column ofthe Server Configuration file (server.cfg). You can use any name in the@smoplm column, as required. As a result, database names that areperhaps less understandable, are translated to an immediately recognizedterm, of your own choosing, when displayed on-screen, or included inreports.
If no name is specified, the default that is applied is PARENT,NAME. Thiscorrelates to BSC and Cell, as defined by the default RADIOQOS hierarchy.
For further information about the server.cfg file, please refer to the"QuantiQa Client User Manual Part 2"
PR O P E R T I E S
Property based aggregation allows you to query the database, and view theresults for a hierarchy, or hierarchical level, organized according to definedMO properties, such as the technology used, or geographical location.
Property-based aggregation entries in the Aggregation Mode Selectionpanel dropdown list, can be readily identified, through the '@' character atthe beginning of the name, for example, @Cell.Technology. In this instance,the hierarchical level is 'Cell', and 'Technology' is the property.
55
The Main Selection Window

QuantiQa Client User Manual Part 1
IMPORTANT: If a query is run using, for example, hierarchical levelaggregation, it can be rerun, with a different preset, if required.
If however, a query is run using Managed Object propertyaggregation, it will not possible to repeat it, without updating the MOlist from the server, and selecting the required MOs again. This isbecause after running a query that has been aggregated in this way,the MO Selection window displays a hierarchical list of MOproperties, rather than the MOs themselves.
As a result, if you attempt to repeat the query, a window, similar to thefollowing displays:
56

The MO Selection Window
FI G U R E 9 .1: TH E MO S E L E C T I O N W I N D O W.
This chapter describes the MO Selection window, the controls that itincludes, and the Managed Object list. For an brief introductory overview ofhow to use the MO Selection window, please refer to the “QuantiQa ClientGetting Started Guide”.
DISPLAY THE MO SELECTION WINDOW
If the MO Selection window is not visible:
1. Click the MO Selection tab.
Result: The MO Selection window displays.
If the MO Selection tab is not visible:
In the Main Menu bar, positioned at the top of the Main Window:
1. Click View > MO Selection.
Result: The MO Selection window displays.
THE MO SELECTION WINDOW
The MO Selection window consists of:
• The Title Bar.
• The MO Selection toolbar.
• The MO Profile and Group toolbar.
• The Column Drag & Drop area.
• The Managed Object list.
The following sections describe each of these components in further detail,starting with the Managed Object list.
57
9

QuantiQa Client User Manual Part 1
TH E MANA GED OBJECT LISTAfter a server, date range and time interval have been chosen in the MainSelection window, the MO Selection window displays the ManagedObjects (MO) that are included in the server's database during the perioddefined by the date and time parameters, together with their relevantproperties, in the Managed Object list. The Managed Objects areorganized as a selectable, alpha-numerical listing of top-level MOs, linkedas appropriate, to further MOs, through drop-down hierarchical lists.
By default, the top-level MOs represent the highest level of aggregationavailable (excluding the ALL option), for the hierarchy chosen in theAggregation Mode Selection panel. For example, the default RADIOQOShierarchy has ALL, BSC, Cell and TRX aggregation levels available. As aresult, BSC is selected as the initial aggregation level.
NOTE:
The MO Selection list can be aggregated according to MO properties,hierarchies, or hierarchy levels. For further information, please refer to"The Main Selection Window, The Aggregation Mode SelectionPanel", earlier in this Manual.
The MO properties that are displayed, vary according to the selectedhierarchy, or hierarchy level.
In addition to other details, an MO property list may also include itsgeographical co-ordinates. While this means, for example, that anyhierarchy, hierarchy level, or MO, may potentially be displayed on amap, this functionality is still being developed, and at the present time,it is limited to representing MOs as cell orientation sticks. For furtherinformation about cell sticks, please refer to "The Map ResultWindow", later in this Manual.
Although under normal circumstances, MO details are very consistent, withlittle, or no change, the relationship between managed objects and theselected time interval, is key to successfully querying the database, and theavailable results. As a result, whenever the time interval is changed, forexample, if you choose a new date range, QuantiQa Client performs a newdatabase query, and the MO Selection window is updated.
It is important to remember that:
• When an MO appears in the Managed Object list, this confirms boththat it exists, and is included in the database during the selected timeinterval. However, this does not mean that it is available for the wholeperiod.
• The contents of the MO Selection list depends upon a suitable andapplicable Results Output Period (ROP) being selected, for thenetwork concerned.
58

VIEWIN G MANAGED OBJECTSInitially, only the top-level MOs are displayed, as shown in "Figure 9.1". Toview the managed objects that are part of the hierarchical list associatedwith a top-level MO:
1. Click the '+' button, to the left of the relevant top-level MO.
Result: A drop-down list of MOs displays.
FI G U R E 9 .2: TO P-L E V E L MO WI T H DR O P -D O W N HI E R A R C H I C A L L I S T D I S P L AY E D .
NOTE:
When a drop-down list is displayed, this can influence whether MOs ina hierarchy are shown in a Result window. For further information,please refer to the "MO Visibility" section, later in this chapter, andthe "Map Result Window" chapter, later in this Manual.
THE MO SELEC TION TOOLBAR
FI G U R E 9.3: T H E MO SE L E C T I O N TO O L B A R.
The MO Selection toolbar includes controls that enable you to displaymanaged object lists, select the objects to be queried, and toggle thevisibility of selected MOs. It has the following buttons:
• Global MO List.
• Result Window MO List.
• Highlight All.
• Remove Highlight From All.
• Invert Highlighting.
• Toggle Visibility.
59
The MO Selection Window

QuantiQa Client User Manual Part 1
• Lock Visibility.
• Select All Highlighted MOs.
• Deselect All Highlighted MOs.
• Toggle Selection of All Highlighted MOs.
• Find MO.
• Column or Field Chooser.
• Collapse All Groups.
• Expand All Groups.
• Query Server to Expand All MOs.
Each button does the following:
GL O B A L MO LI S T
This button displays all available objects, within the Managed Object list.Initially only the top-level MOs are visible.
RE S U LT WI N D O W MO LI S T
This button displays, within the Managed Object list, only the objects thatare present in a Result window, such as a map, chart, or table.
Because queries are processed from the latest data on the server,without direct reference to the MO Selection window, the MOs listedbefore running a preset, may differ to those shown afterward. Thismay occur when for example, the server sends results for MOs thathave been expanded, or aggregated, differently to those in the originalManaged Object list. In most cases, the lists before and after a querywill be the same, however this is not always so.
This also means that if a preset is run multiple times, the results maydiffer for each run. This is especially true if, for example, the visibilityof MOs in a Result window is changed, before rerunning the preset.
HI G H L I G H T AL L
This button highlights every MO within the Managed Object list.
RE M O V E HI G H L I G H T FR O M AL L
This button removes the highlighting from every MO within the ManagedObject list.
60

IN V E R T HI G H L I G H T I N G
This button highlights those MOs within the Managed Object list, whichpreviously were not highlighted, and removes the highlighting from thosethat were.
NOTE:
MOs are highlighted in order to either bulk select them for inclusion ina query, or to toggle their visibility in a Result window.
TO G G L E VI S I B I L I T Y
This button toggles the visibility of the highlighted MOs in a Result window,between on and off. The Lightbulb icon, positioned to the left of a managedobject, changes between yellow for on, and blue for off, and the MOsvisibility in a query Result window, is updated accordingly.
The Toggle Visibility button is only available when the Lock Visibilitybutton is set to unlock. For further information, please refer to the LockVisibility button, below.
LO C K VI S I B I L I T Y
This button locks and unlocks the visibility of MOs in a Result window.When this button is clicked (the default state), visibility is locked, and onlythe MOs that are selected to be used when running a query, are displayed ina Result window. In addition, the Show Only Expanded Rows button, onthe Map Top toolbar, in a Map Result window, is deactivated. For furtherinformation about the Show Only Expanded Rows button, please refer tothe "Map Result Window" chapter, later in this Manual.
When visibility is unlocked, you can independently determine which MOsdisplay in a Result window, regardless of whether they are to be used whenrunning a query. For further information about the visibility of an MO in aResult window, please refer to the "MO Visibility" section, later in thischapter.
NOTE:
If you manually select which MOs display when visibility is unlocked,and later click the Lock Visibility button, all MOs that are not selectedto be used when running a query, will no longer show in the Resultwindow.
SE L E C T AL L HI G H L I G H T E D MOS
This button selects all highlighted MOs, ensuring that they are used whenrunning a query. The tick-box to the left of each MO is checked accordingly.
If the Lock Visibility button is clicked, the relevant MOs are shown in aResult window, when displayed. If visibility is not locked, you need to set itmanually.
DE S E L E CT AL L HI G H L I G H T E D MOS
This button deselects all highlighted MOs, to remove them from a query. Thetick-box to the left of each MO is unchecked accordingly.
61
The MO Selection Window

QuantiQa Client User Manual Part 1
If the Lock Visibility button is clicked, the relevant MOs are not shown in aResult window, when displayed. If visibility is not locked, you need toremove MOs from the Result window display manually.
TO G G L E SE L EC T I O N O F AL L HI G H L I G H T E D MOS
This button toggles the selection of all highlighted MOs, so that thosepreviously selected are deselected, and those not selected are now markedfor use in a query. The state of the tick-box to the left of each MO ischanged accordingly.
If the Lock Visibility button is clicked, the MO visibility in a Result windowis changed accordingly. If visibility is not locked, you need to change itmanually.
FI N D MOThis button locates the chosen MO within a Map Result window, andhighlights it. The cell within the map turns red, and blinks briefly.
CO L U M N O R F I E L D CH O O S ER
This button displays the Field Chooser window, which is made up of aselectable list of all of those columns that are in the Drag and Drop Area,as well as any that are hidden. For further information about the FieldChooser window, please refer to the "Windows And Panels" chapter of thisManual.
CO L L A PS E AL L GR O U P S
This button collapses any expanded column groupings, within the ManagedObject list. A plus sign (+) displays next to the name of column groupingsthat are collapsed.
EX PA N D A L L GR O U P S
This button expands all column groupings , within the Managed Object list.A minus sign (-) displays next to the name of column groupings that areexpanded.
For further information about the column groupings, please refer to the"Windows And Panels" chapter of this Manual.
QU E RY SE RV E R TO EX PA N D AL L MOS
This button initiates a server query, and results in the drop-down lists, for alltop-level MOs, being expanded to display the most up-to-date dataregarding the associated MO hierarchy. When clicked, the following windowdisplays:
62

FI G U R E 9.4: TH E E X PA N D AL L MO S W I N D O W.
Click Yes to proceed (or NO to abort).
MO SELECTION FILTERThe MO Selection toolbar also includes a filter that allows you to furtherrefine the contents of the Managed Object list.
FI G U R E 9 .5: TH E MO S E L E C T I O N F I LT E R .
To use:
1. Enter an appropriate term in the text field.
2. Click Apply Filter.
Result: The Managed Object list is filtered according to the termthat you entered.
You can filter the Managed Object list further, by selecting FilterIncrementally, and then entering the next term in the text field.
SELECTING MANAGED OBJECTS
An MO in the Managed Object list, can have one of four states:
• Not selected to be used when processing a preset, and not visible in aResult window, such as a map (the default state).
• Not selected to be used when processing a preset, but visible in aResult window, such as a map. This state is only possible before apreset is run.
• Selected to be used when processing a preset, and visible in a Resultwindow, such as a map (the default selected state).
• Selected to be used when processing a preset, but not be visible in aResult window, such as a map.
A managed object must have one of the last two states, if it is to be includedin a query.
63
The MO Selection Window

QuantiQa Client User Manual Part 1
NOTE:
When an MO is selected using one of the following methods, it isnormally visible in a Result window. It is possible however, to controlthe visibility of an MO, regardless of whether it is selected or not. Forfurther information, please refer to the "MO Visibility" and "MOSelection Toolbar" sections.
To select Managed Objects:
1. In the MO Selection list, do one of the following:
I. Click the tick-box to the left of one top-level MO to select it, andall the MOs in the associated hierarchy list.
NOTE:
If you click the tick-box next to a top-level MO, all of theMOs in the associated hierarchical list will automaticallyselected, whether the list is expanded, or not.
or:
II. Do the following:
a. Click the '+' button to the left of a top-level MO, to expandits hierarchical list.
b. Click the tick-box to the left of one of the listed MOs.
III. Repeat any combination of steps I. and II. as required, until allthe MOs needed for the query, have been selected.
or:
IV. Do the following:
a. Click any top-level MO to highlight it.
b. Press and hold <SHIFT> and click another top-level MO,n… rows above, or below the originally highlighted MO.
Result: A continuous series of top-level MOs arehighlighted.
c. Click the Select All Highlighted MOs button, on the MOSelection toolbar.
Result: The continuous series of highlighted, top-levelMOs, together with all of the MOs in theassociated hierarchical lists, are selected.
d. Repeat steps a. to c. to select further continuous series oftop-level MOs, and those in the associated hierarchicallists, until all the MOs needed for the query have beenselected.
or:
V. Do the following:
a. Click the '+' button to the left of a top-level MO, to expandits hierarchical list.
b. Click an MO in the list to highlight it.
64

c. Press and hold <SHIFT> and click another MO, n… rowsabove, or below the originally highlighted MO.
Result: A continuous series of MOs is highlighted.
d. Click the Select All Highlighted MOs button, on the MOSelection toolbar.
Result: The continuous series of highlighted MOs, isselected.
e. Repeat steps a. to d. to select further continuous series ofMOs, until all the MOs needed for the query have beenselected.
or:
VI. Do the following:
a. Click any top-level MO to highlight it.
b. Press and hold <CTRL> and click as many additional top-level MOs as you require, in any order.
c. Release <CTRL> when you have finished.
Result: A non-continuous series of top-level MOs ishighlighted.
d. Click the Select All Highlighted MOs button, on the MOSelection toolbar.
Result: The non-continuous series of highlighted, top-level MOs, together with all of the MOs in theassociated hierarchical lists, are selected.
or:
VI. Do the following:
a. Click the '+' button to the left of a top-level MO, to expandits hierarchical list.
b. Repeat step a. to expand all top-level MOs that arerequired.
c. Click any MO needed for a query, to highlight it.
b. Press and hold <CTRL> and click as many additional MOsas you require, in any order.
c. Release <CTRL> when you have finished.
Result: A non-continuous series of MOs is highlighted.
d. Click the Select All Highlighted MOs button, on the MOSelection toolbar.
Result: The non-continuous series of highlighted MOsis selected.
Result: Any MO that has been selected is used in a query.
65
The MO Selection Window

QuantiQa Client User Manual Part 1
NOTE:
Only a limited number of common selection methods are describedabove. The MO Selection toolbar includes additional controls thatsimplify the selection of complex groups of multiple MOs. For furtherinformation, please refer to the "MO Selection Toolbar" section,earlier in this chapter.
To help you select MOs on a geographical basis, open a new map window.MOs are automatically displayed on the map, as you select them.
NOTE:
Provided that the Lock Visibility button, on the MO Selection toolbar,is active, the selected MOs display on maps without having to run aquery first.
If a Result Table window, or a Result Map window, is open when youhighlight objects in the Managed Object list, the appropriate MO isautomatically highlighted there. Once a query has been run, if you deselectMOs in the Result Window MO list, for example, to further refine the query,the corresponding MO in the Managed Object list is also deselected.
MO VISIB IL IT YBy default, an MO is only visible in a Result window, if it is selected bymeans of its tick-box. It is however, possible to control visibilityindependently of whether an MO is selected, or not, as follows:
1. Do one of the following:
I. Click the Lock Visibility button, on the MO Selection toolbar, tounlock visibility.
Result: MO visibility is no longer locked to whether an MO isselected.
or:
II. Do the following:
a. Click the Lightbulb icon, to the left of an appropriate MO.
Result: The following window displays:
FI G U R E 9.6: T H E V I S I B I L I T Y I S LO C K E D WI N D O W.
b. Click Yes to continue (or No to abort).
66

Result: MO visibility is no longer locked to whether an MO isselected, and the chosen Lightbulb icon changescolor accordingly.
2. Do one, or a combination of the following:
I. Click individual MO Lightbulb icons as required.
Result: Each MO is visible in a Result window, and theLightbulb icon changes color accordingly.
II. Do the following:
a. Click the '+' button, to the left of appropriate top-levelMOs, to expand their hierarchical lists.
b. Click any appropriate MO to highlight it.
c. Press and hold <CTRL> and click as many additional MOsas you require, in any order.
d. Release <CTRL> when you have finished.
Result: A non-continuous series of MOs is highlighted.
e. Click the Toggle Visibility button, on the MO Selectiontoolbar.
Result: All highlighted MOs are visible in a Resultwindow, and the Lightbulb icons change coloraccordingly.
NOTE:
When a top-level MO is made visible, but its hierarchical list is notexpanded before running a query, then only the top-level MO isdisplayed in a Map Result window. If the hierarchical list is expandedat the time of running a query, then all of the relevant MOs aredisplayed.
However, if the hierarchical list of a visible top-level MO is expandedand then collapsed before running a query, the MOs in the list may stillbe visible in the Map Result window. The visibility of collapsedhierarchical lists is controlled by the Show Only Expanded Rowsbutton, on the Map Top toolbar, in a Map Result window. For furtherinformation about the Show Only Expanded Rows button, pleaserefer to the "Map Result Window" chapter, later in this Manual.
If an MO in a hierarchical list is made visible, but its respective top-level MO is not, then only the visible MO displays in a Result window.
MO PROFILE AND GROU P TOOL BARSave Button Delete Button
FI G U R E 9.7: T H E MO PR O F I L E A N D G R O U P TO O L B A R.
The MO Profile and Group toolbar enables you to define, save, recall anddelete libraries of column groupings and managed objects, as required. Itconsists of:
67
The MO Selection Window
QuantiQa Client User Manual Part 1
• The MO Profile tool.
• The MO Group tool.
Each tool is made up of a directly editable drop-down list, together with saveand delete buttons.
TH E MO PR O F I L E TO O L
This tool is used to save and retrieve, for example, a hierarchical columngrouping, known as a Profile, which has previously been defined in theDrag and Drop Area of the MO Selection window. For further informationabout the Drag And Drop Area, please refer to the "Windows And Panels"chapter of this Manual.
To save a column grouping:
1. Use the Drag and Drop Area to define a column grouping.
2. Enter a name for the grouping in the Profile combined text field anddropdown list.
3. Click the Save button.
Result: The grouping is saved under the appropriate ProfileName.
To retrieve a grouping:
1. Click the arrowhead, positioned to the right of the Profile combinedtext field and dropdown list.
Result: A dropdown list displays.
2. Select the appropriate Profile Name.
Result: The Profile displays in the Managed Object list.
To delete a grouping:
1. Follow steps 1 and 2 above.
2. Ensure that the correct Profile Name displays in the Profile combinedtext field and dropdown list.
3. Click the Delete button.
Result: The Profile is permanently deleted.
68

NOTE:
If the Profile dropdown list is empty, no profiles have been saved.
FI G U R E 9.8: T H E MO SE L E C T I O N W I N D O W, D I S P L AY I N G A NAME A N D A N T TY P E
CO L U M N GR O U P I N G .
TH E MO GR O U P TO O L
The MO Group tool is used to save and retrieve a group of selectedmanaged objects. To save an managed object group:
1 Select one or more elements from the Managed Object list.
2. Enter a name for the managed object group in the Group combinedtext field and dropdown list.
3. Click the Save button.
Result: The managed object group is saved under the appropriate Group Name.
To retrieve a managed object group:
1. Click the arrowhead, positioned to the right of the Group combinedtext field and dropdown list.
Result: A dropdown list displays.
2. Select the appropriate Group Name.
Result: The managed object group displays in the ManagedObject list.
To delete a managed object group:
1. Follow steps 1 and 2 above.
2. Ensure that the correct Group Name displays in the Group combinedtext field and drop-down list.
3. Click the Delete button.
Result: The managed object group is permanently deleted.
NOTE:
If the Group drop-down list is empty, no managed object groups havebeen saved.
69
The MO Selection Window

QuantiQa Client User Manual Part 1
FIND A MANA GED OBJECTYou can search for a managed object in the MO Selection list as follows:
1. Press <CTRL> and <F> at the same time.
Result: The Find MO dialog displays.
2. Enter a search string.
3. Select from the following, as appropriate:
I. Search Up.
II. Find All.
III. Match Case.
4. Click Find Next.
Result: All fields in the MO Selection list are searched for thedefined string, according to the selected criteria. Whenfound, the relevant managed objects are highlighted.
TH E COLUMN DRAG & DROP AREA.For further information about the Column Drag & Drop Area, please refer tothe "Windows And Panels" chapter, earlier in this Manual.
70

The Preset SelectionWindow
FI G U R E 10.1: TH E PR E S E T SE L E C T I O N WI N D O W.
The Preset Selection window contains two types of Presets:
• Predefined presets.
Presets which are included in the installation package. These arelocated in the directory under the /preset directory and organized indirectories below /preset.
• User defined presets.
Presets created by the user and these can be located anywhere theuser desires, but QuantiQa Client GUI will only access presets fromthe installation /preset directory structure.
In the Preset Selection window the presets of all directories andsubdirectories appear within a tree structure. To expand, or collapse a treelevel, click the folder. The illustrated tree structure corresponds exactly tothe directory structure under the installation /preset directory. For the aboveexample, the preset directory contains the following visible directories:
/preset/2G LB QoS;
/preset/2G Radio QoS;
/preset/Abis_rev_02;
/preset/Abis_rev_02/CHARTS;
Within the Preset directories are the preset files, either predefined or user-defined. The files, “LinkBalance 1800_chart” and “RxLev_RxQUAL_UL”, arejust 2 of the many preset files shown available here within theAbis_rev02/CHARTS library directory.
71
10

QuantiQa Client User Manual Part 1
NOTE:
Both presets and directories can be moved by dragging them toanother folder.
FI G U R E 10.2: PR E S E T SE L E C T I O N W I T H TH E CO N T E X T ME N U .
From the Preset Selection window you can edit, execute or delete a preset.To use:
1. Open the Preset Selection window.
2. Select the preset to be modified and right click.
3. Select Edit, Execute or Delete Preset.
EDIT A PRESET
Select Edit to modify or edit an existing preset. This will display the PresetEditor, as in the case of the Disconnection_Analysis preset example below.
FI G U R E 10.3: PR E S E T ED I T O R DI S C O N N E C T I O N S_AN A LY S I S .
Most of the fields can be modified then the file must be saved. You can savewith any file name at any directory location. The Preset Editor is describedin more detail later in this manual.
EXECUTE A PRESET
Select Execute, followed by Map, Table, or Chart.
A map, chart or table window is opened, and a query based on the preset issent to the database. When processing is finished, the result window ispopulated with the results. Maps, Tables and Charts are described in moredetail, later in this Manual.
DELETE A PRESET
Select Delete to permanently delete a preset from the file system and thePreset selection list. It is best to backup your file(s) before deleting.
72

The Counters SelectionWindow
FI G U R E 11.1: CO U N T E R S SE L E C T I O N W I T H CO U N T E R S .
The Counters Selection window lists the counters that are available from theactive KPM servers. The counters in the list are retrieved from the databaseafter logging on to the server. The counters are used in the Preset Editorwhen building formulas. When adding a counter to a preset, drag and drop itin the Formula field of a Preset Editor.
As the cursor is moved over each counter in the list, tool tips display a briefdescription.
A detailed explanation of the formulas can be found in "QuantiQa ClientUser Manual, Part 2: Appendices".
73
11

QuantiQa Client User Manual Part 1
74

The Ticket Finder Window
Tool Buttons Bar
Tree View List
Ticket Type Fields List
FI G U R E 12.1: TH E T I C K E T F I N D E R W I N D O W.
The Ticket Finder window is the main tool that is used to manage tickets. Itretrieves tickets to user defined filtering rules. To show the Ticket Finderwindow click on the Ticket Finder tab under the bottom right corner area ofthe Main Window. If the Ticket Finder tab is not visible, go to the “View” topmenu and click “Drill Down Ticket Finder” to reveal the Ticket Finder window.
There are three different areas in the Ticket Finder window:
• Tool Buttons Bar.
This contains all the tools to access the required set of tickets. This isfirst used to set the time period of interest.
• Tree View List.
This provides lists of the types of tickets for each server that areavailable on the operator network for the selected time period. Therequired ticket type is selected here.
• Ticket Type Fields List.
For the selected ticket type, this shows the list of fields that exist.Filters can be applied to these fields to confine the list of tickets to anyspecific characteristics that the user is looking for.
To access tickets:
1. First select date and time of the investigated time period using theTool Buttons Bar.
2. Then through the Tree View List select the site server and the type oftickets.
75
12

QuantiQa Client User Manual Part 1
3. Choose any eventual filter to apply using the Ticket Type Fields list.
4. Click on the Select Interval button to find and list the tickets.
The resulting tickets are listed in the Ticket List window.
FI G U R E 12.2: TH E T I C K E T L I S T W I N D O W W I T H SE L E C T E D T I C K E T S .
THE TICKET FINDER TOOL BUTTONS BAR
Refresh Start/Stop/Pause
Start Time
End Time
Play Until End Profile
FI G U R E 12.3: TH E TO O L BU T T O N S BA R .
The Ticket Finder Tool Buttons Bar contains all the tools to select the set oftickets and these are explained in the following section.
76

Refresh This refreshes the server list in the TreeView list, using the defined time interval.The time interval is set by means of thestart and end Date and Time controls.
Press <ALT> and click this button todisplay a dialog with a list of DD servers.This can be used to select which serversare synchronized for PDU NEIDs, and todefine a timeout setting. The timeoutoverrides, for the next synchronizationonly, any setting made using the Optionsmenu. For further information about theOptions menu synchronization settings,please refer to the “QuantiQa Client UserManual, Part 1”.
If a server exceeds the timeout setting, awarning button ( ) displays. Whenclicked, a list of non-responsive servers isshown.
Select This Opens a tickets list window that containsall the filtered tickets belonging to dateand time values set in the start date andtime controls, (i.e. to the right of thisbutton).
Start and EndDate
Sets the start and end date of theinterested time interval. By clicking overeach of the separated fields of the date,the respective value will be highlightedand can be changed by typing in newvalues or using the keyboard UP andDOWN arrows. The keyboard LEFT andRIGHT arrows can be used to move thehighlight from one field to the other. ByClicking on the down chevron theCalendar control will be opened. Using theCalendar control user can set the desireddate simply by acting on the propercontrols.
Start and EndTime
Sets the start and end time of a timeinterval. By clicking over each of theseparated fields of the time, the respectivevalue will be highlighted and can bechanged by typing in new values or usingthe keyboard UP and DOWN arrows. Tochange the time user can also use the upand down chevrons buttons on the right ofthe Time control. The keyboard LEFT and
77
The Ticket Finder Window

QuantiQa Client User Manual Part 1
RIGHT arrows can be used to move thehighlight from one field to the other.
Select Interval Opens a tickets list window that containsall the filtered tickets belonging to anentire time interval as set by the start andend Date and Time controls.
Play Opens a tickets list window that containsall the filtered tickets shown in real time.This process continues until user pressesthe Stop or Pause button.
Stop Stops the process of showing ticketsstarted by the Play button. If you press thePlay button, after having pressed the Stopbutton, the process of showing tickets willstart again from the beginning.
Pause Pauses the process of showing ticketsstarted by the Play button. To continue theprocess of showing tickets from where youleft it press the Play button again.
Play To End Opens a tickets list window that containsall the filtered tickets showed in real timefrom the start time till the end time. Thetime interval is set by means of the startand end Date and Time controls. If thestart time is of the past, the system showsall produced tickets starting from that time,then it shows all other tickets as producedin real time until the end time is reached.Thus the end time can be of the past or inthe future.
Profile Lists all the user defined profiles andprovides the ability to set new profiles.Profiles are specific configurations of theTicket Finder tool filters, which the usercan re-use without having to configure thesame settings to the Ticket Finder eachtime. Profiles are XML files saved locallyunder the neprofiles subdirectory into theQuantiQa Client installation directory, andwith the same name as assigned throughthe profile control but with the .tfpextension.
78

Save Saves the profile with the name setthrough the Profile control.
Delete Deletes the profile with the name setthrough the Profile control.
FI G U R E 12.4: C A L E N D A R CO N T R O L EX A M P L E .
TREE VIEW LIST
FI G U R E 12.5: TH E TR E E V I E W L I S T.
The Tree View list is used to identify all the available ticket types producedwithin the time interval set by the Tool Buttons Bar. Ticket types are shownin the Tree View List window, and are grouped under their originating siteserver.
Site servers and ticket types are represented by a tree view list. Each siteserver is a node of the tree view. Clicking on the symbol on the left ofeach site server name, users can expand the list of ticket types availablefrom that server. Clicking on the will collapse the site server’s list of tickettypes. By double clicking on a site server name will expand or collapse thepertaining list of ticket types. Each item of the Tree View list can behighlighted simply by clicking on it. Highlighting a ticket type will show thelist of its fields in the Ticket Type Fields list window.
79
The Ticket Finder Window

QuantiQa Client User Manual Part 1
TICKET TYPE FIELDS LIST
FI G U R E 12.6: T I C K E T TY P E F I E L D S L I S T.
The Ticket Type Fields list is used to show all the available fields of achosen ticket type. The Ticket Type Fields are shown in a two column list,and against any field in the left column, the user can set a value (or aformula) against it in the right column as a prerequisite requirement to filterout the required tickets. I.E, only those tickets that satisfy the imposedcondition(s) will be collected and displayed in the resulting Tickets Listwindow.
When users type in a value, or select a required property from a predefinedlist, they must complete the entry either by pressing the “Enter key” or by aclick outside the field with the new value, before running the filter. Also thisvalue will only be applied as a filter if the check box against this field hasbeen set. Several fields may be used to apply filters.
ADVANCED TICKET FILTERING
You can also use C language style relational and logical operators.
TA B L E 12.1: A D VA N C E D T I C K E T F I LT E R I N G : RE L AT I O N A L OP E R AT O R S
Operator Example Description< x < a less than
<= x <= a less than or equal to> x > a greater than
>= x >= a greater than or equal to!= x != a not equal to== x == a equal to
TA B L E 12.2: A D VA N C E D T I C K E T F I LT E R I N G: LO G I C A L OP E R AT O R S
Operator Example Description&& a && b and|| a || b or
80

FI G U R E 12.7: EX A M P L E S OF AD VA N C E D T I C K E T F I LT E R I N G EX P R E S S I O N S .
Relational operators use a fix left value which is represented by the xlowercase letter. The x letter refers to the value of the adjacent field. LogicalOperators can be combined together with relational operators to buildcomplex expressions.
When building complex expressions, relational operators are evaluatedbefore logical operators. For clarity when building expressions, users canuse spaces to separate each variable, operator and value, but this is notessential. Equally users can use round parenthesis to group sub-expressions to ensure intended order of evaluation, or to just make complexexpressions more readable.
DD SERVER ADVANCED TICKET FILTERING
DD server advanced ticket filtering allows you to filter tickets that havevariable length fields. To search, for example, for a field that includes theexpression “123”:
5. Do one of the following:
I. Type 123, or the ASCII equivalent, as the search string.
or:
II. Type a search string, using wildcards, for example, 1*3.
Result: Any tickets with a field that includes the search string arehighlighted in the Ticket List window.
Because of DD server advanced ticket filtering, you can also display ticketswith hierarchical fields. For further information, please refer to the “TheTicket List Window” chapter of this manual.
81
The Ticket Finder Window

QuantiQa Client User Manual Part 1
82

The Drill Down Filter Window
Tool Buttons Bar
Available Message Types
MO Filter list ofLACs and Pointcodes
FI G U R E 13.1: TH E D R I L L DO W N F I LT E R W I N D O W.
The Drill Down Filter window is the PDU equivalent of the Ticket Finder fortickets. It retrieves PDUs for MOs specified by LAC code or Pointcode, andagainst the user’s defined message filters. To show the Drill Down filterwindow click on the DrillDown Filter tab under the bottom right corner areaof the Main Window. If the Drill Down Filter tab is not visible, go to the“View” top menu and click “Drill Down Filter” to reveal the Drill Down Filterwindow.
Starting from the bottom and working upwards, we can identify threedifferent areas in the DrillDown Filter window. This is also the sequence ofuser input.
• LACs or Pointcodes.
This displays the server and a tree of its MOs in terms of LACs andPointcodes. From this pane the MOs must be selected first as thedisplay in the next pane depends on this selection. If required, morethan one LAC or Pointcode can be selected by holding down the shiftkey or control key.
• Message Tree List.
This provides lists of all the types of PDUs for the user’s selection ofMOs. Unwanted message types can be excluded by turning off theirlightbulbs. In the example below only “Connection Failures” arerequired.
83
13
MO filter

QuantiQa Client User Manual Part 1
• Tool Buttons Bar.
This contains the same control arrangement as for Ticket Finder. Fromhere the overall time period is set and data collection can be started,paused, and if necessary stopped.
NOTE:
If the window is restricted in width, the toolbar will not displaythe profile facility. If the profile area is not visible, increase thewindow width.
To access a set of PDUs:
1. First select the MOs of interest.
2. Then from message types pane, exclude all those not wanted. (leavingonly the Connection Failures in the given example.
3. Select date and time for the investigation time period using the ToolButtons Bar and initiate collection with the Interval button. Use theStop button to end the collection if the PDUs are not required for thewhole period.
The collected PDUs appear in a Protocol Analyzer window.
FI G U R E 13.2: A PDU LI S T W I N D O W GE N E R AT E D US I N G A DR I L L D O W N F I LT E R .
In the above example, the opportunity has been taken to drill up from one ofthe listed PDUs to determine the Ticket and learn details of the call affected.
84

MO FILTER
FI G U R E 13.3: TH E MO F I LT E R L I S T.
If the MO Filter list is in its collapsed state, click on all the “+” signs, andany “+” signs that are subsequently displayed, until the full scope of theMOs is apparent. The user may select all those MOs to be included. Holddown either the shift key or control key as the mouse is clicked when morethan one item is to be selected.
Only after a selection has been made for the MOs can the Protocols and thedifferent message types be listed.
PROTOCOLS AND MESSAGE TYPES
FI G U R E 13.4: PR O T O C O L AN D ME S S A G E L I S T S .
Having selected the MOs, the server is able to provide a complete list of allthe possible message types and the user is able to select which types are ofinterest and those that are not wanted. All the light bulbs need to be set to inaccordance with these user requirements.
It is easiest to turn the complete contents of a folder on or off just bycollectively setting them with one or two clicks on the folder. With all set tothe majority condition, the exceptions can now be set individually within thefolder.
85
The Drill Down Filter Window

QuantiQa Client User Manual Part 1
THE DRILL DOWN FILTER TOOL BUTTONS BAR
Refresh Start/Stop/Pause
Start Time
End Time
Play Until End Profile
FIGURE 13.5: THE TOOL BUTTONS BAR.
The Drill Down Filter Tool Buttons Bar contains all the tools to select the setof PDUs and these are explained below.
NOTE:
Make sure that the “Profile” drop down list is visible. If not, widen thewindow to expose it.
Refresh This refreshes the list of server in the MOlist using the defined time interval. Thetime interval is set by mean of the startand end Date and Time controls.
Select This Opens a protocol analyzer window thatcontains all the filtered PDUs belonging todate and time values set in the start dateand time controls, (i.e. to the right of thisbutton).
Start and EndDate
Sets the start and end date of theinterested time interval. By clicking overeach of the separated fields of the date,the respective value will be highlightedand can be changed by typing in newvalues or using the keyboard UP andDOWN arrows. The keyboard LEFT andRIGHT arrows can be used to move thehighlight from one field to the other. ByClicking on the down chevron theCalendar control will be opened. Using theCalendar control user can set the desireddate simply by acting on the propercontrols.
86

Start and EndTime
Sets the start and end time of a timeinterval. By clicking over each of theseparated fields of the time, the respectivevalue will be highlighted and can bechanged by typing in new values or usingthe keyboard UP and DOWN arrows. Tochange the time user can also use the upand down chevrons buttons on the right ofthe Time control. The keyboard LEFT andRIGHT arrows can be used to move thehighlight from one field to the other.
Select Interval Opens a protocol analyzer window thatcontains all the filtered PDUs belonging toan entire time interval as set by the startand end Date and Time controls.
Play Opens a protocol analyzer window thatcontains all the filtered PDUs shown inreal time. This process continues untiluser presses the Stop or Pause button.
Stop Stops the process of adding PDUs startedby the Play button. If you press the Playbutton, after having pressed the Stopbutton, the process of showingPDUs willstart again from the beginning.
Pause Pauses the process of showing PDUsstarted by the Play button. To continue theprocess of showing tickets from where youleft it press the Play button again.
Play To End Opens a protocol analyzer window thatcontains all the filtered PDUs showed inreal time from the start time till the endtime. The time interval is set by means ofthe start and end Date and Time controls.If the start time is of the past, the systemshows all produced PDUs starting fromthat time, then it shows all other PDUs asproduced in real time until the end time isreached. Thus the end time can be of thepast or in the future.
Profile Lists all the user defined profiles andprovides the ability to set new profiles.Profiles are specific configurations of the
87
The Drill Down Filter Window

QuantiQa Client User Manual Part 1
Ticket Finder tool filters, which the usercan re-use without having to configure thesame settings to the Ticket Finder eachtime. Profiles are XML files saved locallyunder the neprofiles subdirectory into theQuantiQa Client installation directory, andwith the same name as assigned throughthe profile control but with the .tfpextension.
Save Saves the profile with the name setthrough the Profile control.
Delete Deletes the profile with the name setthrough the Profile control.
FI G U R E 13.6: CA L E N D A R CO N T R O L EX A M P L E.
88

The Preset Editor
FI G U R E 14.1: TH E P R E S E T E D I T O R W I T H TO O L B A R A N D C O L U M N S.
The Preset Editor enables the user to create result definitions that can beused to query the server database for measurement information and provideresults that can be visually be represented on maps, in tables or in charts.Each entry in the preset definition represents a query and returns resultsthat could be in scalar, vector or table form. Depending on the results, themeasurements from the server can be visualized in QuantiQa Client in manydifferent ways.
The Toolbar buttons are:
New Preset Clears the current preset entries and allowsthe user to add new formula entries.
Load Preset Opens a file browser to allow the user toselect a preset file to edit.
Save Preset Allows the user to save the current preset toa user defined file name and folder.
Revert to Saved Revert to last saved.
Add Formula Creates an entry in the preset editor withsome of the columns or fields with defaultvalues. The user can modify each field withinthe preset entry.
Duplicate Formula Duplicates a line in the preset.
Delete Formula Deletes a line in the preset.
Move Formula Down Moves a line down.
89
14

QuantiQa Client User Manual Part 1
Move Formula Up Moves a line up.
Synchronize Lists Refreshes the “DD Item” and “Colormap”dropdown lists with newly created informationfrom the preset entries. For example, a usermay add a new colormap to the colormapdirectory; the Sync button would rebuild thedropdown list to include the newly addedcolormap.
FI G U R E 14.2: ED I T I N G A PR E S E T.
For every entry or row in the preset editor, each column in the row iseditable. Some fields indicate droplists with selections, checkboxes, editabletextfields for characters or numeric values. The modifications for the fieldsaffect the results for QuantiQa. When a Preset is selected for a query theentries for the preset are used in the query. When the preset editor windowis closed, if a change has been made the user is invited to save the file.
Each of the preset editor’s fields is identified and described below:
• Name.
Specify the name of the results from the “Formula” field. This namewill be used in dropdown lists and sliders for selection of thecorresponding measurement results as specified in the “Formula” field.
• Formula.
Specify the table, counter, formula or JavaScript function required toreturn the desired results. The results will be associated with the nameentered in the “Name” field.
Table and counter selection follow the same parsing rules andselection methods as designed in both CommProve Netledge andCommProve Quantiqa. Detailed explanations for the formulas aregiven in the appendices.
To determine the difference between a server Table or Counter nameand Javascript function calls, the user must delineate all server tablenames, counters, and server formulas with quotes. For example, thefollowing formula is surrounded in quotes and specifies to QuantiQathe RLINKISSUES and associated formulas can be found andcalculated on the server:
"RLINKISSUES[0:0][$]/RLINKISSUES[0:0][]*100"
However, the following example without quotes indicates to QuantiQato call the given JavaScript:
90

Traffico()
The formulas can mix Tables, Counters and/or JavaScript in the samepreset. The following JavaScript would be executed in order and allentries would return the same results:
Traffico()
TrafficFunction("RXQUL[][]")
“RXQUL[][]”
Where the JavaScript for the two functions are:
formula Traffico (result, "RXQUL[][]" as traf)
{
print (ne.NAME+" Traff_formula = "+traf.Get()+"\n");
result.Set(traf.Get());
}
and
function TrafficFunction (result, traf)
{
print (ne.NAME+" Traff_function= "+traf.Get()+"\n");
result.Set(999); ß Notice user defined return result in table.
}
“RXQUL[][]” is a simple data query to the server that returns the samescalar value.
This would produce the following results in table form:
Console entries within QuantiQa that correspond to the “print” statementswithin the JavaScript:
91
The Preset Editor

QuantiQa Client User Manual Part 1
Notice that within JavaScript functions you can use the “ne” variable to printdifferent attributes of the MO that are designated as display names in theserver configuration file ( “ne.NAME” or “ne.PARENT“ ).
• Show R Click.
Specify whether the right mouse click will display scalar and vectortables for the results directly on the map.
• Map Type.
Specify the visualization mechanism used by the map to display theresults. The options available are:
○ Split Drop.
Creates a colored “teardrop” image to represent scalar andvector data points at the MO point on the map. The color of thedrop will be shaded based on the colormap value.
○ Split Ball.
Creates a single circle at the tip of the MO stick to represent thevalue for scalars only. The color of the ball will be shaded basedon the colormap value.
○ TA Vector.
Creates an arc a valid distance from the Managed Object on themap representing a location at which the measurementoccurred. The color of the arc will be shaded based on thecolormap value.
FI G U R E 14.3: PR E S E T ED I T O R M A P TY P E S .
92

• Threshold.
Specifies the value to set for the low thumb on the map’s colorscalewhen the Main Layer Threshold is on.
• Min.
Specify the minimum value to display on Maps and Charts. This valuealso affects the color threshold bar.
• Max.
Specify the maximum value to display on the Maps and Charts. Thisvalue also affects the color threshold bar.
• Dbl Click.
Not available in this release.
• Chart.
Not available in this release.
• List.
Specify whether the preset formula is available for view as a global ordrilldown item on the map.
• DD Item.
Specify the name of the formula that will be used in drilldown mode onthe Map. This formula item must exist as one of the entries in thesame preset definition.
• Colormap.
Specify the colormap to use in Maps and Charts when viewing themeasurement results. The colormap will specify the color of the drop,ball, TA vector arc, pie, and/or bar chart. Color maps can be userdefined to generate the necessary colors for each value as required bythe user.
• Formula2.
Specify the formula (same rules and syntax as shown above in theformula description) that will be used in a twin configuration. Thisformula2 and the query/results are associated and processed by thesecond server in the list of a twin configuration.
93
The Preset Editor

QuantiQa Client User Manual Part 1
94

The Chart Builder
The Chart Builder is an editor which allows the user to modify existing chartlayouts or to build new charts as they will appear on the Chart ResultWindow. Chart Builder is accessed from the Main Window either using theNew Menu by selecting New Chart Builder or from the “New” Toolbar at thetop of the Main Window.
The process of modifying or building a new chart involves the followingstages :
1. Open a Chart Builder window from the Main Window or “New” menu.
FI G U R E 15.1: EM P T Y CH A R T BU I L D E R W I N D O W.
2. Assign the Preset. The preset is dragged from the Preset Selectionwindow to the new window, or alternatively a resultset data of thatpreset can be dragged from the dragger icon of an existing ChartResult window. Either will give one of two possibilities according towhether the preset already has, or does not have a chart.
FI G U R E 15.2: PR E S E T AS S I G N E D, W I T H A N D W I T H O U T E X I S T I N G C H A R T.
95
15

QuantiQa Client User Manual Part 1
3. A) If A Chart Already Exists then it may be modified or a newalternative chart added.
B1`) Copy a Chart from Another Preset ? If there is No ExistingChart, the option is offered to select a chart from another preset.
B2) Starting without an existing chart.
4. Setting Chart Properties. After having established the chart by one ofthe three alternative paths, the named chart is set or modified exactlyas required, and finally saved.
ESTABLISHING THE CHARTAfter dragging the preset or the preset’s result set to the empty chart builderwindow, this section describes how to obtain and make a chart ready for thesetting of its properties.
PRESET HAS A N EXISTING CH AR TAfter dragging the preset or the preset’s result set to the empty chart builderwindow, if the preset already has a chart the dialog the dialog should besimilar to that shown below.
FI G U R E 15.3: TY P I C A L C H A R T B U I L D E R W I N D O W, R E A D Y FO R E D I T I N G PR O P E R T I E S .
The preset may have one or more existing charts, and by clicking on the topleft drop down list, the user can select any of the existing charts ready formodification.
Alternatively the user may click on the Add button to create a new chart asshown adjacent. This now provides for creation of a new chart definition.
96

FI G U R E 15.4: A D D I N G A N E W C H A R T.
COPY CHAR TS FR OM ANOTHER PRESETIf the user makes the choice to “Copy charts from another preset”, the scrolllist gives a full listing of the currently available chart layout files. When theuser selects one of the listed names (a preset name) the Chart Builderdialog presents a description of the types of charts defined in this file.
FI G U R E 15.5: C H A R T B U I L D E R, CO P Y "MA I N_TRAF" CO N TA I N I N G 3 C H A R T S .
In the above figure, Chart Builder is preparing to create a chart file for thepreset “Main2” and a label string below the “Copy” radio button indicates thecharts defined for “Main_TRAF” are 1pie chart, 1 bar chart and 1 XY chart.
On clicking the “OK” button with the selection as shown in the figure above,all three charts are copied into a newly created “Main2” chart file and madeavailable for future use by the “Main2” preset. However the Chart Builderdialog showing chart properties is now open for modification of properties ofall the copied charts as is usually necessary and subsequent updating of thenew chart file.
97
The Chart Builder

QuantiQa Client User Manual Part 1
FI G U R E 15.6: CH A R T BU I L D E R: ED I T A CO P Y O F A C H A R T LAY O U T W I T H 3 CH A R T S .
Notice the dropdown list contains 3 titles of the charts from a copy of a chartlayout file, “Main_TRAF”. By selecting a title from the dropdown list, theproperties for that chart will be displayed in the Chart Builder window forediting. The user can make modifications but these are only saved to the fileif and when the “Apply” or “OK” buttons are used.
CR EATE A NEW CHAR T DEFIN IT IONA new chart definition can created from either the Option dialog to copycharts from another preset, or from use of the top left Add button of theChart Editor dialog.
The “New Chart” dialog, offers the user a choice of chart type to create. Theavailable types are Pie, Bar, XY or Gauge charts.
98
MO

FI G U R E 15.7: TH E NE W C H A R T D I A L O G.
After selecting the chart type, a text field must also be completed for thechart title. This title will appear at the top of the chart image. After making aselection and entering a title, click the “OK” button. The chart editor windowwill then appear and the chart is ready for the setting of its properties.
FI G U R E 15.8: BU I L D A NE W P I E CH A R T.
99
The Chart Builder
MO

QuantiQa Client User Manual Part 1
SETTING THE CHART PROPERTIES
PIE, BAR A ND XY CHAR TSThe controls for Pie, Bar and XY charts are different, but are the same interms of their grouping for setting their respective chart properties. Thesegroupings are as follows:
• Title Area controls.
This group selects the chart, the chart type and determines its titlename.
• Axis controls.
For pie charts and 2-D bar charts, there is one axis only (for pie: angleof slice, for 2-D bar: the x-axis). For 3-D Bar and Line charts, 2 axesare available (bars and sets). Drop-down boxes allow assignment ofone of the 6 resultset coordinates to each available axis.
• Coordinate controls.
Coordinates not used for the axis, can still be displayed by othermeans dependant on the type of chart (height, colormap, sector sizeand displacement). Up to 4 dimensional settings are possible for piecharts, up to 2 for 2-D charts (height and colormap), and 1 for 3-Dcharts (height).
• Axis Labels and Orientation.
A text string can optionally be included as a title for each of axis. Inaddition the orientation of the value labels for the x-axis, can be setanywhere between 0º and 360º.
• Show As controls.
For 3-D charts only, either “Lines” or “Bars” can be selected.
• Custom Area.
Facilities exist for some chart forms, for the use of custom colors (i.e.user selected) or custom labels.
• Widgets.
Sliders and droplists are available for allocation to coordinates toenable the user to determine values for any MO, ROP, Item, X, Y, Zvalue.
100

FI G U R E 15.9: TH E TH R E E DI F F E R E N T TY P E S O F C H A R T: P I E , BA R A N D XY.
101
Widget Control
Axis Controls
Axis Labels
Legend Control
Title Area
Coordinate Controls
Custom Controls
MO
MO
MO
The Chart Builder

QuantiQa Client User Manual Part 1
TITLE AR EA CON TROLS
FI G U R E 15.10: E D I T PR O P E R T I E S FO R A P I E C H A R T.
F I G U R E 15.11: CH A R T B U I L D E R T I T L E C O N T R O L S.
The first control is a dropdown list of currently defined chart titles with thename of the selected chart displayed. Underneath the dropdown list thereare 3 buttons :
• Add.
Click and a “New Chart” window will appear to create another chart.
• Remove.
Click and the currently selected chart is permanently removed fromthe dropdown list.
• Rename.
Click and a “Chart Builder Rename” window will appear with a textboxfor entering a new title for the chart currently selected.
CH AR T BUILD ER AXIS CONTR OLS
FI G U R E 15.12: CH A R T BU I L D E R A X I S CO N T R O L FO R P I E A N D 2-D B A R .
102

The Axis control is different for some of the charts as described below. Thedropdown lists allows the selection of one of the 6 coordinates which arepart of the resultset.
• Pie Chart.
The axis is depicted as the angle of a pie slice for more than 1coordinate value in the result. The axis is the entire pie if there is only1 coordinate value.
• 2-D Bar.
The axis is the x-axis of the chart.
FI G U R E 15.13: C H A R T B U I L D E R AX I S CO N T R O L FO R 3-D B A R A N D L I N E.
• 3-D Bar and Line.
There are 2 axes, one for “Bars” and one for “Sets”. The coordinatesettings for the “Bars” and “Sets” should not be the same coordinate.
COORD INAT ES AREA
FI G U R E 15.14: PI E CH A R T CO O R D I N AT E S .
The Coordinates area is different for each of the types of charts asdescribed below. A dimension setting can be turned “on” or “off” by clickingthe checkbox. To change a setting click the “Set” button. The “Set” window isdescribed at the end of this section.
On the Chart Builder window there are 4 dimension settings available on thepie chart as shown above. Each pie chart has a “Sector Size” or angle. The“Colormap”, “Height” and “Displacement” are described in detail later in thisManual.
103
The Chart Builder

QuantiQa Client User Manual Part 1
FI G U R E 15.15: 2-DI M E N S I O N A L BA R CH A R T CO O R D I N AT E S .
Each 2-D chart has a Height. The Colormap dimension is optional.
FI G U R E 15.16: 3-DI M E N S I O N A L CH A R T CO O R D I N AT E S .
Each 3-D chart has a Height. The Colormap is not an option.
CO-O R D IN AT E VA L U E S
To set the coordinate values, click on the “Set” button and the Chart BuilderCoordinates window will appear. All 6 coordinates with their values willappear on the Coordinates window. A coordinate is greyed out if it wasselected as the “Axis”, “Bars” or “Sets” on the main Chart Builder window.
FI G U R E 15.17: CH A R T BU I L D E R C O O R D I N AT E S
• Formula.
The dropdown list will contain the formulas defined for the Preset. ThePreset name is on title bar of the main Chart Builder window.
104

• MO.
This is grayed out in this view because it is selected as the axis. Theaxis will differ for each chart. All of the MOs in the query will berepresented on the pie chart as pie slices so you don’t need to selecta specific MO. On the pie chart example, if the MOs for the query havenot yet been selected then the MO for the axis will default to 10 MOobjects.
• ROP.
The dropdown list will contain all the time periods defined on the MainWindow.
• X, Y and Z.
Each of these coordinates is set using numeric scrolling. The minimumis 0 and maximum is 256. From the resultset the X, Y and Z will havedifferent maximum values but the numeric scroll control is defaultingwith the maximum of 256.
SHO W AS AREA
FI G U R E 15.18: C H A R T B U I L D E R SH O W A S AR E A .
The Show As area with the “Lines” and “Bars” radio buttons is available onlyon the Builder Window for the 3-D charts. The 3-D Chart type will changeaccording to the selection.
CUSTOM AR EA
FI G U R E 15.19: CH A R T BU I L D E R C U S T O M AR E A.
The custom area allows the user to checkmark then create custom colorsand custom labels for each axis object. For example on the pie chart, eachpie slice is an axis object.
• Custom Colors.
When turned “on”, go to the chart image and click on the top of a pieslice. A color wheel will appear to select a color.
• Custom Labels.
When turned “on”, click the “Set” button and a “Custom Labels” dialogdisplays.
105
The Chart Builder

QuantiQa Client User Manual Part 1
FI G U R E 15.20: CH A R T BU I L D E R CU S T O M LA B E L S.
The choices on the Custom Labels window are to display the label either ina numeric format or as a name string.
• Range of Numbers.
A user can set the first number in a range with a step amount to thenext number and the number can have decimal point precision.
• Names.
Click “Insert” to add a label name, “Remove” to remove a label name,“Move Up” and “Move Down” to set the positioning of the label name.If more names are listed then there are axis objects the default isshow another object without a value plotted.
AXIS LABELS AND LABEL ORIENTATION
FI G U R E 15.21: CH A R T BU I L D E R X A X I S , PR I M A R Y Y AN D S E C O N D A RY Y A X I S LA B E L PA N E L S.
106

You can label the X and Y axes of Bar charts and XY charts as required.QuantiQa Client also provides the option of adding a second Y axis andlabel, to XY charts only. This can, for example, be set to a different scalethan that of the first Y axis, or relate to different data results in the samechart.
FI G U R E 15.22: EX A M P L E OF A CH A R T WI T H TW O Y A X E S .
You can define the data results to which the secondary Y axis refers, byclicking the plot that represents the data in the chart, or by clicking theappropriate entry in the chart legend, if displayed.
• X Axis Label.
○ Enter the label for the X axis.
○ The Tick Label field allows you to adjust the angle of the X axislabels.
○ If you select Custom Tick Labels, and click Set, the Custom XAxis Labels dialog displays. For further details about thisdialog, please refer to “Custom Labels”, earlier in this chapter.
107
The Chart Builder

QuantiQa Client User Manual Part 1
FI G U R E 15.23: TH E CU S T O M X AX I S LA B E L S D I A L O G.
• Primary and Secondary Y Axis Labels.
Enter the label for the Primary and/or Secondary Y axis. If you clickOptions, you can define:
○ The Axis Style:
• Bars.
• Lines.
• Step lines.
• Splines
○ The Axis Line style:
• Solid.
• Dash.
○ The Axis Scale:
• Linear.
• Logarithmic.
108

FI G U R E 15.24: TH E Y A X I S OP T I O N S D I A L O G.
WIDGETS: SLIDERS AND DROPLISTSClick Widgets to display the Chart Builder Widgets dialog.
FI G U R E 15.25: C H A R T BU I L D E R W I D G E T S D I A L O G.
The Widgets are the “Slider” and “Droplist” controls which are visible at thebottom of the main Chart Window. Each slider and droplist is defined as oneof the 6 coordinates types. The maximum number of widgets is 6, while theminimum is 0.
109
The Chart Builder

QuantiQa Client User Manual Part 1
LEGEND
FI G U R E 15.26: TH E CH A R T LE G E N D .
The chart Legend is an option that can be displayed as part of XY charts. Touse:
1. Click Legend.
Result: The Chart Builder Legend Options dialog displays.
FI G U R E 15.27: T H E CH A R T BU I L D E R LE G E N D OP T I O N DI A L O G .
2. Select the Legend Position that you require.
3. Do one of the following:
I. Type in the Distance from chart field, how far, in pixels, thelegend should be positioned, away from the chart.
or:
II. Click the up, or down arrowhead, positioned to the right of theDistance from chart field, until you have scrolled to therequired distance in pixels.
4. Click Close.
Result: The Chart Builder Legend Options dialog closes, and thechart legend is displayed.
110

GAUGE CH AR T
FI G U R E 15.28: BU I L D A NE W GA U G E CH A R T.
The following controls are common to Gauge charts, as well as the otherchart types:
• Title Area controls.
• Widgets.
NOTE:
The Gauge type chart is affected by all sliders.
For further information about these controls, please refer to the previoussection of this Guide.
The remaining controls used to create a Gauge chart, differ from those usedto define the other types of chart. These controls are:
• Position control.
This allows you to define the co-ordinates that the gauge uses. All sixco-ordinates, formula, MO, ROP, X, Y and Z are used to determine thegauge needle position.
When the Set button is clicked, the Chart Builder Coordinateswindow displays. For further details about using the Chart BuilderCoordinates window, please refer to "Co-ordinate Values" and"Figure 15.17: Chart Builder Coordinates", earlier in this chapter.
• Show colormap ring box.
When selected, this displays the formula's colormap as a progressivering around the circumference of the gauge.
111
The Chart Builder

QuantiQa Client User Manual Part 1
• Show value box.
When selected, this displays the numeric value of the gauge's currentneedle position in the chart panel.
• Decimal control.
This allows you to define the number of decimal places to whichdisplayed results are rounded.
• Major tick step control.
This allows you to define how often major division marks appear onthe face of the gauge. For example, setting the Major tick stepcontrol to 5, means that a major division mark will display at every 5units.
• Minor tick control.
This allows you to define how often major divisions are subdividedwith minor division marks. For example, setting the Major tick stepcontrol to 5, and the Minor tick control to 10, means that 10 minordivision marks will display, each representing 0.5 units.
• Micro tick control.
This allows you to define how often minor divisions are subdivided.with micro division marks. For example, setting the Micro tick controlto 10, means that a minor division will be subdivided into 10 microsections. In the example used above, these would each represent 0.05units.
112
Query Results
After a successful query to the server database, measurement data followsin the form of a resultset. It will be recalled that the query contains MO, ROPand preset information. The ResultSet is a structure containing MO, ROP,ITEM (preset formula), X, Y and Z information. Each value of the ResultSetcan be addressed by using these 6 coordinates.
MAPSFor the map, the user only needs to select a cell element. The measurementis retrieved from the ResultSet based on the selected cell element. To viewthe data for a cell element, select the line or wand protruding from the cellcenter (depicted as a small circle). After selection, right-click to bring up apop-up containing a scalar value, a scroll list containing all the timingadvance values or a pop-up table containing values.
TABLESFor the table all the data measurements available in the ResultSet will beviewed which means all the sets of values for the 6 coordinates are used.The measurements are displayed in a grid format on the Table/Recordwindow.
CHARTSWhen plotting a chart, settings for the 6 coordinates are defined in a chartlayout file. The chart layout files are built using the Chart Builder. From thechart layout configuration, defined sliders and/or dropdown lists contain thepossible selections for the 6 coordinates. The sliders and droplists will bevisible at the bottom of the main Chart window. The user can set the slidersand droplists to alter the charting of the data from the ResultSet..
The concept of the ResultSet with the coordinate information for the MO,ROP, ITEM, X, Y and Z is complex to describe. It was mentioned here purelyto give an overview of the ResultSet. The user does not require detailedknowledge of the ResultSet to view the data but an awareness may help indescribing some of the GUI controls used to manipulate the retrieval of data.The following sections describe the map, table and chart views of the dataretrieved from the ResultSet.
The following chapters describe the results windows in more detail.
113
16

QuantiQa Client User Manual Part 1
114

The Map Result Window
FI G U R E 17.1: TH E M A P R E S U LT W I N D O W.
The Map Result window provides a geographical view of cell locations andcell data. It consists of:
• The Map Title Bar.
• The Map Top toolbar.
• The Map Tools toolbar.
• The Map Results panel.
• The Map Color Scale.
• The Bottom toolbar.
In addition to displaying query results as a map, a Map Result window canalso be opened before running a preset, to display the geographical positionof Managed Objects that are selected in the MO Selection window. Thisenables you, for example, to more readily identify the MOs to use whenrunning a preset, according to their location.
MAP TITLE BAR
FI G U R E 17.2: MA P T I T L E B A R .
115
17

QuantiQa Client User Manual Part 1
The Map Title Bar is a standard QuantiQa Client User Defined windowTitle Bar, and includes:
• The map title.
• The Focus State Icon.
• Standard window control buttons.
The title is formatted as “Server name - Preset name - ROP time period”.For example, in the figure above, the server name is “Allen”, the preset is“Main_TRAF” and the time period displayed on the map is “11/12 12:00 –11/12 13:00”.
MAP TOP TOOLBAR
FI G U R E 17.3: MA P TO P TO O L B A R .
Some of the controls on the top toolbar are created by using file entries fromthe query’s preset. The description of these toolbar controls, reference boththe toolbar and the Preset Editor that contains the preset file for the query,as shown in the following illustration.
FI G U R E 17.4: EX A M P L E OF A PR E S E T F I L E W I T H CO L U M N EN T R I E S .
MAP TOP TOOL BAR BUTTONSThe Map top toolbar includes the following buttons and controls:
• Dragger.
• Auto Refresh.
• Global Dropdown List.
• Lock Drilldown Layer.
• Drilldown Dropdown List.
• Autoscale.
• Print.
116

• Pixel.
• Show Only Expanded Rows.
• Main Layer.
• Drilldown Layer Threshold.
DR A G G E R
The Dragger icon allows the user to select and drag from this icon theresults from the query to another map, table or chart window. After dragging,a copy of the map results, a corresponding set of results will be displayedon the destination map, chart or table window. If a window already containsresults, they will be replaced by the new results and displayed.
AU TO RE F RE S H
This button displays the Auto Refresh Settings dialog. This, when enabled,allows the Map Result window to be refreshed periodically.
FI G U R E 17.5: AU TO RE F R E S H IN DI S AB L E D MO D E.
FI G U R E 17.6: AU TO RE F R E S H IN EN AB L E D MO D E.
The dialog tells you the ROP granularity (period), and can be enabled asfollows:
1. Click the Auto Refresh button.
Result: The Auto Refresh Settings dialog displays.
2. Select Enable.
3. Do one of the following:
I. Use the scroll arrows to select the number of minutes it shouldtake, until the first refresh should begin.
or:
117
The Map Result Window

QuantiQa Client User Manual Part 1
I. Click the scroll box text field, and directly type in a value for thenumber of minutes it should take, until the first refresh shouldbegin.
4. Do one of the following:
I. Use the scroll arrows to select how often, in minutes, a refreshshould take place.
or:
I. Click the scroll box text field, and directly type in a value for howoften, in minutes, a refresh should take place.
5. Click OK to proceed, or Cancel to abort.
Result: Auto Refresh is enabled, using the defined settings.
When Auto Refresh is enabled, the Auto Refresh button is highlighted with ablue box, and the remaining time until the next refresh takes place, isdisplayed in the title bar of the Map Result window.
FI G U R E 17.7: N O T I F I C AT I O N OF NE X T AU T O RE F R E S H .
GL O B A L DR O P D O W N LI S T
The dropdown list contains the names from the preset file when the typeidentified in the Presets List column is “Global” or “Both”. For example,notice the “List” column for the row “Traf” indicates “Global”. This means“Traf” will appear in the Global Dropdown list on the map’s toolbar as isindicated above. If the “List” column indicated “Both” then “Traf” would belisted in the Global Dropdown list and the Drilldown Dropdown list.
LO C K DR I L L D O W N LAY E R
Lock button locks or unlocks the Drilldown droplist. When locked theDrilldown droplist is grayed out. When unlocked the background of the Lockbutton icon is highlighted and the Drilldown droplist enabled. The lockedmode sets the DrillDown mouse mode to use the formula indicated in thePreset’s DD Item column for the Drilldown data. For example, the “DD Item”for the row “Traf” indicates formula “TrafTA” so this formula’s data will beused on the map when the DrillDown mouse mode is invoked.
DR I L L D O W N DR O P LI S T
The Drilldown Droplist is enabled when the Lock Button is in an unlockedstate. The droplist contains the Names from the Preset file when the typeidentified in the Preset’s List column is “Drill” or “Both”. For example, the“List” column for the row “TrafTA” indicates “Drill”. This means “TrafTA” willappear in the Drilldown Droplist. If the “List” column indicated “Both” then“TrafTA” would be listed in the Global Droplist and the Drilldown Droplist.When the Lock button (described above) is unlocked then the data fromformula listed in the Drilldown Droplist is used on the map.
118

AU TO S C A L E
This turns the Autoscaling ‘on’ and ‘off’ and the button is highlighted when‘on’ (default condition). Autoscaling uses the selected formula in the GlobalDroplist to determine the colormap scaling. When colormap scaling changesit will change the background color of the colormap labels which affects thedata colors on the map such as the teardrop color and TA sector color.
PR I N T
The Print button enables you to print a copy of the map area currentlydisplayed in the Map Result window. Maps can be printed in landscape orportrait format and, if the area displayed is to large for the selected papersize, it is scaled down to fit the page.
PI X E L
Pixelization of a map is currently under development.
SH O W ON LY EX PA N D E D RO W S When visibility is locked in the MO Selection window, the Show OnlyExpanded Rows button displays, in addition to the MOs already shown on themap, all selected MOs within MO Selection window hierarchical lists thatwere previously expanded, but are now collapsed.
When visibility is unlocked, the Show Only Expanded Rows button displays, inaddition to all the selected MOs as described above, all visible MOs within MOSelection window hierarchical lists that were previously expanded, but arenow collapsed.
If the Show Only Expanded Rows button is deactivated, the map display returns toits original state.
MA I N LAY E R TH RE S H O L D
Main Layer Threshold sets the color map slider to use the values from theGlobal Droplist formula when in Drilldown mode. Drilldown mode is setwhen the Drill button in the Main Window Top Toolbar is turned on.
MA I N WI N D O W TO P TO O L B A R DR I L L B U T T O N
DR I L LD O W N LAY E R TH RE S H O L D
Drill-down Layer Threshold sets the color map slider to use the values fromthe Drilldown Droplist formula when in Drill-down mode. Drill-down mode isset when the Drill button in the Main Window’s Top Toolbar is turned on.
119
The Map Result Window

QuantiQa Client User Manual Part 1
FI G U R E 17.8: MA P AU T O S C A L E IS OF F.
When Autoscale is ‘off’ it uses the minimum and maximum values indicatedin the Min and Max columns in the Preset for the selected formula. For thePreset example above, on the “Traf” row the “Min” column equals “0” andthe “Max” column equals “5”. For the map this sets the colormap scalingbetween 0 – 5. We are using “Traf” because it is the selected formula in theGlobal Droplist.
FI G U R E 17.9: MA P AU T O S C A L E IS O N.
When Autoscale is ‘on’ the data retrieved for the selected formuladetermines the minimum and maximum value used for the colormap scaling.In the above figure, the minimum value appears to be 0.179 and themaximum value to be 2.878. Note: When ‘on’ the minimum and maximumvalues are determined by comparing all the values in the query including allROP time periods.
120

THE MAP TOOLS TOOLBAR
FI G U R E 17.10: T H E M A P TO O L S TO O L B A R.
The Map Tools toolbar, positioned to the left of the window, includes arange of controls, which are intended to help you customize the way thatdata is presented visually.
The Map Tools toolbar includes a selection of buttons, which define:
• How your mouse functions when it is used, within a visible and activeMap window.
• The information detail displayed.
• The map projection applied to a Map window.
MAP TOOLS TOOLBAR BUTTON SThe Map Tools toolbar includes the following buttons:
• Selection Pointer.
• Zoom In.
• Zoom Out.
• Zoom Extent.
121
The Map Result Window

QuantiQa Client User Manual Part 1
• Pan.
• Drill Down.
• Disable Drill Down.
• Show Neighbor Cells.
• Distance Measurement.
• Rectangle Selection.
• Polygon Selection.
• Layer Manager.
• Projection.
• File Manager.
SELEC TION POINTERWhen clicked, the mouse functionality is set to the default mouse mode. Itscursor is an arrow.
ZOOM IN When clicked, the mouse functionality is set to Zoom In mode. Its cursor isa magnifying glass, with a plus (+) sign. To use:
1. Click an appropriate point on a map.
Result: The map view zooms in to an enlargement of the selected area.
or:
1. Click and hold the left mouse button, over an appropriate point on amap.
2. Drag the mouse, to define a map area to zoom in to. The area ishighlighted with a dotted rectangle, as you define it.
3. Release the left mouse button.
Result: The dotted rectangular highlighting disappears, and the map view zooms in to the defined area.
NOTE:
If you press and hold <CTRL> while clicking on a map, the mousefunctionality toggles to Zoom Out mode. The magnifying glass cursordisplays a minus (-) sign.
122

ZOOM OUTWhen clicked, the mouse functionality is set to Zoom Out mode. Its cursoris a magnifying glass, with a minus (-) sign. To use:
1. Click an appropriate point on a map.
Result: The map view zooms out, and a larger area of the map displays, with the point you clicked at its center.
or:
1. Click and hold the left mouse button, over an appropriate point on amap.
2. Drag the mouse, to define a map area to zoom out from. The area ishighlighted with a dotted rectangle, as you define it.
3. Release the left mouse button.
Result: The rectangular highlighting disappears, the view zooms out, and a larger area of the map displays, with the portionyou defined, at its center.
NOTE:
If you press and hold <CTRL> while clicking on a map, the mousefunctionality toggles to Zoom In mode. The magnifying glass cursordisplays a minus (+) sign.
ZOOM EXTEN TWhen clicked, the mouse functionality is set to Zoom Extent mode. Itscursor is a magnifying glass, with a two chevron (< >) signs. To use:
1. Click and hold the left mouse button, over an appropriate point on amap.
2. Drag the mouse, to define a linear selection of the map area to zoomin to. The area is highlighted with a dotted line, as you define it.
3. Release the left mouse button.
Result: The highlighting disappears, and the map view zooms in tothe defined area.
PANWhen clicked, the mouse functionality is set to Pan mode. Its cursor is ahand. To use:
1. Click and hold the left mouse button over an appropriate point on amap.
2. Drag the mouse, to scroll the map view.
3. Release the left mouse button.
Result: The map view displays a different portion of the map.
123
The Map Result Window

QuantiQa Client User Manual Part 1
DR IL L DOWNWhen clicked, the mouse functionality is set to Drill Down mode. Its cursoris a hand drill, with a plus (+) sign. To use:
1. Click a point on the map, in which you are interested.
2. If you want to select further points:
I. Press and hold <CTRL>.
II. Click further points on the map, until you have selected all theones, in which you are interested.
III. Release <CTRL>.
Result: Cells associated with the selected point(s) are highlighted in red.
3. Right click a selected point.
Result: A dropdown list displays, which enables you to access statistical values (KPIs) assigned to a preset, and as a result, graphically analyze a network problem .
DISAB LE DRILL DOWNWhen clicked, all cell sticks associated with a drill-down, are removed fromthe map view. There is no change to mouse functionality, or its cursor'sappearance.
SHO W NEIGH BOR CELL SWhen clicked, the mouse functionality is set to Show Neighbor Cells mode.Its cursor is a broad arrow. To use:
1. Click an appropriate cell stick.
Result: Lines display in the map view, known as "cobwebs", which connect from the selected cell stick, to its target cells, or neighbors.
or:
1. Click an appropriate cell stick.
2. Press and hold <CTRL>, while selecting other cell sticks.
3. Release <CTRL> when finished.
Result: Multiple cobwebs display, connecting the selected cell sticks to their targets, or neighbors.
When the QuantiQa Client Handover and Neighbor Managementfunctionality is activated, the cobwebs display as one of three different typesof line, depending upon whether:
• The neighboring cell is a target of the selected cell stick.
• The target cell is measured.
124

FI G U R E 17.11: EX A M P L E S O F C O B W E B S W H E N US I N G TH E SH O W N E I G H B O R S M O D E .
F I G U R E 17.12: T H E M A N A G E D OB J E C T S FO R TH E AB O V E E X A M P L E .
To remove cobwebs from the map view:
1. Do one of the following:
I. Click a different cell stick to the one(s) selected.
or:
II. Click an area of the map view where there is no cell stick.
Result: The cobwebs are removed.
125
Target, but not measured.
Target and measured.
Measured, but not target.
The Map Result Window

QuantiQa Client User Manual Part 1
NOTE:
If the mouse cursor is placed over a cell stick, a Tool Tips listdisplays, which shows the details of its neighboring cell sticks. If theDisable Drill Down functionality is enabled, all cell sticks associatedwith a drill-down, are removed from the map view. There is no changeto mouse cursor's appearance.
DISTA NCE MEASU REM ENTWhen clicked, the mouse functionality is set to Distance Measurementmode. Its cursor is a cross hair. To use:
1. Click and hold the left mouse button, over an appropriate point on amap.
2. Drag the mouse to another point on the same map.
3. Release the left mouse button.
Result: The distance between the two points is measured, and displays towards the bottom left corner of the Map window.
RECTANGLE SELEC TIONWhen clicked, the mouse functionality is set to Rectangular Selectionmode. Its cursor is a left pointing arrow, with a rectangle. To use:
1. Click and hold the left mouse button, over an appropriate point on amap.
2. Drag the mouse, to define the map area to select. The area ishighlighted with a dotted rectangle, as you define it.
3. Release the left mouse button.
Result: The dotted rectangular highlighting disappears, and is replaced by a dotted, rectangular selection box. All cell locations within the box are selected. The corresponding Managed Objects are highlighted in the MO Selection window.
4. If you want to make further selections, press <CTRL> while repeatingsteps 1 to 3.
5. Release <CTRL> when finished.
NOTE:
When you have made a selection with the Rectangle Selection tool,and right click over the appropriate area, the number of selected pixelsis displayed.
If you have made multiple selections that overlap, any tickets includedin more than one selection, are counted once only.
126

POLYGON SELEC TIONWhen clicked, the mouse functionality is set to Polygon Selection mode. Itscursor is a left pointing arrow, with a polygon. To use:
1. Click the left mouse button, over an appropriate point on a map.
2. Move the mouse to the next point on the same map, and define thefirst side of the polygon.
3. Click the left mouse button.
Result: The side of the polygon is highlighted with a dotted line.
4. Repeat steps 2 and 3, until you have defined all the sides of thepolygon you require.
5. Double-click the left mouse button to close the polygon.
Result: The dotted linear highlighting disappears, and is replaced by a dotted, polygon-shaped selection box. All cell locations within the box are selected. The corresponding Managed Objects are highlighted in the MO Selection window.
LAYER MANA GERWhen clicked, the mouse functionality is set to Layer Control mode.
NOTE:
When a map is created, different layers of information are generated.Each layer of information represents a set of geographical data, storedin one database table. A graphical representation of this data displayson the map, and could be, for example, roads, or lakes.
To use:
1. Click the Layer Manager button.
Result: A Layer dialog displays. This shows a list of all of the layers, which combine to make up the active map. The dialog provides several control options, for example, Visible, which toggles a layer's display properties betweenvisible and invisible.
2. Select The layer that you want to manage, in the Layer dialog.
3. Select the control option(s) that you require.
4. Repeat steps 2 and 3, until you have made all necessary changes.
5. Press <ENTER>.
Result: The active map refreshes, and displays with the chosen options.
PROJECTIONWhen clicked, the map is set to Projection mode, and the Projection dialogdisplays.
127
The Map Result Window

QuantiQa Client User Manual Part 1
NOTE:
The Projection mode enables you to select the type of conversionthat is applied to a map, when the true positions of objects on theEarth's three dimensional surface, are plotted to representations on atwo dimensional area, such as your computer screen.
This conversion process always results in a degree of distortion, forseveral reasons. The intention behind changing the type ofconversion, is to reduce this distortion, and/or generate a map layoutwith the projection settings, which you require.
Use the Projection dialog to define:
• The Projection Category.
• The Projection Category Member.
The projection displayed, is the result of combining the ProjectionCategory and Projection Category Member settings.
Latitude/Longitude Robinson Sinusoidal
Polar Stereographic
FI G U R E 17.13: PR O J E C T I O N E X A M P L E S .
FILE MANA GERWhen clicked, the Third Party Map File Manager window displays. This isused to associate third party map files with QuantiQa Client.
To use:
1. Click the File Manager button.
Result: The Third Party Map File Manager window displays.
2. Click Add...
Result: A Windows Explorer window displays.
3. Navigate to the folder where the map files, which you want toassociate with QuantiQa Client, are stored on your computer.
4. Select the appropriate files.
5. Click Open.
Result: The name of the map file(s) display in the Third Party Files list.
128

6. Select a map file in the Third Party Files list.
Result: The file path displays in the File Path panel.
7. Use the controls in the File Properties panel to adjust the map'svisibility and transparency.
8. Repeat steps 6 and 7, as required.
9. Click OK.
Result: The Third Party Map File Manager window closes, and the third party map is displayed, according to the settings that you have defined.
To remove a third party map:
1. Click the File Manager button.
Result: The Third Party Map File Manager window displays.
2. Select the map that you want to remove in the Third Party Files list.
Result: The file path displays in the File Path panel.
3. Click Remove.
Result: The map file is deleted from the Third Party Files list.
4. Click OK.
Result: The Third Party Map File Manager window closes, and the map display refreshes.
NOTE:
The appropriate Map window must be active, before you can use theMap Tools. If a Map window is not active, the Map Tools toolbarbuttons appear gray, and are unavailable.
ACTIVATE A MAP WINDOW To activate a Map window:
1. Ensure that the required Map window is visible.
2. Click the Map window's Title Bar.
Result: The Map window is activated, and the Map Tools toolbar buttons are available.
THE MAP RESULTS PANEL
The Map Results panel includes a Geographical Information System (GIS)with an overlay of the retrieved data from a query. The GIS map will varydepending upon the customer locations for QOS assessment. The map canindicate the cell locations based on longitude and latitude, and thetechnology of each antenna. It can indicate the distance between celllocations. The user can view the managed object measurements for eachcell. This section will describe the use of the map controls found on the MapWindow and the map tools located on the Main Window.
129
The Map Result Window

QuantiQa Client User Manual Part 1
The map creation uses the query information containing the managedobjects, the preset formulas, the time periods and the element data. Eachmanaged object has geographic properties such as the longitude, latitudeand direction to determine the cell locations. See the MO Selection windowfor the geographical properties in a tabular format.
CELL LOCATION AN D CELL SECTOR
FI G U R E 17.14: M A P W I T H 2 C E L L LO C AT I O N S .
The map shown above is of a geographic area with 2 cell locations on themap. A cell location is based on the longitude and latitude. The cell locationis indicated as a circle. A cell location can have cell sectors. A cell sector isindicated as a black, blue, purple or red protruding line from the cell circle. Ifthe line is red then the cell sector is selected. The sector line is drawnbased on the direction of the MO(s) associated with this line.
When a cell sector is not selected, its length and color indicates itstechnology layer:
• A long black stick indicates L1 layer (usually assigned to GSM900).
• A medium length dark blue stick indicates L2 layer (usually assignedto GSM1800).
• A short dark purple stick represents L3 layer (usually assigned to FDDUMTS).
The 2 cell locations each have 2 cell sectors. Each cell sector has a coloredteardrop shape surrounding it. The teardrop or drop color corresponds to thecolormap legend on the right side of the map frame. The colormap legendindicates values with a different colored label for each value. So a drop coloris an indicator of the value retrieved from the query.
130

FI G U R E 17.15: C E L L LO C AT I O N W I T H TR A F D ATA.
On the map above is a cell sector with a label “4017699”. The drop color iswhite and matches the colormap indicator with an approximate value of2.878. The above figure indicates a popup with the label, “Traf 2.847600”.This popup label corresponds to cell sector “4017699”. To see the values forthe cell sectors, select a cell sector at the line protruding from the celllocation then right-click, a popup appears indicating the values for eachpreset formula. In this example there are 2 formulas, “Traf” and “TrafTA”.The value which is visible is for “Traf”. As mentioned previously the datavalues and preset formula information are available in the ResultSet.
FI G U R E 17.16: CE L L LO C AT I O N W I T H TR A F TA DATA.
The above figure shows a partial map with a cell sector selected and a pop-up with data visible. The second formula, “TrafTA”, is a 2G vector. Thevector is depicted as a one row scroll list. This vector is a timing advance(TA) which can have up to 64 values and is the reason for the addition of thescroll bar. Scrolling to the left or right allows you to view all 64 values.
The cell sector labeled “4017699” displays a ‘red’ line protruding from thecell location. This indicates the cell sector is selected. In addition, when acell sector is selected on the map the selection is also highlighted on theMO Selection window.
131
The Map Result Window

QuantiQa Client User Manual Part 1
FI G U R E 17.17: SE L E C T E D EL E M E N T O N M A P A N D MO S E L E C T I O N W I N D O W.
MULTIPLE MOS AT TH E SAME CELL SECTOR
FI G U R E 17.18: DE P I C T I O N OF 2 CE L L S E C T O R S , LE F T H A S M U LT I P L E MO S A N D
RI G H T HA S ON E MO.
In the case where there are multiple MOs with the same longitude, latitudeand direction, the cell sector line will be thicker. In the above figure, the firstimage contains 2 cell sectors. The image on the left has more than one MOas indicated with a thicker sector line. When the thicker sector line isselected a pop-up containing a labeled check box for each MO is visible asindicated in the second image. The user can click on a check box and theassociated MO will be selected on the map as the third image indicates withthe multiple MO sector line being red.
Although the pop-up is centered over the cell sector on the right, the checkbox selections affect the cell sector on the left. As mentioned previouslywhen a cell sector is selected on the map the MO is also selected in the listof MOs in the MO Selection Window. For multiple MOs on the same cellsector, when a check box is selected that MO is selected in the MOSelection Window.
132

MAP COLOR SCALE
FI G U R E 17.19: CO L O R M A P SC A L E W I T H SL I D E R AN D TH U M B S, H I G H A N D LO W.
On the QuantiQa Client GUI the color map scale is a gui control which isused for the map and the charts. This example of a colormap scale alsoincludes a slider with 2 thumbs on the right side of the scale. Only the mapwill have a colormap scale with a slider.
A colormap file determines the colors used on the scale. The specificcolormap file is set in the Preset file for the Query.
The colormap scale allows a graphic indication of a value. The data valueshave a direct correlation to a color. On the map the data can be presentedas colored tear drops around cell sectors or as TA sectors resemblingcolored arcs echoing out from a cell. On a chart data points are plotted andthe result will be various colored lines, bars or pie slices.
A colormap scale is visible with a slider to the right of the scale. The slider isused to set a range of values visible on the map. On the slider are 2 thumbs;one is positioned high at > 2.878 and the other positioned low at < 0.169.The scale between the thumbs is the range of values which can be viewedon the map. By sliding either the high thumb or low thumb, the effect on themap is that the color disappears for those teardrops or TA sectors where thecolor value is no longer in the range.
133
The Map Result Window

QuantiQa Client User Manual Part 1
FI G U R E 17.20: TE X T B O X W I T H TH E TH U M B VA L U E .
There are two methods to modify the slider range using the thumbs. One isto drag either thumb to the desired value. The second method is to select athumb with the mouse and right-click. A pop-up with an editable text field isdisplayed for a value to be entered. When the pop-up text field appears thecurrent value is set to the current position of the thumb on the numericscale. The result of editing a thumb value is the thumb will slide to the newvalue which will increase or decrease the range of the color values whichare viewable on the map.
MAP BOTTOM TOOLBAR
FI G U R E 17.21: MA P B O T T O M TO O L B A R.
The bottom toolbar contains the following buttons and controls:
• Distance Measurement Label.
• Blending Tools.
• Map (Blending Tool).
• Feat (Blending Tool).
• Image Sizing Tools.
134

• ROP Tools.
• Previous Button (ROP Tools).
• Speed/Play Button (ROP Tools).
• Next Button (ROP Tools).
DISTA NC E MEASUREM ENT LABELThe Distance Measurement Label indicates the distance from a selectedpoint to the drop point on the map. Distance Measurement mode is setwhen the Measurement button in the Main Window’s Top Toolbar is turnedon.
FI G U R E 17.22: DI S TA N C E BE T W E E N CE L L LO C AT I O N S .
The distance between 2 cell locations is indicated as a dash line. Thedistance label is indicated as “D: 8.481 KM” on the bottom toolbar.
BLEND ING TOOL SThe map’s Blending Tools consist of a dropdown list and slider. The toolsset the transparency of 2 areas on the map work area. A dropdown listcontains the icon options for Map and Feat. The Map option affects the GISMap and the Feat affects the map features. The map’s features consist ofthe colored images for the teardrop or TA displayed on the cell sectors. Thesecond tool is the Blending Slider. As the user moves the slider either theGIS Map or Map’s features will increase or decrease their transparency.
135
The Map Result Window

QuantiQa Client User Manual Part 1
FI G U R E 17.23: PA R T I A L GIS MA P W I T H MA P AR E A FA D E D.
MA P (BL E N D I N G TO O L)In the figure above the dropdown displays the the Map icon. As the slidermoves to the left the transparency will increase, until the map area isinvisible. As the slider moves to the right, the map transparency decreases.
FE AT (BL E N D I N G TO O L)As the slider moves to the left the transparency will increase until theimages for the teardrop or TA are invisible. As the slider moves to the rightthe images transparency decreases.
FI G U R E 17.24: PA R T I A L GIS MA P W I T H FE AT FA D E D.
136

IMAGE SIZ IN G TOOL SThe Image Sizing Tools consist of a dropdown list and slider. The sizingtools set the size of the cell sectors’ image features. A dropdown listcontains the options for either a:
• Teardrop Image.
• TA Image.
To be displayed on the map. The second tool is the Sizing slider. As the usermoves the slider either the teardrop increases or decreases in size and theTA image will increase or decrease in angle.
FI G U R E 17.25: M A X I M U M P O S S I B L E S I Z E OF TA IM A G E .
ROP TOOLSThe ROP Tools include a Previous button, a Speed/Play button, a Sliderand a Next button. The ROP Tools are available if a query contains morethan 1 ROP. The tools enable the user to set the ROP period to be displayedon the map work area. When a ROP changes the data for the ROP periodwill be displayed on the map and the ROP time on the Title Bar will beupdated.
PR E V I O U S BU T TO N (ROP TO O L S)The Previous button will set the ROP to the previous ROP period. Theslider moves to the left, and the map updates accordingly.
137
The Map Result Window

QuantiQa Client User Manual Part 1
SP E E D/PL AY BU T TO N (ROP TO O L S)The Speed/Play button is a combined button and dropdown list. By clickingthe play button the ROPs are updated automatically, on a time basis. TheSpeed dropdown enables the user to select the speed at which the ROPdata is automatically updated on the map.
FI G U R E 17.26: ROP SP E E D/P L AY BU T T O N W I T H SP E E D O P T I O N S .
NE X T BU T TO N (ROP TO O L S)The Next button sets the ROP to the next ROP period. The slider moves oneposition to the right, and the map updates accordingly.
MAP WITH A NOT A NUMBER (NAN) RESULT
FI G U R E 17.27: MA P SH O W I N G TH E D R I L L D O W N TA VE C T O R W I T H VA L U E S AN D NO N -VA L U E S .
138

A map which has a measurement retrieved from the query which is a NAN,or Not A Number, cannot be plotted in the same way as one with ameasurement that is. To make it clear that the vector contains a NAN, thevector displays with a white background and red crosshatch lines. This issimilar to the appearance of a NAN on a pie chart.
AN EXAMPLE OF USING DRILLDOWN
The following sequence of figures show:
• A map of a network area that shows where most Drops occur.
• The worst performing cell is identified, and its performance examined.
• Tickets are obtained for the instances of Drops.
• The list of PDUs is obtained for one of the tickets.
• See measurements after Handover is complete.
FI G U R E 17.28: A DR I L L D O W N EX A M P L E .
139
Click measure for tickets
Double Click ticket
See measure
The Map Result Window

QuantiQa Client User Manual Part 1
140

The Table Result Window
FI G U R E 18.1: TA B L E AN D RE C O R D S IN A TA B L E RE S U LT S W I N D O W.
The Table Result window contains the managed object data in a tabularformat. Along with the data, the table can also display the information for themanaged objects. The query result information contains the selectedmanaged objects, the ROP time settings, the formulas in the Preset and themeasurements retrieved from the server database. The Table/Record isfilled using some of the query result information. To display queryinformation in a table/record window the user can drag and drop a newresultset from another result window or select a preset then execute a table.
TABLE GRID
The structure of the table is a grid which allows sorting of the table bycolumn . The first row of the grid is the header row containing the Title andtype of the column. The titles depicted in the header row shown are “ROP”,“Parent”, “Name”, “Traf”, “TrafTA”, “Read Tables(%)” and “% Data”. Thesubsequent rows contain ResultSet information retrieved from the query andorganized in the grid according to the column header type. The header rowtitles will differ for at least 2 of the columns. In this example the “Parent”column references the query’s aggregation type which can vary dependingon the Preset, and the “Traf” and “TrafTA” columns which are the Presetformulas. The number of columns in the header row will vary based on thenumber of formulas in the Query’s Preset and the number of columns whichare not hidden.
141
18

QuantiQa Client User Manual Part 1
In the Table/Record example there are 3 ROP times ( “11/12 12:00 – 11/1213:00”, “11/12 13:00 – 11/12 14:00”, “11/12 14:00 – 11/12 15:00” ), 4managed objects ( “44017698”, “44017699”, “44017721”, “44017722” ), and2 Preset formulas ( “Traf” and “TrafTA” ). The twelve rows of datainformation are for the 4 managed objects multiplied by the 3 time periods(ROP).
The data or measurements retrieved from the query are different for eachPreset formula, for each managed object at each ROP.
The “Read Tables(%)”column indicates the percentage of the databasetables which responded from the initial query. The “% Data” columnindicates the percentage of possible counters returned from the query.
TABLE/RECORD TITLE BA R
FI G U R E 18.2: TA B L E T I T L E B A R.
At the top of each Table Window the title bar contains a title on the left andwindow controls on the right. The title is formatted as “Server name - Presetname - ROP time period”. For example in the aboved figure, the servername is “Allen”, the preset is “Main_TRAF” and the first ROP is “11/12 12:00– 11/12 13:00”.
The controls on the top right are the focus, window options, and the closebutton as standard for all user windows.
TABLE/RECORD TOOLBAR
FI G U R E 18.3: TA B L E /RE C O R D TO O L B A R .
The toolbar at the top of the table window has icon buttons and a dropdownlist.
The toolbar controls are as follows:
• Dragger.
• Auto Refresh.
• Export to Clipboard.
• Export to Disk.
• Export to Excel.
142

• Individual Cell Selection.
• Table Options.
• Column/Field Chooser.
• Collapse All Groups.
• Expand All Groups.
• Normalization Dropdown List.
DRAGGERThe Dragger icon allows the user to select and drag from this icon theresults from the query to another map, table or chart window. After draggingand processing, a copy of the table results, a corresponding set of resultswill be displayed on the destination map, chart or table window. If a windowalready contains results, the old results will be cleared and the new resultsdisplayed.
AUTO REFRESHThis button displays the Auto Refresh Settings dialog. This, when enabled,allows the Table Results window to be refreshed periodically.
FI G U R E 18.4: AU TO RE F R E S H IN DI S AB L E D MO D E.
FI G U R E 18.5: AU TO RE F R E S H IN EN AB L E D MO D E.
The dialog tells you the ROP granularity (period), and can be enabled asfollows:
1. Click the Auto Refresh button.
Result: The Auto Refresh Settings dialog displays.
143
The Table Result Window

QuantiQa Client User Manual Part 1
2. Select Enable.
3. Do one of the following:
I. Use the scroll arrows to select the number of minutes it shouldtake, until the first refresh should begin.
or:
I. Click the scroll box text field, and directly type in a value for thenumber of minutes it should take, until the first refresh shouldbegin.
4. Do one of the following:
I. Use the scroll arrows to select how often, in minutes, a refreshshould take place.
or:
I. Click the scroll box text field, and directly type in a value for howoften, in minutes, a refresh should take place.
5. Click OK to proceed, or Cancel to abort.
Result: Auto Refresh is enabled, using the defined settings.
When Auto Refresh is enabled, the Auto Refresh button is highlighted with ablue box, and the remaining time until the next refresh takes place, isdisplayed in the title bar of the Table Result window.
FI G U R E 18.6: N O T I F I C AT I O N OF NE X T AU T O RE F R E S H .
EXPOR T TO CLIPBOA RDWhen the export table selection button is clicked, the selected rows orselected cells in the table will be copied to the desktop clipboard. Thecontents on the clipboard can then be pasted.
NOTE:
By holding the Ctrl key multiple rows/cells can be selected. If nothinghas been selected when this button is pressed, a warning is given andno copy action is taken.
EXPOR T TO DISKWhen the Export and Save button is clicked, the selected rows, or selectedcells in the table, are copied and a SaveAs dialog will appear. This allowsyou to save the contents as a csv or tsv file, with a user-defined name andlocation. If nothing has been selected when this button is clicked, a warningis given and no copy action is taken.
144

EXPORT TO EXCELWhen the Export to Excel button is clicked, the selected rows or selectedcells in the table are copied into an Excel spreadsheet ,which can then besaved as a workbook with a user-defined name and location. If nothing hasbeen selected when this button is clicked, a warning is given and no copyaction is taken.
IND IV IDU AL CELL SELECTIONWhen this button is clicked, it changes the selection mode within the tablefrom row, to individual cell. When the button is in cell selection mode, it issurrounded by a blue highlight.
TABLE OPTIONSThis button opens a dialog for setting the decimal precision, and thousandsseparator options, for numerical results in the table. It also provides theoption of displaying row numbers.
FI G U R E 18.7: TA B L E OP TI O N S DI A L O G.
COLUMN/FIELD CHOOSERThe Column chooser or Field chooser is a dialog containing a drag anddrop list area. When you drag and drop a column header to the dialog, itdisplays the column name. After dragging a column header to the Chooserdialog, the column information will no longer be visible in the table.
NOTE:
The Formula columns, such as “Traf” and “TrafTA”, and the “ReadTables (%) and “% Data” columns cannot be dragged.
To retrieve a column from the chooser list you can select a column nameand drag it to the column header row or the column drag area above thetable. If a column name is dragged to the Header row, the column headerand column information will refresh.
145
The Table Result Window

QuantiQa Client User Manual Part 1
If a column name is dragged and dropped in the column drag area then thetable will refresh with a hierarchial grouping.
FI G U R E 18.8: TA B L E CO L U M N/FI E L D CH O O S E R DI A L O G.
COLLA PSE ALL GROUPSAll column groupings in the grid area collapse. A ‘+‘ sign is visible next tothe name of those elements that are collapsed.
EXPAN D ALL GROU PSAll column groupings in the grid area expand. A ‘-‘ sign is visible next to thename of those elements that are expanded.
NOR MA LIZAT ION DROPDOWN LISTThe Normalization dropdown list allows you to select a Normalization modefor the displayed counter data in the table. Normalization is calculated usingthe preset formulas in the query. There are 4 normalization modes asdepicted in the following figure.
FI G U R E 18.9: TA B L E NO R M A L I Z AT I O N OP T I O N S .
• Normalization off.
Provides the raw data and is the default setting shown in the abovedroplist.
• Maximum Value.
Normalizes the values according to the maximum value in eachformula.
146
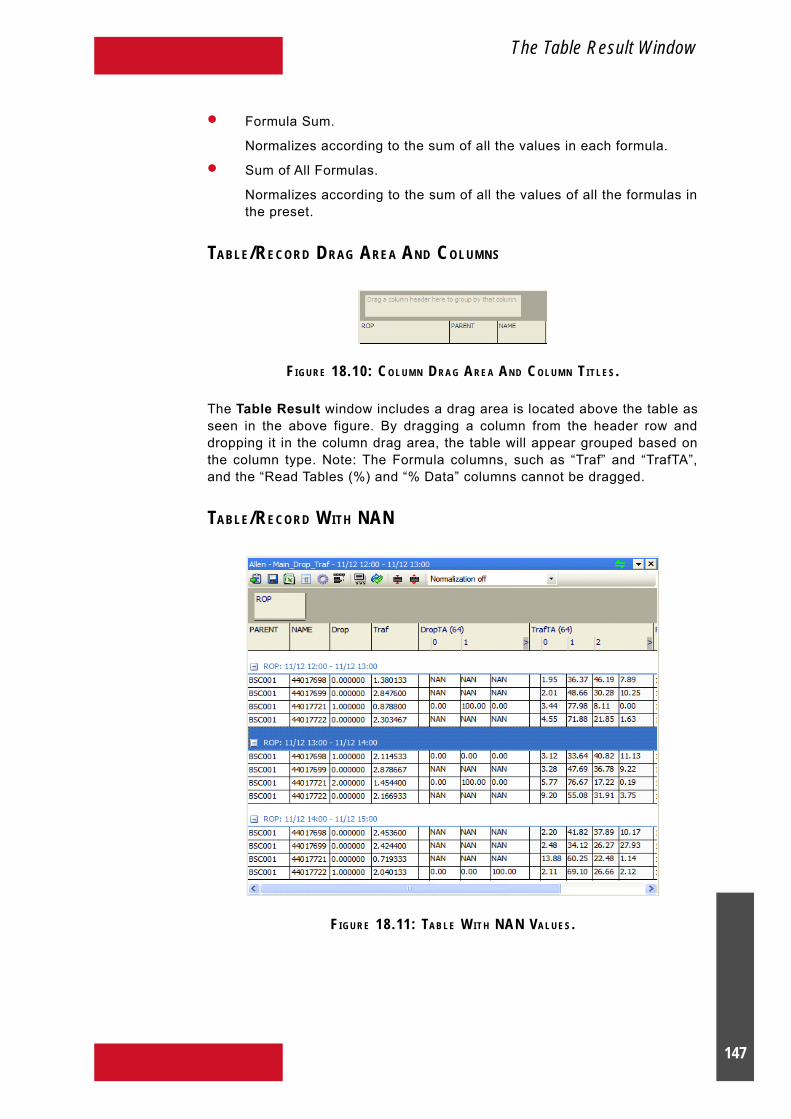
• Formula Sum.
Normalizes according to the sum of all the values in each formula.
• Sum of All Formulas.
Normalizes according to the sum of all the values of all the formulas inthe preset.
TABLE/RECORD DR AG AREA AN D COLUMNS
FI G U R E 18.10: C O L U M N D R A G AR E A AN D CO L U M N T I T L E S .
The Table Result window includes a drag area is located above the table asseen in the above figure. By dragging a column from the header row anddropping it in the column drag area, the table will appear grouped based onthe column type. Note: The Formula columns, such as “Traf” and “TrafTA”,and the “Read Tables (%) and “% Data” columns cannot be dragged.
TABLE/RECORD WITH NAN
FI G U R E 18.11: TA B L E W I T H NAN VA L U E S .
147
The Table Result Window

QuantiQa Client User Manual Part 1
When the value in the table grid indicates “NAN” this is an abbreviation for“Not A Number”. This is a measurement without value. Normalization cannotbe calculated when one of the measurements in the column has a “NAN” sothe rest of the values will default to a zero value.
148

The Chart Result Window
FI G U R E 19.1: CH A R T W I N D O W W I T H 3 CH A R T IM A G E S, 3 DR O P D O W N L I S T S AN D 1 S L I D E R.
The Chart Result window consists of a title bar, toolbar, panels with chartimages and a bottom toolbar. A chart can be created and viewed after aquery is successfully completed.
An empty chart window can be created by going to the Main Window NewMenu and selecting New Chart. A result can be dragged and dropped intothe chart window to start the processing of creating and displaying thecharts.
There are 5 chart types Pie, 2D Bar, 3D Bar, 3D Line and Gauge, which canbe created. Each chart will have at least one axis and one dimension. Thechart result window’s tools and chart layout area are explained in latersections.
CHART LAYOUT AND RESULTSET
When a query result is received by the result window, a file containing thelayout of the charts will be read. The layout file will indicate :
• The chart type for each chart.
• The initial resultset coordinates for each chart.
• Whether sliders or dropdown lists are available on the bottom toolbarof the chart’s dialog window.
149
19

QuantiQa Client User Manual Part 1
The number of charts is determined by the number of chart descriptions inthe chart layout file. The available chart types in the layout file are :
• Pie.
• 2-Dimensional Bar.
• 3-Dimensional Bar.
• 3-Dimensional Line.
• Gauge.
The values plotted on the charts are retrieved from the ResultSet. When aquery is sent to the server, a successful response will return a ResultSet.The ResultSet is a structure containing MO, ROP, Preset ITEM (formula), X,Y and Z information. Each value of the ResultSet can be addressed by usingthese 6 coordinates. Each pie, bar and line chart is able to have one of the 6coordinates as a chart axis and the axis is set in the layout file. The other 5coordinates can also be set in the layout file or a default setting is used. All6 co-ordinates are used to define the position of the needle in a gaugechart.
The example in the figure above, has 3 chart images, a 3D Bar chart, a 3DLine chart and a Pie chart. The layout file would contain at least 3 chartdescriptions for the example. The file also defines a droplist for “ROP”, adroplist for “MO”, a droplist for “ITEM” and a slider for “X”.
Some of the chart types can have 1 or more dimensions. In the figureabove, the Pie Chart has multiple dimensions. The width of the pie slices isone dimension. The height of the pie slice can be a dimension. The color ofthe pie slice can be a dimension. The dimensions for each chart type aredescribed in the chart type section for the Pie, 2D Line, 3D Line and 3D Bar.The user will be able to configure the number of dimensions by making theproper settings for the particular chart type using the Chart Builder.
CH AR T TITL E BA R
FI G U R E 19.2: CH A R T W I N D O W T I T L E BA R .
At the top of each Chart window the title bar contains a title on the left andwindow controls on the right. The title is formatted as “Server name - Presetname - ROP”. In the example above, the server name is “Allen” and thepreset is “Main_TRAF”.
The controls on the top right are the focus, window options, and the closebutton as standard for all user windows.
150

CHAR T TOP TOOLBAR
FI G U R E 19.3: CH A R T WI N D O W TO P TO O L B A R.
The toolbar buttons and controls are as follows:
• Dragger.
• Auto Refresh.
• Save Layout.
• Load Layout.
• Edit Layout (Unlock Chart).
• Zoom In.
• Zoom Out.
• Scroll.
• Save.
• Print.
• Autoscale With Data Dropdown List.
• Disable Items.
• Cumulative.
• Normalization Dropdown List.
DRAGGERThe Dragger icon allows the user to select and drag from this icon theresults from the query to another map, table or chart window. After draggingand processing, a copy of the chart results, a corresponding set of resultswill be displayed on the destination map, chart or table window. If a windowalready contains results, the old results will be cleared and the new resultsdisplayed.
151
The Chart Result Window

QuantiQa Client User Manual Part 1
AUTO REFRESHThis button displays the Auto Refresh Settings dialog. This, when enabled,allows the Chart Result window to be refreshed periodically.
FI G U R E 19.4: AU TO RE F R E S H IN DI S AB L E D MO D E.
FI G U R E 19.5: AU TO RE F R E S H IN EN AB L E D MO D E.
The dialog tells you the ROP granularity (period), and can be enabled asfollows:
1. Click the Auto Refresh button.
Result: The Auto Refresh Settings dialog displays.
2. Select Enable.
3. Do one of the following:
I. Use the scroll arrows to select the number of minutes it shouldtake, until the first refresh should begin.
or:
I. Click the scroll box text field, and directly type in a value for thenumber of minutes it should take, until the first refresh shouldbegin.
4. Do one of the following:
I. Use the scroll arrows to select how often, in minutes, a refreshshould take place.
or:
I. Click the scroll box text field, and directly type in a value for howoften, in minutes, a refresh should take place.
5. Click OK to proceed, or Cancel to abort.
Result: Auto Refresh is enabled, using the defined settings.
152

When Auto Refresh is enabled, the Auto Refresh button is highlighted with ablue box, and the remaining time until the next refresh takes place, isdisplayed in the title bar of the Chart Result window.
FI G U R E 19.6: NO T I F I C AT I O N O F N E X T A U T O RE F R E S H .
SAVE LAYOUTThe Save Chart Layout archives the current chart layout in the installationdirectory with the filename similar to “<presetname>.layout”. Whenever thesame query preset spawns a chart, the “<presetname>.layout” checks as towhether it exists. If it does, then this archived version of the layout for thecharts is used.
LOA D LAYOUTLoad Chart Layout checks whether the “<presetname>.layout” file exists inthe installation directory. If it does exist, the file is used to set or re-set thelayout of the charts.
EDIT LAYOUT (UNLOCK CH AR T)The Edit Layout button can be turned ‘on’ or ‘off’. When ‘on’ the button ishighlighted and the panes containing the chart images are changed to theunlocked and editable mode.
FI G U R E 19.7: TH R E E CH A R T PA N E L S U N L O C K E D A N D E D I TA B L E .
153
The Chart Result Window

QuantiQa Client User Manual Part 1
Each chart’s panel will appear attached as shown above but each pane isseparate with a title bar at the top. The title bar may not contain a title stringbut will have a pushpin button and ‘X’ button.
FI G U R E 19.8: TH E PA N E L T I T L E BA R .
• Title bar.
Select bar and drag the pane for re-docking within the chart layoutarea.
• Title.
May or may not be visible, if visible the title was defined in the chartlayout file.
• Pushpin button.
When clicked the pane will Autohide.
• X button.
When clicked the pane is deleted.
ZOOM INZoom In mode displays less data for each mouse click on the chart. ZoomIn mode can be turned ‘on’ and ‘off’ by clicking the button. When turned ‘on’the mouse is shaped as a spyglass with a ‘+’ sign when it is in the viewportarea of a chart.
ZOOM OUTZoom Out mode displays more data for each mouse click on the chart. ZoomOut mode can be turned ‘on’ and ‘off’ by clicking the button. When turned‘on’ the mouse is shaped as a spyglass with a ‘-‘ sign when it is in theviewport area of a chart.
SCROLLScroll Chart View mode allows scrolling through data in the chart view. Forlarge amounts of data when the data is first displayed on a Bar or Line chartthe chart software will display all the data. With this much data the lines andbars are so close together they become unreadable. The Zoom In mode andscrolling mechanism allow the user to adjust the amount of data to beviewed. The Zoom In will set less data in the viewport and the Scrollingallows the user to scroll forwards or backwards through the data.
By clicking on the Scroll Chart View button the scrolling mechanism isturned ‘on’ or ‘off’. To turn on scrolling, the mouse must be clicked and helddown over a chart viewport then moved to the left or right. The appearanceof the mouse will change to left and right arrows. This indicates the user canmove the mouse forward or backward through data.
154

SAVEWhen the Save button is clicked, a Save As dialog displays, which providesoptions to save the current chart in PNG, BMP, WBMP, JPEG, or GIF format.You can also save a chart at the currently displayed size, or at a customresolution, defined in pixels.
FI G U R E 19.9: TH E S AV E A S DI A L O G .
When multiple chart panels are displayed for different slider positions, forexample, for a range of Managed Objects and ROPs, you can batch saveall charts as separate files. The file names are automatically generated,which by default, include the preset, chart and managed object names,together with the ROP and date. This is done to ensure that each savedchart has a name that is both unique and identifiable.
The preset name displays in the File name text field however, and can bechanged as required. The other naming elements are not visible, and cannotbe changed from the Save As dialog.
To save a chart or group of charts:
1. Click the Save button.
Result: The Save As dialog displays.
2. Click the downwards arrow, to the right of the Save as type text field.
Result: A dropdown list of possible file types displays.
3. Select the appropriate file type.
155
The Chart Result Window

QuantiQa Client User Manual Part 1
4. In the Chart Selection panel, do one of the following:
I. If you only want to save the active chart, select Current sliderposition only.
or:
I. If you want to save all displayed charts, select All sliderpositions.
5. In the Size panel do one of the following:
I. Select Use current size to save the selection at the resolutionit/they appear at, on the screen.
or:
I. Select Custom size, then do one of the following:
a. Type the required size in pixels, in the Width and Heighttext fields.
or:
a. Use the arrows next to the Width and Height fields toscroll to the desired size in pixels.
6. In the File name text field, do one of the following:
I. Highlight the name that is currently displayed.
II. Type in any name that you require.
or:
I. Position the cursor before, or after the currently displayed name.
II. Type in any addition to the name that you require.
or:
I. Click the downwards arrow to the right of the File name textfield.
Result: A dropdown list of names displays.
II. Select a name from the list.
7. Do one of the following:
I. Click Save to proceed.
Result: The chart/s are saved at the size, and in the format selected. The Save As dialog closes.
or:
I. Click Cancel to abort.
Result: All actions are canceled, and the Save As dialog closes.
156
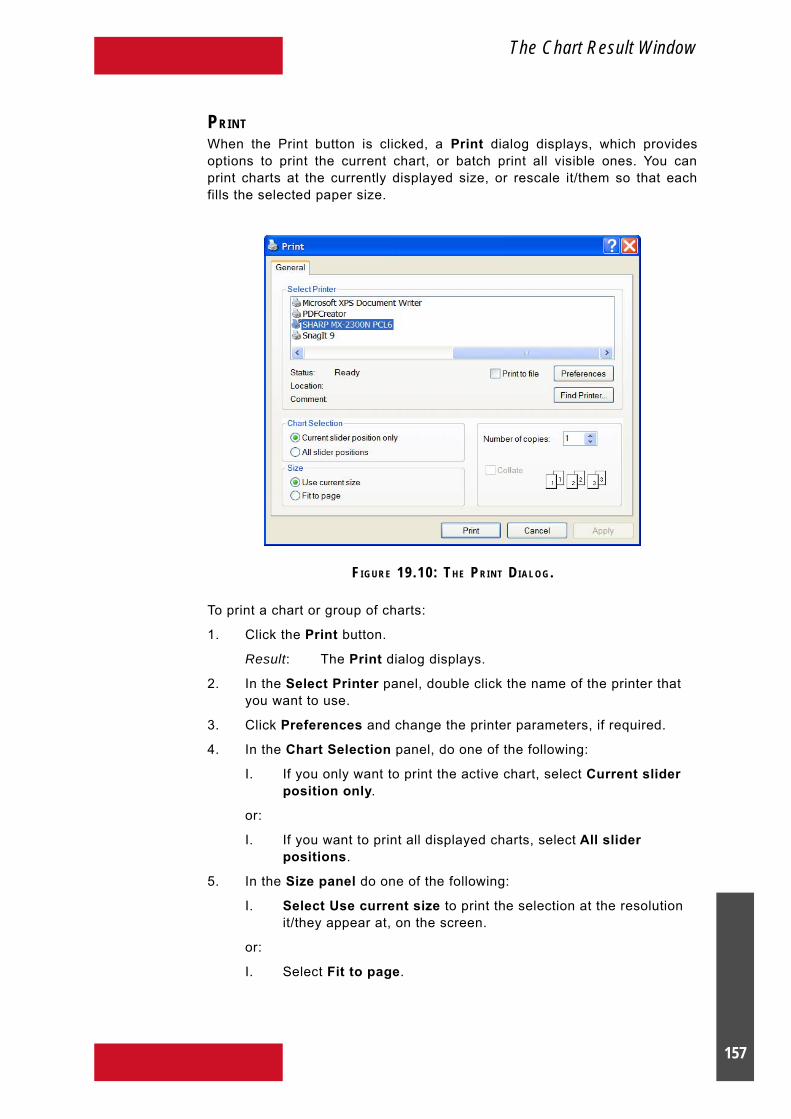
PRINTWhen the Print button is clicked, a Print dialog displays, which providesoptions to print the current chart, or batch print all visible ones. You canprint charts at the currently displayed size, or rescale it/them so that eachfills the selected paper size.
FI G U R E 19.10: T H E P R I N T DI A L O G .
To print a chart or group of charts:
1. Click the Print button.
Result: The Print dialog displays.
2. In the Select Printer panel, double click the name of the printer thatyou want to use.
3. Click Preferences and change the printer parameters, if required.
4. In the Chart Selection panel, do one of the following:
I. If you only want to print the active chart, select Current sliderposition only.
or:
I. If you want to print all displayed charts, select All sliderpositions.
5. In the Size panel do one of the following:
I. Select Use current size to print the selection at the resolutionit/they appear at, on the screen.
or:
I. Select Fit to page.
157
The Chart Result Window

QuantiQa Client User Manual Part 1
6. Select the number of copies that you want to print.
7. Do one of the following:
I. Click Print to proceed.
Result: The chart/s are printed at the size selected. The Print dialog closes.
or:
I. Click Cancel to abort.
Result: All actions are canceled, and the Print dialog closes.
AUTOSC ALE WITH DATA DROPD OWN LISTThere are 2 controls to set autoscaling. There is the Autoscale button andthe Data dropdown list. The button allows autoscaling to be turned ‘on’ and‘off’ with the button highlighted when ‘on’. Turning ‘on’ autoscaling affectsthe colormap scaling according to the range of the minimum and maximumvalues. Changing the colormap scale will affect the chart image colorsbased on the range.
The Data dropdown list determines the amount data used to set theminimum and maximum values. The data is either “Autoscale to all data” or“Autoscale to visible data”. For “all data” the minimum and maximum valuesare based on all the resultset data. For “visible data” the minimum andmaximum values are based on the data retrieved from the settings of thesliders and droplists on the bottom of the Chart Window.
FI G U R E 19.11: AU T O S C A L E WI T H D ATA CH O I C E S .
Autoscaling is ‘on’ when the button background is highlighted. To determinethe data state click on the dropdown list. A checkmark is visible in front ofeither “Autoscale to all data” or “Autoscale to visible data”.
NOTE:
Autoscaling has no impact on gauge charts, as only one data valuedisplayed.
DISAB LE ITEMSThis button opens a list of all the Formula items included in the resultset andfor multi-item resultsets, enables the used to deselect items not wanted fordisplay. In this way the user may simplify presentation for clarity and viewingof currently relevent items.
158

When an item checkbox is set the item is included in the chart.
FI G U R E 19.12: D I S A B L E FO R M U L A I T E M S L I S T.
CUMULATIVEThe Cumulative Mode calculates each retrieved value and sums it to theprevious value’s sum, such that
1st = 1st,
2nd = 1st + 2nd,
3rd = 1st + 2nd + 3rd
...
The cumulative values are used to plot points for the charts. The initial datavalues are retrieved from the Preset Item formula selected in the ITEMdroplist. The Cumulative mode is valid on the Line and Bar charts only. TheCumulative Mode button is highlighted when ‘on’.
NORMALIZAT ION DROPD OWN LISTThe Normalization dropdown list allows the user to select a mode tonormalize the data used to plot a chart. Normalization is calculated usingthe data from the Preset formula selected in the “ITEM” dropdown list orslider. The “ITEM” dropdown list at the bottom of the window is an example.
FI G U R E 19.13: TA B L E NO R M A L I Z AT I O N O P T I O N S .
159
The Chart Result Window

QuantiQa Client User Manual Part 1
• Normalization off.
Provides the raw data and is the default setting shown in the abovedropdown list.
• Maximum Value.
Normalizes the values according to the maximum value in eachformula.
• Formula Sum.
Normalizes according to the sum of all the values in each formula.
• Sum of All Formulas.
Normalizes according to the sum of all the values of all the formulas inthe preset.
AUTOSCALE EXAMPLES
For the charts a colormap scale is visible for the Pie Charts so for ourexample we use the Pie chart.
FI G U R E 19.14: AU T O S C A L E IS O F F AN D CO L O R SC A L E RA N G E IS BE T W E E N 0 – 5.
When Autoscale is ‘off’ it uses the minimum and maximum values indicatedin the Min and Max columns in the Preset for the selected formula in theITEM droplist. For the Preset, “Main_Traf”, on the “Traf” row the “Min”column equals “0” and the “Max” column equals “5”. The range for thecolormap scale is between 0 – 5. We are using “Traf” because it is theselected formula in the ITEM droplist.
160

If there is not a slider or droplist defining the ITEM, then a default ITEMformula will be used.
FI G U R E 19.15: AU T O S C A L E IS O N AN D CO L O R S C A L E R A N G E IS MI N A N D MA X OF RE S U LT VA L U E S .
When Autoscale is ‘on’ the data retrieved for “Traf” in the ITEM droplist isused. The minimum value appears to be 0.159 and the maximum value to be2.878 for all “Traf” data. The “Traf” data includes data from all ROP timeperiods. To determine whether the range of data to get the minimum andmaximum is for all the data or the visible data, click on the AutoScale’s Datadroplist.
WIDGETS: SLIDERS AND DROPDOWN LISTS
The sliders and dropdown lists at the bottom of the Chart Result windoware configurable. The definition of the sliders and dropdown lists are madein the chart layout file using the Chart Builder.
As mentioned previously the query resultset contains the values ormeasurements used to plot the points on the charts. To extract values fromthe resultset structure there are 6 coordinates, MO, ROP, ITEM, X, Y and Z.The sliders and droplists are defined using the 6 coordinate types.
FI G U R E 19.16: E X A M P L E OF MO ROP IT E M DR O P D O W N L I S T S A N D X SL I D E R ON TH E BO T T O M TO O L B A R
161
The Chart Result Window

QuantiQa Client User Manual Part 1
Before a slider or dropdown list is created the chart layout file is read todetermine how many sliders or dropdown lists to create. The maximumnumber of sliders and dropdown lists is 6, one for each coordinate type. Theminimum number of sliders or dropdown lists can be 0 because it is not arequirement to define a slider or dropdown list. The size of the coordinate inthe resultset determines the slider range. The coordinate’s names in theresultset defines the item strings in the dropdown list.
For a simple example, consider a query with 4 MOs with the names“44017698”, “44017699”, “44017721” and “44017722”. (This information isavailable in the query result.)
The slider type is MO so the slider range would be 1 – 4 because there are4 MOs in the query. By clicking the right arrow the slider can slide to theright 3 times. Changing the slider value changes the MO whosemeasurements are retrieved from the query resultset. As the MOmeasurements change, the points plotted on the chart change.
FI G U R E 19.17: MO SL I D E R WI T H R A N G E OF 4.
If the dropdown list type is MO, the list of items would be “44017698”,“44017699”, “44017721” and “44017722”. Because the dropdown listdisplays the item strings and there are 4 MOs in this query. By selecting adifferent MO, the measurements retrieved from the resultset will differaffecting the points plotted on the chart.
FI G U R E 19.18: MO DR O P D O W N L I S T W I T H MO N A M E S .
162

The sliders and dropdown lists allow the user to change the selection of acoordinate value. By changing the selection the measurement data changes.
FI G U R E 19.19: 2D BA R W I T H MO D R O P D O W N L I S T = 44017698.
F I G U R E 19.20: 2D BA R W I T H MO D R O P D O W N L I S T = 44017721.
The two charts above, show the results of changing the MO Dropdown listfrom “44017698” to “44017721”. The values plotted on both charts arevisually different. The remaining 5 coordinates for ROP, ITEM, X, Y and Zdid not change in either chart.
The case where a selection is changed for a coordinate and the chart doesnot change is when the slider or dropdown list coordinate type is the sameas the chart axis. An example is described for the pie.
163
The Chart Result Window

QuantiQa Client User Manual Part 1
FI G U R E 19.21: PI E CH A R T W I T H A N G L E, H E I G H T, CO L O R AN D MO D R O P D O W N L I S T.
On the pie chart the axis is the angle of the slice. If a slider is set to thesame coordinate as the angle then changing this slider will not have anaffect on the angle of the pie slices because all the values are alreadyvisible. In the above figure, the axis is set to MO, there are 4 MO pie slicesshown and the MO dropdown list is set to “44017698”.
If the dropdown list changes to a different MO the chart will not changesince the measurements for all the MOs are already visible for this ROP,ITEM, X, Y and Z. If the ROP dropdown list time period changes though themeasurements for this time period will change the plot points on the chart.
FI G U R E 19.22: P I E C H A R T W I T H NO S L I D E R S O R D R O P D O W N L I S T S DE F I N E D .
164

In the situation where there are no sliders or dropdown lists, defaultcoordinate values are used to retrieve the measurements from the resultset.The measurements for the map will not change. The values used to plot thechart will change only if Cumulative or Normalization are turned on becausethese 2 modes use the results of calculations done on the original retrievedmeasurement. When setting Autoscaling it appears the chart values havechanged but this mode affects the minimum and maximum settings on thecolormap scale. Autoscaling uses the original measurements to plot thechart.
PIE CHART
Each chart type will have at least one axis defined in the chart layout file.The Pie’s axis is the angle. The angle is depicted as a pie slice. The Pie is achart type which can be configured to have multiple dimensions. The height,color and displacement of the slice can be separate visible dimensions butare optional. For a dimension to be turned on or visible it must be defined inthe chart layout file by using the Chart Builder. When a dimension isdefined each of the 6 coordinates, MO, ROP, ITEM, X, Y and Z, can be set.The setting of all of the coordinates determines the value or non-value readfrom the resultset.
The following section describes the 4 possible dimensions of the pie:
• Angle.
• Color.
• Height or Depth.
• Displacement.
PIE ANGLE
FI G U R E 19.23: PI E CH A R T: 4 MOS W I T H DATA DE P I C T E D A S SL I C E S OR AN G L E S .
The Pie Chart has the axis set to MO because the labels are MO names.There are 4 MOs in this query since there are 4 slices in the pie. Althoughthis example has color, the colors are using the default colormap since acolormap scale is not visible. From the example the MO “44017699” has thelargest data value compared with the widths of all 4 slices. This depictiongives you one dimension of the data measurements retrieved for this query.
165
The Chart Result Window

QuantiQa Client User Manual Part 1
PIE COLOR
FI G U R E 19.24: 4 MO S W I T H DATA DE P I C T E D AS 4 AN G L E S AN D 4 CO L O R S .
The Pie Chart has the axis set to MO but the color has been turned onbecause the colormap scale is visible on the right side. In the scenariowhere there are multiple Preset Formulas in a query, the pie can beconfigured to use one Preset formula for the angle width and a differentPreset formula to depict the color. This would allow one dimension for theangle width and a different dimension for the color.
The color gives a visual view of a value. The colormap scale contains valuelabels with different background colors. The pie slice color shouldcorrespond with the value on the colormap scale. In the example the MO“44017699” has an approximate value of 2.878 since the color of the slice iswhite and corresponds to the white label of “2.878”.
The colormap scale depiction is similar to the colormap scale used on theMap window.
PIE HEIGH T
FI G U R E 19.25: MO S W I T H DATA DE P I C T E D A S 4 AN G L E S AN D 4 HE I G H T S .
The Pie chart has pie slices with varying heights or depths. The pie slicesalso have varying widths. Again the axis is set to MO since the labels areMO names and there are 4 MOs in the query since there are 4 pie slices.The color associated with the slices has no meaning since there is not avisible colormap scale. In the example, slice “44017699” has the greatestvalue since the slice height is the tallest. The height of the slices will gofrom the tallest at the top to the smallest going clockwise.
166

PIE DISPLACEMENT
FI G U R E 19.26: MOS W I T H DATA D E P I C T E D A S 4 A N G L E S AN D 4 DI S P L A C E M E N T S .
The Pie chart is depicted with pie slices displaced from the center. The pieslices also have varying widths. Again the axis is set to MO since the labelsare MO names. There are 4 MOs in the query since there are 4 pie slices.The color associated with the slices are default colors and have no meaningsince there is not a visible colormap scale. The displacement of a pie slicefrom the center should correspond to a value. The greater the value thegreater the displacement of the slice from the center.
PIE WITH A NAN
FI G U R E 19.27: P I E C H A R T W I T H 2 VA L U E S A N D 2 N O N -VA L U E S .
A Pie chart which has a measurement retrieved from the query which is“NAN” or “Not A Number” can not be plotted the same as a measurementwhich is a number. To make it obvious one of the pie sectors is a “NAN”, thepie sector will appear with a white background and red crossed lines. This issimilar to the appearance for a “NAN” on the map.
167
The Chart Result Window

QuantiQa Client User Manual Part 1
TWO DIMENSIONAL BAR CHAR T
FI G U R E 19.28: 2D BA R CH A R T W I T H CO L O R .
Each chart type will have at least one axis defined in the chart layout file.The 2D Bar chart’s axis is the height. The height is the point plotted on thechart. The bar chart has one other dimension which is the color. For adimension to be turned on or visible it must be defined in the chart layout fileby using the Chart Builder. When a dimension is defined each of the 6coordinates, MO, ROP, ITEM, X, Y and Z, can be set in the chart builder.The settings of all the coordinates determines the measurements read fromthe resultset.
The 2D Bar chart in the figure above, indicates the color dimension is turned“on” because the colormap scale is visible. The x-axis is set to the ROPcoordinate since ROP labels are visible on the horizontal axis.
If the result of a measurement is “NAN” or “Not A Number”, this non-valuecannot be plotted so a bar will not be visible for that point. Normalizationand Cumulative mode do not apply on the 2D chart.
168

THREE DIMEN SION AL BAR AN D LIN E CHAR T
FI G U R E 19.29: 3D LI N E CH A R T.
Each chart type will have at least one axis defined in the chart layout file.The 3D Bar and 3D Line Chart have 2 axes defined as “bars” and “sets”. The“bars” and “sets” can be set to any of the 6 coordinates, MO, ROP, ITEM(formula), X, Y and Z but cannot be set to the same coordinate type. Eachaxis is defined in the the chart layout file by using the Chart Builder. TheChart Builder defines the 3D Bar and 3D Line Charts as XY charts. Customcolors of the lines or bars are defined in the chart layout file otherwise theyare the default colors of the charting software.
For the XY chart (3D Bar or 3D Line), each coordinate value defined as theaxis for “sets” is displayed as a position on the horizontal axis (x-axis). Eachcoordinate value defined as the axis for “bars” is displayed as a separateline or bar.
FI G U R E 19.30: 3D BA R CH A R T.
169
The Chart Result Window

QuantiQa Client User Manual Part 1
In the two figures above, the top title indicates the axis settings as“Sets:MO” and “Bars:ROP”. The query, Main_TRAF, contains 4 MOs and 3ROPs. The horizontal axis displays the 4 MO strings, “44017698”,“44017699”, “44017721” and “44017722”. The chart legend is reflective ofthe “bars” and the coordinate value of each ROP, “11/12 12:00 – 11/1213:00”, “11/12 13:00 – 11/12 14:00” and “11/12 14:00 – 11/12 15:00”. EachROP bar is denoted with a different color.
The different coordinate values for the “sets” and “bars” will retrieve themeasurements to be plotted for the height. The height for each combinationof MO with each ROP is shown in the 2 charts as:
MO-44017698 ROP:11/12 12:00 – 11/12 13:00 > red bar or line
ROP:11/12 13:00 – 11/12 14:00 > green bar or line
ROP:11/12 14:00 – 11/12 15:00 > blue bar or line
MO-44017699 ROP:11/12 12:00 – 11/12 13:00 > red bar or line
ROP:11/12 13:00 – 11/12 14:00 > green bar or line
ROP:11/12 14:00 – 11/12 15:00 > blue bar or line
and so on for each MO with each ROP.
Keep in mind the settings for the 4 other coordinate types of ITEM, X, Y andZ are also in the retrieval. So the true settings used in the retrieval from theresultset would be similar to:
MO-44017698, ITEM-Traf, X-0, Y-0, Z-0
ROP:11/12 12:00 – 11/12 13:00 > red bar or line
ROP:11/12 13:00 – 11/12 14:00 > green bar or line
ROP:11/12 14:00 – 11/12 15:00 > blue bar or line
MO-44017699, ITEM-Traf, X-0, Y-0, Z-0
ROP:11/12 12:00 – 11/12 13:00 �red bar or line
ROP:11/12 13:00 – 11/12 14:00 > green bar or line
ROP:11/12 14:00 – 11/12 15:00 > blue bar or line
and so on for each MO with each ROP.
TH REE DIMENSIONAL BA R AND LINE CH AR T WITH NAN
FI G U R E 19.31: 3D L I N E AN D 3D BA R W I T H NAN.
170

For “NAN” results on the 3D Line Chart the point is not plotted but willappear to be 0. From this NAN point (at 0) the line segment will indicate adifferent color from the rest of the line. The “NAN” result on a 3D Bar chart isnot plotted so a bar will not be visible for a NAN point.
Based on the query results for DropTA with X = 1, the appearance of the 2charts for 3D Line and 3D Bar are shown in the figure above. For the linechart on the left, notice the gray line. This gray line is indicating the firstpoint at “44017698” plotted is a NAN. The second point at “44017699” is aNAN. The third point at “44017721” is 100.
On the line chart the third point at “44017721” should indicate a red andgreen dot but the pixel points are too small to be visible. For Line chartswhen the plotted points are not contiguous the line will not be visible and theresolution for the plotted points may not be visible either. For non-contiguous plotted points the bar chart is better to display thesemeasurements.
In the figure above, the Bar chart on the right shows “4401698” at point 0has a green bar barely visible and “44017721” at point 100 has a red andgreen bar. The NAN values are not plotted.
FI G U R E 19.32: EX A M P L E OF RE S U LT TA B L E W I T H NAN RE S U LT S .
171
The Chart Result Window

QuantiQa Client User Manual Part 1
GAUGE CHAR T
FI G U R E 19.33: G A U G E C H A R T.
Each chart is defined in the chart layout file, using the Chart Builder. Thegauge needle can be set to any of the 6 coordinates, MO, ROP, formula, X,Y and Z.
The formula's colormap can be displayed as a progressive ring around thecircumference of the gauge, and the numeric value of the current needleposition may also be shown, with the appropriate decimal rounding asdefined using the Chart Builder. The gauge is affected by all sliders.
The face of the gauge may be divided using major division marks. Thesecan in turn, be subdivided with minor and micro division marks.
172

The Ticket List Window
FI G U R E 20.1: A TY P I C A L T I C K E T L I S T W I N D O W.
The Ticket List window lists all those tickets associated with any one of thefollowing:
• A specific search as made by the Ticket Finder dialog.
• A Drilldown from a KPI/KPM displayed on a map or in table.
• The use of the Drilldown Filter dialog to select a ticket.
• A Drill Up, or Trace Up from a PDU under analysis.
The Ticket List is a table presenting one or more tickets/procedures foranalysis and the table contains the summary information for each ticket.
The Ticket List table includes the standard column sorting and re-arrangement facilities to help organise the table and gather details asrequired from the tickets. If needed the user can double click a ticket row todrill down to protocol analysis for still deeper study of its messages and theircontents.
NOTE:
If a ticket list is already open and in use, it can be overwritten by asubsequent ticket list. To avoid this, use the New Toolbar button toopen a new ticket list and leave this selected before creating anotherticket list.
173
20
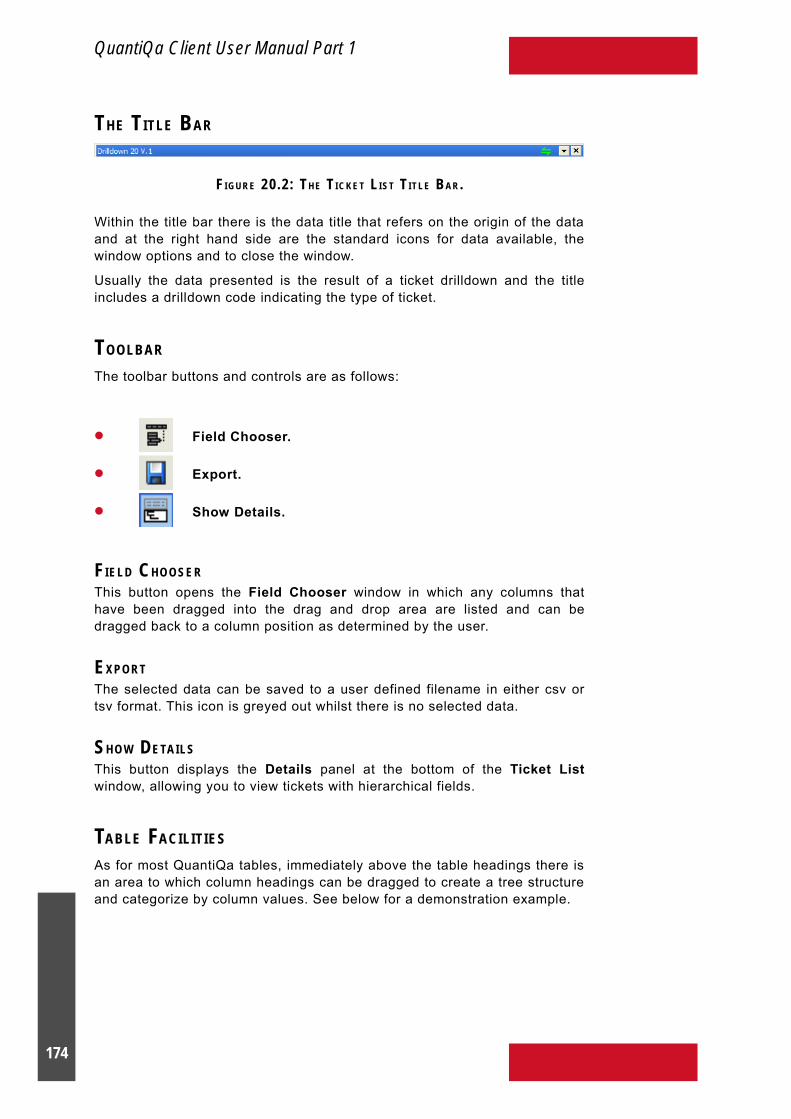
QuantiQa Client User Manual Part 1
THE TITLE BAR
FI G U R E 20.2: TH E T I C K E T L I S T T I T L E BA R .
Within the title bar there is the data title that refers on the origin of the dataand at the right hand side are the standard icons for data available, thewindow options and to close the window.
Usually the data presented is the result of a ticket drilldown and the titleincludes a drilldown code indicating the type of ticket.
TOOLBAR
The toolbar buttons and controls are as follows:
• Field Chooser.
• Export.
• Show Details.
FIELD CHOOSERThis button opens the Field Chooser window in which any columns thathave been dragged into the drag and drop area are listed and can bedragged back to a column position as determined by the user.
EXPOR TThe selected data can be saved to a user defined filename in either csv ortsv format. This icon is greyed out whilst there is no selected data.
SHO W DETAILSThis button displays the Details panel at the bottom of the Ticket Listwindow, allowing you to view tickets with hierarchical fields.
TABLE FACILITIES
As for most QuantiQa tables, immediately above the table headings there isan area to which column headings can be dragged to create a tree structureand categorize by column values. See below for a demonstration example.
174

FI G U R E 20.3: TA B L E DR A G AN D DR O P AR E A, AN D F I E L D CH O O S E R L I S T.
The Field Chooser button can be used to display the Field Chooserwindow as means to restore columns as with other tables.
A left mouse click on any ticket will select it. A group of tickets can beselected by using the control or shift keys with a further click.
A right mouse click on any ticket or over an existing selection offers theopportunity to export the selected data by saving it in csv or tsb format.
FI G U R E 20.4: EX P O R T I N G T I C K E T IN F O R M AT I O N .
A double click on any ticket row will select the row and open the ProtocolAnalyzer for analysis of all its procedures and PDUs. To ensure a newProtocol Analysis window is opened, hold <CONTROL> and double click.
175
The Ticket List Window

QuantiQa Client User Manual Part 1
176

The Protocol Analyzer Window
FI G U R E 20.1: TY P I C A L P R O C E D U R E L I S T SH O W I N G A T I C K E T L I S T W I N D O W WI T H O U T TR A C E D T I C K E T S.
This window lists all those messages (PDUs) associated with a specificTicket and has extensive facilities for analysis of the sequence of messages,for analysis of the contents of any message, and its structure right down tobit level.
This window is a single window that can include several panes for which atypical arrangement is shown below.
NOTE:
When the Protocol Analysis first opens, nothing is selected and so theDetails and Bytes panes will contain no data.
TITLE BAR
FI G U R E 21.2: TH E PR O T O C O L AN A LY Z E R T I T L E BA R .
Within the title bar there is the data title that refers on the origin of the dataand at the right hand side are the standard icons for data available, thewindow options and to close the window. The data presented is usually theresult of a ticket drilldown. The title includes a code for the type of ticket.
PROTOCOL ANALYSIS TOOLBAR
FI G U R E 21.3: PR O T O C O L A N A LY Z E R TO O L B A R.
177
21
PDU Bytes Pane
PDU Content Pane
PDU List Pane
Trace Diagram

QuantiQa Client User Manual Part 1
The toolbar buttons and controls are as follows:
• Protocol Analyzer View.
• Trace Diagram View.
• Mixed View.
• Find Text.
• Column Chooser.
• Refresh.
• Export.
PROTOC OL ANA LYZER VIEWClicking on this button selects the normal tabular presentation of proceduremessages (PDUs) in the message table pane. This selection also includesthe PDU Contents and PDU Bytes panes.
TR AC E DIAGRAM VIEWClicking on the Trace Diagram button selects display of the Trace Diagramonly, showing message flow.
MIXED VIEWClicking on the Mixed View button provides the message analyzer and flowsequence message views, side by side. I.E. this displays all panes together.
FIND TEXTThis button helps you locate specific text.
COLUM N CHOOSERThis button opens the Column Chooser window in which any columns thathave been dragged into the drag and drop area are listed and can bedragged back to a column position as determined by the user.
REFRESHThis refreshes the contents of the protocol analyzer window as determinedfrom the selected ticket.
EXPOR TThe selected data can be exported to a user defined file in either text, binaryor Wireshark format. This icon is grayed out when there is no selected data.
178

FI G U R E 21.4: TH E E X P O R T M E N U.
The following shows the different display options available, by using the firstthree buttons of the Protocol Analyzer toolbar.
FI G U R E 21.5: TH E P R O T O C O L A N A LY Z E R D I S P L AY O P T I O N S .
179
The Protocol Analyzer Window

QuantiQa Client User Manual Part 1
PDU LIST PANEL
FI G U R E 21.6: PR O T O C O L A N A LY Z E R PDU L I S T PA N E L .
This is the master panel for the Protocol Analyzer and from which one PDUmessage at a time can be selected for thorough analysis. In this pane thePDUs are tabulated in a similar manner to other QuantiQa tables andcolumns can be dragged into the drag and drop area at the top of the pane,for hierarchal regrouping of messages according to the values of thedeposited column(s).
When data is available this pane should contain one or more PDUs, and thescroll bars may need to be used to view all the data. PDU rows have either agreen or blue background. Green signifies an uplink message, and blueindicates a downlink message.
By default, the PDU rows are presented in chronological order but the usercan reorganize the table sequence to follow the ascending or descendingvalues of any column by clicking the column heading, and of courserearrange size and sequence of columns.
A left mouse click on any PDU message in the PDU List will select the PDUfor more detailed display of its contents in the PDU Contents and PDU Bytespane.
A right mouse click on any PDU in the PDU List will open a menu to :
• Trace the PDUs procedure.
• Drill up to the PDUs ticket.
• Export the PDU (in Text, Binary of Wireshark formats).
• Select all PDUs.
TRACE THE PDU PROCEDURES
From a selected PDU the user can trace other procedures in which this PDUis included. After a Right mouse click and selecting “Trace procedure”, thedrop down list of ticket types appears. A click on an item here determineswhether the selected PDU is included. If it is the corresponding procedurelist is displayed.
180

FI G U R E 21.7: TH E DR O P D O W N L I S T OF T I C K E T TY P E S.
The PDU selected above, is included in three procedure lists, - RadioLink,AbisCallTrace, and Channel Request. The procedures found, are shownhere.
FI G U R E 21.8: EX A M P L E S O F P R O C E D U R E S FO U N D .
181
The Protocol Analyzer Window

QuantiQa Client User Manual Part 1
DR IL L UP TO TICKETFrom a selected PDU the user can drill up to tickets in which this PDU isincluded. After a Right mouse click and selecting “Drill up to ticket”, the dropdown list of ticket types appears. A click on an item here determines whetherthe selected PDU is included. If it is, the ticket is displayed.
FI G U R E 21.9: TH E D R O P D O W N L I S T O F T I C K E T TY P E S.
The PDU selected above, was included in three tickets, RadioLink,AbisCallTrace, and Channel Request. The tickets found are shown below.
FI G U R E 21.10: EX A M P L E S OF T I C K E T S FO U N D .
PDU CONTENTS PANELThis panel displays the descriptive contents of the PDU selected in the PDUList pane, and when a PDU is first selected it is displayed here in closedhierarchal form.
182

FI G U R E 21.11: PR O T O C O L A N A LY Z E R PDU CO N T E N T S PA N E L WI T H C L O S E D H I E R A R C H Y.
NOTE:
When the Protocol Analyzer first opens, no message is selected andthis pane can be blank.
The panel can be sized or scrolled to display as much information asrequired. Full descriptive information is available for every field of themessage and each field is in tree form which can be expanded as required,all the way down to bit level.
The higher levels of the fields in this pane are in black text, but at the lowestlevel some details are in blue. This signifies that a context menu exists,accessed by a right mouse click, by which the user can arrange for asummary display of the contents of this field in each message in the TraceDiagram pane to assist in the analysis process.
FI G U R E 21.12: TH E PR O T O C O L AN A LY Z E R DE TA I L S PA N E L , W I T H E X PA N D E D F I E L D .
For whatever line is currently selected, the corresponding bytes arehighlighted in the Bytes panel.
PDU BYTES PANELIn this panel, each byte of the selected message is displayed in hex dumpformat.
The address offest is on the left side, the middle area shows the data inhexadecimal, and the corresponding ASCII characters are displayed to theright where possible.
FI G U R E 21.13: T H E P R O T O C O L AN A LY Z E R PDU BY T E S PA N E L (NO S E L E C T I O N) .
When fields are selected in the Details panel, the corresponding bytes arehighlighted in the Bytes panel. Equally, bytes can be selected in the PDU
183
The Protocol Analyzer Window

QuantiQa Client User Manual Part 1
Bytes panel and to reveal the corresponding fields in the Details panel. Seebelow for examples.
FI G U R E 21.14: PR O T O C O L AN A LY Z E R PDU BY T E S PA N E L (A D D R E S S F I E L D S E L E C T E D) .
TR AC E DIAGRAM PANELThis displays a labeled arrow to represent each PDU, in downwardchronological order and showing the direction of flow.
FI G U R E 21.15: PR O T O C O L AN A LY Z E R TR A C E DI A G R A M PA N E L (W I T H O U T D ATA) .
This panel is read only. The scroll bars can be used to display theappropriate part of the trace diagram but it is not possible to select and/oroperate on a message from here.
The PDU Contents and PDU Bytes panels are not displayed alongside theTrace Diagram panel unless the Mixed view has been selected. When theMixed view is used, the PDU selected in the Message List panel ishighlighted in the Trace Diagram.
184

Table Of Figures
Figure 2.1: QuantiQa Client Main Window............................................................................................4Figure 2.2: Toolbar Control Handles......................................................................................................6Figure 3.1: The Main Menu...................................................................................................................7Figure 3.2: The New Menu....................................................................................................................8Figure 3.3: The View Menu.................................................................................................................10Figure 3.4: The Toolbars List...............................................................................................................12Figure 3.5: An Example Of A Windows Selectable List.......................................................................12Figure 3.6: The Tools Menu.................................................................................................................13Figure 3.7: The Help Menu.................................................................................................................15Figure 4.1: The New Toolbar...............................................................................................................17Figure 4.2: The Time Grid Toolbar.......................................................................................................18Figure 4.3: The Mode Button..............................................................................................................18Figure 4.4: An Example Of The ROP Selection Button.......................................................................19Figure 4.5: The ROP Selection Dropdown List....................................................................................19Figure 4.6: Examples Of Time Slot Selection Grid..............................................................................20Figure 5.1: The User Defined Window Title Bar..................................................................................24Figure 5.2: The Options Dropdown List...............................................................................................24Figure 5.3: Example Of A Table Window.............................................................................................24Figure 5.4: Examples Of Column Grouping........................................................................................26Figure 5.5: The Field Chooser Window...............................................................................................27Figure 6.1: The Options Window.........................................................................................................29Figure 6.2: The Options Window, With The Protocol Analyzer
List Item Selected...........................................................................................................................30Figure 6.3: The Options Window, With The Protocol Analyzer
Fonts And Colors List Item Selected..............................................................................................32Figure 6.4: The Options Window, With The Ticket Viewer
List Item Selected...........................................................................................................................33Figure 6.5: The Options Window, With The Application
List Item Selected...........................................................................................................................34Figure 6.6: The Options Window, With The Map Results
List Item Selected...........................................................................................................................36Figure 6.7: The Import PA Symbols Window.......................................................................................37Figure 6.8: The System Login Dialog..................................................................................................39Figure 6.9: The Please Change Password Dialog...............................................................................40Figure 6.10: The KPM Rule Administration Window............................................................................41Figure 6.11: The IMSI List Configuration Window...............................................................................41Figure 6.12: The Alarm And Report Configuration Window.................................................................42Figure 8.1: The Main Selection Window,
With Collapsed And Expanded Panels...........................................................................................45Figure 8.2: The Server Selection Panel..............................................................................................46Figure 8.3: The Date Selection Panel.................................................................................................48Figure 8.4: The Calendar Selection Panel..........................................................................................49Figure 8.5: The Day Time Slot Selection Panel...................................................................................51Figure 8.6: The Aggregation Mode Selection Panel............................................................................52Figure 8.7: Aggregation Mode Selection Panel Dropdown List...........................................................53Figure 8.8: Cell Level Aggregation,
Displaying The Cell With Two Parent MOs.....................................................................................54Figure 8.9: Cell NOREHOM Level Aggregation, Showing The Cell Independent Of The Parent MOs.
.......................................................................................................................................................55Figure 9.1: The MO Selection Window................................................................................................57Figure 9.2: Top-level MO With Drop-down Hierarchical List Displayed...............................................59Figure 9.3: The MO Selection Toolbar.................................................................................................59Figure 9.4: The Expand All MOs Window............................................................................................63Figure 9.5: The MO Selection Filter.....................................................................................................63
185

QuantiQa Client User Manual Part 1
Figure 9.6: The Visibility Is Locked Window........................................................................................66Figure 9.7: The MO Profile And Group Toolbar...................................................................................67Figure 9.8: The MO Selection Window, Displaying A NAME And AntType Column Grouping.............69Figure 10.1: The Preset Selection Window.........................................................................................71Figure 10.2: Preset Selection With The Context Menu.......................................................................72Figure 10.3: Preset Editor Disconnections_Analysis...........................................................................72Figure 11.1: Counters Selection With Counters..................................................................................73Figure 12.1: The Ticket Finder Window...............................................................................................75Figure 12.2: The Ticket List Window With Selected Tickets................................................................76Figure 12.3: The Tool Buttons Bar.......................................................................................................76Figure 12.4: Calendar Control Example..............................................................................................79Figure 12.5: The Tree View List..........................................................................................................79Figure 12.6: Ticket Type Fields List.....................................................................................................80Figure 12.7: Examples Of Advanced Ticket Filtering Expressions......................................................81Figure 13.1: The Drill Down Filter Window..........................................................................................83Figure 13.2: A PDU List Window Generated Using A Drill Down Filter................................................84Figure 13.3: The MO Filter List...........................................................................................................85Figure 13.4: Protocol And Message Lists............................................................................................85Figure 13.5: The Tool Buttons Bar.......................................................................................................86Figure 13.6: Calendar Control Example..............................................................................................88Figure 14.1: The Preset Editor With Toolbar And Columns.................................................................89Figure 14.2: Editing A Preset...............................................................................................................90Figure 14.3: Preset Editor Map Types.................................................................................................92Figure 15.1: Empty Chart Builder Window..........................................................................................95Figure 15.2: Preset Assigned, With and Without Existing Chart..........................................................95Figure 15.3: Typical Chart Builder Window, Ready For Editing Properties..........................................96Figure 15.4: Adding A New Chart........................................................................................................97Figure 15.5: Chart Builder, Copy "Main_TRAF" Containing 3 Charts..................................................97Figure 15.6: Chart Builder: Edit A Copy Of A Chart Layout With 3 Charts...........................................98Figure 15.7: The New Chart Dialog.....................................................................................................99Figure 15.8: Build A New Pie Chart.....................................................................................................99Figure 15.9: The Three Different Types Of Chart: Pie, Bar and XY...................................................101Figure 15.10: Edit Properties For A Pie Chart...................................................................................102Figure 15.11: Chart Builder Title Controls.........................................................................................102Figure 15.12: Chart Builder Axis Control For Pie And 2-D Bar..........................................................102Figure 15.13: Chart Builder Axis Control For 3-D Bar And Line........................................................103Figure 15.14: Pie Chart Coordinates.................................................................................................103Figure 15.15: 2-Dimensional Bar Chart Coordinates.........................................................................104Figure 15.16: 3-Dimensional Chart Coordinates...............................................................................104Figure 15.17: Chart Builder Coordinates...........................................................................................104Figure 15.18: Chart Builder Show As Area........................................................................................105Figure 15.19: Chart Builder Custom Area.........................................................................................105Figure 15.20: Chart Builder Custom Labels......................................................................................106Figure 15.21: Chart Builder X Axis, Primary Y And Secondary
Y Axis Label Panels......................................................................................................................106Figure 15.22: Example Of A Chart With Two Y Axes.........................................................................107Figure 15.23: The Custom X Axis Labels Dialog...............................................................................108Figure 15.24: The Y Axis Options Dialog...........................................................................................109Figure 15.25: Chart Builder Widgets Dialog......................................................................................109Figure 15.26: The Chart Legend.......................................................................................................110Figure 15.27: The Chart Builder Legend Option Dialog.....................................................................110Figure 15.28: Build A New Gauge Chart............................................................................................111Figure 17.1: The Map Result Window...............................................................................................115Figure 17.2: Map Title Bar.................................................................................................................115Figure 17.3: Map Top Toolbar............................................................................................................116Figure 17.4: Example Of A Preset File With Column Entries.............................................................116Figure 17.5: Auto Refresh In Disabled Mode.....................................................................................117Figure 17.6: Auto Refresh In Enabled Mode.....................................................................................117Figure 17.7: Notification Of Next Auto Refresh..................................................................................118
186

Main Window Top Toolbar Drill Button...............................................................................................119Figure 17.8: Map Autoscale Is Off.....................................................................................................120Figure 17.9: Map Autoscale Is On.....................................................................................................120Figure 17.10: The Map Tools Toolbar................................................................................................121Figure 17.11: Examples Of Cobwebs When Using The Show Neighbors Mode...............................125Figure 17.12: The Managed Objects For The Above Example..........................................................125Figure 17.13: Projection Examples...................................................................................................128Figure 17.14: Map With 2 Cell Locations..........................................................................................130Figure 17.15: Cell Location With Traf Data.......................................................................................131Figure 17.16: Cell Location With Traf TA Data. ................................................................................131Figure 17.17: Selected Element On Map And MO Selection Window...............................................132Figure 17.18: Depiction Of 2 Cell Sectors, Left Has Multiple MOs And Right Has One MO..............132Figure 17.19: Colormap Scale With Slider And Thumbs, High And Low...........................................133Figure 17.20: Textbox With The Thumb Value..................................................................................134Figure 17.21: Map Bottom Toolbar....................................................................................................134Figure 17.22: Distance Between Cell Locations................................................................................135Figure 17.23: Partial GIS Map With Map Area Faded.......................................................................136Figure 17.24: Partial GIS Map With Feat Faded...............................................................................136Figure 17.25: Maximum Possible Size Of TA Image.........................................................................137Figure 17.26: ROP Speed/Play Button With Speed Options.............................................................138Figure 17.27: Map Showing The Drilldown TA Vector With Values
And Non-Values...........................................................................................................................138Figure 17.28: A Drill down Example..................................................................................................139Figure 18.1: Table And Records In A Table Results Window.............................................................141Figure 18.2: Table Title Bar...............................................................................................................142Figure 18.3: Table/Record Toolbar....................................................................................................142Figure 18.4: Auto Refresh In Disabled Mode....................................................................................143Figure 18.5: Auto Refresh In Enabled Mode.....................................................................................143Figure 18.6: Notification Of Next Auto Refresh.................................................................................144Figure 18.7: Table Options Dialog.....................................................................................................145Figure 18.8: Table Column/Field Chooser Dialog..............................................................................146Figure 18.9: Table Normalization Options.........................................................................................146Figure 18.10: Column Drag Area And Column Titles.........................................................................147Figure 18.11: Table With NAN Values...............................................................................................147Figure 19.1: Chart Window With 3 Chart Images, 3 Dropdown Lists
And 1 Slider..................................................................................................................................149Figure 19.2: Chart Window Title Bar.................................................................................................150Figure 19.3: Chart Window Top Toolbar............................................................................................151Figure 19.4: Auto Refresh In Disabled Mode....................................................................................152Figure 19.5: Auto Refresh In Enabled Mode.....................................................................................152Figure 19.6: Notification Of Next Auto Refresh.................................................................................153Figure 19.7: Three Chart Panels Unlocked And Editable..................................................................153Figure 19.8: The Panel Title Bar........................................................................................................154Figure 19.9: The Save As Dialog.......................................................................................................155Figure 19.10: The Print Dialog..........................................................................................................157Figure 19.11: Autoscale With Data Choices......................................................................................158Figure 19.12: Disable Formula Items List..........................................................................................159Figure 19.13: Table Normalization Options.......................................................................................159Figure 19.14: Autoscale Is Off And Color Scale Range Is Between 0 – 5.........................................160Figure 19.15: Autoscale Is On And Color Scale Range Is Min And
Max Of Result Values...................................................................................................................161Figure 19.16: Example Of MO ROP Item Dropdown Lists And X Slider
On The Bottom Toolbar................................................................................................................161Figure 19.17: MO Slider With Range Of 4.........................................................................................162Figure 19.18: MO Dropdown List With MO Names...........................................................................162Figure 19.19: 2D Bar With MO Dropdown List = 44017698..............................................................163Figure 19.20: 2D Bar With MO Dropdown List = 44017721..............................................................163Figure 19.21: Pie Chart With Angle, Height, Color And MO Dropdown List......................................164Figure 19.22: Pie Chart With No Sliders Or Dropdown Lists Defined................................................164
187
Table Of Figures

QuantiQa Client User Manual Part 1
Figure 19.23: Pie Chart: 4 MOs With Data Depicted As Slices Or Angles.........................................165Figure 19.24: 4 MOs With Data Depicted As 4 Angles And 4 Colors.................................................166Figure 19.25: MOs With Data Depicted As 4 Angles And 4 Heights..................................................166Figure 19.26: MOs With Data Depicted As 4 Angles And 4 Displacements......................................167Figure 19.27: Pie Chart With 2 Values And 2 Non-values.................................................................167Figure 19.28: 2D Bar Chart With Color..............................................................................................168Figure 19.29: 3D Line Chart..............................................................................................................169Figure 19.30: 3D Bar Chart...............................................................................................................169Figure 19.31: 3D Line And 3D Bar With NAN....................................................................................170Figure 19.32: Example Of Result Table With NAN Results...............................................................171Figure 19.33: Gauge Chart...............................................................................................................172Figure 20.1: A Typical Ticket List Window.........................................................................................173Figure 20.2: The Ticket List Title Bar.................................................................................................174Figure 20.3: Table Drag And Drop Area, And Field Chooser List.......................................................175Figure 20.4: Exporting Ticket Information..........................................................................................175Figure 20.1: Typical Procedure List Showing A Ticket List Window
Without Traced Tickets.................................................................................................................177Figure 21.2: The Protocol Analyzer Title Bar.....................................................................................177Figure 21.3: Protocol Analyzer Toolbar..............................................................................................177Figure 21.4: The Export Menu..........................................................................................................179Figure 21.5: The Protocol Analyzer Display Options.........................................................................179Figure 21.6: Protocol Analyzer PDU List Panel.................................................................................180Figure 21.7: The Dropdown List Of Ticket Types..............................................................................181Figure 21.8: Examples Of Procedures Found...................................................................................181Figure 21.9: The Dropdown List Of Ticket Types..............................................................................182Figure 21.10: Examples Of Tickets Found........................................................................................182Figure 21.11: Protocol Analyzer PDU Contents Panel
With Closed Hierarchy..................................................................................................................183Figure 21.12: The Protocol Analyzer Details Panel, With Expanded Field........................................183Figure 21.13: The Protocol Analyzer PDU Bytes Panel (No Selection).............................................183Figure 21.14: Protocol Analyzer PDU Bytes Panel
(Address Field Selected)..............................................................................................................184Figure 21.15: Protocol Analyzer Trace Diagram Panel (Without Data)..............................................184
188

189

CommProve Addresses
IrelandCommProve LimitedBlock F2East Point Business ParkFairviewDublin 3Ireland
Telephone: +353 1 818 8050Fax: +353 1 875 0127
ItalyVia delle Fonti, 8/e50010 ScandicciFlorenceItaly
Telephone: +39 055 737 54Fax: +39 055 737 5666
UKAnnex 1 Worting Business ParkChurch Lane, BasingstokeHampshire RG23 8PXUK
Telephone: +44 1256 817 640Fax: +44 1256 811 876
USASuite 200-3001022 S Greenville Ave.AllenTX 75002USA
Telephone: +1 469 656 4900Fax: +1 214 383 5999
BrazilAv. Das Americas3434 Bloco 5 Sala 50322640-102Rio de JaneiroBrazil
Telephone: +55 21 3431 3738Fax: +55 21 3431 3739