UCF US Forecast Q2 2021
36
U.S. FORECAST JUNE 2021
Transcript of UCF US Forecast Q2 2021

U.S. FORECAST
J U N E 2 0 2 1

We would like to recognize the following organizations for their support of the Institute for Economic Forecasting:
About University of Central Florida (UCF)
The University of Central Florida is a public, multi-campus, metropolitan research university,
dedicated to serving its surrounding communities with their diverse and expanding populations,
technological corridors, and international partners. The mission of the university is to offer high-
quality undergraduate and graduate education, student development, and continuing education; to
conduct research and creative activities; to provide services that enhance the intellectual, cultural,
environmental, and economic development of the metropolitan region; to address national and
international issues in key areas; to establish UCF as a major presence; and to contribute to the
global community.
About the College of Business
The College of Business advances the university’s mission and goal in providing intellectual
leadership through research, teaching, and service. The college is striving to enhance graduate
programs, while maintaining the strong undergraduate base. The college delivers research and
quality business education programs at the undergraduate, masters, doctoral, and executive levels
to citizens of the state of Florida and to select clientele nationally and internationally.

U . S . F O R E C A S T 2 0 2 1 - 2 0 2 4
Published quarterly by the Institute for Economic Forecasting, College of Business, University of Central Florida
Copyright © 2021 Institute for Economic Forecasting. All rights reserved.
This forecast was prepared based upon assumptions reflecting the Institute for Economic Forecasting judgments as of the date it bears. Actual results could vary materially from the forecast. Neither the Institute for Economic Forecasting nor the University of Central Florida shall be held responsible as a consequence of any such variance. Unless approved by the Institute for Economic Forecasting, the publication or distribution of this forecast and the preparation, publication or distribution of any excerpts from this forecast are prohibited.
Publications of the Institute for Economic Forecasting are made possible by the following staff:
Dr. Sean Snaith, Director
James Bailey, Researcher
Nefertari Elshiekh, Researcher
Justin Mahoney, Researcher
Summer McCowen, Researcher
Dana Rosewall, Researcher
Leonardo Rossi, Researcher

HIG
HL
IGH
TS
Q2
20
21 I N T H I S U . S . F O R E C A S T
• Gasoline lines and shortages, big jumps in the cost of living? Hey man, don’t
let your Mood Ring turn black, the 1970’s aren’t back.
• Pent-up demand squared – the spending that didn’t happen during the
recession compounded by the lockdowns, closures, and stay-at-home edicts –
continue to fuel the economic recovery.
• Payroll job growth of -5.7% in 2020 will be followed by 3.4% in 2021, 3.5% in
2022, 1.3% in 2023 and 1.0% in 2024. The public health shutdowns destroyed
the best labor market in decades, and it won’t be until 2022 before total
business payrolls recover to pre-pandemic levels.
• U.S. consumers are providing the muscle that is powering this recovery.
Following the end of most lockdowns, consumers were ready to spend.
Household balance sheets are strong thanks to rising home prices and financial
markets, and still historically low interest rates will help fuel consumers
spending growth, particularly in 2021.
• Consumption spending shrank by 3.9% in 2020 but will accelerate to 7.7% in
2021, easing to 4.4% in 2022, then ease to 2.5% in 2023 and 2024.
• The Federal Reserve cut interest rates to near zero in the face of a COVID-19-
induced recession, and the Fed’s balance sheet has grown to $8.0 trillion. The
federal funds rate will remain between 0.0% and 0.25% through the end of
2021. But the probability of rate hikes in 2022 and beyond is rising. The punch
bowl will have to be removed at some point.
• Real GDP growth was -3.5% in 2020 but will accelerate to 6.7% in 2021,
easing to 4.7% in 2022, 1.9% in 2023 and then rise to 2.2% in 2024.
• The housing market continues to progress and will improve through 2021.
Ultra-low inventories and mortgage rates will underpin the sector. Housing
starts will rise from 1.4 million in 2020 to 1.59 million in 2021, then
decelerate to 1.32 million by 2024.
• The headline unemployment rate (U-3) is expected to decline to 3.5% in 2024.
Payroll job growth will help ease the damage to the labor market from the
lockdown. The economy was closing in on full employment with accelerating
wage growth before our self-inflicted recession took its brutal toll.

U . S . F O R E C A S T
Institute for Economic Forecasting 5
The 1970’s Redux? Don’t Break Out Your Leisure Suit Just Yet.
Over the past several months we have observed events and received some data that had many experiencing flashbacks to the time of disco. The April release of the Consumer Price Index (CPI) showed the CPI increasing by 0.8% that month for only the third time in 30 years. The May CPI increased by 0.6% and for the first five months of 2021, the average monthly increase in the CPI has been 0.5% which is the highest average increase in the first five months of a year since 1990.
These types of monthly CPI figures were indeed de rigueur in the 1970s when annual rates of inflation were regularly in or near double digits. From 1970 to 1981 the average rate of monthly inflation during the first five months of each of these years was 0.6%.
In addition to the CPI data, a ransomware attack on the Colonial Pipeline which transports gasoline, jet fuel, and diesel to mainly southern states from Texas up to New York shut down the pipeline for five days before the ransom was paid. This led to long lines at gasoline stations, with many stations shutting down as a result of this supply interruption.
This Colonial Pipeline episode was reminiscent of the 1973 and 1979 gasoline shortages that led to massive lines at gas stations, flaring tempers, and odd-even rationing by license plate number.
Are we witnessing a Back to the Future style return to the economic woes of the 1970s?
Well, just wait a minute (or a few months) before you break out your tube tops, bell-bottomed jeans, platform shoes, leisure suits and mood rings. This CPI data and repercussions of the ransomware attack should be relatively short-lived.
The COVID-19 global shutdowns of the economy created a tremendous disruption of global supply chains, which over decades have evolved
from holding inventory in warehouses to just in time supply chain management. As the COVID lockdowns eased, pent-up demand-squared1 was unleashed and supply has been insufficient to meet this surge in spending. The result is, as in the case of any market where there is a shortage, that prices are rising.
These disruptions should ease over the next few months and with them so should the upward pressure on prices.
On the other hand,2 there is a dam filling rapidly with potential inflation that could break at some point in the future.
The Federal Reserve balance sheet is now over 8 trillion dollars (it was $800 billion prior to the Great Recession) and nearly $4 trillion of that amount represents reserves in the banking system. Beginning with the three rounds of Quantitative Easing in the wake of the 2008 financial crisis and continuing with an even broader array of asset purchases following COVID-19, the Federal Reserve has flooded the banking system with reserves.
While these asset purchases have been painted as “printing money” they are more akin to buying the paper and ink which could be used to make money. If the banking system holds on to the proceeds from the trillions of dollars of asset sales to the Federal Reserve and keeps them as reserves, the actual
1 Pent-up demand squared is unique to the COVID-19 recession. Every recession sees pent-up demand as consumers who do not lose their jobs or see their incomes fall cut back on spending during the uncertainty of a recession, but this effect was multiplied in this recession. Consumers were literally pent-up in their homes during this recession and are eager to get back to pre-pandemic life and are spending at an even faster pace than emerging from a traditional recession.2 As U.S President Harry Truman famously pleaded, “Give me a one-handed economist. All my economists say, ‘on the one hand . . .’, then ‘but on the other . . .’”

U . S . F O R E C A S T
6 U.S. Forecast / June 2021
“printing” (creation) of money doesn’t occur. If the banking system instead begins to lend out those reserves, then money is created and begins circulating in the economy.
Record low interest rates, heavy financial regulation (Dodd-Frank, Federal Reserve stress testing) creates little in the way of incentives for the banking system to lend out these reserves particularly now that the Fed pays interest on these reserve balances. However, if market interest rates begin to rise the incentive to lend excess reserves will increase and more of these reserves will make it into the money supply and begin circulating within the economy.
The Federal Reserve is not alone in its efforts as the Federal government by virtue of trillions of dollars of deficit spending also continues to fill this dam. From 2020 through 2022 we are projecting deficit spending that will be nearly $6.4 trillion. Stimulus checks, additional unemployment compensation, larger child tax credits and other spending does, unlike bank reserves, feed directly into the economy continuing to boost aggregate demand in an economy that has been growing rapidly since the 2020 recession.
In the 3rd quarter of 2020, the economy expanded 33.4% and in the 4th quarter of that year it grew by 4.3%. The 1st quarter of 2021 saw a 6.4% rise in real GDP and expectations for the 2nd quarter are that growth could push as high as 10%. These numbers certainly do not warrant the trillions of dollars of deficit spending we continue to see. And like the Federal Reserve’s actions, this spending also comes with the risk of higher inflation as “too many dollars chase too few goods.”
A N X I O U S I N D E XFear of Another Recession Dwindles
The most recent release (2nd quarter of 2021) of the Survey of Professional Forecasters by the Federal Reserve Bank of Philadelphia states that the forecasters surveyed for the publication put just a 7.3% chance that a decline in real GDP will occur in the 3rd quarter of 2021.
One section of the Survey of Professional Forecasters asked panelists to estimate the probability that real GDP will decline in the quarter in which the survey is taken, as well as the probabilities of a decline in each of the following four quarters. The anxious index is the estimated probability of a decline in real GDP in the quarter after a survey is taken. In the survey taken in May for the 2nd quarter of 2021, the index stands at 7.3, meaning forecasters believe there is a 7.3% chance that real GDP will decline in the 3rd quarter of 2021.
Figure 1 plots the historical values of the anxious index, where the gray bars indicate periods of recession in the U.S. economy. The current level of the anxious index is 5.7 points lower than the
Figure 1.
Source: Survey of Professional Forecasters, Philadelphia Federal Reserve Bank
0
10
20
30
40
50
60
70
80
90
100
1968
1969
1970
1971
1972
1973
1974
1975
1976
1977
1978
1979
1980
1981
1982
1983
1984
1985
1986
1987
1988
1989
1990
1991
1992
1993
1994
1995
1996
1997
1998
1999
2000
2001
2002
2003
2004
2005
2006
2007
2008
2009
2010
2011
2012
2013
2014
2015
2016
2017
2018
2019
2020
2021
Prob
abili
ty (p
erce
nt)
Quarter for Decline
The Anxious IndexOne-Quarter-Ahead Probability of Decline in Real GDP
Quarterly, 1969:Q1 to 2021:Q3
The shading shows the period beginning with each NBER peak and ending with the corresponding trough. As of May 14, 2021, the NBER has not announced the date for the trough associated with the 2019 Q4 peak.

U . S . F O R E C A S T
Institute for Economic Forecasting 7
average level during the previous economic recovery (13.00). It is also the lowest level for the anxious index since the 2nd quarter of 2011.
G D P O U T L O O KThe End of Lockdowns Launched a Historic Recovery
The National Bureau for Economic Research (NBER) declared that the longest economic expansion in U.S. history enjoyed its final month in February of 2020. This declaration meant that in March, the U.S. economy was in recession. There is little doubt that the recession continued through April, but data suggest that the recession may have ended in May or June (the NBER has still not yet weighed in on this). This would imply a recession that lasted 2 or 3 months and would therefore be the shortest contraction in U.S. history (6 months was the previous record for the shortest recession.)
Fiscal and monetary policy have been unleashed in a historic manner to counter the deleterious effect of the public health measures on the U.S. economy. While the combined policy effects were clearly not enough to offset the damage the lockdowns have done, they lessened the severity of the historic recession. The continued fiscal stimulus as the recovery continues at a more than robust pace.
In the 4th quarter of 2019, real GDP growth at an annual rate was 2.4%. In the 1st quarter of 2020, the economy contracted by 5.0%, and then output plunged by 31.4% in the 2nd quarter before surging 33.4% in the 3rd quarter and 4.3% in the 4th quarter of 2020.
In 2019, real GDP growth decelerated in the face of global economic weakness and uncertainty surrounding trade negotiations to 2.2%. This was of course pre-pandemic. In 2020 the economy contracted by 3.5% before rebounding to grow at an expected rate of 6.7% in 2021. From 2021-2024 average annual real GDP growth is expected to be 3.9%, with the economy coming back to earth in 2023 and 2024.
We expect the Federal Reserve to keep the Federal Funds rate at current levels (between 0.0% and 0.25%) through the end of 2021 and into 2022. Beyond that point, the pressure on prices could lead to interest hikes before mid-2024 when we are currently forecasting that the Fed will begin a slow process of reversing these interest rate cuts.
The Fed was in the process of reversing its balance sheet, which was engorged by three rounds of quantitative easing from battling the Great Recession. The balance sheet had contracted to $3.76 trillion before the COVID-19 pandemic led to a resumption of asset purchases. By June 1st, 2020, the Fed’s balance sheet had swelled to nearly $7.2 trillion and sits near $8.0 trillion today.
This is uncharted territory for monetary policy as has been the case since the 2008-09 recession. There is no previous playbook to follow on how best to carry policy forward, and the Fed has altered course on the balance sheet process just as they have on interest rates in response to the pandemic. We expect no major changes to Fed policies through the end of 2022 but beginning in 2023 the massive “punch bowl3” will need to be drained.
C O N S U M E R S P E N D I N G(Pent-Up Demand)2 Continues to Fuel the Recovery
The U.S. consumer and the U.S. economy were brutalized by the lockdowns, a result of public health restrictions on economic activity. As a result, consumer spending plummeted in the second quarter of 2020 by an estimated annual rate of 33.2%. This followed a smaller decline in spending of 6.9% in the 1st quarter as public health restrictions were first rolled out in March of 2020.
In the 3rd quarter, pent-up demand from consumers who were also cooped-up in their homes (thus pent-
3 The job of the Federal Reserve, Bill Martin the 9th Chair of the Federal Reserve famously said, is “to take away the punch bowl just as the party gets going,” that is, raise interest rates just when the economy reaches peak activity after a recession.

U . S . F O R E C A S T
8 U.S. Forecast / June 2021
up demand squared) was unleashed, leading to 41.0% growth at an annual rate in consumer spending for the quarter. In the 4th quarter of 2020, consumer spending grew more modestly at 2.3%. In the 1st quarter of 2021 consumers were again spending robustly, fueled by federal stimulus payments, and consumption spending soared to an 11.4% rate of growth at an annual rate. As the rest of the COVID-19 pent-up demand is released, growth will remain strong for 2021, average quarterly spending growth this year will be a healthy 7.7%.
The CARES Act and subsequent stimulus payments plus supplemental unemployment insurance payments helped to ease some of the pain consumers felt from the public health lockdowns. In addition to these programs, increases in the child tax credit will put additional disposable income into the consumers’ pockets continuing to fuel spending growth.
In 2019, consumer spending growth decelerated to 2.6% from 3.0% in 2018. The public health policies aimed at slowing the spread of COVID-19 caused spending growth in 2020 to contract by 3.9%. Consumption spending growth is expected to be 7.7% in 2021, 4.4% in 2022, 2.5% in 2023 and in 2024.
I N V E S T M E N TThe COVID-19 recession and presidential election
in 2020, created an atmosphere of high uncertainty in the economy. This uncertainty was no friend to investment spending.
Nonresidential fixed investment spending eased in 2019 to 2.9% from 6.9% in 2018. In 2020 investment spending contracted by 4.0%
Investment spending during the historically weak economic recovery that followed the Great Recession of 2008-2009. In multiple issues of our U.S. Forecast publication, we have discussed the role of uncertainty and the rapid growth in the regulatory burden as probable causes of this weakness. The regulatory burden was significantly rolled back during the
Trump administration, and coupled with the Tax Cuts and Jobs Act, the overall environment for investment spending improved. It is possible that many of these policies will be reversed by the Biden administration but not before a sharp bounce back from the 2020 recession.
Spending on equipment and software contracted for the full year in 2016 by 1.7%. In 2017, we saw a 4.9 percentage point swing in investment of this type, as the full year rebounded to 3.2% growth and then to 8.0% in 2018 before sliding to 2.1% in 2019. In 2020 spending growth turned negative again and contracted by 4.9%. The outlook post-2020 will improve. Average growth in this type of investment spending is expected to be 6.5% over the 2021-2024 timeframe, peaking at 14.5% in 2021 and decelerating rapidly to 3.8% in 2024.
Purchases of aircraft again contracted by 9.7% in 2016 but recovered by expanding to 33.7% in 2017. A single aircraft order from an airline can move this figure by tens of billions of dollars, and the problems Boeing has been facing with its 737 Max planes weighed heavily. This led to a sharp reversal of growth in 2019 to -27.6%. 2020 made matters worse for the industry as air travel collapsed globally as the COVID-19 pandemic spread. In 2020, investment fell by over 44.0%. We expect that there will be a very sharp rebound in 2021 as investment surges 88.1%.
This sharp rebound in 2021 will commence as Boeing and other manufacturers put the 737 Max episode and COVID-19 behind it. Over the next four years, spending on aircraft is expected to grow an average of 35.6%, but quarter-to-quarter and even year-over-year volatility in this type of investment spending is the rule, particularly in this COVID impacted environment.
The 2016 slowdown in overall investment spending also reflected the negative impact of oil prices falling by nearly two-thirds. Consumers enjoyed the low prices at the gasoline pump, but oil producers—shale and otherwise—cut back on investments as oil prices dropped below $40 per barrel early in

U . S . F O R E C A S T
Institute for Economic Forecasting 9
2016. The rig count in the U.S. hit a seventy-year low of 404 in response to plunging oil prices. In the middle of the COVID recession, an oil price war broke out and drove spot prices at one point below zero. This price drop has caused the U.S. rig count to plummet to 282. Higher oil prices due in part to the strong economic recovery and the stoppage of the construction of the Keystone XL pipeline have pushed the rig count to 470 which is 204 higher than a year ago.
During 2015 and 2016, investment in mining and petroleum equipment contracted by 27.9% and 40.6%, respectively. In 2017, growth hit 39.2% and came in at 25.4% for 2018 before declining 2.0% in 2019 and plunging 36.6% in 2020. Investment will average 11.8% growth per year during 2021-2024 but will be hindered by the green energy initiatives of the Biden administration in 2023-24.
Business nonresidential structures investment growth hit 4.3% in 2017 and decelerated to 3.7% in 2018. Spending growth contracted by 0.6% in 2019 and contracted by 11.0% in 2020 and will contract again by 6.4% in 2021, before expanding at an average rate of 3.0% during the following three years.
Interest rates have plummeted as a response to the pandemic. The Federal Reserve cut short-term interest rates to near zero and plans to keep them there for at least the next year, while the interest rates on U.S. Treasury bonds fell to historic lows and remain near these levels. This will help fuel investment growth once the uncertainty of pandemic subsides.
Business spending on industrial equipment will grow at an annual average rate of 5.4% from 2021-2024. Investment spending growth on computers and peripherals will average 4.6% during 2021-2024. Spending on communications equipment should expand at an average annual rate of 9.3% during the same four-year span, with spending accelerating in 2021 to a 20.7% growth rate with the rollout of 5G mobile internet technology.
Residential fixed investment growth hit 6.7% in 2016, before slipping further to 4.0% in 2017, contracting by 0.6% in 2018 and again by 1.7% in 2019. Growth will average 1.4% through 2021-2024, accelerating to a peak growth rate of 13.8% in 2021.
We expect housing starts to continue to be steady over the next several years, reaching nearly 1.6 million in 2021 before decelerating to a level slightly above 1.3 million in 2024. Record low mortgage rates and solid economic fundamentals will continue to feed the residential sector going forward as will the current shortage of housing that is plaguing the sector in many parts of the country.
G O V E R N M E N T S P E N D I N GGovernment spending has become a series
of continuing resolutions and lately a series of COVID-19 stimulus packages, devoid of any policy discussions about priorities, problems, or serious policy objectives. Unsurprisingly, our public finances are adrift, and deficits had climbed back to the $1 trillion mark even before the pandemic. Some were quick to blame the Tax Cut & Jobs Act, but since its signing, federal government revenues have grown. Unfortunately, spending grew even faster, and the deficit began growing again in 2016. This was all before public health measures plunged the economy into the deepest recession since the Great Depression.
In 2016, federal government spending growth was 0.6% after contracting for five consecutive years and was just 0.3% in 2017. In 2018, it expanded by 2.8%, and in 2019, it rose again by 4.0%. During the 2021-2024 period, federal government spending is going to be flat, growing at an annual average pace of 0.0%. Over the same time frame, state and local governments will see spending growth at an average rate of 1.3%. This modest growth in spending will be greatest in 2021 before growth decelerates in the final three years of our forecast.
The federal budget deficit jumped in 2017 to over $665 billion, then to $779 billion in 2018, and $984

U . S . F O R E C A S T
10 U.S. Forecast / June 2021
billion in 2019. Reaching $3.1 trillion in 2020, the deficit will remain over $1 trillion through the end of 2022. This is a reversal of course in fiscal policy after a four-year period in which we saw deficits shrinking from nearly $1.3 trillion in 2011 to $439 billion in 2015. While the Tax Cuts and Jobs Act has boosted economic growth and government revenue, federal budget deficits have increased at the same time as spending continued seemingly unchecked as the federal government moved from one continuing resolution to the next. In 2017, the deficit grew by $78.4 billion, and it surged even higher in 2018, hitting $779.0 billion. The deficit grew larger still in 2019, as entitlement and military spending pushed it to $984 billion. COVID-19 public health measures have moved the U.S. fiscal situation from bad to worse, and in 2020, the deficit soared to a historic $3.1 trillion.
As we have discussed at some length in previous forecasts, the U.S. continues to travel down an unsustainable fiscal path that will ultimately lead to a crisis if changes are not enacted, and with the current deficits, we are accelerating down the same path. The existing structure of our entitlement programs (62% of the federal budget is mandatory spending and is growing), coupled with the demographics of an aging Baby Boomer generation, ensures that if no changes are made to these programs and/or how they are funded, we will eventually face a fiscal crisis. There has been no indication that the Trump administration or the Biden administration, like those of its predecessors, will make any of the difficult but necessary changes to avoid this future crisis. This crisis-in-the-making is even more concerning because of a misguided but growing belief among some lawmakers and even some fringe economists that deficits and the debt “don’t matter.”
We are projecting deficits through 2024 that will consistently average more than $1.27 trillion—the type of deficits that were the norm during 2009-2012. The amount that the projected deficits will add to the national debt over the next four years will be more than $5.0 trillion, pushing the national
debt total to over $33 trillion and a debt to GDP ratio of 125%. If interest rates in the economy rise, the burden of servicing this debt will rise as well. Spending by the Biden administration (and Congress) will help push this debt to even higher levels than we are currently projecting if interest rates rise more quickly than anticipated. Slower-than-projected economic growth would also push projected deficits higher, though the possibility of faster economic growth would help mitigate the growth of these deficits.
Currently, the national debt is over $28.3 trillion and rising. This represents a debt of nearly $226,113 per taxpayer and $85,159 per citizen. The unfunded liabilities of the U.S. are even more disturbing. These include Social Security; Medicare parts A, B, and D; Federal debt held by the public; and federal employee and veteran benefits, representing more than $149.2 trillion in liabilities, boiling down to more than $447,881 per citizen.4
N E T E X P O R T SCOVID-19 inflicted havoc not just on the
U.S. economy but on the global economy as well. International trade collapsed in the 2nd quarter of 2020. Real exports collapsed by 64.4% at an annual rate while real imports plunged by 54.1%. But like the rest of the economy, the external sector came roaring back in the 3rd quarter. Real exports grew at an annual rate of 59.6% that quarter, with real imports growing at a 93.1% pace as consumer spending surged.
The U.S. dollar appreciated for five straight years against our major trading partners, including an outsized 16.1% appreciation in 2015. In 2016, this trend moderated; in 2017 and 2018, the dollar returned some of these gains. However, after the Fed raised interest rates and the U.S. economy experienced faster growth relative to our trading partners, the dollar appreciated again in 2019 at a 3.6% pace before depreciating 1.1% in pandemic-
4 National debt data from: http://www.usdebtclock.org/

U . S . F O R E C A S T
Institute for Economic Forecasting 11
addled 2020. We expect that the dollar will accelerate its depreciation in 2021 by 5.3% and continue to do so through 2023, which will dampen import growth and catalyze export growth over that time period.
A stronger dollar increases imports and reduces exports by making our goods and services more expensive to foreigners, while at the same time making imported goods and services less expensive to U.S. consumers. This results in a worsening of the trade deficit, which is the difference between the dollar value of exports and the dollar value of imports.
The trade battle with China does impart additional uncertainty into the outlook for foreign trade, but the overall impact has not been as large as some have suggested. After reaching phase one of the trade agreement, the pressure will continue to build on China to come to a full agreement as the U.S. has greater leverage in this lopsided trade partnership. This relationship may become even further complicated as a result of China’s behavior surrounding the COVID-19 outbreak as we move forward. However, it appears the Biden administration will take a much softer stance on all things China.
Overall, real export growth will resume, after a sharp contraction in 2020, through the end of our 2024 forecast horizon and is expected to accelerate sharply in 2021. Real import growth contracted significantly in 2020, but growth will recover and continue through 2024. Trade skirmishes and COVID-19 notwithstanding, real export growth from 2021-2024 will average 6.5%, while real import growth will be flat over the same time frame.
Real net exports will average over -$1.2 trillion during 2021-2024, with the trade balance remaining roughly constant over that time period, coming in at over -$1.1 trillion in 2024.
U N E M P L O Y M E N TThe national headline unemployment rate (U-3) in
April 2021 stood at 6.1% was down 8.7 percentage points from the April 2020 reading of 14.8%, the
highest level since the Great Depression era. The labor force participation rate rose in April 2021 from March’s level of 61.5% to 61.7%.
The April jobs report fell well short of expectations as growth in payroll jobs was 266,000 with the expectation that the figure would be 1,000,000. The 14,453,000 increase in payroll employment since May 2020 comes after 22,160,000 payroll jobs were lost in March and April. These historic job gains serve to reinforce how much more must be done for the labor market to recover the jobs lost from a historic, self-inflicted recession.
The Bureau of Labor Statistics (BLS) produces alternative measures of labor market weakness, including the broadest measure of unemployment (U-6). U-6 takes into account discouraged workers (currently 565,000 workers), underemployed workers—working part-time but not by choice— (currently 5.2 million workers), and workers who are marginally attached to the labor force, those who have looked for work in the past 12 months but are not currently looking yet indicate a willingness to work (1.9 million workers). None of these 7.6 million-plus workers are counted in the December headline unemployment rate of 6.1%.
U-6 stands at 10.4% as of April 2021, down 12.5 points from the April 2020 level, and up 3.5 percentage points from the start of 2020. The current level of U-6 is higher than its level of 10.3% in July 2015. U-6 was stuck in double digits for more than seven years. It had been in single digits for fifty-one consecutive months, beginning in December 2015 before surging during the lockdowns in April and May.
The spread between U-6 and U-3 measures of unemployment has fallen to 4.3 percentage points and is 3.1 points below the peak spread of 7.4 points that took place in September of 2011.

C H A R T S
12 U.S. Forecast / June 2021
24232221201918171615141312111009080706
7.0
6.0
5.0
4.0
3.0
2.0
2.5
2.0
1.5
1.0
0.5
0.0
30-Year Mortgage Rates and Housing Starts(Mortgage rates - Left axis, %)
30-Year Fixed Mortgage RateHousing Starts - Millions
24232221201918171615141312111009080706
14.012.010.08.06.04.02.00.0
Automobile and Light Truck Sales(Millions Vehicles)
Auto SalesLight Truck Sales
24232221201918171615141312111009080706
300.0
200.0
100.0
0.0
-100.0
-200.0
-300.0
-400.0
Change in Real Business Inventories(Billions of 2012 Dollars)
Change in Real Business Inventories

C H A R T S
Institute for Economic Forecasting 13
24232221201918171615141312111009080706
6.0
4.0
2.0
0.0
-2.0
Consumer Prices(% Change Year Ago)
Consumer Price IndexCore Consumer Price Index
24232221201918171615141312111009080706
-0.0
-1000.0
-2000.0
-3000.0
-4000.0
-5000.0
-6000.0
Federal Budget Surplus(Billions of Dollars)
Federal Budget Surplus
24232221201918171615141312111009080706
6.0
5.0
4.0
3.0
2.0
1.0
0.0
-1.0
Federal Funds Rate(%)
Fed Funds Rate

C H A R T S
14 U.S. Forecast / June 2021
24232221201918171615141312111009080706
10.0
5.0
0.0
-5.0
-10.0
Real GDP Growth and Federal Funds Rate(%)
Quarterly Growth Rate Real GDP Fed Funds Rate
24232221201918171615141312111009080706
120.0
115.0
110.0
105.0
100.0
95.0
90.0
85.0
Industrial Production(2012=100)
Industrial Production
24232221201918171615141312111009080706
3500.0
3000.0
2500.0
2000.0
1500.0
Private Fixed Nonresidential Investment(Billions of Dollars)
Private Fixed Nonresidential Investment

C H A R T S
Institute for Economic Forecasting 15
24232221201918171615141312111009080706
14.5
14.0
13.5
13.0
12.5
12.0
11.5
11.0
Manufacturing Employment(Millions)
Manufacturing Employment
23222120191817161514131211100908070605
6000.0
5000.0
4000.0
3000.0
2000.0
1000.0
Money Supply(Annual Growth Rate %)
Annual Growth Rate of M1
23222120191817161514131211100908070605
100.0
80.0
60.0
40.0
20.0
0.0
-20.0
Money Supply(Annual Growth Rate %)
Annual Growth Rate of M2Annual Growth Rate of M1

C H A R T S
16 U.S. Forecast / June 2021
24232221201918171615141312111009080706
155.0
150.0
145.0
140.0
135.0
130.0
125.0
Total Nonfarm Payroll Employment(Millions)
Total Nonfarm Employment
24232221201918171615141312111009080706
140.0
120.0
100.0
80.0
60.0
40.0
20.0
100
90
80
70
60
50
Oil and Consumer ConfidenceOil ($ Per Barrel) - Left Axis
Price of Oil WTI Consumer Sentiment
24232221201918171615141312111009080706
1200.0
1000.0
800.0
600.0
400.0
200.0
0.0
-200.0
Corporate Retained Earnings(Billions of Dollars)
Corporate Retained Earnings

C H A R T S
Institute for Economic Forecasting 17
24232221201918171615141312111009080706
20.0
15.0
10.0
5.0
0.0
-5.0
-10.0
-15.0
Real Disposable Income and Consumption(% Change Year Ago)
Real Disposable Income Consumption
24232221201918171615141312111009080706
2500.0
2000.0
1500.0
1000.0
500.0
Real After Tax Profits(Billions of Dollars)
Real After Tax Profits
24232221201918171615141312111009080706
-1100-1000-900-800-700-600-500-400 1.50
1.40
1.30
1.20
1.10
1.00
0.90
0.80
Trade Balance and Real Exchange Rate
Trade Balance (Billions $) Left axisU.S. Dollar Real Exchange Rate (2012 = 1.0) Right axis

C H A R T S
18 U.S. Forecast / June 2021
24232221201918171615141312111009080706
-0.0
-1000.0
-2000.0
-3000.0
-4000.0
-5000.0
-6000.0
Twin Deficits(Billions of Dollars)
U.S. Federal Budget SurplusCurrent Account
24232221201918171615141312111009080706
14.0
12.0
10.0
8.0
6.0
4.0
2.0
Civilian Unemployment Rate(%)
Unemployment Rate
24232221201918171615141312111009080706
7.06.05.04.03.02.01.00.0
Yield Curve(%)
1-Year T-Bill Yield5 Year Treasury Bond Yield30 year Treasury Bond Yield

TA B L E S
Institute for Economic Forecasting 19
Table 1. Summary of the Long-Term Forecast of the U.S.
2014 2015 2016 2017 2018 2019 2020 2021 2022 2023 2024
Composition of Real GDP, Percent ChangeGross Domestic Product 2.5 3.1 1.7 2.3 3.0 2.2 -3.5 6.7 4.7 1.9 2.2 Final Sales of Domestic Product 2.7 2.8 2.3 2.4 2.8 2.2 -2.9 6.1 3.9 2.2 2.3Total Consumption 3.0 3.8 2.8 2.6 2.7 2.4 -3.9 7.7 4.4 2.5 2.5 Durables 7.2 7.6 5.8 6.9 6.9 4.8 6.2 13.8 -3.3 1.9 4.8 Nondurables 2.6 3.4 2.5 2.6 2.7 3.1 2.6 5.6 -0.3 1.0 1.7 Services 2.4 3.4 2.4 2.0 2.1 1.8 -7.3 7.6 7.3 3.0 2.4Nonresidential Fixed Investment 7.2 2.4 0.5 3.7 6.9 2.9 -4.0 7.8 6.0 4.4 4.4 Equipment & Software 7.0 3.1 -1.7 3.2 8.0 2.1 -4.9 14.5 4.8 3.1 3.8 Information Processing Equipment 5.2 6.2 4.5 7.4 8.7 3.1 7.3 20.4 3.4 -0.1 1.1 Computers & Peripherals 0.0 0.4 -0.7 7.7 12.3 5.5 15.6 27.1 0.0 -5.5 -3.3 Communications Equipment 12.6 15.7 12.4 12.0 2.6 2.7 1.9 20.7 5.9 5.9 4.6 Industrial Equipment 3.9 0.1 -1.4 5.5 8.2 2.2 -4.2 7.0 2.6 2.7 9.5 Transportation equipment 12.5 12.4 -4.6 0.0 6.0 0.3 -22.4 20.0 8.8 11.5 -5.2 Aircraft 14.4 2.1 -9.7 33.7 8.8 -27.6 -44.1 88.6 41.3 10.7 1.7 Other Equipment 14.2 10.8 -22.3 2.3 9.9 9.1 -20.5 16.7 -2.3 -0.6 -0.6 Structures 11.1 -0.8 -4.3 4.3 3.7 -0.6 -11.0 -6.4 1.3 3.6 4.1 Commercial & Health Care 12.9 12.3 16.7 3.5 1.3 -2.2 -1.8 -9.2 -3.1 3.6 6.3 Manufacturing 12.7 36.3 -4.8 -13.4 -1.7 4.6 -14.3 -14.0 15.5 16.8 -3.0 Power & Communication 18.3 4.7 2.4 -3.8 -5.6 4.1 4.2 -7.1 -10.0 -1.3 5.4 Mining & Petroleum 8.1 -27.9 -40.6 39.2 25.4 -2.0 -36.6 29.9 20.1 -2.5 -0.2 Other 8.3 10.6 7.2 3.9 1.3 -3.4 -15.0 -12.5 2.2 7.5 8.8Residential Fixed Investment 3.8 10.2 6.7 4.0 -0.6 -1.7 6.0 13.8 -4.1 -4.1 0.1Exports 4.2 0.4 0.3 3.9 3.0 -0.1 -13.0 6.9 7.8 5.9 4.9Imports 5.0 5.2 1.6 4.7 4.1 1.1 -9.2 14.5 4.0 2.9 4.5Federal Government -2.6 0.0 0.6 0.3 2.8 4.0 4.3 2.3 -1.6 -0.8 0.1State & Local Government 0.2 2.9 2.6 1.2 1.2 1.3 -0.8 2.8 1.7 -0.2 0.7
Billions of DollarsReal GDP 16912.0 17432.2 17730.5 18144.1 18687.8 19091.7 18426.1 19639.9 20551.2 20937.1 21404.8Nominal GDP 17527.3 18238.3 18745.1 19543.0 20611.9 21433.2 20936.6 22915.3 24460.7 25430.2 26566.5
Prices & Wages, Percent Change, Annual RateGDP Deflator 1.8 1.0 1.0 1.9 2.4 1.8 1.2 2.7 2.0 2.0 2.2Consumer Prices 1.6 0.1 1.3 2.1 2.4 1.8 1.3 2.6 1.7 1.9 2.0 Excl. Food & Energy 1.8 1.8 2.2 1.8 2.1 2.2 1.7 1.9 2.1 2.2 2.3Producer Prices, Finished Goods 1.9 -3.3 -1.0 3.2 3.1 0.8 -1.3 5.8 1.7 1.4 1.7Employment Cost Index - Total Comp. 2.1 2.1 2.1 2.5 2.9 2.7 2.6 3.0 3.3 3.3 3.0
Other MeasuresOil - WTI ($ per barrel) 93.3 48.7 43.2 51.0 64.9 57.0 39.2 62.7 62.8 62.2 62.4Productivity (%change) 0.9 1.6 0.4 1.2 1.4 1.8 2.6 2.4 1.9 1.1 1.8Industrial Production (%change) 3.1 -1.0 -1.9 2.3 3.9 0.9 -6.7 5.9 5.5 2.2 2.1Factory Operating Rate 75.2 75.3 74.2 75.1 76.6 75.6 70.3 75.0 77.4 76.9 76.5Nonfarm Inven. Chg. (Bil. of 2012 $) 90.1 136.5 30.2 21.0 59.3 62.2 -75.1 38.1 186.3 112.9 97.5Consumer Sentiment Index 84.1 92.9 91.8 96.8 98.4 96.0 81.5 83.2 87.8 89.8 90.1Light Vehicle Sales (Million units) 16.5 17.4 17.5 17.2 17.2 17.0 14.4 16.7 16.7 16.8 16.7Housing Starts (Million units) 1.0 1.1 1.2 1.2 1.2 1.3 1.4 1.6 1.4 1.3 1.3Existing House Sales (Million units) 4.3 4.6 4.8 4.9 4.7 4.7 5.1 5.3 5.1 4.9 4.8Unemployment Rate (%) 6.2 5.3 4.9 4.4 3.9 3.7 8.1 5.3 3.9 3.6 3.5Payroll Employment (%change) 1.9 2.1 1.8 1.6 1.6 1.3 -5.7 3.4 3.5 1.3 1.0Federal Surplus (Unified, FY, bil. $) -483.4 -436.5 -587.3 -665.8 -779.0 -984.4 -3131.9 -2090.0 -1128.8 -971.7 -875.6Current Account Balance (Bil. $) -367.8 -407.4 -394.9 -365.3 -449.7 -480.2 -647.2 -790.9 -683.0 -552.7 -500.8
Financial Markets, NSAFederal Funds Rate (%) 0.1 0.1 0.4 1.0 1.8 2.2 0.4 0.1 0.1 0.1 0.33-Month Treasury Bill Rate (%) 0.0 0.1 0.3 0.9 1.9 2.1 0.4 0.0 0.1 0.1 0.21-Year Treasury Note Yield (%) 0.1 0.3 0.6 1.2 2.3 2.1 0.4 0.1 0.0 0.2 0.55-Year Treasury Note Yield (%) 1.6 1.5 1.3 1.9 2.7 2.0 0.5 0.8 1.0 1.2 1.510-Year Treasury Note Yield (%) 2.5 2.1 1.8 2.3 2.9 2.1 0.9 1.6 1.9 2.0 2.225-Year Treasury Note Yield (%) 3.3 2.8 2.6 2.9 3.1 2.6 1.6 2.3 2.6 2.7 2.830-Year Fixed Mortgage Rate (%) 4.2 3.9 3.6 4.0 4.5 3.9 3.1 3.1 3.5 3.7 3.9S&P 500 Stock Index 1930.7 2061.2 2092.4 2448.2 2744.7 2912.5 3218.5 4151.3 4400.9 4655.6 4771.3 (Percent change) 17.7 6.9 1.6 17.0 12.3 6.2 10.4 29.5 6.1 5.8 2.5Exchange Rate, Major Trading Partners 1.1 1.2 1.2 1.2 1.2 1.3 1.2 1.2 1.2 1.2 1.2 (Percent change (negative = depreciation)) 3.1 15.7 1.3 -0.4 -2.1 3.6 -1.1 -5.3 -1.2 -0.3 0.3
IncomesPersonal Income (Bil. of $) 14991.7 15724.2 16160.7 16948.6 17851.8 18551.5 19691.0 20878.4 21026.7 21843.4 22836.2 (Percent change) 5.7 4.9 2.8 4.9 5.3 3.9 6.1 6.2 0.8 3.9 4.5Disposable Income (Bil. of $) 13207.1 13784.3 14202.8 14901.9 15766.5 16348.6 17495.3 18514.0 18528.1 19233.2 20097.2 (Percent change) 5.6 4.4 3.0 4.9 5.8 3.7 7.0 6.0 0.2 3.8 4.5Real Disposable Income (Bil. Of 2012 $) 12843.6 13377.3 13641.0 14060.5 14566.3 14882.8 15742.9 16279.8 16005.8 16321.3 16729.1 (Percent change) 4.1 4.2 2.0 3.1 3.6 2.2 5.8 3.6 -1.5 2.0 2.5Saving Rate (%) 7.4 7.6 6.9 7.2 7.9 7.6 16.1 13.1 7.9 7.5 7.5After-Tax Profits (Billions of $) 1857.4 1732.0 1748.9 1871.9 1903.8 1938.6 1874.4 2307.7 2373.8 2440.6 2573.4 (Percent change) 3.8 -6.6 1.2 7.2 1.8 1.8 -3.4 25.6 3.0 2.8 5.4
Forecast

TA B L E S
20 U.S. Forecast / June 2021
Table 2. Real Gross Domestic Product
2014 2015 2016 2017 2018 2019 2020 2021 2022 2023 2024
Real GDP Billions 2012 $
Gross Domestic Product 16912.0 17432.2 17730.5 18144.1 18687.8 19091.7 18426.1 19639.9 20551.2 20937.1 21404.8
Final Sales of Domestic Product 16822.3 17290.1 17686.9 18107.2 18613.8 19021.1 18471.0 19569.9 20332.8 20787.2 21269.7
Total Consumption 11497.4 11934.3 12264.6 12587.2 12928.1 13240.2 12725.6 13686.3 14284.4 14636.4 15007.5
Durables 1301.6 1400.6 1481.9 1584.6 1692.6 1774.6 1886.9 2132.5 2060.7 2100.6 2201.6
Nondurables 2605.3 2693.7 2762.0 2834.0 2910.3 3001.5 3078.8 3247.5 3238.1 3271.2 3328.3
Services 7594.9 7849.0 8035.6 8195.5 8367.1 8520.5 7898.6 8473.1 9082.6 9351.3 9578.7
Nonresidential Fixed Investment 2365.3 2420.3 2433.0 2524.2 2698.9 2776.8 2665.1 2869.2 3041.1 3173.5 3314.3
Equipment & Software 1101.1 1134.6 1115.1 1150.3 1242.2 1267.7 1204.8 1373.5 1439.4 1483.6 1539.7
Information Processing Equipment 370.2 393.3 410.8 441.2 479.3 493.9 530.0 635.0 656.2 655.8 663.2
Computers & Peripherals 102.9 103.4 102.6 110.5 124.0 130.7 151.3 190.6 190.4 179.9 173.9
Communications Equipment 133.0 153.9 172.8 193.4 198.2 203.6 207.1 248.8 263.4 279.0 291.7
Industrial Equipment 216.5 216.7 213.7 225.4 243.9 249.1 238.5 254.9 261.4 268.4 293.9
Transportation Equipment 272.8 306.3 292.0 292.0 309.5 310.3 241.1 280.5 305.2 340.3 322.2
Aircraft 42.1 42.8 38.2 51.1 55.5 40.1 22.5 35.3 48.5 53.7 54.6
Other Equipment 73.4 81.0 62.9 63.8 70.1 76.4 60.6 69.7 68.1 67.6 67.2
Structures 538.8 534.1 510.4 531.7 551.1 547.7 487.4 454.2 460.1 476.9 496.5
Commercial & Health 121.3 136.0 158.7 163.8 166.0 162.2 159.3 144.6 140.1 145.2 154.4
Manufacturing 55.0 74.0 70.4 60.9 59.9 62.6 53.7 46.0 53.0 61.5 59.7
Power & Communication 112.5 116.4 118.9 113.5 107.0 110.7 114.7 106.4 95.8 94.4 99.5
Mining & Petroleum 167.8 119.9 69.4 96.3 120.6 118.0 74.9 88.2 103.7 101.1 100.8
Other 82.4 91.0 97.5 101.3 102.6 99.2 84.4 73.7 75.2 80.9 88.0
Residential Fixed Investment 504.1 555.4 592.1 615.7 612.0 601.5 638.1 722.7 693.3 664.6 665.4
Exports 2365.3 2375.2 2382.3 2475.5 2549.5 2546.6 2216.9 2349.1 2531.6 2679.7 2810.2
Imports 2942.5 3094.8 3145.9 3292.4 3427.2 3464.2 3142.9 3569.4 3712.5 3819.7 3993.2
Federal Government 1183.8 1183.8 1190.5 1194.1 1227.8 1277.2 1332.6 1363.1 1341.5 1330.5 1331.2
State & Local Government 1848.6 1902.9 1952.0 1976.2 2000.2 2025.5 2009.1 2065.4 2100.3 2096.9 2112.3
History Forecast

TA B L E S
Institute for Economic Forecasting 21
Table 3. Quarterly Summary of the Forecast of the U.S.
2021Q1 2021Q2 2021Q3 2021Q4 2022Q1 2022Q2 2022Q3 2022Q4 2023Q1 2023Q2 2023Q3 2023Q4 2024Q1 2024Q2 2024Q3 2024Q4
Composition of Real GDP, Percent Change, Annual RateGross Domestic Product 6.4 8.4 7.1 7.6 4.2 2.7 1.6 1.6 1.8 2.0 2.0 2.3 2.3 2.3 2.3 2.2 Final Sales of Domestic Product 9.2 7.1 5.3 5.0 3.8 2.8 2.1 2.2 2.2 2.2 2.1 2.4 2.4 2.4 2.3 2.2Total Consumption 10.7 8.4 6.2 5.2 4.2 3.1 2.6 2.5 2.4 2.3 2.3 2.6 2.6 2.6 2.6 2.6 Durables 41.4 -8.7 -11.2 -3.3 -1.8 -1.4 -0.4 0.6 2.4 3.1 3.8 4.8 5.1 5.2 5.2 5.3 Nondurables 14.4 0.8 -1.4 -0.6 -0.3 -0.4 0.2 0.9 1.3 1.3 1.3 1.6 1.7 1.9 2.1 2.0 Services 4.6 14.7 12.2 8.5 6.6 4.8 3.8 3.3 2.6 2.5 2.4 2.5 2.5 2.4 2.4 2.4Nonresidential Fixed Investment 9.9 5.5 5.6 7.8 6.8 5.5 3.9 4.3 4.3 4.4 4.3 4.6 4.5 4.5 4.3 4.1 Equipment & Software 16.7 5.8 0.1 7.2 6.5 5.3 2.6 2.4 2.8 3.2 3.4 3.8 3.8 4.1 3.9 3.9 Information Processing Equipment 34.4 5.0 7.3 6.1 3.3 1.4 -0.3 -0.7 -0.5 0.3 0.2 0.9 1.4 1.6 1.2 1.7 Computers & Peripherals 65.0 2.7 5.8 4.7 -0.3 -3.2 -5.7 -6.4 -6.0 -5.5 -5.2 -3.8 -3.1 -2.6 -2.1 -1.1 Communications Equipment 35.9 3.8 10.6 4.9 5.3 5.3 5.7 6.4 6.6 6.0 4.6 5.4 4.6 5.0 2.8 3.0 Industrial Equipment 5.7 8.5 -4.9 -1.8 4.7 9.9 0.4 0.4 -1.6 9.3 1.6 7.9 9.5 14.3 12.7 10.0 Transportation equipment 19.8 -5.7 -6.3 32.6 6.6 3.3 9.3 17.0 16.5 10.9 9.4 -3.7 -8.4 -11.5 -10.4 -10.7 Aircraft 30.5 122.3 46.6 135.7 14.9 11.9 8.0 18.0 15.9 5.3 1.9 8.6 -3.5 3.1 0.5 -2.8 Other Equipment 50.4 -15.9 -10.5 5.1 -4.1 1.8 -1.6 0.8 -1.2 -0.8 -2.0 0.1 -0.5 -0.5 0.0 -1.3 Structures -4.8 -1.2 7.1 -1.1 0.4 0.7 1.6 5.0 4.1 3.9 3.7 4.2 4.2 4.2 4.3 4.0 Commercial & Health Care -13.1 -17.0 2.1 -8.1 -1.1 -4.0 1.4 3.6 5.7 2.9 6.0 5.1 5.1 7.5 10.5 7.2 Manufacturing -0.7 -34.2 8.1 19.9 9.3 27.2 25.5 51.7 13.0 1.7 -0.2 -5.3 1.4 -10.3 -3.4 0.8 Power & Communication -10.3 19.6 -16.2 -14.4 -10.9 -7.2 -11.0 -12.0 3.1 8.2 1.5 8.5 4.7 11.9 -1.6 0.2 Mining & Petroleum 60.3 73.0 92.5 30.8 5.3 -0.1 -3.9 -4.1 -5.0 0.2 0.4 -0.9 -2.0 0.1 1.9 2.1 Other -14.5 -10.8 -1.9 -7.9 8.9 4.3 9.7 9.2 5.4 5.9 9.2 11.0 10.1 6.1 9.2 7.1Residential Fixed Investment 10.8 3.1 4.9 -3.6 -6.8 -7.2 -5.7 -5.5 -4.5 -3.2 -1.8 0.3 1.1 0.9 0.1 0.4Exports -1.1 10.5 7.4 8.8 8.1 7.1 6.5 6.1 5.8 5.5 5.2 5.0 4.8 4.8 4.5 4.4Imports 5.7 15.7 4.2 3.4 3.5 3.0 2.6 2.5 2.3 3.2 3.6 4.3 5.0 5.0 4.9 4.6Federal Government 13.9 -2.2 -3.4 -1.6 -1.5 -1.1 -0.4 -1.6 -0.7 -0.7 -0.7 0.2 0.2 0.2 0.4 0.5State & Local Government 1.7 17.2 1.5 2.5 0.7 0.5 -1.8 -0.1 -0.4 0.3 0.2 0.9 0.9 0.9 0.9 0.2
Billions of DollarsReal GDP 19087.6 19478.4 19813.5 20180.2 20389.1 20523.0 20605.1 20687.7 20778.8 20882.3 20984.0 21103.3 21223.5 21346.9 21466.5 21582.2Nominal GDP 22048.9 22676.4 23201.4 23734.3 24090.8 24364.7 24583.6 24803.9 25042.6 25296.1 25549.4 25832.7 26124.0 26420.2 26713.8 27008.2
Prices & Wages, Percent Change, Annual RateGDP Deflator 4.1 3.0 2.4 1.8 1.9 1.9 2.0 2.0 2.1 2.1 2.1 2.2 2.2 2.2 2.2 2.3Consumer Prices 3.7 2.5 1.8 1.6 1.7 1.6 1.6 1.6 2.1 1.9 1.8 2.0 2.1 2.1 2.1 2.1 Excl. Food & Energy 1.2 2.5 1.9 2.1 2.1 2.1 2.1 2.1 2.2 2.2 2.2 2.3 2.3 2.3 2.3 2.3Producer Prices, Finished Goods 13.5 6.1 2.6 1.7 1.1 1.2 1.2 1.2 1.6 1.6 1.5 1.7 1.7 1.7 1.8 1.8Employment Cost Index - Total Comp. 4.0 2.3 3.0 3.7 3.4 3.4 3.5 3.7 3.2 3.2 3.1 3.2 2.9 2.9 2.9 2.9
Other Key MeasuresOil - WTI ($ per barrel) 57.8 62.3 65.9 64.7 63.9 63.3 62.4 61.6 62.4 62.2 62.1 62.2 62.2 62.3 62.4 62.6Productivity (%change) 5.4 1.8 0.2 4.5 2.8 1.0 0.2 0.7 1.0 1.5 1.6 2.0 1.9 1.9 1.9 1.8Industrial Production (%change) 2.5 4.6 7.2 9.5 6.1 3.5 2.2 1.8 2.2 2.4 2.1 1.9 2.1 2.3 2.2 2.0Factory Operating Rate 73.4 74.1 75.5 76.9 77.5 77.6 77.4 77.2 77.0 76.9 76.8 76.7 76.6 76.6 76.5 76.4Nonfarm Inven. Chg. (Bil. of 2012 $) -81.3 -20.9 64.0 190.5 212.9 206.2 179.0 147.1 125.1 116.2 108.5 101.8 98.8 98.7 97.2 95.4Consumer Sentiment Index 80.2 82.1 84.4 85.9 86.9 87.6 88.2 88.7 89.3 89.8 90.0 90.1 90.1 90.0 90.0 90.1Light Vehicle Sales (Million units) 16.9 17.0 16.4 16.5 16.6 16.7 16.7 16.8 16.8 16.8 16.9 16.9 16.8 16.7 16.7 16.6Housing Starts (Million units) 1.6 1.6 1.6 1.5 1.5 1.5 1.4 1.4 1.4 1.3 1.3 1.3 1.3 1.3 1.3 1.3Existing House Sales (Million units) 5.6 5.1 5.2 5.3 5.3 5.2 5.1 5.0 5.0 4.9 5.0 4.9 4.9 4.8 4.7 4.7Unemployment Rate (%) 6.2 5.8 5.0 4.3 4.1 3.9 3.8 3.7 3.6 3.6 3.6 3.6 3.6 3.5 3.5 3.5Payroll Employment (%change) 2.1 5.6 8.4 4.7 2.3 1.9 1.6 1.3 1.2 1.2 1.0 1.0 1.0 1.0 0.9 0.8Federal Surplus (NIPA Bil. $) -4369.5 -4229.3 -1923.5 -1410.8 -1412.9 -1403.8 -1404.7 -1265.0 -1235.6 -1228.4 -1222.4 -1179.7 -1189.6 -1190.6 -1195.2 -1184.8Current Account Balance (Bil. $) -776.3 -835.0 -787.8 -764.7 -736.9 -703.4 -664.8 -627.1 -591.1 -562.0 -536.0 -521.6 -508.3 -501.6 -497.8 -495.4
Financial Markets, NSAFederal Funds Rate (%) 0.1 0.1 0.1 0.1 0.1 0.1 0.1 0.1 0.1 0.1 0.1 0.1 0.1 0.2 0.4 0.43-Month Treasury Bill Rate (%) 0.1 0.0 0.0 0.0 0.0 0.1 0.1 0.1 0.1 0.1 0.1 0.1 0.1 0.1 0.3 0.31-Year Treasury Note Yield (%) 0.1 0.0 0.0 0.0 0.0 0.0 0.0 0.1 0.1 0.2 0.2 0.3 0.3 0.4 0.6 0.75-Year Treasury Note Yield (%) 0.6 0.9 0.9 0.9 1.0 1.0 1.1 1.1 1.2 1.2 1.2 1.3 1.3 1.4 1.5 1.610-Year Treasury Note Yield (%) 1.3 1.6 1.7 1.7 1.8 1.9 1.9 2.0 2.0 2.0 2.0 2.1 2.1 2.2 2.2 2.325-Year Treasury Note Yield (%) 2.1 2.3 2.3 2.4 2.5 2.5 2.6 2.6 2.7 2.7 2.7 2.7 2.8 2.8 2.9 2.930-Year Fixed Mortgage Rate (%) 2.9 3.0 3.1 3.3 3.4 3.5 3.6 3.6 3.7 3.7 3.7 3.7 3.8 3.8 3.9 3.9S&P 500 Stock Index 3862.6 4180.2 4271.8 4290.4 4300.3 4361.2 4433.5 4508.8 4566.3 4622.4 4690.9 4742.7 4769.8 4777.8 4772.5 4765.3 (Percent change) 39.5 37.2 9.1 1.7 0.9 5.8 6.8 7.0 5.2 5.0 6.1 4.5 2.3 0.7 -0.4 -0.6Exchange Rate, Major Trading Partners 1.2 1.2 1.2 1.2 1.2 1.2 1.2 1.2 1.2 1.2 1.2 1.2 1.2 1.2 1.2 1.2 (Percent change (negative = depreciation) -6.6 -0.4 -0.6 -0.5 -1.3 -2.4 -1.8 0.0 -0.4 0.8 -0.3 0.8 0.1 0.7 -0.5 0.1
IncomesPersonal Income (Bil. of $) 21900.3 20691.8 20513.9 20407.6 20702.1 20941.5 21150.2 21312.8 21509.1 21731.0 21951.1 22182.6 22451.8 22707.0 22962.9 23223.2 (Percent change) 59.0 -20.3 -3.4 -2.1 5.9 4.7 4.0 3.1 3.7 4.2 4.1 4.3 4.9 4.6 4.6 4.6Disposable Income (Bil. of $) 19621.5 18337.9 18119.1 17977.5 18242.5 18454.6 18638.4 18776.7 18944.8 19136.1 19326.0 19526.0 19762.6 19984.6 20207.2 20434.3 (Percent change) 67.0 -23.7 -4.7 -3.1 6.0 4.7 4.0 3.0 3.6 4.1 4.0 4.2 4.9 4.6 4.5 4.6Real Disposable Income (Bil. Of 2012 $) 17394.3 16148.0 15883.2 15693.7 15857.4 15976.6 16068.5 16120.7 16188.6 16277.5 16364.8 16454.5 16572.8 16677.3 16781.0 16885.3 (Percent change) 61.3 -25.7 -6.4 -4.7 4.2 3.0 2.3 1.3 1.7 2.2 2.2 2.2 2.9 2.5 2.5 2.5Saving Rate (%) 21.0 13.1 10.4 8.0 8.0 8.0 8.0 7.7 7.6 7.5 7.5 7.4 7.5 7.5 7.5 7.5After-Tax Profits (Billions of $) 2229.9 2447.4 2222.7 2330.9 2370.5 2382.5 2379.1 2363.2 2423.0 2432.6 2444.7 2462.1 2543.2 2565.2 2584.1 2601.0 (Percent change) 31.5 45.1 -32.0 20.9 7.0 2.0 -0.6 -2.7 10.5 1.6 2.0 2.9 13.8 3.5 3.0 2.6

TA B L E S
22 U.S. Forecast / June 2021
Table 4. Quarterly Gross Domestic Product
2021Q1 2021Q2 2021Q3 2021Q4 2022Q1 2022Q2 2022Q3 2022Q4 2023Q1 2023Q2 2023Q3 2023Q4 2024Q1 2024Q2 2024Q3 2024Q4
Real GDP Billions 2012 $
Gross Domestic Product 19087.6 19478.4 19813.5 20180.2 20389.1 20523.0 20605.1 20687.7 20778.8 20882.3 20984.0 21103.3 21223.5 21346.9 21466.5 21582.2
Final Sales of Domestic Product 19132.8 19465.6 19719.4 19961.6 20146.8 20285.9 20393.1 20505.5 20617.3 20729.4 20838.3 20963.9 21087.1 21210.7 21331.7 21449.2
Total Consumption 13333.8 13606.8 13814.3 13990.5 14135.6 14243.0 14335.0 14424.2 14508.4 14592.5 14676.0 14768.8 14863.2 14959.4 15055.5 15152.0
Durables 2205.6 2155.9 2093.0 2075.7 2066.2 2059.1 2057.2 2060.2 2072.5 2088.6 2108.1 2133.2 2160.0 2187.3 2215.2 2243.8
Nondurables 3249.5 3255.8 3244.6 3240.0 3237.7 3234.6 3236.4 3243.5 3254.3 3265.2 3276.0 3289.4 3303.6 3319.5 3336.5 3353.4
Services 8093.5 8376.4 8621.9 8800.5 8942.6 9048.6 9132.7 9206.5 9266.5 9324.0 9378.6 9436.2 9493.6 9550.9 9607.1 9663.4
Nonresidential Fixed Investment 2807.5 2845.3 2884.4 2939.5 2988.3 3028.6 3057.6 3089.9 3122.4 3156.3 3189.6 3225.7 3261.6 3297.6 3332.2 3365.5
Equipment & Software 1352.9 1372.0 1372.5 1396.6 1418.8 1437.2 1446.4 1455.1 1465.2 1476.8 1489.2 1503.1 1517.3 1532.5 1547.1 1562.1
Information Processing Equipment 621.3 628.9 640.1 649.7 655.0 657.3 656.8 655.8 654.9 655.4 655.7 657.2 659.5 662.1 664.2 666.9
Computers & Peripherals 187.7 189.0 191.7 193.9 193.8 192.2 189.4 186.3 183.5 180.9 178.5 176.8 175.4 174.2 173.3 172.8
Communications Equipment 243.2 245.5 251.7 254.8 258.0 261.4 265.0 269.1 273.5 277.5 280.6 284.3 287.5 291.0 293.1 295.2
Industrial Equipment 252.9 258.1 254.8 253.7 256.6 262.7 263.0 263.3 262.2 268.1 269.1 274.3 280.6 290.1 298.9 306.1
Transportation Equipment 280.8 276.7 272.3 292.2 296.9 299.4 306.1 318.3 330.7 339.4 347.1 343.9 336.4 326.3 317.4 308.6
Aircraft 27.0 33.0 36.3 45.0 46.5 47.9 48.8 50.9 52.8 53.5 53.7 54.8 54.3 54.8 54.8 54.4
Other Equipment 72.8 69.7 67.8 68.6 67.9 68.2 68.0 68.1 67.9 67.8 67.4 67.4 67.4 67.3 67.3 67.1
Structures 451.7 450.3 458.1 456.8 457.2 458.0 459.8 465.4 470.1 474.6 478.9 483.9 488.9 493.9 499.2 504.1
Commercial & Health 150.1 143.3 144.0 141.0 140.6 139.2 139.7 140.9 142.9 143.9 146.1 147.9 149.7 152.5 156.3 159.1
Manufacturing 48.7 43.9 44.7 46.8 47.8 50.8 53.8 59.7 61.5 61.8 61.8 60.9 61.1 59.5 59.0 59.1
Power & Communication 106.2 111.1 106.2 102.2 99.3 97.5 94.7 91.7 92.4 94.2 94.6 96.5 97.6 100.4 100.0 100.1
Mining & Petroleum 71.4 81.9 96.5 103.2 104.5 104.5 103.4 102.4 101.0 101.1 101.2 101.0 100.5 100.5 101.0 101.5
Other 75.8 73.7 73.3 71.8 73.4 74.1 75.9 77.6 78.6 79.7 81.5 83.7 85.7 87.0 88.9 90.5
Residential Fixed Investment 716.0 721.4 730.1 723.4 710.7 697.5 687.3 677.7 670.0 664.6 661.6 662.2 664.1 665.6 665.7 666.4
Exports 2272.2 2329.7 2371.8 2422.5 2470.2 2512.7 2552.6 2590.9 2627.8 2663.3 2697.3 2730.6 2762.7 2795.1 2826.3 2856.6
Imports 3447.7 3575.5 3612.2 3642.3 3674.1 3701.4 3725.5 3748.8 3770.5 3800.2 3833.5 3874.6 3921.8 3970.1 4017.5 4063.4
Federal Government 1376.1 1368.3 1356.7 1351.2 1346.3 1342.7 1341.3 1335.7 1333.3 1331.0 1328.6 1329.2 1329.7 1330.2 1331.7 1333.4
State & Local Government 1997.6 2078.4 2086.4 2099.3 2103.1 2105.8 2096.3 2095.9 2094.0 2095.6 2096.6 2101.4 2106.2 2111.0 2115.6 2116.5

TA B L E S
Institute for Economic Forecasting 23
Table 5. Annual Employment
2014 2015 2016 2017 2018 2019 2020 2021 2022 2023 2024
Millions
Total Nonfarm Employment 138.92 141.80 144.33 146.59 148.89 150.90 142.25 146.75 151.85 153.78 155.29
Private Nonfarm 117.05 119.78 122.10 124.24 126.44 128.29 120.34 124.88 129.26 130.95 132.33
Mining 0.84 0.76 0.62 0.63 0.68 0.68 0.57 0.58 0.61 0.62 0.63
Construction 6.15 6.46 6.73 6.97 7.29 7.49 7.27 7.47 7.53 7.50 7.49
Manufacturing 12.18 12.33 12.35 12.44 12.69 12.82 12.18 12.32 12.41 12.43 12.34
Trade, Transportation and Utilities 26.30 26.81 27.18 27.39 27.60 27.72 26.59 27.46 27.07 26.58 26.05
Transportation & Warehousing 4.65 4.86 5.00 5.18 5.43 5.66 5.55 5.83 6.16 6.27 6.32
Financial Activities 7.98 8.12 8.29 8.45 8.59 8.75 8.73 8.89 9.24 9.24 9.23
Education & Health 21.44 22.03 22.64 23.19 23.64 24.16 23.23 23.67 24.16 24.24 24.54
Professional & Business Services 19.12 19.69 20.11 20.50 20.95 21.28 20.25 21.20 22.91 23.26 23.95
Information 2.73 2.75 2.79 2.81 2.84 2.86 2.70 2.74 2.92 2.94 3.04
Leisure & Hospitality 14.69 15.15 15.66 16.05 16.30 16.59 13.37 14.72 15.96 17.56 18.46
Government 21.88 22.03 22.23 22.35 22.45 22.61 21.91 21.87 22.59 22.83 22.96
Federal 2.73 2.76 2.79 2.80 2.80 2.83 2.93 2.89 2.90 2.90 2.90
State & Local 19.14 19.27 19.44 19.55 19.65 19.78 18.98 18.98 19.69 19.94 20.06
Growth Rates
Total Nonfarm Employment 1.88 2.08 1.78 1.57 1.57 1.35 -5.72 3.40 3.50 1.27 0.98
Private Nonfarm 2.22 2.33 1.94 1.75 1.77 1.46 -6.19 4.05 3.54 1.30 1.06
Mining 3.84 -16.57 -14.91 7.60 7.85 -4.90 -14.63 7.96 2.54 2.45 0.86
Construction 5.61 5.06 3.36 3.75 4.61 2.10 -0.34 2.25 0.07 -0.49 0.11
Manufacturing 1.70 0.67 -0.10 1.35 2.14 0.14 -3.21 1.29 0.69 -0.28 -0.76
Trade, Transportation and Utilities 2.13 1.51 1.33 0.55 0.77 0.46 -0.65 2.93 -3.64 -0.79 -2.10
Transportation & Warehousing 4.57 3.92 3.05 3.80 5.17 3.81 0.66 5.53 5.15 -0.23 1.59
Financial Activities 1.51 1.85 2.06 1.73 1.94 1.89 -0.52 2.61 3.83 -1.49 0.62
Education & Health 2.09 2.96 2.75 2.11 1.89 2.48 -2.72 3.25 0.98 0.36 1.31
Professional & Business Services 3.05 2.84 1.79 1.96 2.19 1.40 -2.50 7.79 4.66 1.87 3.70
Information 0.33 0.93 2.00 0.15 1.34 1.15 -6.36 5.95 3.94 2.20 2.58
Leisure & Hospitality 2.94 3.47 2.94 2.27 1.29 2.36 19.86 16.80 7.44 8.10 3.03
Government 0.46 0.67 0.97 0.42 0.49 0.96 -4.71 3.75 1.83 0.72 0.53
Federal -0.09 1.01 1.40 -0.31 0.42 1.18 3.85 -0.70 0.00 0.00 0.00
State & Local 0.54 0.62 0.91 0.53 0.50 0.93 -5.77 4.45 2.11 0.83 0.61
History Forecast

TA B L E S
24 U.S. Forecast / June 2021
Table 6. Quarterly Employment
2021Q1 2021Q2 2021Q3 2021Q4 2022Q1 2022Q2 2022Q3 2022Q4 2023Q1 2023Q2 2023Q3 2023Q4 2024Q1 2024Q2 2024Q3 2024Q4
Employment (Millions)
Total Nonfarm Employment 143.35 145.33 148.30 150.02 150.89 151.60 152.20 152.71 153.17 153.61 153.99 154.36 154.75 155.13 155.49 155.79
Private Nonfarm 121.82 123.64 126.33 127.71 128.45 129.05 129.56 129.99 130.39 130.79 131.14 131.48 131.84 132.19 132.51 132.79
Mining 0.56 0.57 0.58 0.59 0.60 0.61 0.61 0.61 0.61 0.62 0.62 0.62 0.62 0.63 0.63 0.63
Construction 7.41 7.44 7.52 7.53 7.53 7.53 7.54 7.53 7.52 7.50 7.49 7.49 7.49 7.48 7.49 7.50
Manufacturing 12.25 12.31 12.38 12.35 12.39 12.39 12.41 12.44 12.45 12.45 12.43 12.40 12.37 12.35 12.33 12.31
Trade, Transportation and Utilities 27.09 27.30 27.72 27.72 27.39 27.09 27.09 26.71 26.55 26.72 26.55 26.49 26.27 26.02 25.97 25.93
Transportation & Warehousing 5.71 5.75 5.89 5.97 6.03 6.10 6.26 6.27 6.30 6.27 6.25 6.25 6.28 6.32 6.33 6.35
Financial Activities 8.78 8.83 8.96 8.99 9.08 9.21 9.34 9.33 9.33 9.23 9.20 9.19 9.20 9.23 9.23 9.24
Education & Health 23.31 23.52 23.87 24.01 23.79 24.28 24.36 24.22 24.25 24.19 24.22 24.30 24.42 24.52 24.58 24.62
Professional & Business Services 20.72 20.78 21.30 21.98 22.82 22.99 22.86 22.96 23.19 23.19 23.28 23.38 23.61 23.87 24.06 24.25
Information 2.68 2.70 2.77 2.81 2.90 2.91 2.95 2.91 2.91 2.93 2.95 2.98 3.01 3.05 3.06 3.05
Leisure & Hospitality 13.46 14.48 15.32 15.62 15.68 15.62 15.84 16.71 16.97 17.39 17.84 18.06 18.26 18.44 18.53 18.61
Government 21.53 21.69 21.97 22.31 22.44 22.55 22.64 22.72 22.77 22.82 22.86 22.88 22.91 22.94 22.97 23.00
Federal 2.88 2.90 2.90 2.90 2.90 2.90 2.90 2.90 2.90 2.90 2.90 2.90 2.90 2.90 2.90 2.90
State & Local 18.65 18.79 19.07 19.41 19.54 19.65 19.74 19.82 19.88 19.92 19.96 19.99 20.01 20.04 20.08 20.11
Growth Rates
Total Nonfarm Employment 2.05 5.53 8.18 4.62 2.32 1.90 1.58 1.33 1.20 1.15 1.00 0.96 1.01 1.00 0.91 0.79
Private Nonfarm 2.34 5.99 8.70 4.34 2.34 1.88 1.57 1.32 1.24 1.21 1.07 1.04 1.10 1.08 0.97 0.83
Mining 4.07 10.04 10.01 6.72 6.90 3.97 0.68 -1.64 3.15 2.01 2.10 2.44 -0.40 1.53 1.22 1.08
Construction 2.48 1.69 4.35 0.37 0.31 0.14 0.07 -0.24 -0.76 -0.74 -0.46 -0.02 -0.21 -0.24 0.27 0.62
Manufacturing 1.98 1.81 2.28 -0.95 1.13 0.29 0.54 0.79 0.58 -0.20 -0.54 -0.97 -0.94 -0.84 -0.63 -0.63
Trade, Transportation and Utilities 2.33 3.04 6.13 0.02 -4.82 -4.30 -0.03 -5.67 -2.41 2.67 -2.54 -0.94 -3.39 -3.82 -0.72 -0.59
Transportation & Warehousing 4.13 2.43 10.03 5.52 4.54 4.46 10.87 0.71 2.05 -2.22 -0.82 0.06 1.79 2.16 1.23 1.17
Financial Activities 1.10 2.38 5.86 1.11 4.16 5.79 6.03 -0.69 0.16 -4.05 -1.46 -0.60 0.61 1.13 0.24 0.50
Education & Health 0.93 3.71 5.98 2.38 -3.58 8.54 1.30 -2.34 0.66 -1.10 0.50 1.38 2.01 1.67 0.97 0.59
Professional & Business Services 6.26 1.05 10.45 13.39 16.24 2.90 -2.22 1.72 4.05 0.02 1.59 1.83 3.97 4.52 3.21 3.09
Information 3.93 3.76 10.72 5.40 14.14 0.89 6.14 -5.38 -0.12 1.89 3.11 3.92 5.01 4.32 1.17 -0.17
Leisure & Hospitality -0.05 33.95 25.15 8.14 1.60 -1.58 5.71 24.01 6.24 10.35 10.65 5.16 4.36 3.99 2.15 1.64
Government 0.40 2.93 5.28 6.39 2.28 2.03 1.62 1.40 0.98 0.80 0.63 0.48 0.51 0.52 0.55 0.55
Federal -4.89 2.10 0.00 0.00 0.00 0.00 0.00 0.00 0.00 0.00 0.00 0.00 0.00 0.00 0.00 0.00
State & Local 1.25 3.06 6.11 7.39 2.62 2.33 1.86 1.61 1.13 0.91 0.72 0.55 0.58 0.60 0.63 0.62
TA B L E S
Institute for Economic Forecasting 25
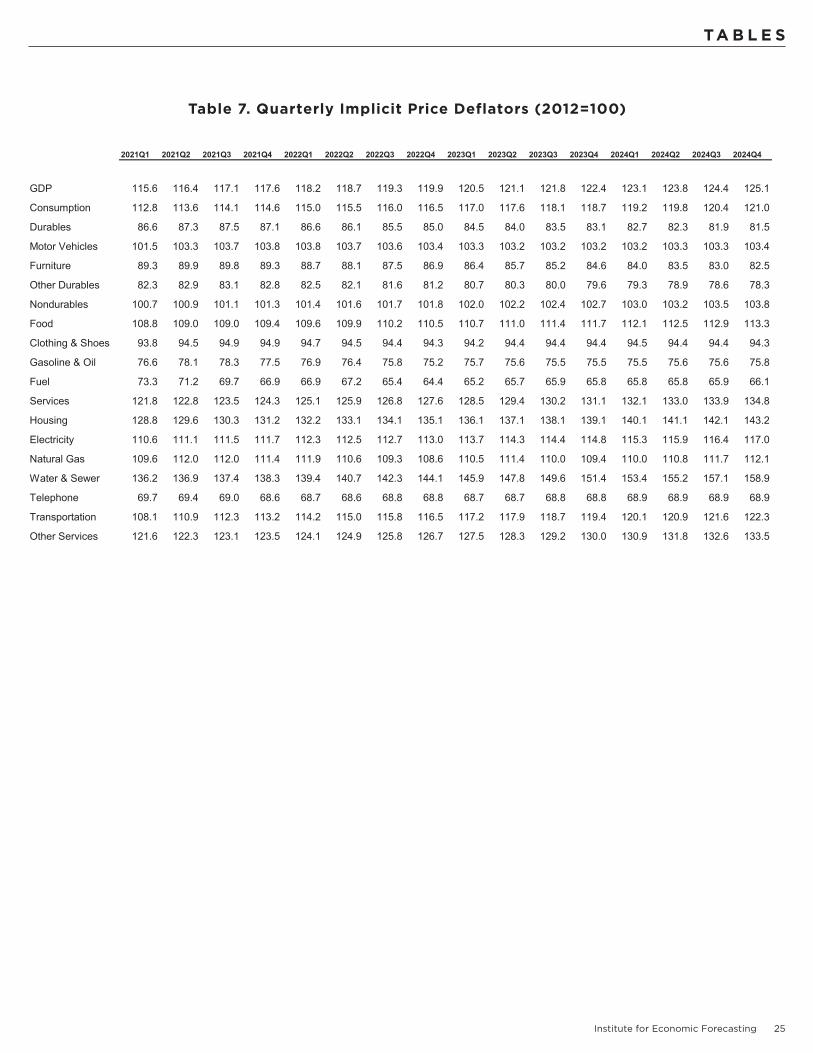
Table 7. Quarterly Implicit Price Deflators (2012=100)
2021Q1 2021Q2 2021Q3 2021Q4 2022Q1 2022Q2 2022Q3 2022Q4 2023Q1 2023Q2 2023Q3 2023Q4 2024Q1 2024Q2 2024Q3 2024Q4
GDP 115.6 116.4 117.1 117.6 118.2 118.7 119.3 119.9 120.5 121.1 121.8 122.4 123.1 123.8 124.4 125.1
Consumption 112.8 113.6 114.1 114.6 115.0 115.5 116.0 116.5 117.0 117.6 118.1 118.7 119.2 119.8 120.4 121.0
Durables 86.6 87.3 87.5 87.1 86.6 86.1 85.5 85.0 84.5 84.0 83.5 83.1 82.7 82.3 81.9 81.5
Motor Vehicles 101.5 103.3 103.7 103.8 103.8 103.7 103.6 103.4 103.3 103.2 103.2 103.2 103.2 103.3 103.3 103.4
Furniture 89.3 89.9 89.8 89.3 88.7 88.1 87.5 86.9 86.4 85.7 85.2 84.6 84.0 83.5 83.0 82.5
Other Durables 82.3 82.9 83.1 82.8 82.5 82.1 81.6 81.2 80.7 80.3 80.0 79.6 79.3 78.9 78.6 78.3
Nondurables 100.7 100.9 101.1 101.3 101.4 101.6 101.7 101.8 102.0 102.2 102.4 102.7 103.0 103.2 103.5 103.8
Food 108.8 109.0 109.0 109.4 109.6 109.9 110.2 110.5 110.7 111.0 111.4 111.7 112.1 112.5 112.9 113.3
Clothing & Shoes 93.8 94.5 94.9 94.9 94.7 94.5 94.4 94.3 94.2 94.4 94.4 94.4 94.5 94.4 94.4 94.3
Gasoline & Oil 76.6 78.1 78.3 77.5 76.9 76.4 75.8 75.2 75.7 75.6 75.5 75.5 75.5 75.6 75.6 75.8
Fuel 73.3 71.2 69.7 66.9 66.9 67.2 65.4 64.4 65.2 65.7 65.9 65.8 65.8 65.8 65.9 66.1
Services 121.8 122.8 123.5 124.3 125.1 125.9 126.8 127.6 128.5 129.4 130.2 131.1 132.1 133.0 133.9 134.8
Housing 128.8 129.6 130.3 131.2 132.2 133.1 134.1 135.1 136.1 137.1 138.1 139.1 140.1 141.1 142.1 143.2
Electricity 110.6 111.1 111.5 111.7 112.3 112.5 112.7 113.0 113.7 114.3 114.4 114.8 115.3 115.9 116.4 117.0
Natural Gas 109.6 112.0 112.0 111.4 111.9 110.6 109.3 108.6 110.5 111.4 110.0 109.4 110.0 110.8 111.7 112.1
Water & Sewer 136.2 136.9 137.4 138.3 139.4 140.7 142.3 144.1 145.9 147.8 149.6 151.4 153.4 155.2 157.1 158.9
Telephone 69.7 69.4 69.0 68.6 68.7 68.6 68.8 68.8 68.7 68.7 68.8 68.8 68.9 68.9 68.9 68.9
Transportation 108.1 110.9 112.3 113.2 114.2 115.0 115.8 116.5 117.2 117.9 118.7 119.4 120.1 120.9 121.6 122.3
Other Services 121.6 122.3 123.1 123.5 124.1 124.9 125.8 126.7 127.5 128.3 129.2 130.0 130.9 131.8 132.6 133.5

TA B L E S
26 U.S. Forecast / June 2021
Table 8. Percent Change in Implicit Price Deflators
2021Q1 2021Q2 2021Q3 2021Q4 2022Q1 2022Q2 2022Q3 2022Q4 2023Q1 2023Q2 2023Q3 2023Q4 2024Q1 2024Q2 2024Q3 2024Q4
GDP 4.1 3.0 2.4 1.8 1.9 1.9 2.0 2.0 2.1 2.1 2.1 2.2 2.2 2.2 2.2 2.3
Consumption 3.5 2.7 1.8 1.7 1.7 1.6 1.7 1.7 1.9 1.8 1.8 2.0 2.0 2.0 2.0 2.0
Durables 1.0 3.3 0.6 -1.8 -2.1 -2.4 -2.4 -2.5 -2.4 -2.3 -2.2 -2.0 -2.0 -1.9 -1.9 -1.8
Motor Vehicles -3.6 7.4 1.6 0.4 -0.2 -0.4 -0.4 -0.5 -0.4 -0.3 -0.2 0.0 0.1 0.2 0.2 0.2
Furniture 2.2 2.8 -0.2 -2.4 -2.7 -2.7 -2.7 -2.6 -2.5 -2.8 -2.7 -2.6 -2.7 -2.5 -2.4 -2.4
Other Durables 3.9 2.7 0.8 -1.1 -1.6 -2.1 -2.0 -2.2 -2.2 -1.9 -1.9 -1.8 -1.7 -1.6 -1.5 -1.4
Nondurables 8.0 0.9 0.7 0.6 0.6 0.5 0.5 0.4 1.0 0.8 0.8 1.0 1.0 1.1 1.1 1.1
Food 0.7 0.7 0.0 1.3 1.0 1.0 1.0 1.0 1.0 1.1 1.2 1.3 1.4 1.4 1.4 1.4
Clothing & Shoes 9.3 2.9 1.8 -0.3 -0.6 -0.9 -0.4 -0.3 -0.4 0.6 0.0 0.2 0.2 -0.2 -0.2 -0.2
Gasoline & Oil 101.7 7.9 1.2 -4.0 -3.1 -2.7 -3.1 -3.2 2.7 -0.6 -0.5 -0.1 0.1 0.4 0.4 0.6
Fuel 118.9 -11.2 -7.9 -15.5 0.0 1.9 -10.3 -5.9 5.0 3.5 0.9 -0.6 0.2 0.1 0.4 0.9
Services 2.6 3.2 2.4 2.6 2.7 2.6 2.7 2.7 2.8 2.8 2.7 2.8 2.8 2.8 2.8 2.8
Housing 1.9 2.4 2.3 2.8 2.9 2.9 3.0 3.0 2.9 2.9 3.0 3.0 2.9 2.9 2.9 2.9
Electricity 2.4 1.9 1.2 1.0 1.9 0.8 0.7 1.0 2.8 2.0 0.5 1.2 1.9 2.1 1.8 1.9
Natural Gas 9.1 9.0 0.0 -2.3 1.9 -4.4 -4.6 -2.7 7.3 3.2 -5.0 -2.1 2.2 3.1 3.0 1.5
Water & Sewer 4.2 2.1 1.6 2.6 3.2 3.9 4.6 5.0 5.2 5.3 4.9 5.1 5.2 5.0 4.8 4.8
Telephone -2.5 -1.8 -2.3 -1.9 0.2 -0.2 0.8 0.1 -0.2 -0.1 0.1 0.4 0.3 0.0 -0.1 0.1
Transportation -0.5 10.7 5.4 3.0 3.8 2.8 2.8 2.3 2.5 2.5 2.5 2.6 2.3 2.5 2.5 2.4
Other Services 2.3 2.3 2.7 1.2 1.8 2.8 2.9 2.7 2.7 2.6 2.7 2.7 2.8 2.6 2.4 2.8

TA B L E S
Institute for Economic Forecasting 27
Table 9. Annual Implicit Price Deflators (2012=100)
2014 2015 2016 2017 2018 2019 2020 2021 2022 2023 2024
GDP 103.6 104.6 105.7 107.8 110.3 112.3 113.6 116.7 119.0 121.5 124.1Consumption 102.8 103.0 104.1 106.0 108.2 109.9 111.1 113.7 115.8 117.8 120.1Durables 95.4 93.4 91.1 89.0 87.5 86.5 85.7 87.1 85.8 83.8 82.1Motor Vehicles 100.6 100.5 99.4 98.2 97.8 98.0 99.9 103.1 103.6 103.2 103.3Furniture 94.7 92.4 90.0 87.5 86.6 87.2 87.8 89.6 87.8 85.5 83.3Other Durables 94.0 90.6 89.9 88.7 87.1 85.1 82.7 82.8 81.8 80.2 78.8Nondurables 100.6 97.1 95.9 97.4 99.3 99.2 98.7 101.0 101.6 102.4 103.4Food 102.9 104.1 103.0 102.9 103.4 104.4 108.0 109.1 110.0 111.2 112.7Clothing & Shoes 101.3 100.1 99.8 99.2 99.3 97.9 93.0 94.5 94.5 94.4 94.4Gasoline & Oil 93.5 68.7 61.0 68.9 78.0 75.3 63.9 77.7 76.1 75.5 75.6Fuel 98.3 69.9 58.0 66.8 80.8 77.2 60.6 70.3 66.0 65.7 65.9Services 104.8 106.7 109.2 111.9 115.0 117.7 120.1 123.1 126.4 129.8 133.4Housing 105.0 108.2 111.9 115.7 119.6 123.8 127.3 130.0 133.6 137.6 141.6Electricity 105.8 106.4 105.2 107.5 108.3 108.5 108.9 111.2 112.6 114.3 116.2Natural Gas 112.3 99.0 96.6 104.3 104.4 102.8 103.3 111.2 110.1 110.3 111.1Water & Sewer 108.1 112.8 116.8 120.7 124.9 128.9 133.0 137.2 141.6 148.7 156.2Telephone 95.0 89.7 85.8 78.1 75.9 72.1 70.5 69.2 68.7 68.8 68.9Transportation 102.3 102.7 103.6 104.9 107.1 109.3 107.9 111.1 115.4 118.3 121.2Other Services 105.4 107.5 109.6 112.0 115.0 117.8 120.3 122.6 125.4 128.7 132.2
History Forecast

TA B L E S
28 U.S. Forecast / June 2021
Table 10. Percent Change in Implicit Price Deflators
2014 2015 2016 2017 2018 2019 2020 2021 2022 2023 2024
GDP 1.5 0.8 1.5 2.0 2.3 1.6 1.3 2.8 1.9 2.1 2.2Consumption 1.1 0.3 1.6 1.8 2.0 1.5 1.2 2.4 1.7 1.9 2.0Durables -2.6 -2.0 -2.9 -1.8 -1.3 -1.5 0.8 0.8 -2.4 -2.3 -1.9Motor Vehicles -0.3 -0.3 -1.4 -0.9 0.2 0.0 4.9 1.4 -0.4 -0.2 0.2Furniture -3.0 -2.5 -2.8 -3.0 0.6 -0.2 2.7 0.6 -2.7 -2.6 -2.5Other Durables -4.1 -3.4 0.0 -1.2 -3.3 -0.8 -3.7 1.6 -2.0 -1.9 -1.6Nondurables -0.4 -3.1 0.4 1.6 1.0 0.5 -0.8 2.6 0.5 0.9 1.1Food 2.8 0.3 -1.8 0.7 0.5 0.9 4.1 0.7 1.0 1.2 1.4Clothing & Shoes -0.1 -1.2 0.1 -1.4 0.1 -1.7 -4.3 3.4 -0.5 0.1 -0.1Gasoline & Oil -10.8 -16.8 7.4 14.4 6.6 1.8 -2.1 26.7 -3.0 0.4 0.4Fuel -9.1 -29.1 7.7 17.3 14.2 -3.5 -10.6 21.1 -3.6 2.2 0.4Services 2.2 1.7 2.7 2.5 2.8 2.3 1.9 2.7 2.7 2.8 2.8Housing 2.8 3.2 3.5 3.3 3.4 3.4 2.4 2.3 2.9 3.0 2.9Electricity 3.1 -0.7 0.3 2.2 0.6 0.0 1.0 1.6 1.1 1.6 1.9Natural Gas 6.5 -12.4 6.6 4.2 -0.7 -0.5 5.0 3.9 -2.4 0.8 2.5Water & Sewer 4.1 3.9 3.3 3.2 4.2 2.6 3.4 2.6 4.2 5.1 5.0Telephone -7.2 -3.2 -5.8 -8.1 -3.4 -3.9 -1.3 -2.1 0.2 0.1 0.1Transportation 1.1 -0.4 1.0 1.8 3.0 1.4 -1.7 4.6 2.9 2.5 2.4Other Services 2.3 1.7 2.1 2.1 3.3 2.0 1.9 2.1 2.5 2.7 2.7
History Forecast

TA B L E S
Institute for Economic Forecasting 29
Table 11. Personal Income and its Components
2014 2015 2016 2017 2018 2019 2020 2021 2022 2023 2024
Personal Income Billions Current DollarsPersonal Income 14991.7 15724.2 16160.7 16948.6 17851.8 18551.5 19691.0 20878.4 21026.7 21843.4 22836.2Wages & Salaries 9249.1 9699.4 9963.9 10422.5 10950.1 11432.4 11448.5 12295.1 13000.8 13605.8 14256.4Other Labor Income 1227.5 1270.6 1293.5 1346.0 1430.7 1474.0 1457.0 1547.3 1628.7 1706.5 1786.9Nonfarm Income 1377.9 1366.7 1388.7 1467.4 1542.9 1608.0 1630.5 1775.7 1852.9 1886.5 1975.4Farm Income 69.8 56.2 36.0 41.5 43.0 49.7 64.7 64.9 56.9 59.8 62.8Rental Income 604.6 649.0 682.7 721.9 759.3 787.1 801.8 827.4 872.8 933.2 990.5Dividends 953.2 1033.1 1077.4 1160.8 1305.1 1290.4 1272.6 1310.9 1480.5 1577.3 1647.4Interest Income 1349.0 1439.1 1474.3 1577.6 1641.6 1677.4 1640.2 1656.6 1635.7 1616.4 1630.4Transfer Payments 2541.5 2685.4 2776.8 2855.1 2970.3 3125.2 4268.7 4491.9 3745.8 3850.6 4035.9Personal Social Insurance Tax 607.1 635.4 657.9 693.3 735.2 769.7 775.5 842.5 883.3 920.1 961.8
Percent Change, Annual RatePersonal Income 5.7 4.9 2.8 4.9 5.3 3.9 6.1 6.2 0.8 3.9 4.5Wages & Salaries 4.7 4.9 2.7 4.6 5.1 4.4 0.1 7.5 5.8 4.7 4.8Other Labor Income 2.7 3.5 1.8 4.0 6.3 3.0 -1.2 6.2 5.3 4.8 4.7Nonfarm Income 4.8 -0.8 1.6 5.7 5.1 4.2 1.4 9.5 4.5 1.8 4.7Farm Income -19.9 -19.0 -36.0 15.3 5.2 18.9 27.8 15.2 -11.8 5.1 5.1Rental Income 8.0 7.3 4.2 6.8 4.3 3.2 1.1 4.4 6.6 6.8 5.6Dividends 22.5 3.4 5.9 10.2 11.0 -4.0 0.1 8.0 11.1 5.0 4.2Interest Income 7.0 6.2 2.5 7.2 3.9 1.9 -4.0 2.1 -2.0 -0.5 1.7Transfer Payments 6.3 4.6 3.4 2.6 4.1 5.4 187.7 103.7 3.8 3.3 5.2Personal Social Insurance Tax 5.5 4.1 3.8 6.0 5.4 4.4 2.8 8.9 3.8 4.4 4.6
History Forecast

TA B L E S
30 U.S. Forecast / June 2021
Table 12. Personal Consumption Expenditures (Current Dollars)
2021Q1 2021Q2 2021Q3 2021Q4 2022Q1 2022Q2 2022Q3 2022Q4 2023Q1 2023Q2 2023Q3 2023Q4 2024Q1 2024Q2 2024Q3 2024Q4
Consumer Expenditures by Type Billions Current DollarsConsumer spending on… all goods & services 15041.1 15452.2 15758.9 16026.4 16261.7 16452.1 16627.7 16800.6 16978.5 17155.2 17331.6 17525.7 17724.0 17926.0 18129.3 18336.7 durable goods 1910.9 1882.7 1830.4 1806.9 1789.0 1772.1 1759.7 1751.1 1750.9 1754.1 1760.5 1772.3 1785.6 1799.7 1814.0 1828.9 furniture and appliances 445.5 426.5 410.9 400.6 393.1 387.3 383.8 381.8 380.0 379.8 381.8 384.5 387.5 389.4 390.9 392.8 information processing equipment 205.6 199.6 194.5 191.8 191.0 190.1 189.6 188.3 187.8 189.2 190.8 192.5 193.6 195.0 196.7 198.5 motor vehicles and parts 645.3 653.9 637.9 636.1 630.5 623.7 619.9 617.3 620.0 623.2 626.6 631.3 637.3 643.4 649.9 656.5 other durable goods 177.6 175.9 172.4 170.1 169.0 165.6 163.1 160.4 158.9 157.6 156.9 156.7 156.9 157.4 158.2 159.1 nondurables 3272.6 3286.7 3281.2 3281.7 3284.5 3285.6 3291.2 3301.6 3320.8 3338.1 3356.0 3377.9 3401.2 3426.6 3453.4 3480.7 clothing & shoes 418.0 429.3 432.4 435.2 437.9 439.2 441.3 443.7 448.7 452.8 456.5 460.3 464.5 467.9 471.0 473.9 fuel oil & coal 19.2 17.9 17.3 17.2 17.1 17.2 16.7 16.5 16.8 16.9 16.9 16.9 16.9 16.9 16.8 16.8 gasoline & motor oil 288.0 305.4 311.4 313.3 315.3 316.1 316.0 315.2 317.9 318.3 318.4 318.7 319.0 319.5 320.0 320.5 food 1181.9 1172.3 1148.3 1140.0 1135.8 1133.3 1134.8 1138.3 1143.7 1149.9 1155.9 1163.1 1170.3 1178.0 1185.8 1193.6 other nondurable goods 1365.6 1361.7 1371.7 1376.0 1378.5 1379.8 1382.4 1387.9 1393.6 1400.3 1408.2 1418.9 1430.5 1444.4 1459.8 1475.9
Consumer Expenditures by Type Billions 2012 DollarsConsumer spending on… all goods & services 13333.8 13606.8 13814.3 13990.5 14135.6 14243.0 14335.0 14424.2 14508.4 14592.5 14676.0 14768.8 14863.2 14959.4 15055.5 15152.0 durable goods 2205.6 2155.9 2093.0 2075.7 2066.2 2059.1 2057.2 2060.2 2072.5 2088.6 2108.1 2133.2 2160.0 2187.3 2215.2 2243.8 furniture and appliances 498.9 474.5 457.3 448.5 443.2 439.7 438.7 439.4 440.0 443.0 448.3 454.4 461.0 466.4 470.9 476.1 information processing equipment 334.8 324.8 316.7 314.7 316.0 317.5 320.1 321.8 324.4 330.8 337.0 343.6 349.2 355.4 362.5 369.8 motor vehicles and parts 636.0 633.2 615.1 612.8 607.6 601.7 598.7 596.9 600.1 603.6 607.3 611.9 617.5 623.1 629.1 635.1 other durable goods 237.1 233.6 229.0 227.3 227.2 224.3 222.3 220.4 220.0 219.8 220.4 221.6 223.2 225.4 227.9 230.5 nondurables 3249.5 3255.8 3244.6 3240.0 3237.7 3234.6 3236.4 3243.5 3254.3 3265.2 3276.0 3289.4 3303.6 3319.5 3336.5 3353.4 clothing & shoes 445.4 454.2 455.5 458.8 462.3 464.7 467.3 470.3 476.1 479.8 483.8 487.6 491.7 495.6 499.1 502.4 fuel oil & coal 26.1 25.2 24.9 25.7 25.5 25.6 25.6 25.7 25.7 25.7 25.7 25.7 25.6 25.6 25.5 25.4 gasoline & motor oil 375.8 391.0 397.5 404.1 409.9 413.7 416.8 419.2 420.1 421.2 421.8 422.4 422.6 422.8 423.0 423.1 food 1086.1 1075.4 1053.5 1042.4 1036.0 1031.3 1029.9 1030.6 1032.9 1035.6 1038.0 1041.0 1043.9 1047.1 1050.4 1053.5 other nondurable goods 1276.6 1275.3 1281.4 1280.1 1277.3 1274.3 1272.9 1274.6 1276.7 1280.2 1284.1 1289.8 1296.5 1304.5 1314.0 1323.9
Real Consumer Expenditures Annual Growth RateConsumer spending on… all goods & services 10.3 8.2 6.1 5.1 4.1 3.0 2.6 2.5 2.3 2.3 2.3 2.5 2.6 2.6 2.6 2.6 durable goods 36.2 -9.0 -11.7 -3.3 -1.8 -1.4 -0.4 0.6 2.4 3.1 3.7 4.8 5.0 5.1 5.1 5.2 furniture and appliances 39.1 -19.6 -14.5 -7.7 -4.7 -3.2 -0.9 0.6 0.5 2.7 4.8 5.4 5.8 4.6 3.9 4.4 information processing equipment 36.7 -11.9 -10.0 -2.5 1.6 2.0 3.3 2.1 3.2 7.9 7.6 7.7 6.5 7.2 7.9 8.1 motor vehicles and parts 43.8 -1.8 -11.4 -1.5 -3.4 -3.9 -2.0 -1.2 2.1 2.4 2.4 3.0 3.6 3.7 3.8 3.8 other durable goods 37.0 -6.0 -7.8 -3.0 -0.3 -5.2 -3.4 -3.5 -0.6 -0.4 1.0 2.2 2.9 3.9 4.4 4.6 nondurables 13.7 0.8 -1.4 -0.6 -0.3 -0.4 0.2 0.9 1.3 1.3 1.3 1.6 1.7 1.9 2.0 2.0 clothing & shoes 30.2 7.9 1.1 2.9 3.1 2.1 2.3 2.5 5.0 3.0 3.3 3.1 3.4 3.1 2.9 2.6 fuel oil & coal 1.3 -14.7 -5.1 13.9 -2.6 0.4 0.3 1.2 1.1 -0.4 -0.6 -0.4 -0.8 -0.2 -1.0 -1.7 gasoline & motor oil 10.7 16.2 6.6 6.6 5.7 3.8 2.9 2.4 0.8 1.0 0.6 0.5 0.2 0.2 0.1 0.1 food 15.2 -3.9 -7.9 -4.1 -2.4 -1.8 -0.5 0.2 0.9 1.1 0.9 1.2 1.1 1.2 1.2 1.2 other nondurable goods 9.3 -0.4 1.9 -0.4 -0.9 -0.9 -0.4 0.5 0.6 1.1 1.2 1.8 2.1 2.5 2.9 3.0

TA B L E S
Institute for Economic Forecasting 31
Table 13. Personal Consumption Expenditures
2014 2015 2016 2017 2018 2019 2020 2021 2022 2023 2024
Consumer Expenditures by Type Billions Current DollarsConsumer spending on… all goods & services 11822.8 12297.5 12770.0 13340.4 13993.3 14544.6 14145.3 15569.6 16535.5 17247.8 18029.0 durable goods 1242.1 1307.6 1350.2 1410.7 1481.6 1534.4 1619.0 1857.7 1768.0 1759.4 1807.0 furniture and appliances 276.2 294.2 309.4 324.7 343.3 357.4 380.6 420.9 386.5 381.5 390.1 information processing equipment 113.8 111.6 116.8 130.3 143.4 157.1 178.1 197.9 189.8 190.1 196.0 motor vehicles and parts 442.0 475.3 485.6 503.6 523.2 521.8 535.3 643.3 622.9 625.3 646.8 other durable goods 135.0 139.9 139.6 142.0 147.0 149.3 144.2 174.0 164.5 157.5 157.9 nondurables 2620.9 2615.4 2648.1 2761.6 2890.3 2977.9 3039.8 3280.5 3290.7 3348.2 3440.5 clothing & shoes 360.8 368.7 376.4 380.0 394.2 403.5 353.6 428.7 440.5 454.6 469.3 fuel oil & coal 26.3 19.7 15.9 17.7 20.5 19.0 16.0 17.9 16.9 16.9 16.8 gasoline & motor oil 377.0 289.7 259.2 291.3 328.7 316.4 233.5 304.5 315.6 318.3 319.8 food 896.9 921.0 939.9 970.2 998.8 1025.7 1133.9 1160.6 1135.6 1153.2 1181.9 other nondurable goods 959.9 1016.3 1056.9 1102.5 1148.0 1213.3 1302.8 1368.8 1382.2 1405.2 1452.7
Consumer Expenditures by Type Billions 2012 DollarsConsumer spending on… all goods & services 11497.4 11934.3 12264.6 12587.2 12928.1 13240.2 12725.6 13686.3 14284.4 14636.4 15007.5 durable goods 1301.6 1400.6 1481.9 1584.6 1692.6 1774.6 1886.9 2132.5 2060.7 2100.6 2201.6 furniture and appliances 291.6 318.4 343.7 371.1 396.7 410.1 433.3 469.8 440.3 446.4 468.6 information processing equipment 129.7 132.7 149.3 173.3 197.0 231.0 285.3 322.8 318.8 333.9 359.2 motor vehicles and parts 439.4 472.8 488.7 513.0 535.1 532.4 535.1 624.3 601.2 605.7 626.2 other durable goods 148.4 161.8 163.9 170.1 181.8 192.3 192.9 231.8 223.5 220.5 226.8 nondurables 2605.3 2693.7 2762.0 2834.0 2910.3 3001.5 3078.8 3247.5 3238.1 3271.2 3328.3 clothing & shoes 356.1 368.5 377.2 383.1 397.1 412.0 380.2 453.5 466.1 481.8 497.2 fuel oil & coal 26.8 28.2 27.4 26.5 25.4 24.7 26.6 25.5 25.6 25.7 25.5 gasoline & motor oil 403.1 421.7 424.6 422.9 421.4 420.2 362.4 392.1 414.9 421.4 422.9 food 871.4 884.8 912.4 943.1 965.9 982.0 1050.0 1064.3 1031.9 1036.9 1048.7 other nondurable goods 947.4 991.3 1017.7 1050.1 1087.7 1145.0 1217.7 1278.4 1274.8 1282.7 1309.7
Real Consumer Expenditures Annual Growth RateConsumer spending on… all goods & services 3.8 3.1 2.7 2.9 2.4 2.5 0.8 7.6 3.1 2.4 2.6 durable goods 9.2 6.0 7.0 8.2 4.2 5.8 16.8 4.6 -0.7 3.5 5.2 furniture and appliances 10.0 9.0 6.8 10.1 3.0 4.8 12.7 1.5 -2.0 3.4 4.8 information processing equipment 9.0 1.3 16.9 15.7 10.5 21.4 28.9 4.6 2.2 6.8 7.6 motor vehicles and parts 9.4 4.6 7.1 6.1 0.6 0.7 12.4 9.3 -2.6 2.5 3.8 other durable goods 11.8 6.8 0.2 5.3 7.1 4.9 65.5 6.5 -3.0 0.6 4.0 nondurables 3.2 2.8 2.0 3.7 2.3 2.7 5.4 3.3 0.1 1.4 1.9 clothing & shoes 4.9 1.9 1.5 3.5 3.8 3.7 25.2 11.5 2.5 3.7 3.0 fuel oil & coal -2.3 10.8 5.0 4.7 -8.0 -2.0 28.8 -0.7 -0.1 -0.1 -0.9 gasoline & motor oil 1.7 3.3 -0.9 0.4 0.1 -1.0 3.8 10.5 3.8 0.7 0.2 food 1.5 1.3 4.1 3.6 1.4 1.8 7.1 -0.2 -1.1 1.0 1.2 other nondurable goods 5.1 4.4 1.0 4.9 3.4 4.5 8.7 2.6 -0.4 1.2 2.6
History Forecast

TA B L E S
32 U.S. Forecast / June 2021
Table 14. Business Fixed Investment
2014 2015 2016 2017 2018 2019 2020 2021 2022 2023 2024
Billions Current DollarsBusiness Fixed Investment 2400.1 2466.6 2460.5 2574.5 2776.7 2895.0 2792.3 3028.1 3232.5 3388.8 3563.1Producers Dur. Equipment 1091.9 1119.5 1088.6 1122.2 1213.4 1241.0 1176.7 1344.8 1408.2 1444.6 1498.6Nonresidential Structures 577.6 584.4 560.3 599.1 631.4 650.2 584.7 556.1 576.8 612.0 652.4Non-Farm Buildings 234.9 284.7 320.6 328.6 346.7 358.7 336.8 295.8 296.9 330.7 358.9Commercial 103.0 118.6 145.3 154.3 163.8 167.0 166.7 147.6 134.3 141.0 155.7Industrial 58.1 79.6 76.3 67.6 69.6 77.1 68.1 60.1 73.9 89.0 88.3Other Buildings 73.8 86.5 99.0 106.6 113.2 114.5 102.0 88.2 88.7 100.7 114.9Utilities 126.3 133.5 135.2 132.4 131.8 141.2 146.4 146.5 140.6 139.3 149.9Mines & Wells 188.3 137.1 75.8 108.4 124.9 120.6 73.0 85.4 107.0 107.4 106.3
Billions 2012 DollarsBusiness Fixed Investment 2365.3 2420.3 2433.0 2524.2 2698.9 2776.8 2665.1 2869.2 3041.1 3173.5 3314.3Producers Dur. Equipment 1101.1 1134.6 1115.1 1150.3 1242.2 1267.7 1204.8 1373.5 1439.4 1483.6 1539.7Nonresidential Structures 538.8 534.1 510.4 531.7 551.1 547.7 487.4 454.2 460.1 476.9 496.5Non-Farm Buildings 222.0 263.7 291.4 289.5 292.4 288.0 263.6 231.7 235.0 254.3 267.3Commercial 98.2 110.7 133.7 138.5 141.6 137.9 134.8 120.8 114.0 116.7 124.2Industrial 55.0 74.0 70.4 60.9 59.9 62.6 53.7 46.0 53.0 61.5 59.7Other Buildings 68.9 79.1 87.5 90.0 90.9 87.5 75.6 65.5 67.4 74.5 82.2Utilities 123.1 128.1 129.0 123.5 118.8 121.3 124.2 116.0 105.6 104.6 110.1Mines & Wells 167.8 119.9 69.4 96.3 120.6 118.0 74.9 88.2 103.7 101.1 100.8
Annual Growth RateBusiness Fixed Investment 8.3 -0.4 1.7 5.8 7.6 2.5 1.0 8.3 5.6 4.9 5.1Producers Dur. Equipment 5.6 0.7 -3.0 7.7 7.4 -1.4 9.9 8.4 3.7 2.9 4.0Nonresidential Structures 16.2 -7.1 5.2 2.9 4.3 5.1 -14.9 2.9 4.3 6.4 6.7Non-Farm Buildings 21.0 13.0 14.1 -0.5 5.1 4.8 -10.8 -10.5 9.2 8.9 9.8Commercial 20.2 12.8 25.7 -0.5 5.1 5.0 -3.6 -14.8 -2.7 7.8 12.8Industrial 38.6 15.1 -6.4 -8.7 7.4 9.6 -18.8 3.8 35.9 5.4 -1.0Other Buildings 12.3 13.6 16.7 5.3 4.2 2.0 -15.6 -11.2 8.9 14.0 15.1Utilities -6.5 23.5 13.2 -13.7 2.1 20.7 -7.7 6.2 -8.5 6.0 6.7Mines & Wells 34.5 -46.0 -19.0 63.3 9.1 -10.1 -17.0 71.1 6.1 -0.1 -1.7
History Forecast

TA B L E S
Institute for Economic Forecasting 33
Table 15. Government Receipts and Expenditures
2014 2015 2016 2017 2018 2019 2020 2021 2022 2023 2024
Federal Government Receipts and ExpendituresReceipts 3292.0 3448.0 3463.3 3524.3 3567.6 3711.2 3663.8 3955.8 4181.0 4348.7 4548.5Personal Tax and Nontax Receipts 1403.7 1532.6 1548.0 1614.6 1617.5 1713.0 1689.9 1807.5 1917.9 2004.2 2102.9Corp. Profits Tax Accruals 339.6 329.1 311.9 245.4 210.6 217.3 199.0 262.8 271.1 279.7 295.6Indirect Business Tax and Nontax Accruals 136.3 140.3 136.4 130.9 162.8 173.7 152.7 163.9 166.5 167.7 171.6Contributions for Social Insurance 1140.1 1190.8 1224.6 1283.7 1344.6 1402.2 1420.8 1526.9 1601.2 1667.6 1743.3
Expenditures 3889.4 4008.3 4132.5 4246.8 4499.3 4758.1 6810.6 6939.1 5552.6 5565.2 5738.6Purchases Goods & Services 1215.0 1220.8 1234.7 1263.9 1339.4 1419.2 1484.5 1557.5 1569.7 1591.6 1627.6National Defense 743.4 729.7 728.7 747.2 794.3 852.4 885.6 915.9 942.1 954.0 973.6Other 471.6 491.0 506.0 516.6 545.1 566.7 598.9 641.6 627.7 637.6 654.0Transfer Payments 2441.5 2568.1 2650.5 2726.4 2852.5 3006.0 4365.9 4841.5 3724.4 3763.8 3921.5To Persons 1881.1 1969.9 2024.5 2098.8 2195.7 2323.4 3412.7 3603.7 2828.0 2915.1 3069.0To Foreigners 45.8 44.8 48.2 46.0 51.5 50.4 51.6 46.3 43.8 44.4 45.1Grants in Aid to State & Local Gov't 495.0 533.1 556.8 559.8 582.6 608.1 872.8 1164.5 824.4 774.8 775.8Net Interest 415.3 402.2 425.0 446.6 504.7 542.6 535.3 495.9 438.6 419.3 416.5Subsidies less Surplus of Gov't Entities 64.7 59.9 62.6 58.4 63.4 75.2 746.1 371.4 124.8 95.8 81.5Surplus (+) or Deficit (-) -597.4 -560.2 -669.1 -722.4 -931.7 -1047.0 -3146.9 -2983.3 -1371.6 -1216.5 -1190.0
State and Local Government Receipts and ExpendituresReceipts 2257.5 2373.1 2431.5 2515.2 2643.2 2742.9 3031.2 3493.5 3259.9 3310.9 3422.6Personal Tax/Nontax Receipts 1541.9 1598.4 1638.6 1719.3 1810.3 1877.1 1910.5 2068.1 2160.4 2246.1 2344.1Corporate Profits 380.9 407.4 409.9 432.1 467.8 489.9 505.8 556.9 580.7 606.0 636.1Indirect Business Tax and Nontax Accruals 56.5 56.2 53.4 54.2 60.5 69.5 75.8 90.8 84.4 87.2 92.3Contributions for Social Insurance 18.7 19.2 20.0 20.0 21.0 21.7 20.4 23.0 23.5 24.8 25.9Federal Grants-In-Aid 495.0 533.1 556.8 559.8 582.6 608.1 872.8 1164.5 824.4 774.8 775.8
Expenditures 2495.4 2588.9 2670.7 2754.0 2856.8 2950.7 2988.5 3157.3 3283.7 3375.3 3510.4Purchases Goods & Services 1953.0 2009.4 2064.6 2143.2 2255.7 2328.7 2346.9 2504.6 2622.4 2708.5 2825.4Transfer Payments 616.5 675.5 690.4 691.2 722.5 753.0 1020.2 1315.6 980.2 937.2 945.1Interest Received 196.8 204.3 214.8 214.7 204.1 219.4 204.4 192.3 192.5 199.4 207.2Net Subsidies 4.4 2.5 3.4 6.7 5.8 6.3 18.7 14.2 8.4 5.7 5.7Dividends Received 5.3 5.4 5.7 5.8 6.0 6.6 5.7 5.9 6.3 6.6 6.9Surplus (+) or Deficit (-) -237.9 -215.8 -239.2 -238.8 -213.7 -207.7 42.7 336.2 -23.7 -64.4 -87.8
History Forecast

TA B L E S
34 U.S. Forecast / June 2021
Table 16. U.S. Exports and Imports of Goods and Services
2014 2015 2016 2017 2018 2019 2020 2021 2022 2023 2024
Billions of DollarsNet Exports Goods & Services -507.7 -526.6 -512.5 -555.5 -609.5 -610.5 -644.8 -863.9 -781.8 -692.0 -677.2Current Account -367.8 -407.4 -394.9 -365.3 -449.7 -480.2 -647.2 -790.9 -683.0 -552.7 -500.8Exports -Goods & Services 2371.7 2265.9 2227.2 2374.6 2528.7 2514.8 2127.1 2460.4 2679.0 2828.5 2990.9Merchandise Balance -749.9 -761.9 -749.8 -799.3 -880.3 -864.3 -915.6 -1059.7 -978.8 -904.2 -906.1Food, Feed & Beverage 143.72 127.72 130.52 132.76 133.13 131.1 137.9 163.2 162.4 167.3 173.7Industrial Supplies Excl Petroleum 500.7 418.1 387.6 459.4 537.0 526.8 455.3 609.9 651.8 694.2 734.4Motor Vehicles & Parts 159.8 151.9 150.4 157.9 158.8 162.5 128.9 158.9 181.8 180.9 178.0Capital Goods, Excl. MVP 551.8 539.8 520.0 533.7 563.4 548.1 460.8 541.3 591.0 599.3 631.7Computer Equipment 48.8 46.8 45.1 46.1 49.5 46.9 41.0 48.4 42.5 39.4 41.1Other 389.8 373.5 354.0 366.7 383.1 375.3 347.5 405.2 425.6 420.5 444.5Consumer Goods, Excl. MVP 198.4 197.3 193.3 197.2 205.5 205.0 174.7 202.3 210.9 218.8 222.1Other Consumer 60.6 59.7 62.2 60.9 66.0 63.2 60.4 66.0 72.5 79.2 85.3Services 756.7 771.3 783.2 832.8 864.8 878.0 709.2 718.8 808.7 888.8 965.7
Billions of DollarsImports -Goods & Services 2879.4 2792.4 2739.7 2930.1 3138.2 3125.2 2772.0 3324.3 3460.8 3520.4 3668.1Merchandise 2391.6 2288.1 2221.1 2376.9 2565.6 2525.6 2308.6 2809.3 2856.9 2853.4 2941.1Food, Feed & Beverage 126.8 128.8 131.0 138.8 148.3 151.6 155.6 165.2 171.4 171.9 176.5Petroleum & Products 353.6 197.2 159.6 197.4 238.9 207.1 126.0 205.9 227.7 232.0 240.8Industrial Supplies Excl Petroleum 316.3 290.9 277.8 305.7 335.8 312.4 298.4 391.4 367.6 292.1 265.4Motor Vehicles & Parts 329.5 350.0 350.8 359.1 372.4 376.8 311.4 382.3 370.0 353.6 359.7Capital Goods, Excl. MVP 598.8 607.2 593.6 642.9 694.7 681.1 647.3 727.0 710.0 709.3 730.2Computer Equipment 122.0 120.3 114.6 128.4 142.1 130.9 144.7 170.4 165.8 160.1 158.9Other 423.5 431.6 429.0 463.1 497.2 487.3 457.3 506.3 484.5 482.7 499.9Consumer Goods, Excl. MVP 558.7 596.4 584.9 603.5 648.4 655.9 636.6 796.1 874.7 952.7 1004.3Other Consumer 107.9 117.5 123.3 129.5 127.1 140.8 133.3 141.4 135.5 141.7 164.3Services 487.8 504.4 518.6 553.2 572.6 599.6 463.4 515.0 603.9 667.1 726.9
Billions 2012 DollarsNet Exports Goods & Services -577.2 -719.5 -763.6 -816.8 -877.7 -917.6 -926.0 -1220.3 -1180.9 -1140.0 -1183.1Exports G & S 2365.3 2375.2 2382.3 2475.5 2549.5 2546.6 2216.9 2349.1 2531.6 2679.7 2810.2Imports G & S 2942.5 3094.8 3145.9 3292.4 3427.2 3464.2 3142.9 3569.4 3712.5 3819.7 3993.2
Exports & Imports % Change
Exports G & S 1.7 -6.4 2.4 9.1 2.7 -0.7 6.7 16.6 6.3 5.4 5.9Imports G & S 4.5 -5.2 2.7 8.5 4.8 -3.7 16.6 13.9 1.6 2.5 4.8Real Exports G & S 3.0 -1.5 1.5 5.9 0.6 0.4 2.0 6.4 7.0 5.4 4.6Real Imports G & S 6.6 3.3 2.8 5.7 3.1 -1.8 13.5 7.2 2.9 3.4 4.9
ForecastHistory

Sean M. Snaith, PhDDirector, Institute for Economic Forecasting
P 407.823.1451E [email protected]
Sean Snaith, Ph.D., is the director of the University of Central Florida’s Institute for Economic Forecasting and a nationally recognized economist in the field of business and economic forecasting.
Snaith is the recipient of multiple awards for the accuracy of his forecasts, his research and his teaching. He has served as a consultant for local governments and multinational corporations such as Compaq, Dell and IBM. Before joining UCF’s College of Business, he held teaching positions at Pennsylvania State University, American University in Cairo, the University of North Dakota and the University of the Pacific.
Snaith is frequently interviewed in international, national and regional media. He has been quoted in The Wall Street Journal, USA Today, The New York Times, The Economist and The Guardian and has appeared on CNBC, Fox Business Network, The Nightly News with Brian Williams, Al Jazeera, the BBC and CBC, China Central TV, Sky News, Nippon TV and the Business News Network, based in Toronto.
Snaith is a sought-after speaker known for his engaging and humorous presentations. He has built a national reputation for his unique ability to explain complex subject matter in a digestible manner. He earned praise from one business editor for having “an uncanny knack of making economics not only understandable but interesting.”
Snaith is a member of several economic organizations and national economic forecasting panels, including The Wall Street Journal’s Economic Forecasting Survey, the Associated Press’ Economy Survey, CNNMoney.com’s Survey of Leading Economists, USA Today’s Survey of Top Economists, Federal Reserve Bank of Philadelphia’s Survey of Professional Forecasters, Bloomberg and Reuters.
Snaith holds a B.S. in Economics from Allegheny College and an M.A. and Ph.D. in Economics from Pennsylvania State University.

U N I V E R S I T Y O F C E N T R A L F L O R I D AI N S T I T U T E F O R E C O N O M I C F O R E C A S T I N G
P . O . B O X 1 6 1 4 0 0O R L A N D O , F L O R I D A 3 2 8 1 6
P H 4 0 7 . 8 2 3 . 1 4 5 3 • F X 4 0 7 . 8 2 3 . 1 4 5 4
W W W . I E C . U C F . E D U