Uber Technologies, Inc. Q2 2021 Earnings
37
Q2 2021 Earnings Uber Technologies, Inc. Q2 2021 Earnings Supplemental Data August 4, 2021
Transcript of Uber Technologies, Inc. Q2 2021 Earnings

Q2 2021 Earnings
Uber Technologies, Inc. Q2 2021 EarningsSupplemental Data
August 4, 2021

2
To supplement our financial information, which is prepared and presented in accordance with generally accepted accounting principles in the United States of America, or GAAP, we use the following non-GAAP financial measures: Adjusted EBITDA margin as a percentage of Revenue, Revenue Excluding UK Accrual, Mobility Revenue Excluding UK Accrual, Mobility Adjusted EBITDA margin as a percentage of Mobility revenue, Delivery Adjusted EBITDA margin as a percentage of Mobility Revenue, and Non-GAAP Costs and Operating Expenses. The presentation of this financial information is not intended to be considered in isolation or as a substitute for, or superior to, the financial information prepared and presented in accordance with GAAP. We use these non-GAAP financial measures for financial and operational decision-making and as a means to evaluate period-to-period comparisons.
We believe that these non-GAAP financial measures provide meaningful supplemental information regarding our performance by excluding certain items that may not be indicative of our recurring core business operating results.
We believe that both management and investors benefit from referring to these non-GAAP financial measures in assessing our performance and when planning, forecasting, and analyzing future periods. These non-GAAP financial measures also facilitate management’s internal comparisons to our historical performance. We believe these non-GAAP financial measures are useful to investors both because (1) they allow for greater transparency with respect to key metrics used by management in its financial and operational decision-making and (2) they are used by our institutional investors and the analyst community to help them analyze the health of our business.
There are a number of limitations related to the use of non-GAAP financial measures. In light of these limitations we provide specific information regarding the GAAP amounts excluded from these non-GAAP financial measures and evaluating these non-GAAP financial measures together with their relevant financial measures in accordance with GAAP.
For more information on these non-GAAP financial measures, please see the section titled “Non-GAAP Reconciliations” included at the end of this deck.
In regards to forward looking non-GAAP guidance provided on our Q2 2021 earnings release and call, we are not able to reconcile the forward-looking non-GAAP Adjusted EBITDA measure to the closest corresponding GAAP measure without unreasonable efforts because we are unable to predict the ultimate outcome of certain significant items. These items include, but are not limited to, significant legal settlements, unrealized gains and losses on equity investments, tax and regulatory reserve changes, restructuring costs and acquisition and financing related impacts.
Non-GAAP Financial Measures Disclosure

3
Forward Looking Statements
This presentation contains forward-looking statements regarding our future business expectations, which involve risks and uncertainties. Actual results may differ materially from the results predicted, and reported results should not be considered as an indication of future performance. Forward-looking statements include all statements that are not historical facts and can be identified by terms such as “anticipate,” “believe,” “contemplate,” “continue,” “could,” “estimate,” “expect,” “hope,” “intend,” “may,” “might,” “objective,” “ongoing,” “plan,” “potential,” “predict,” “project,” “should,” “target,” “will,” or “would” or similar expressions and the negatives of those terms. Forward-looking statements involve known and unknown risks, uncertainties and other factors that may cause our actual results, performance or achievements to be materially different from any future results, performance or achievements expressed or implied by the forward-looking statements. These risks, uncertainties and other factors relate to, among others: the outcome of a tax case before the UK tax authority related to classification as a transportation provider, developments in the COVID-19 pandemic and the impact on our business and operations, competition, managing our growth and corporate
culture, financial performance, investments in new products or offerings, our ability to attract drivers, consumers and other partners to our platform, our brand and reputation and other legal and regulatory developments and proceedings, particularly with respect to our relationships with drivers and delivery persons. In addition, other potential risks and uncertainties that could cause actual results to differ from the results predicted include, among others, those risks and uncertainties included under the captions “Risk Factors” and “Management’s Discussion and Analysis of Financial Condition and Results of Operations” in our annual report on Form 10-K for the year ended December 31, 2020 and subsequent annual reports, quarterly reports and other filings filed with the Securities and Exchange Commission from time to time. All information provided in this presentation is as of the date hereof and any forward-looking statements contained herein are based on assumptions that we believe to be reasonable as of such date. We undertake no duty to update this information unless required by law.

Q2 2021 Earnings
Platform Highlights
Condensed Consolidated Financial Statements
Business Highlights
Non-GAAP Reconciliations
Segment Details
Q2 2021 Earnings 5
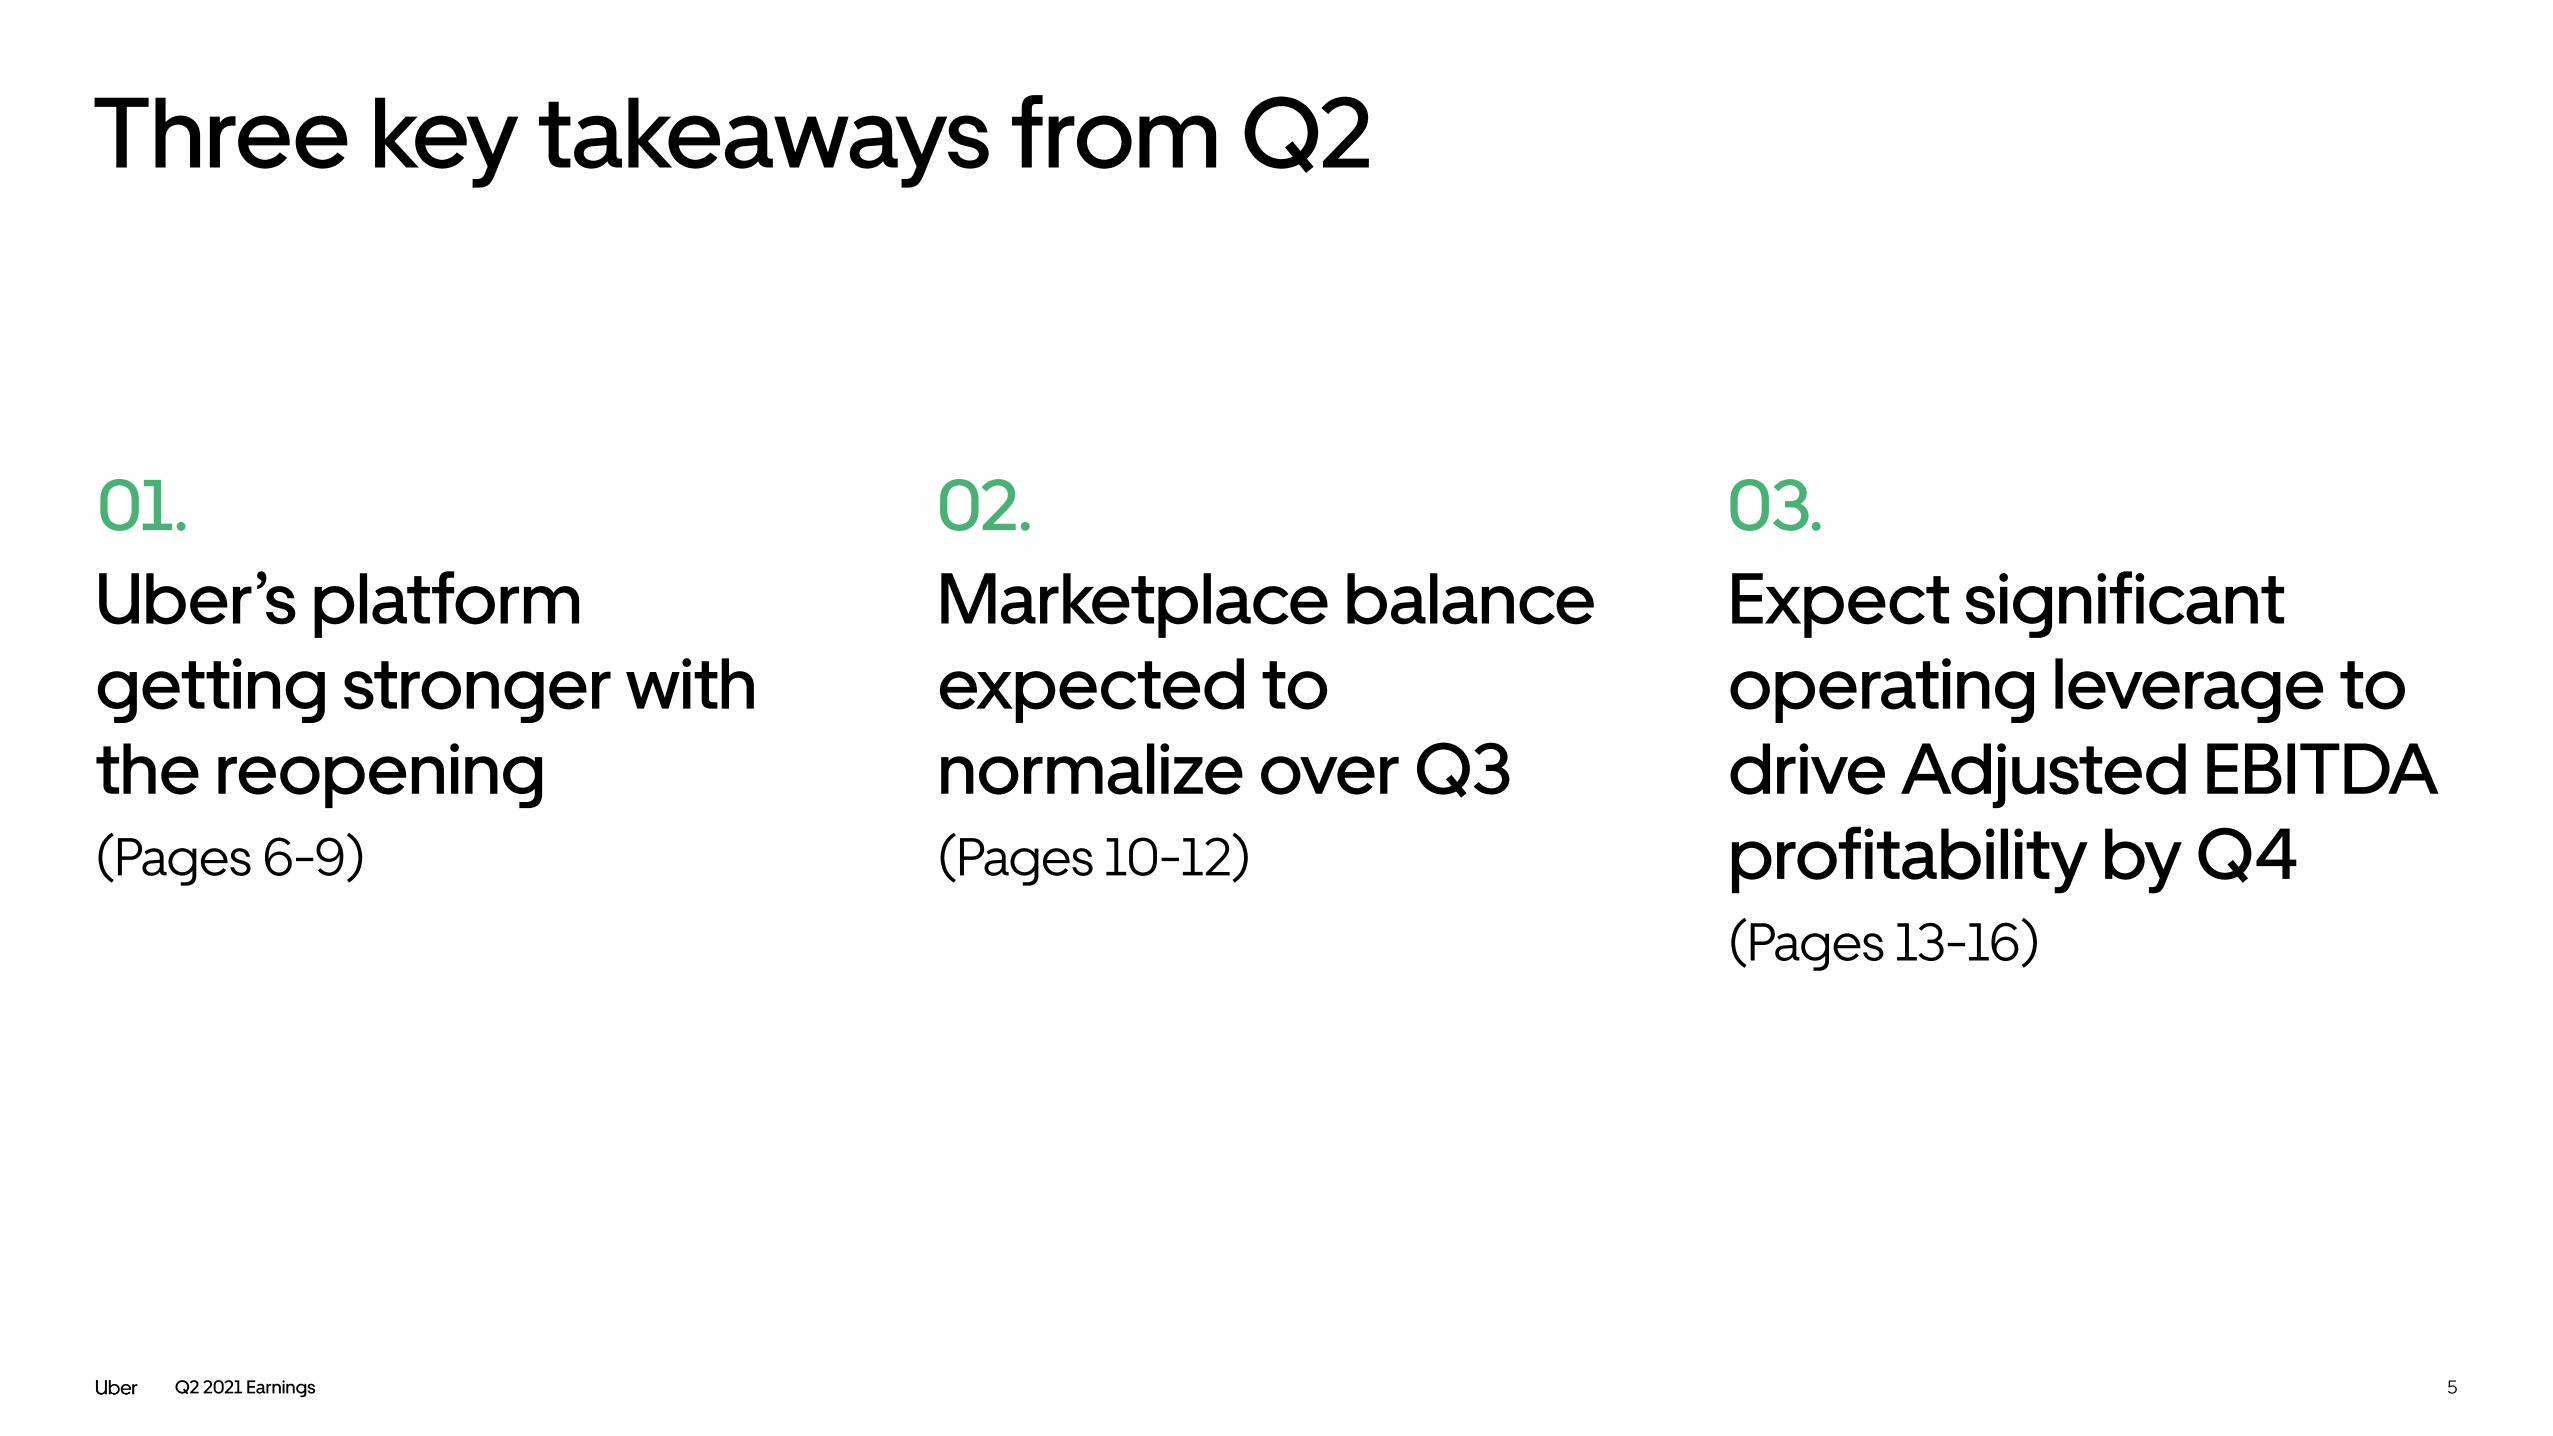
Uber’s platform getting stronger with the reopening (Pages 6-9)
Marketplace balance expected to normalize over Q3 (Pages 10-12)
Expect significant operating leverage to drive Adjusted EBITDA profitability by Q4 (Pages 13-16)
Three key takeaways from Q2
01. 02. 03.

Q2 2021 Earnings
Gross bookings continued to grow despite Delta variant related slowdown in recovery in July
Mobility Delivery
Jan ’20
Feb ’20
Mar ’20
Apr ’20
May ’20
Jun ’20
Jul ’20
Aug ’20
Sep ’20
Oct ’20
Nov ’20
Dec ’20
Jun ’21
May ’21
Apr ’21
Mar ’21
Jan ’21
Feb ’21
Jul ’21
Vaccine distribution
starts
Delta and other variants force some markets
to lockdown but impacts to Uber relatively muted
GBs ~45% vs. 2019
GBs ~25% YoY
Global COVID-19 outbreak
6
Q2 2021 Earnings
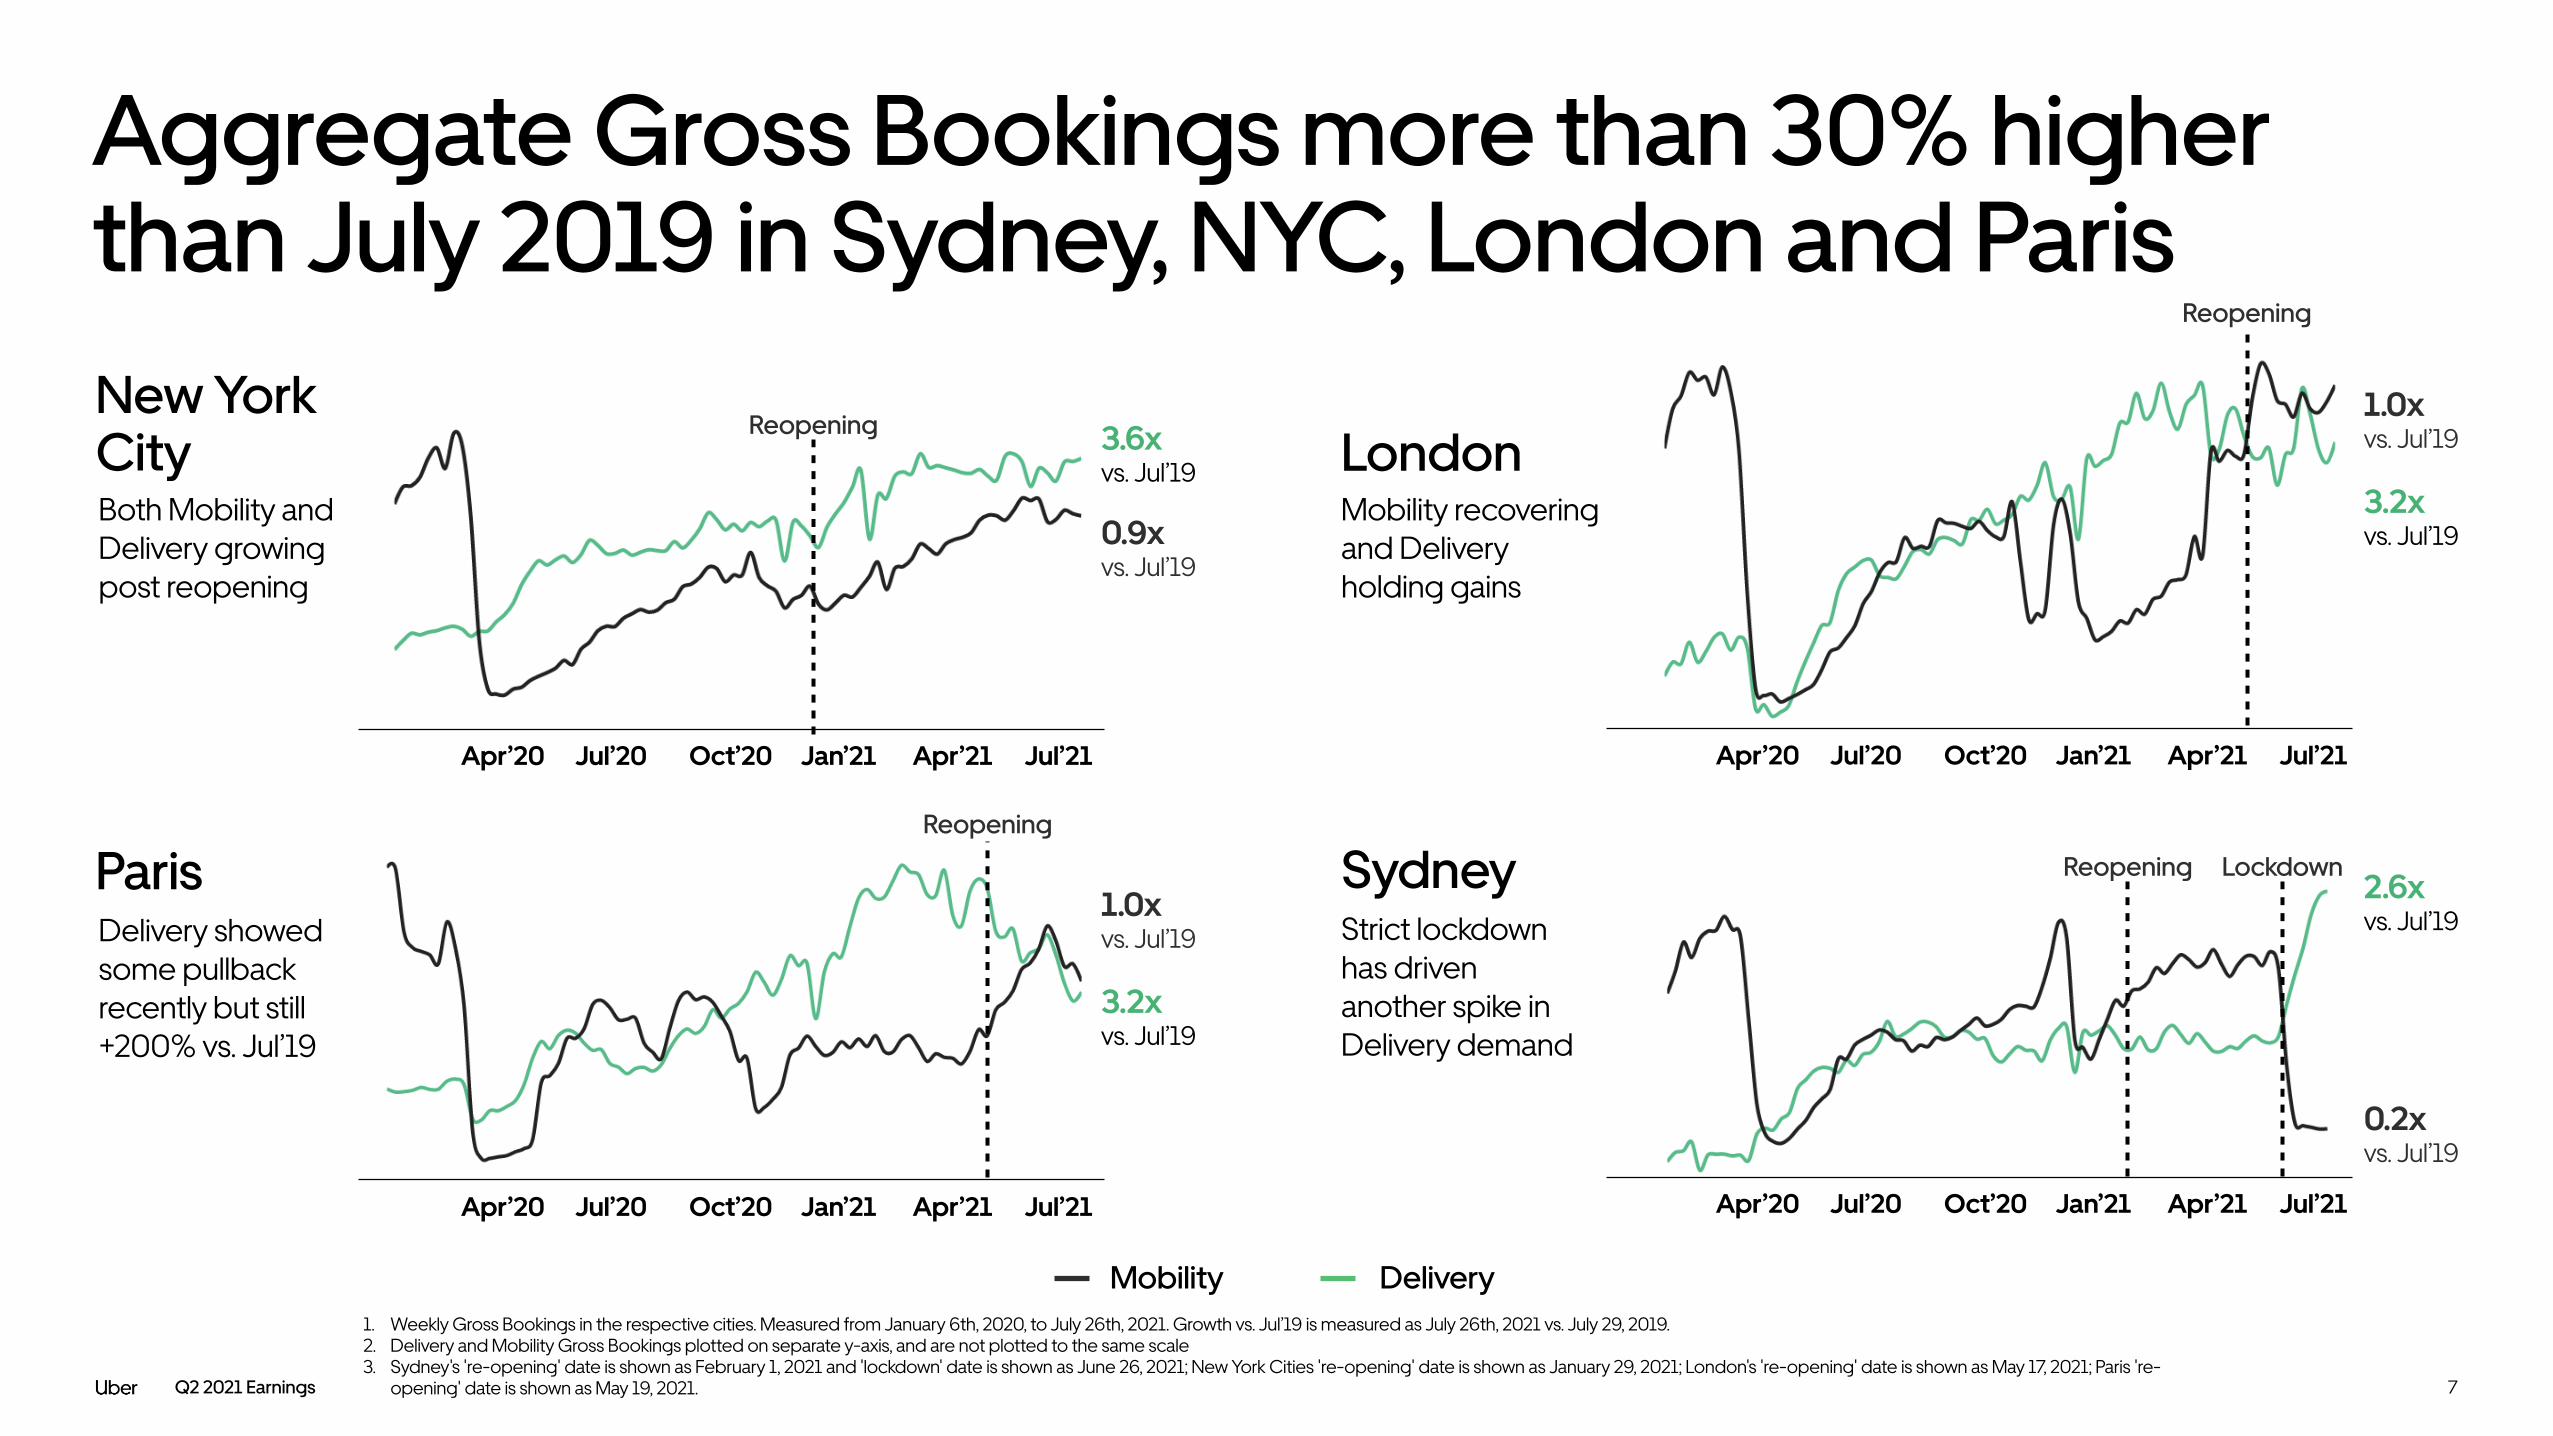
New York CityBoth Mobility and Delivery growing post reopening
Reopening
Apr’20 Jul’20 Oct’20 Jan’21 Apr’21 Jul’21
3.6x vs. Jul’19
0.9x vs. Jul’19
ParisDelivery showed some pullback recently but still +200% vs. Jul’19
Apr’20 Jul’20 Oct’20 Jan’21 Apr’21 Jul’21
Reopening
3.2x vs. Jul’19
1.0x vs. Jul’19
7
1. Weekly Gross Bookings in the respective cities. Measured from January 6th, 2020, to July 26th, 2021. Growth vs. Jul’19 is measured as July 26th, 2021 vs. July 29, 2019. 2. Delivery and Mobility Gross Bookings plotted on separate y-axis, and are not plotted to the same scale 3. Sydney's 're-opening' date is shown as February 1, 2021 and 'lockdown' date is shown as June 26, 2021; New York Cities 're-opening' date is shown as January 29, 2021; London's 're-opening' date is shown as May 17, 2021; Paris 're-
opening' date is shown as May 19, 2021.
DeliveryMobility
Reopening Lockdown
Apr’20 Jul’20 Oct’20 Jan’21 Apr’21 Jul’21
SydneyStrict lockdown has driven another spike in Delivery demand
2.6x vs. Jul’19
0.2x vs. Jul’19
Aggregate Gross Bookings more than 30% higher than July 2019 in Sydney, NYC, London and Paris
Apr’20 Jul’20 Oct’20 Jan’21 Apr’21 Jul’21
Reopening
LondonMobility recovering and Delivery holding gains
3.2x vs. Jul’19
1.0x vs. Jul’19

Q2 2021 Earnings 8
Uber’s cross-platform usage expanding as Mobility recovers
*Active cross-platform consumers are defined as unique consumers who completed a Mobility ride and received a Delivery order on our platform at least once during the trailing 12 week period.
Gross Bookings (% of total) from Mobility & Delivery cross-platform consumers
Pass members already drive 25% of Delivery Gross Bookings, and we see significant upside to Pass adoption. Cross-platform consumers* active on both Mobility and Delivery drive 44% of Uber’s total company Gross Bookings.
As consumers have embraced Delivery and are now increasingly returning to Mobility, this metric has increased meaningfully thus far in 2021. In the US and UK, cross-platform consumers drive roughly 50% of Uber’s Gross Bookings, up from roughly 40% pre-COVID. We expect to see further upside as Mobility continues to recover.
42%39%
50%
40%
33%
48%
Jan ’20 Mar ’20 May ’20 Jul ’20 Sep ’20 Nov ’20 Jan ’21 Mar ’21 May ’21 Jul ’21
United KingdomUnited States
8

Q2 2021 Earnings
Cross-platform consumer acquisition increasingly benefitting all parts of our business
1. Cross-platform consumer acquisition data shows % of monthly first time eaters and first time riders in the US and UK. * New Verticals includes Uber’s non-restaurant food delivery offerings, including grocery, convenience, and alcohol
United KingdomUnited States
The Uber super app is a powerful consumer acquisition funnel for Delivery…% of first time Delivery orders originating from the Rides app
…while Delivery is starting to drive significant expansion for Mobility…% of first time Mobility trips from existing Delivery consumers
We expect our emerging New Verticals* business to become yet another compelling addition to the Uber platform
14%
4%
22%
12%
Jan’20 Apr’20 Jul’20 Oct’21 Jan’21 Apr’21 Jul’21 Jan’20 Apr’20 Jul’20 Oct’21 Jan’21 Apr’21 Jul’21
19%
10%
42%
20%
9

Q2 2021 Earnings
Significant progress made in improving US driver availability, particularly in states further along the reopening curve
1. Wait times/ETA measured from the week of 3/29/2021 to the week of 7/12/2021. 2. Wait time chart based on ETA in minutes. Estimated Time of Arrival, or “ETA”, is the average ETA riders see in the app after they have entered in their pickup and dropoff locations.
US Mobility drivers up 50%+ from February to July
Wait times improved across the US, with strong improvements in FL, TX, AZ, and GA
US Miami Houston Dallas Phoenix AtlantaJan ’21 Feb ’21 Mar ’21 Apr ’21 May ’21 Jun ’21 Jul ’21
Monthly Active Drivers +50% 0
-1
-2
-3
10
Min
utes
imp
rove
d

Q2 2021 Earnings 11
Expect driver recovery to gain significant momentum in Q3 and Q4
Driver intent to return rapidly improvingQ: When do you plan on driving with Uber again?
April 2021 June 2021
5%8%
10%
35%
42%
5%
2%4%
6%
29%
59%
2%4%
Never3-6 months 6-12 months1-3 months1 month
Nearly 90K inactive drivers responded to our survey in June, up from 50K that responded in April (both surveys sent to roughly 900K inactive drivers).
8%

Q2 2021 Earnings 12
Consumers continue to prefer ridesharing to other modes of transportationWe do not take this for granted - Rider experience remains far from optimal - and we are committed to improving marketplace balance over the next few months
New York City rideshare trip recovery vs. taxi and MTA*
Feb'20 Mar'20 Apr'20 May'20 Jun'20 Jul'20 Aug'20 Sep'20 Oct'20 Nov'20 Dec'20 Jan'21 Feb'21 Mar'21 Apr'21 May'21 Jun'21
*MTA, Taxi, and Rideshare data sourced from NYC Taxi & Limousine Commission
Green TaxiMTA (Subway Bus) Yellow Taxi Rideshare App (Uber, Lyft, Via)

Q2 2021 Earnings 13
Gross Bookings ($M), % Constant Currency Growth YoYUber Gross Bookings at all time highs; expect to deliver Adjusted EBITDA profitability by Q4 Mobility
Adjusted EBITDA ($M)
1. “% Constant Currency Growth YoY” is calculated by translating our current period financial results using the corresponding prior period’s monthly exchange rates for our transacted currencies other than the U.S. dollar.
Q1'19 Q2'19 Q3'19 Q4'19 Q1'20 Q2'20 Q3'20 Q4'20 Q1'21 Q2'21
506631
742581
50245 293 298
179
(161)
(509)
(200)(359)
(145)
(454)
(183)
(625)
(232)
(837)
(313)
(612)(461)
(615)
(316)
(585)
(286)
(656)
Expect Adjusted EBITDA profitability by Q4, as Gross Bookings continue to scale and Uber demonstrates significant leverage with incentive rationalization
Q1'19 Q2'19 Q3'19 Q4'19 Q1'20 Q2'20 Q3'20 Q4'20 Q1'21 Q2'21
3481,000800800800
30050050050013212,912
12,46110,0508,550
6,961
4,6834,3743,6583,3863,071
8,6406,7736,7895,9053,046
10,87413,51212,55412,18811,446
37% 32%30%
10%
(32%)
(8%)(4%)
+22% YoY +33% vs. Q1’19
+104% YoY +39% vs. Q2’19
All OtherDelivery
UberMobility Delivery
41%
(309)
(869)
192

Q2 2021 Earnings
Potential Adjusted EBITDA levers (Figures in USD million)
Q2 Adjusted EBITDA ($509)
Mobility: July trends through Q3 +300-350
Delivery: High visibility improvements (Postmates synergies, Ads ramp and July trends)
+60-70
Q3 Adjusted EBITDA outlook ($100) or better
Path to profitability: Expect significant improvement in Q3 and Adjusted EBITDA profitability by Q4
Illustrative bridge from Q2 Adjusted EBITDA to Q3 Adjusted EBITDA outlook, based on our July observations. Our base case anticipates an ongoing recovery and further tapering of supply investments.
We would remind investors that uncertainty from the Delta variant continues to impact visibility.
14

Q2 2021 Earnings
Expect mobility profitability to expand significantly as driver revival investments fade
Rider-Driver recovery gap in June Q2’21 EBITDA margin (% of revenue)
1. June Rider-Driver recovery gap defined as the difference between active rider recovery (June 2021 vs. June 2019) and active driver recovery (June 2021 vs. June 2019). 2. Q2’21 Mobility Adjusted EBITDA margin as a % of revenue.Q2 2021 Earnings
Imbalanced Balanced
59%
(4%)
63%
16%
67%
19%
46%
(12%)
10%
(20%)
Australia France UAECanadaUS
Major international markets delivering strong Mobility EBITDA margins in June
In the US, Mobility take rates in balanced markets reverting to pre-COVID levels
15

Q2 2021 Earnings 16
1. Gross Bookings reported by Uber, Gross Merchandise Value reported by Delivery Hero, Gross Order Value reported by Doordash, and Gross Transaction Value reported by JET and Deliveroo. 2. Uber Delivery based on Q2’21 actuals, Delivery Hero based on Q2’21 Visible Alpha consensus, DoorDash based on Q2’21 Visible Alpha consensus, JET based on midpoint of Q2’21 guidance and YoY % based on Q2’21 actual, Deliveroo based on FY’21 Visible Alpha consensus and YoY % based on Q2’21 actual. 3. Euro and Pound to USD currency conversions based on July 15th 2021 exchange rates. *based on majority owned operations Gross Bookings
Uber Delivery ex-US & Canada is growing much faster than peers
Uber’s Delivery business is the largest on-demand food delivery platform in the world (excluding China). Uber has a category leading position in 8 of our top 10 markets (with a strong #2 position in the US and UK).
Uber’s Delivery business ex-US & Canada is outperforming peers, and was close to Adjusted EBITDA breakeven in Q2.
In the US, where we have opted to lean in to improve our position, we made significant progress, reaching the #1 position in NYC for the first time, and successfully consolidating Postmates to establish a #1 position in LA as well. Going forward, we expect to optimize US spend to improve profitability.
We believe delivery is on track to reaching Adjusted EBITDA breakeven by Q4 2021.
Uber US&C Delivery Uber ROW Delivery
Delivery ex-US & Canada near breakeven in Q2
Q2’21 GB/GMV/GOV/GTV annualized scale & growth
Q2’21 Adjusted EBITDA loss and margin (% of Gross Bookings)
85% YoY
72% YoY
58% YoY 26%
YoY104%
YoY70% YoY
76% YoY
$52B $39B $39B $35B $26B $25B $9B
Ub
er
Del
iver
y
DH
ER
DA
SH JET
Ub
er R
OW
D
eliv
ery
Ub
er U
S&C
D
eliv
ery
ROO
($13M) Adj. EBITDA (0.2%) of GBs
($148M) Adj. EBITDA (2.4%) of GBs
*

Q2 2021 Earnings
~11%
~16%
~25%
~33%
~9%
~4%
~31%
$14.9B
Healthy liquidity position, and investments in leading Mobility and Delivery assets
$5B
Unrestricted Cash
ST Investments
1. Liquidity position excluding revolver. Undrawn revolver provides additional liquidity of $2.0B, net of letters of credit. As of June 30, 2021, Uber’s long-term debt was roughly $7.8 billion. 2. Dollar ownership amounts based on carrying value as of 6/30/2021, which may be different than potential market transaction values. 3. As of June 30, 2021, Uber owns approximately 612M shares of Zomato, 411M shares of Grab, 133M shares of Aurora, and 2.6M shares of Joby. As of June 30, 2021, Uber owned approximately 48M preferred shares of Didi, which upon close of Didi's IPO in early July, converted into 144M ordinary shares (each Didi ADS listed on the NYSE represents 0.25 Didi ordinary shares). 4. Ownership stake percentages as of June 30, 2021 and based on a fully diluted basis.
Uber’s Ownership Position
$ 4.4
$ 0.6
Equity Stakes (Carrying value)Liquidity Position
Announced intention to become publicly listed
Other
YandexJoby
Aurora
Grab
Zomato
Didi
$0.6
$1.0$0.2
$2.1
$3.6
$0.1
$7.3
Publicly listed
17

Q2 2021 Earnings
Platform Highlights
Condensed Consolidated Financial Statements
Business Highlights
Non-GAAP Reconciliations
Segment Details

Q2 2021 Earnings 19
Operating MetricsIn Millions
Monthly Trips / MAPC 4.5 5.25.1 4.9
Note 1: MAPCs is the number of unique consumers who completed a Mobility or New Mobility ride or received a Delivery order on our platform at least once in a given month, averaged over each month in the quarter. Note 2: We define Trips as the number of completed consumer Mobility or New Mobility rides and Delivery orders in a given period.
Q2 2020 Q3 2020 Q4 2020 Q1 2021 Q2 2021
101989378
55
Q2 2020 Q3 2020 Q4 2020 Q1 2021 Q2 2021
1,5111,4471,4431,184
737
MAPCs
Trips
+84%MAPCs Growth YoY
5.0
+105%Trips Growth YoY

Q2 2021 Earnings
$ in Millions
Q2 2020 Q3 2020 Q4 2020 Q1 2021 Q2 2021
$21,900
$19,536
$17,152
$14,745
$10,224
(35%) (10%) (5%) 24%(32%) (8%) (4%) 22%
20
Gross Bookings
% Growth YoY
Note 1: We define Gross Bookings as the total dollar value, including any applicable taxes, tolls, and fees, of Mobility and New Mobility rides, Delivery orders, and amounts paid by Freight shippers, in each case without any adjustment for consumer discounts and refunds, Driver and Merchant earnings, and Driver incentives. Gross Bookings do not include tips earned by Drivers. Note 2: “% Constant Currency Growth YoY” is calculated by translating our current period financial results using the corresponding prior period’s monthly exchange rates for our transacted currencies other than the U.S. dollar.
% Constant Currency Growth YoY
114%104%
+12%Gross Bookings Growth QoQ
Q2 2021 Earnings
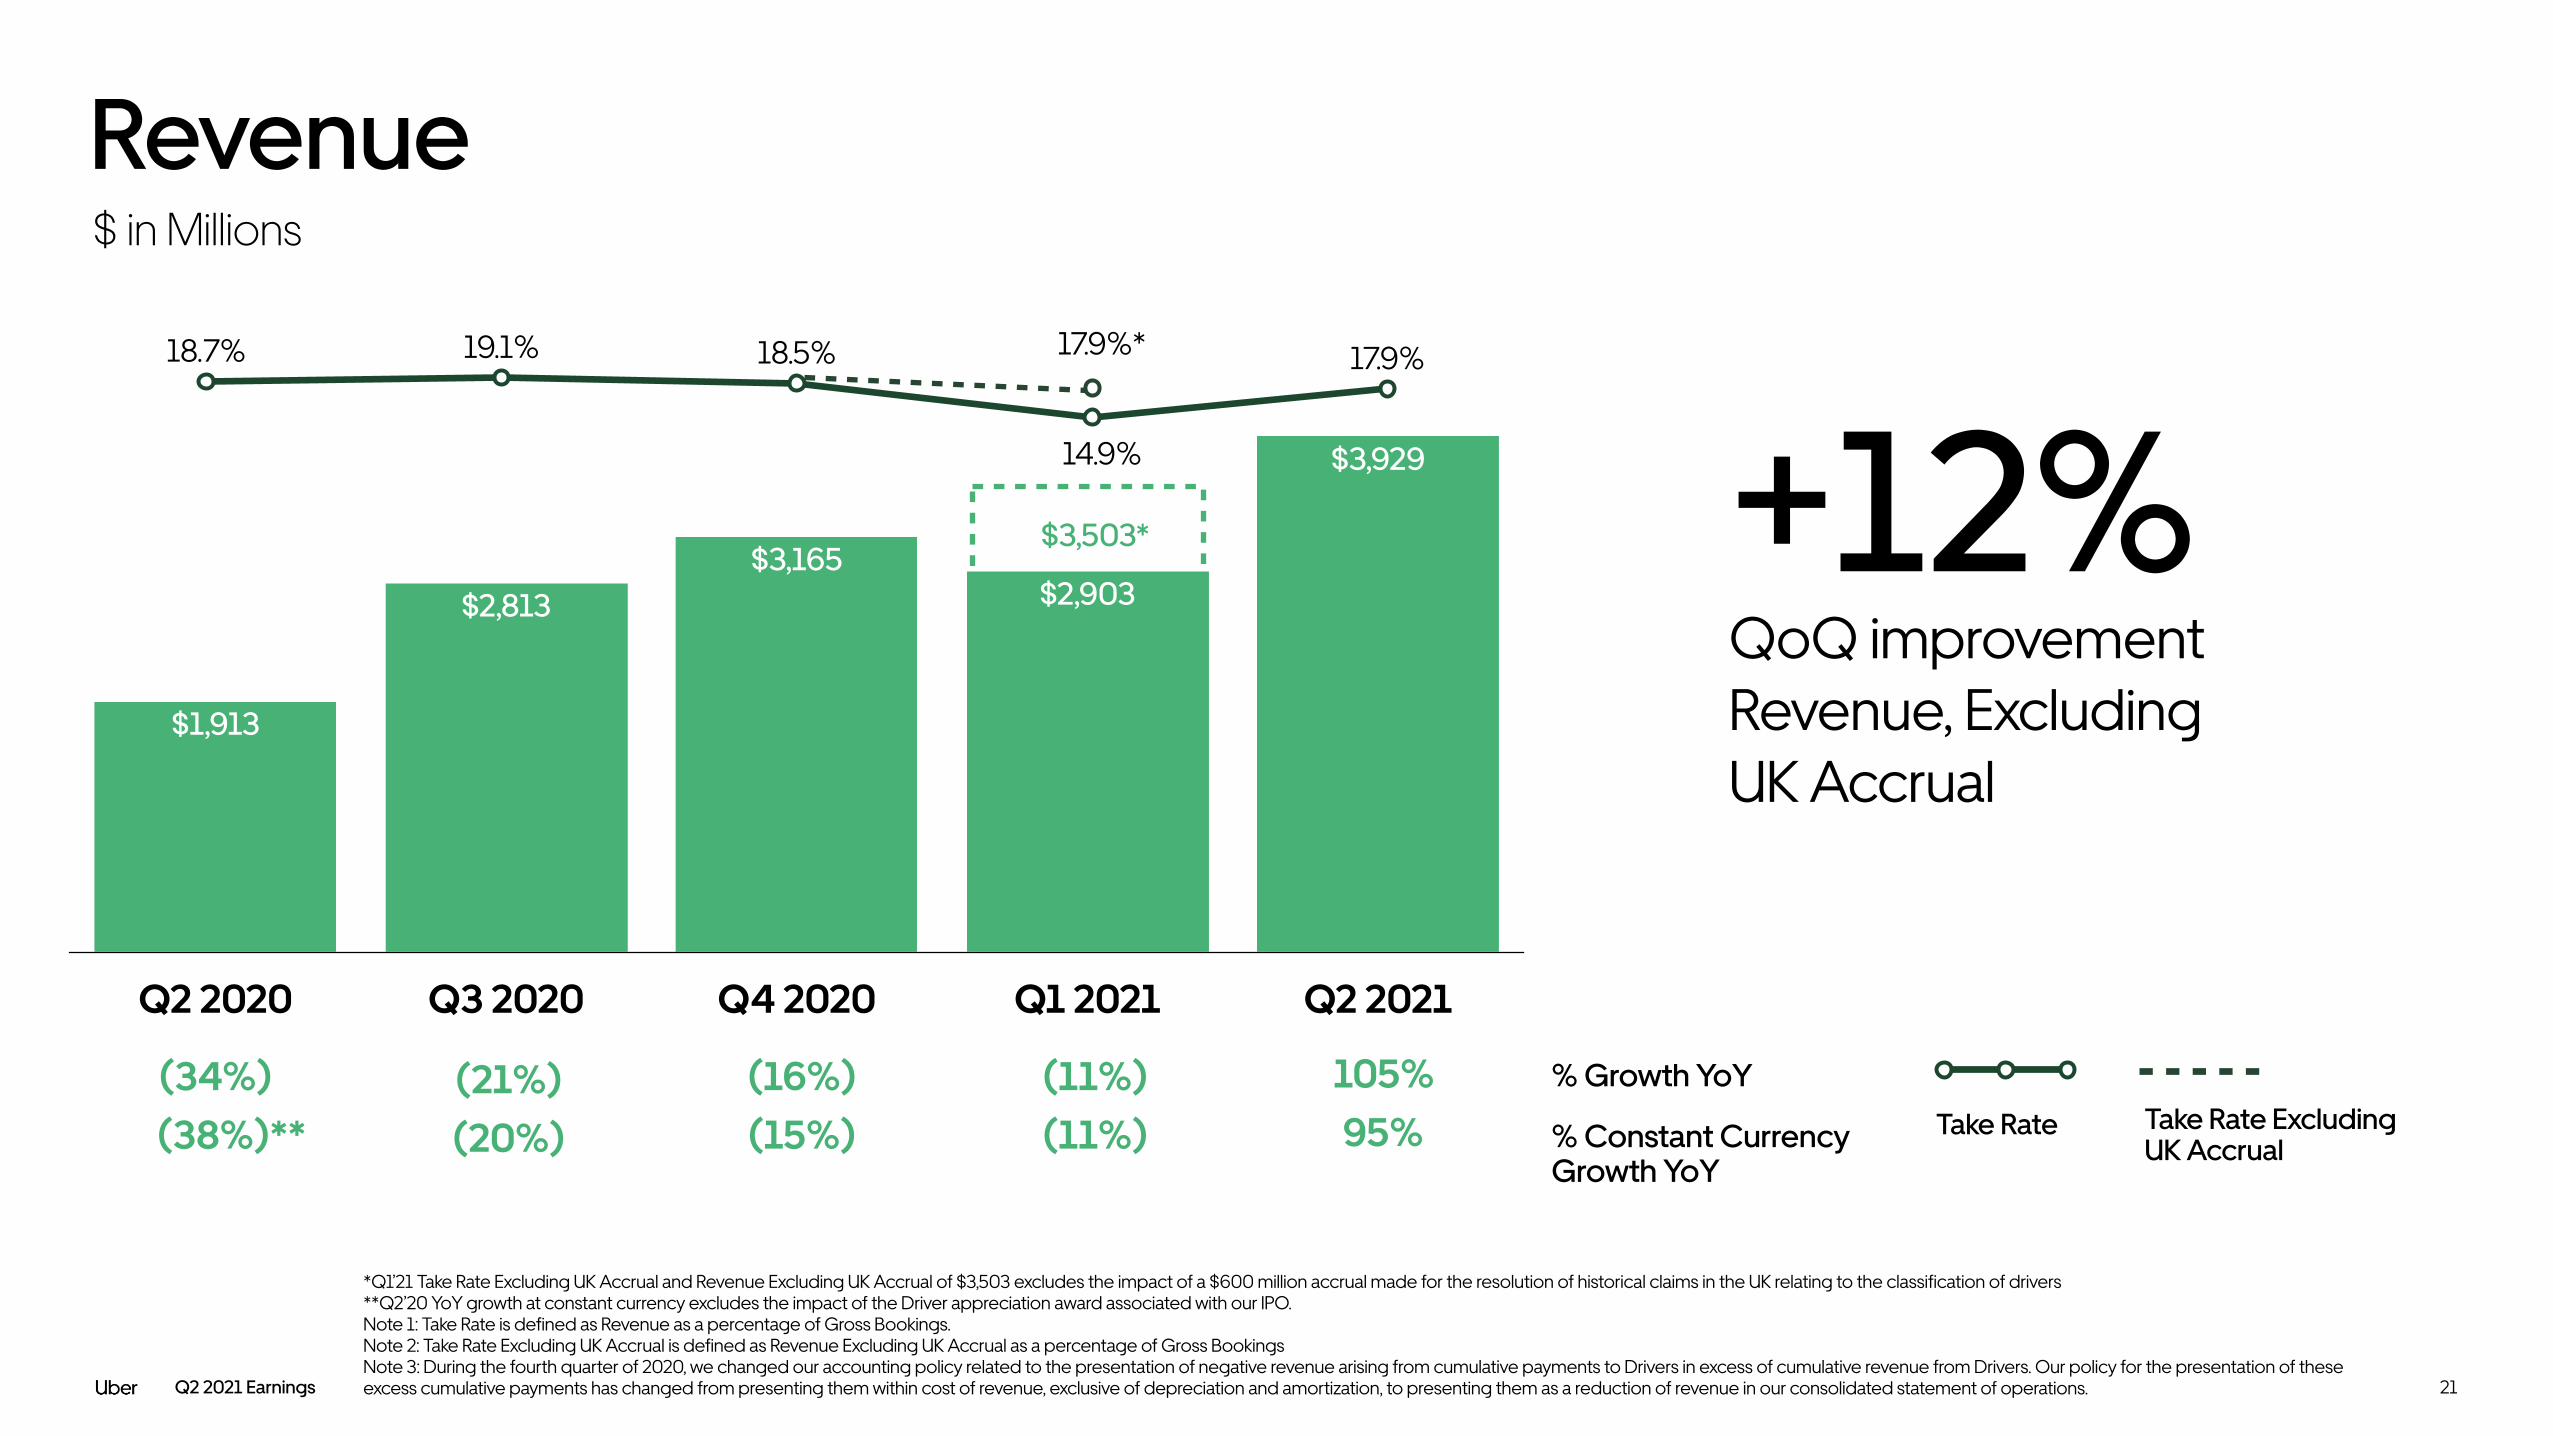
Q2 2020 Q3 2020 Q4 2020 Q1 2021 Q2 2021
$3,929
$2,903$3,165
$2,813
$1,913
17.9%14.9%
18.5%19.1%18.7%
21
Revenue$ in Millions
*Q1’21 Take Rate Excluding UK Accrual and Revenue Excluding UK Accrual of $3,503 excludes the impact of a $600 million accrual made for the resolution of historical claims in the UK relating to the classification of drivers **Q2’20 YoY growth at constant currency excludes the impact of the Driver appreciation award associated with our IPO. Note 1: Take Rate is defined as Revenue as a percentage of Gross Bookings. Note 2: Take Rate Excluding UK Accrual is defined as Revenue Excluding UK Accrual as a percentage of Gross Bookings Note 3: During the fourth quarter of 2020, we changed our accounting policy related to the presentation of negative revenue arising from cumulative payments to Drivers in excess of cumulative revenue from Drivers. Our policy for the presentation of these excess cumulative payments has changed from presenting them within cost of revenue, exclusive of depreciation and amortization, to presenting them as a reduction of revenue in our consolidated statement of operations.
Take Rate
% Growth YoY
% Constant Currency Growth YoY
17.9%*
Take Rate Excluding UK Accrual
14.9%
$3,503* +12%QoQ improvement Revenue, Excluding UK Accrual
(34%)(38%)**
(21%)(20%)
(16%)(15%)
(11%)(11%)
105%95%
Q2 2021 Earnings
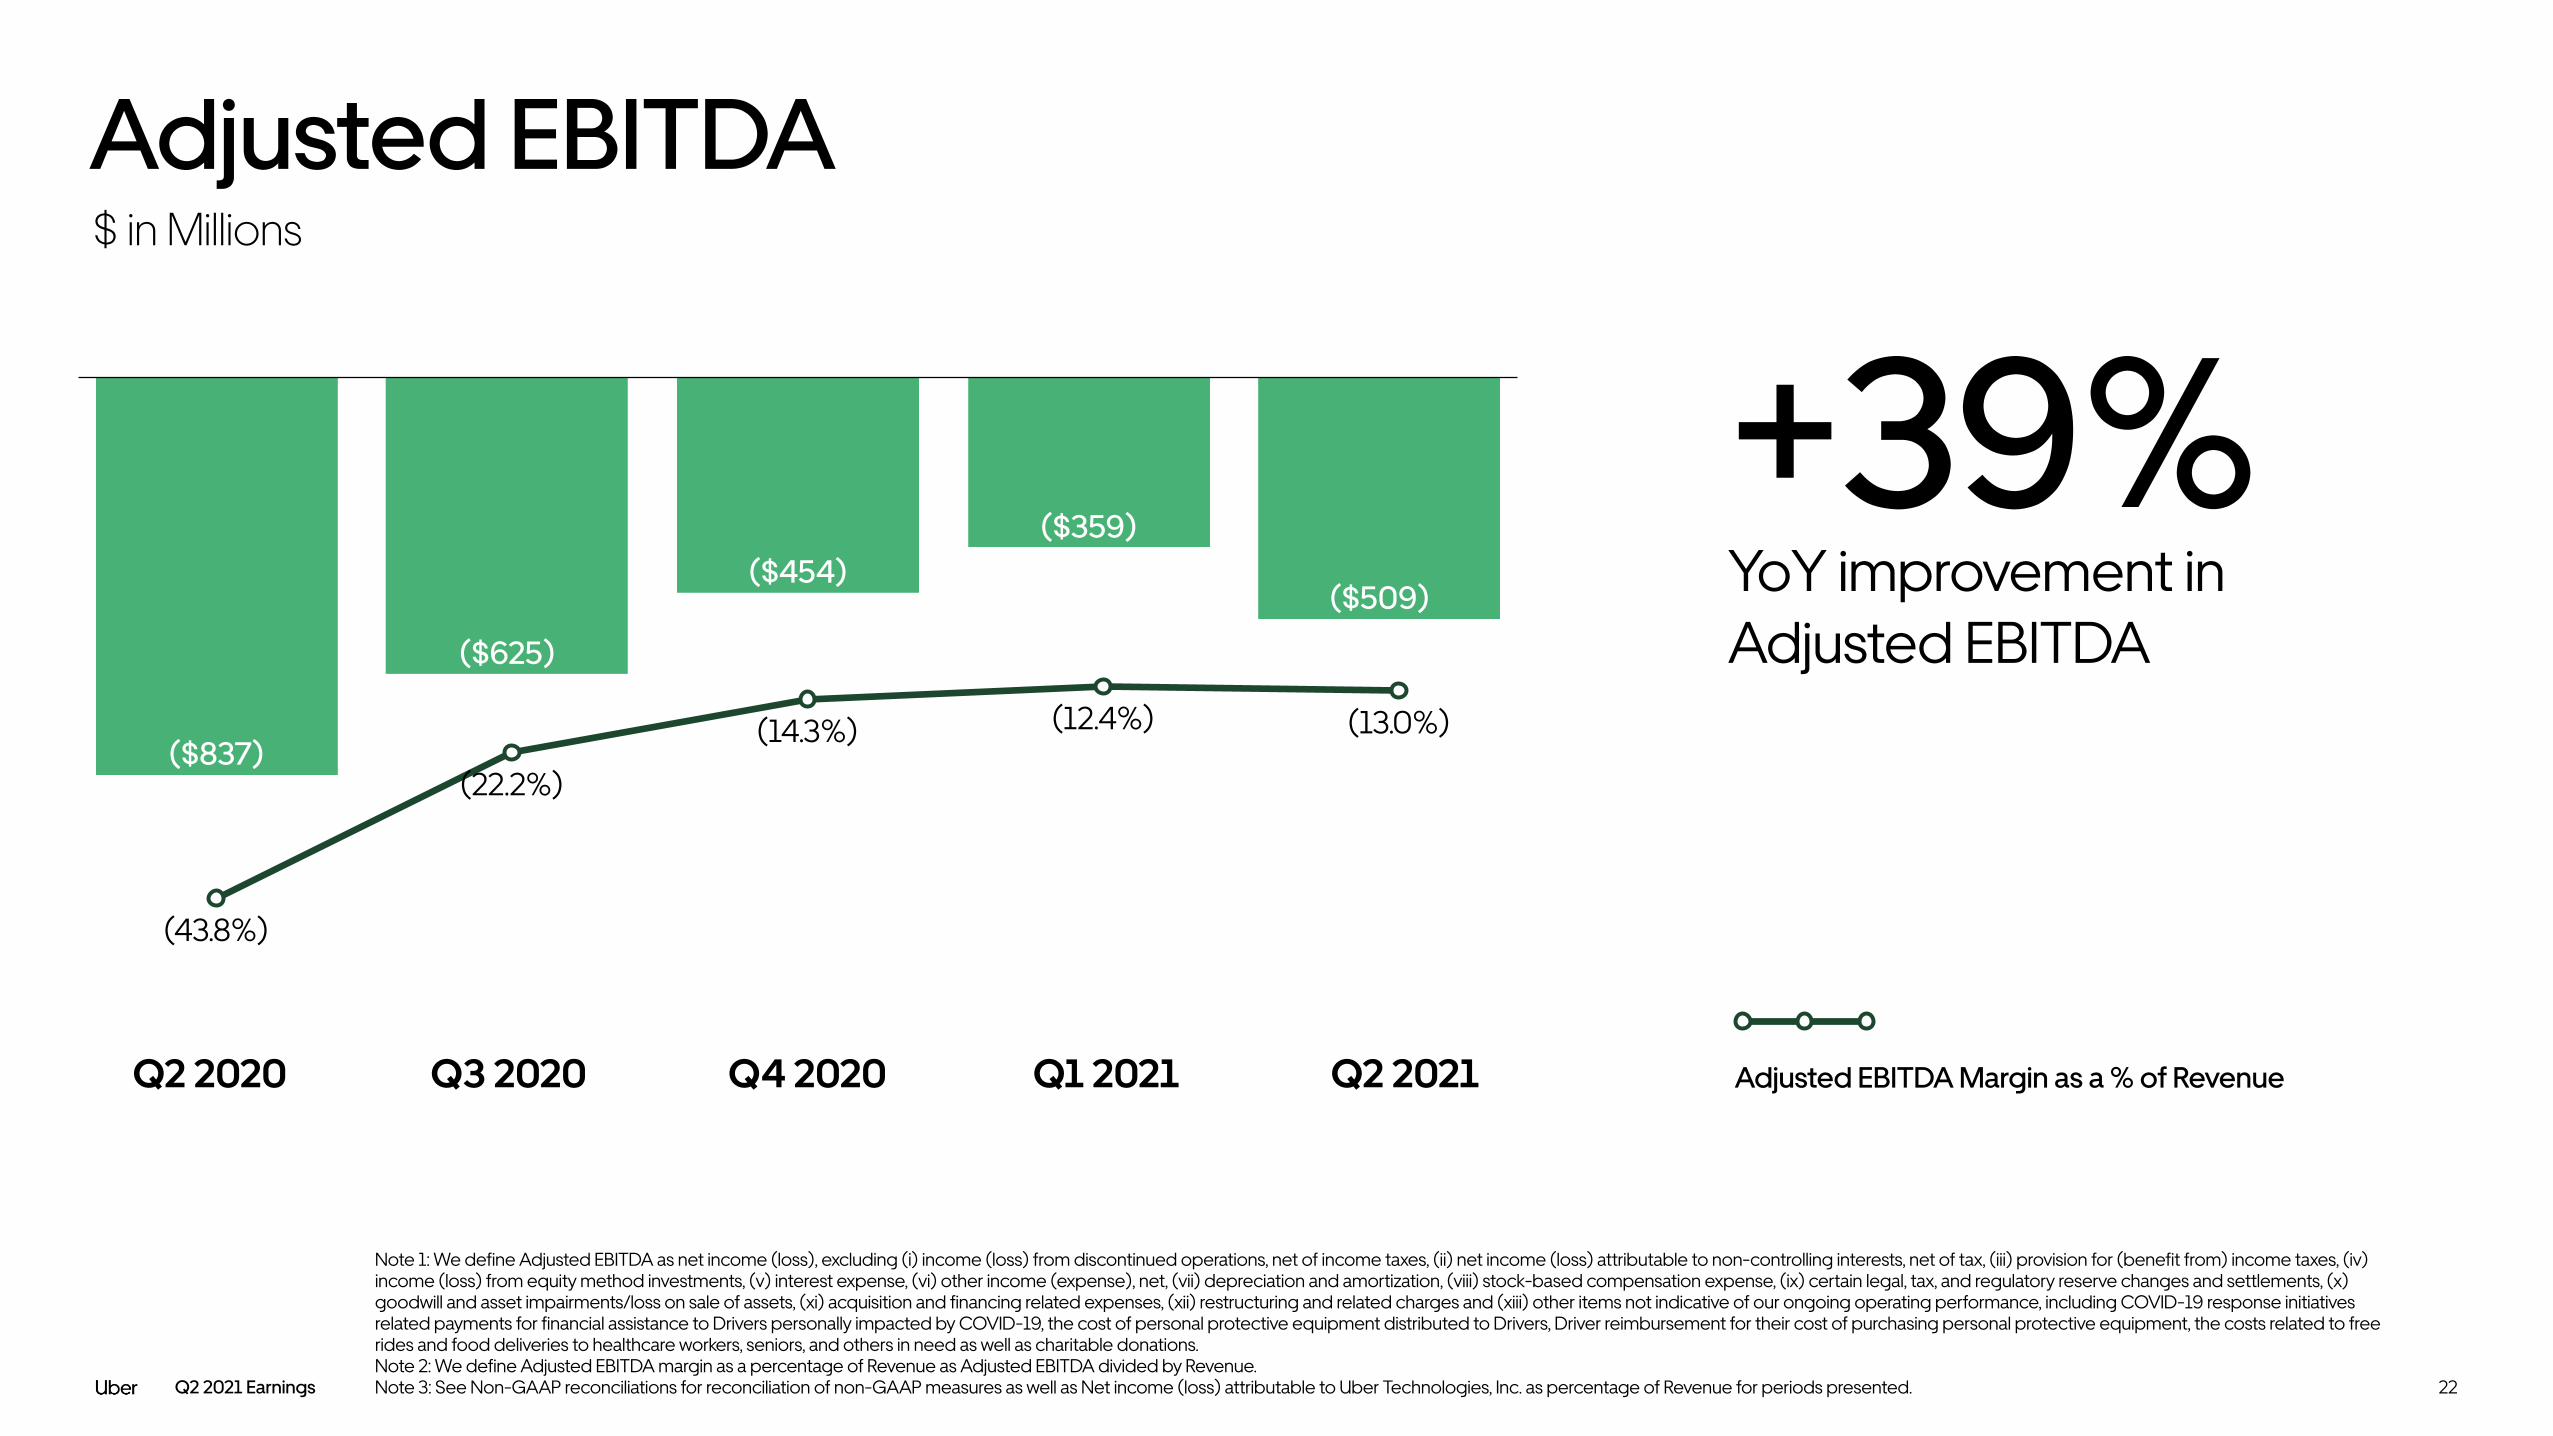
Q2 2020 Q3 2020 Q4 2020 Q1 2021 Q2 2021
22
Adjusted EBITDA$ in Millions
($509)
($359)($454)
($625)
($837)(13%)(12.4%)(14.3%)
(22.2%)
(43.8%)
Note 1: We define Adjusted EBITDA as net income (loss), excluding (i) income (loss) from discontinued operations, net of income taxes, (ii) net income (loss) attributable to non-controlling interests, net of tax, (iii) provision for (benefit from) income taxes, (iv) income (loss) from equity method investments, (v) interest expense, (vi) other income (expense), net, (vii) depreciation and amortization, (viii) stock-based compensation expense, (ix) certain legal, tax, and regulatory reserve changes and settlements, (x) goodwill and asset impairments/loss on sale of assets, (xi) acquisition and financing related expenses, (xii) restructuring and related charges and (xiii) other items not indicative of our ongoing operating performance, including COVID-19 response initiatives related payments for financial assistance to Drivers personally impacted by COVID-19, the cost of personal protective equipment distributed to Drivers, Driver reimbursement for their cost of purchasing personal protective equipment, the costs related to free rides and food deliveries to healthcare workers, seniors, and others in need as well as charitable donations. Note 2: We define Adjusted EBITDA margin as a percentage of Revenue as Adjusted EBITDA divided by Revenue. Note 3: See Non-GAAP reconciliations for reconciliation of non-GAAP measures as well as Net income (loss) attributable to Uber Technologies, Inc. as percentage of Revenue for periods presented.
Adjusted EBITDA Margin as a % of Revenue
+39%YoY improvement in Adjusted EBITDA
(13.0%)

Q2 2021 Earnings
Platform Highlights
Condensed Consolidated Financial Statements
Business Highlights
Non-GAAP Reconciliations
Segment Details

Q2 2021 Earnings
11.1%
34.9%
19.9%18.0%
6.3%
$1,617
$853
$1,471$1,364
$788
18.7%12.6%21.7%23.1%25.9%
(50%) (47%)
(69%)* (51%) (51%)
24
Mobility Highlights
% Constant Currency Growth YoY
Gross Bookings
Adjusted EBITDA
Revenue% Constant Currency Growth YoY
$ in Millions
*Q2’20 constant currency growth rate excludes the impact of the Driver appreciation award associated with the IPO. **Q1’21 Take Rate Excluding UK Accrual and Revenue Excluding UK Accrual of $1,453 excludes the impact of a $600 million accrual made for the resolution of historical claims in the UK relating to the classification of drivers Note 1: Take Rate is defined as Revenue as a percentage of Gross Bookings. Note 2: Take Rate Excluding UK Accrual is defined as Revenue Excluding UK Accrual as a percentage of Gross Bookings Note 3: See Non-GAAP reconciliations for reconciliation of non-GAAP measures as well as Mobility Adjusted EBITDA as a percentage of Mobility Revenue. Note 4: All measures are for Mobility segment unless otherwise noted.
Q2 2020 Q3 2020 Q4 2020 Q1 2021 Q2 2021
$179
$298$293$245
$50
$8,640$6,773$6,789$5,905
$3,046
Revenue: Take Rate
Adjusted EBITDA: Segment Adjusted EBITDA Margin as a % of Revenue
(36%)
(63%)
21.5%**
12.6%
Revenue: Take Rate Excluding UK Accrual
20.5%
$1,453**
Adjusted EBITDA: Segment Adjusted EBITDA Margin as a % of Revenue Excluding UK Accrual
+28%QoQ improvement in Gross Bookings
(73%) 174%
98%

Q2 2021 Earnings
Q2 2020 Q3 2020 Q4 2020 Q1 2021 Q2 2021
($161)($200)($145)($183)($232)
$1,964$1,741$1,356$1,136$885
15.2%14.0%13.5%13.3%12.7%
160%** 187% 220%
(8.2%)(11.5%)(10.7%)(16.1%)
(26.2%)
25
Delivery Highlights
% Constant Currency Growth YoY
Gross Bookings
Revenue: Take Rate
Adjusted EBITDA: Segment Adjusted EBITDA Margin as a % of Revenue
Revenue% Constant Currency Growth YoY
$ in Millions
**Q2’20 constant currency growth rate excludes the impact of the Driver appreciation award associated with the IPO. Note 1: Take Rate is defined as Revenue as a percentage of Gross Bookings. Note 2: See Non-GAAP reconciliations for reconciliation of non-GAAP measures as well as Delivery Adjusted EBITDA as a percentage of Delivery Revenue. Note 3: All measures are for Delivery segment unless otherwise noted.
+106%Revenue Growth YoY at Constant Currency
Adjusted EBITDA
113% 135% 128%
$12,912$12,461$10,050
$8,550$6,961
157% 75%
215% 106%+3.3 ptsImprovement in Adj. EBITDA Margin as a % of Revenue

Q2 2021 Earnings
Platform Highlights
Condensed Consolidated Financial Statements
Business Highlights
Non-GAAP Reconciliations
Segment Details

Q2 2021 Earnings 27
$ in Millions, except share amounts, which are in thousands, and per share amounts
Condensed Consolidated Statements of Operations (Unaudited)
Six Months Ended June 30,Three Months Ended June 30,
2020 2021 2020 2021
Revenue $1,913 $3,929 $5,161 $6,832
Costs and expenses
Cost of revenue, exclusive of depreciation and amortization shown separately below 924 2,099 2,415 3,809
Operations and support 582 432 1,085 855
Sales and marketing 736 1,256 1,621 2,359
Research and development 584 488 1,229 1,003
General and administrative 565 616 1,424 1,080
Depreciation and amortization 129 226 257 438
Total costs and expenses $3,520 $5,117 $8,031 $9,544
Loss from operations ($1,607) ($1,188) ($2,870) ($2,712)
Interest expense (110) (115) (228) (230)
Other income (expense), net (44) 1,943 (1,839) 3,653
Income (loss) before income taxes and loss from equity method investments (1,761) 640 (4,937) 711
Provision for (benefit from) income taxes 4 (479) (238) (294)
Loss from equity method investments (7) (7) (19) (15)
Net income (loss) including non-controlling interests (1,772) 1,112 (4,718) 990
Less: net income (loss) attributable to non-controlling interests, net of tax 3 (32) (7) (46)
Net income (loss) attributable to Uber Technologies, Inc. ($1,775) $1,144 ($4,711) $1,036
Net income (loss) per share attributable to Uber Technologies, Inc. common stockholders:
Basic ($1.02) $0.61 ($2.72) $0.56
Diluted ($1.02) $0.58 ($2.72) $0.52
Weighted-average shares used to compute net income (loss) per share attributable to common stockholders:
Basic 1,738,897 1,875,156 1,731,632 1,866,830
Diluted 1,738,897 1,955,975 1,731,632 1,949,750
Q2 2021 Earnings 28
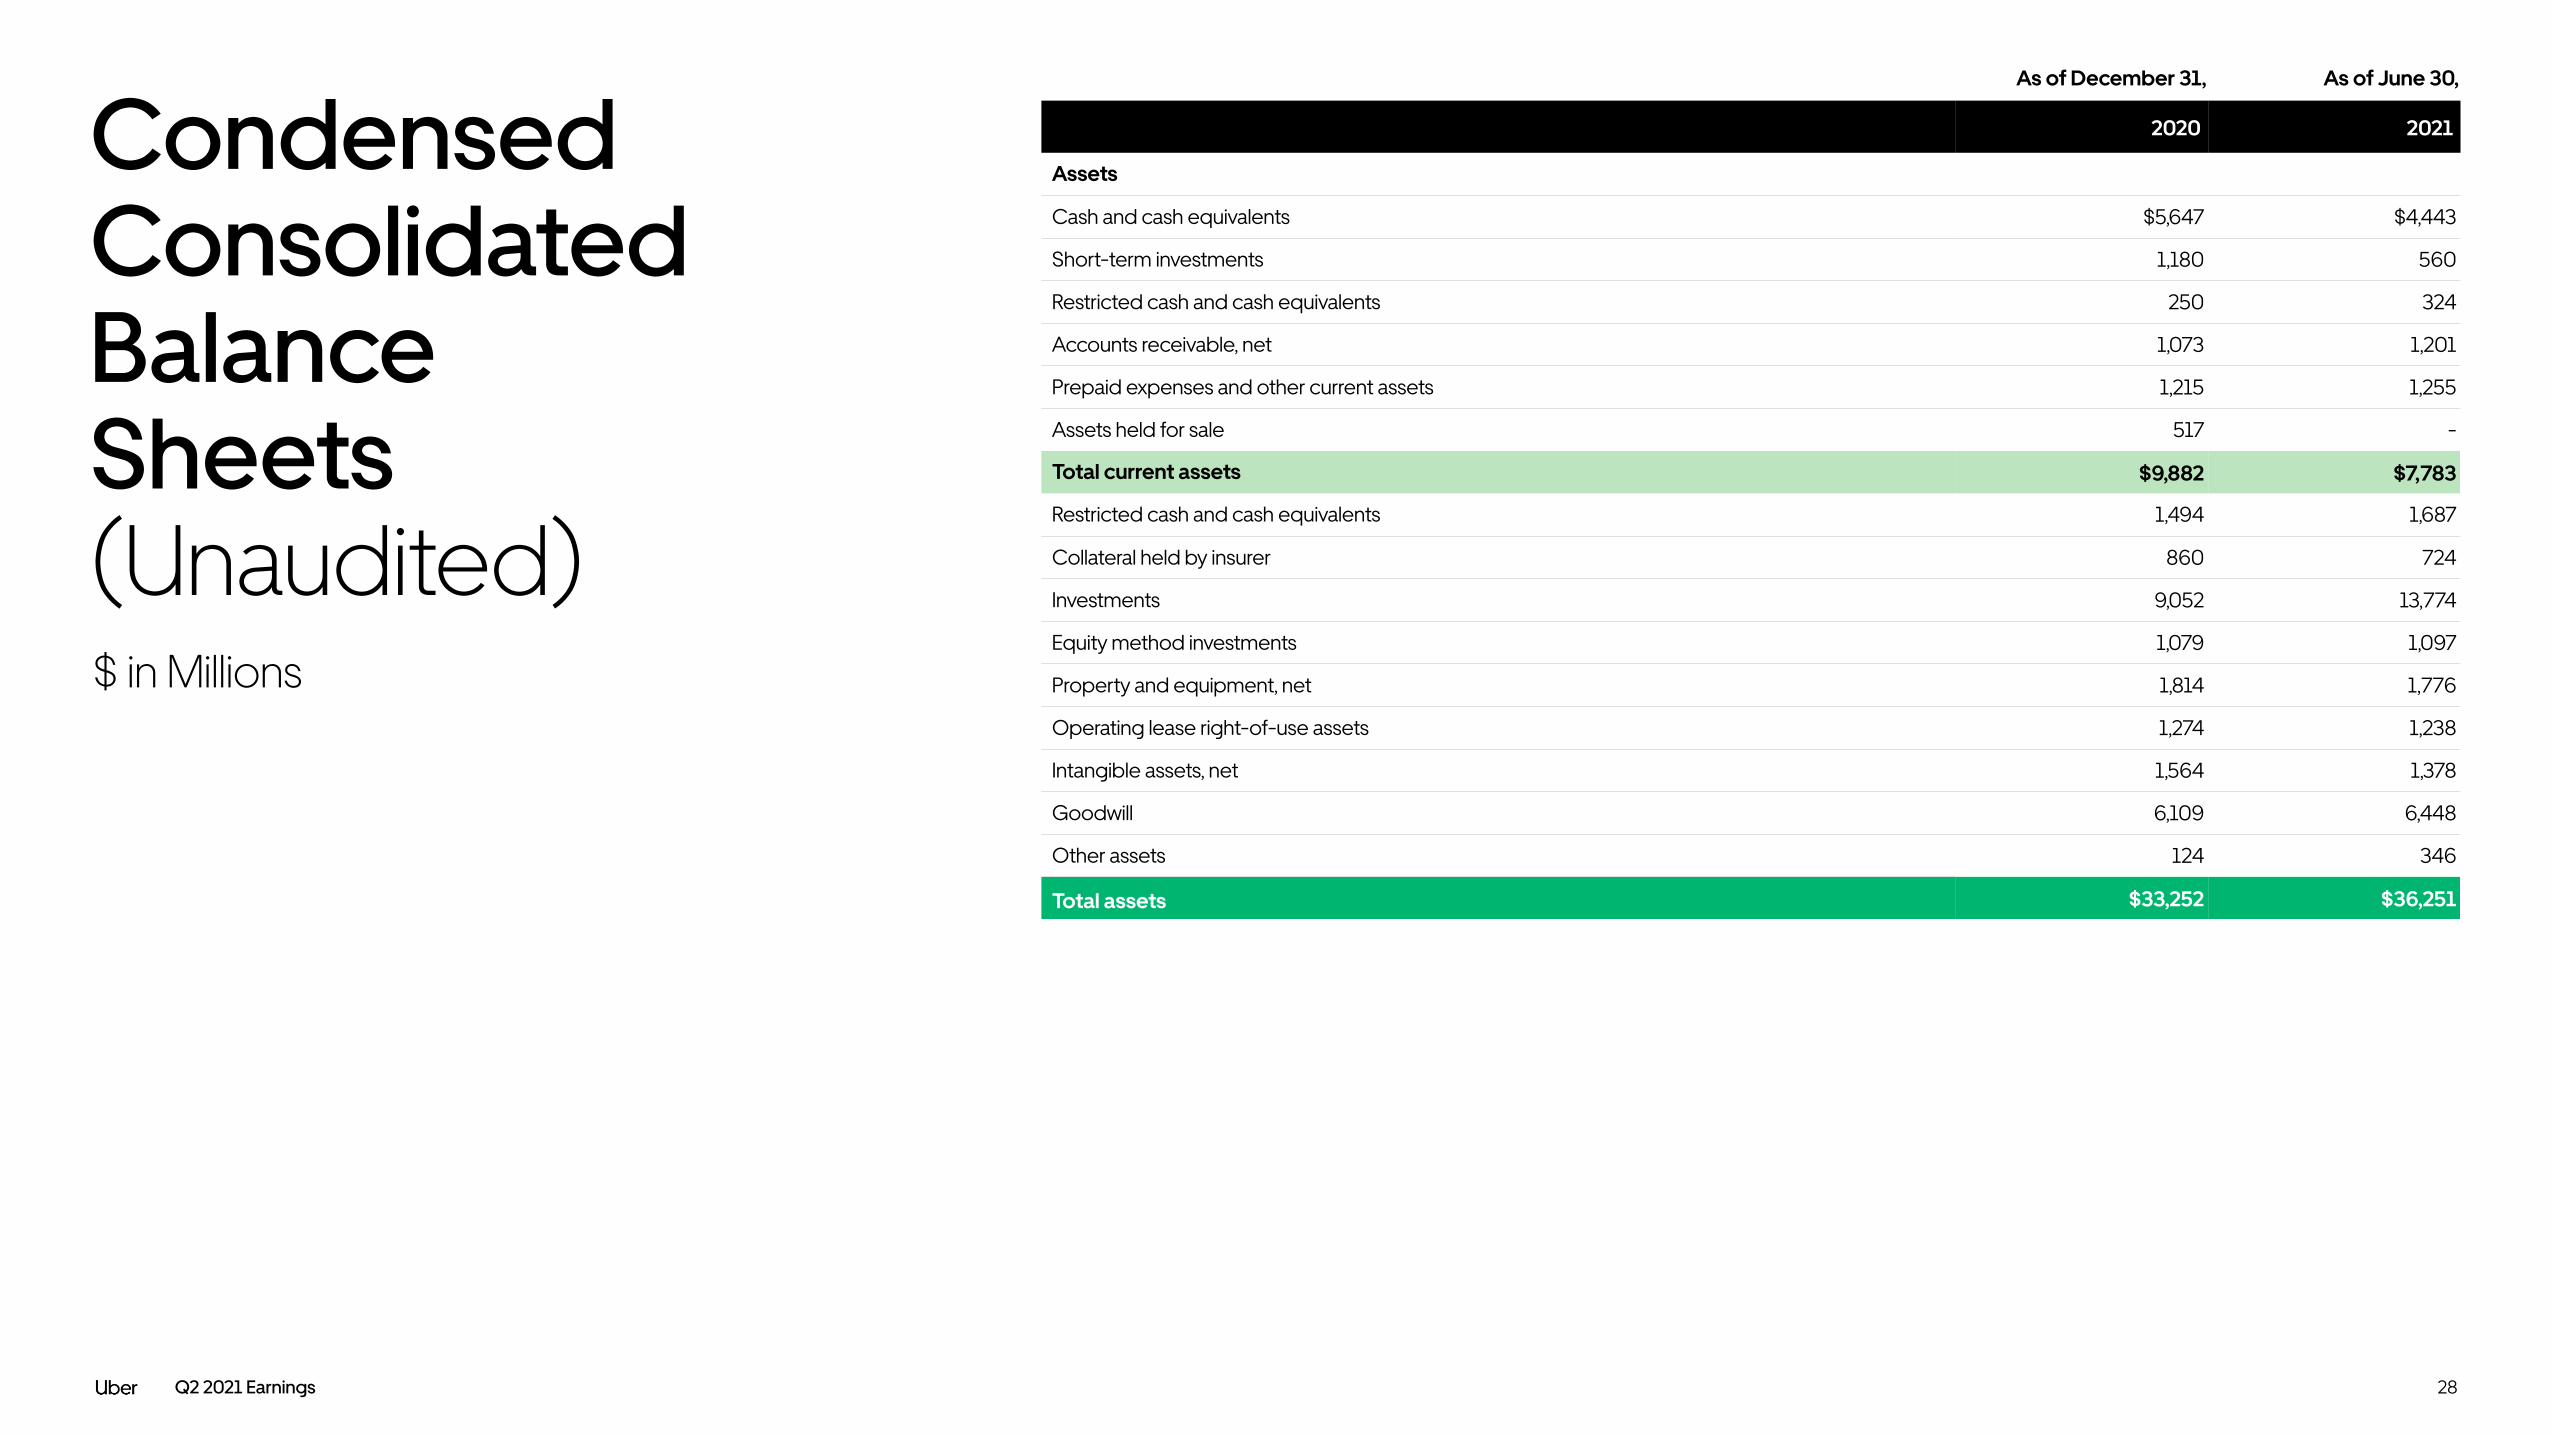
Condensed Consolidated Balance Sheets (Unaudited)
2020 2021
Assets
Cash and cash equivalents $5,647 $4,443
Short-term investments 1,180 560
Restricted cash and cash equivalents 250 324
Accounts receivable, net 1,073 1,201
Prepaid expenses and other current assets 1,215 1,255
Assets held for sale 517 -
Total current assets $9,882 $7,783
Restricted cash and cash equivalents 1,494 1,687
Collateral held by insurer 860 724
Investments 9,052 13,774
Equity method investments 1,079 1,097
Property and equipment, net 1,814 1,776
Operating lease right-of-use assets 1,274 1,238
Intangible assets, net 1,564 1,378
Goodwill 6,109 6,448
Other assets 124 346
Total assets $33,252 $36,251
$ in Millions
As of December 31, As of June 30,

Q2 2021 Earnings
Continued:
29
2020 2021
Liabilities, redeemable non-controlling interests and equity
Accounts payable $235 $429
Short-term insurance reserves 1,243 1,221
Operating lease liabilities, current 175 177
Accrued and other current liabilities 5,112 5,857
Liabilities held for sale 100 -
Total current liabilities $6,865 $7,684
Long-term insurance reserves 2,223 2,268
Long-term debt, net of current portion 7,560 7,798
Operating lease liabilities, non-current 1,544 1,513
Other long-term liabilities 1,306 1,244
Total liabilities $19,498 $20,507
Redeemable non-controlling interests 787 1,569
Equity
Common stock - -
Additional paid-in capital 35,931 35,588
Accumulated other comprehensive income (loss) (535) 681
Accumulated deficit (23,130) (22,094)
Total Uber Technologies, Inc. stockholders' equity $12,266 $14,175
Non-redeemable non-controlling interests 701 -
Total equity $12,967 $14,175
Total liabilities, redeemable non-controlling interests and equity $33,252 $36,251
Condensed Consolidated Balance Sheets (Unaudited)$ in Millions
As of December 31, As of June 30,

Q2 2021 Earnings 30
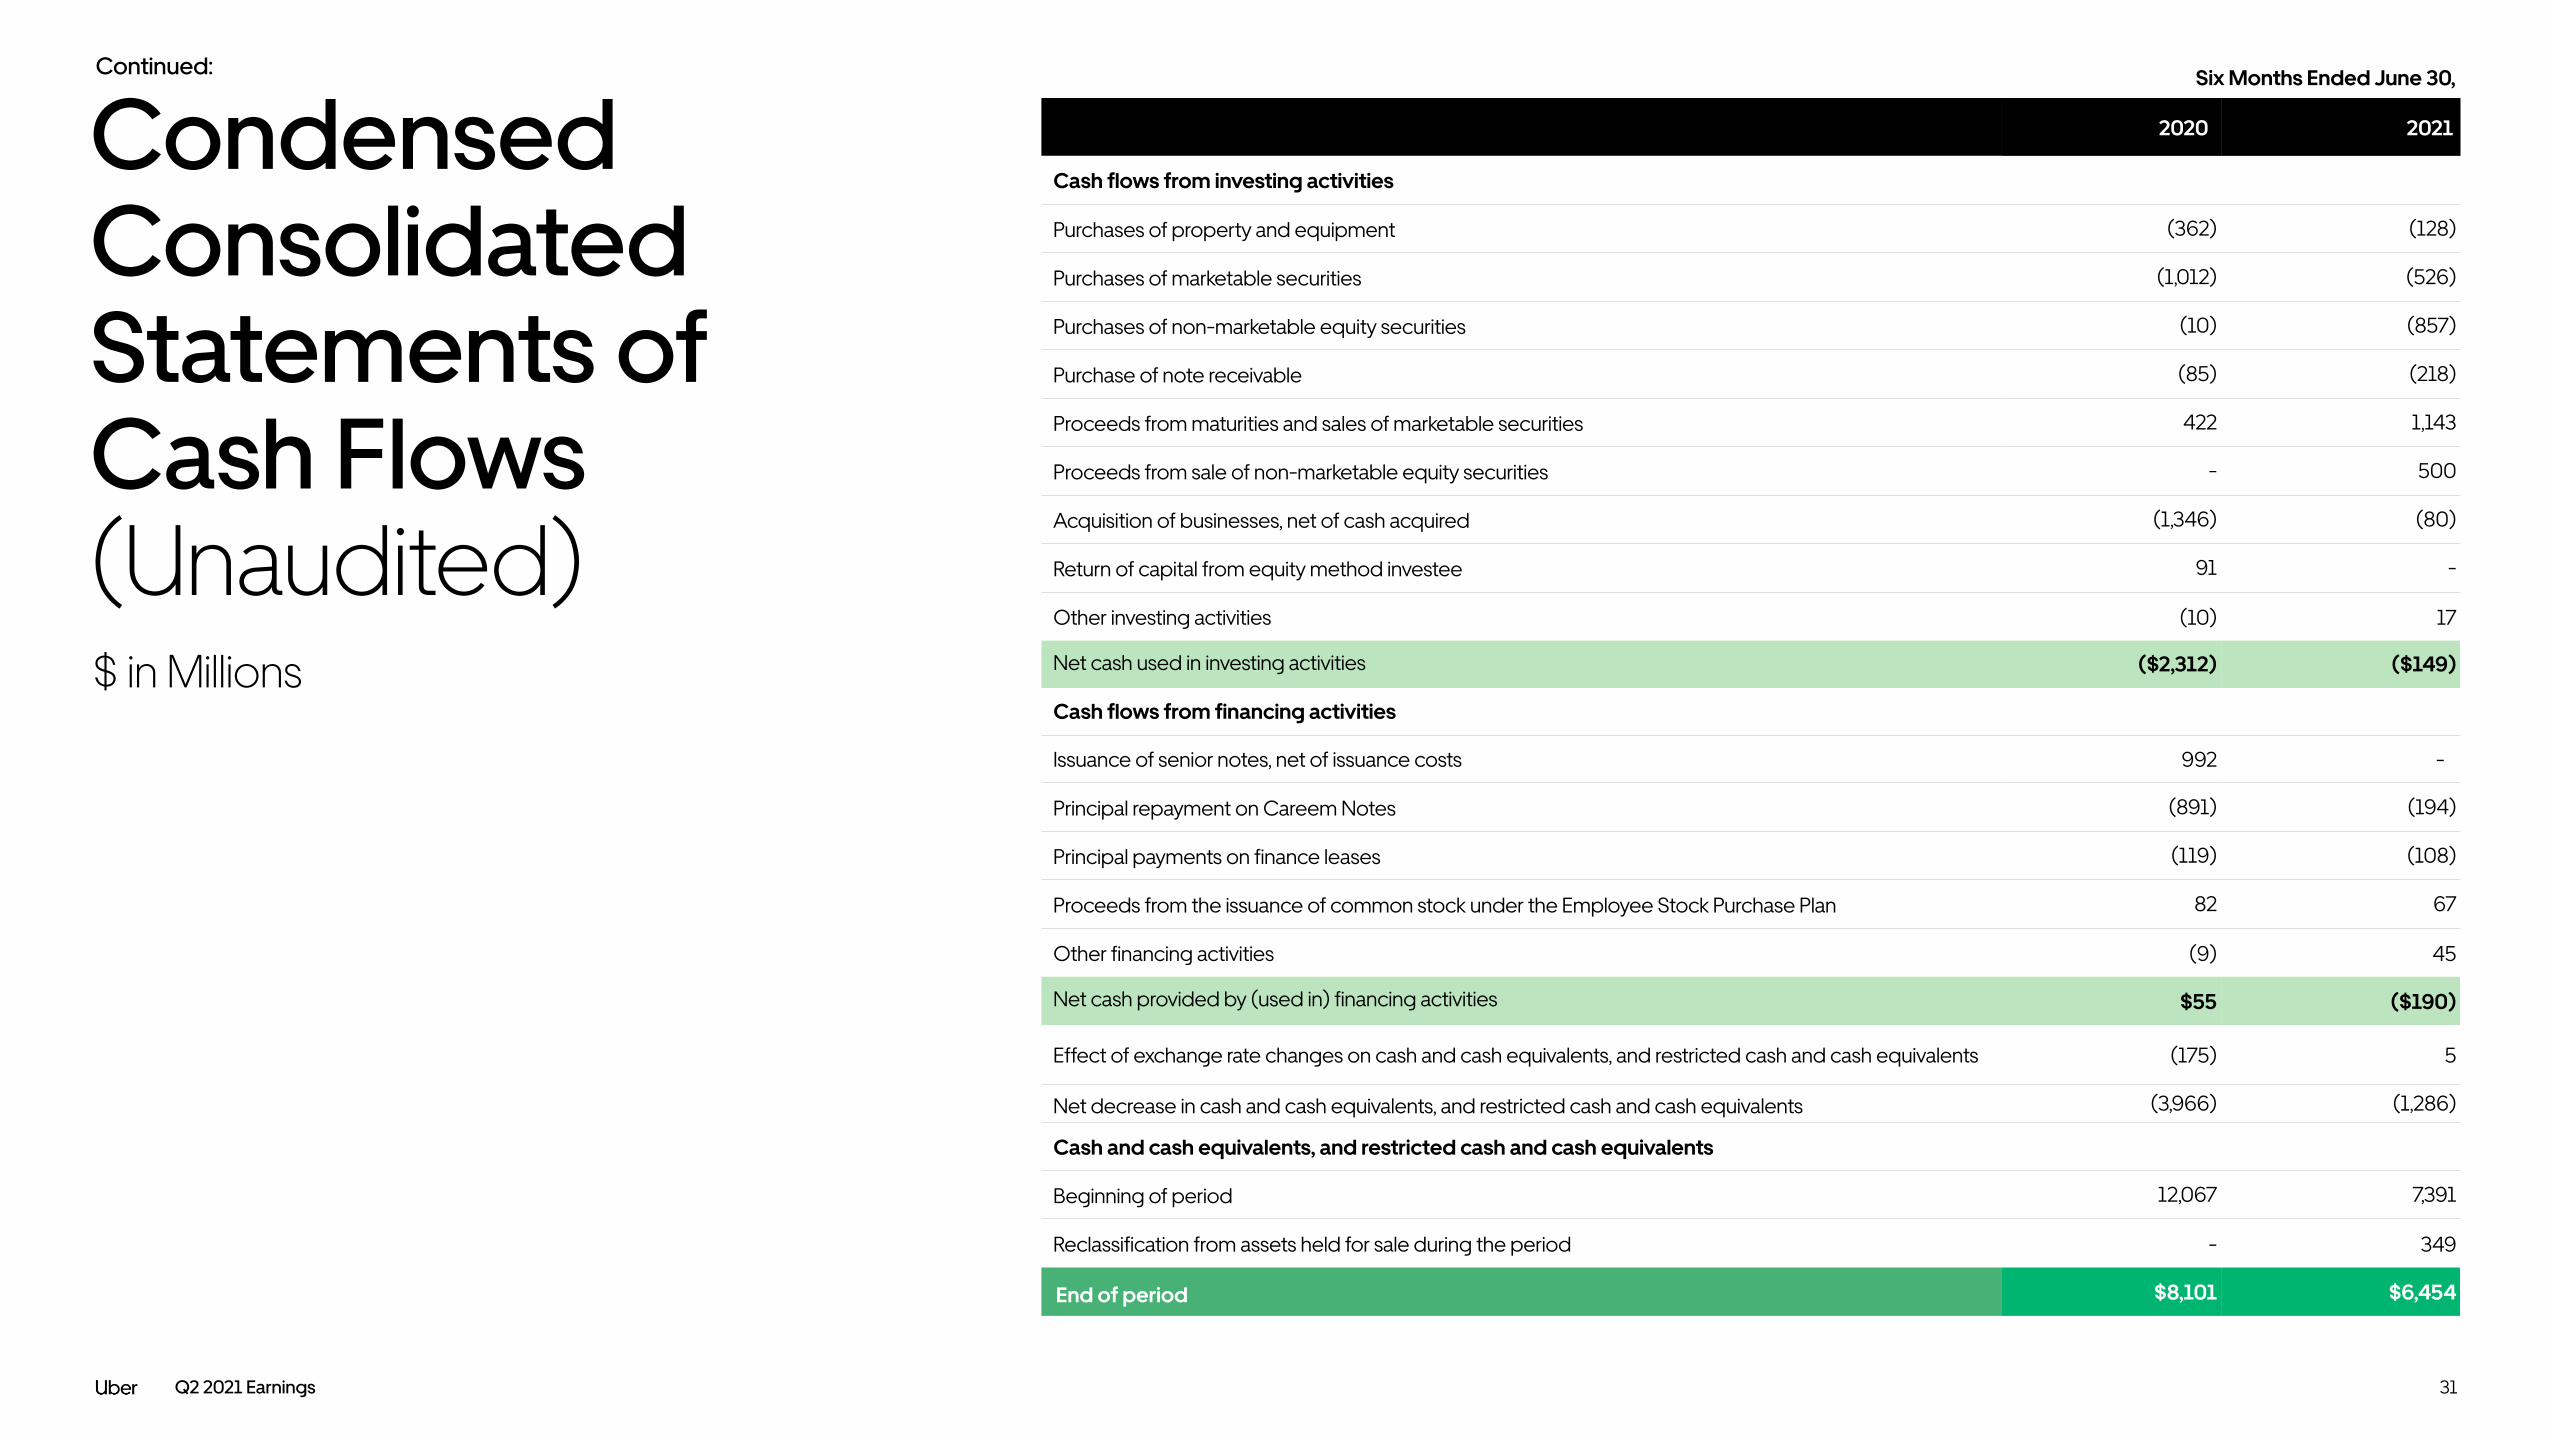
Condensed Consolidated Statements of Cash Flows (Unaudited)
As of Dec 31 2020 2021
Cash flows from operating activities
Net income (loss) including non-controlling interests ($4,718) $990
Adjustments to reconcile net income (loss) to net cash used in operating activities:
Depreciation and amortization 257 438
Bad debt expense 32 49
Stock-based compensation 408 553
Gain on business divestitures (127) (1,684)
Deferred income taxes (282) (367)
Loss from equity method investments, net 19 15
Unrealized (gain) loss on debt and equity securities, net 116 (1,975)
Impairment of debt and equity securities 1,850 -
Impairments of goodwill, long-lived assets and other assets 297 16
Unrealized foreign currency transactions 13 (2)
Other 25 62
Change in assets and liabilities, net of impact of business acquisitions and disposals:
Accounts receivable 517 (149)
Prepaid expenses and other assets 141 (9)
Collateral held by insurer 178 136
Operating lease right-of-use assets 137 77
Accounts payable (10) 185
Accrued insurance reserves (8) 21
Accrued expenses and other liabilities (337) 762
Operating lease liabilities (42) (70)
Net cash used in operating activities ($1,534) ($952)
Six Months Ended June 30,
$ in Millions
Q2 2021 Earnings 31
As of Dec 31 2020 2021
Cash flows from investing activities
Purchases of property and equipment (362) (128)
Purchases of marketable securities (1,012) (526)
Purchases of non-marketable equity securities (10) (857)
Purchase of note receivable (85) (218)
Proceeds from maturities and sales of marketable securities 422 1,143
Proceeds from sale of non-marketable equity securities - 500
Acquisition of businesses, net of cash acquired (1,346) (80)
Return of capital from equity method investee 91 -
Other investing activities (10) 17
Net cash used in investing activities ($2,312) ($149)
Cash flows from financing activities
Issuance of senior notes, net of issuance costs 992 -
Principal repayment on Careem Notes (891) (194)
Principal payments on finance leases (119) (108)
Proceeds from the issuance of common stock under the Employee Stock Purchase Plan 82 67
Other financing activities (9) 45
Net cash provided by (used in) financing activities $55 ($190)
Effect of exchange rate changes on cash and cash equivalents, and restricted cash and cash equivalents (175) 5
Net decrease in cash and cash equivalents, and restricted cash and cash equivalents (3,966) (1,286)
Cash and cash equivalents, and restricted cash and cash equivalents
Beginning of period 12,067 7,391
Reclassification from assets held for sale during the period - 349
End of period $8,101 $6,454
Condensed Consolidated Statements of Cash Flows (Unaudited)$ in Millions
Continued: Six Months Ended June 30,

Q2 2021 Earnings
Platform Highlights
Condensed Consolidated Financial Statements
Business Highlights
Non-GAAP Reconciliations
Segment Details

Q2 2021 Earnings 33
Jun 30, ’20 Sept 30, ‘20 Dec 31, ‘20 Mar 31, ‘21 Jun 30, ‘21
Mobility $50 $245 $293 $298 $179
Delivery (232) (183) (145) (200) (161)
Freight (49) (73) (41) (29) (41)
All Other (114) (104) (72) (11) -
Corporate G&A and Platform R&D (492) (510) (489) (417) (486)
Adjusted EBITDA ($837) ($625) ($454) ($359) ($509)
Add (deduct):
Legal, tax, and regulatory reserve changes and settlements (38) - 92 (551) (140)
Goodwill and asset impairments/loss on sale of assets (16) (76) (32) (57) -
Restructuring and related charges (credits), net (382) 6 14 - -
Gain (loss) on lease arrangement (7) 12 - - -
Acquisition, financing and divestitures related expenses (19) (14) (43) (36) (26)
Accelerated lease costs related to cease-use of ROU assets - (80) (22) (2) -
COVID-19 response initiatives (48) (18) (16) (26) (15)
Depreciation and amortization (129) (138) (180) (212) (226)
Stock-based compensation expense (131) (183) (236) (281) (272)
Other income (expense), net (44) 151 63 1,710 1,943
Interest expense (110) (112) (118) (115) (115)
Loss from equity method investments (7) (8) (7) (8) (7)
Provision for (benefit from) income taxes (4) (23) (23) (185) 479
Net income (loss) attributable to non-controlling interest, net of tax (3) 19 (6) 14 32
Net income (loss) attributable to Uber Technologies, Inc. ($1,775) ($1,089) ($968) ($108) $1,144
Adjusted EBITDA Reconciliation (Unaudited)$ in Millions
Three Months Ended
Note: In the second quarter of 2020, Other Bets, which previously consisted of the Company’s JUMP business whose divestiture was announced in May, is no longer a reportable segment. Historical results of the former Other Bets segment are included within All Other.

Q2 2021 Earnings 34
GAAP to Non-GAAP Reconciliations (Unaudited)
Jun 30, ‘20 Sept 30, ‘20 Dec 31, ‘20 Mar 31, ‘21 Jun 30, ‘21
GAAP Cost of Revenue 924 1,298 1,441 1,710 2,099
Goodwill and asset impairment/loss on sale of assets (10) - - - -
COVID-19 response initiatives (22) (16) (13) (11) (6)
Acquisition, financing and divestitures related expenses (4) (1) - - -
Non-GAAP Cost of Revenue $888 $1,281 $1,428 $1,699 $2,093
Non-GAAP Operating Expenses
GAAP Operations and support $582 $365 $369 $423 $432
Restructuring and related charges (187) 6 10 - -
Goodwill and asset impairment/loss on sale of assets (6) (2) - - -
COVID-19 response initiatives (7) - - - (1)
Acquisition, financing and divestitures related expenses (10) (2) (1) (3) (3)
Stock-based compensation (11) (16) (20) (28) (38)
Non-GAAP Operations and support $361 $351 $358 $392 $390
Three Months Ended
$ in Millions

Q2 2021 Earnings 35
Jun 30 ‘20 Sept 30 ‘20 Dec 31 ‘20 Mar 31 ‘21 Jun 30 ‘21
GAAP Sales and marketing $736 $924 $1,038 $1,103 $1,256
Restructuring and related charges (22) - 1 - -
Acquisition, financing and divestitures related expenses - - (1) (3) (1)
COVID-19 response initiatives (13) - - (5) (2)
Stock-based compensation (10) (11) (13) (22) (19)
Non-GAAP Sales and marketing $691 $913 $1,025 $1,073 $1,234
GAAP Research and development $584 $493 $483 $515 $488
Restructuring and related charges (86) - 2 - -
Acquisition, financing and divestitures related expenses (5) - (7) (13) (5)
Goodwill and asset impairment/loss on sale of assets - - - (42) -
Stock-based compensation (72) (102) (136) (133) (149)
Non-GAAP Research and development $421 $391 $342 $327 $334
GAAP General and administrative $565 $711 $531 $464 $616
Legal, tax, and regulatory reserve changes and settlements (5) - 117 49 (65)
Goodwill and asset impairment/loss on sale of assets - (74) (32) (15) -
Restructuring and related charges (87) - 1 - -
Acquisition, financing, and divestitures related expenses - (11) (34) (17) (17)
Accelerated lease costs related to cease-use of ROU asssets - (80) (22) (2) -
Loss on lease terminations (7) 12 - - -
Stock-based compensation (38) (54) (67) (98) (66)
Non-GAAP General and administrative $428 $504 $494 $381 $468
GAAP to Non-GAAP Reconciliations (Unaudited)$ in Millions Three Months Ended
Continued:
Q2 2021 Earnings 36
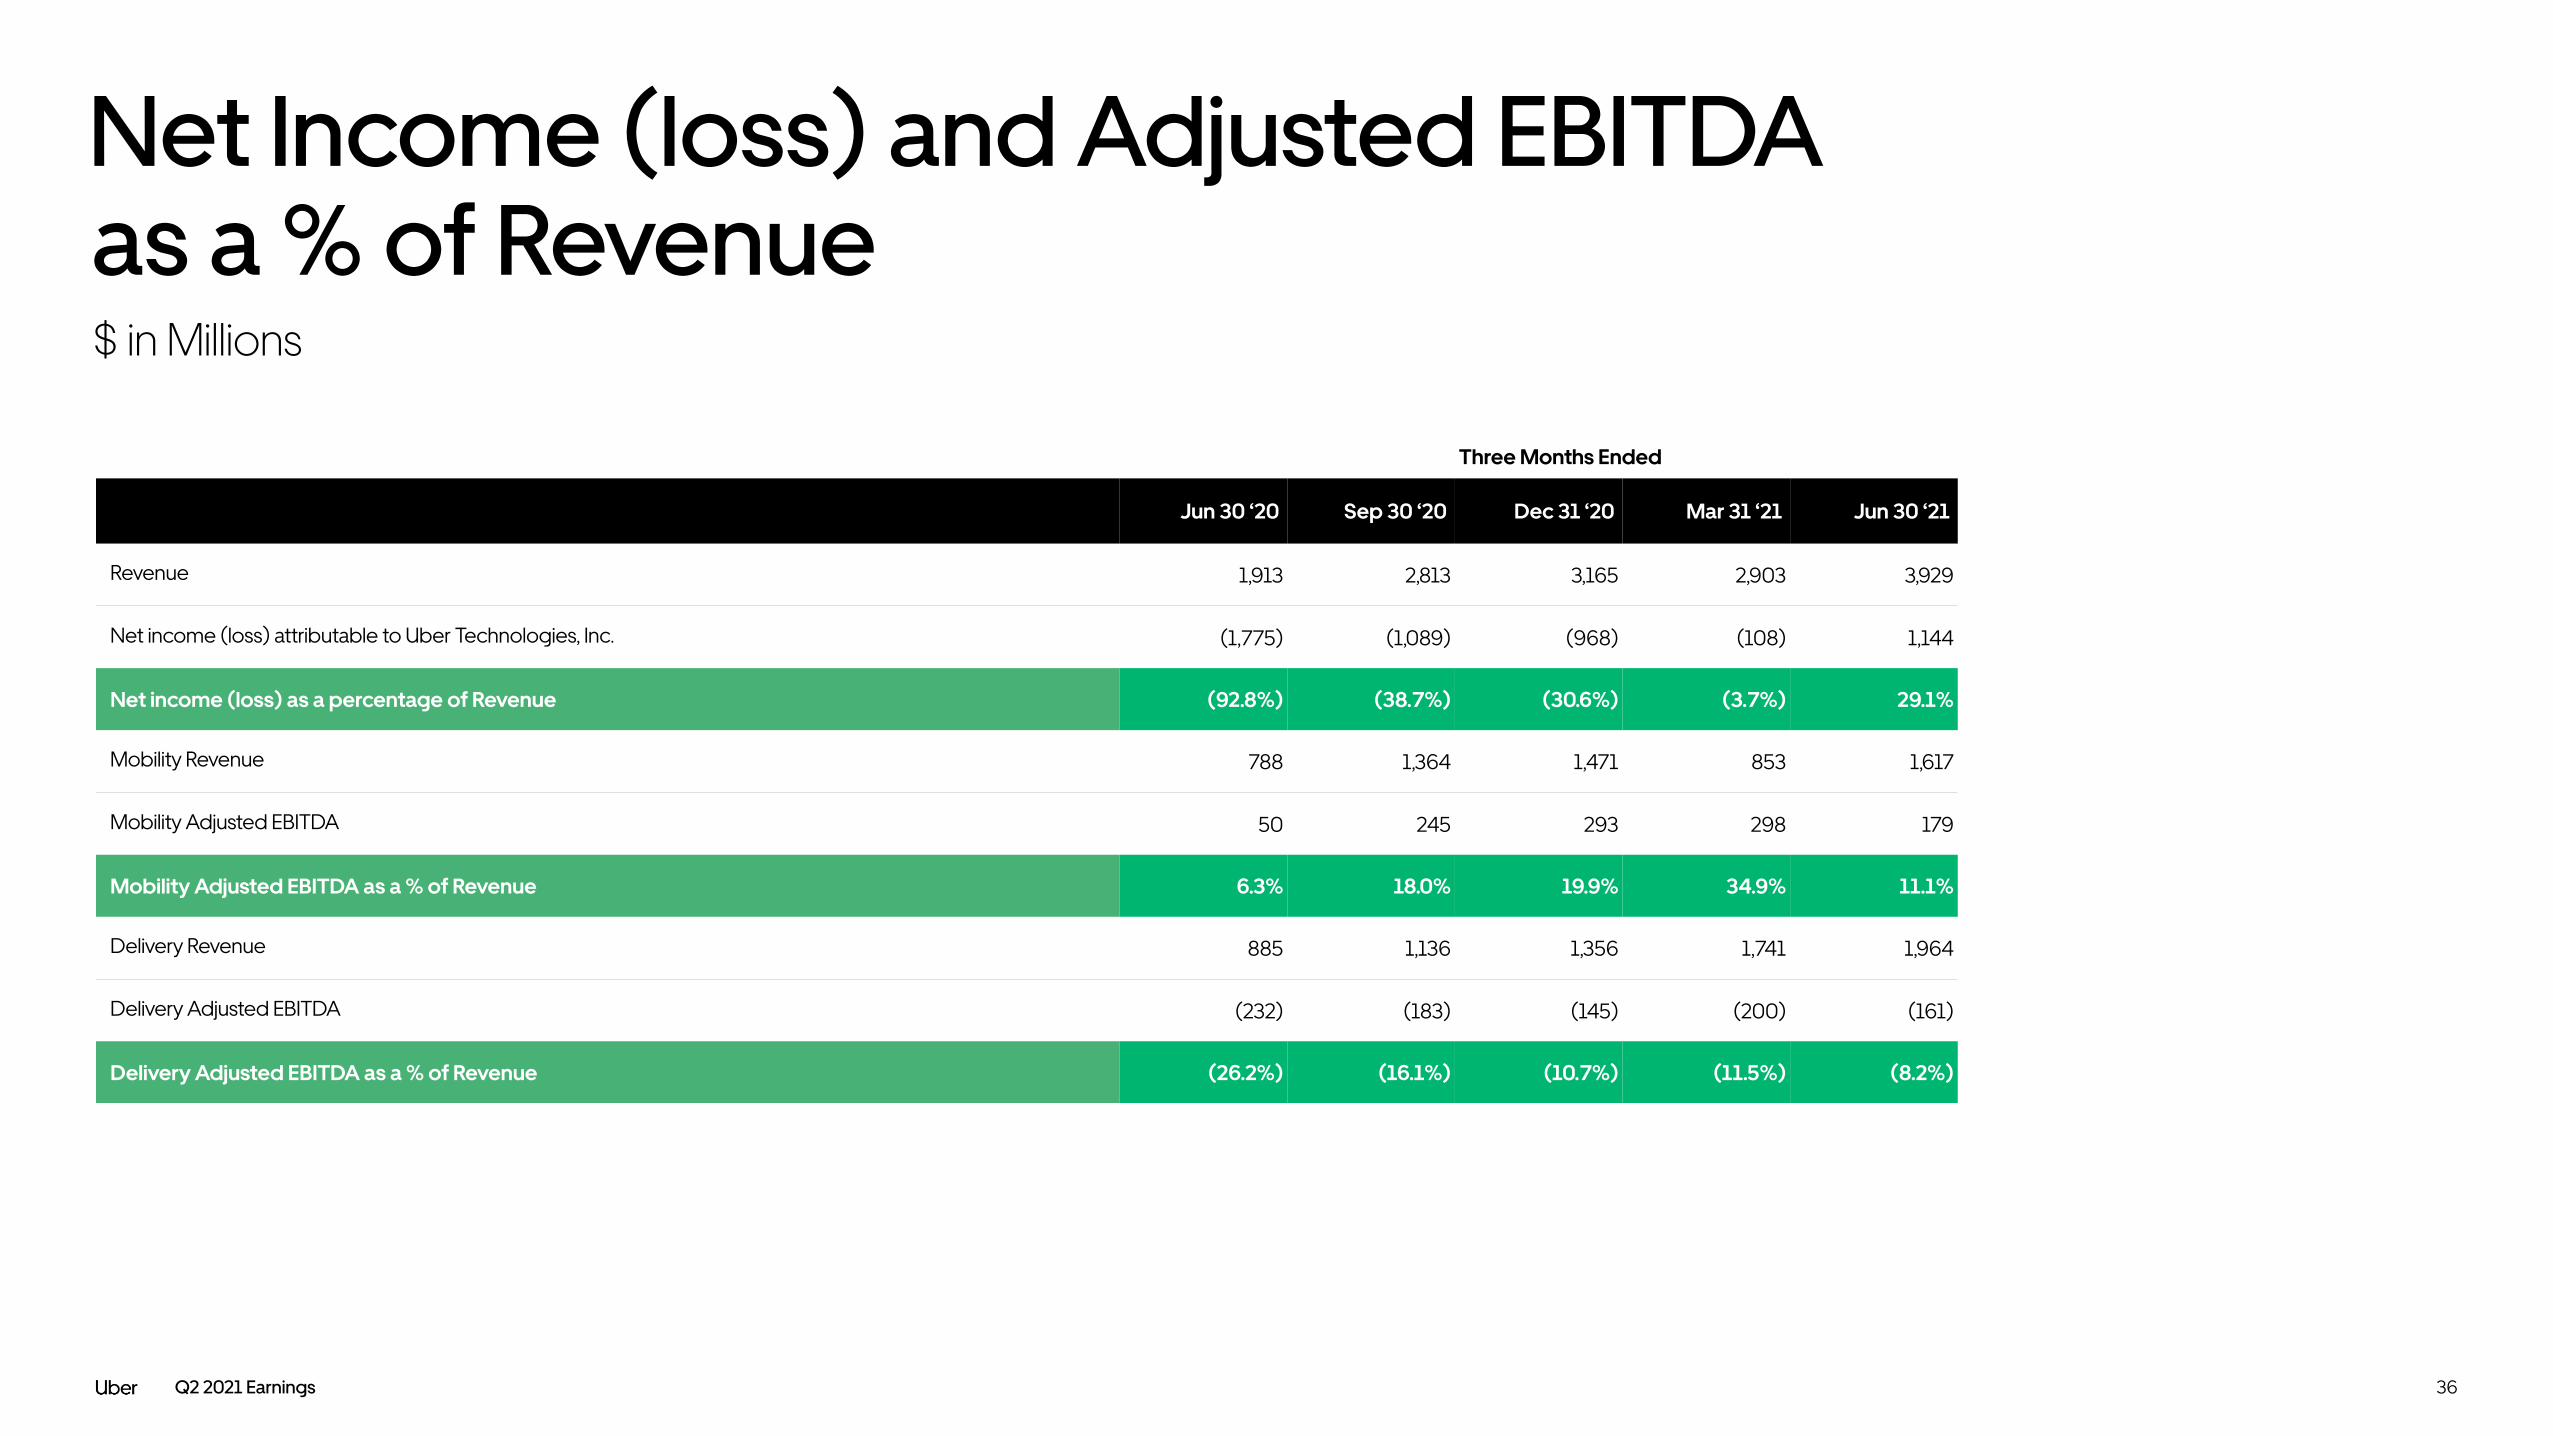
Jun 30 ‘20 Sep 30 ‘20 Dec 31 ‘20 Mar 31 ‘21 Jun 30 ‘21
Revenue 1,913 2,813 3,165 2,903 3,929
Net income (loss) attributable to Uber Technologies, Inc. (1,775) (1,089) (968) (108) 1,144
Net income (loss) as a percentage of Revenue (92.8%) (38.7%) (30.6%) (3.7%) 29.1%
Mobility Revenue 788 1,364 1,471 853 1,617
Mobility Adjusted EBITDA 50 245 293 298 179
Mobility Adjusted EBITDA as a % of Revenue 6.3% 18.0% 19.9% 34.9% 11.1%
Delivery Revenue 885 1,136 1,356 1,741 1,964
Delivery Adjusted EBITDA (232) (183) (145) (200) (161)
Delivery Adjusted EBITDA as a % of Revenue (26.2%) (16.1%) (10.7%) (11.5%) (8.2%)
Net Income (loss) and Adjusted EBITDA as a % of Revenue
Three Months Ended
$ in Millions

Q2 2021 Earnings 37
Reconciliations of Non-GAAP Financial Measures($ in Millions)
Jun 30 ‘20 Sep 30 ‘20 Dec 31 ‘20 Mar 31 ‘21 Jun 30 ‘21
Revenue Excluding UK Accrual reconciliation
Revenue 1,913 2,813 3,165 2,903 3,929
Add back:
UK Accrual - - - 600 -
Revenue Excluding UK Accrual $1,913 $2,813 $3,165 $3,503 $3,929
Three Months Ended
Jun 30 ‘20 Sep 30 ‘20 Dec 31 ‘20 Mar 31 ‘21 Jun 31 ‘21
Mobility Revenue Excluding UK Accrual reconciliation
Mobility Revenue 788 1,364 1,471 853 1,617
Add back:
UK Accrual - - - 600 -
Mobility Revenue Excluding UK Accrual $788 $1,364 $1,471 $1,453 $1,617
Three Months Ended