Q2 Earnings Presentation
28
Second Quarter 2013 Earnings July 26, 2013
-
Upload
newmont-mining-corporation -
Category
Business
-
view
762 -
download
0
Transcript of Q2 Earnings Presentation
Second Quarter 2013 Earnings
July 26, 2013
Newmont Mining Corporation | Second Quarter 2013 Earnings | www.newmont.com July 26, 2013 2
Cautionary statement
Cautionary Statement Regarding Forward Looking Statements, Including 2013 Outlook:
This presentation contains “forward-looking statements” within the meaning of Section 27A of the Securities Act of 1933, as
amended, and Section 21E of the Securities Exchange Act of 1934, as amended, which are intended to be covered by the safe
harbor created by such sections and other applicable laws. Such forward-looking statements may include, without limitation: (i)
estimates of future production and sales; (ii) estimates of future costs applicable to sales; (iii) estimates of future capital
expenditures, expenses, sustaining capital or costs, spend, and all-in sustaining cost; (iv) plans to reduce costs and increase
efficiencies; (v) expectations regarding the development, growth and exploration potential of the Company’s projects; and (vi)
expectations regarding future liquidity, balance sheet strength, borrowing availability, credit ratings, and return to shareholders.
Estimates or expectations of future events or results are based upon certain assumptions, which may prove to be incorrect. Such
assumptions, include, but are not limited to: (i) there being no significant change to current geotechnical, metallurgical,
hydrological and other physical conditions; (ii) permitting, development, operations and expansion of the Company’s projects
being consistent with current expectations and mine plans; (iii) political developments in any jurisdiction in which the Company
operates being consistent with its current expectations; (iv) certain exchange rate assumptions for the Australian dollar to the U.S.
dollar, as well as other the exchange rates being approximately consistent with current levels; (v) certain price assumptions for
gold, copper and oil; (vi) prices for key supplies being approximately consistent with current levels; and (vii) the accuracy of our
current mineral reserve and mineral resource estimates. Where the Company expresses or implies an expectation or belief as to
future events or results, such expectation or belief is expressed in good faith and believed to have a reasonable basis. However,
such statements are subject to risks, uncertainties and other factors, which could cause actual results to differ materially from
future results expressed, projected or implied by the “forward-looking statements”. Such risks include, but are not limited to, gold
and other metals price volatility, currency fluctuations, increased production costs and variances in ore grade or recovery rates
from those assumed in mining plans, political and operational risks, community relations, conflict resolution and outcome of
projects or oppositions and governmental regulation and judicial outcomes. For a more detailed discussion of such risks and other
factors, see the Company’s 2012 Form 10-K, filed on February 22, 2013, with the Securities and Exchange Commission (the
“SEC”), as well as the Company’s other SEC filings. Investors are also encouraged to review this presentation in conjunction with
the Company’s most recent Form 10-Q filed with the SEC on July 26, 2013. The Company does not undertake any obligation to
release publicly revisions to any “forward-looking statement,” including, without limitation, outlook, to reflect events or
circumstances after the date of this presentation, or to reflect the occurrence of unanticipated events, except as may be required
under applicable securities laws. Investors should not assume that any lack of update to a previously issued “forward-looking
statement” constitutes a reaffirmation of that statement. Continued reliance on “forward-looking statements” is at investors' own
risk.

Newmont Mining Corporation | Second Quarter 2013 Earnings | www.newmont.com July 26, 2013 3
Operational efficiency starts with safety
Newmont total injury rate – by quarter
(injuries per 200,000 hours worked)
0.80
0.72
0.64
0.46 0.50 0.49
Q1'12 Q2'12 Q3'12 Q4'12 Q1'13 Q2'13Tanami
Newmont Mining Corporation | Second Quarter 2013 Earnings | www.newmont.com July 26, 2013 4
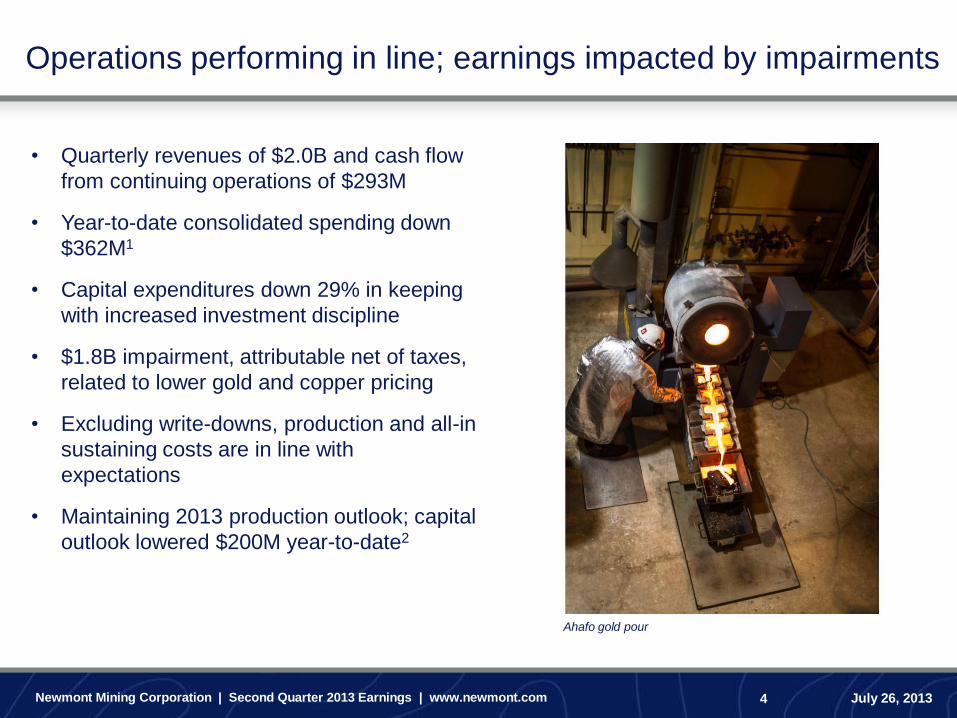
Operations performing in line; earnings impacted by impairments
Ahafo gold pour
• Quarterly revenues of $2.0B and cash flow
from continuing operations of $293M
• Year-to-date consolidated spending down
$362M1
• Capital expenditures down 29% in keeping
with increased investment discipline
• $1.8B impairment, attributable net of taxes,
related to lower gold and copper pricing
• Excluding write-downs, production and all-in
sustaining costs are in line with
expectations
• Maintaining 2013 production outlook; capital
outlook lowered $200M year-to-date2

Newmont Mining Corporation | Second Quarter 2013 Earnings | www.newmont.com July 26, 2013 5
• Focusing on value over volume
• Achieving sustainable cost improvements
• Improving mining fundamentals
• Developing only our best projects
• Preserving financial flexibility
Strengthening the business for all cycles
Newmont Mining Corporation | Second Quarter 2013 Earnings | www.newmont.com July 26, 2013 6
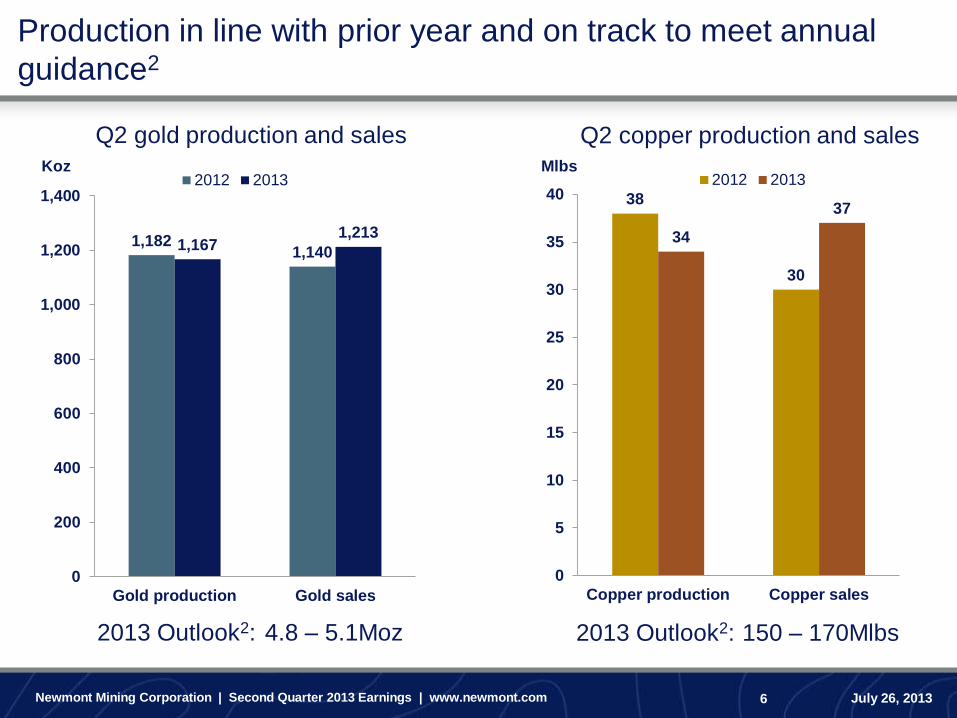
Production in line with prior year and on track to meet annual
guidance2
38
30
34
37
0
5
10
15
20
25
30
35
40
Copper production Copper sales
2012 2013
Q2 copper production and sales
Mlbs
1,182 1,140 1,167
1,213
0
200
400
600
800
1,000
1,200
1,400
Gold production Gold sales
2012 2013Koz
Q2 gold production and sales
2013 Outlook2: 4.8 – 5.1Moz 150 – 170Mlbs 2013 Outlook2:
Newmont Mining Corporation | Second Quarter 2013 Earnings | www.newmont.com July 26, 2013 7
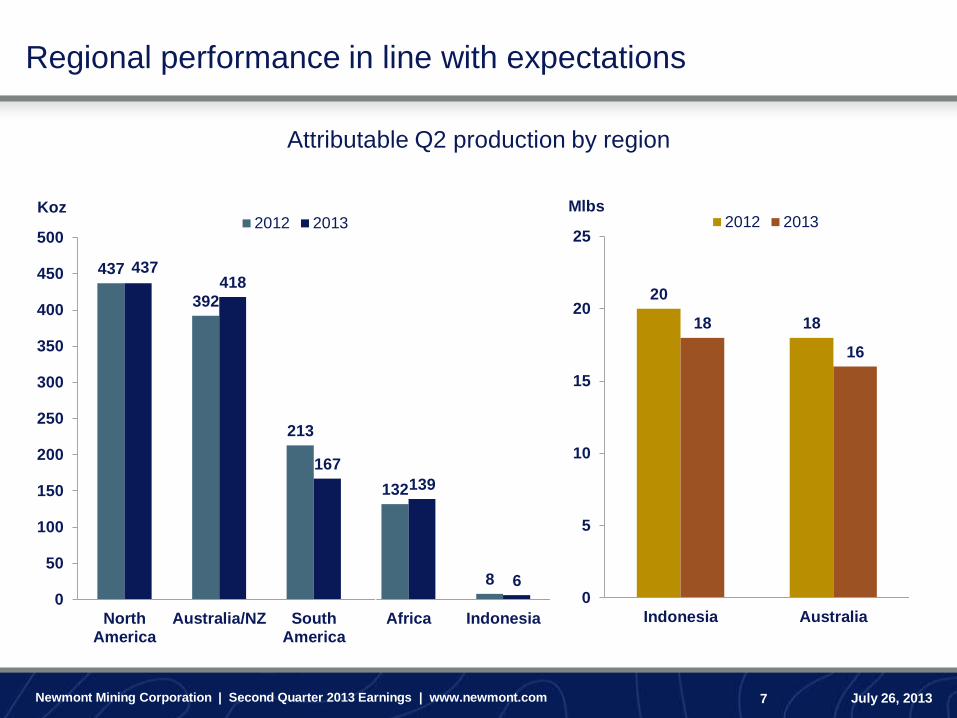
Regional performance in line with expectations
Attributable Q2 production by region
437
392
213
132
8
437 418
167
139
6 0
50
100
150
200
250
300
350
400
450
500
NorthAmerica
Australia/NZ SouthAmerica
Africa Indonesia
2012 2013
‘
1
2
Koz
20
18 18
16
0
5
10
15
20
25
Indonesia Australia
2012 2013Mlbs
Newmont Mining Corporation | Second Quarter 2013 Earnings | www.newmont.com July 26, 2013 8
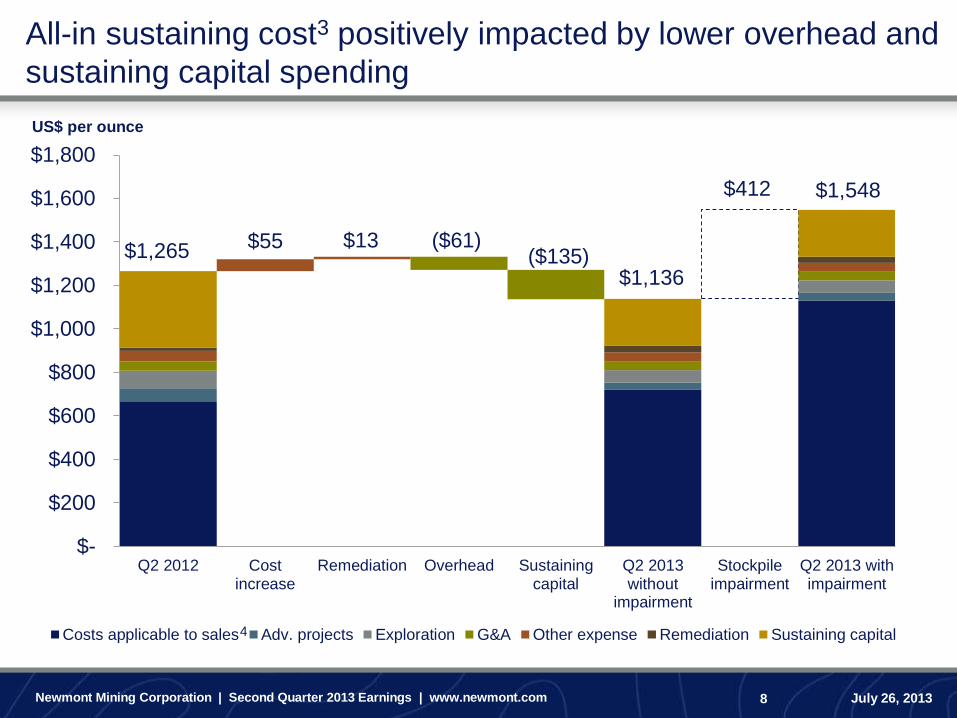
All-in sustaining cost3 positively impacted by lower overhead and
sustaining capital spending
$1,136
$1,548
$55 $13 ($61) ($135)
$412
$-
$200
$400
$600
$800
$1,000
$1,200
$1,400
$1,600
$1,800
Q2 2012 Costincrease
Remediation Overhead Sustainingcapital
Q2 2013without
impairment
Stockpileimpairment
Q2 2013 withimpairment
Costs applicable to sales Adv. projects Exploration G&A Other expense Remediation Sustaining capital
$1,265
US$ per ounce
4
Newmont Mining Corporation | Second Quarter 2013 Earnings | www.newmont.com July 26, 2013 9
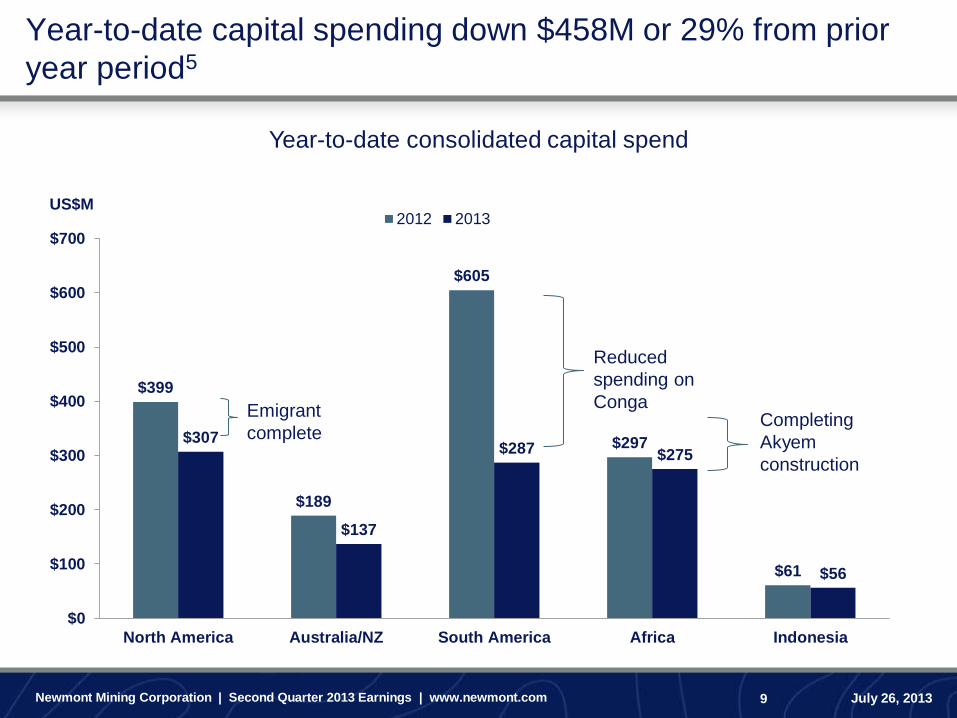
Year-to-date capital spending down $458M or 29% from prior
year period5
$399
$189
$605
$297
$61
$307
$137
$287 $275
$56
$0
$100
$200
$300
$400
$500
$600
$700
North America Australia/NZ South America Africa Indonesia
2012 2013
Emigrant
complete
US$M
Completing
Akyem
construction
Year-to-date consolidated capital spend
Reduced
spending on
Conga
Newmont Mining Corporation | Second Quarter 2013 Earnings | www.newmont.com July 26, 2013 10
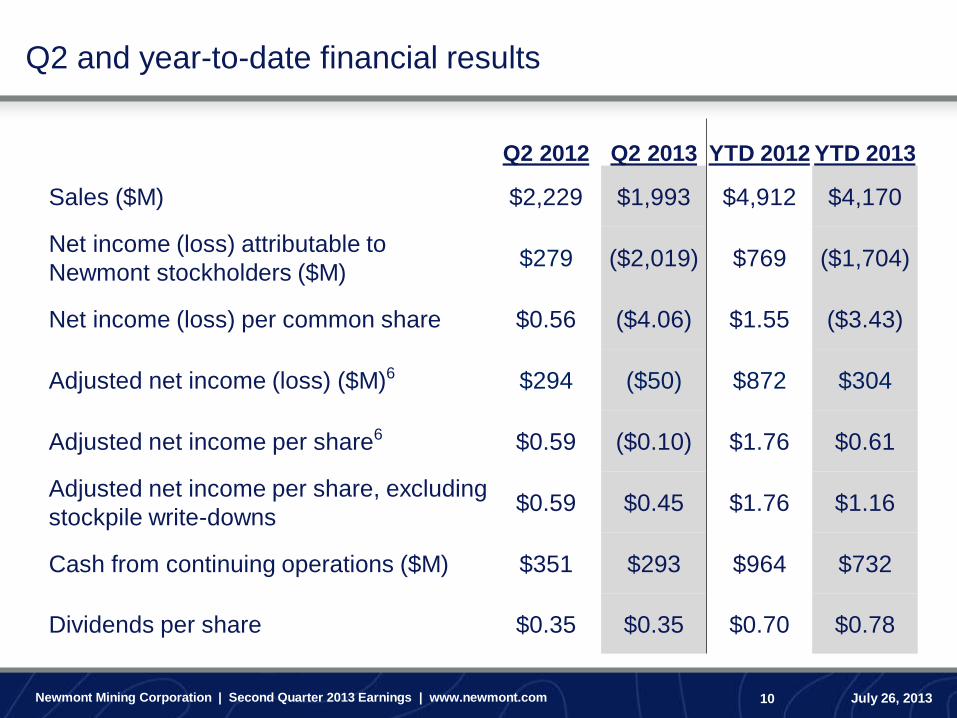
Q2 and year-to-date financial results
Q2 2012 Q2 2013 YTD 2012 YTD 2013
Sales ($M) $2,229 $1,993 $4,912 $4,170
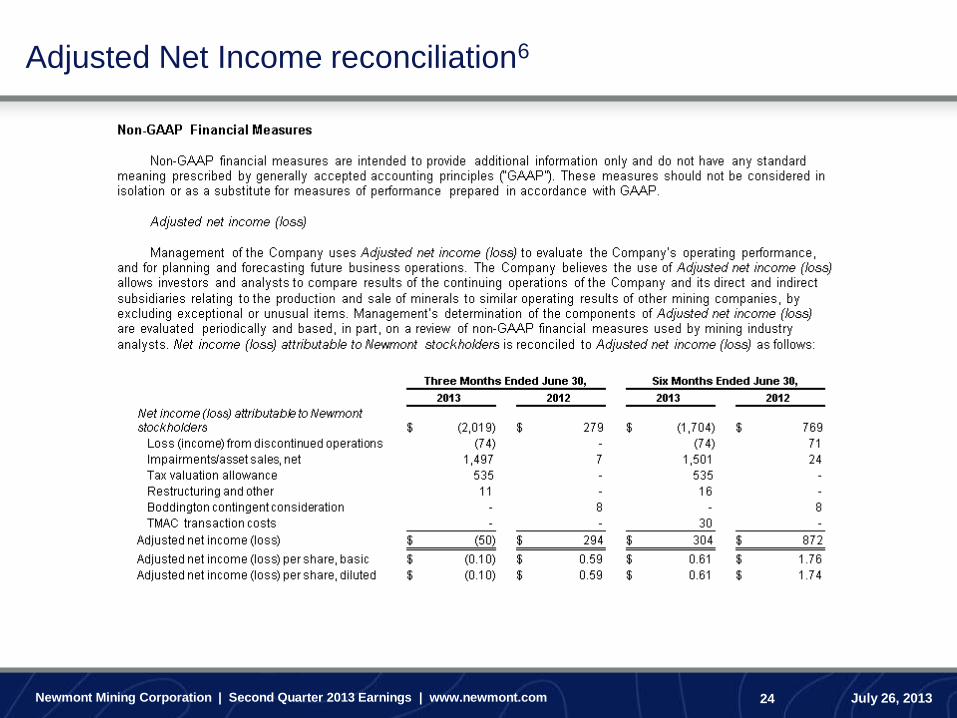
Net income (loss) attributable to
Newmont stockholders ($M) $279 ($2,019) $769 ($1,704)
Net income (loss) per common share $0.56 ($4.06) $1.55 ($3.43)
Adjusted net income (loss) ($M)6 $294 ($50) $872 $304
Adjusted net income per share6 $0.59 ($0.10) $1.76 $0.61
Adjusted net income per share, excluding
stockpile write-downs $0.59 $0.45 $1.76 $1.16
Cash from continuing operations ($M) $351 $293 $964 $732
Dividends per share $0.35 $0.35 $0.70 $0.78
Newmont Mining Corporation | Second Quarter 2013 Earnings | www.newmont.com July 26, 2013 11
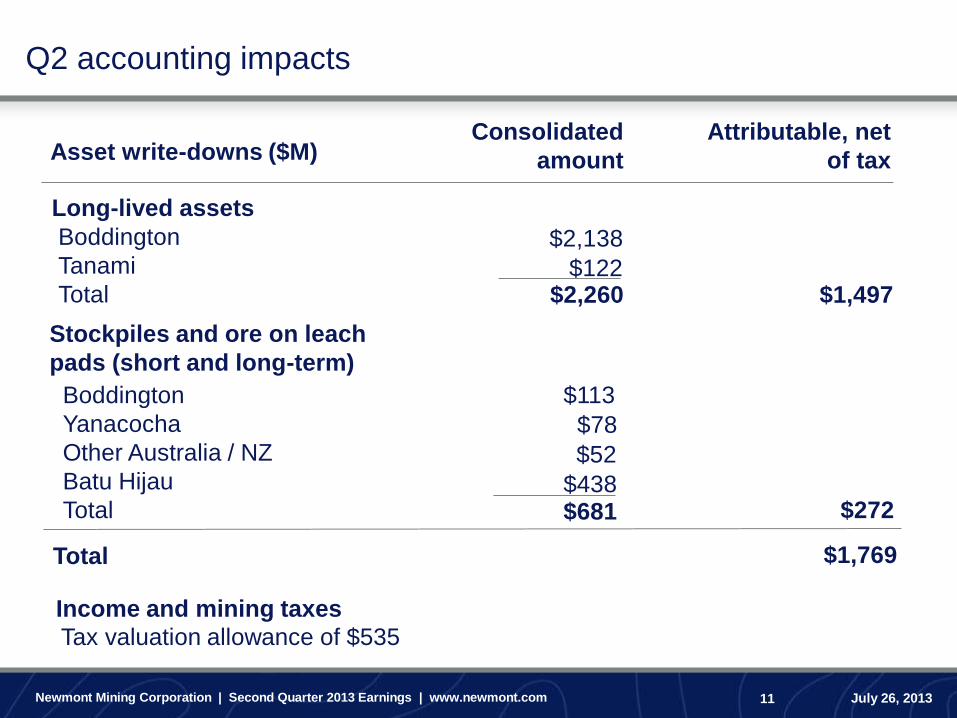
Q2 accounting impacts
Asset write-downs ($M)
Stockpiles and ore on leach
pads (short and long-term)
Long-lived assets
Boddington
Tanami
Total
Boddington
Yanacocha
Other Australia / NZ
Batu Hijau
Total
Income and mining taxes
Tax valuation allowance of $535
Consolidated
amount
Attributable, net
of tax
$1,497
$272
Total $1,769
$2,138
$122 $2,260
$113
$78
$52
$438 $681
Newmont Mining Corporation | Second Quarter 2013 Earnings | www.newmont.com July 26, 2013 12
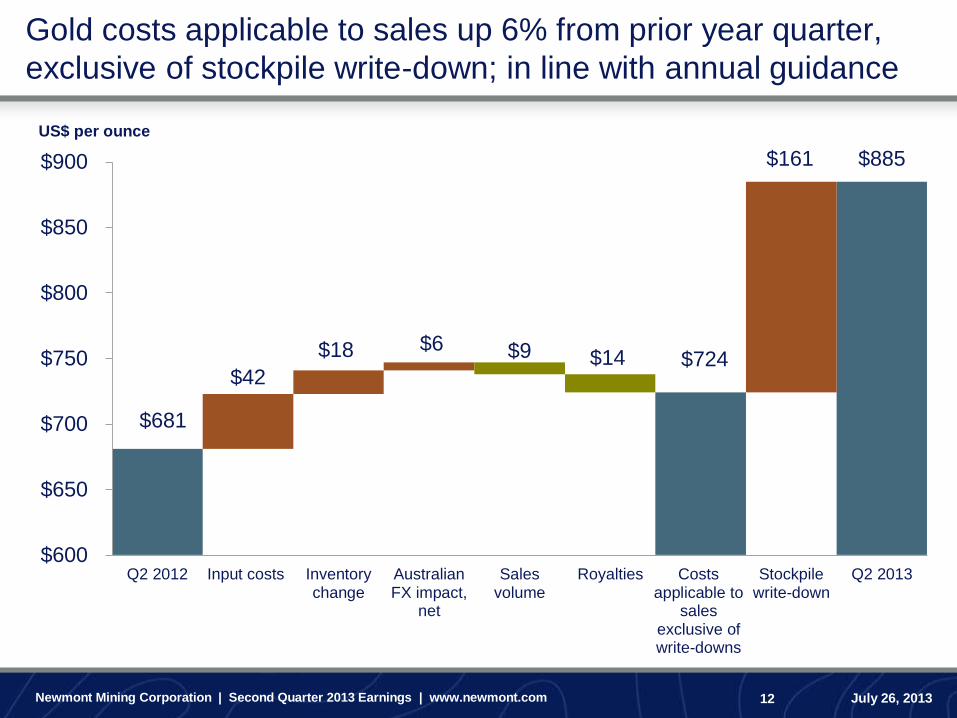
Gold costs applicable to sales up 6% from prior year quarter,
exclusive of stockpile write-down; in line with annual guidance
US$ per ounce
$681
$724
$885
$42
$18 $6 $9 $14
$161
$600
$650
$700
$750
$800
$850
$900
Q2 2012 Input costs Inventorychange
AustralianFX impact,
net
Salesvolume
Royalties Costsapplicable to
salesexclusive ofwrite-downs
Stockpilewrite-down
Q2 2013
Newmont Mining Corporation | Second Quarter 2013 Earnings | www.newmont.com July 26, 2013 13
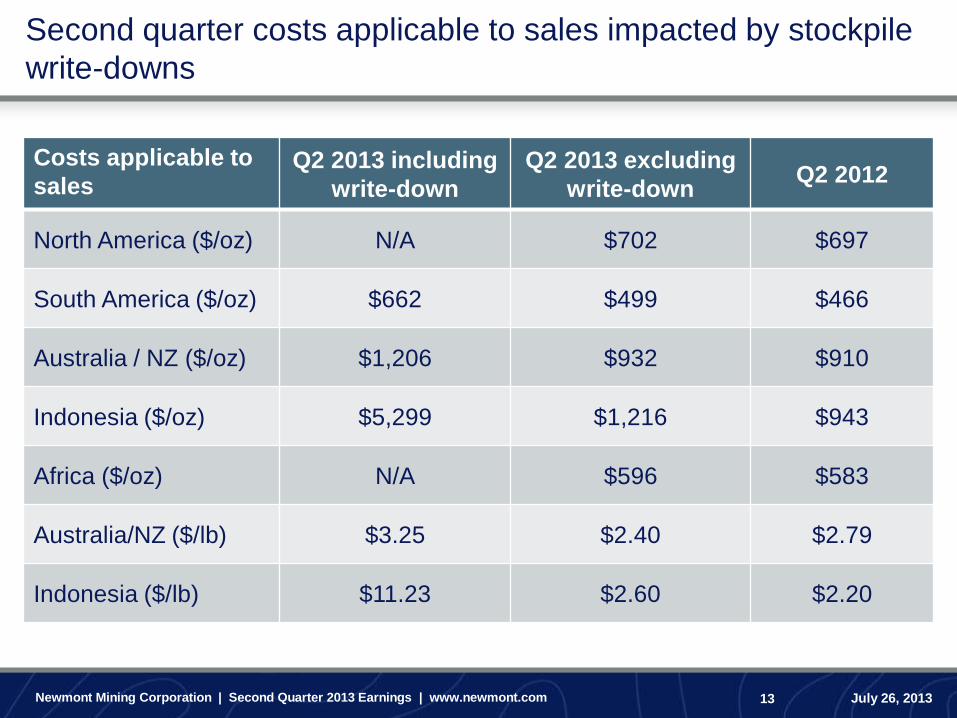
Second quarter costs applicable to sales impacted by stockpile
write-downs
Costs applicable to
sales Q2 2013 including
write-down
Q2 2013 excluding
write-down Q2 2012
North America ($/oz) N/A $702 $697
South America ($/oz) $662 $499 $466
Australia / NZ ($/oz) $1,206 $932 $910
Indonesia ($/oz) $5,299 $1,216 $943
Africa ($/oz) N/A $596 $583
Australia/NZ ($/lb) $3.25 $2.40 $2.79
Indonesia ($/lb) $11.23 $2.60 $2.20
Newmont Mining Corporation | Second Quarter 2013 Earnings | www.newmont.com July 26, 2013 14
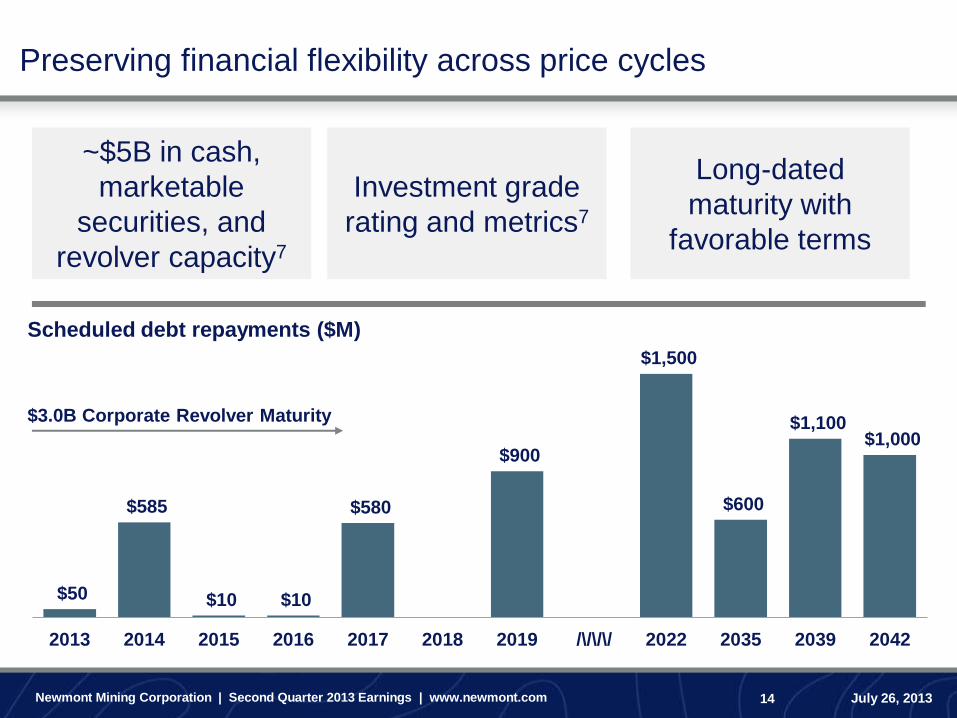
Preserving financial flexibility across price cycles
Scheduled debt repayments ($M)
~$5B in cash,
marketable
securities, and
revolver capacity7
Investment grade
rating and metrics7
Long-dated
maturity with
favorable terms
$50
$585
$10 $10
$580
$900
$1,500
$600
$1,100 $1,000
2013 2014 2015 2016 2017 2018 2019 2022 2035 2039 2042
$3.0B Corporate Revolver Maturity
/\/\/\/
Newmont Mining Corporation | Second Quarter 2013 Earnings | www.newmont.com July 26, 2013 15
$0.00
$0.50
$1.00
$1.50
$2.00
$2.50
$3.00
$3.50
$4.00
$1,200-$1,299
$1,300-$1,399
$1,400-$1,499
$1,500-$1,599
$1,600-$1,699
$1,700-$1,799
$1,800-$1,899
$1,900-$1,999
$2,000-$2,099
$2,100-$2,199
$2,200-$2,299
An
nu
ali
ze
d D
ivid
en
d P
er
Sh
are
(U
S$
)
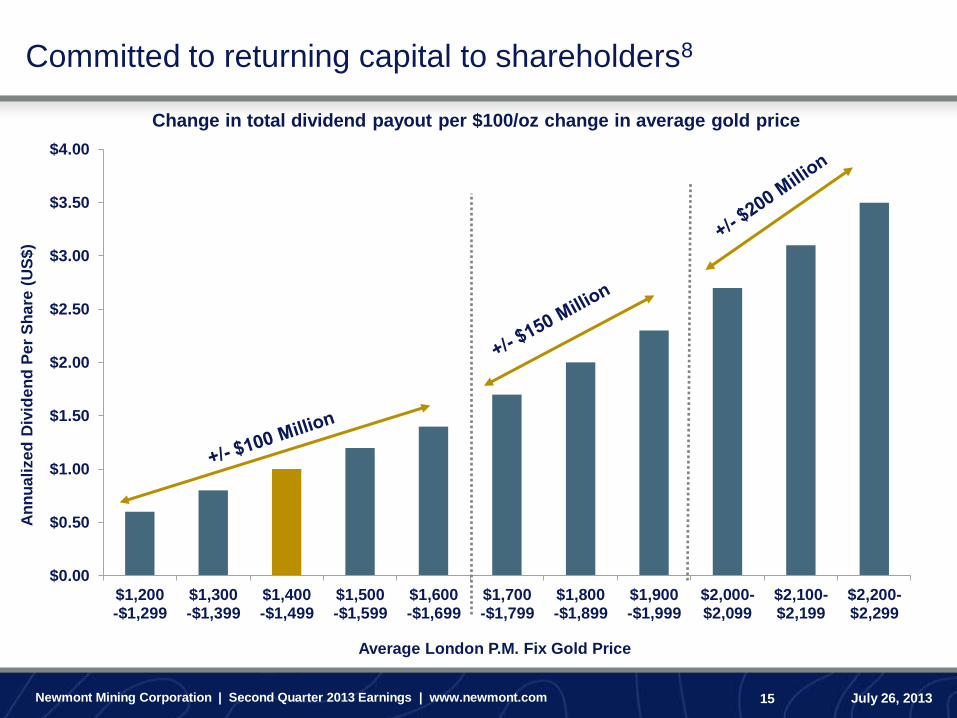
Change in total dividend payout per $100/oz change in average gold price
Committed to returning capital to shareholders8
Average London P.M. Fix Gold Price
Newmont Mining Corporation | Second Quarter 2013 Earnings | www.newmont.com July 26, 2013 16
Building a more resilient business
Portfolio optimization underway
• Total net proceeds of C$608M through sale of Canadian Oil Sands interest
Full Potential deployed at major sites
• Step-change in cost and efficiency improvements
Administrative reductions underway
• Reducing corporate work force by more than one-third; implementation in Q3
2013
• Similar efforts underway at regional offices; implementation in Q4 2013
Optimizing exploration strategy
Reviewing other efficiencies in procurement and projects
Newmont Mining Corporation | Second Quarter 2013 Earnings | www.newmont.com July 26, 2013 17
North America
• Turf vent shaft leverages existing infrastructure to increase production; first
production expected early 2015
• Phoenix Copper Leach converts waste to ore; first production by Q4 2013
• Long Canyon drilling and permitting progressing according to plan
South America
• Water first approach at Conga; Chailhuagón reservoir completed in May
• Mineral Agreement for Merian approved by Suriname national assembly in June
Africa
• Akyem construction on budget and schedule; commercial production expected
Q4 2013
Building profitable projects to improve cash flow and returns
Newmont Mining Corporation | Second Quarter 2013 Earnings | www.newmont.com July 26, 2013 18
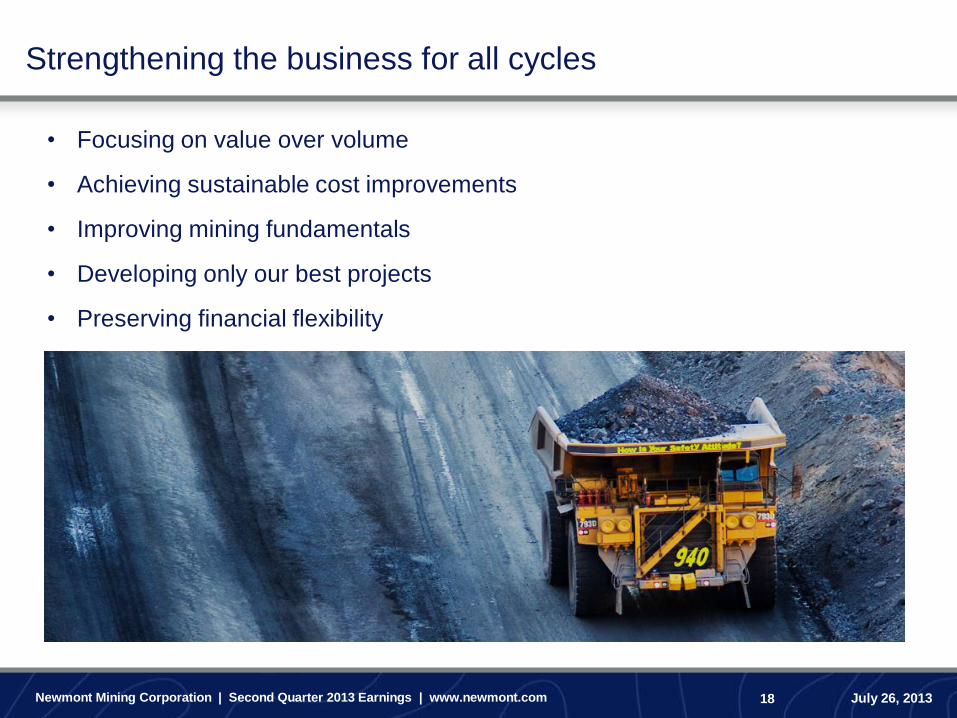
• Focusing on value over volume
• Achieving sustainable cost improvements
• Improving mining fundamentals
• Developing only our best projects
• Preserving financial flexibility
Strengthening the business for all cycles
Questions

Appendix
Newmont Mining Corporation | Second Quarter 2013 Earnings | www.newmont.com July 26, 2013 21
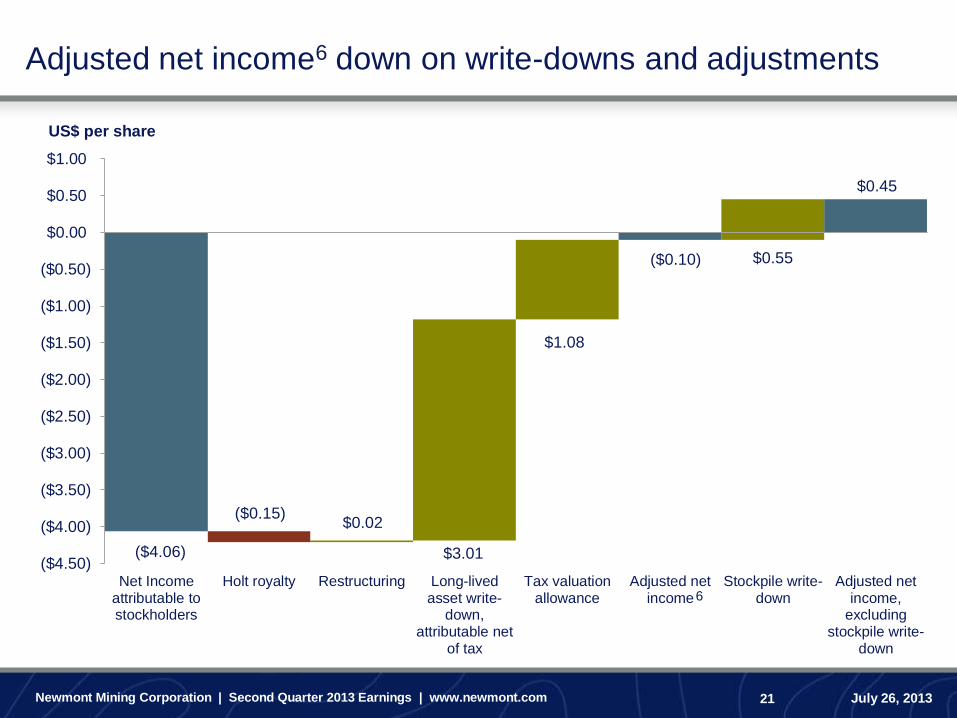
Adjusted net income6 down on write-downs and adjustments
US$ per share
($4.06)
($0.10)
$0.45
($0.15) $0.02
$3.01
$0.55
($4.50)
($4.00)
($3.50)
($3.00)
($2.50)
($2.00)
($1.50)
($1.00)
($0.50)
$0.00
$0.50
$1.00
Net Incomeattributable tostockholders
Holt royalty Restructuring Long-livedasset write-
down,attributable net
of tax
Tax valuationallowance
Adjusted netincome
Stockpile write-down
Adjusted netincome,
excludingstockpile write-
down
$1.08
6
Newmont Mining Corporation | Second Quarter 2013 Earnings | www.newmont.com July 26, 2013 22
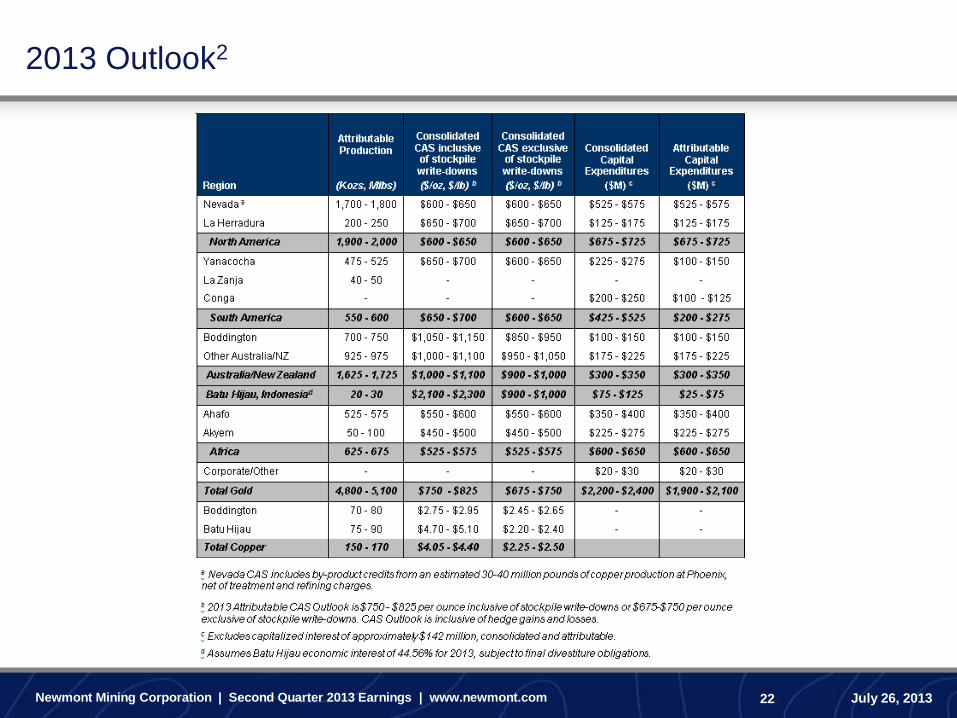
2013 Outlook2
Newmont Mining Corporation | Second Quarter 2013 Earnings | www.newmont.com July 26, 2013 23
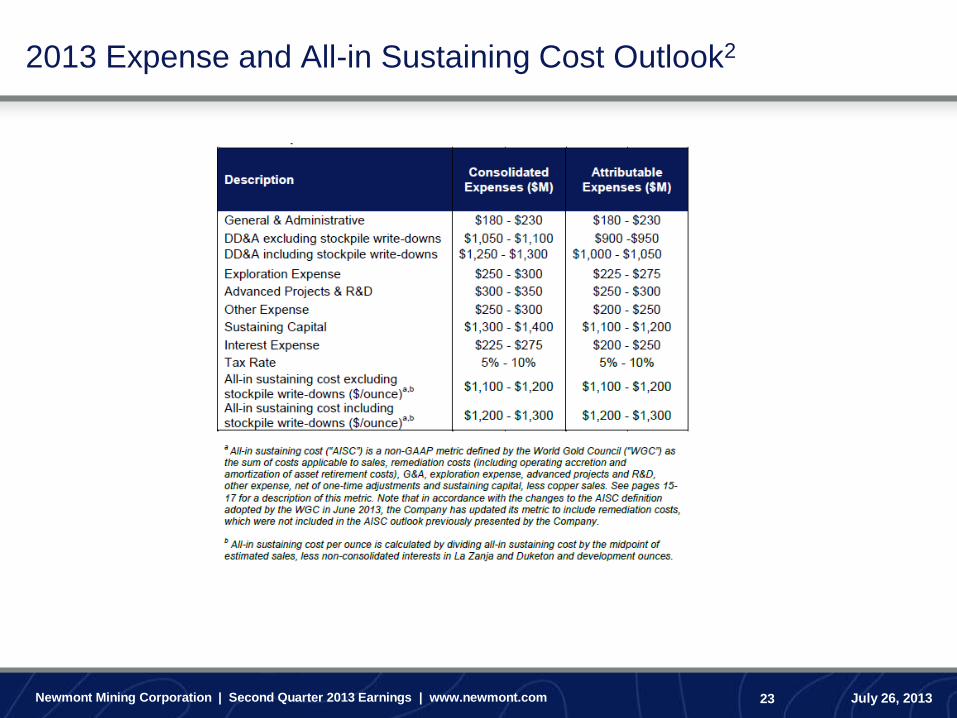
2013 Expense and All-in Sustaining Cost Outlook2
Newmont Mining Corporation | Second Quarter 2013 Earnings | www.newmont.com July 26, 2013 24
Adjusted Net Income reconciliation6
Newmont Mining Corporation | Second Quarter 2013 Earnings | www.newmont.com July 26, 2013 25
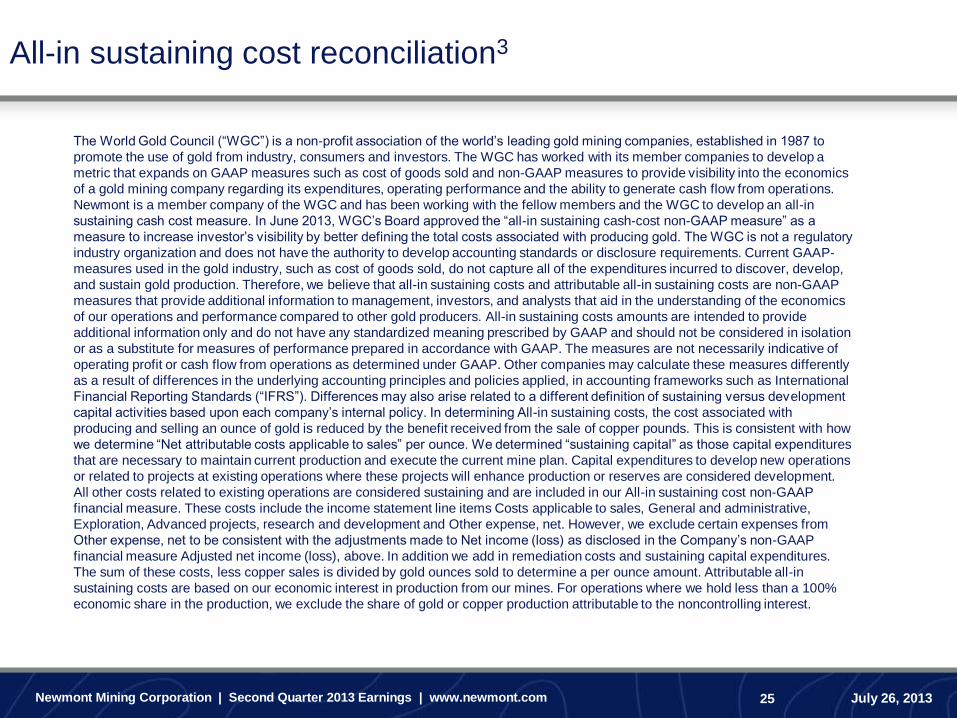
All-in sustaining cost reconciliation3
The World Gold Council (“WGC”) is a non-profit association of the world’s leading gold mining companies, established in 1987 to
promote the use of gold from industry, consumers and investors. The WGC has worked with its member companies to develop a
metric that expands on GAAP measures such as cost of goods sold and non-GAAP measures to provide visibility into the economics
of a gold mining company regarding its expenditures, operating performance and the ability to generate cash flow from operations.
Newmont is a member company of the WGC and has been working with the fellow members and the WGC to develop an all-in
sustaining cash cost measure. In June 2013, WGC’s Board approved the “all-in sustaining cash-cost non-GAAP measure” as a
measure to increase investor’s visibility by better defining the total costs associated with producing gold. The WGC is not a regulatory
industry organization and does not have the authority to develop accounting standards or disclosure requirements. Current GAAP-
measures used in the gold industry, such as cost of goods sold, do not capture all of the expenditures incurred to discover, develop,
and sustain gold production. Therefore, we believe that all-in sustaining costs and attributable all-in sustaining costs are non-GAAP
measures that provide additional information to management, investors, and analysts that aid in the understanding of the economics
of our operations and performance compared to other gold producers. All-in sustaining costs amounts are intended to provide
additional information only and do not have any standardized meaning prescribed by GAAP and should not be considered in isolation
or as a substitute for measures of performance prepared in accordance with GAAP. The measures are not necessarily indicative of
operating profit or cash flow from operations as determined under GAAP. Other companies may calculate these measures differently
as a result of differences in the underlying accounting principles and policies applied, in accounting frameworks such as International
Financial Reporting Standards (“IFRS”). Differences may also arise related to a different definition of sustaining versus development
capital activities based upon each company’s internal policy. In determining All-in sustaining costs, the cost associated with
producing and selling an ounce of gold is reduced by the benefit received from the sale of copper pounds. This is consistent with how
we determine “Net attributable costs applicable to sales” per ounce. We determined “sustaining capital” as those capital expenditures
that are necessary to maintain current production and execute the current mine plan. Capital expenditures to develop new operations
or related to projects at existing operations where these projects will enhance production or reserves are considered development.
All other costs related to existing operations are considered sustaining and are included in our All-in sustaining cost non-GAAP
financial measure. These costs include the income statement line items Costs applicable to sales, General and administrative,
Exploration, Advanced projects, research and development and Other expense, net. However, we exclude certain expenses from
Other expense, net to be consistent with the adjustments made to Net income (loss) as disclosed in the Company’s non-GAAP
financial measure Adjusted net income (loss), above. In addition we add in remediation costs and sustaining capital expenditures.
The sum of these costs, less copper sales is divided by gold ounces sold to determine a per ounce amount. Attributable all-in
sustaining costs are based on our economic interest in production from our mines. For operations where we hold less than a 100%
economic share in the production, we exclude the share of gold or copper production attributable to the noncontrolling interest.
Newmont Mining Corporation | Second Quarter 2013 Earnings | www.newmont.com July 26, 2013 26
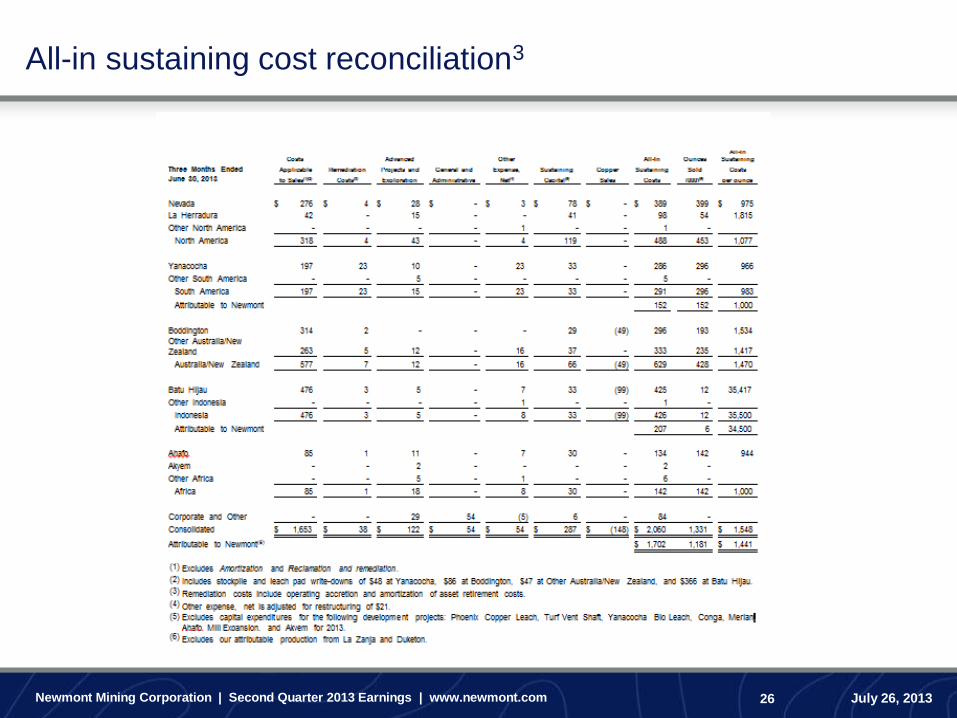
All-in sustaining cost reconciliation3

Newmont Mining Corporation | Second Quarter 2013 Earnings | www.newmont.com July 26, 2013 27
Consolidated spending reconciliation1
Newmont Mining Corporation | Second Quarter 2013 Earnings | www.newmont.com July 26, 2013 28
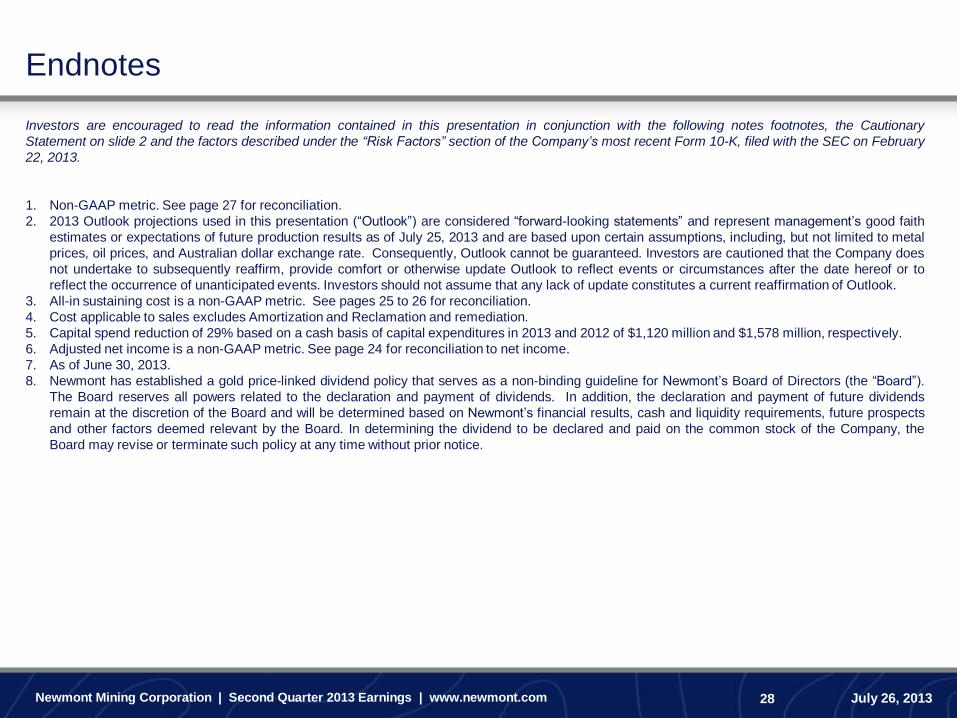
Endnotes
Investors are encouraged to read the information contained in this presentation in conjunction with the following notes footnotes, the Cautionary
Statement on slide 2 and the factors described under the “Risk Factors” section of the Company’s most recent Form 10-K, filed with the SEC on February
22, 2013.
1. Non-GAAP metric. See page 27 for reconciliation.
2. 2013 Outlook projections used in this presentation (“Outlook”) are considered “forward-looking statements” and represent management’s good faith
estimates or expectations of future production results as of July 25, 2013 and are based upon certain assumptions, including, but not limited to metal
prices, oil prices, and Australian dollar exchange rate. Consequently, Outlook cannot be guaranteed. Investors are cautioned that the Company does
not undertake to subsequently reaffirm, provide comfort or otherwise update Outlook to reflect events or circumstances after the date hereof or to
reflect the occurrence of unanticipated events. Investors should not assume that any lack of update constitutes a current reaffirmation of Outlook.
3. All-in sustaining cost is a non-GAAP metric. See pages 25 to 26 for reconciliation.
4. Cost applicable to sales excludes Amortization and Reclamation and remediation.
5. Capital spend reduction of 29% based on a cash basis of capital expenditures in 2013 and 2012 of $1,120 million and $1,578 million, respectively.
6. Adjusted net income is a non-GAAP metric. See page 24 for reconciliation to net income.
7. As of June 30, 2013.
8. Newmont has established a gold price-linked dividend policy that serves as a non-binding guideline for Newmont’s Board of Directors (the “Board”).
The Board reserves all powers related to the declaration and payment of dividends. In addition, the declaration and payment of future dividends
remain at the discretion of the Board and will be determined based on Newmont’s financial results, cash and liquidity requirements, future prospects
and other factors deemed relevant by the Board. In determining the dividend to be declared and paid on the common stock of the Company, the
Board may revise or terminate such policy at any time without prior notice.