U S Department of Energy Recommendations and...
46
U S Department of Energy Recommendations and Industrial Chiller Plant Optimization Presented by: David Pleasants 2016 1 Copyright © 2016 PES LLC & tekWorx , LLC Not to be copied for other than Greenville , SC, ASHRAE members without written permission.
Transcript of U S Department of Energy Recommendations and...
U S Department of Energy
Recommendations
and
Industrial Chiller Plant Optimization
Presented by:
David Pleasants
2016
1
Copyright © 2016 PES LLC & tekWorx , LLC Not to be copied for other than Greenville , SC, ASHRAE members without written permission.

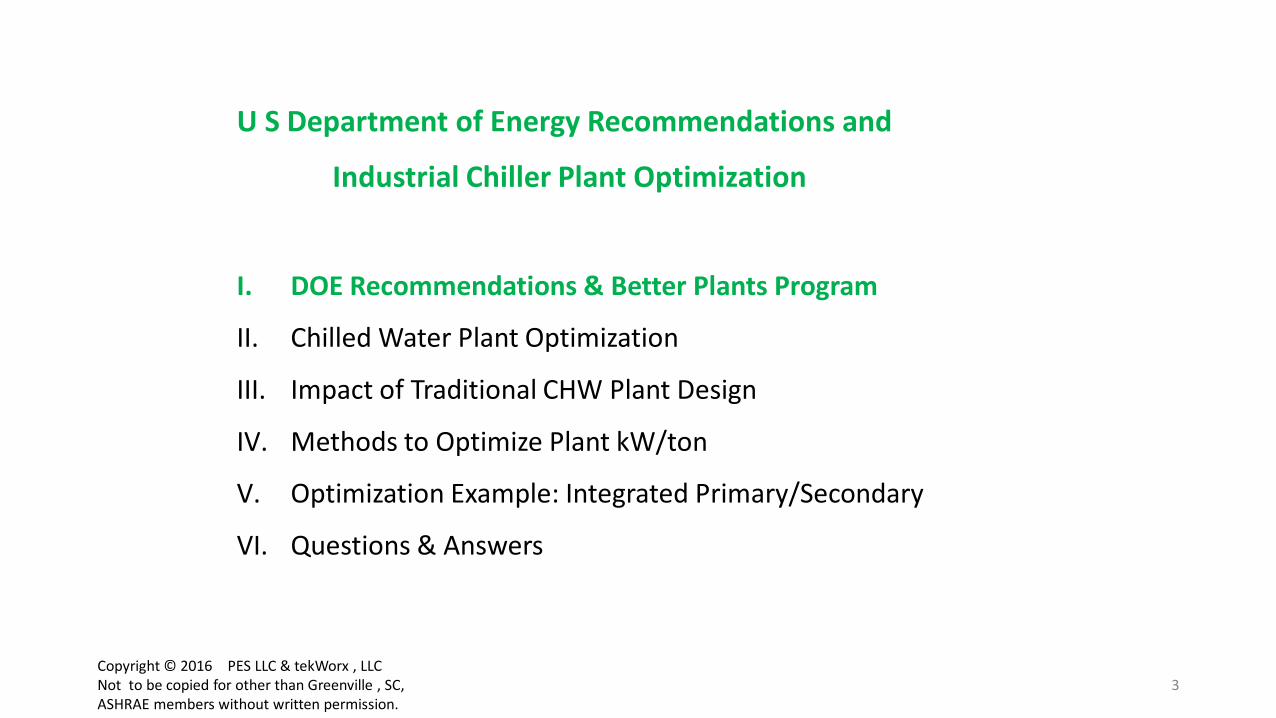
U S Department of Energy Recommendations and
Industrial Chiller Plant Optimization
I. DOE Recommendations & Better Plants Program
II. Chilled Water Plant Optimization
III. Impact of Traditional CHW Plant Design
IV. Methods to Optimize Plant kW/ton
V. Optimization Example: Integrated Primary/Secondary
VI. Questions & Answers
2 Copyright © 2016 PES LLC & tekWorx , LLC Not to be copied for other than Greenville , SC, ASHRAE members without written permission.
U S Department of Energy Recommendations and
Industrial Chiller Plant Optimization
I. DOE Recommendations & Better Plants Program
II. Chilled Water Plant Optimization
III. Impact of Traditional CHW Plant Design
IV. Methods to Optimize Plant kW/ton
V. Optimization Example: Integrated Primary/Secondary
VI. Questions & Answers
3 Copyright © 2016 PES LLC & tekWorx , LLC Not to be copied for other than Greenville , SC, ASHRAE members without written permission.
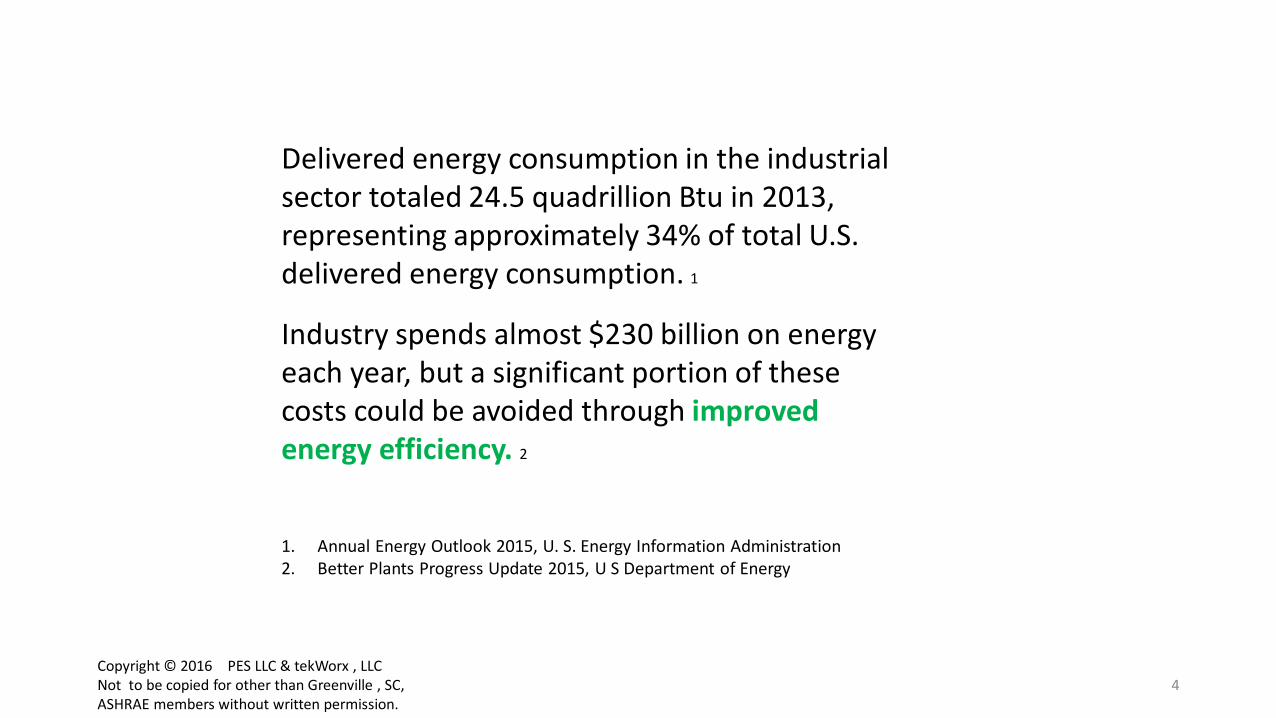
Delivered energy consumption in the industrial sector totaled 24.5 quadrillion Btu in 2013, representing approximately 34% of total U.S. delivered energy consumption. 1
Industry spends almost $230 billion on energy each year, but a significant portion of these costs could be avoided through improved energy efficiency. 2
1. Annual Energy Outlook 2015, U. S. Energy Information Administration 2. Better Plants Progress Update 2015, U S Department of Energy
4 Copyright © 2016 PES LLC & tekWorx , LLC Not to be copied for other than Greenville , SC, ASHRAE members without written permission.

Money saved through energy efficiency/effectiveness can be
redirected toward:
• new technologies.
• upgraded equipment.
• additional employees.
• other investments that can help businesses
stay competitive.
5 Copyright © 2016 PES LLC & tekWorx , LLC Not to be copied for other than Greenville , SC, ASHRAE members without written permission.

The industrial sector also accounts for the
largest share of the Nation’s greenhouse gas
emissions by end use sector—about 34%,
ahead of the transportation sector at 28%.7
By lowering energy consumption, energy
efficiency is a key tool for manufacturers to
reduce their carbon footprint and help meet
corporate sustainability goals.
6 Copyright © 2016 PES LLC & tekWorx , LLC Not to be copied for other than Greenville , SC, ASHRAE members without written permission.
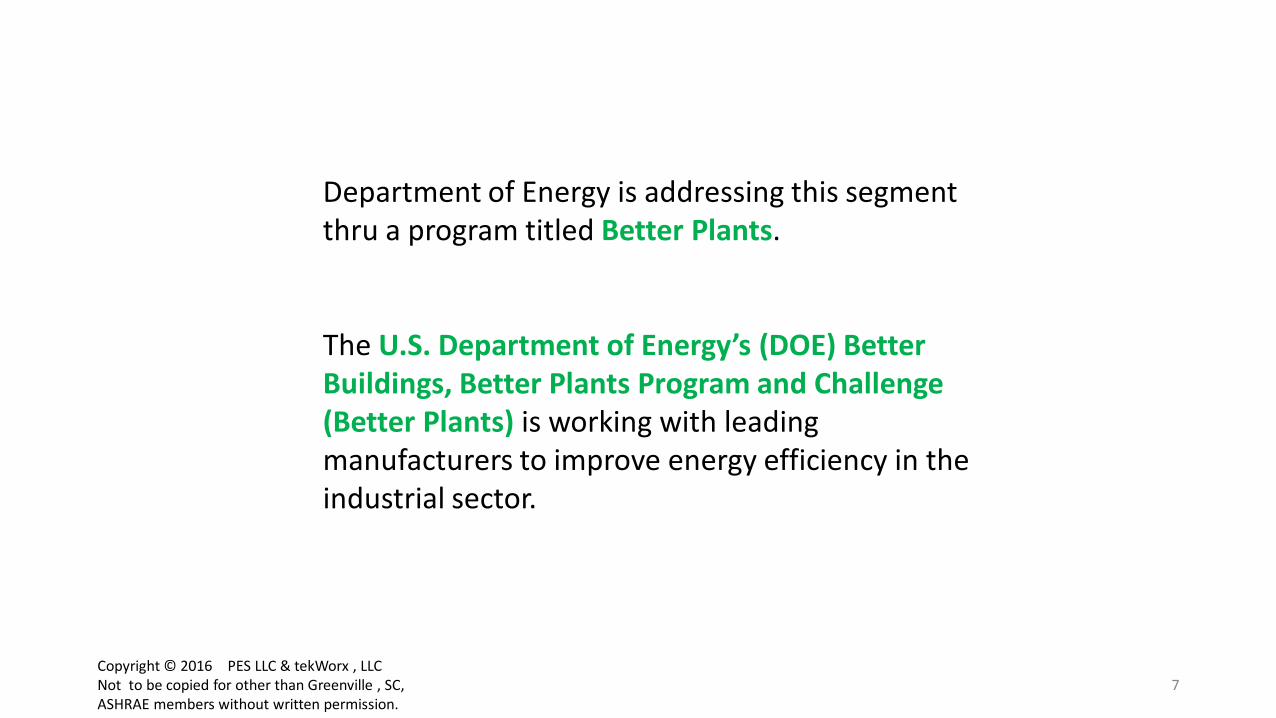
Department of Energy is addressing this segment thru a program titled Better Plants. The U.S. Department of Energy’s (DOE) Better Buildings, Better Plants Program and Challenge (Better Plants) is working with leading manufacturers to improve energy efficiency in the industrial sector.
7 Copyright © 2016 PES LLC & tekWorx , LLC Not to be copied for other than Greenville , SC, ASHRAE members without written permission.

Today, 157 industrial organizations representing 11.4% of the total U.S. manufacturing energy footprint are Better Plants Partners, a combined energy footprint greater than the state of Tennessee. Partners have reported estimated cumulative energy savings of roughly 457 trillion British thermal units and $2.4 billion in energy costs. 3 3. Better Plants Progress Update 2015, U S Department of Energy
8 Copyright © 2016 PES LLC & tekWorx , LLC Not to be copied for other than Greenville , SC, ASHRAE members without written permission.
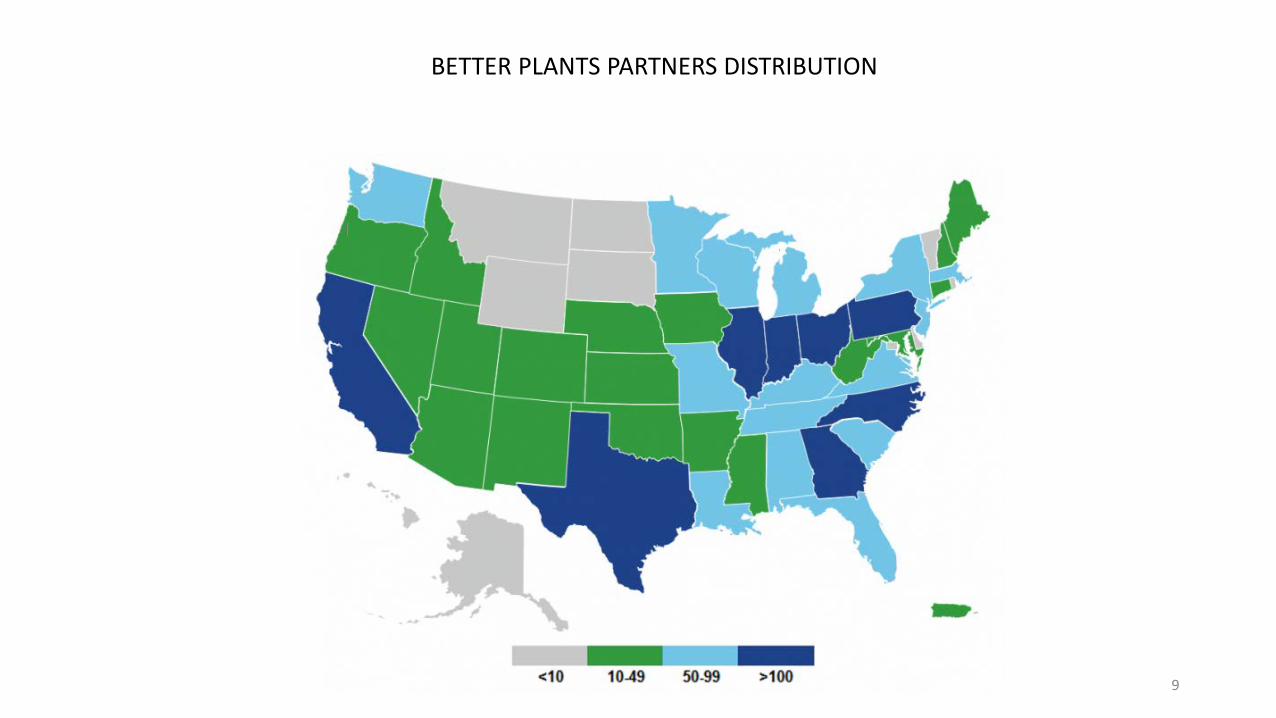
BETTER PLANTS PARTNERS DISTRIBUTION
9

THERE’S MUCH MORE TO GO!
10 Copyright © 2016 PES LLC & tekWorx , LLC Not to be copied for other than Greenville , SC, ASHRAE members without written permission.

Industrial Manufacturing Plants Energy Inputs typically follow this sequence:
1. Primary energy input.
2. Central Generation ≈ Central Energy Plant
3. Distribution.
4. Energy conversion, consisting of motors, fans, pumps and heat exchangers.
5. Processes, in which converted energy transforms raw materials and intermediates into final products.
11 Copyright © 2016 PES LLC & tekWorx , LLC Not to be copied for other than Greenville , SC, ASHRAE members without written permission.
U S Department of Energy Recommendations and
Industrial Chiller Plant Optimization
I. DOE Recommendations & Better Plants Program
II. Chilled Water Plant Optimization
III. Impact of Traditional CHW Plant Design
IV. Methods to Optimize Plant kW/ton
V. Optimization Example: Integrated Primary/Secondary
VI. Questions & Answers
12 Copyright © 2016 PES LLC & tekWorx , LLC Not to be copied for other than Greenville , SC, ASHRAE members without written permission.

Presentation today on specific part of Central Energy Plant –
OPTIMIZATION OF
CHILLED WATER PRODUCTION
13 Copyright © 2016 PES LLC & tekWorx , LLC Not to be copied for other than Greenville , SC, ASHRAE members without written permission.
OPTIMIZATION OF
CHILLED WATER PRODUCTION
• MANY VENDORS TODAY
14 Copyright © 2016 PES LLC & tekWorx , LLC Not to be copied for other than Greenville , SC, ASHRAE members without written permission.
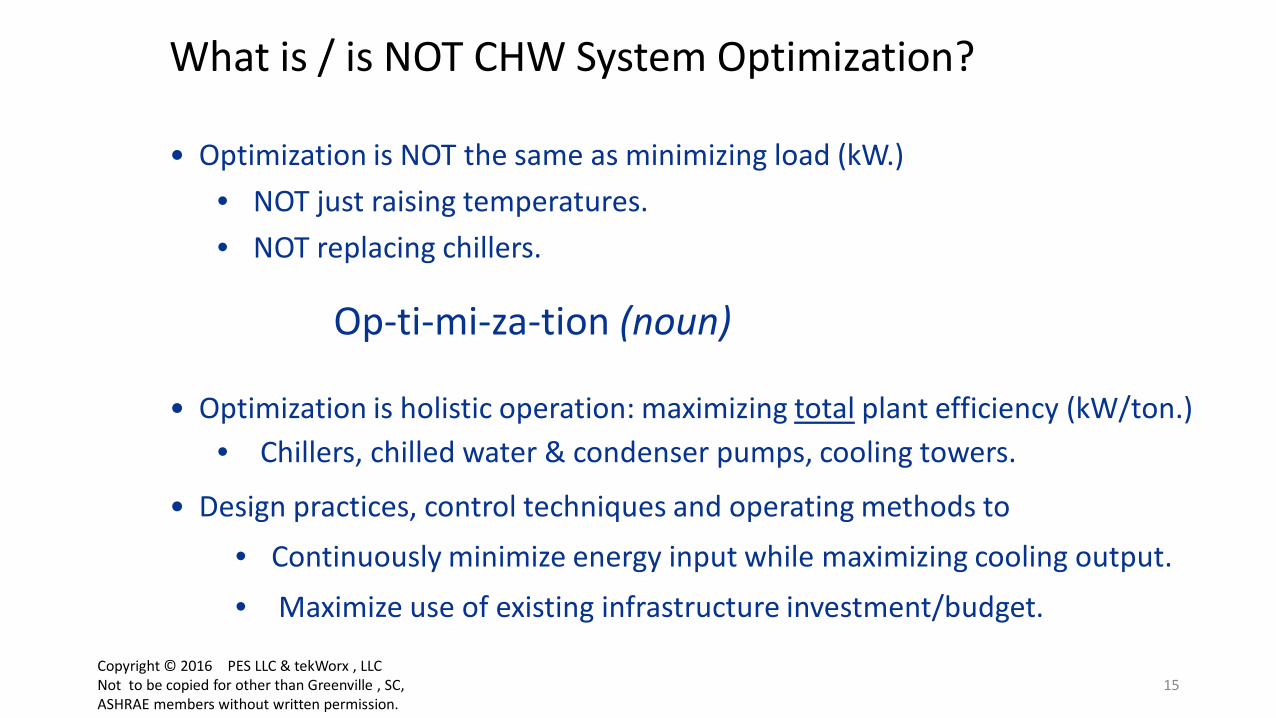
What is / is NOT CHW System Optimization?
• Optimization is NOT the same as minimizing load (kW.) • NOT just raising temperatures. • NOT replacing chillers.
Op-ti-mi-za-tion (noun)
• Optimization is holistic operation: maximizing total plant efficiency (kW/ton.) • Chillers, chilled water & condenser pumps, cooling towers.
• Design practices, control techniques and operating methods to • Continuously minimize energy input while maximizing cooling output.
• Maximize use of existing infrastructure investment/budget.
15 Copyright © 2016 PES LLC & tekWorx , LLC Not to be copied for other than Greenville , SC, ASHRAE members without written permission.

Chilled Water System Optimization: Components/Opportunities
• Hydronic Design • Piping • Pumping • Valves
• Control System • Strategy • Algorithms • Instrumentation
• Operating Methods • Operator influence • Maintenance problems • System specific issues/requirements
16 Copyright © 2016 PES LLC & tekWorx , LLC Not to be copied for other than Greenville , SC, ASHRAE members without written permission.

Added Benefits of Optimization:
• Improved efficiency / effectiveness → increases usable % of plant capacity.
• More tonnage per chiller → less chillers needed.
• Less chillers needed → less pumps, cooling towers needed.
• Less chillers, pumps, cooling towers needed → redundancy.
• Less chillers, pumps, cooling towers needed → less maintenance.
17 Copyright © 2016 PES LLC & tekWorx , LLC Not to be copied for other than Greenville , SC, ASHRAE members without written permission.

U S Department of Energy Recommendations and
Industrial Chiller Plant Optimization
I. DOE Recommendations & Better Plants Program
II. Chilled Water Plant Optimization
III. Impact of Traditional CHW Plant Design
IV. Hydronic Design Impact on Efficiency
V. Methods to Optimize Plant kW/ton
VI. Optimization Example: Integrated Primary/Secondary
VII. Questions & Answers
18
Copyright © 2016 PES LLC & tekWorx , LLC Not to be copied for other than Greenville , SC, ASHRAE members without written permission.

Your Chiller Plant may be Wasting Money Impact of Traditional Chilled Water System Design,
Operation and Energy Efficiency, Effectiveness

Traditional Design Approach: Impact on Efficiency and Effectiveness
20
• Up to 90% of plants can be improved, but . . . Most owners don’t acknowledge the problems or don’t know how to fix .
• 90% of plants operate at .95 kW per ton or higher ! !
kW / ton 0.5 0.6 0.7 0.8 0.9 1.0 1.1 1.2 1.3 1.4 1.5
Inefficient Designs / Manual Control / Older Plants
/ Operational Problems
I P/S or
optimized VP
VP design / standard control
sequence Standard Primary/Secondary
and BAS control sequence
10% < .95 kW per ton
90% > .95 kW per ton
Copyright © 2016 PES LLC & tekWorx , LLC Not to be copied for other than Greenville , SC, ASHRAE members without written permission.
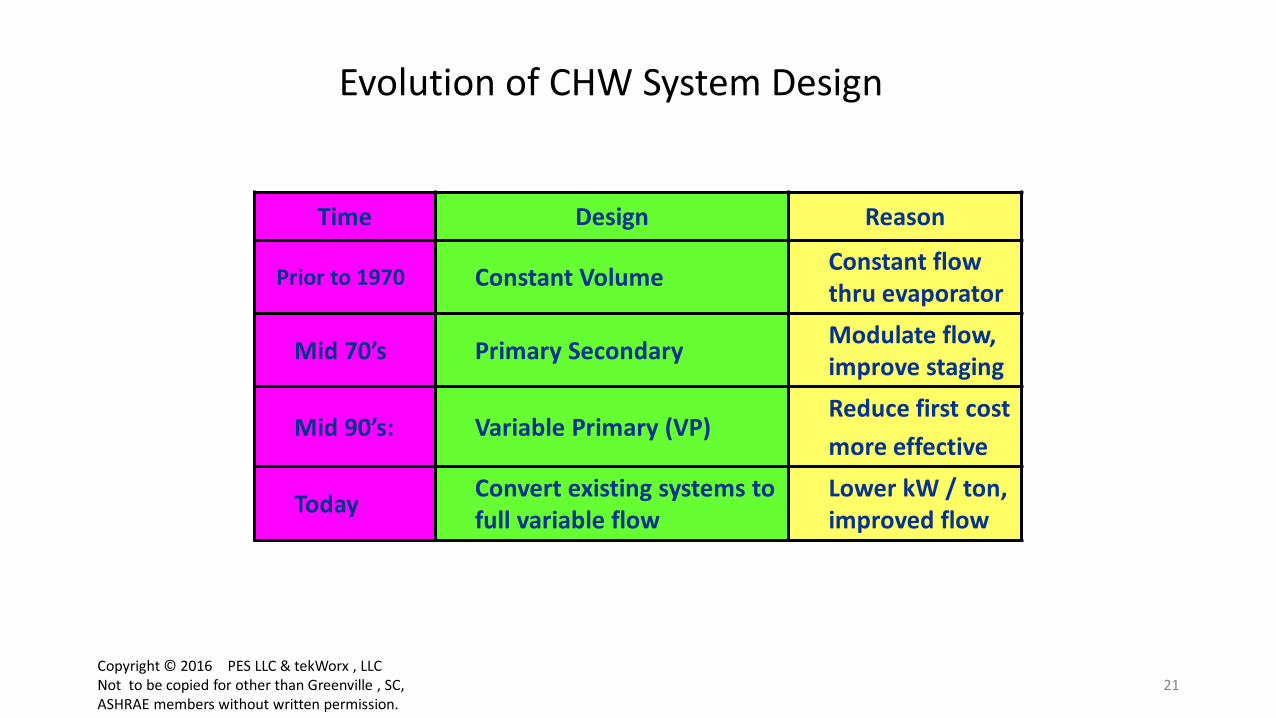
Evolution of CHW System Design
Time Design Reason
Prior to 1970 Constant Volume Constant flow thru evaporator
Mid 70’s Primary Secondary Modulate flow, improve staging
Mid 90’s: Variable Primary (VP) Reduce first cost more effective
Today Convert existing systems to full variable flow
Lower kW / ton, improved flow
21 Copyright © 2016 PES LLC & tekWorx , LLC Not to be copied for other than Greenville , SC, ASHRAE members without written permission.
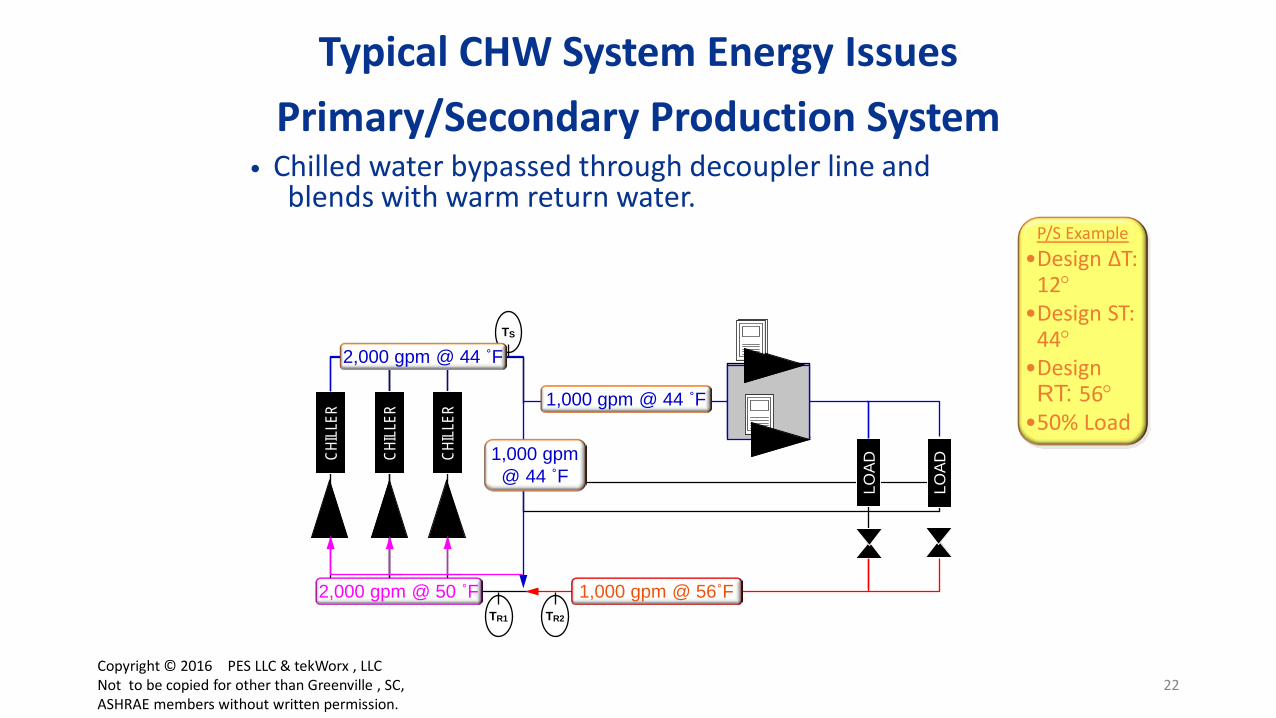
CHILL
ER
CHILL
ER
CHILL
ER
LOAD
LOAD
TR1 TR2
TS
2,000 gpm @ 44 ˚F
1,000 gpm @ 44 ˚F
1,000 gpm @ 44 ˚F
1,000 gpm @ 56˚F 2,000 gpm @ 50 ˚F
P/S Example •Design ΔT:
12° •Design ST:
44° •Design RT: 56°
•50% Load
• Chilled water bypassed through decoupler line and blends with warm return water.
Typical CHW System Energy Issues Primary/Secondary Production System
22 Copyright © 2016 PES LLC & tekWorx , LLC Not to be copied for other than Greenville , SC, ASHRAE members without written permission.
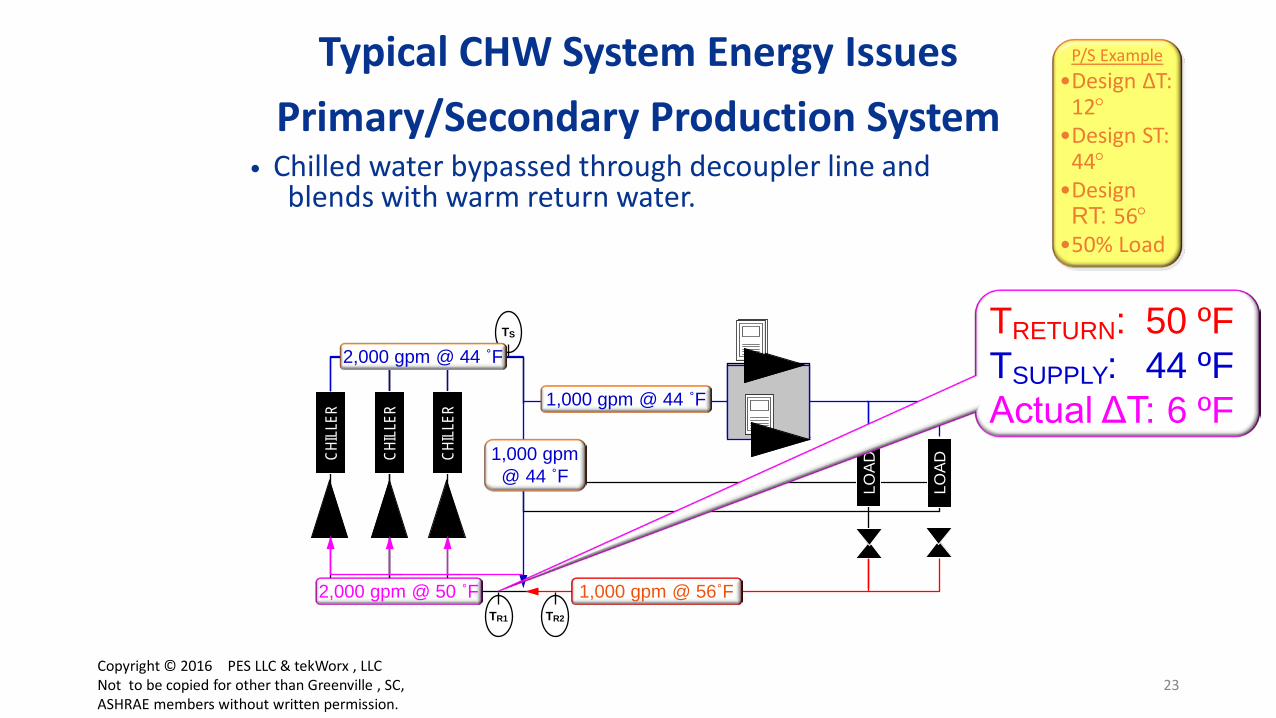
CHILL
ER
CHILL
ER
CHILL
ER
LOAD
LOAD
TR1 TR2
TS
2,000 gpm @ 44 ˚F
1,000 gpm @ 44 ˚F
1,000 gpm @ 44 ˚F
1,000 gpm @ 56˚F 2,000 gpm @ 50 ˚F
P/S Example •Design ΔT:
12° •Design ST:
44° •Design RT: 56°
•50% Load
• Chilled water bypassed through decoupler line and blends with warm return water.
Typical CHW System Energy Issues Primary/Secondary Production System
TRETURN: 50 ºF TSUPPLY: 44 ºF Actual ΔT: 6 ºF
23 Copyright © 2016 PES LLC & tekWorx , LLC Not to be copied for other than Greenville , SC, ASHRAE members without written permission.
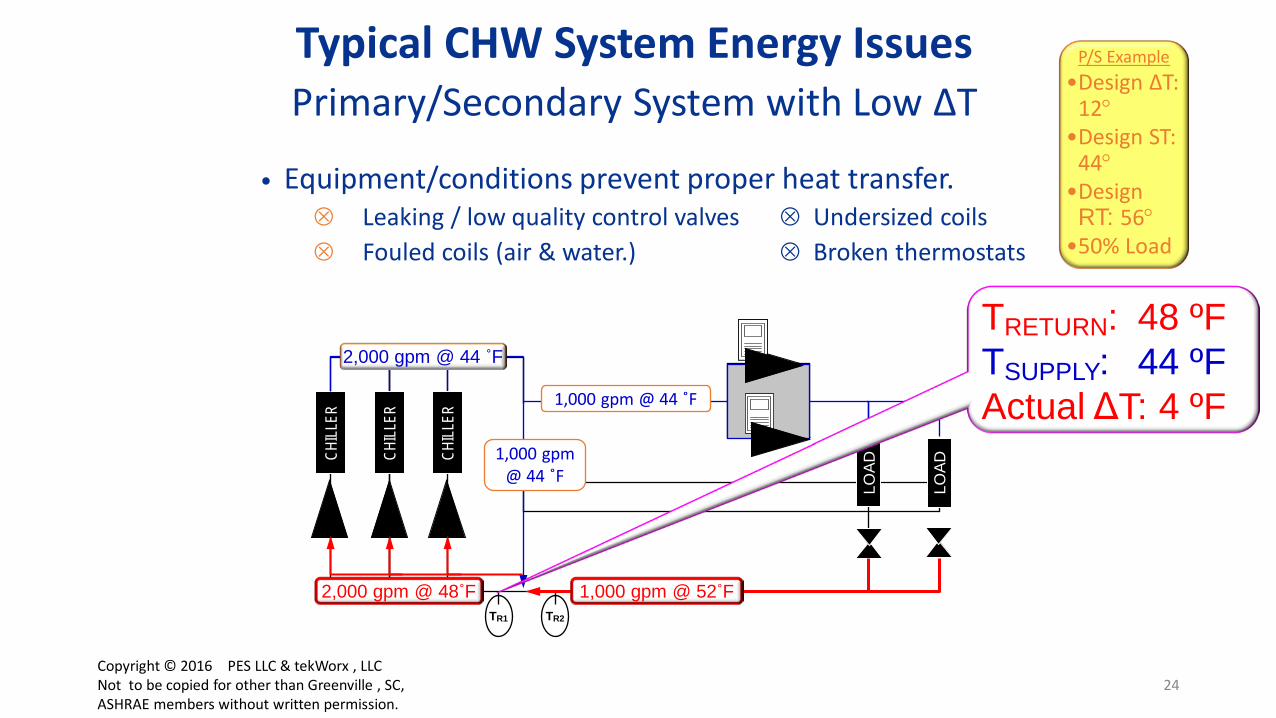
CHILL
ER
CHILL
ER
CHILL
ER
LOAD
LOAD
TR1 TR2
2,000 gpm @ 44 ˚F
1,000 gpm @ 44 ˚F
1,000 gpm @ 44 ˚F
1,000 gpm @ 52˚F
TRETURN: 48 ºF TSUPPLY: 44 ºF Actual ΔT: 4 ºF
2,000 gpm @ 48˚F
• Equipment/conditions prevent proper heat transfer. ⊗ Leaking / low quality control valves ⊗ Undersized coils ⊗ Fouled coils (air & water.) ⊗ Broken thermostats
Typical CHW System Energy Issues Primary/Secondary System with Low ΔT
P/S Example •Design ΔT:
12° •Design ST:
44° •Design RT: 56°
•50% Load
24 Copyright © 2016 PES LLC & tekWorx , LLC Not to be copied for other than Greenville , SC, ASHRAE members without written permission.

CHILL
ER
CHILL
ER
CHILL
ER
LOAD
LOAD
TR1 TR2
2,000 gpm @ 44 ˚F
1,000 gpm @ 44 ˚F
1,000 gpm @ 44 ˚F
1,000 gpm @ 52˚F 2,000 gpm @ 48˚F
• Equipment/conditions prevent proper heat transfer. ⊗ Leaking / low quality control valves ⊗ Undersized coils ⊗ Fouled coils (air & water.) ⊗ Broken thermostats
Typical CHW System Energy Issues Primary/Secondary System with Low ΔT
P/S Example •Design ΔT:
12° •Design ST:
44° •Design RT: 56°
•50% Load
25 Copyright © 2016 PES LLC & tekWorx , LLC Not to be copied for other than Greenville , SC, ASHRAE members without written permission.

CHILL
ER
CHILL
ER
CHILL
ER
LOAD
LOAD
TR1 TR2
2,000 gpm @ 44 ˚F
1,000 gpm @ 44 ˚F
1,000 gpm @ 44 ˚F
1,000 gpm @ 52˚F
TRETURN: 48 ºF TSUPPLY: 44 ºF Actual ΔT: 4 ºF
2,000 gpm @ 48˚F
• Equipment/conditions prevent proper heat transfer. ⊗ Leaking / low quality control valves ⊗ Undersized coils ⊗ Fouled coils (air & water.) ⊗ Broken thermostats
Typical CHW System Energy Issues Primary/Secondary System with Low ΔT
P/S Example •Design ΔT:
12° •Design ST:
44° •Design RT: 56°
•50% Load
26 Copyright © 2016 PES LLC & tekWorx , LLC Not to be copied for other than Greenville , SC, ASHRAE members without written permission.
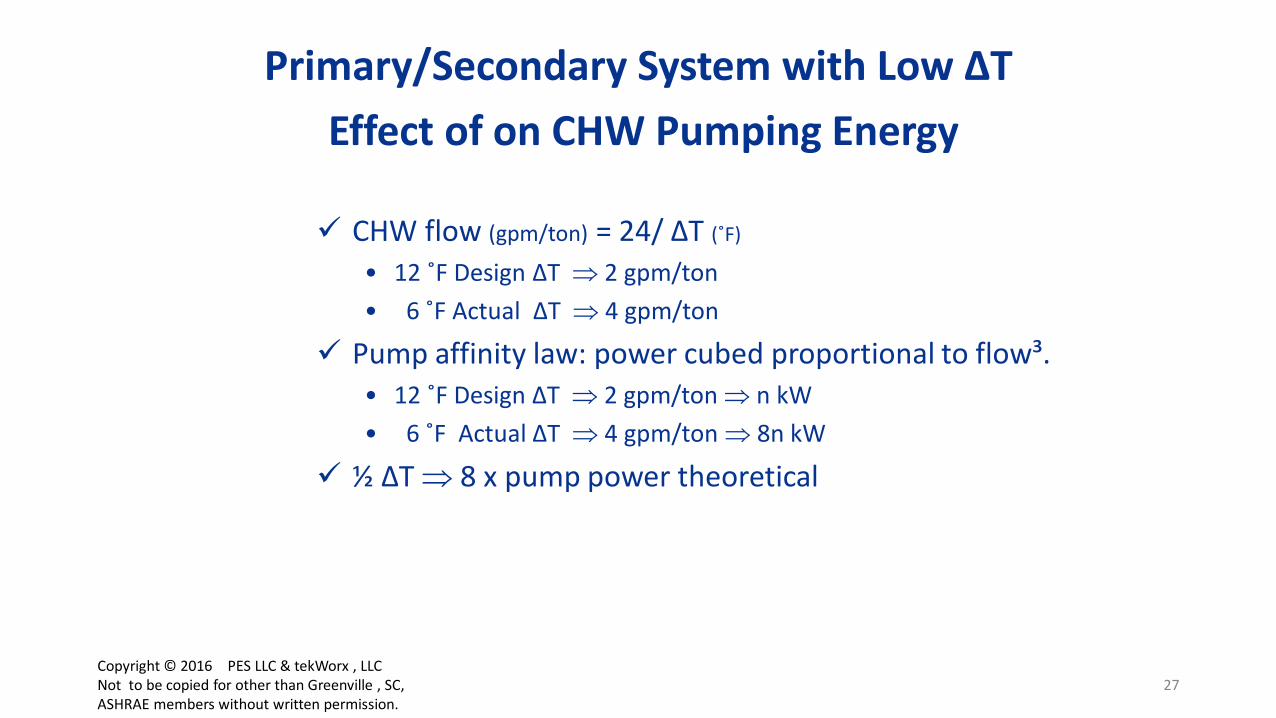
CHW flow (gpm/ton) = 24/ ΔT (˚F)
• 12 ˚F Design ΔT ⇒ 2 gpm/ton • 6 ˚F Actual ΔT ⇒ 4 gpm/ton
Pump affinity law: power cubed proportional to flow³. • 12 ˚F Design ΔT ⇒ 2 gpm/ton ⇒ n kW • 6 ˚F Actual ΔT ⇒ 4 gpm/ton ⇒ 8n kW
½ ΔT ⇒ 8 x pump power theoretical
Primary/Secondary System with Low ΔT Effect of on CHW Pumping Energy
27 Copyright © 2016 PES LLC & tekWorx , LLC Not to be copied for other than Greenville , SC, ASHRAE members without written permission.

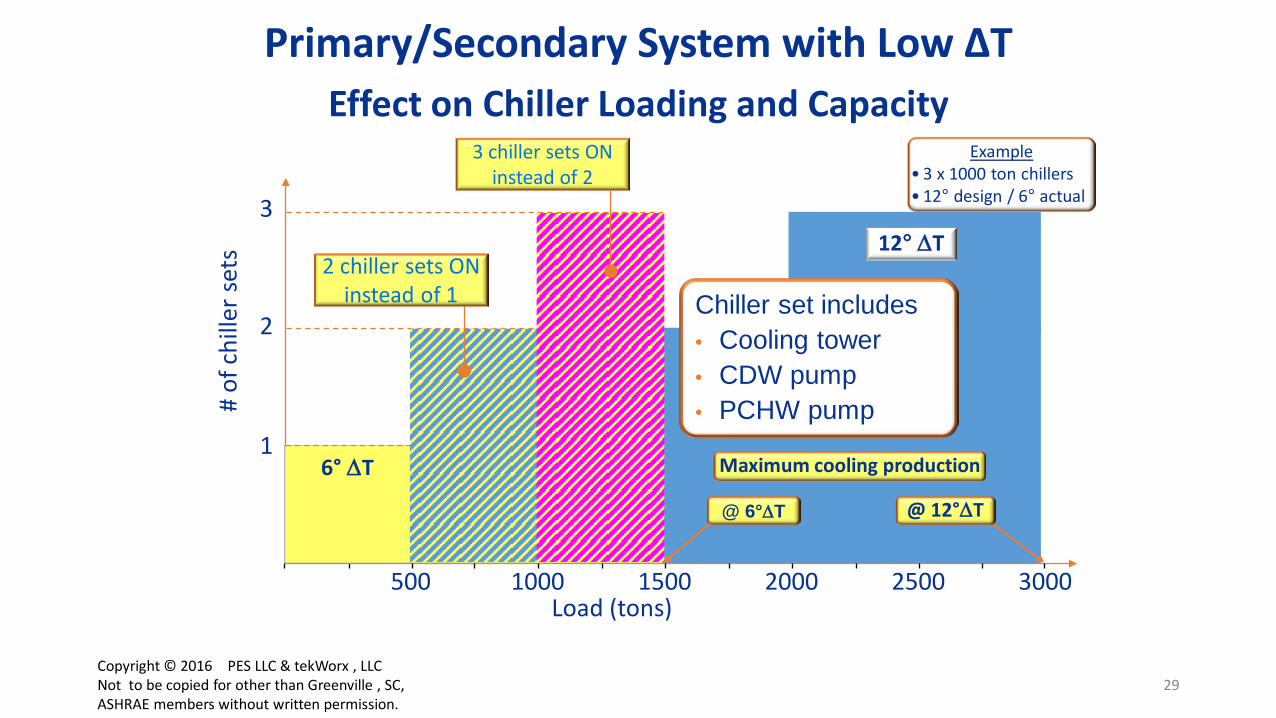
• Chiller tonnage variables = ∆T x q (evaporator flow.) • Design tonnage requires design q (flow) and ΔT …. or increased q (flow) to compensate for decreased ΔT. • Primary loop has constant flow no compensation. • Example: actual ∆T = 6° = 50% = 500 tons
design ∆T = 12° • Two chillers required for loads > 500 tons. • Premature operation of CT fans/pumps. • Chiller kW/ton increases probably.
Primary/Secondary System with Low ΔT Effect on Chiller Loading and Capacity
P/S Example •Design ΔT: 12° •1,000 ton chiller
Chiller Load (ton)
0.5
1.0
0 300 600
0.7
kW /
ton
28 Copyright © 2016 PES LLC & tekWorx , LLC Not to be copied for other than Greenville , SC, ASHRAE members without written permission.
12° ∆T
Example • 3 x 1000 ton chillers • 12° design / 6° actual
@ 6°∆T
Maximum cooling production
@ 12°∆T
# of
chi
ller s
ets
2
1
3
Load (tons) 500 1000 1500 2000 2500 3000
6° ∆T
2 chiller sets ON instead of 1
3 chiller sets ON instead of 2
Chiller set includes • Cooling tower • CDW pump • PCHW pump
Primary/Secondary System with Low ΔT Effect on Chiller Loading and Capacity
29 Copyright © 2016 PES LLC & tekWorx , LLC Not to be copied for other than Greenville , SC, ASHRAE members without written permission.

Optimization Opportunity 3°ΔT Increase Effect on Loading and Capacity
12° ∆T
Example • 3 x 1000 ton chillers • 12° design / 6° actual
# of
chi
ller s
ets
2
1
3
Load (tons) 500 1000 1500 2000 2500 3000
6° ∆T 9° ∆T @ 9°∆T
@ 12°∆T
Sequence Points
Delayed
Available Capacity
Increased
Maximum cooling production
@ 6°∆T
Copyright © 2016 PES LLC & tekWorx , LLC Not to be copied for other than Greenville , SC, ASHRAE members without written permission.

U S Department of Energy Recommendations and
Industrial Chiller Plant Optimization
I. DOE Recommendations & Better Plants Program
II. Chilled Water Plant Optimization
III. Impact of Traditional CHW Plant Design
IV. Methods to Optimize Plant kW/ton
V. Optimization Example: Integrated Primary/Secondary
VI. Questions & Answers
31 Copyright © 2016 PES LLC & tekWorx , LLC Not to be copied for other than Greenville , SC, ASHRAE members without written permission.

Chiller Sequencing & Temp Reset
Tower & Condenser
Pumps
Distribution Pumps
CHW System Optimization Overview • Standard Goal: make enough cold water on a design day.
• Algorithms should utilize real-time values of variables that affect both operation and efficiency: flow, ∆T, DP, kW, etc.
• Automatic, real-time adjustments to optimize kW per ton.
• Energy/Effectiveness Goal: meet demand at the lowest kW per ton.
32 Copyright © 2016 PES LLC & tekWorx , LLC Not to be copied for other than Greenville , SC, ASHRAE members without written permission.

Flow To
tal k
W
100%
Pump kW Sequence Model
One Pump
Two Pumps
Three Pumps
•Model: xyz 6 x 8
•Head: 85 feet
•Flow:1700 GPM
• Adaptive algorithm could auto reset setpoint to minimize pump power.
• Pump speed regulated to meet demand. • # of pumps based on minimum pump power. • Pump kW Sequence Model – based on
specific hydronic system and affinity laws.
Lead pump Lead + Lag pump
kW evaluated after each lag pump sequence operation
ON setpoint for next operation using adaptive algorithm
ON setpoint for 1st sequence operation using model
Lead pump Lead + Lag
pump
CHW System Optimization Opportunity Optimized Control of Variable Speed Pumps
33 Copyright © 2016 PES LLC & tekWorx , LLC Not to be copied for other than Greenville , SC, ASHRAE members without written permission.
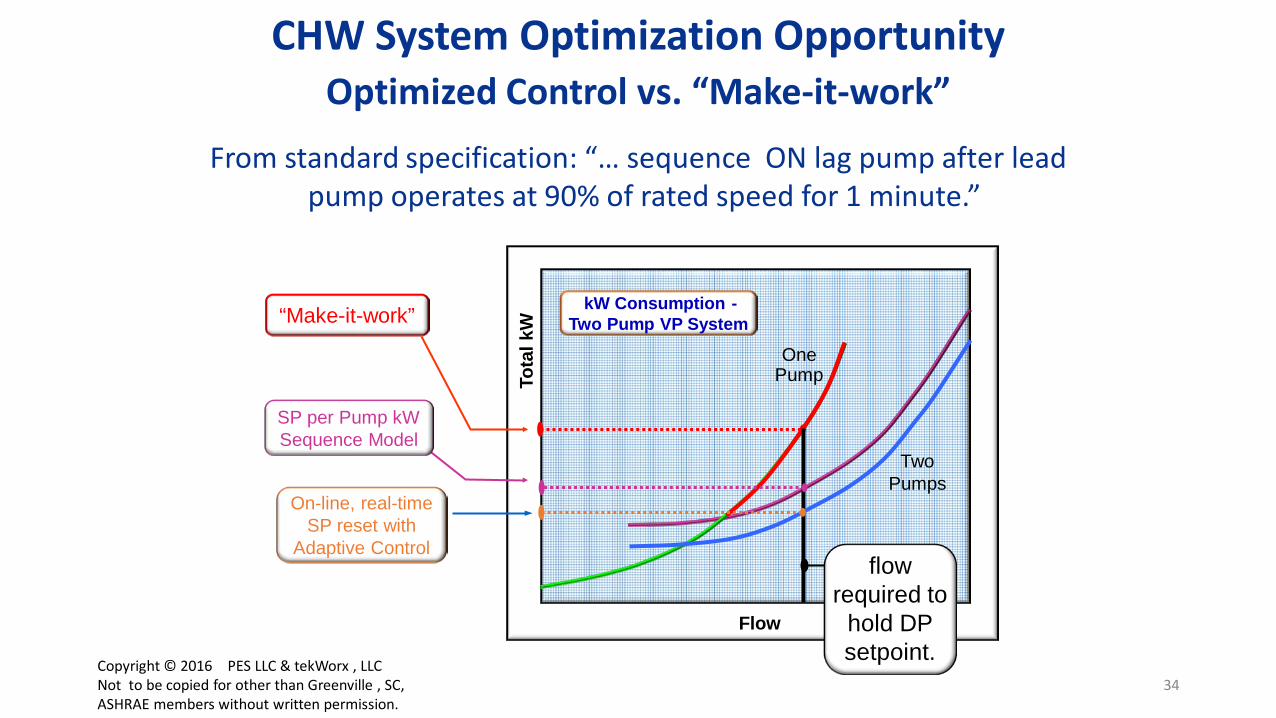
From standard specification: “… sequence ON lag pump after lead pump operates at 90% of rated speed for 1 minute.”
Flow
Tota
l kW
One Pump
Two Pumps
kW Consumption - Two Pump VP System “Make-it-work”
flow required to
hold DP setpoint.
On-line, real-time SP reset with
Adaptive Control
SP per Pump kW Sequence Model
CHW System Optimization Opportunity Optimized Control vs. “Make-it-work”
34 Copyright © 2016 PES LLC & tekWorx , LLC Not to be copied for other than Greenville , SC, ASHRAE members without written permission.
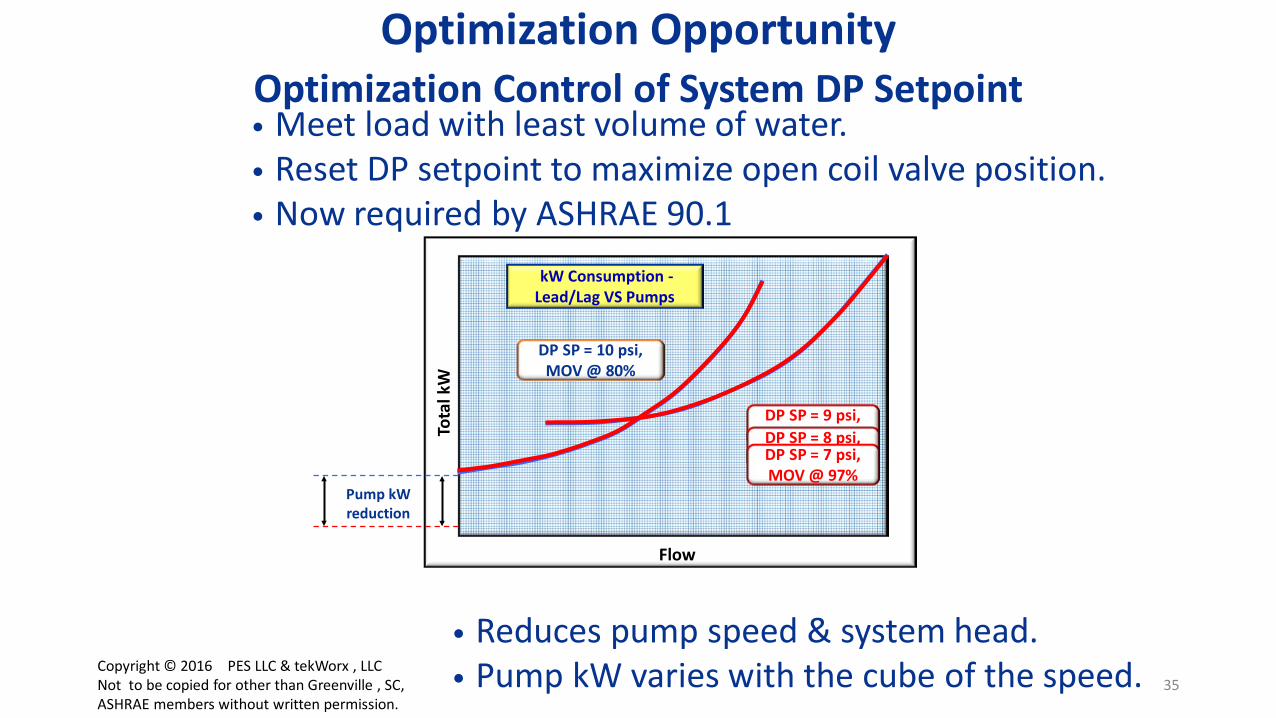
• Reduces pump speed & system head. • Pump kW varies with the cube of the speed.
Flow
Tota
l kW
kW Consumption - Lead/Lag VS Pumps
DP SP = 10 psi, MOV @ 80%
DP SP = 9 psi, MOV @ 90%
Pump kW reduction
DP SP = 8 psi, MOV @ 95% DP SP = 7 psi, MOV @ 97%
• Meet load with least volume of water. • Reset DP setpoint to maximize open coil valve position. • Now required by ASHRAE 90.1
Optimization Opportunity Optimization Control of System DP Setpoint
35 Copyright © 2016 PES LLC & tekWorx , LLC Not to be copied for other than Greenville , SC, ASHRAE members without written permission.

• Control Strategy: balance CT fan speed vs. chiller lift. • Minimizes total kW of chiller and tower.
CT Fan kW Chiller
kW
HIGHER CT FAN SPEED (MORE KW)
COLDER CDWST
LOWER CHILLER
LIFT (LESS KW)
CHILLER KW + CT FAN KW
LOWER TOTAL KW/TON
CHW System Optimization Opportunity Optimized Control of CDW Temperature
CT Fan kW
Chiller kW
36 Copyright © 2016 PES LLC & tekWorx , LLC Not to be copied for other than Greenville , SC, ASHRAE members without written permission.
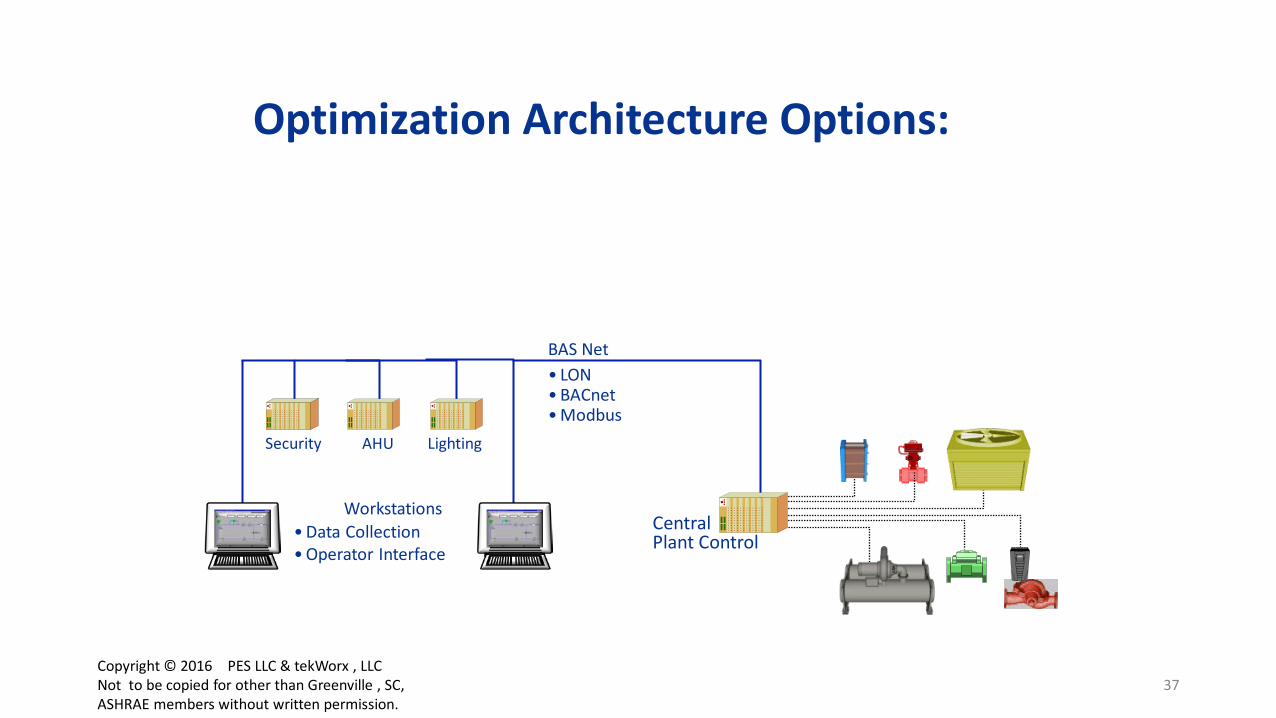
Central Plant Control
Lighting AHU
BAS Net • LON • BACnet • Modbus
Workstations • Data Collection • Operator Interface
Security
Optimization Architecture Options:
37 Copyright © 2016 PES LLC & tekWorx , LLC Not to be copied for other than Greenville , SC, ASHRAE members without written permission.

BAS Network Gateway
PLC
•PLC physically connected to equipment. •Real-time adaptive control and optimization of plant. •Control of the rest of facility and local service
remain with control BAS contractor.
Central Plant Control
Lighting AHU
BAS Net • LON • BACnet • Modbus
Workstations • Data Collection • Operator Interface
Security
Optimization Architecture Options Direct Control Engine (multiple vendors)
38
Industrial HMI
Copyright © 2016 PES LLC & tekWorx , LLC Not to be copied for other than Greenville , SC, ASHRAE members without written permission.

• BAS writes values to PLC. • PLC performs optimization algorithms
and writes status to BAS. • BAS physically controls outputs.
Central Plant Control
Lighting AHU
BAS Net • LON • BACnet • Modbus
Workstations • Data Collection • Operator Interface
Security
BAS Network Gateway
PLC CPU (no I/O)
BAS Network Gateway
PLC CPU (no I/O)
Optimization Architecture Options Supervisory Control Engine - PLC & BAS (Multiple Vendors)
39 Copyright © 2016 PES LLC & tekWorx , LLC Not to be copied for other than Greenville , SC, ASHRAE members without written permission.

U S Department of Energy Recommendations and
Industrial Chiller Plant Optimization
I. DOE Recommendations & Better Plants Program
II. Chilled Water Plant Optimization
III. Impact of Traditional CHW Plant Design
IV. Methods to Optimize Plant kW/ton
V. Optimization Example: Integrated Primary/Secondary
VI. Questions & Answers
40 Copyright © 2016 PES LLC & tekWorx , LLC Not to be copied for other than Greenville , SC, ASHRAE members without written permission.
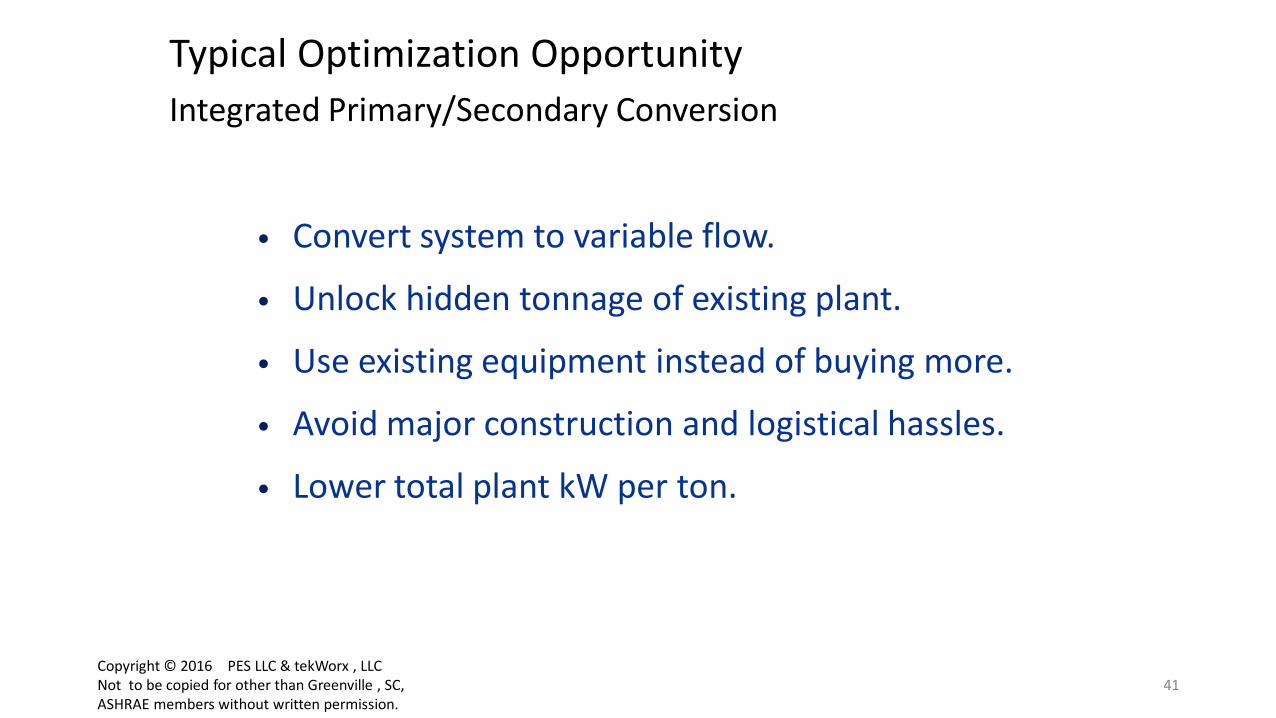
Typical Optimization Opportunity Integrated Primary/Secondary Conversion
• Convert system to variable flow.
• Unlock hidden tonnage of existing plant.
• Use existing equipment instead of buying more.
• Avoid major construction and logistical hassles.
• Lower total plant kW per ton.
41 Copyright © 2016 PES LLC & tekWorx , LLC Not to be copied for other than Greenville , SC, ASHRAE members without written permission.
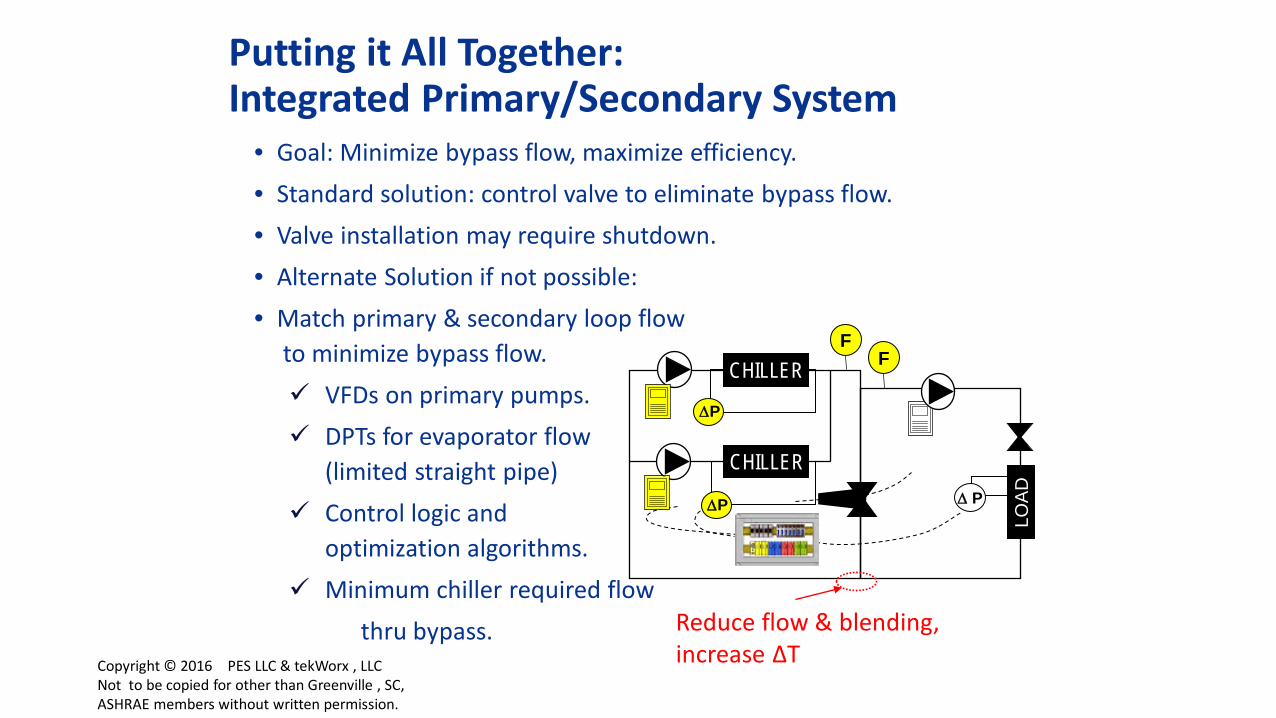
• Goal: Minimize bypass flow, maximize efficiency. • Standard solution: control valve to eliminate bypass flow. • Valve installation may require shutdown. • Alternate Solution if not possible: • Match primary & secondary loop flow
to minimize bypass flow. VFDs on primary pumps. DPTs for evaporator flow
(limited straight pipe) Control logic and
optimization algorithms. Minimum chiller required flow thru bypass.
Putting it All Together: Integrated Primary/Secondary System
∆ P
V
LOAD
∆P
F
∆P
F
CHILLER
CHILLER
Reduce flow & blending, increase ΔT Copyright © 2016 PES LLC & tekWorx , LLC
Not to be copied for other than Greenville , SC, ASHRAE members without written permission.
43
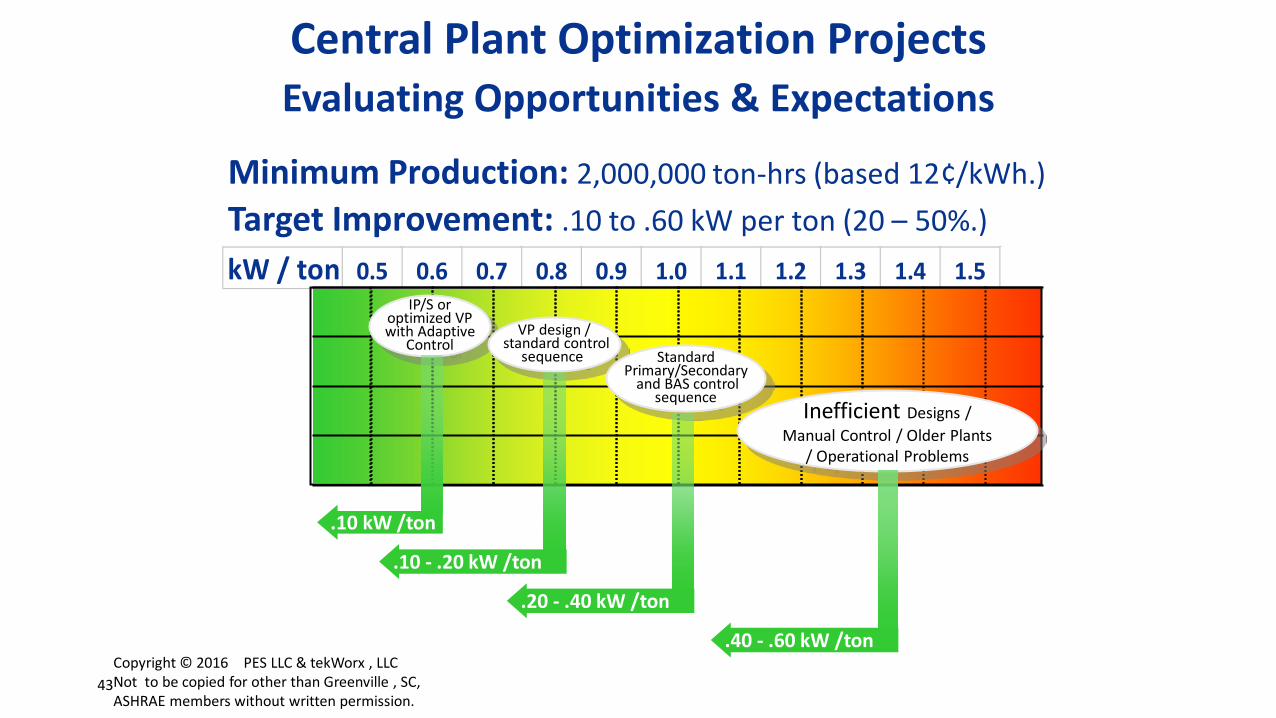
kW / ton 0.5 0.6 0.7 0.8 0.9 1.0 1.1 1.2 1.3 1.4 1.5
Central Plant Optimization Projects Evaluating Opportunities & Expectations
Minimum Production: 2,000,000 ton-hrs (based 12¢/kWh.) Target Improvement: .10 to .60 kW per ton (20 – 50%.)
Inefficient Designs / Manual Control / Older Plants
/ Operational Problems
IP/S or optimized VP with Adaptive
Control VP design /
standard control sequence Standard
Primary/Secondary and BAS control
sequence
.10 kW /ton
.10 - .20 kW /ton
.20 - .40 kW /ton
.40 - .60 kW /ton Copyright © 2016 PES LLC & tekWorx , LLC Not to be copied for other than Greenville , SC, ASHRAE members without written permission.

Annual Mechanical Cooling Operation 8,760 hoursAverage Load 500 tonsAnnual Cooling Production 4,380,000 ton-hoursImprovement Factor - based on: 0.2 kW per ton
Current Hydronic Design:Primary/Secondary
Current Control Strategy: BASOther factors: existing ΔT = 6-8˚F
Energy Savings 876,000 kWhAverage Blended Electricity Cost 0.11$ $ / kWhAnnual Savings 96,360$ Required payback period 3 yearsTotal Project budget up to 289,080$
Chiller Plant Upgrade Worksheet EXAMPLE
Evaluating Optimization Opportunitie$
Copyright © 2016 PES LLC & tekWorx , LLC Not to be copied for other than Greenville , SC, ASHRAE members without written permission.
U S Department of Energy Recommendations and
Industrial Chiller Plant Optimization
I. DOE Recommendations & Better Plants Program
II. Chilled Water Plant Optimization
III. Impact of Traditional CHW Plant Design
IV. Methods to Optimize Plant kW/ton
V. Optimization Example: Integrated Primary/Secondary
VI. Questions & Answers
45 Copyright © 2016 PES LLC & tekWorx , LLC Not to be copied for other than Greenville , SC, ASHRAE members without written permission.

David Pleasants
Principal Pleasants Energy Services LLC
615 Bruton Place South Greensboro NC 27410
336.542.7086 46
Copyright © 2016 PES LLC & tekWorx , LLC Not to be copied for other than Greenville , SC, ASHRAE members without written permission.