U-POST INVESTIGATION - Transportation Research...
11
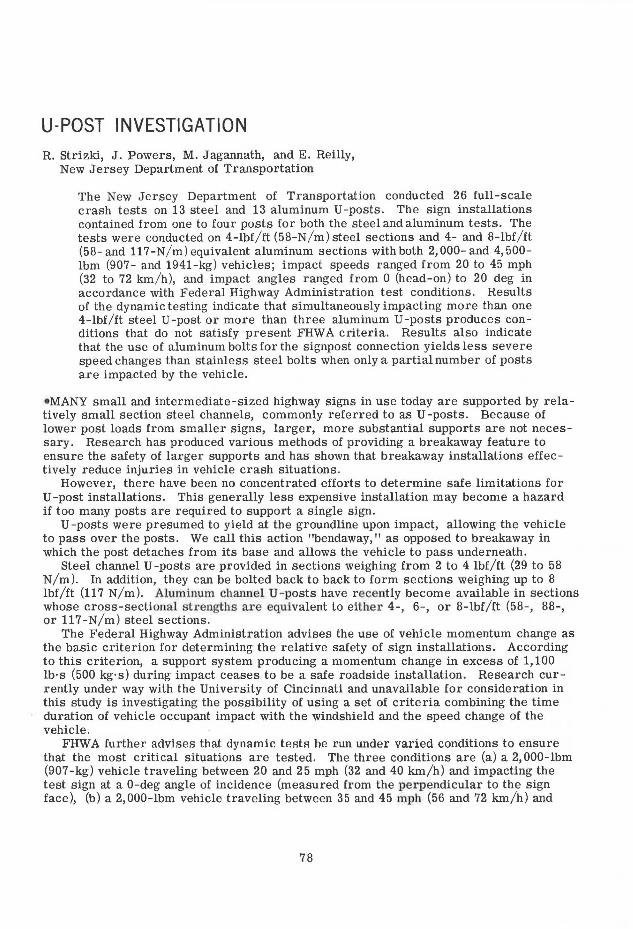
U-POST INVESTIGATION R. Strizki, J. Powers, M. Jagannath, and E. Reilly, New Jersey Department of Transportation The New Jersey Department of Transportation conducted 26 full-scale crash tests on 13 steel and 13 aluminum U-posts. The sign installations contained from one to four posts for both the steel and aluminum tests. The tests were conducted on 4-lbf/ft (58-N/m) steel sections and 4- and 8-lbf/ft (58- and 117-N/m) equivalent aluminum sections with both 2, 000- and 4, 500- lbm (907- and 1941-kg) vehicles; impact speeds ranged from 20 to 45 mph (32 to 72 km/h), and impact angles ranged from 0 (head-on) to 20 deg in accordance with Federal Highway Administration test conditions. Results of the dynamic testing indicate that simultaneously impacting more than one 4-lbf/ft steel U-post or more than three aluminum U-posts produces con- ditions that do not satisfy present FHWA criteria. Results also indicate that the use of aluminum bolts for the connection yields less severe speed changes than stainless steel bolts when only a partial number of posts are impacted by the vehicle. •MANY small and intermediate-sized highway signs in use today are supported by rela- tively small section steel channels, commonly referred to as U-posts. Because of lower post loads from smaller signs, larger, more substantial supports are not neces- sary. Research has produced various methods of providing a breakaway feature to ensure the safety of larger supports and has shown that breakaway installations effec- tively reduce injuries in vehicle crash situations. However, there have been no concentrated efforts to determine safe limitations for U-post installations. This generally less expensive installation may become a hazard if too many posts are required to support a single sign. U -posts were presumed to yield at the groundline upon impact, allowing the vehicle to pass over the posts. We call this action "bendaway," as opposed to breakaway in which the post detaches from its base and allows the vehicle to pass underneath. Steel channel U -posts are provided in sections weighing from 2 to 4 lbf/ft (29 to 58 N/m). In addition, they can be bolted back to back to form sections weighing up to 8 lbf/ft (117 N/m). Aluminum channel U- posts have recently become available in sections whose cross-sectional strengths are equivalent to either 4-, 6-, or 8-lbf/ft (58-, 88-, or 117-N/m) steel sections. The Federal Highway Administration advises the use of vehicle momentum change as the basic criterion for determining the relative safety of sign installations. According to this criterion, a support system producing a momentum change in excess of 1, 100 lb·s (500 kg·s) during impact ceases to be a safe roadside installation. Research cur- rently under way with the University of Cincinnati and unavailable for consideration in this study is investigating the possibility of using a set of criteria combining the time duration of vehicle occupant impact with the windshield and the speed change of the vehicle. FHWA further advises that dynamic teRtfl be run under varied conditions to ensure that the most critical situations are tested. The three conditions are (a) a 2,000-lbm (907-kg) vehicle traveling between 20 and 25 mph (32 and 40 km/h) and impacting the test sign at a 0-deg angle of incidence (measured from the perpendicular to the sign face), (b) a 2,000-lbm vehicle traveling between 35 and 45 mph (56 and 72 km/h) and 78
-
Upload
vuongkhanh -
Category
Documents
-
view
217 -
download
1
Transcript of U-POST INVESTIGATION - Transportation Research...
U-POST INVESTIGATION R. Strizki, J. Powers, M. Jagannath, and E. Reilly,
New Jersey Department of Transportation
The New Jersey Department of Transportation conducted 26 full-scale crash tests on 13 steel and 13 aluminum U-posts. The sign installations contained from one to four posts for both the steel and aluminum tests. The tests were conducted on 4-lbf/ft (58-N/m) steel sections and 4- and 8-lbf/ft (58- and 117-N/m) equivalent aluminum sections with both 2, 000- and 4, 500-lbm (907- and 1941-kg) vehicles; impact speeds ranged from 20 to 45 mph (32 to 72 km/h), and impact angles ranged from 0 (head-on) to 20 deg in accordance with Federal Highway Administration test conditions. Results of the dynamic testing indicate that simultaneously impacting more than one 4-lbf/ft steel U-post or more than three aluminum U-posts produces conditions that do not satisfy present FHWA criteria. Results also indicate that the use of aluminum bolts for the si~npost connection yields less severe speed changes than stainless steel bolts when only a partial number of posts are impacted by the vehicle.
•MANY small and intermediate-sized highway signs in use today are supported by relatively small section steel channels, commonly referred to as U-posts. Because of lower post loads from smaller signs, larger, more substantial supports are not necessary. Research has produced various methods of providing a breakaway feature to ensure the safety of larger supports and has shown that breakaway installations effectively reduce injuries in vehicle crash situations.
However, there have been no concentrated efforts to determine safe limitations for U-post installations. This generally less expensive installation may become a hazard if too many posts are required to support a single sign.
U -posts were presumed to yield at the groundline upon impact, allowing the vehicle to pass over the posts. We call this action "bendaway," as opposed to breakaway in which the post detaches from its base and allows the vehicle to pass underneath.
Steel channel U -posts are provided in sections weighing from 2 to 4 lbf/ft (29 to 58 N/m). In addition, they can be bolted back to back to form sections weighing up to 8 lbf/ft (117 N/m). Aluminum channel U-posts have recently become available in sections whose cross-sectional strengths are equivalent to either 4-, 6-, or 8-lbf/ft (58-, 88-, or 117-N/m) steel sections.
The Federal Highway Administration advises the use of vehicle momentum change as the basic criterion for determining the relative safety of sign installations. According to this criterion, a support system producing a momentum change in excess of 1, 100 lb·s (500 kg·s) during impact ceases to be a safe roadside installation. Research currently under way with the University of Cincinnati and unavailable for consideration in this study is investigating the possibility of using a set of criteria combining the time duration of vehicle occupant impact with the windshield and the speed change of the vehicle.
FHWA further advises that dynamic teRtfl be run under varied conditions to ensure that the most critical situations are tested. The three conditions are (a) a 2,000-lbm (907-kg) vehicle traveling between 20 and 25 mph (32 and 40 km/h) and impacting the test sign at a 0-deg angle of incidence (measured from the perpendicular to the sign face), (b) a 2,000-lbm vehicle traveling between 35 and 45 mph (56 and 72 km/h) and
78
79
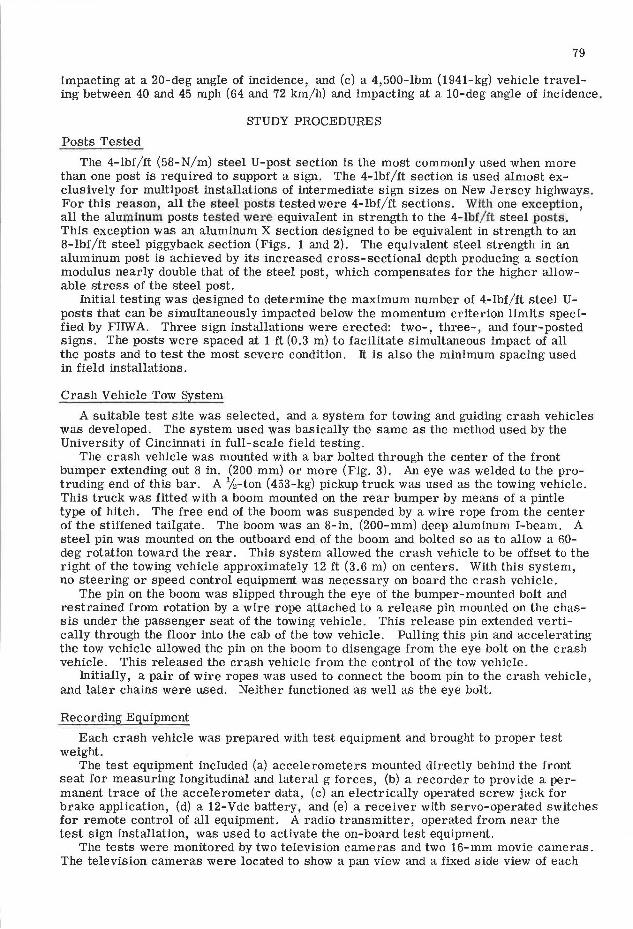
impacting at a 20-deg angle of incidence, and (c) a 4,500-lbm (1941-kg) vehicle traveling between 40 and 45 mph (64 and 72 km/h) and impacting at a 10-deg angle of incidence .
STUDY PROCEDURES
Posts Tested
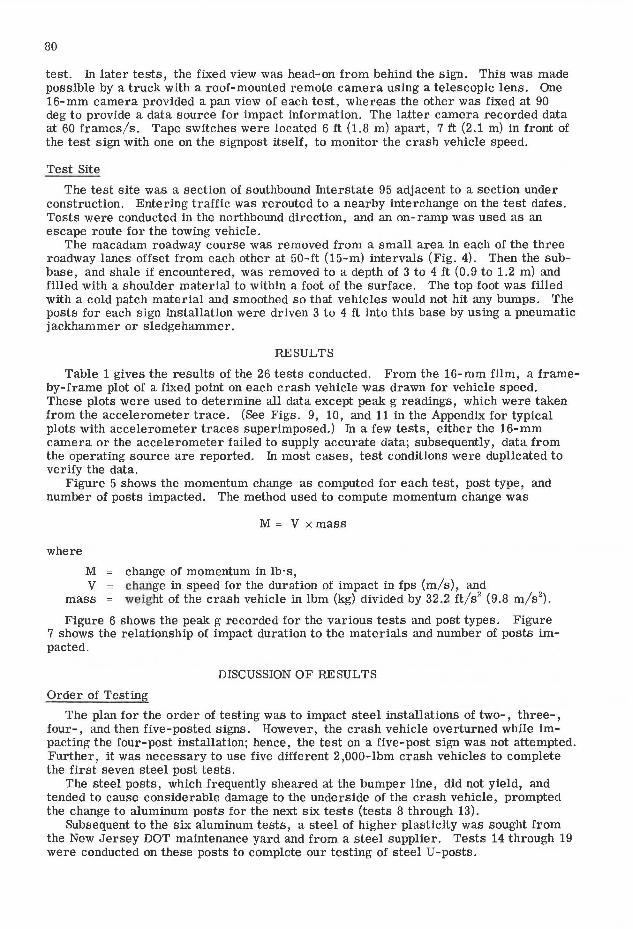
The 4-lbf/ft (58-N/m) steel U-post section is the most commonly used when more than one post is required to support a sign. The 4-lbf/ft section is used almost exclusively for multipost installations of intermediate sign sizes on New Jersey highways . For this r eason, all the steel posts tested were 4-lbf/ft sections. With one exception, all the aluminum posts tested wexe equivalent in strength to the 4- lbf/ ft steel posts . This exception was an aluminum X section designed to be equivalent in strength to an 8-lbf/ft steel piggyback section (Figs. 1 and 2). The equivalent steel strength in an aluminum post is achieved by its increased cross-sectional depth producing a section modulus nearly double that of the steel post, which compensates for the higher allowable stress of the steel post.
Initial testing was designed to determine the maximum number of 4-lbf/ft steel Uposts that can be simultaneously impacted below the momentum criterion limits specified by FHW A. Three sign installations were erected: two-, three-, and four-posted signs. The posts were spaced at 1 ft (0.3 m) to facilitate simultaneous impact of all the posts and to test the most severe condition. It is also the minimum spacing used in field installations.
Crash Vehicle Tow System
A suitable test site was selected, and a system for towing and guiding crash vehicles was developed. The system used was basically the same as the method used by the University of Cincinnati in full-scale field testing.
The crash vehicle was mounted with a bar bolted through the center of the front bumper extending out 8 in. (200 mm) or more (Fig. 3). An eye was welded to the protruding end of this bar. A %-ton (453-kg) pickup truck was used as the towing vehicle. This truck was fitted with a boom mounted on the rear bumper by means of a pintle type of hitch. The free end of the boom was suspended by a wire rope from the center of the stiffened tailgate. The boom was an 8-in. (200-mm) deep aluminum I-beam. A steel pin was mounted on the outboard end of the boom and bolted so as to allow a 60-deg rotation toward the rear. This system allowed the crash vehicle to be offset to the right of the towing vehicle approximately 12 ft (3.6 m) on centers. With this system, no steering or speed control equipment was necessary on board the crash vehicle.
The pin on the boom was slipped through the eye of the bumper-mounted bolt and restrained from rotation by a wire rope attached to a release pin mounted on the chassis under the passenger seat of the towing vehicle. This release pin extended vertically through the floor into the cab of the tow vehicle. Pulling this pin and accelerating the tow vehicle allowed the pin on the boom to disengage from the eye bolt on the crash vehicle. This released the crash vehicle from the control of the tow vehicle.
Initially, a pair of wire ropes was used to connect the boom pin to the crash vehicle, and later chains were used. Neither functioned as well as the eye bolt.
Recording Equipment
Each crash vehicle was prepared with test equipment and brought to proper test weight.
The test equipment included (a) accelerometers mounted directly behind the front seat for measuring longitudinal and lateral g forces, (b) a recorder to provide a permanent trace of the accelerometer data, (c) an electrically operated screw jack for brake application, (d) a 12-Vdc battery, and (e) a receiver with servo-operated switches for remote control of all equipment. A radio transmitter, operated from near the test sign installation, was used to activate the on-board test equipment.
The tests were monitored by two television cameras and two 16-mm movie cameras. The television cameras were located to show a pan view and a fixed side view of each
80
test. In later tests, the fixed view was head-on from behind the sign. This was made possible by a truck with a roof-mounted remote camera using a telescopic lens. One 16-mm camera provided a pan view of each test, whereas the other was fixed at 90 deg to provide a data source for impact information. The latter camera recorded data at 60 frames/s. Tape switches were located 6 ft (1.8 m) apart, 7 ft (2.1 m) in front of the test sign with one on the signpost itself, to monitor the crash vehicle speed.
Test Site
The test site was a section of southbound Interstate 95 adjacent to a section under construction. Entering traffic was rerouted to a nearby interchange on the test dates. Tests were conducted in the northbound direction, and an on-ramp was used as an escape route for the towing vehicle.
The macadam roadway course was removed from a small area in each of the three roadway lanes offset from each other at 50-ft (15-m) intervals (Fig. 4). Then the subbase, and shale if encountered, was removed to a depth of 3 to 4 ft (0.9 to 1.2 m) and filled with a shoulder material to within a foot of the surface. The top foot was filled with a cold patch material and smoothed so that vehicles would not hit any bumps. The posts for each sign installation were driven 3 to 4 ft into this base by using a pneumatic jackhammer or sledgehammer.
RESULTS
Table 1 gives the results of the 26 tests conducted. From the 16-mm film, a frameby-frame plot of a fixed point on each crash vehicle was drawn for vehicle speed. These plots were used to determine all data except peak g readings, which were taken from the accelerometer trace. (See Figs. 9, 10, and 11 in the Appendix for typical plots with accelerometer traces superimposed.) In a few tests, either the 16-mm camera or the accelerometer failed to supply accurate data; subsequently, data from the operating source are reported. In most cases, test conditions were duplicated to verify the data.
Figure 5 shows the momentum change as computed for each test, post type, and number of posts impacted. The method used to compute momentum change was
where
M v
mass
M = V xmass
change of momentum in lb·s, chauge in speed for the duration of impact in fps (m/s), and weight of the crash vehicle in lbm (kg) divided by 32.2 ft/s 2 (9.8 m/s 2
).
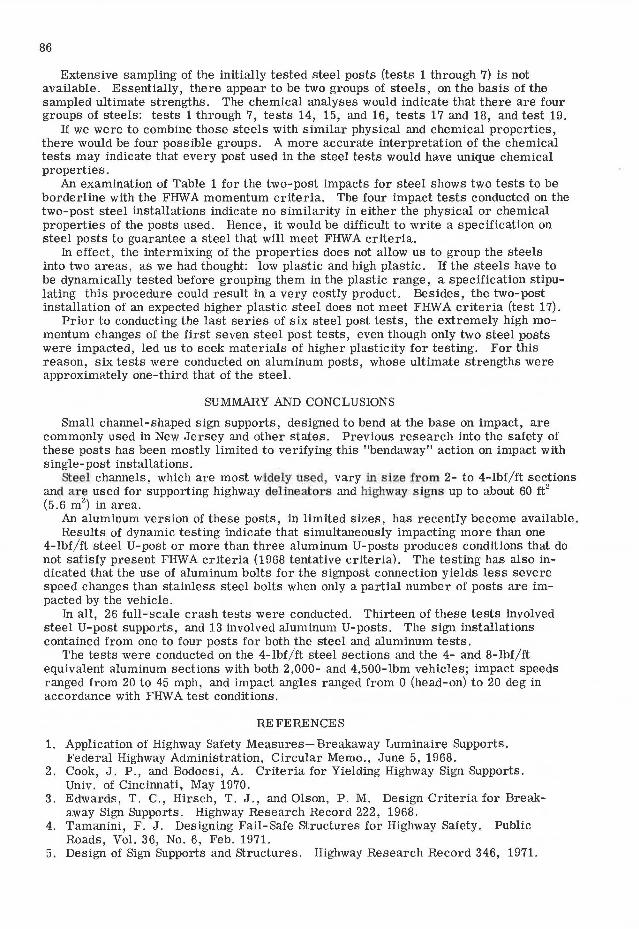
Figure 6 shows the peak g recorded for the various tests and post types. Figure 7 shows the relationship of impact duration to the materials and number of posts impacted.
DISCUSSION OF RESULTS
Order of Testing
The plan for the order of testing was to impact steel installations of two-, three-, four-, and then five-posted signs. However, the crash vehicle overturned while impacting the four-post installation; hence, the test on a five-post sign was not attempted. Further, it was necessary to use five different 2,000-lbm crash vehicles to complete the first seven steel post tests.
The steel posts, which frequently sheared at the bumper line, did not yield, and tended to cause considerable damage to the underside of the crash vehicle, prompted the change to aluminum posts for the next six tests (tests 8 through 13).
Subsequent to the six aluminum tests, a steel of higher plasticity was sought from the New Jersey DOT maintenance yard and from a steel supplier. Tests 14 through 19 were conducted on these posts to complete our testing of steel U-posts.
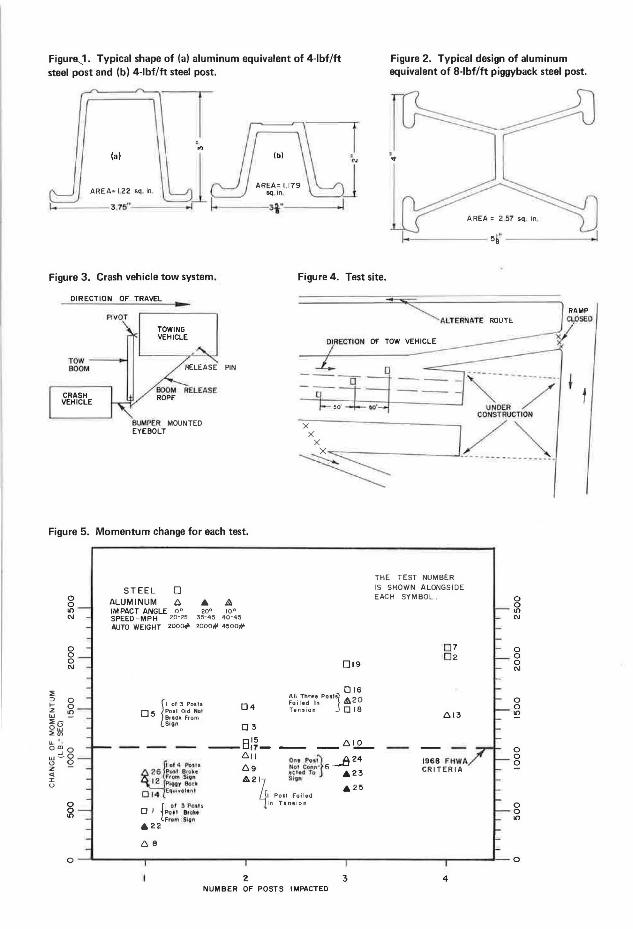
Figure.___1. Typical shape of (a) aluminum equivalent of 4-lbf/ft steel post and (b) 4-lbf/ft steel post.
Figure 2. Typical design of aluminum equivalent of 8-lbf/ft piggyback steel post.
(a)
AREA; 1.22 sq. in.
i.------3 75" _____ ,
Figure 3. Crash vehicle tow system.
DIRECTION OF TRAVEL
Figure 4. Test site.
' ...
PIVOT ALTERNATE ROUTE
CRASH VEHICLE
TOWING VEHICLE
RELEASE
PIN
DIRECTION OF TOW
a
UNDER / CONSTRUCTION
BUMPER MOUNTED EYE BOLT
~---.JI,_/ __
Figure 5. Momentum change for each test.
0 0 It') N
0 0 0 N
STEEL 0 ALUMINUM C:. A A IM PACT ANGLE o0 20° 10° SPEED - MPH 20·25 3 5-45 40·45
AUTO WEIGHT 2000# 2000# 4500#
0 5 Posl Did Nol Il of 3 Posis
Brto~ From Si on
04
03
019
016 All Three Po1IJ ,. 20 Failed In m Tension D 18
---B1~-t::. 11 Ont Po•il __fj 24 69 :~t'.f~tJ 6 .23
A2 q "'~" ,a.25 I Po11 Foiled In Tension
2 3 NUMBER OF POSTS IMPACTED
THE TEST NUMBER IS SHOWN ALONGSIDE EACH SYMBOL .
0 7 02
C:.13
1968 F HWA CRITERIA
4
0 0 It')
N
0 0 0 N
0 0 It')
0 0 0
0 0 It')
RAMP O.,OSEO
;;
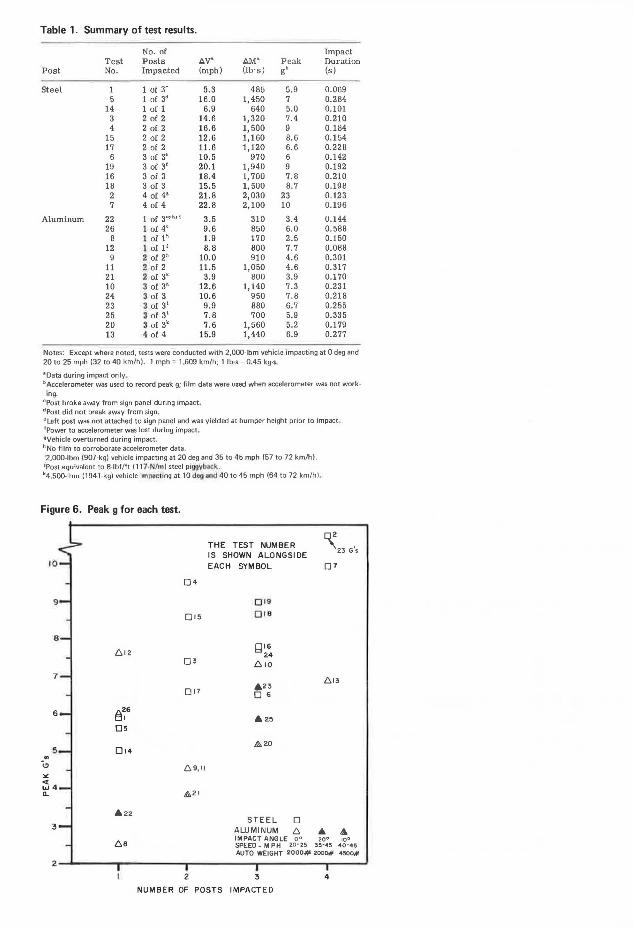
Table 1. Summary of test results.
No. of Impact Test Posts AV" AM• P eak Duration
Post No. Impacted (mph) (lb·s) g' (s)
Steel 1 1 ol 3° 5.3 48[) G.9 0.009 5 1 of 3' 16. 0 1,450 7 0.284
14 1 of 1 6.9 640 5.0 0.101 3 2 of 2 14.6 1,320 7.4 0.210 4 2 of 2 16. 6 1,500 9 0.184
15 2 of 2 12 .6 1,160 8.6 0.154 17 2 o[ 2 11. 6 1,120 6.6 0.228
6 3 of 3' 10.5 970 6 0.142 19 3 o[ 3' 20 .1 1,940 9 0.192 16 3 of 3 18. 4 1, 700 7.8 0.210 18 3 o[ 3 15.5 1,500 8. 7 0.198
2 4 of 4' 21.8 2,030 23 0.123 7 4 of 4 22 .8 2,100 10 0.196
Aluminum 22 1 of 3c1hJi 3.5 310 3.4 0.144 26 1 of 4' 9.6 850 6.0 0.588
8 I of 1" 1.9 170 2.5 0.150 12 I of 1' 8.8 800 7.7 0.088
9 2. of 2" 10.0 910 4.6 0.301 11 2 of 2 11 .5 1,050 4.6 0.317 21 2 of 3' 3.9 800 3.9 0.170 10 3 of 3" 12.6 1,140 7.3 0.231 24 3 of 3 10.6 950 7.8 0.218 23 3 of 31 9.9 880 6.7 0.255 25 3 of 3' 7.8 700 5.9 0.335 20 3 of 3' 7 .6 1,560 5.2 0.179 13 4 of 4 15.9 1,440 6.9 0.277
Notes: Except where noted, tests were conducted with 2,000-lbm vehicle impacting at 0 deg and 20 to 25 mph (32 to 40 km/h) . 1 mph = 1.609 km/h; 1 lb·s = 0 .45 kg·S.
fl Data during impact only , bAccelerometer was used to record peak g; film data were used when accelerometer was not working.
cPost broke away from sign panel during impact. dPost did not break away from sign. e l..2ft post was not attached to sign panel and was yielded at bumper height prior to impact. 'Power to accelerometer was lost during impact. 9Vehicle overturned during impact. 11 No film to corroborate acc:elerometer data. ;2,000·lbm (907-kg) veh icle impacting at 20 deg and 35 to 45 mph (57 to 72 km/h). iPost equivalent to B·lbf/ft (111 ·N/ml steel piQ9VbKk. '4.500-lbm (194 Hg) vehicle irnp;ictlng at 10 dog ond 40 to 45 mph (64 to 72 km/h) .
Figure 6. Peak g for each test.
THE TEST NUMBER ~23 G's IS SHOWN ALONGSIDE
10 EACH SYMBOL 07
04
9 019
015 0 18
8
612 Q 16
24 03 610
7 613
623 017 06
6 8~6 A25 05
5 014 &.20
.. -<!>
69,11
" c( i.J4 Cl. £:,21
A22 STEEL 0
3 ALUMINUM 6 .. 4 6e
IMPACT ANGLE o 0 20• 10• SPEED-MPH 20-25 35- .. 5 .. 0-45
AUTO WEIGHT 2000# 2000# 4500#
2
2 3 4
NUMBER OF POSTS IMPACTED

83
Tests 8 through 13 were conducted on aluminum posts, and vehicle damage was so minimal that only one 2,000-lbm vehicle was used for all the tests. Even after impacting four posts (test 13), the vehicle was considered usable for further tests with one minor repair-freeing the hood latch from the grille work.
The preliminary results of these 19 tests (13 with steel and 6 with aluminum) indicated that the aluminum posts gave consistently better results than the steel samples tested. Therefore, the last seven tests (tests 20 through 26) were conducted with aluminum posts. Five of these seven tests were designed to give information on increased speeds and angles of impact. The other two tests were designed to duplicate previous post-impact conditions. ill addition, the post spacing was increased to that that would be found in actual installations for some of these latter tests.
Peak g Force
The symbol g refers to the constant acceleration due to gravity (32.2 ft/s 2 or 9.8 m/s2
). For a vehicle that decelerates at 128.8 ft/s 2 (39.26 m/s2), there would be a
negative force exerted on the vehicle of 4 g. There are three factors to consider with deceleration forces: the actual peak g
reading, the time duration of the g reading, and the onset rate. Research conducted by J. P. stapp over a period of 4 years and later work by others
resulted in a composite graph indicating that the human body can tolerate 40 g in deceleration for up to 40 msec without injury. Additional work by New York state concluded that a 10-g deceleration lasting longer than 50 msec may produce injury to a human body.
The onset rate was also investigated by Stapp, who suggested a 1,000-g/s value as a tolerable rate. FHWA suggests 500 g/s as a more conservative value.
ill this study, the only other measure of deceleration (besides the accelerometer tracing) is the speed change and calculated deceleration from frame to frame on the 16-mm film. From a review of the study films, it is safe to assume that maximum deceleration took place over a period of 17.5 msec (time between 16-mm frames). The more conservative onset rate of 500 g/s would permit a peak g force of approximately 8.7.
A review of Table 1 indicates that only four tests resulted in g forces exceeding 8. 7, and three of these were less than 10 peak g. These latter g readings are far below the allowable peaks suggested by stapp.
Momentum Change
The change in momentum is directly a function of the weight of the vehicle and the change in speed of the vehicle during impact. It is obvious that the speed parameter is more than minimally affected by certain factors. Those factors most readily defined are the post material and the number of posts impacted.
Less obvious but important conditions that also have a substantial effect on the speed change are the angle of impact, the bolt types used for the signpost connection, and the embedment of the posts (2).
Of the posts tested, there appear to be two distinct regions for the ranges of momentum change. Although this is not obvious from Figure 5, Figure 8 shows this feature in a plot of momentum change and duration of impact. The variation of momentum change in Figure 8 (for each material type) is mainly a function of the number of posts simultaneously impacted, whereas the variation in impact duration is mainly a function of the conditions of impact (e.g., number of posts of an installation impacted or angle of impact).
Most of the data samples shown in Figure 8 are for the 2,000-lbm (907-kg) vehicle. The 4,500-lbm (1941-kg) vehicle was only used to satisfy FHWA test conditions, inasmuch as towing this vehicle at 45 mph was hazardous. Hence, only the comparison of tests 20 and 21 can be made for the heavier vehicle. Although test 20 yielded a very high momentum change, the low peak g and speed change put this test in the acceptable region (less than 8.5 g) of the other impacts of three aluminum posts.

Figure 7. Impact duration for each test.
( MBMC. ) STEEL 0 626
0.4 ALUMINUM 6 • A IMPACT ANGLE o' 20' 10' SPEED - MPH 20-25 3~·~5 40"4&
AUTO WEIGHT 2000# 2ooo"" 111~
.25
611 0 .3 69
O• 613
cj UJ
~ •" z 0 610 t:: 017 <t 624 0::: 0> 01• ::> Cl 0.2 El 18 01 19 I-u O• Jt.20
~ IJ, 21 ::!: 015
i~2 O•
02
0.1 014 612
O• THE TEST NUMBER IS SHOWN ALONGSIDE EACH SYMBOL .
0 .0 -
2 3 4
NUMBER OF POSTS IMPACTED
Figure 8. Relationship between change of momentum and duration of impact.
0 0
"' N
0 0 0 N
0 0 Ill
0
STEEL 0 ALUMINUM 6
0.05 0 .10 0 ,15 0 .20 IMPACT DURATION
(SECONDS)
0 .25
THE TEST NUMBER IS SHOWN ALONGSIDE EACH SYMBOL .
0 30 0 .35
RANGE Of
ALUM I NU
0 .40
(.588 sec)
626

85
Aluminum Versus steel Bolts
The comparison of aluminum and steel bolts is empirically possible when the crash vehicle impacts a partial number of posts of a test installation. If the impacted post (or posts) does not separate from the sign (i.e., the bolts do not fail), the sign acts as a structural member tying all the posts together. The effective resistance to the impacting vehicle is then greater than the number of posts impacted when a partial number of posts is impacted. There were five tests where fewer than all the posts of a multipost installation were impacted (tests 1, 5, 21, 22, and 26).
Two steel bolts per post, with washers at the sign face, were used to attach the posts to the sign panel in three tests: tests 1, 5, and 26. Only one post was impacted in each of these three tests. In all, only two of the six bolts involved broke immediately upon impact, both on the same post. The post was the one impacted in test 1, a steel post test. The post yielded at the base and allowed the car to pass easily. As a result, the momentum change was very low.
In test 5, impact conditions were identical. However, the bolts did not break. Consequently, the post did not yield at all, severe damage was done to the vehicle, and the resulting momentum change was excessively high for a one-post impact. The effect of the bolts remaining intact was to offer, to some extent, the resistance of the other two posts to the impacting vehicle.
In test 26, aluminum posts were used to support a 4- x 8-ft (1.2- x 2.4-m) sign, and the posts were spaced at 2 ft (0.6 m) rather than at 1 ft as in tests 1 and 5. Steel bolts with washers at the sign face were again employed. The bottom bolt did not break immediately, and, consequently, the post failed in tension near the base. The top bolt never broke, and the post, which hooked on the front end of the test vehicle, failed again in tension where the base of the sign panel was bolted. The momentum change was again high for a one-post impact. Again, the resistance of more than one post was felt by the impacting vehicle.
From the description of tests 1, 5, and 26, the advantage of the post bolts breaking upon impact can be clearly seen, regardless of post material, when fewer than all the posts of an installation are impacted.
To emphasize this point, tests 21 and 22 were also impacts of less than all the posts of a multipost installation. However, aluminum bolts were used. Both tests were run under higher speed conditions than in tests 1, 5, and 26. Test 21 was with a 4,500-lbm vehicle, and test 22 was with a 2,000-lbm vehicle. In each test, both bolts on each post impacted broke immediately, and the sign remained attached, as in tests 1, 5, and 26, to the remaining posts. The momentum change for test 21 was the lowest recorded for a two-post test, and only one test produced a lower momentum change for a one-post impact than test 22.
Although limited test results are available on steel and aluminum bolts, the benefits of the aluminum bolts appear to outweigh those of the steel on partial-post impacts. The main benefit is the ability of the post to disconnect from the sign (with the use of aluminum bolts), thus not giving the resistance of all posts to the impacting vehicle.
The only disadvantage to using aluminum bolts is that on some vehicle impacts the sign may be disconnected from the posts and hit the windshield of the vehicle.
Chemical and Physical Properties of Materials
The New Jersey DOT specification for the U-post stipulates that rail steel be supplied for all construction jobs. Chemical properties are not defined in the specification, except to indicate a high carbon content, nor are heat-treating procedures. Only the minimum physical limits for tensile and yield strengths are stated-80,000 and 60,000 psi (551 and 413 MPa) respectively.
With this background, testing commenced without the benefit of chemical and physical analyses. The posts used in the first seven tests were thought to be rail steel, but a subsequent chemical analysis of one post showed it to be in the billet range. Consequently, more extensive sampling was made of the steel posts used in the six subsequent steel post tests.
86
Extensive sampling of the initially tested steel posts (tests 1 through 7) is not available. Essentially, there appear to be two groups of steels, on the basis of the sampled ultimate strengths. The chemical analyses would indicate that there are four groups of steels: tests 1 through 7, tests 14, 15, and 16, tests 17 and 18, and test 19.
If we were to combine those steels with similar physical and chemical properties, there would be four possible groups. A more accurate interpretation of the chemical tests may indicate that every post used in the steel tests would have unique chemical properties.
An examination of Table 1 for the two-post impacts for steel shows two tests to be borderline with the FHW A momentum criteria. The four impact tests conducted on the two-post steel installations indicate no similarity in either the physical or chemical properties of the posts used. Hence, it would be difficult to write a specification on steel posts to guarantee a steel that will meet FHW A criteria.
In effect, the intermixing of the properties does not allow us to group the steels into two areas, as we had thought: low plastic and high plastic. If the steels have to be dynamically tested before grouping them in the plastic range, a specification stipulating this procedure could result in a very costly product. Besides, the two-post installation of an expected higher plastic steel does not meet FHW A criteria (test 17).
Prior to conducting the last series of six steel post tests, the extremely high momentum changes of the first seven steel post tests, even though only two steel posts were impacted, led us to seek materials of higher plasticity for testing. For this reason, six tests were conducted on aluminum posts, whose ultimate strengths were approximately one-third that of the steel.
SUMMARY AND CONCLUSIONS
Small channel-shaped sign supports, designed to bend at the base on impact, are commonly used in New Jersey and other states. Previous research into the safety of these posts has been mostly limited to verifying this "bendaway" action on impact with single-post installations.
Steel channels, which are most W'idely used, vary In size from 2- to 4-lbf/ft sections and are used for supporting highway delineatoi·s and h1ghway signs up to about 60 ft2
(5.6 m2) in area.
An aluminum version of these posts, in limited sizes, has recently become available . Results of dynamic testing indicate that simultaneously impacting more than one
4-lbf/ft steel U-post or more than three aluminum U-posts produces conditions that do not satisfy present FHWA criteria (1968 tentative criteria). The testing has also indicated that the use of aluminum bolts for the signpost connection yields less severe speed changes than stainless steel bolts when only a partial number of posts are impacted by the vehicle.
In all, 26 full-scale crash tests were conducted. Thirteen of these tests involved steel U-post supports, and 13 involved aluminum U-posts. The sign installations contained from one to four posts for both the steel and aluminum tests.
The tests were conducted on the 4-lbf/ft steel sections and the 4- and 8-lbf/ft equivalent aluminum sections with both 2,000- and 4,500-lbm vehicles; impact speeds ranged from 20 to 45 mph, and impact angles ranged from 0 (head-on) to 20 deg in accordance with FHWA test conditions.
REFERENCES
1. Application of Highway Safety Measures-Breakaway Luminaire Supports. Federal Highway Administration, Circular Memo., June 5, 1968.
2. Cook, J. P., and Bodocsi, A. Criteria for Yielding Highway Sign Supports. Univ. of Cincinnati, May 1970.
3. Edwards, T. C., Hirsch, T. J., and Olson, P. M. Design Criteria for Breakaway Sign Supports. Highway Research Record 222, 1968.
4. Tamanini, F. J. Designing Fail-Safe Structures for Highway Safety. Public Roads, Vol. 36, No. 6, Feb. 1971.
5. Design of Sign Supports and Structures. Highway Research Record 346, 1971.

87
6. Development of Design Criteria for Safer Luminaire Supports. NCHRP Rept. 77, 1969.
7. Development of Safer Roadside Structures and Protective Systems. Highway Research Record 259, 1969.
8. Shoemaker, N. E. Full-Scale Dynamic Testing of New Jersey Breakaway Sign Structure. Cornell Aeronautical Laboratory, Inc., Rept. VJ-2955-V-1, Sept. 1969.
9. Guardrails, Barriers and Sign Supports. Highway Research Record 174, 1967. 10. Rib- Bak Four Sign Post. Pollak Steel Company, 1965.
APPENDIX
Figure 9. Vehicle compartment data for test 1.
a w w
30
25
e; 20
w _J
u J: :;:: a. ~ ~ •5
r V)
<I ct: u
10
I IMPACT
""""'
INTERVALS (00173 sec/frame)
·10
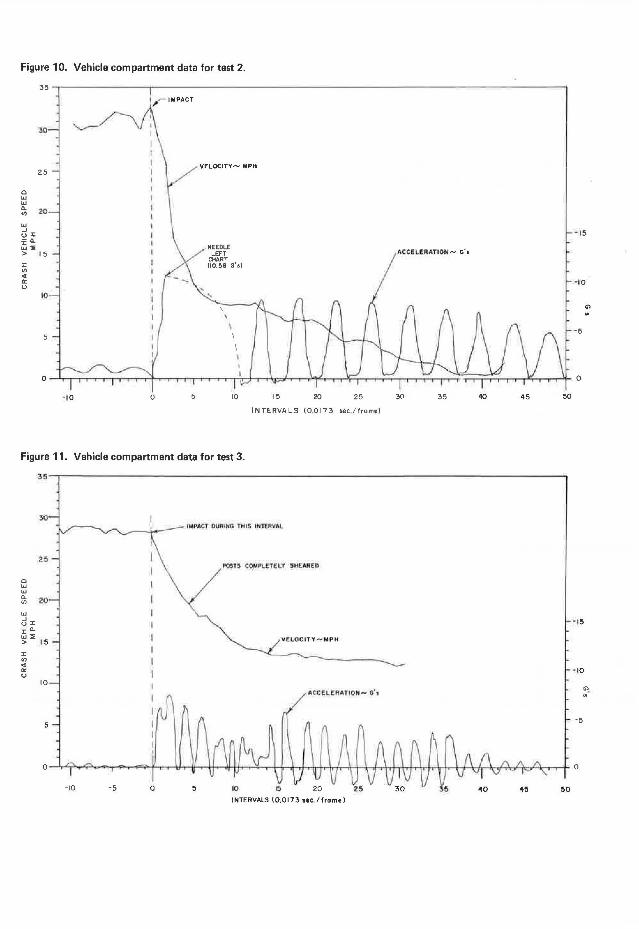
Figure 10. Vehicle compartment data for test 2.
c "' "' a.
"' "' ...J o:x: i: a. "' :IE
25
2-0
> 15
:I:
"' .. a: l.)
10
-1 0 0
VELOCITY- MPH
NEEDLE LEFT
g~~:~ G11)
\ \
\ \ \
INTERVALS {0.0173 sec /frame)
Figure 11. Vehicle compartment data for test 3.
2~
0
"' "' a. 20 <I)
"' ...J u:I: J: a. .,:i; > 15
:I: <I) .. a: 0
10
INTERVALS (0.0173 SIC /frame)
ACCIELEA.-.TI ON - 6 11
50
- 10
-5
0
- 10
"' .-