TWO-PHASE HEAT TRANSFER INSIDE MINICHANNELSpaduaresearch.cab.unipd.it/2733/1/Tesi_28_01_2010.pdf ·...
177
Sede Amministrativa: Università degli Studi di Padova Dipartimento di FISICA TECNICA SCUOLA DI DOTTORATO DI RICERCA IN INGEGNERIA INDUSTRIALE INDIRIZZO: FISICA TECNICA CICLO XXII TWO-PHASE HEAT TRANSFER INSIDE MINICHANNELS Direttore della Scuola: Prof. Paolo Bariani Coordinatore d’indirizzo: Prof. Luisa Rossetto Supervisore: Prof. Davide Del Col Correlatore: Prof. Luisa Rossetto Dottorando: Stefano Bortolin
Transcript of TWO-PHASE HEAT TRANSFER INSIDE MINICHANNELSpaduaresearch.cab.unipd.it/2733/1/Tesi_28_01_2010.pdf ·...
Sede Amministrativa: Università degli Studi di Padova
Dipartimento di FISICA TECNICA
SCUOLA DI DOTTORATO DI RICERCA IN INGEGNERIA INDUSTRIALE
INDIRIZZO: FISICA TECNICA
CICLO XXII
TWO-PHASE HEAT TRANSFER INSIDE MINICHANNELS
Direttore della Scuola: Prof. Paolo Bariani
Coordinatore d’indirizzo: Prof. Luisa Rossetto
Supervisore: Prof. Davide Del Col
Correlatore: Prof. Luisa Rossetto
Dottorando: Stefano Bortolin


1
Abstract
Condensation and vaporization in mini and microchannels are major topics in heat transfer research nowadays. Despite recent activity carried out in order to investigate the behaviour of two-phase heat transfer in small diameter channels, there is still a lack of information and reliable data, if compared to the wide range of engineering design and applications.
Two-phase heat transfer and pressure drop inside two minichannels with different shape (circular and square cross section) are investigated in this thesis.
A 0.96 mm diameter single circular minichannel is tested to measure both local heat transfer coefficients during condensation and two-phase pressure losses of R32 and R245fa. Test runs have been performed at around 40°C saturation temperature; the pressure drop tests have been performed in adiabatic flow conditions, to measure the frictional pressure losses. The heat transfer experimental data are compared against predicting models to provide a guideline for the design of minichannel condensers.
Experimental heat transfer coefficients measured during R134a condensation at 40°C saturation temperature, inside a single square cross section minichannel, having a 1.18 mm side length, are also reported in this thesis. The experimental local heat transfer coefficients are compared to the ones previously obtained in the circular minichannel. This subject is particularly interesting since most of the mini and microchannels used in practical applications have non circular cross sections. Tests have been performed with R134a at 40°C saturation temperature. As compared to the heat transfer coefficients measured in a circular minichannel, in the square minichannel a heat transfer enhancement at low values of mass velocity is found; this must be due to the effect of the surface tension.
The present work also reports the heat transfer coefficients measured during flow boiling of R245fa, R134a and R32 in a the single circular channel. The test runs have been performed during vaporization at around 30°C saturation temperature. As a peculiar characteristic of the present technique, the heat transfer coefficient is not measured by imposing the heat flux; instead, the boiling process is governed by controlling the inlet temperature of the heating secondary fluid (water). The flow boiling data taken in the present test section are presented and discussed, with particular regard to the effect of heat flux, mass velocity, vapour quality and fluid properties.
The onset of dryout is detected by means of the standard deviation of the temperature readings in the wall. The wall temperature in fact displays larger fluctuations in the zone where dryout occurs, which are related to the presence of a liquid film drying up at the wall with some kind of an oscillating process.


3
Riassunto
La condensazione e la vaporizzazione all’interno di minicanali sono attualmente temi di grande interesse nella ricerca sullo scambio termico. Nonostante i recenti studi portati avanti per investigare il comportamento dello scambio termico bifase all’ interno di minicanali, c’è ancora mancanza di informazioni e di dati affidabili rispetto all’ampio numero di applicazioni.
In questa tesi viene presentato uno studio sperimentale sullo scambio termico bifase e sulle cadute di pressione all’interno di due minicanali di forma diversa (sezione circolare e sezione quadrata).
Un minicanale circolare singolo, avente un diametro di 0.96 mm, è stato utilizzato per misurare il coefficiente di scambio termico locale durante la condensazione e le cadute di pressione bifase con i fluidi R32 e R245fa. Le prove sperimentali sono state realizzate alla temperatura di saturazione di 40°C; le misure di cadute di pressione sono state condotte in condizioni di deflusso adiabatico, in modo da misurare solo la componete dovuta all’attrito. I dati sperimentali di scambio termico sono stati poi confrontati con alcuni modelli in modo da fornire delle linee guida per il dimensionamento dei condensatori a minicanali.
In questa tesi vengono presentati i coefficienti sperimentali di scambio termico ottenuti durante la condensazione di R134a alla temperatura di saturazione di 40°C, all’interno di un minicanale avente sezione trasversale quadrata e un lato pari a 1.18 mm. I dati sperimentali sono stati confrontati con quelli precedentemente ottenuti nel minicanale circolare. Questo aspetto è particolarmente interessante poiché molti dei minicanali utilizzati nelle applicazioni pratiche hanno sezioni non circolari. Dal confronto tra minicanale quadrato e circolare emerge come nel caso del minicanale quadrato si abbia un aumento del coefficiente di scambio termico alle basse portate specifiche; questo è dovuto all’effetto della tensione superficiale.
Inoltre, nel presente lavoro vengono riportati i coefficienti di scambio termico misurati durante la vaporizzazione convettiva di R245fa, R134a e R32 all’interno del minicanale circolare. Le prove sperimentali sono state condotte alla temperatura di saturazione di 30°C. La caratteristica particolare di questa tecnica è che il coefficiente di scambio termico non è misurato imponendo il flusso termico; il processo di ebollizione è invece governato dalla temperatura di ingresso del fluido secondario (acqua). I dati ottenuti sono stati analizzati con particolare attenzione all’effetto del flusso termico, della portata specifica di massa, del titolo di vapore e delle proprietà dei fluidi.
L’inizio del dryout viene individuato attraverso il valore della deviazione standard delle temperature alla parete. Infatti, la temperatura alla parete del canale presenta grandi oscillazioni nella zona in cui inizia il dryout; queste oscillazioni sono legate alla presenza del film di liquido che si secca alla parete con un fenomeno di tipo oscillatorio.


5
Contents
ABSTRACT ................................................................................................................................................1
RIASSUNTO...............................................................................................................................................3
LIST OF FIGURES....................................................................................................................................7
LIST OF TABLES....................................................................................................................................15
INTRODUCTION ....................................................................................................................................17
CHAPTER 1. EXPERIMENTAL APPARATUS..............................................................................21
1.1 INTRODUCTION.........................................................................................................................21 1.2 TEST APPARATUS.....................................................................................................................21 1.3 CIRCULAR MINICHANNEL : TEST SECTION.................................................................................23 1.4 SQUARE MINICHANNEL.............................................................................................................27
1.4.1 Description of the experimental section .............................................................................27 1.4.2 Calibration procedure ........................................................................................................32
CHAPTER 2. HEAT TRANSFER AND PRESSURE DROP DURING SINGLE-PHASE FLOW OF R245FA AND R32 INSIDE THE CIRCULAR MINICHANNEL.................................................37
2.1 INTRODUCTION.........................................................................................................................37 2.2 PRESSURE DROP DURING R245FA AND R32 SINGLE-PHASE FLOW.............................................38 2.3 HEAT TRANSFER DURING LIQUID-PHASE FLOW.........................................................................39
CHAPTER 3. CONDENSATION HEAT TRANSFER OF HIGH AND LOW PRESSURE REFRIGERANTS FLOWING IN THE SINGLE CIRCULAR MINICHANNEL ............................47
3.1 INTRODUCTION.........................................................................................................................47 3.2 STATE OF THE ART....................................................................................................................47 3.3 CONDENSATION TESTS.............................................................................................................49 3.4 SENSITIVITY TO INLET VAPOUR QUALITY CONDITIONS.............................................................54 3.5 PRESSURE DROP TESTS.............................................................................................................55 3.6 UNCERTAINTY ANALYSIS .........................................................................................................56 3.7 ASSESSMENT OF HEAT TRANSFER CORRELATIONS....................................................................61
CHAPTER 4. TWO-PHASE PRESSURE DROP INSIDE THE CIRCULAR MINICHANNEL 67
4.1 INTRODUCTION.........................................................................................................................67 4.2 EXPERIMENTAL PRESSURE DROP..............................................................................................67 4.3 COMPARISON AGAINST MODELS...............................................................................................70
CHAPTER 5. FLOW BOILING IN THE CIRCULAR MINICHANNEL .....................................77
5.1 INTRODUCTION.........................................................................................................................77 5.2 LITERATURE REVIEW................................................................................................................77 5.3 EXPERIMENTAL APPARATUS.....................................................................................................80 5.4 DATA REDUCTION ....................................................................................................................81 5.5 EFFECT OF HEAT FLUX..............................................................................................................83 5.6 EFFECT OF VAPOUR QUALITY AND MASS VELOCITY..................................................................93 5.7 UNCERTAINTY ANALYSIS .........................................................................................................95 5.8 COMPARISON AGAINST MODELS.............................................................................................100
CHAPTER 6. DRYOUT DURING FLOW BOILING IN THE SINGLE CIRCULAR MINICHANNEL ....................................................................................................................................105
6.1 INTRODUCTION.......................................................................................................................105
6 CONTENTS
6.2 LITERATURE REVIEW.............................................................................................................106 6.3 EXPERIMENTAL TEST SECTION...............................................................................................109 6.4 DRYOUT QUALITY AND CRITICAL HEAT FLUX ........................................................................109
6.4.1 Temperature fluctuations in the wall ................................................................................109 6.4.2 Data reduction..................................................................................................................112 6.4.3 Uncertainty analysis.........................................................................................................115
6.5 EXPERIMENTAL RESULTS.......................................................................................................117 6.6 COMPARISON WITH MODELS ........................................................................................121
CHAPTER 7. HEAT TRANSFER AND PRESSURE DROP DURING R134A SINGLE-PHASE FLOW INSIDE THE SQUARE MINICHANNEL .............................................................................127
7.1 INTRODUCTION ......................................................................................................................127 7.2 PRESSURE DROP DURING R134A SINGLE-PHASE FLOW...........................................................127
7.2.1 Friction factor for laminar flow .......................................................................................127 7.2.2 Friction factor for turbulent flow .....................................................................................130 7.2.3 Experimental results .........................................................................................................131 7.2.4 Uncertainty analysis.........................................................................................................132
7.3 HEAT TRANSFER COEFFICIENT DURING R134A LIQUID -PHASE FLOW......................................136
CHAPTER 8. CONDENSATION INSIDE THE SQUARE MINICHANNEL.............................143
8.1 INTRODUCTION ......................................................................................................................143 8.2 EXPERIMENTAL APPARATUS..................................................................................................145 8.3 DATA REDUCTION ..................................................................................................................146 8.4 EXPERIMENTAL RESULTS.......................................................................................................148 8.5 EXPERIMENTAL UNCERTAINTY ..............................................................................................149 8.6 SENSITIVITY TO VAPOUR QUALITY INLET CONDITIONS...........................................................153 8.7 WATER TEMPERATURE INFLUENCE ON HEAT TRANSFER COEFFICIENT....................................154 8.8 COMPARISON BETWEEN CIRCULAR AND SQUARE MINICHANNEL............................................156 8.9 COMPARISON WITH THE MODELS...........................................................................................158
CONCLUSIONS.....................................................................................................................................163
REFERENCES .......................................................................................................................................165
PUBLICATIONS ...................................................................................................................................171
NOMENCLATURE ...............................................................................................................................173
ACKNLOWLEDGEMENTS ................................................................................................................175

7
List of figures
Fig. 1-1. Schematic representation of the test rig. The configuration refers to a condensation test. .................................................................................................... 22
Fig. 1-2. A view of the experimental set-up. .................................................................. 23 Fig. 1-3. Close-up of the measuring sector during construction..................................... 24 Fig. 1-4. Enlarged photo of the round minichannel cross section. ................................. 24 Fig. 1-5. Cross section of the fin where the wall temperature is measured. ................... 24 Fig. 1-6. View of the circular minichannel test section. ................................................. 26 Fig. 1-7. Schematic of the water flow passage geometry. .............................................. 26 Fig. 1-8. Image of the test section before thermal insulating.......................................... 26 Fig. 1-9. New test section: square channel. .................................................................... 27 Fig. 1-10. External side: pressure tap in the stainless steel and coolant channel in the
copper rod. .............................................................................................................. 27 Fig. 1-11. Enlarged pictures taken with a microendoscope inside the channel: the square
perimeter corresponds to the junction of stainless steel (blue) and copper (orange).................................................................................................................................. 28
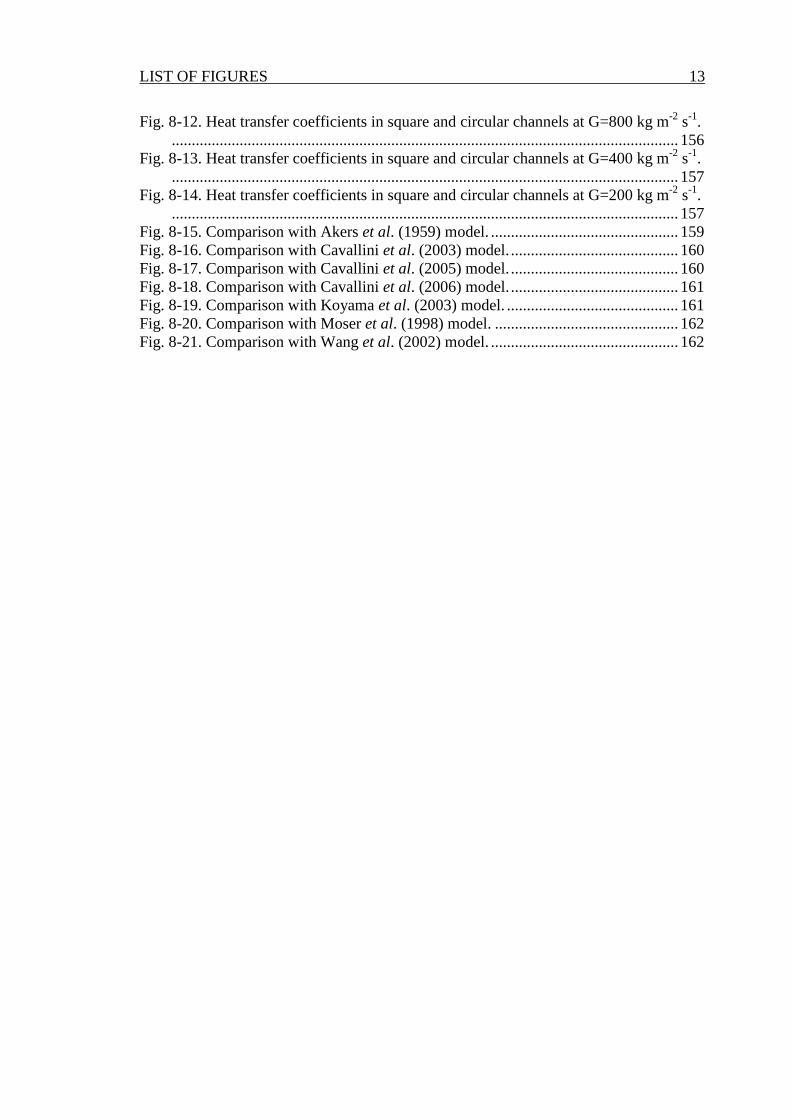
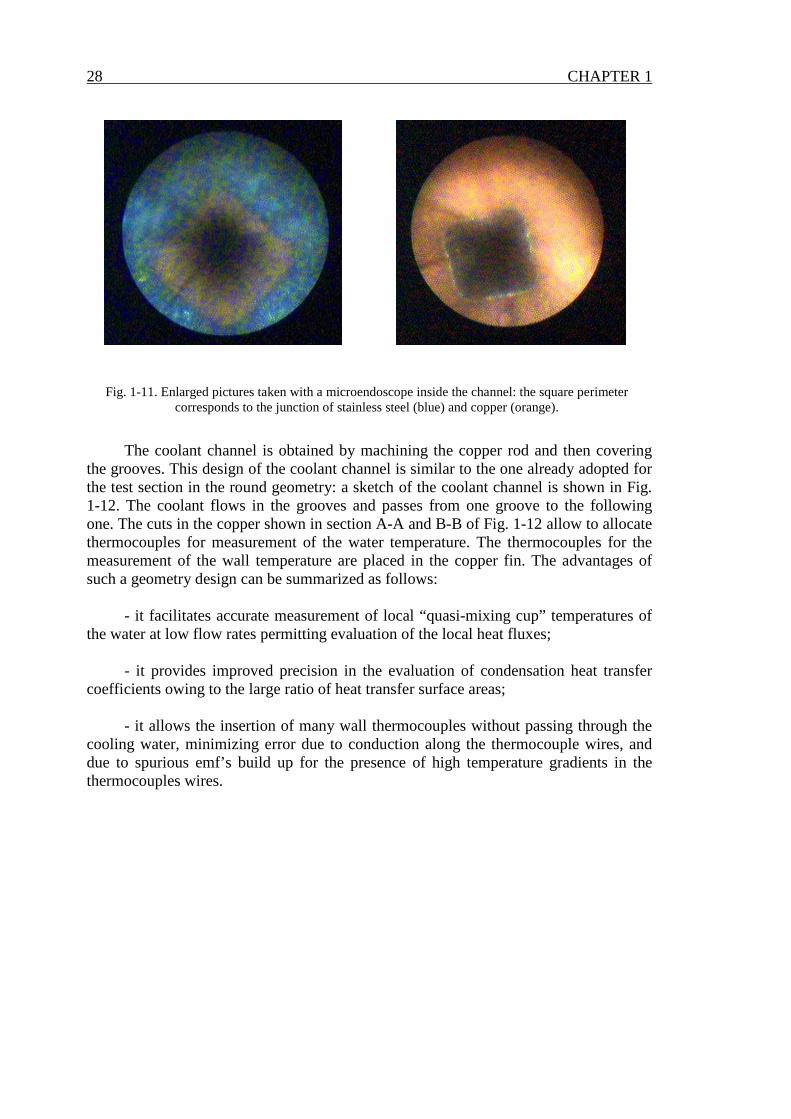
Fig. 1-12. Details of the coolant flow passage geometry................................................ 29 Fig. 1-13. Fabrication of the new test section. Top: insertion of thermocouples in the
water channel. Bottom: wires of thermocouples from the water channel and from the wall.................................................................................................................... 29
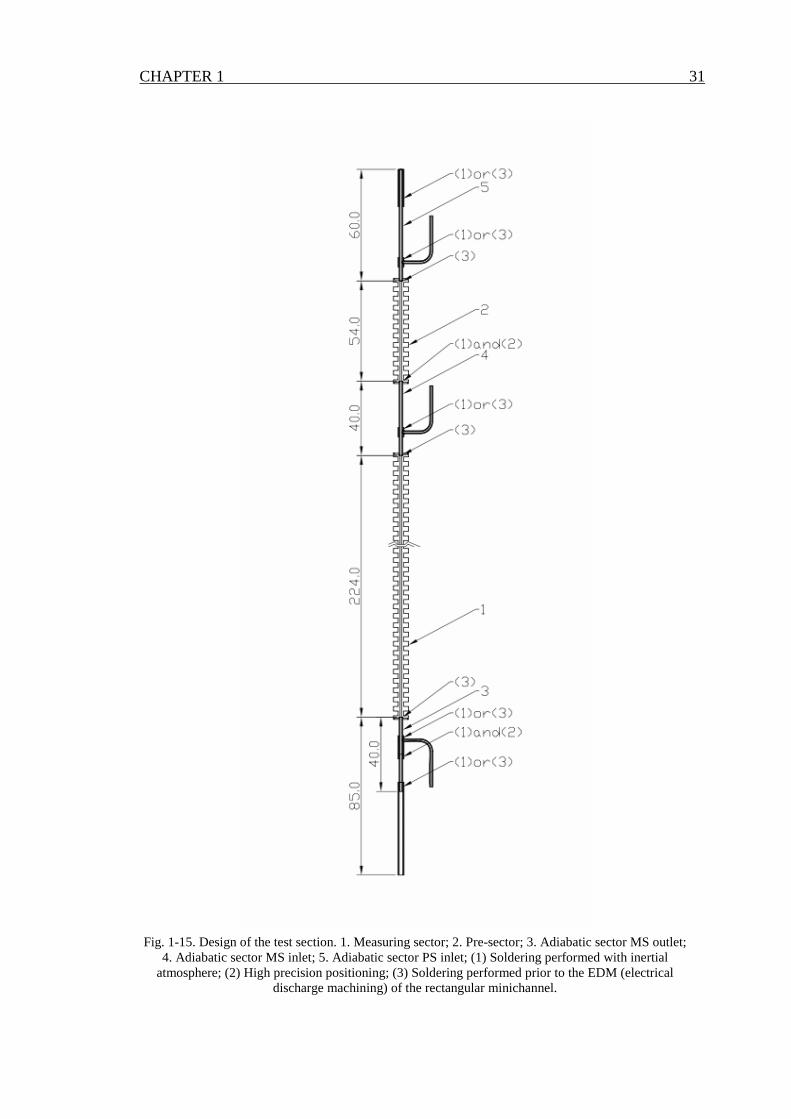
Fig. 1-14. Image of the test section inserted in the glass cylinder. ................................. 30 Fig. 1-15. Design of the test section. 1. Measuring sector; 2. Pre-sector; 3. Adiabatic
sector MS outlet; 4. Adiabatic sector MS inlet; 5. Adiabatic sector PS inlet; (1) Soldering performed with inertial atmosphere; (2) High precision positioning; (3) Soldering performed prior to the EDM (electrical discharge machining) of the rectangular minichannel.......................................................................................... 31
Fig. 1-16. Water temperature and wall temperature in the pre-sector before on-site calibration. Water enters the pre-sector at ambient temperature. Big square dots represent standard deviation of wall temperature measurements. .......................... 34
Fig. 1-17. Water temperature and wall temperature in the measuring-sector before on-site calibration. Water enters the measuring-sector at ambient temperature. Big square dots represent standard deviation of wall temperature measurements. ....... 34
Fig. 1-18. Water temperature and wall temperature in the pre-sector after on-site calibration. Water enters the pre-sector at ambient temperature. Big square dots represent standard deviation of wall temperature measurements. .......................... 34
Fig. 1-19. Water temperature and wall temperature in the measuring-sector after on-site calibration. Water enters the measuring-sector at ambient temperature. Big square dots represent standard deviation of wall temperature measurements.................... 34
Fig. 1-20. Water temperature and wall temperature in the measuring-sector after on-site calibration. Water enters the measuring-sector at 30°C. Big square dots represent standard deviation of wall temperature measurements........................................... 35
Fig. 1-21. Water temperature and wall temperature in the measuring-sector after on-site calibration. Water enters the measuring-sector at 38°C. Big square dots represent standard deviation of wall temperature measurements........................................... 35
8 LIST OF FIGURES
Fig. 2-1. Friction factor versus Reynolds number...........................................................38 Fig. 2-2. Temperature profiles during R245fa liquid flow at G=1500 kg m-2 s-1. ..........40 Fig. 2-3. Experimental local heat transfer coefficient during liquid flow at G=1500 kg
m-2 s-1and Re=3200 compared to correlation for forced convective heat transfer. .40 Fig. 2-4. Temperature profiles during R245fa liquid flow at G=1100 kg m-2 s-1. ..........41 Fig. 2-5. Experimental local heat transfer coefficient during liquid flow at G=1100 kg
m-2 s-1and Re=2300 compared to correlation for forced convective heat transfer. .41 Fig. 2-6. Temperature profiles during R245fa liquid flow at G=700 kg m-2 s-1. ............42 Fig. 2-7. Experimental local heat transfer coefficient during liquid flow at G=700 kg m-2
s-1and Re=1500 compared to correlation for forced convective heat transfer. .......42 Fig. 2-8. Temperature profiles during R32 liquid flow at G=1560 kg m-2 s-1.................43 Fig. 2-9. Experimental local heat transfer coefficient during liquid flow at G=1560 kg
m-2 s-1and Re=13000 compared to correlation for forced convective heat transfer..................................................................................................................................43
Fig. 2-10. Temperature profiles during R32 liquid flow at G=1100 kg m-2 s-1...............44 Fig. 2-11. Experimental local heat transfer coefficient during liquid flow at G=1100 kg
m-2 s-1and Re=9200 compared to correlation for forced convective heat transfer. .44 Fig. 2-12. Temperature profiles during R32 liquid flow at G=800 kg m-2 s-1.................45 Fig. 2-13. Experimental local heat transfer coefficient during liquid flow at G=800 kg
m-2 s-1and Re=6600 compared to correlation for forced convective heat transfer. .45 Fig. 3-1. Experimental test rig. (DESUP.=desuperheater, MF=mechanical filter,
HF=drier, PV=pressure vessel, CFM=Coriolis-effect mass flow meter, P=pressure transducer, T=temperature transducer, DP=differential pressure transducer). .......50
Fig. 3-2. Temperature measurements within the single minichannel test section. .........51 Fig. 3-3. Heat transfer coefficient measured during condensation of R32 in the channel
versus vapour quality. .............................................................................................53 Fig. 3-4. Heat transfer coefficient measured during condensation of R245fa in the
channel versus vapour quality. ................................................................................54 Fig. 3-5. Heat transfer coefficient measured during condensation of R32, mass velocity
600 kg m-2 s-1, and different vapour inlet conditions. .............................................55 Fig. 3-6. Experimental pressure drop during condensation compared with model by
Cavallini et al. (2009). ............................................................................................56 Fig. 3-7. HTC and vapour quality experimental uncertainty during R32 condensation
tests..........................................................................................................................59 Fig. 3-8. HTC and vapour quality experimental uncertainty during R234fa condensation
tests..........................................................................................................................59 Fig. 3-9. HTC percentage uncertainty during R32 condensation at G=400 kg m-2 s-1. ..60 Fig. 3-10. HTC percentage uncertainty during R245fa condensation at G=400 kg m-2 s-1.
.................................................................................................................................60 Fig. 3-11. Comparison with Akers et al. (1959) model. .................................................63 Fig. 3-12. Akers et al. (1959) model. Ratio of calculated HTC to experimental HTC
versus mass velocity................................................................................................63 Fig. 3-13. Comparison with Cavallini et al. (2003) model. ............................................63 Fig. 3-14. Cavallini et al. (2003) model. Ratio of calculated HTC to experimental HTC
versus mass velocity................................................................................................63 Fig. 3-15. Comparison with Cavallini et al. (2005) model. ............................................64 Fig. 3-16. Cavallini et al. (2005) model. Ratio of calculated HTC to experimental HTC
versus mass velocity................................................................................................64

LIST OF FIGURES 9
Fig. 3-17. Comparison with Cavallini et al. (2006) model............................................. 64 Fig. 3-18. Cavallini et al. (2006) model. Ratio of calculated HTC to experimental HTC
versus mass velocity. .............................................................................................. 64 Fig. 3-19. Comparison with Koyama et al. (2003) model. ............................................. 65 Fig. 3-20. Koyama et al. (2003) model. Ratio of calculated HTC to experimental HTC
versus mass velocity. .............................................................................................. 65 Fig. 3-21. Comparison with Moser et al. (1998) model. ................................................ 65 Fig. 3-22. Moser et al. (1998) model. Ratio of calculated HTC to experimental HTC
versus mass velocity. .............................................................................................. 65 Fig. 3-23. Comparison with Wang et al. (2002) model. ................................................. 66 Fig. 3-24. Wang et al. (2002) model. Ratio of calculated HTC to experimental HTC
versus mass velocity. .............................................................................................. 66 Fig. 3-25. Condensation test runs plotted on the flow pattern map (Cavallini et al.,
2006). ...................................................................................................................... 66 Fig. 4-1. Total experimental pressure drop for R32 at 40°C versus vapour quality at
different mass velocities. ........................................................................................ 69 Fig. 4-2. Total experimental pressure drop for R245fa at 40°C versus vapour quality at
different mass velocities. ........................................................................................ 69 Fig. 4-3. R32 and R245fa data compared against model by Cavallini et al. (2009)....... 70 Fig. 4-4. R32 and R245fa data compared against model by Chen et al. (2001)............. 71 Fig. 4-5. R32 and R245fa data compared against model by Friedel (1979). .................. 71 Fig. 4-6. R32 and R245fa data compared against model by Garimella et al. (2004). .... 72 Fig. 4-7. R32 and R245fa data compared against homogeneous model......................... 72 Fig. 4-8. R32 and R245fa data compared against model by Koyama et al. (2003)........ 73 Fig. 4-9. R32 and R245fa data compared against model by Lockhart and Martinelli
(1949). ..................................................................................................................... 73 Fig. 4-10. R32 and R245fa data compared against model by Mishima and Hibiki (1996).
................................................................................................................................. 74 Fig. 4-11. R32 and R245fa data compared against model by Müller Steinhagen and
Heck (1986). ........................................................................................................... 74 Fig. 4-12. R32 and R245fa data compared against model by Yan and Lin (1999). ....... 75 Fig. 4-13. R32 and R245fa data compared against model by Zhang and Webb (2001). 75 Fig. 5-1. Experimental test-rig.(PRES.=pre-sector, MF=mechanical filter, HF=
dehumidifier, PV=pressure vessel, CFM=Coriolis-effect mass flow meter, TV=valve, P=pressure transducer, T=temperature transducer, DP=differential pressure transducer). ............................................................................................... 81
Fig. 5-2. Water, wall and saturation temperatures during flow boiling of R245fa at G=300 kg m-2s-1. Inlet and outlet temperatures of the refrigerant are also directly measured (Ref IN/OUT). ........................................................................................ 84
Fig. 5-3. Heat transfer coefficient and heat flux versus vapour quality during flow boiling of R245fa at G=300 kg m-2s-1. .................................................................... 84
Fig. 5-4. Water, wall and saturation temperatures during flow boiling of R134a at G=500 kg m-2s-1. Inlet and outlet temperatures of the refrigerant are also directly measured (Ref IN/OUT). ........................................................................................ 85
Fig. 5-5. Heat transfer coefficient and heat flux versus vapour quality during flow boiling of R134a at G=500 kg m-2s-1. ..................................................................... 85
10 LIST OF FIGURES
Fig. 5-6. Water, wall and saturation temperatures during flow boiling of R32 at G=600 kg m-2s-1. Inlet and outlet temperatures of the refrigerant are also directly measured (Ref IN/OUT)..........................................................................................................86
Fig. 5-7. Heat transfer coefficient and heat flux versus vapour quality during flow boiling of R32 at G=600 kg m-2s-1. .........................................................................86
Fig. 5-8. Boiling curves for R245fa. Data refer to the temperature measurement location z=46 mm from MS inlet. .........................................................................................88
Fig. 5-9. Boiling curves for R134a. Data refer to the temperature measurement location z=136 mm from MS inlet and mass velocity G=600 kg m-2 s-1. .............................88
Fig. 5-10. Boiling curves for R32. Data refer to the temperature measurement location z=91 mm from MS inlet and mass velocity G=400 kg m-2 s-1. ...............................89
Fig. 5-11. Flow boiling data of R245fa at Tsat=31°C: local heat transfer coefficients versus heat flux. ......................................................................................................90
Fig. 5-12. Flow boiling data of R245fa at Tsat=31°C: local heat flux versus vapour quality......................................................................................................................90
Fig. 5-13. Flow boiling data of R134a at Tsat=31°C: local heat transfer coefficients versus heat flux. ......................................................................................................91
Fig. 5-14. Flow boiling data of R134a at Tsat=31°C: local heat flux versus vapour quality......................................................................................................................91
Fig. 5-15. Flow boiling data of R32 at Tsat=31°C: local heat transfer coefficients versus heat flux...................................................................................................................92
Fig. 5-16. Flow boiling data of R32 at Tsat=31°C: local heat flux versus vapour quality..................................................................................................................................92
Fig. 5-17. Local heat transfer coefficient versus vapour quality during vaporization of R245fa at 300 kg m-2s-1 and constant heat flux.......................................................94
Fig. 5-18. Local heat transfer coefficient versus vapour quality during vaporization of R134a at 300 kg m-2s-1 and constant heat flux. .......................................................94
Fig. 5-19. Local heat transfer coefficient versus vapour quality during vaporization of R32 at 400 kg m-2s-1 and constant heat flux. ...........................................................94
Fig. 5-20. R245fa: local heat transfer coefficient versus heat flux at constant vapour quality......................................................................................................................95
Fig. 5-21. R134a: local heat transfer coefficient versus heat flux at constant vapour quality......................................................................................................................95
Fig. 5-22. R32: local heat transfer coefficient versus heat flux at constant vapour quality......................................................................................................................95
Fig. 5-23. Heat flux distribution obtained varying all water temperature in the uncertainty range; data refer to a location z=151 mm from channel inlet. .............98
Fig. 5-24. Gaussian probability density function. ...........................................................98 Fig. 5-25. R245fa: HTC experimental uncertainty. ........................................................99 Fig. 5-26. R134a: HTC experimental uncertainty...........................................................99 Fig. 5-27. R32: HTC experimental uncertainty. .............................................................99 Fig. 5-28. R245fa experimental data compared against model by Lazarek and Black
(1982). ...................................................................................................................101 Fig. 5-29. R134a experimental data compared against model by Lazarek and Black
(1982). ...................................................................................................................101 Fig. 5-30. R32 experimental data compared against model by Lazarek and Black (1982).
...............................................................................................................................101

LIST OF FIGURES 11
Fig. 5-31. R245fa experimental data compared against model by Kandlikar and Balasubramanian (2004). ...................................................................................... 102
Fig. 5-32. R134a experimental data compared against model by Kandlikar and Balasubramanian (2004). ...................................................................................... 102
Fig. 5-33. R32 experimental data compared against model by Kandlikar and Balasubramanian (2004). ...................................................................................... 102
Fig. 5-34. R245fa experimental data compared against model by Thome et al. (2004)................................................................................................................................ 103
Fig. 5-35. R134a experimental data compared against model by Thome et al. (2004)................................................................................................................................ 103
Fig. 5-36. R32 experimental data compared against model by Thome et al. (2004).... 103 Fig. 5-37. R245fa experimental data compared against model by Bertsch et al. (2009).
............................................................................................................................... 104 Fig. 5-38. R134a experimental data compared against model by Bertsch et al. (2009).
............................................................................................................................... 104 Fig. 5-39. R32 experimental data compared against model by Bertsch et al. (2009)... 104 Fig. 6-1 Water, wall and saturation temperature during a boiling process of R134a in the
0.96 mm diameter channel at G=400 kg m-2s-1. The big square dots represent the standard deviation of the wall temperature measurements. .................................. 111
Fig. 6-2. Saturation, wall and water temperature during a condensation process of R134a in the 0.96 mm diameter channel at G=400 kg m-2s-1. The big square dots represent the standard deviation of the wall temperature measurements. ............ 112
Fig. 6-3. Flow boiling process of R134a in the 0.96 single circular minichannel at 400 kg m-2s-1: Top) Water, wall and refrigerant temperatures, standard deviation of wall temperature and heat flux; Bottom) Heat transfer coefficient and vapour quality along the channel. ..................................................................................... 114
Fig. 6-4. R134a data at 31°C saturation temperature. Inlet subcooling varies between 3 and 5 K. The values of heated length vary in the tests. ........................................ 118
Fig. 6-5. R32 data at 31°C saturation temperature. Inlet subcooling varies between 4 and 6 K. The values of heated length vary in the tests................................................ 119
Fig. 6-6. Fig. R134a data: critical heat flux vs. mass velocity at constant heated length................................................................................................................................ 120
Fig. 6-7. R134a data: critical heat flux vs. heated length at constant mass velocity. ... 120 Fig. 6-8. R32 data: critical heat flux vs. heated length at constant mass velocity. ....... 121 Fig. 6-9. Katto and Ohno (1984) model........................................................................ 122 Fig. 6-10. Zhang et al. (2006) model. ........................................................................... 123 Fig. 6-11. Wojtan et al. (2006) model. ......................................................................... 124 Fig. 6-12. Del Col et al. (2007) model.......................................................................... 125 Fig. 6-13. Kosar (2009) model...................................................................................... 126 Fig. 7-1. Velocity field inside square minichannel....................................................... 130 Fig. 7-2. Friction factor versus Reynolds number. ....................................................... 132 Fig. 7-3. Experimental uncertainty on friction factor. .................................................. 134 Fig. 7-4. Experimental uncertainty on friction factor: laminar region.......................... 135 Fig. 7-5. Temperature profiles during cooling of R134a; the refrigerant flows in the
minichannel as subcooled liquid with a mass velocity G=790 kg m-2 s-1............. 137 Fig. 7-6. Experimental local heat transfer coefficient during liquid flow at G=790 kg m-2
s-1and Re=5100 compared to correlation for forced convective heat transfer. ..... 137
12 LIST OF FIGURES
Fig. 7-7. Temperature profiles during cooling of R134a; the refrigerant flows in the minichannel as subcooled liquid with a mass velocity G=660 kg m-2 s-1. ............138
Fig. 7-8. Experimental local heat transfer coefficient during liquid flow at G=660 kg m-2 s-1and Re=4400 compared to correlation for forced convective heat transfer. .....138
Fig. 7-9. Temperature profiles during cooling of R134a; the refrigerant flows in the minichannel as subcooled liquid with a mass velocity G=520 kg m-2 s-1. ............139
Fig. 7-10. Experimental local heat transfer coefficient during liquid flow at G=520 kg m-2 s-1and Re=3400 compared to correlation for forced convective heat transfer................................................................................................................................139
Fig. 7-11. Temperature profiles during heating of R134a; the refrigerant flows in the minichannel as subcooled liquid with a mass velocity G=790 kg m-2 s-1. ............140
Fig. 7-12. Experimental local heat transfer coefficient during liquid flow at G=790 kg m-2 s-1and Re=4700 compared to correlation for forced convective heat transfer................................................................................................................................140
Fig. 7-13. Temperature profiles during heating of R134a; the refrigerant flows in the minichannel as subcooled liquid with a mass velocity G=660 kg m-2 s-1. ............141
Fig. 7-14. Experimental local heat transfer coefficient during liquid flow at G=660 kg m-2 s-1and Re=4000 compared to correlation for forced convective heat transfer................................................................................................................................141
Fig. 7-15. Temperature profiles during heating of R134a; the refrigerant flows in the minichannel as subcooled liquid with a mass velocity G=530 kg m-2 s-1. ............142
Fig. 7-16. Experimental local heat transfer coefficient during liquid flow at G=530 kg m-2 s-1and Re=3200 compared to correlation for forced convective heat transfer................................................................................................................................142
Fig. 8-1. Heat transfer coefficient measured during condensation of R134a in a 0.96 mm diameter circular channel at varying mass flux G [kg m-2 s-1] (taken from Matkovic et al., 2009). ..........................................................................................................144
Fig. 8-2. Experimental test rig.......................................................................................145 Fig. 8-3. Condensation in square channel: test run during condensation of R134a at 400
kg m-2 s-1 mass velocity.........................................................................................147 Fig. 8-4. Experimental local heat transfer coefficient during condensation of R134a
inside the square cross section minichannel at different mass velocities G [kg m-2 s-
1]. ...........................................................................................................................148 Fig. 8-5. HTC and vapor quality experimental uncertainty during R134a condensation
tests........................................................................................................................151 Fig. 8-6. HTC percentage uncertainty during R134a condensation at G200 kg m-2 s-1.
...............................................................................................................................152 Fig. 8-7. HTC percentage uncertainty during R134a condensation at G400 kg m-2 s-1.
...............................................................................................................................152 Fig. 8-8. Experimental local heat transfer coefficient at varying inlet vapour conditions,
from 0.98 to 0.68 quality.......................................................................................153 Fig. 8-9. Experimental uncertainty on local heat transfer coefficient at varying inlet
vapour conditions. .................................................................................................154 Fig. 8-10. Experimental local heat transfer coefficient during condensation of R134a at
260 kg m-2 s-1 when varying the inlet water temperature......................................155 Fig. 8-11. Experimental uncertainty on local heat transfer coefficient during
condensation of R134a at 260 kg m-2 s-1 when varying the inlet water temperature................................................................................................................................155
LIST OF FIGURES 13
Fig. 8-12. Heat transfer coefficients in square and circular channels at G=800 kg m-2 s-1................................................................................................................................ 156
Fig. 8-13. Heat transfer coefficients in square and circular channels at G=400 kg m-2 s-1................................................................................................................................ 157
Fig. 8-14. Heat transfer coefficients in square and circular channels at G=200 kg m-2 s-1................................................................................................................................ 157
Fig. 8-15. Comparison with Akers et al. (1959) model. ............................................... 159 Fig. 8-16. Comparison with Cavallini et al. (2003) model........................................... 160 Fig. 8-17. Comparison with Cavallini et al. (2005) model........................................... 160 Fig. 8-18. Comparison with Cavallini et al. (2006) model........................................... 161 Fig. 8-19. Comparison with Koyama et al. (2003) model. ........................................... 161 Fig. 8-20. Comparison with Moser et al. (1998) model. .............................................. 162 Fig. 8-21. Comparison with Wang et al. (2002) model. ............................................... 162

14 LIST OF FIGURES

15
List of tables
Table 1-1. Refrigerant saturation temperature measurements. ....................................... 32 Table 1-2. Heat balance during R134a condensation tests at different mass velocities. 33 Table 3-1. Properties of saturated R32 and R245fa compared to R134a at 40°C,
corresponding to 24. 8 bar and 2.5 bar for R32 and R245fa, respectively. Each value is the ratio to the corresponding R134a property value at the same temperature. ............................................................................................................ 48
Table 3-2. Type B experimental uncertainty of measured parameters. .......................... 56 Table 5-1. Properties of saturated R245fa, R134a and R32 at 31°C. ............................. 83 Table 5-2. Type B experimental uncertainty of measured parameters. .......................... 96 Table 6-1. Experimental uncertainty of measured parameters. .................................... 115 Table 6-2. Uncertainty of dryout vapour quality .......................................................... 117 Table 6-3. Relative uncertainty of critical heat flux (UQ) and heated length (UL)........ 117 Table 7-1. Type B experimental uncertainty of measured parameters. ........................ 132 Table 8-1. Type B experimental uncertainty of measured parameters. ........................ 149

16 LIST OF TABLES

17
Introduction
A significant and still growing part of the engineering research community addressed themselves in the last few decades to scaling down devices, while keeping or even increasing their functionality. The introduction of minichannels in the field of enhanced heat and mass transfer is surely one of those attempts. As a result, compact heat exchangers can be found in a wide variety of applications: from residential and vehicles air-conditioning to cooling electronic devices, both for ground and space applications. In the case of condensers for automotive air-conditioning applications, for example, extruded aluminium multi-port minichannel tubing is a technology that has become common.
Compact elements work with reduced refrigerant charge and can usually withstand extremely high system pressures. Resistance to high pressures enables to use natural refrigerants such as carbon dioxide and hence to operate in supercritical region. Furthermore, small refrigerant charges can contribute to reduce the direct greenhouse effects of the systems and to promote the use of flammable or even toxic refrigerants. For example, charge minimization is a major design objective for equipment using hydrocarbons or ammonia because the possible hazard when dealing with toxic or flammable fluids is proportional to the total amount of refrigerant trapped in the system. (Da Riva, 2009). The same restriction should be adopted, in any case, in systems operating with halogenated fluids when trying to reduce emissions for environmental reasons. Since most of the charge in HVAC equipment is trapped in the heat exchangers, and especially in the condenser, the first step in order to minimize the refrigerant charge is the optimization of these devices, and minichannels technology appears to be a very good opportunity to obtain this target (Cavallini et al., 2008).
Nevertheless, the art of utilization of microchannels for achieving high heat transfer rates is much farther ahead than the science of obtaining a comprehensive understanding of phase change in these channels.
Condensation is one of the most widely used phase change phenomena in process engineering. It is usually associated to the hot part of systems. When applied to minichannels, forced convective condensation is usually considered. Heat and mass transfer mechanisms seem to be less complicated in comparison to the flow boiling phenomenon where more parameters have significant effect on the process. On the contrary, it may be more difficult to perform local heat transfer coefficient measurements during condensation inside a single minichannel as compared to the flow boiling case. In fact, unlike in the case of evaporation, where heat transfer rates can be accurately measured from electrical heat input, condensation heat transfer rates have to be determined indirectly. Besides, in the case of channels having small cross flow area, it becomes very difficult to reduce the vapour quality change in the test section, from inlet to outlet, and therefore measuring local coefficients is a hard task.
Most of the data available in the literature for condensation inside mini and micro-channels was taken using multiport channels, leading to averaged values of the heat transfer coefficient. Instead, in this work, the heat transfer coefficient is measured inside two different shape single channel: a single round minichannel with 0.96 mm internal diameter and a single square minichannel with side length equal to 1.18 mm. The heat

18 INTRODUCTION
transfer coefficient is obtained through the measurement of the local heat flux and the saturation minus wall temperature difference.
Experimental results relative to single phase flow, adiabatic two phase flow and forced convective condensation flow of two different HFC refrigerants (R245fa and R32) have been obtained and are presented in this thesis.
Some numerical studies have been presented in the literature reporting that the channel shape may have great influence on the heat transfer coefficient during condensation inside minichannels (Wang and Rose, 2005). But, no attempt to measure the local heat transfer coefficient in a square or rectangular cross section single minichannel has been published.
During condensation inside minichannels, in fact, the surface tension is supposed to enhance the heat transfer in the presence of corners as compared to the case of circular channels, because the liquid is pulled towards the corners leading to a thinner liquid film on the flat sides and therefore to a lower thermal resistance on these parts of the channel. This may provide a higher average heat transfer coefficient on the perimeter of the channel, but no experimental evidence is yet available. Besides, this subject is particularly interesting since most of the mini and microchannels used in practical applications have non circular cross sections.
In order to investigate the role of surface tension, heat transfer coefficient during condensation of R134a inside a square minichannel has been measured. The experimental results have been reported in this thesis and a comparison with experimental data by Matkovic et al. (2009) for R134a condensing in a circular minichannel is reported in the present work.
Flow boiling in mini and microchannels is a very hot topic in heat transfer research nowadays. Recent technical applications in the electronic industry demand high-heat flux dissipation from small areas. Cooling of electronic devices requires that heat be removed from the device surface but also that the device be maintained at a relatively low temperature. Cooling through vaporization of a refrigerant in a minichannel heat sink will allow compactness, minimal coolant usage, high heat transfer coefficients and a constant temperature dictated by the coolant’s saturation temperature.
Despite recent activity carried out in order to investigate the behaviour of flow boiling heat transfer in small diameter channels, there is still a lack of information and reliable data, if compared to the wide range of engineering design and other applications.
In practical applications of evaporation inside minichannels, the heat flux may be an independent variable as under Joule-effect heating or it may be a dependent variable when it is transferred from a secondary fluid.
Most of the flow boiling data in minichannels available in the literature were measured by adopting Joule effect heating and thus by imposing the heat flux. This technique allows to measure the heat flux with high accuracy and also to easily embed thermocouples in the wall.
On the contrary, very few data are available in the literature for flow boiling in minichannels taken without fixing the heat flux. Those data, measured with the use of a secondary fluid in the evaporation test section, were obtained mainly in multiport minichannels, and generally using the Wilson plot technique. The main shortcoming of the Wilson plot technique is the high experimental uncertainty for the heat transfer coefficients particularly when the leading thermal resistance is on the secondary fluid

INTRODUCTION 19
side. Furthermore, in the case of multiport tubes, the heat transfer coefficient measured with the indirect experimental method represents only an average value over the parallel channels, that often are not evenly fed, and does not give any information for the single channel.
In this thesis, heat transfer coefficient has been measured during flow boiling of refrigerants inside a circular minichannel. Three HFC refrigerants have been investigated: R245fa, R134a and R32. The three fluids represent a significant span of reduced pressures and thus the wide range of test conditions.
The heat is transferred to the evaporating fluid by using a secondary circuit and thus by imposing temperatures. The heat transfer coefficient in the single channel is obtained through the measurement of the local heat flux and the wall minus saturation temperature difference.
Furthermore, the onset of dryout has been investigated in this thesis. The onset of dryout is detected by means of the standard deviation of the temperature readings in the wall. The wall temperature in fact displays larger fluctuations in the zone where dryout occurs, which are related to the presence of a liquid film drying up at the wall with some kind of an oscillating process. These temperature fluctuations are detected by means of the standard deviation in the wall temperature. The fluctuations also disappear in the post-dryout zone.
So far, there is no agreement in the literature on the heat transfer mechanisms which are dominant during vaporization. As reported by Lee and Mudawar (2005), researchers are divided into two groups. The first group shares the view that nucleate boiling is dominant and therefore dictates overall heat transfer inside the channel. A second group shares the observation that the local heat transfer coefficient is a function of vapour quality and mass velocity in addition to heat flux. Of course, the understanding of dominant mechanisms during flow boiling in mini-channels is the fundamental basis for the development of an accurate predicting method.
In this thesis, the experimental data taken both in condensation and vaporization are compared against predicting models, although the predicting accuracy which can be obtained for condensation is still far beyond the modelling capabilities of flow boiling heat transfer.
The manuscript is organized as follows: -Chapter 1. Description of the experimental apparatus utilized in condensation and
vaporization tests; a detailed description of the two test sections (circular and square minichannels) is also reported.
-Chapter 2. Heat transfer and pressure drop during R245fa and R32 single-phase
flow inside circular minichannel. -Chapter 3. Heat transfer coefficient during condensation of R245fa and R32
inside circular minichannel. -Chapter 4. Two-phase pressure drop inside circular minichannel during adiabatic
flow of R245fa and R32.

20 INTRODUCTION
-Chapter 5. Flow boiling inside circular minichannel; heat transfer coefficient data
for R245fa, R134a, and R32 have been illustrated. -Chapter 6. Dryout during flow boiling of R245fa, R134a and R32 in circular
minichannel. -Chapter 7. Heat transfer and pressure drop during R134a single-phase flow inside
square minichannel. -Chapter 8. Heat transfer coefficient during condensation of R134a inside square
minichannel.

21
Chapter 1.
Experimental apparatus
1.1 Introduction
The experimental apparatus will be described in the present chapter. The test rig allows to perform heat transfer and pressure drop measurements during condensation and vaporization of refrigerants inside minichannels. In particular, two different test sections have been installed in the apparatus, in parallel mode: the first section consists of a circular minichannel with 0.96 mm internal diameter; the second section consists of a square minichannel with side length equal to 1.18 mm.
1.2 Test apparatus
With reference to the test rig in Fig. 1-1, subcooled refrigerant from the postcondenser passes the mechanical
filter and dehumidifier. It is pumped with a variable speed electric motor gear pump into the Coriolis effect mass flow meter and then through the throttling valve. During condensation tests, the fluid passes the evaporator and enters the test section in the state of superheated vapour. Instead, when vaporization tests have been performed, the evaporator is by-passed and the refrigerant is sent to the test section in the state of subcooled liquid. The thermodynamic state of the refrigerant is determined measuring the temperature and the pressure at inlet test section.
An important part of the primary loop is the accumulator (PV). It is used to store a certain amount of the test fluid as a liquid. The system pressure in the rig is controlled by varying the volume of the liquid contained in the accumulator. As the accumulator is partly filled with a compressible gas, such as nitrogen, it works also as an expansion vessel. Therefore, this element should never be detached from the system.
Another important element of the primary refrigerant loop is the throttling valve (TV2). It is installed after pump, accumulator and Coriolis effect mass flow meter. Its purpose is to make the fluid flow more stable with proper throttling.
The “reset” bypass (dashed line) allows to send some fluid back to the inlet of the postcondenser. In this way, the pump works at rather high flow rates and the part of the test rig from the postcondenser down to the outlet of the pump, is sufficiently subcooled to avoid possible cavitation. As a consequence, the flow is more stable. The cavitation is

22 CHAPTER 1
likely to occur at low flow rates for the small thermal capacity, and could cause insufficient feeding of the pump and lack of fluid flow through the test section. It is therefore important to have sufficient reflux of the refrigerant, particularly when the saturation temperature is relatively close to the ambient temperature.
An view of the experimental apparatus is reported in Fig. 1-2.
DESUP. desuperheater MF mechanical filter HF dehumidifier PV pressure vessel CFM Coriolis-effect mass flow meter TV valve P pressure transducer DP differential pressure transducer
Fig. 1-1. Schematic representation of the test rig. The configuration refers to a condensation test.

CHAPTER 1 23
Fig. 1-2. A view of the experimental set-up.
1.3 Circular minichannel: test section
The most important part of the test rig is the test section, which consists of two sectors. The first one, the pre-sector (PS), is used to prepare the desired inlet vapour quality: in condensation tests the pre-sector works as desuperheater, while in vaporization tests it allows to obtained the desired subcooling. The second one is actually the measuring sector (MS). Between the two sectors and downstream the MS, adiabatic stainless steel pipes are installed in order to reduce the axial heat conduction through the tube wall, to thermally detach the two sectors from the surrounding and to check the saturation state of the fluid by measuring the adiabatic wall temperature and the fluid pressure. A detailed view with internal geometry of the test section is given in Fig. 1-6.

24 CHAPTER 1
Fig. 1-3. Close-up of the measuring sector during construction.
The test section is equipped with 28 thermocouples, 13 in the wall and 15 in the
secondary fluid (water) channel along the sector; the test section is made from an 8 mm copper rod with a 0.96 mm internal bore – the minichannel. An enlarged photo of the round minichannel cross section is reported in Fig. 1-4. The thermocouples embedded in the wall are installed in 0.6 mm diameter cylindrical holes, machined 0.5 mm far from the internal tube surface as shown in Fig. 1-5. The refrigerant flows inside the minichannel; condensation and boiling processes are achieved using a secondary fluid (water) that flows in counter-flow outside the minichannel. The length of the channel is equal to 228.5 mm.
Fig. 1-4. Enlarged photo of the round minichannel cross section.
Fig. 1-5. Cross section of the fin where the wall temperature is measured.
A rather tortuous path for the secondary fluid is machined in the thick copper wall
surrounded by an epoxy resin sheath (Fig. 1-3) working as an insulator, armature and support for thermocouple wires. The water flow passage geometry is described in Fig. 1-7. Crucial advantages of such a design reflect in the following characteristics:
-good coolant mixing and thus accurate temperature measurements along the
measuring sector is essential to obtain a reliable water temperature profile, which is used for determination of local heat flux;
-both the continuous interrupting of the boundary layer, due to the rather complex
coolant flow passage geometry, and the enhanced external wall surface area notably decrease the external heat transfer resistance, which is crucial for precise heat transfer coefficient measurements;

CHAPTER 1 25
-thermocouple wires embedded in the copper wall are led outside the measuring sites through the epoxy resin without passing through the coolant flow: in this way the error of the temperature measurements due to axial heat conduction along the thermocouple wire and the spurious emf’s build up for the presence of high temperature gradients is reduced to a minimum;
-the epoxy resin sheath does not only serve for accommodation of the
thermocouple wires and for the insulation purpose; it also plays an important role as the test section’s support.
In order to achieve low uncertainty in the measurement of the heat transfer
coefficient, the following characteristics of the minichannel test tube are required: -High external heat transfer coefficient. -Enhanced external surface area. -Homogeneous wall surface temperature distribution along the channel. -Low thermal resistance of the channel wall in radial direction. -High thermal resistance of the channel wall in axial direction. -Good coolant mixing. -Low pressure drop. The first two characteristics enhance the external heat transfer, which moves the
leading thermal resistance toward the refrigerant side. In this way, the wall to refrigerant temperature difference is increased at given heat flow rate, while the relative error of the corresponding temperature difference measurement is decreased. Enhanced external heat transfer should be achieved so as to avoid systematic errors in wall temperature measurement due to local temperature variations. Furthermore, a high thermal conductivity of the tube wall decreases the associated temperature gradients and thus the wall temperature error due to deviation in temperature sensor positioning. On the other hand, the high thermal conductivity of the test tube also promotes the axial heat conduction. Even though, much smaller in comparison with the radial one, the axial heat conduction is additionally reduced by the multiple groves in the wall thickness of the present design. Additionally, a precise coolant temperature profile measurement is also of paramount importance for high performance heat transfer coefficient measurements. Insufficient coolant mixing is probably one of the most frequent reasons for systematic errors in fluid temperature measurement. On the other hand, a flow passage geometry that enables good fluid mixing and enhanced heat transfer are usually associated with significant pressure drop. In this context, the present coolant flow passage geometry has turned out to offer an excellent performance behaviour for high precision HTC measurements inside a single minichannel.
An image of the test section is reported in Fig. 1-8. More details about test section design and building can be found in Matkovic (2006).

26 CHAPTER 1
Fig. 1-6. View of the circular minichannel test section.
Fig. 1-7. Schematic of the water flow passage geometry.
Fig. 1-8. Image of the test section before thermal insulating.

CHAPTER 1 27
1.4 Square minichannel
1.4.1 Description of the experimental section
The test section was designed with the aim of studying the experimental condensation inside a square channel (Fig. 1-9). The channel is obtained from a copper rod and has a square cross section with 1.18 mm side length. Each corner has a curvature radius equal to 0.15 mm, which leads to a hydraulic diameter equal to 1.23 mm.
Fig. 1-9. New test section: square channel.
Fig. 1-10. External side: pressure tap in the stainless steel and coolant channel in the copper rod.
The experimental technique adopted here is the same as the one used for the
circular channel (Matkovic et al., 2009). For this technique, both high conductivity copper rod and low conductivity stainless steel rod were used: the first material is used for the actual measuring sector while the second one is used for the adiabatic segments before and after the condensing sector. Therefore, copper and stainless steel round rods have been soldered together and then internally machined to obtain the square channel. Fig. 1-11 presents two images of the cross section of the channel, obtained by means of a microendoscope, at the conjunction of stainless steel and copper.
Fig. 1-10 shows some details of the external side before instrumenting it with thermocouples: the stainless steel segment and the coolant channel machined in the copper rod. The stainless steel is used to achieve thermal separation between the desuperheater and the measuring sector and between the measuring sector and the outlet to the test section. It also provides adiabatic sectors where measurement of the refrigerant temperature can be done with a good accuracy on the outer tube surface. Finally, the stainless steel is used to place the pressure taps, as can be seen in Fig. 1-10. The pressure taps allow to measure the pressure at inlet and outlet of the measuring sector.
28 CHAPTER 1
Fig. 1-11. Enlarged pictures taken with a microendoscope inside the channel: the square perimeter corresponds to the junction of stainless steel (blue) and copper (orange).
The coolant channel is obtained by machining the copper rod and then covering
the grooves. This design of the coolant channel is similar to the one already adopted for the test section in the round geometry: a sketch of the coolant channel is shown in Fig. 1-12. The coolant flows in the grooves and passes from one groove to the following one. The cuts in the copper shown in section A-A and B-B of Fig. 1-12 allow to allocate thermocouples for measurement of the water temperature. The thermocouples for the measurement of the wall temperature are placed in the copper fin. The advantages of such a geometry design can be summarized as follows:
- it facilitates accurate measurement of local “quasi-mixing cup” temperatures of
the water at low flow rates permitting evaluation of the local heat fluxes; - it provides improved precision in the evaluation of condensation heat transfer
coefficients owing to the large ratio of heat transfer surface areas; - it allows the insertion of many wall thermocouples without passing through the
cooling water, minimizing error due to conduction along the thermocouple wires, and due to spurious emf’s build up for the presence of high temperature gradients in the thermocouples wires.
CHAPTER 1 29
Fig. 1-12. Details of the coolant flow passage geometry.
Fig. 1-13 shows two stages of the fabrication process of the measuring section.
The coolant channel in the copper sector has been initially covered with epoxy resin. This covering film was holed in some places in order to insert the thermocouples for the measurement of the coolant temperature during condensation. Afterwards, other thermocouples have been inserted in the copper fins to measure the wall temperature.
On the whole, more than sixty thermocouples have been placed in the measuring section and some more have been embedded in the pre-sector which is located before the test section. The local heat flux can be obtained from the coolant temperature profile while the local heat transfer coefficient is determined from the saturation and wall temperatures.
After the construction, the test section was inserted in a glass cylinder to reduce heat dissipation and still permit to see the present test apparatus (Fig. 1-14).
A design of the test section with geometric dimensions is reported in Fig. 1-15. Finally, the onsite calibration of thermocouples has been performed and the
preliminary tests of condensation of R134a have been carried out.
Fig. 1-13. Fabrication of the new test section. Top: insertion of thermocouples in the water channel. Bottom: wires of thermocouples from the water channel and from the wall.

30 CHAPTER 1
Fig. 1-14. Image of the test section inserted in the glass cylinder.
CHAPTER 1 31
Fig. 1-15. Design of the test section. 1. Measuring sector; 2. Pre-sector; 3. Adiabatic sector MS outlet; 4. Adiabatic sector MS inlet; 5. Adiabatic sector PS inlet; (1) Soldering performed with inertial
atmosphere; (2) High precision positioning; (3) Soldering performed prior to the EDM (electrical discharge machining) of the rectangular minichannel.

32 CHAPTER 1
1.4.2 Calibration procedure
In the calibration of the present system the following actions have been performed to assure the accuracy of the measurements:
- on site calibration of thermocouples; - check of temperature and pressure under saturated conditions; - check of thermal balance in the test section. On-site calibration of the thermocouples installed in the wall and in the water
channel has been performed, especially with regards to the temperature difference among them. This on-site calibration is performed by circulating water under constant and adiabatic conditions; in order to avoid heat losses, vacuum is realized inside the minichannel. The calibration was performed using as reference thermometers two calibrated thermistors Pt100 located in the test section, at water inlet and outlet. Thermistors have been coupled with Hart Scientific Super-Thermometer II 1590; this configuration achieves an uncertainty of 0.002 °C on measured temperature. A correction function for each thermocouple is determined from the on-site calibration procedure. Wall and water temperatures measured by thermocouples are reported from Fig. 1-16 to Fig. 1-21. Each measured temperature refers to a mean value of 50 readings taken in 50 s during stationary conditions. The range of variation of the water and the wall thermocouples readings after the on-site calibration is equal to ± 0.03 K.
As a second check of the experimental apparatus, the refrigerant temperature at inlet and outlet to the measuring sector is measured during two-phase flow by means of a copper-constantan thermocouple. This temperature is compared to the saturation temperature obtained from the pressure: the disagreement is typically below 0.15 K, which is within the uncertainty range of the two instruments. Details are shown in Table 1-1.
Table 1-1. Refrigerant saturation temperature measurements.
Saturation temperature measured with
thermocouple [°C]
Saturation temperature obtained from pressure [°C]
Discrepancy [°C]
MS inlet 37.37 37.36 0.01 MS outlet 37.07 37.19 -0.12 The energy balance in the test section is checked by comparing the water side heat
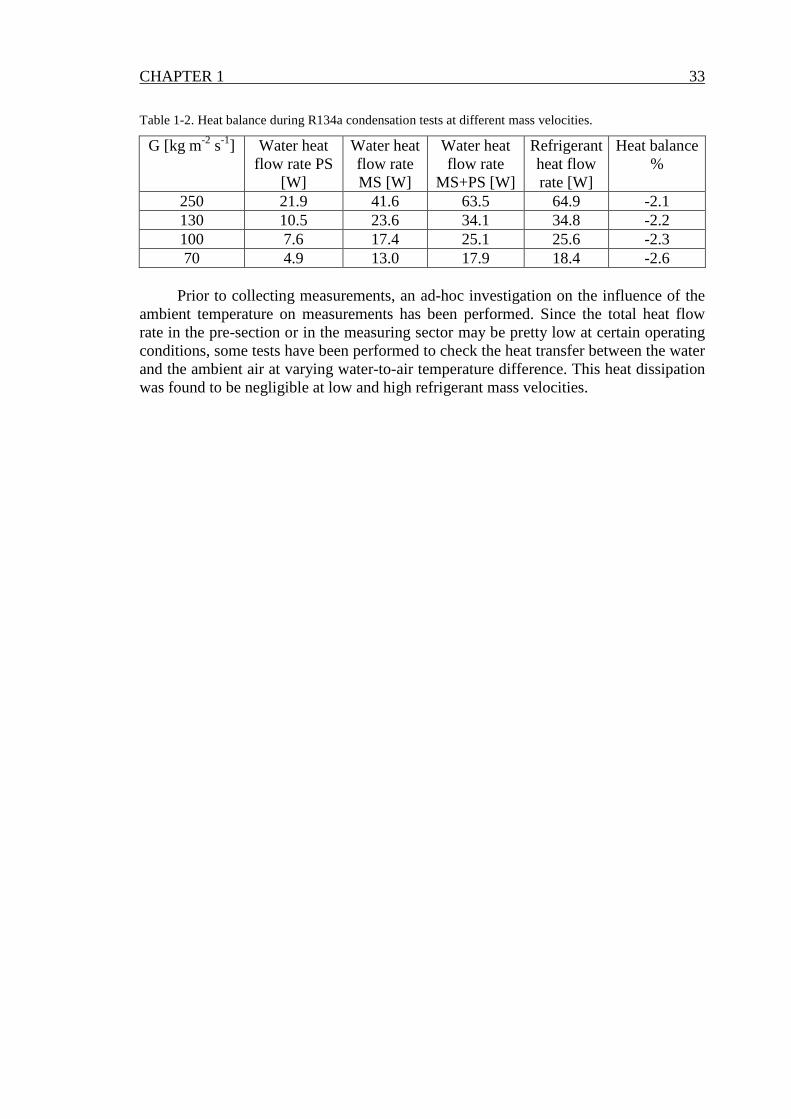
flow rate to the one calculated on the refrigerant side when superheated vapor enters the test section and subcooled liquid exits. Energy balance during condensation of R134a at different mass velocities is reported in Table 1-2. The difference between the heat flow rate measured on the water side (4th column in the table) and the heat flow rate measured on refrigerant side (5th column in the table) is equal to 2% for all mass velocities.
CHAPTER 1 33
Table 1-2. Heat balance during R134a condensation tests at different mass velocities.
G [kg m-2 s-1] Water heat flow rate PS
[W]
Water heat flow rate MS [W]
Water heat flow rate
MS+PS [W]
Refrigerant heat flow rate [W]
Heat balance %
250 21.9 41.6 63.5 64.9 -2.1 130 10.5 23.6 34.1 34.8 -2.2 100 7.6 17.4 25.1 25.6 -2.3 70 4.9 13.0 17.9 18.4 -2.6
Prior to collecting measurements, an ad-hoc investigation on the influence of the
ambient temperature on measurements has been performed. Since the total heat flow rate in the pre-section or in the measuring sector may be pretty low at certain operating conditions, some tests have been performed to check the heat transfer between the water and the ambient air at varying water-to-air temperature difference. This heat dissipation was found to be negligible at low and high refrigerant mass velocities.

34 CHAPTER 1
22.8
22.9
23.0
23.1
23.2
23.3
0 10 20 30 40 50 60POSITION [mm]
TE
MP
ER
AT
UR
E [°
C]
0.000
0.020
0.040
0.060
0.080
0.100
ST
AN
D. D
EV
. [°C
]
Wall
Water
Water IN/OUT
Super-Thermometer
Fig. 1-16. Water temperature and wall temperature in the pre-sector before on-site calibration. Water enters the pre-sector at ambient temperature. Big square dots represent standard deviation of wall
temperature measurements.
23.7
23.8
23.9
24.0
24.1
24.2
24.3
0 40 80 120 160 200 240POSITION [mm]
TE
MP
ER
AT
UR
E [°
C]
0.000
0.020
0.040
0.060
0.080
0.100
ST
AN
D. D
EV
. [°C
]
WallWaterWater IN/OUTSuper-Thermometer
Fig. 1-17. Water temperature and wall temperature in the measuring-sector before on-site calibration.
Water enters the measuring-sector at ambient temperature. Big square dots represent standard deviation of wall temperature measurements.
27.30
27.35
27.40
27.45
27.50
0 10 20 30 40 50 60POSITION [mm]
TE
MP
ER
AT
UR
E [°
C]
0.000
0.020
0.040
0.060
0.080
0.100
ST
AN
D. D
EV
. [°C
]
Wall
Water
Water IN/OUT
Super-Thermometer
Fig. 1-18. Water temperature and wall temperature in the pre-sector after on-site calibration. Water enters the pre-sector at ambient temperature. Big square dots represent standard deviation of wall
temperature measurements.
25.20
25.25
25.30
25.35
25.40
0 40 80 120 160 200 240POSITION [mm]
TE
MP
ER
AT
UR
E [°
C]
0.000
0.020
0.040
0.060
0.080
0.100
ST
AN
D. D
EV
. [°C
]
WallWaterWater IN/OUTSuper-Thermometer
Fig. 1-19. Water temperature and wall temperature in the measuring-sector after on-site calibration. Water enters the measuring-sector at ambient
temperature. Big square dots represent standard deviation of wall temperature measurements.

CHAPTER 1 35
29.30
29.35
29.40
29.45
29.50
0 40 80 120 160 200 240POSITION [mm]
TE
MP
ER
AT
UR
E [°
C]
0.000
0.020
0.040
0.060
0.080
0.100
ST
AN
D. D
EV
. [°C
]
WallWaterWater IN/OUTSuper-Thermometer
Fig. 1-20. Water temperature and wall temperature in the measuring-sector after on-site calibration. Water enters the measuring-sector at 30°C. Big square dots represent standard deviation of wall
temperature measurements.
38.10
38.15
38.20
38.25
38.30
0 40 80 120 160 200 240POSITION [mm]
TE
MP
ER
AT
UR
E [°
C]
0.000
0.020
0.040
0.060
0.080
0.100
ST
AN
D. D
EV
. [°C
]
WallWaterWater IN/OUTSuper-Thermometer
Fig. 1-21. Water temperature and wall temperature in the measuring-sector after on-site calibration. Water enters the measuring-sector at 38°C. Big square dots represent standard deviation of wall
temperature measurements.

36 CHAPTER 1
37
Chapter 2.
Heat transfer and pressure drop during
single-phase flow of R245fa and R32 inside
the circular minichannel
2.1 Introduction
In the recent years numerous single-phase experiments have been carried out in order to evaluate the accuracy of conventional theory in micro-scale. Celata et al. (2009) investigated the friction factor during compressible flow of nitrogen gas inside microtubes ranging from 30 to 500 µm. Their work demonstrates that classical correlations can predict frictional factor in laminar flow without revealing any influence of the surface roughness; beyond this, in the fully development turbulent regime, an agreement between experimental data and Blasius correlation was found for smooth tubes.
Several investigations on single-phase flow in minichannels have demonstrated that the underlying mechanism in heat transfer is the same observed in conventional channels. Celata et al. (2007) studied laminar and turbulent heat transfer in uniformly heated microtubes from 0.5 mm down to 0.12 mm. Heat transfer coefficient in turbulent flow was found to agree with classic Gnielinski (1993) correlation; for the laminar flow and fully developed flow the experimental Nusselt number approached the theoretical value Nu=4.36 for uniformly heated wall.
From this point of view, single-phase pressure drop has been measured to characterize the test channel and liquid-phase heat transfer tests have been performed to check the experimental procedure. The length of the channel is equal to 228.5 mm.
The friction factor has been measured during adiabatic flow of R245fa and R32 in subcooled liquid state and in superheated vapour state. Since in the turbulent region it depends on the surface roughness, the internal surface roughness of the copper channel has been measured with the digital surface roughness machine ZEISS-TSK Surfcom 1400A. The measurements have been performed moving axially at different circumferential positions. The mean roughness Ra, as defined by the ISO 4287:1997, ranges between 2.01 µm and 2.76 µm, with a mean value equal to 2.34 µm.
The local heat transfer coefficients have also been measured during liquid-phase flow of R245fa in heating mode and R32 in cooling mode.

38 CHAPTER 2
2.2 Pressure drop during R245fa and R32 single-phase flow
In Fig. 2-1 the measured friction factor is reported as a function of Reynolds number. In the laminar region experimental data are in good agreement with the Hagen-Poiseuille correlation; in the turbulent zone a good estimation of the experimental points is obtained by the Churchill equations (1977). More details on the geometry and the procedure used to obtain the friction factor can be found in Cavallini et al. (2009).
0.001
0.010
0.100
100 1000 10000 100000
Re [/]
f [/]
R245faR32BlasiusChurchillHagen-Poiseuille
Fig. 2-1. Friction factor versus Reynolds number.

CHAPTER 2 39
2.3 Heat transfer during liquid-phase flow
Wall temperatures, water temperatures and refrigerant temperatures during heating of R245fa are shown in Fig. 2-2, Fig. 2-4, Fig. 2-6 as function of the axial position along the channel, for a refrigerant mass velocity ranging from 700 to 1500 kg m-2 s-1. Similar graphs are reported in, Fig. 2-8, Fig. 2-10 and Fig. 2-12 for R32 liquid-phase heat transfer test performed in heating mode.
In these test runs, the refrigerant enters the measuring sector in the thermodynamic state of subcooled liquid. Refrigerant heating or cooling is obtained by heat transfer with the secondary fluid (water) that flows in counter-flow outside the minichannel.
Local liquid-phase heat transfer coefficient inside the minichannel is determined as follows:
( ) ( )( ) ( )
'
r w
q zHTC z
T z T z=
− (2-1)
An exponential function has been adopted for interpolation of water temperatures.
The fitting curve was calculated by minimum square method:
( ) 1 2z
wT z C e Cγ− ⋅= ⋅ + (2-2)
where C1, C2, and γ are the coefficients determined by minimum square method. The slope of the water temperature profile measured along the channel is used to
calculate the local heat flux.
,
d ( )1'( )
dw
w p wi
T zq z m c
d zπ= − ⋅ ⋅
⋅ɺ (2-3)
The refrigerant temperature profile was determined from the temperature of
refrigerant measured at the channel inlet and from the thermal balance on the water side.
( ) ( ) ( ) ,,
,
0 w p wr r in w w
r p r
m cT z T T z T z
m c
⋅= − = − ⋅ ⋅
ɺ
ɺ (2-4)
A comparison between the measured heat transfer coefficient and correlations
reported in VDI (1993) and VDI (2002) is illustrated in Fig. 2-3, Fig. 2-5, Fig. 2-7 for R245fa and in Fig. 2-9, Fig. 2-11, Fig. 2-13 for R32. The Reynolds number was varied from 1500 to 13000; the agreement between experimental data and calculated values is very satisfactory at all mass flow rates, although the temperature difference between refrigerant and wall is very low.

40 CHAPTER 2
8
12
16
20
24
28
32
36
40
44
0 40 80 120 160 200 240POSITION [mm]
TE
MP
ER
AT
UR
E [°
C]
water
water in/out
wall
R245fa
Fig. 2-2. Temperature profiles during R245fa liquid flow at G=1500 kg m-2 s-1.
0
1000
2000
3000
4000
0 40 80 120 160 200 240POSITION [mm]
HT
C [W
m-2
K-1
]
EXPERIMENTAL HTCHTC Gnielinski VDI 1993HTC Gnielinski VDI 2002
Fig. 2-3. Experimental local heat transfer coefficient during liquid flow at G=1500 kg m-2 s-1and Re=3200 compared to correlation for forced convective heat transfer.

CHAPTER 2 41
8
12
16
20
24
28
32
36
40
44
0 40 80 120 160 200 240POSITION [mm]
TE
MP
ER
AT
UR
E [°
C]
water water in/out
wallR245fa
Fig. 2-4. Temperature profiles during R245fa liquid flow at G=1100 kg m-2 s-1.
0
1000
2000
3000
0 40 80 120 160 200 240POSITION [mm]
HT
C [W
m-2
K-1
]
EXPERIMENTAL HTCHTC VDI 1993HTC VDI 2002
Fig. 2-5. Experimental local heat transfer coefficient during liquid flow at G=1100 kg m-2 s-1and Re=2300 compared to correlation for forced convective heat transfer.

42 CHAPTER 2
8
12
16
20
24
28
32
36
40
44
0 40 80 120 160 200 240POSITION [mm]
TE
MP
ER
AT
UR
E [°
C]
water
water in/out
wall
R245fa
Fig. 2-6. Temperature profiles during R245fa liquid flow at G=700 kg m-2 s-1.
0
200
400
600
800
1000
1200
1400
1600
0 40 80 120 160 200 240POSITION [mm]
HT
C [W
m-2
K-1
]
EXPERIMENTAL HTCHTC VDI 1993HTC VDI 2002
Fig. 2-7. Experimental local heat transfer coefficient during liquid flow at G=700 kg m-2 s-1and Re=1500 compared to correlation for forced convective heat transfer.

CHAPTER 2 43
8
12
16
20
24
28
32
36
40
44
0 40 80 120 160 200 240POSITION [mm]
TE
MP
ER
AT
UR
E [°
C]
water
water in/out
wall
R32
Fig. 2-8. Temperature profiles during R32 liquid flow at G=1560 kg m-2 s-1.
0
1000
2000
3000
4000
5000
6000
7000
8000
9000
10000
0 40 80 120 160 200 240POSITION [mm]
HT
C [W
m-2
K-1
]
EXPERIMENTAL HTCHTC Gnielinski VDI 1993HTC Gnielinski VDI 2002
Fig. 2-9. Experimental local heat transfer coefficient during liquid flow at G=1560 kg m-2 s-1and Re=13000 compared to correlation for forced convective heat transfer.

44 CHAPTER 2
8
12
16
20
24
28
32
36
40
44
0 40 80 120 160 200 240POSITION [mm]
TE
MP
ER
AT
UR
E [°
C]
water
water in/out
wall
R32
Fig. 2-10. Temperature profiles during R32 liquid flow at G=1100 kg m-2 s-1.
0
1000
2000
3000
4000
5000
6000
7000
8000
9000
10000
0 40 80 120 160 200 240POSITION [mm]
HT
C [W
m-2
K-1
]
EXPERIMENTAL HTCHTC Gnielinski VDI 1993HTC Gnielinski VDI 2002
Fig. 2-11. Experimental local heat transfer coefficient during liquid flow at G=1100 kg m-2 s-1and Re=9200 compared to correlation for forced convective heat transfer.

CHAPTER 2 45
8
12
16
20
24
28
32
36
40
44
0 40 80 120 160 200 240POSITION [mm]
TE
MP
ER
AT
UR
E [°
C]
water
water in/out
wall
R32
Fig. 2-12. Temperature profiles during R32 liquid flow at G=800 kg m-2 s-1.
0
1000
2000
3000
4000
5000
6000
7000
8000
9000
10000
0 40 80 120 160 200 240POSITION [mm]
HT
C [W
m-2
K-1
]
EXPERIMENTAL HTCHTC Gnielinski VDI 1993HTC Gnielinski VDI 2002
Fig. 2-13. Experimental local heat transfer coefficient during liquid flow at G=800 kg m-2 s-1and Re=6600 compared to correlation for forced convective heat transfer.

46 CHAPTER 2

47
Chapter 3.
Condensation heat transfer of high and low
pressure refrigerants flowing in the single
circular minichannel
3.1 Introduction
A 0.96 mm circular minichannel is used to measure both heat transfer coefficients during condensation of the refrigerants R32 and R245fa.
Test runs have been performed at around 40°C saturation temperature, corresponding to 24.8 bar saturation pressure for R32 and 2.5 bar saturation pressure for R245fa.
The heat transfer experimental data are compared against predicting models to provide a guideline for the design of minichannel condensers.
3.2 State of the art
A significant and still growing part of the engineering research community has been devoted in the last few decades to scaling down devices, while keeping or even increasing their functionality. The introduction of minichannels in the field of enhanced heat and mass transfer is surely one of those attempts. As a result, compact heat exchangers and heat pipes can be found in a wide variety of applications: from residential air-conditioning to the spacecraft thermal control. Growing interest for different solutions can also be found in electronic cooling, though these applications are less interesting from the condensation point of view due to its exothermal nature. Compact elements work with reduced refrigerant charge and can usually withstand extremely high system pressures.
Two-phase flow in rough minichannels is affected by gravity, inertia, viscous shear and surface tension. These forces influence flow regimes, pressure drop and heat transfer.
Some researchers observed flow regimes during condensation of R134a in minichannels, but no general flow regime map is available. For instance, Coleman and

48 CHAPTER 3
Garimella (2000) reported flow patterns of R134a condensing in horizontal tubes and square minichannels with inner hydraulic diameters ranging from 1 to 4.9 mm. At mass velocities G>150 kg m-2 s-1 the authors observed annular, wavy, intermittent (slug, plug) and dispersed (bubble) flow patterns. At hydraulic diameters Dh < 1 mm the wavy regime was not present while at high flow rates and qualities, annular film with mist core or mist flows were present. While the hydraulic diameter was found to have a substantial effect on flow transitions, tube shape was found to be less significant. Several other authors have performed visualisations in minichannels, as reported in Cavallini et al. (2006b), but no specific visualisation with high pressure fluids has been done.
As it is for visualization, most of the heat transfer data available in the literature for condensation inside minichannels were taken with the fluid R134a and in most cases multiport channels have been used. In multiport tubes, averaged values over a number of parallel channels are measured instead of the heat transfer coefficient in one single channel.
Actually it is not an easy task to perform local heat transfer coefficient measurements during condensation inside a single minichannel and it may be more complicated as compared to the flow boiling case, where electrical heating can be adopted. In this context, a new experimental apparatus for the measurement of the local heat transfer coefficients inside the single minichannel has been recently set up at the University of Padova. With this apparatus, condensation tests have been performed in a 0.96 mm diameter circular channel.
The fluids investigated in this chapter are the single-component refrigerants R32 and R245fa, a high and a low pressure fluid, respectively.
Table 3-1 reports their main physical properties at 40°C compared to the corresponding values of R134a. R32 is a much higher pressure refrigerant as compared to R134a; its vapour density exceeds the value of R134a by 46%, while its liquid viscosity is significantly lower. R245fa displays an opposite behaviour, with much lower vapour density and higher liquid viscosity. The surface tension of R32 is slightly lower than that of R134a (by 20%) while its liquid thermal conductivity is higher by 50%. The surface tension of R245fa is twice the value of R134a and 2.7 times the value of R32.
Table 3-1. Properties of saturated R32 and R245fa compared to R134a at 40°C, corresponding to 24. 8 bar and 2.5 bar for R32 and R245fa, respectively. Each value is the ratio to the corresponding R134a property value at the same temperature.
Property ratio R245fa/R134a R32/R134a Liquid density 1.13 0.78 Vapour density 0.28 1.46 Liquid thermal conductivity 1.14 1.53 Vapour thermal conductivity 0.98 1.21 Liquid viscosity 2.08 0.59 Vapour viscosity 0.87 1.17 Surface tension 1.98 0.73

CHAPTER 3 49
In practical applications, the use of a high pressure refrigerant can mitigate the disadvantage of the high pressure drop due to the small channel diameter. R32 also displays high thermal conductivity, which is favourable to high heat transfer coefficients during condensation. On the contrary, R245fa displays much lower saturation pressure and can be used when a low system pressure is searched.
The reason for studying those two fluids is that they display a wide range of fluid properties and therefore they can be used for proper validation of predicting models.
3.3 Condensation tests
In order to investigate condensation heat transfer within a single minichannel a unique measuring test section has been designed and built (Matkovic et al., 2009).
The test rig arranged for heat transfer and pressure drop measurements during condensation is depicted in Fig. 3-1. It consists of the primary refrigerant loop and four auxiliary loops. The subcooled refrigerant is sent through a filter and a drier into the gear pump coupled with a variable speed electric motor. It is then pumped through the Coriolis-effect mass flow meter into the evaporator where the fluid is heated up, vaporized and superheated. At the evaporator exit, the temperature and the pressure define the state of the superheated vapor.
The superheated vapor enters the test section, which is composed of two counter current heat exchangers. The first one (desuperheater) is used to cool down the fluid to the saturation state at the inlet of the second heat exchanger, which is the actual measuring sector.
The saturation temperature is checked against pressure in the two adiabatic sectors upstream and downstream of the measuring sector. There, the temperature is detected by means of adiabatic wall temperature measurements. Saturated refrigerant enters the measuring sector, where the measurement is performed. The refrigerant state is finally measured at the outlet of the measuring sector and the loop closes in the post-condenser, where it is condensed and subcooled. The temperatures and the flow rates of the secondary loops are controlled by a closed hot water loop, two thermal baths and an additional resistance heater set in series at the inlet of the desuperheater. In this way, it is possible to independently control the temperatures of four different heat sinks or heat sources within the test rig.

50 CHAPTER 3
Fig. 3-1. Experimental test rig. (DESUP.=desuperheater, MF=mechanical filter, HF=drier, PV=pressure vessel, CFM=Coriolis-effect
mass flow meter, P=pressure transducer, T=temperature transducer, DP=differential pressure transducer).
The test tube is a commercial copper tube with inner diameter 0.96 mm and 228.5
mm length. The test section is made of a straight single minichannel with two diabatic and
two adiabatic sectors along its length. The diabatic sectors work as heat exchangers with the presence of a secondary fluid, which is water. The two sectors are made from an 8 mm external diameter copper rod with a 0.96 mm internal bore which is the minichannel itself. The thick-walled tube was machined externally so as to obtain a cooling water channel within the wall thickness. The tortuous path for the secondary fluid, closed with plastic sheath, enables a good water mixing and thus allows precise local coolant temperature measurements. In this test section, fifteen thermocouples have been inserted into the water channel along the measuring sector (MS) in order to measure the coolant temperature profile. The enhanced coolant heat transfer surface area moves the thermal resistance toward the internal side and thus reduces the experimental heat transfer coefficient uncertainty due to the refrigerant to wall temperature difference.
In order to measure precise local heat transfer coefficient values thirteen thermocouples have been inserted into the wall thickness, near the minichannel along the measuring sector, without having the thermocouple wires cross the coolant path. Furthermore, one single thermocouple and one thermopile are used to know the refrigerant temperature by recording the external wall surface temperature of the adiabatic sectors – stainless steel capillary tubes at the two extremes of the measuring

CHAPTER 3 51
sector. When operating in condensation mode, the first diabatic sector works as a desuperheater. To avoid large temperature gradients at the inlet of the measuring sector the desuperheater is used to cool down the superheated refrigerant to the saturation state at the inlet of the measuring sector. Vapour quality is there obtained from the thermal balance on the coolant side, whereas saturation conditions are checked using the adiabatic wall temperature and the pressure measurement in the adiabatic sectors.
The following three parameters are used for the determination of the local heat transfer coefficient: the local heat flux, the saturation temperature and the wall temperature. The heat flux is determined from the temperature profile of the coolant in the measuring sector. The wall temperature is directly measured along the test section and the saturation temperature is measured in the adiabatic segments at the inlet and outlet of the test tube and checked through pressure transducers.
The coolant temperature profile is obtained from the thermocouples set in the water channel along the measuring sector (Fig. 3-2).
Fig. 3-2. Temperature measurements within the single minichannel test section.
The derivative of the temperature profile is proportional to the local heat flux:
,
d ( )1'( )
dw
w p wi
T zq z m c
d zπ= − ⋅ ⋅
⋅ɺ (3-1)
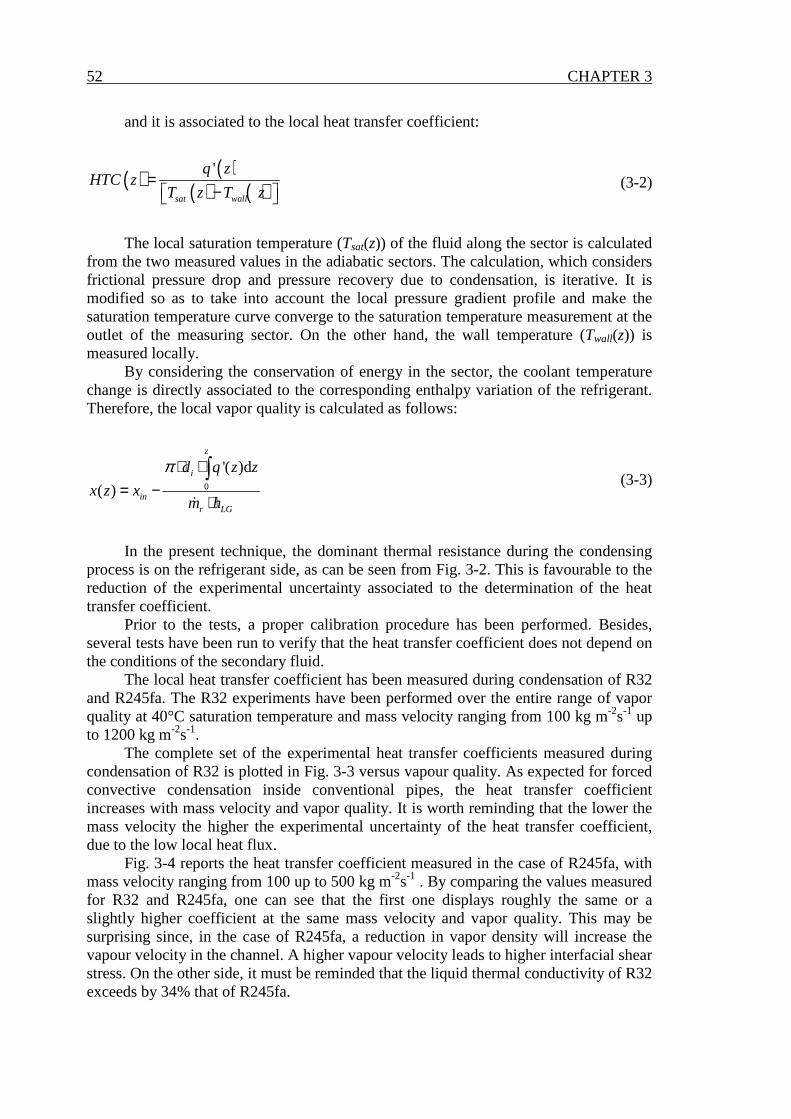
52 CHAPTER 3
and it is associated to the local heat transfer coefficient:
( ) ( )( ) ( )
'
sat wall
q zHTC z
T z T z=
− (3-2)
The local saturation temperature (Tsat(z)) of the fluid along the sector is calculated
from the two measured values in the adiabatic sectors. The calculation, which considers frictional pressure drop and pressure recovery due to condensation, is iterative. It is modified so as to take into account the local pressure gradient profile and make the saturation temperature curve converge to the saturation temperature measurement at the outlet of the measuring sector. On the other hand, the wall temperature (Twall(z)) is measured locally.
By considering the conservation of energy in the sector, the coolant temperature change is directly associated to the corresponding enthalpy variation of the refrigerant. Therefore, the local vapor quality is calculated as follows:
0
'( )d
( )
z
i
inr LG
d q z z
x z xm h
π ⋅ ⋅= −
⋅
∫ɺ
(3-3)
In the present technique, the dominant thermal resistance during the condensing
process is on the refrigerant side, as can be seen from Fig. 3-2. This is favourable to the reduction of the experimental uncertainty associated to the determination of the heat transfer coefficient.
Prior to the tests, a proper calibration procedure has been performed. Besides, several tests have been run to verify that the heat transfer coefficient does not depend on the conditions of the secondary fluid.
The local heat transfer coefficient has been measured during condensation of R32 and R245fa. The R32 experiments have been performed over the entire range of vapor quality at 40°C saturation temperature and mass velocity ranging from 100 kg m-2s-1 up to 1200 kg m-2s-1.
The complete set of the experimental heat transfer coefficients measured during condensation of R32 is plotted in Fig. 3-3 versus vapour quality. As expected for forced convective condensation inside conventional pipes, the heat transfer coefficient increases with mass velocity and vapor quality. It is worth reminding that the lower the mass velocity the higher the experimental uncertainty of the heat transfer coefficient, due to the low local heat flux.
Fig. 3-4 reports the heat transfer coefficient measured in the case of R245fa, with mass velocity ranging from 100 up to 500 kg m-2s-1 . By comparing the values measured for R32 and R245fa, one can see that the first one displays roughly the same or a slightly higher coefficient at the same mass velocity and vapor quality. This may be surprising since, in the case of R245fa, a reduction in vapor density will increase the vapour velocity in the channel. A higher vapour velocity leads to higher interfacial shear stress. On the other side, it must be reminded that the liquid thermal conductivity of R32 exceeds by 34% that of R245fa.

CHAPTER 3 53
In the case of R32 data (Fig. 3-3), the experimental heat transfer coefficients measured at 100 kg m-2s-1 and those at 200 kg m-2s-1 are very close to each other, showing little effect of mass velocity at these conditions. This overlapping of the heat transfer coefficients at the lower tested values of mass velocity is not found with the refrigerant R245fa, whose trend at low mass velocity is as expected from macroscale condensation. The behaviour experienced with R32 may be explained with a different flow pattern occurring in the channel.
0
5000
10000
15000
20000
25000
30000
0.0 0.1 0.2 0.3 0.4 0.5 0.6 0.7 0.8 0.9 1.0VAPOUR QUALITY [/]
HT
C [W
m-2
K-1
]
G1200G1000G800G600G400G200G100
Fig. 3-3. Heat transfer coefficient measured during condensation of R32 in the channel versus vapour quality.

54 CHAPTER 3
0
2000
4000
6000
8000
10000
12000
0.0 0.1 0.2 0.3 0.4 0.5 0.6 0.7 0.8 0.9 1.0VAPOUR QUALITY [/]
HT
C [W
m-2
K-1
]
G500
G400
G300
G200
G100
Fig. 3-4. Heat transfer coefficient measured during condensation of R245fa in the channel versus vapour quality.
3.4 Sensitivity to inlet vapour quality conditions
Fig. 3-5 shows the heat transfer coefficient during condensation of R32 at mass velocity equal to 600 kg m-2 s-1. Five tests have been performed at different vapour inlet conditions; inlet vapour quality ranges between 0.78 and 0.95. The local heat transfer coefficient determined in different test runs doesn’t depend on inlet conditions. These tests show that the local heat transfer coefficient at fixed refrigerant conditions (mass velocity, pressure, vapour quality) is independent on axial location where the coefficient is measured.

CHAPTER 3 55
0
5000
10000
15000
20000
0.0 0.1 0.2 0.3 0.4 0.5 0.6 0.7 0.8 0.9 1.0VAPOUR QUALITY [/]
HT
C [W
m-2
K-1
]
xin=0.95xin=0.91xin=0.87xin=0.82xin=0.78
Fig. 3-5. Heat transfer coefficient measured during condensation of R32, mass velocity 600 kg m-2 s-1, and different vapour inlet conditions.
3.5 Pressure drop tests
In this paragraph pressure drops measured during condensation of R32 and R245fa are reported. Test runs utilized for pressure drop measurements are the same used for heat transfer coefficient measurements (Fig. 3-3 and Fig. 3-4).
The minichannel has a surface roughness Ra=2.34 µm, the maximum height of profile Rz is 17.4 µm. The inlet and outlet pressure ports are inserted in two stainless steel tubes 24 mm long, attached to the ends of the copper tube. The stainless steel tubes have 0.762 mm inner diameter, Ra = 2.0 µm and Rz = 10.2 µm. The total measured pressure variation is the sum of the total frictional pressure drop and the pressure gain due to momentum change. The total frictional pressure drop is then the sum of the frictional pressure drop in the two stainless steel tubes, of the frictional pressure drop in the 228.5 mm long copper tube and of the pressure variations due to one abrupt enlargement (from 0.762 mm diameter to 0.96 mm diameter) and one contraction (from 0.96 mm to 0.762 mm).
Fig. 3-6 shows the total experimental pressure drop for R32 and R134a condensing at 40°C, compared with Cavallini et al. (2009) model. Pressure drops due to enlargement and contraction are calculated with Paliwoda (1992) equations.

56 CHAPTER 3
+20%
-20%
0
10
20
30
40
50
60
0 10 20 30 40 50 60EXPERIMENTAL ∆∆∆∆P [KPa]
PR
ED
ICT
ED
∆∆ ∆∆P
[KP
a]
R245fa
R32
Fig. 3-6. Experimental pressure drop during condensation compared with model by Cavallini et al. (2009).
3.6 Uncertainty analysis
The experimental uncertainties of the measured parameters are reported in Table 3-2. On-site calibrations of the thermocouples installed in the wall and in the water channel is carried out, in order to improve the accuracy of the measurements, especially with regards to the temperature difference among them.
Table 3-2. Type B experimental uncertainty of measured parameters.
Temperature ± 0.05 °C Temperature difference (with thermopile) ± 0.03 °C Water flow rate PS ±0.15±[(0.005/flow rate)·100] % of rate
flow rate expressed in kg/h Water flow rate MS ±0.10±[(0.004/flow rate)·100] % of rate
flow rate expressed in kg/h Refrigerant flow rate ±0.15±[(0.001/flow rate)·100] % of rate
flow rate expressed in kg/h Absolute pressure ± 5 kPa level of confidence 3σ Pressure difference ± 0.1 kPa level of confidence 3σ
CHAPTER 3 57
The uncertainty associated with channel diameter is determined starting from an enlarged image of the minichannel obtained by a microscope. The diameter uncertainty, that includes dimensional tolerance and geometric tolerance, is equal to 0.02 mm.
The main component of the experimental uncertainty affecting heat transfer coefficient is due to the uncertainty associated to the measurement of the heat flux. An uncertainty analysis on measured heat transfer coefficient and vapour quality was conducted. Experimental uncertainty is made up by two parts: the first component is the type A uncertainty that derives from repeated observations, the second one is type B uncertainty that derives from instruments calibration and manufacturer’s specifications.
All experimental measurements (temperature, pressure, mass flow rate) are taken as a mean value of 50 readings with a time step of 1 s.
For the temperature, the average value and the standard deviations are calculated from (3-4) and (3-5) respectively.
1
1 n
kk
t tn =
= ∑ (3-4)
( ) ( )1
1
1
n
k kks t t t
n == −
− ∑ (3-5)
For the pressure and the mass flow rate, the average values and the standard
deviations are calculated from the previous expressions substituting temperature with pressure and mass flow rate.
According to ISO Guide to the Expression of Uncertainty in Measurement (1995), Type A standard uncertainty is given by the experimental standard deviation of the mean as follows:
( ) ( ) ( )ks tu t s t
n= = (3-6)
The heat transfer coefficient is obtained from measured quantities as reported
below:
( ) ( )( ) ( )
( )
( ) ( )
( )
,
, , , ,
ww p w
i sat wall i sat wall
ww sat wall i
dT zm cq z dzHTC z
d T z T z d T z T z
dTHTC z f m T T d
dz
π π
−= =
⋅ − ⋅ −
=
ɺ
ɺ
(3-7)
Vapour quality at MS inlet is obtained by thermal balance between refrigerant and
water in the PS as reported in Eq. (3-8) and Eq. (3-9). Local vapour quality is calculated with a thermal balance between refrigerant and
water in the MS as reported in Eq. (3-10).
58 CHAPTER 3
,sup ,
w PSin p w PS
r
mh h c T
m= − ⋅ ⋅ ∆
ɺ
ɺ (3-8)
( ), , ,in Lin w PS r PS
V L
h hx f m m T
h h
−= = ∆−
ɺ ɺ (3-9)
( ) ( )( ), , ,
, ,( ) , , , ,w MS p w w out w
in in w MS r w out wr LG
m c T T zx z x f x m m T T z
m h
− = − =⋅
ɺ
ɺ ɺ
ɺ (3-10)
The combined standard uncertainty is obtained by combining appropriately the
Type A and Type B standard uncertainties of the measured quantities as follows:
( )1,.. ny f x x= (3-11)
( ) ( )2
2
1
n
c iii
fu y u x
x=
∂= ∂ ∑ (3-12)
A specific procedure has been implemented for determining the uncertainty
associated with temperature gradient. A temperature variation equal to thermocouple uncertainty has been imposed on each water thermocouple; therefore 215 varied water temperature profiles have been obtained, corresponding to all possible water temperature configurations compatible with experimental uncertainty. For each location z along the channel, 215 values of the temperature gradient have been calculated obtaining a Gaussian distribution. The standard deviation of temperature gradient distribution is the uncertainty associated with temperature gradient.
The expanded uncertainty UM is obtained by multiplying the combined standard uncertainty by a coverage factor k=2 with an interval having a level of confidence of approximately 95%.
( )M cU k u y= (3-13)
In Fig (3-7 and (3-8 HTC and vapour quality uncertainty are reported for all
condensation test performed with R32 and R245fa. In Fig. 3-9 and (3-10 percentage uncertainty on HTC is illustrated for R32 and
R245fa condensation tests at G=400 kg m-2 s-1; the contributions to total uncertainty due to diameter uncertainty, heat flux and saturation-to-wall temperature difference are also represented. For both fluids the main contribution to the total HTC uncertainty is due to the uncertainty associated with heat flux measurement.

CHAPTER 3 59
0
5000
10000
15000
20000
25000
30000
0.0 0.1 0.2 0.3 0.4 0.5 0.6 0.7 0.8 0.9 1.0VAPOUR QUALITY [/]
HT
C [W
m-2
K-1
]
G1200G1000G800G600G400G200G100
Fig. 3-7. HTC and vapour quality experimental uncertainty during R32 condensation tests.
0
2000
4000
6000
8000
10000
12000
14000
0.0 0.1 0.2 0.3 0.4 0.5 0.6 0.7 0.8 0.9 1.0VAPOUR QUALITY [/]
HT
C [W
m-2
K-1
]
G500
G400
G300
G200
G100
Fig. 3-8. HTC and vapour quality experimental uncertainty during R234fa condensation tests.

60 CHAPTER 3
0
1
2
3
4
5
6
7
8
0.0 0.1 0.2 0.3 0.4 0.5 0.6 0.7 0.8 0.9 1.0VAPOUR QUALITY [/]
HT
C U
NC
ER
T. [
%]
Total
Diameter
Heat flux
Tref-Twall
Fig. 3-9. HTC percentage uncertainty during R32 condensation at G=400 kg m-2 s-1.
0
1
2
3
4
5
6
7
8
0.0 0.1 0.2 0.3 0.4 0.5 0.6 0.7 0.8 0.9 1.0VAPOUR QUALITY [/]
HT
C U
NC
ER
T. [
%]
Total
Diameter
Heat flux
Tref-Twall
Fig. 3-10. HTC percentage uncertainty during R245fa condensation at G=400 kg m-2 s-1.
CHAPTER 3 61
3.7 Assessment of heat transfer correlations
Experimental results have been compared against seven models available in the open literature and developed for HTC predictions inside macro-scale tubes and minichannels. The first correlation is the one by Akers et al. (1959); this correlation was developed for forced convective condensation within conventional tubes. As reported in Fig. 3-11 the model under predicts experimental data for all fluids.
In Fig. 3-13 a comparison between experimental HTC and Cavallini et al. (2003) model has been presented. The model is based on analogy of heat and momentum transfer. It has been designed for condensation inside macro-channels and encompasses all flow regimes. R32 data are well predicted by Cavallini et al. (2003) model; R245fa data are over predicted by the present model.
Cavallini et al. (2005) developed a model for heat transfer coefficient prediction during condensation inside minichannels. The model was designed for annular and annular-mist regime. All the data at mass velocities greater than 100 kg m-2 s-1 are well estimated by the model. R245fa and R32 data points at G=100 kg m-2 s-1 are under predicted by the model (Fig. 3-15).
The forth model used in the present comparison is the one by Cavallini et al. (2006), which was developed for macroscale condensation. It also accounts for the transition from ∆T-independent to ∆T-dependent region, where ∆T is the saturation minus wall temperature difference, but this transition is defined for conventional tubes, i.e. for channels with hydraulic diameters higher or equal to 3 mm. From flow pattern visualisation available in the open literature, one should expect that the stratified flow region is reduced in the case of minichannels, as compared to conventional tubes.
Besides, Matkovic et al. (2009) have shown no effect of the temperature difference in the heat transfer coefficient at 200 kg m-2s-1 with R32, confirming that the effect of gravity forces in an around 1 mm diameter channel is not significant in comparison with the other forces influencing the condensation heat transfer at this mass velocity.
In Fig. 3-25, the test runs at mass velocity ranging between 100 and 400 kg m-2s-1 are plotted in the diagram of dimensionless vapour velocity vs. Martinelli parameter. The transition provided by Cavallini et al. (2006) for macro tubes is also plotted: this transition curve divides the region characterized by annular flow condensation (upper area), where the heat transfer coefficient does not depend on the saturation minus wall temperature difference, from the region (bottom area) where the heat transfer coefficient is dependent on the above temperature difference. According to this map, all the data points at mass velocity higher or equal to 200 kg m-2s-1 lay in the ∆T independent region and may be predicted by using a model for annular flow condensation. Nevertheless, one should remind that this transition was developed for macroscale condensation and its extension to minichannels may require a proper validation.
Fig. 3-17 reports the comparison between experimental heat transfer coefficients vs. predicted values by using the correlation by Cavallini et al. (2006). Both R32 and R245fa data are very well predicted by this correlation, which is able to catch the experimental trend.
The only data points which are not accurately predicted are the ones measured with R32 at 100 kg m-2s-1, at moderate and high vapor quality. This can be seen by looking at Fig. 3-18, where the ratio of calculated to experimental heat transfer
62 CHAPTER 3
coefficients is plotted versus mass velocity and the model by Cavallini et al. (2006) is applied. This disagreement is not found with R245fa data (Fig. 3-18).
At mass velocity higher or equal to 200 kg m-2 s-1, where the condensation heat transfer is likely to be dominated by shear stress, the macroscale model can accurately predict the heat transfer coefficient for both fluids. At lower mass velocity, where for instance the agreement with R32 data is not sufficiently accurate, the computation procedure based on macroscale condensation data may not be always applicable to minichannels.
In Fig. 3-19 a comparison between experimental HTC and predicted HTC by Koyama et al. (2003) model is presented. The model was developed to predict heat transfer coefficients in small diameter tube having an inside diameter around 1 mm. Satisfactory agreement between R245fa data and predicted results is obtained; instead R32 experimental data are under predicted by 40%.
Moser et al. (1998) model was initially developed for conventional pipes and later on modified by using the Zhang and Webb (2001) method for pressure drop calculation inside small-diameter tubes. Although all the data points have been compared to the models, this correlation should be applied only to annular flow condensation.
The comparison between experimental values and predictions is depicted in Fig. 3-21. As one can see, the model by Moser et al. (1998) modified with the Zhang and Webb (2001) pressure drop correlation is in good agreement with R32 data but overestimates R245fa data by 30%.
The values of the heat transfer coefficient measured with R32 at 100 kg m-2 s-1 are not well predicted by the model, but this may be due to the different flow pattern occurring in the channel in this case. As previously stated, the correlation was developed only for annular flow condensation and therefore it is questionable if the data at 100 kg m-2 s-1 mass velocity may be included in the comparison.
Finally experimental data are compared in Fig. 3-23 with Wang et al. (2002) model. The model has been developed for condensation inside minichannels. Two correlation are utilized in the model for annular flow and stratified flow. R245fa experimental data are over predicted by 15%; R32 data are under predicted by 30%.

CHAPTER 3 63
+20%
-20%
0
5
10
15
20
25
0 5 10 15 20 25EXPERIMENTAL HTC [kW m -2 K -1]
PR
ED
ICT
ED
HT
C [k
W m
-2 K
-1]
R245fa
R32
Fig. 3-11. Comparison with Akers et al. (1959) model.
0.20
0.40
0.60
0.80
1.00
1.20
1.40
1.60
1.80
2.00
0 200 400 600 800 1000 1200
MASS VELOCITY [kg m -2s -1]
CA
LC /
EX
P H
TC
[/]
R245fa
R32
Fig. 3-12. Akers et al. (1959) model. Ratio of calculated HTC to experimental HTC versus mass
velocity.
+20%
-20%
0
5
10
15
20
25
0 5 10 15 20 25EXPERIMENTAL HTC [kW m -2 K -1]
PR
ED
ICT
ED
HT
C [k
W m
-2 K
-1]
R245fa
R32
Fig. 3-13. Comparison with Cavallini et al. (2003) model.
0.20
0.40
0.60
0.80
1.00
1.20
1.40
1.60
1.80
2.00
2.20
2.40
0 200 400 600 800 1000 1200
MASS VELOCITY [kg m -2s-1]
CA
LC /
EX
P H
TC
[/]
R245fa
R32
Fig. 3-14. Cavallini et al. (2003) model. Ratio of calculated HTC to experimental HTC versus mass
velocity.
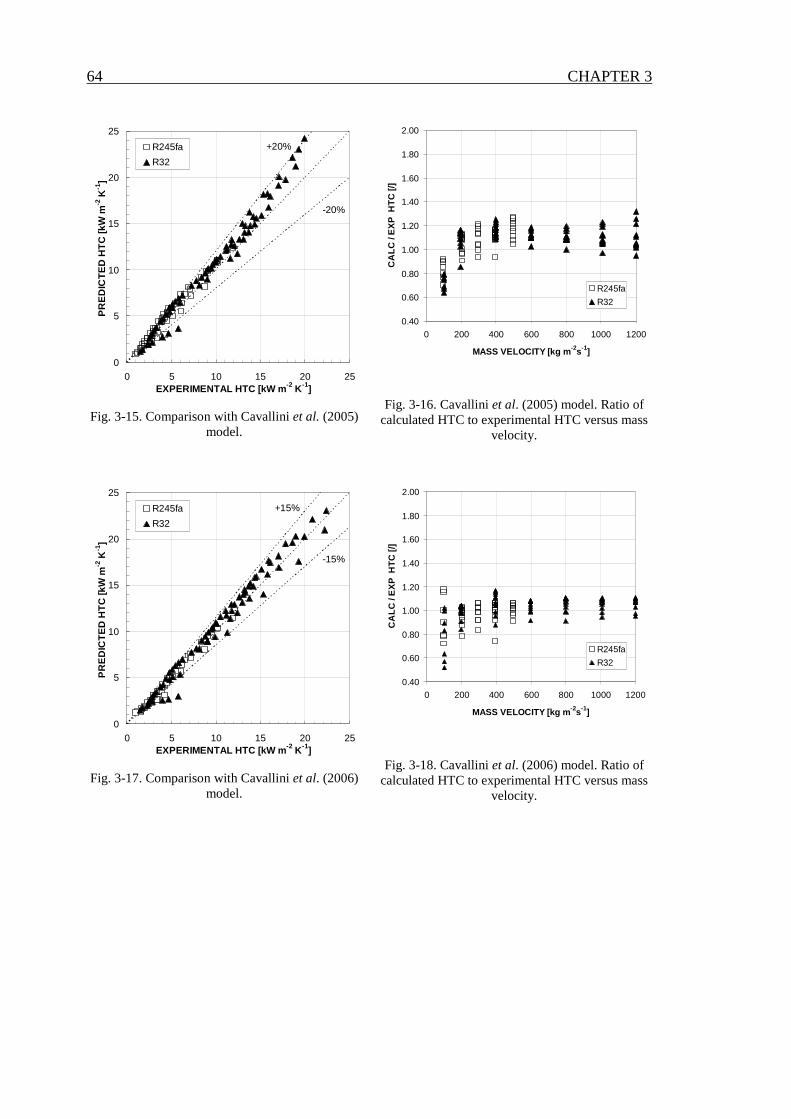
64 CHAPTER 3
+20%
-20%
0
5
10
15
20
25
0 5 10 15 20 25EXPERIMENTAL HTC [kW m -2 K -1]
PR
ED
ICT
ED
HT
C [k
W m
-2 K
-1]
R245fa
R32
Fig. 3-15. Comparison with Cavallini et al. (2005) model.
0.40
0.60
0.80
1.00
1.20
1.40
1.60
1.80
2.00
0 200 400 600 800 1000 1200
MASS VELOCITY [kg m -2s-1]
CA
LC /
EX
P H
TC
[/]
R245fa
R32
Fig. 3-16. Cavallini et al. (2005) model. Ratio of calculated HTC to experimental HTC versus mass
velocity.
+15%
-15%
0
5
10
15
20
25
0 5 10 15 20 25EXPERIMENTAL HTC [kW m -2 K -1]
PR
ED
ICT
ED
HT
C [k
W m
-2 K
-1]
R245fa
R32
Fig. 3-17. Comparison with Cavallini et al. (2006) model.
0.40
0.60
0.80
1.00
1.20
1.40
1.60
1.80
2.00
0 200 400 600 800 1000 1200
MASS VELOCITY [kg m -2s-1]
CA
LC /
EX
P H
TC
[/]
R245fa
R32
Fig. 3-18. Cavallini et al. (2006) model. Ratio of calculated HTC to experimental HTC versus mass
velocity.
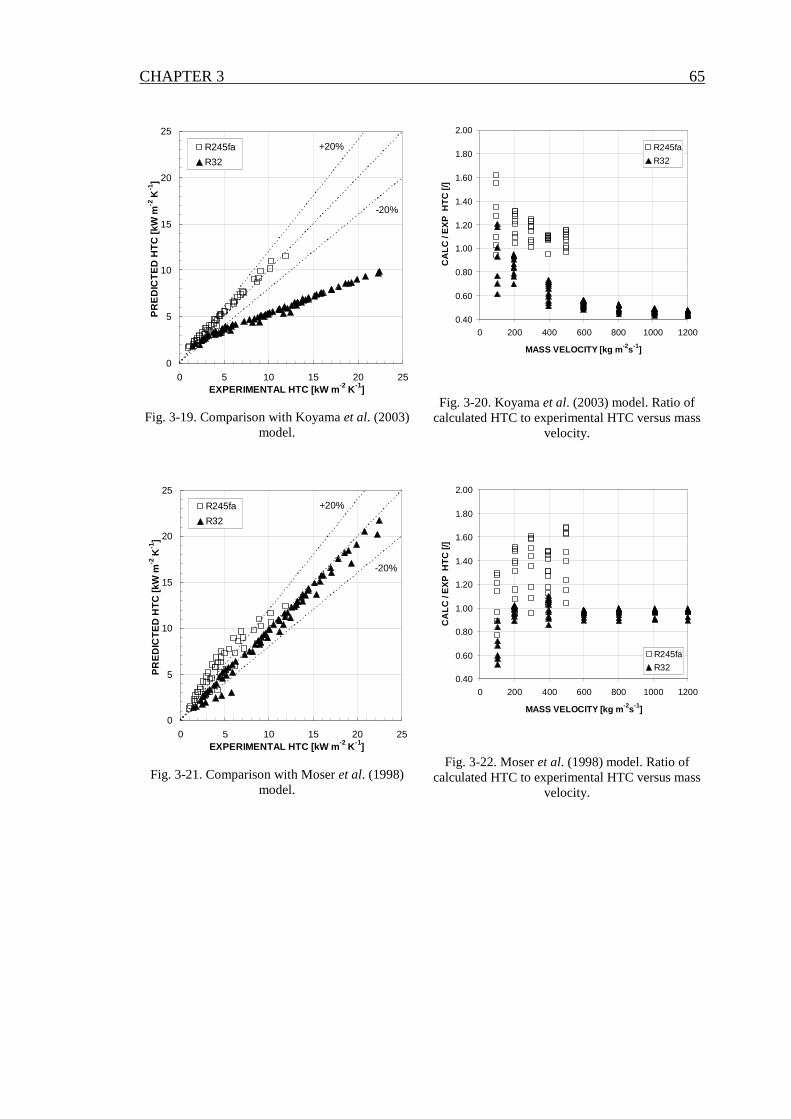
CHAPTER 3 65
+20%
-20%
0
5
10
15
20
25
0 5 10 15 20 25EXPERIMENTAL HTC [kW m -2 K -1]
PR
ED
ICT
ED
HT
C [k
W m
-2 K
-1]
R245fa
R32
Fig. 3-19. Comparison with Koyama et al. (2003) model.
0.40
0.60
0.80
1.00
1.20
1.40
1.60
1.80
2.00
0 200 400 600 800 1000 1200
MASS VELOCITY [kg m -2s-1]
CA
LC /
EX
P H
TC
[/]
R245fa
R32
Fig. 3-20. Koyama et al. (2003) model. Ratio of calculated HTC to experimental HTC versus mass
velocity.
+20%
-20%
0
5
10
15
20
25
0 5 10 15 20 25EXPERIMENTAL HTC [kW m -2 K -1]
PR
ED
ICT
ED
HT
C [k
W m
-2 K
-1]
R245fa
R32
Fig. 3-21. Comparison with Moser et al. (1998) model.
0.40
0.60
0.80
1.00
1.20
1.40
1.60
1.80
2.00
0 200 400 600 800 1000 1200
MASS VELOCITY [kg m -2s-1]
CA
LC /
EX
P H
TC
[/]
R245fa
R32
Fig. 3-22. Moser et al. (1998) model. Ratio of calculated HTC to experimental HTC versus mass
velocity.

66 CHAPTER 3
+20%
-20%
0
5
10
15
20
25
0 5 10 15 20 25EXPERIMENTAL HTC [kW m -2 K -1]
PR
ED
ICT
ED
HT
C [k
W m
-2 K
-1]
R245fa
R32
Fig. 3-23. Comparison with Wang et al. (2002) model.
0.20
0.40
0.60
0.80
1.00
1.20
1.40
1.60
1.80
2.00
2.20
2.40
0 200 400 600 800 1000 1200
MASS VELOCITY [kg m -2s-1]
CA
LC /
EX
P H
TC
[/]
R245fa
R32
Fig. 3-24. Wang et al. (2002) model. Ratio of calculated HTC to experimental HTC versus mass
velocity.
0.01
0.10
1.00
10.00
100.00
0.01 0.10 1.00 10.00Xtt [/]
J g [/
]
R245fa G100
R245fa G200
R245fa G400
R32 G100
R32 G200
R32 G400
Fig. 3-25. Condensation test runs plotted on the flow pattern map (Cavallini et al., 2006).
67
Chapter 4.
Two-phase pressure drop inside the circular
minichannel
4.1 Introduction
With regard to the pressure drop behaviour of minichannels, very few data are available in the open literature regarding high pressure fluids. Most data in fact refer to medium pressure refrigerants, such as R134a. Cavallini et al. (2005b) measured pressure drops during adiabatic flow at 40°C of R410A, R134a and R236ea inside a multi-port minichannel having a square cross section with hydraulic diameter 1.4 mm, length 1.13 m and with mass velocities ranging from 200 to 1400 kg m-2 s-1. The multiport minichannel tested is characterized by a square cross section and a low value of surface roughness (Ra = 0.08 µm and Rz = 0.43 µm), whose effect can thus be neglected.
The authors compared their data against models, either developed for conventional macrochannels or specifically developed for minichannels. No model was able to predict frictional pressure drops of R410A, while many models were not able to predict R236ea trends. Better predictions, however, were obtained for the frictional pressure drops of R134a.
A new model for the frictional pressure gradient valid for adiabatic flow or for flow during condensation of halogenated refrigerants inside minichannels was then suggested by Cavallini et al. (2009).
4.2 Experimental pressure drop
In this paragraph pressure drops measured during adiabatic two-phase flow of R32 and R245fa are reported.
In most of the frictional tests, the desuperheater is used to achieve partial condensation of the refrigerant and then the pressure drop is measured adiabatically in the following sector. Inlet vapour quality has been controlled through the thermal balance in the desuperheater. Some frictional tests, at low vapor quality, have been performed bypassing the evaporator and sending the refrigerant to the test section as a
68 CHAPTER 4
subcooled liquid: the desuperheater is then used as a preheater for the liquid. Indeed, saturation conditions are achieved by partial vaporization before the measuring sector.
The present mini-tube displays a much higher surface roughness as compared to the previously tested multiport minichannel (Cavallini et al., 2005b) and this allows to investigate the effect of tube wall roughness of the channel on the two-phase frictional pressure gradient.
Some single phase flow tests have previously been performed with R245fa and R32 to measure the friction factor in the minichannel. Experimental values of 245fa and R32 friction factor have been compared against equations for both laminar flow and turbulent flow in rough tubes and a good agreement between calculated and experimental values was found.
The test tube is the same used for condensation heat transfer tests. The arithmetical mean deviation of the assessed profile Ra of the inner surface is Ra=2.34 µm, the maximum height of profile Rz is 17.4 µm. The inlet and outlet pressure ports are inserted in two stainless steel tubes 24 mm long, attached to the ends of the copper tube. The stainless steel tubes have 0.762 mm inner diameter, Ra = 2.0 µm and Rz = 10.2 µm. The total frictional pressure drop is then the sum of the frictional pressure drop in the two stainless steel tubes, of the frictional pressure drop in the 228.5 mm long copper tube and of the pressure variations due to one abrupt enlargement (from 0.762 mm diameter to 0.96 mm diameter) and one contraction (from 0.96 mm to 0.762 mm). Pressure losses due to abrupt geometry changes account for 4 to 8 % of total pressure drop in the R245fa data and for 6 to 10 % in the case of R32 data, according to the calculation by means of the Paliwoda (1992) equations.
The experimental uncertainty for the measured pressure difference is ±0.1 kPa, for the absolute pressure is ±5 kPa, for the refrigerant flow rate is ±0.2%; for the vapour quality the uncertainty ranges between ±1% and ±2%.
Fig. 4-1 shows the total experimental pressure drops for R32 at 40°C versus vapour quality, at 200, 400, 600, 800 and 1000 kg m-2 s-1 mass velocities. In Fig. 4-2, the cumulative pressure drops measured during adiabatic two-phase flow of R245fa are reported.
The combined effect of low vapour density and high liquid viscosity explains the significant pressure drop increase which is measured for R245fa as compared to R32, at the same mass velocity and vapour quality.

CHAPTER 4 69
0
10
20
30
40
50
60
70
80
90
100
0.0 0.1 0.2 0.3 0.4 0.5 0.6 0.7 0.8 0.9 1.0VAPOUR QUALITY [/]
PR
ES
SU
RE
DR
OP
[kP
a]
G1000
G800
G600
G400
G200
Fig. 4-1. Total experimental pressure drop for R32 at 40°C versus vapour quality at different mass velocities.
0
10
20
30
40
50
60
0.0 0.1 0.2 0.3 0.4 0.5 0.6 0.7 0.8 0.9 1.0VAPOUR QUALITY [/]
PR
ES
SU
RE
DR
OP
[kP
a]
G300
G250
G200
Fig. 4-2. Total experimental pressure drop for R245fa at 40°C versus vapour quality at different mass velocities.
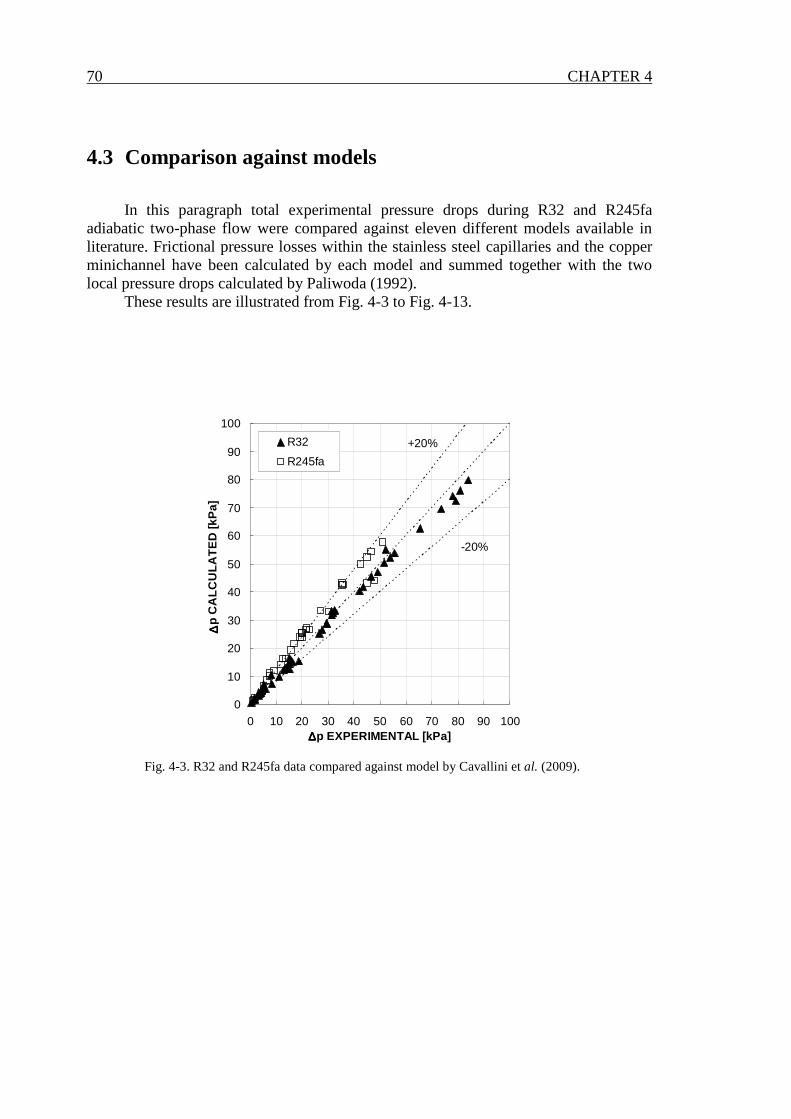
70 CHAPTER 4
4.3 Comparison against models
In this paragraph total experimental pressure drops during R32 and R245fa adiabatic two-phase flow were compared against eleven different models available in literature. Frictional pressure losses within the stainless steel capillaries and the copper minichannel have been calculated by each model and summed together with the two local pressure drops calculated by Paliwoda (1992).
These results are illustrated from Fig. 4-3 to Fig. 4-13.
-20%
+20%
0
10
20
30
40
50
60
70
80
90
100
0 10 20 30 40 50 60 70 80 90 100∆∆∆∆p EXPERIMENTAL [kPa]
∆∆ ∆∆p
CA
LCU
LAT
ED
[kP
a]
R32
R245fa
Fig. 4-3. R32 and R245fa data compared against model by Cavallini et al. (2009).
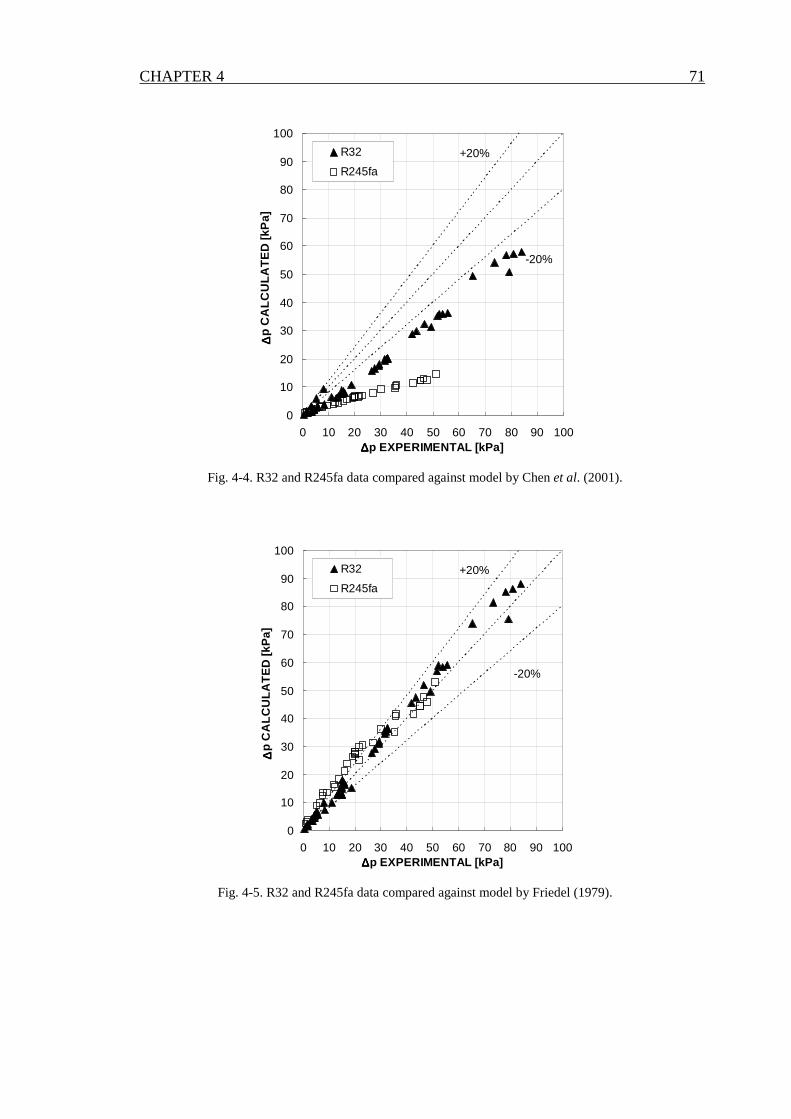
CHAPTER 4 71
+20%
-20%
0
10
20
30
40
50
60
70
80
90
100
0 10 20 30 40 50 60 70 80 90 100∆∆∆∆p EXPERIMENTAL [kPa]
∆∆ ∆∆p
CA
LCU
LAT
ED
[kP
a]
R32
R245fa
Fig. 4-4. R32 and R245fa data compared against model by Chen et al. (2001).
-20%
+20%
0
10
20
30
40
50
60
70
80
90
100
0 10 20 30 40 50 60 70 80 90 100∆∆∆∆p EXPERIMENTAL [kPa]
∆∆ ∆∆p
CA
LCU
LAT
ED
[kP
a]
R32
R245fa
Fig. 4-5. R32 and R245fa data compared against model by Friedel (1979).
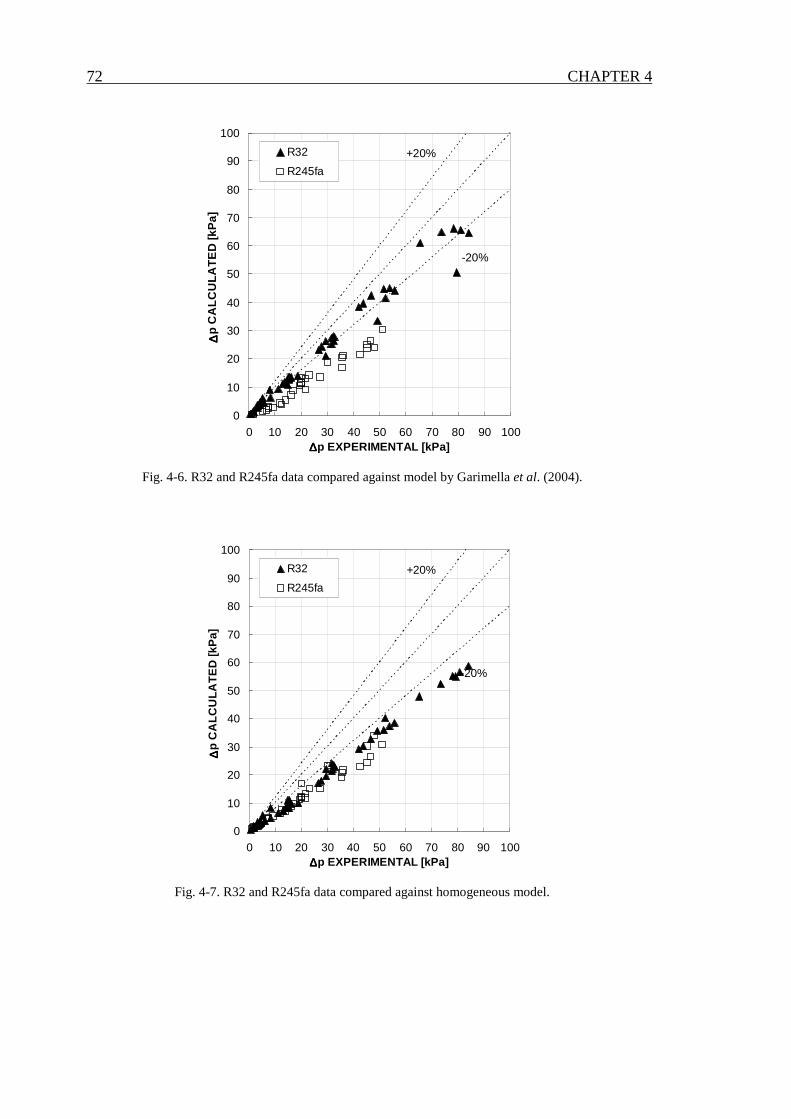
72 CHAPTER 4
-20%
+20%
0
10
20
30
40
50
60
70
80
90
100
0 10 20 30 40 50 60 70 80 90 100∆∆∆∆p EXPERIMENTAL [kPa]
∆∆ ∆∆p
CA
LCU
LAT
ED
[kP
a]
R32
R245fa
Fig. 4-6. R32 and R245fa data compared against model by Garimella et al. (2004).
-20%
+20%
0
10
20
30
40
50
60
70
80
90
100
0 10 20 30 40 50 60 70 80 90 100∆∆∆∆p EXPERIMENTAL [kPa]
∆∆ ∆∆p
CA
LCU
LAT
ED
[kP
a]
R32
R245fa
Fig. 4-7. R32 and R245fa data compared against homogeneous model.
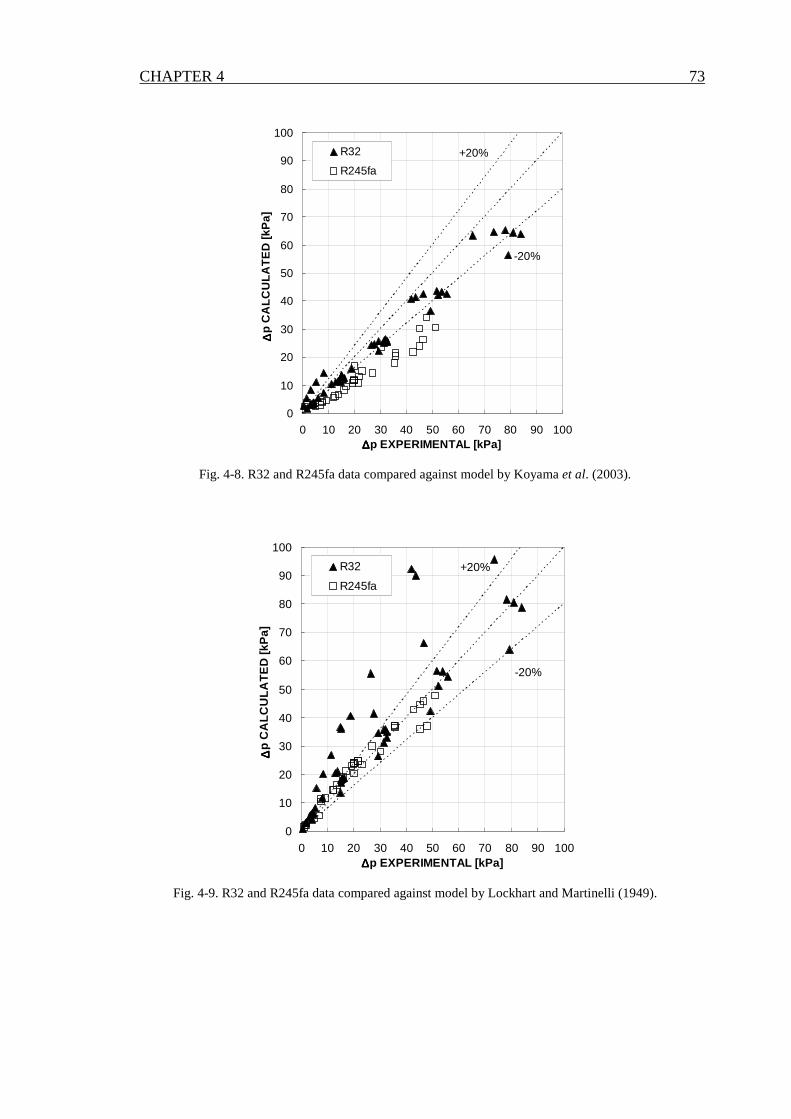
CHAPTER 4 73
+20%
-20%
0
10
20
30
40
50
60
70
80
90
100
0 10 20 30 40 50 60 70 80 90 100∆∆∆∆p EXPERIMENTAL [kPa]
∆∆ ∆∆p
CA
LCU
LAT
ED
[kP
a]
R32
R245fa
Fig. 4-8. R32 and R245fa data compared against model by Koyama et al. (2003).
-20%
+20%
0
10
20
30
40
50
60
70
80
90
100
0 10 20 30 40 50 60 70 80 90 100∆∆∆∆p EXPERIMENTAL [kPa]
∆∆ ∆∆p
CA
LCU
LAT
ED
[kP
a]
R32
R245fa
Fig. 4-9. R32 and R245fa data compared against model by Lockhart and Martinelli (1949).
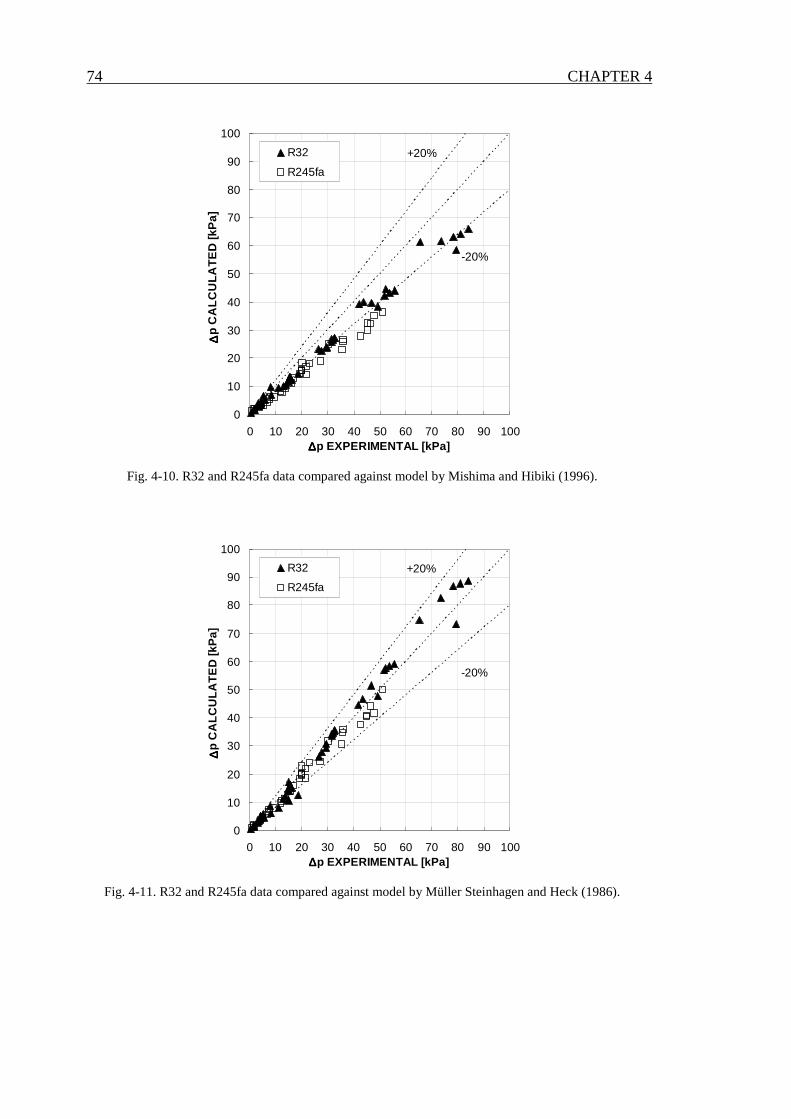
74 CHAPTER 4
+20%
-20%
0
10
20
30
40
50
60
70
80
90
100
0 10 20 30 40 50 60 70 80 90 100∆∆∆∆p EXPERIMENTAL [kPa]
∆∆ ∆∆p
CA
LCU
LAT
ED
[kP
a]
R32
R245fa
Fig. 4-10. R32 and R245fa data compared against model by Mishima and Hibiki (1996).
+20%
-20%
0
10
20
30
40
50
60
70
80
90
100
0 10 20 30 40 50 60 70 80 90 100∆∆∆∆p EXPERIMENTAL [kPa]
∆∆ ∆∆p
CA
LCU
LAT
ED
[kP
a]
R32
R245fa
Fig. 4-11. R32 and R245fa data compared against model by Müller Steinhagen and Heck (1986).
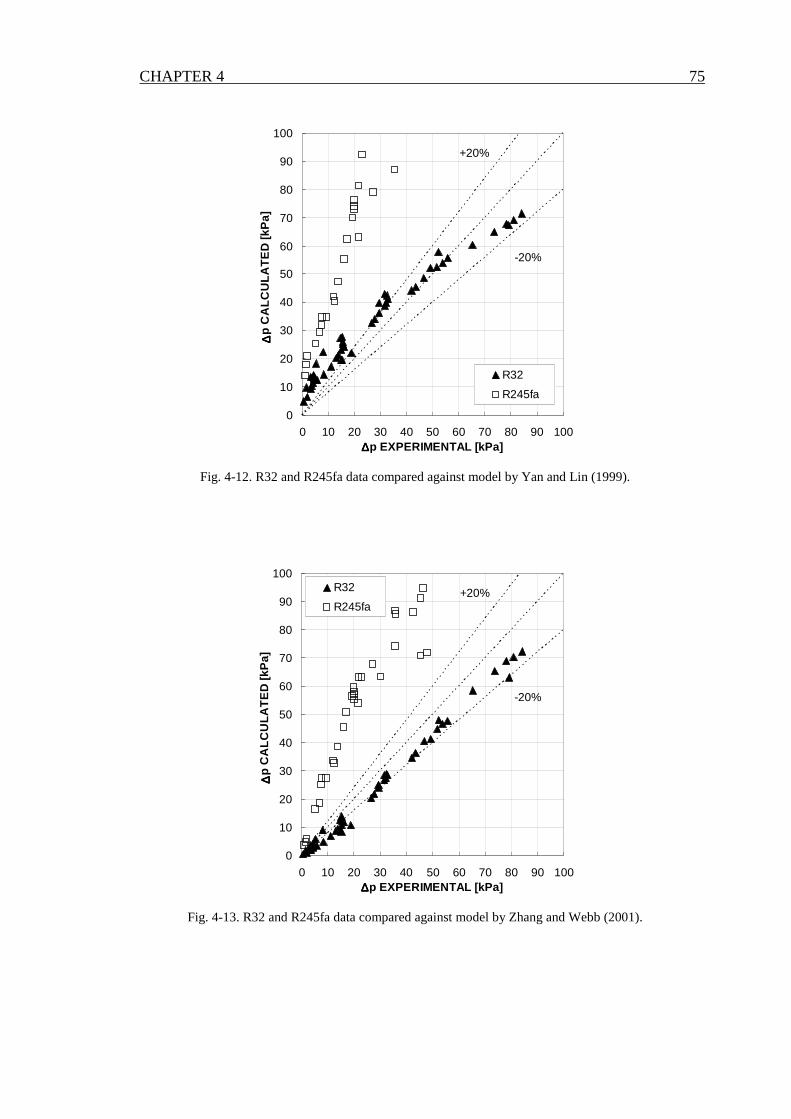
CHAPTER 4 75
-20%
+20%
0
10
20
30
40
50
60
70
80
90
100
0 10 20 30 40 50 60 70 80 90 100∆∆∆∆p EXPERIMENTAL [kPa]
∆∆ ∆∆p
CA
LCU
LAT
ED
[kP
a]
R32
R245fa
Fig. 4-12. R32 and R245fa data compared against model by Yan and Lin (1999).
+20%
-20%
0
10
20
30
40
50
60
70
80
90
100
0 10 20 30 40 50 60 70 80 90 100∆∆∆∆p EXPERIMENTAL [kPa]
∆∆ ∆∆p
CA
LCU
LAT
ED
[kP
a]
R32
R245fa
Fig. 4-13. R32 and R245fa data compared against model by Zhang and Webb (2001).

76 CHAPTER 4

77
Chapter 5.
Flow boiling in the circular minichannel
5.1 Introduction
The present chapter describes the experimental setup for the investigation of two-phase heat transfer inside microchannels and reports local heat transfer coefficients measured during flow boiling of R245fa, R134a and R32 in a 0.96 mm diameter single circular channel. The test runs have been performed during vaporization at around 1.9 bar for R245fa, 7.9 bar for R134a and 19.8 bar for R32, corresponding to 31°C saturation temperature. As a peculiar characteristic of the present technique, the heat transfer coefficient is not measured by imposing the heat flux; instead, the boiling process is governed by controlling the inlet temperature of the heating secondary fluid. In R245fa data, mass velocity ranges between 200 and 400 kg m-2s-1, with heat flux ranging between 5 and 85 kW m-2 and vapour quality from 0.05 up to 0.8. In R134a data, mass velocity ranges between 300 and 600 kg m-2s-1, with heat flux ranging between 10 and 240 kW m-2 and vapour quality from 0.05 up to 0.8. Finally, in R32 data, mass velocity ranges between 400 and 700 kg m-2s-1, with heat flux ranging between 40 and 290 kW m-2 and vapour quality from 0.05 up to 0.65. Since these data are not measured at uniform heat flux conditions, a proper analysis is performed to enlighten the influence of the different parameters and to compare the present data to those obtained when imposing the heat flux. Besides, the test runs have been carried out in a double mode: by increasing the water-to-refrigerant temperature difference and by decreasing it. Finally, the experimental data are compared to models available in the literature for prediction of the heat transfer coefficients inside microchannels.
5.2 Literature review
Recent technical applications in the electronic industry demand high-heat flux dissipation from small areas. Cooling through vaporization of a refrigerant in a minichannel heat sink allows compactness, minimal coolant usage, high heat transfer coefficients and a constant temperature dictated by the coolant’s saturation temperature. For different applications, microchannel flow boiling can also occur when evaporators are used to cool a secondary fluid.

78 CHAPTER 5
So far there is not any established criterion to properly define the transition between conventional ducts to minichannels and to microchannels. Kew and Cornwell (1997) defined an approximate criterion to draw the line dividing conventional channels and microchannels, which accounts for the characteristic of the fluid, namely surface tension and density. Instead, Kandlikar and Grande (2003) provided a classification which is merely based on the channel diameter. According to them, all the channels with diameter between 0.2 mm and 3 mm can be referred to as minichannels. By following this classification, the present test tube should be named minichannel, whereas, according to Kew and Cornwell (1997), a 1 mm diameter tube working with R245fa, R134a or R32 at 30°C fits in the microchannel area. Therefore, in the present paper, the words microchannel and minichannel may be used both as a possible denomination.
In two-phase microchannel flow, capillary (surface tension) forces become important, thus impeding stratification of liquid. Bubble flow, elongated (slug) flow, annular flow and mist flow are some of the flow categories observed. For evaporating flow, the zone with bubbles smaller than channel diameter is very short as bubbles grow to the channel size very quickly.
Several studies have been reported in the recent years on vaporization in microchannels. Some experimental studies show that the heat transfer coefficients obtained during vaporization in microchannels, are not a function of vapour quality nor mass velocity (in contrast with the macro-channel trend), but are a function of heat flux and saturation pressure (Kandlikar (2004), Thome (2004b), Thome (2006)). Other experimental studies demonstrate that the heat transfer coefficient also depends on vapour quality and mass velocity. Some experimentalists conclude that flow in small channels is dominated by nucleate boiling while forced convection evaporation is less important. Instead, Thome (2004) suggests that transient evaporation of the thin liquid films surrounding elongated bubbles is the dominant heat transfer mechanism.
Lee and Mudawar (2005) reported a list of studies on this matter showing that researchers are divided into two groups. The first group shares the view that nucleate boiling is dominant and therefore dictates overall heat transfer inside the channel. A second group shares the observation that the local heat transfer coefficient is a function of vapour quality and mass velocity in addition to heat flux. Of course, the understanding of dominant mechanisms during flow boiling in mini-channels is the fundamental basis for the development of an accurate predicting method. In addition, the heat transfer during vaporization may depend on the surface quality. In fact, surface roughness is a key parameter affecting nucleation; and it also affects the thickness of the liquid films surrounding elongated bubbles as demonstrated by Thome (2004b). However there is still a lack of experimental results regarding the effect of surface roughness in microchannel flow boiling.
Harirchian and Garimella (2008) investigated the local flow boiling heat transfer of a dielectric fluid, Fluorinert FC-77, in a microchannel heat sink. In this study seven different test pieces consisting of parallel microchannels with widths ranging from 100 to 5850 µm and a depth of 400 µm are considered; experiments are performed for heat flux up to 300 kW m-2. The results show that for microchannels of a width grater then 400 µm, the heat transfer coefficient at a fixed heat flux are independent of channel size. Also heat transfer coefficients are independent of mass flux in nucleate boiling region; when convective boiling dominates, the heat transfer coefficient increases with increasing mass flux.

CHAPTER 5 79
Bertsch et al. (2009) studied flow boiling heat transfer with the refrigerants R-134a and R245fa in copper microchannel cold plate evaporators. Arrays of microchannels of hydraulic diameter 1.09 and 0.54 mm are considered with an aspect ratio of the rectangular cross section equal to 2.5. The heat transfer coefficient is measured at saturation temperature ranging from 8 to 30 °C, mass flux from 20 to 350 kg m-2 s-1, and heat flux from 0 to 220 kW m-2. It was found that heat transfer coefficient vary significantly with heat flux and vapour quality, but only slightly with saturation pressure and mass flux. They found that, for R-245fa, at a fixed heat flux, the heat transfer coefficient increases up till a vapour quality of 0.1; then it stays almost constant up to a vapour quality of 0.5 before it starts to drop-off more rapidly towards higher vapour qualities. A different trend was found by Consolini and Thome (2009) during flow boiling of R245-fa in a single microchannel of 510 µm internal diameter with heat flux ranging from 0 to 110 kW m-2. The heat transfer coefficient appears to be sensitive to heat flux only up to intermediate vapour qualities, beyond which the data points for different values of heat fluxes merge and exhibit a monotonic increase with vapour quality.
Shiferaw et al. (2009) recently published flow boiling experiments in a 1.1 mm tube inside diameter using R134a; the parameters were varied in the range: mass flux 100-600 kg m-2 s-1; heat flux 16-150 kW m-2 and pressure 6-12 bar. In their data, the heat transfer coefficient increases with heat flux, but does not change with vapour quality when the quality is less than about 30 to 50%. For vapour quality values greater than 50% and at high heat flux, the heat transfer coefficient decreases with vapour quality.
With reference to microchannel flow boiling databases in the open literature, it appears that most experimentalists use electrical heating. In practical applications, the heat flux may be an independent variable as under Joule-effect heating or it may be a dependent variable when it is transferred from a secondary fluid. However, most of the data available in the literature was measured by adopting Joule effect heating and thus by imposing the heat flux. This technique allows to measure the heat flux with high accuracy and also to easily embed thermocouples in the wall.
On the contrary, limited data is available in the literature for flow boiling in minichannels taken without fixing the heat flux. That data, measured with the use of a secondary fluid in the evaporation test section, was obtained mainly in multiport minichannels, and generally using the Wilson plot technique. The main shortcoming of the Wilson plot technique is the high experimental uncertainty for the heat transfer coefficients particularly when the leading thermal resistance is on the secondary fluid side. Furthermore, in the case of multiport tubes, the heat transfer coefficient measured with the indirect experimental method represents only an average value over the parallel channels, that sometimes may be not evenly fed, and does not give any information for the single channel.
A new experimental apparatus for the measurement of the local heat transfer coefficient inside a single minichannel will be presented in this chapter. The heat is transferred to the evaporating fluid by using a secondary circuit and thus by imposing the temperatures of the fluid.
For the determination of the local heat transfer coefficient, three parameters are measured: the local heat flux, the saturation temperature and the wall temperature. The heat flux is determined from the temperature profile of the secondary fluid in the measuring sector. The wall temperature is directly measured along the test section and

80 CHAPTER 5
the saturation temperature is measured in the adiabatic segments at the inlet and outlet of the test tube by means of pressure transducers.
The present heat transfer data may be interestingly compared against data obtained under Joule-effect heating and used in the comparison against predicting correlations available for flow boiling inside minitubes.
5.3 Experimental apparatus
The test rig used for the experimental tests is depicted in Fig. 5-1. It consists of the primary (refrigerant) loop and of two auxiliary loops: the cooling water loop and the heating water loop. The subcooled refrigerant from the post-condenser is sent through a mechanical filter and a dehumidifier into an independently controlled gear pump, which is magnetically coupled to a variable speed electric motor.
The fluid is pumped through the Coriolis-effect mass flow meter into the test section as a subcooled liquid. The subcooled liquid enters the test section, which is made of two counter-flow heat exchangers: the first one (pre-sector) is used to achieve desired inlet subcooling, the second one is the actual measuring sector.
The pressure is gauged through two digital strain gauge pressure (absolute and differential) transducers, connected to manometric taps to measure the fluid pressure upstream and downstream of the test tube.
Two refrigerated thermal baths are used in the flow boiling tests: the first one provides the hot water entering the measuring sector, the second one provides the coolant for the postcondenser. When necessary, the water entering the pre-sector can be maintained at a different temperature through an additional electrical heater.
The test section is designed for measurement of local two-phase heat transfer coefficients by measuring the local wall temperature and the water temperature profile along the channel. Therefore, the measuring sector is equipped with a high number of thermocouples, both in the wall and in the water.
The measuring sector is thermally separated from the pre-section and the exit tube through adiabatic stainless steel capillary tubes.
The water flow rates, in the pre-sector and in the measuring sector, are measured by means of two Coriolis-effect mass flow meters and the total temperature difference of water across both sectors are measured with two multiple junction copper-constantan thermopiles.
A detailed description of the minichannel test section is reported in Chapter 1.
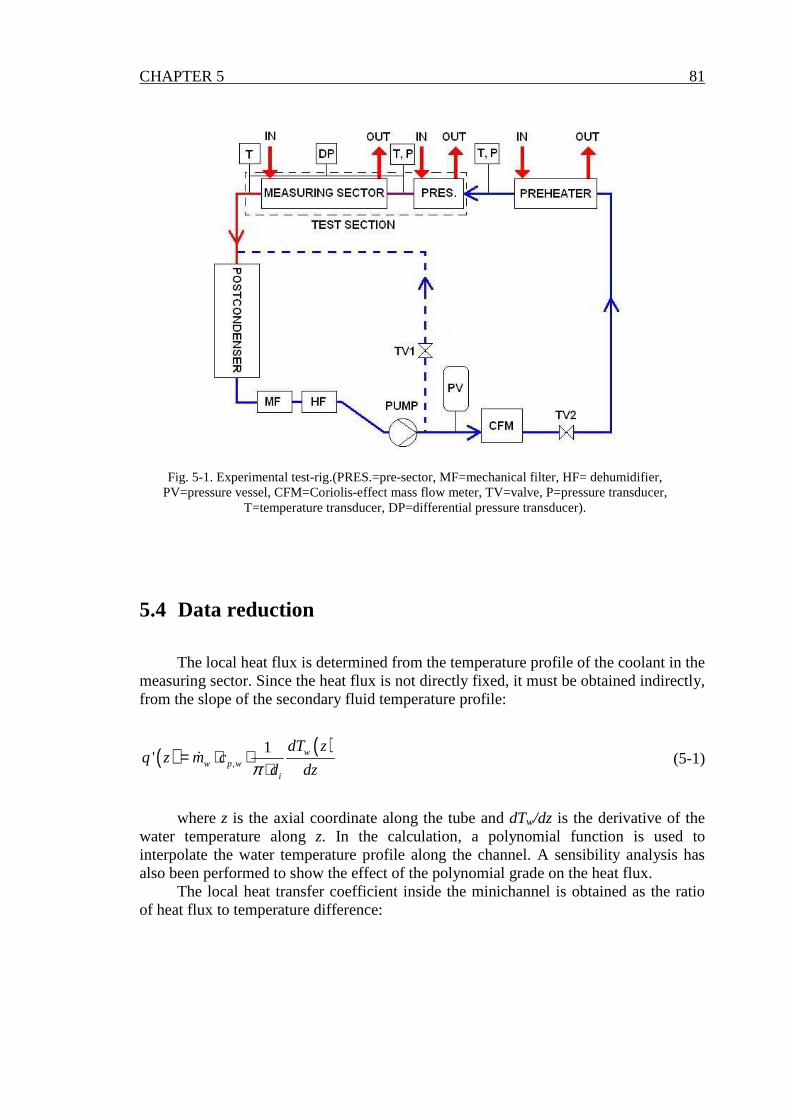
CHAPTER 5 81
Fig. 5-1. Experimental test-rig.(PRES.=pre-sector, MF=mechanical filter, HF= dehumidifier, PV=pressure vessel, CFM=Coriolis-effect mass flow meter, TV=valve, P=pressure transducer,
T=temperature transducer, DP=differential pressure transducer).
5.4 Data reduction
The local heat flux is determined from the temperature profile of the coolant in the measuring sector. Since the heat flux is not directly fixed, it must be obtained indirectly, from the slope of the secondary fluid temperature profile:
( ) ( ),
1' w
w p wi
dT zq z m c
d dzπ= ⋅ ⋅
⋅ɺ (5-1)
where z is the axial coordinate along the tube and dTw/dz is the derivative of the
water temperature along z. In the calculation, a polynomial function is used to interpolate the water temperature profile along the channel. A sensibility analysis has also been performed to show the effect of the polynomial grade on the heat flux.
The local heat transfer coefficient inside the minichannel is obtained as the ratio of heat flux to temperature difference:
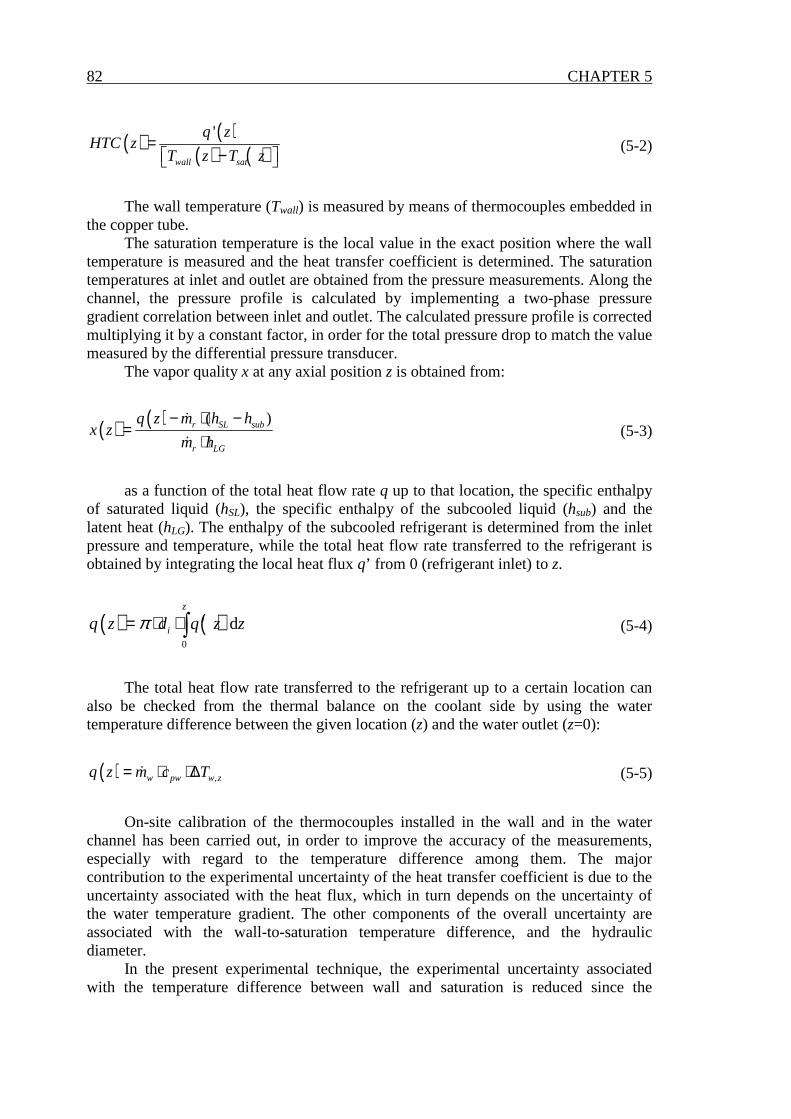
82 CHAPTER 5
( ) ( )( ) ( )
'
wall sat
q zHTC z
T z T z=
− (5-2)
The wall temperature (Twall) is measured by means of thermocouples embedded in
the copper tube. The saturation temperature is the local value in the exact position where the wall
temperature is measured and the heat transfer coefficient is determined. The saturation temperatures at inlet and outlet are obtained from the pressure measurements. Along the channel, the pressure profile is calculated by implementing a two-phase pressure gradient correlation between inlet and outlet. The calculated pressure profile is corrected multiplying it by a constant factor, in order for the total pressure drop to match the value measured by the differential pressure transducer.
The vapor quality x at any axial position z is obtained from:
( ) ( ) ( )r SL sub
r LG
q z m h hx z
m h
− ⋅ −=
⋅ɺ
ɺ (5-3)
as a function of the total heat flow rate q up to that location, the specific enthalpy
of saturated liquid (hSL), the specific enthalpy of the subcooled liquid (hsub) and the latent heat (hLG). The enthalpy of the subcooled refrigerant is determined from the inlet pressure and temperature, while the total heat flow rate transferred to the refrigerant is obtained by integrating the local heat flux q’ from 0 (refrigerant inlet) to z.
( ) ( )0
' dz
iq z d q z zπ= ⋅ ⋅ ∫ (5-4)
The total heat flow rate transferred to the refrigerant up to a certain location can
also be checked from the thermal balance on the coolant side by using the water temperature difference between the given location (z) and the water outlet (z=0):
( ) ,w pw w zq z m c T= ⋅ ⋅∆ɺ (5-5)
On-site calibration of the thermocouples installed in the wall and in the water
channel has been carried out, in order to improve the accuracy of the measurements, especially with regard to the temperature difference among them. The major contribution to the experimental uncertainty of the heat transfer coefficient is due to the uncertainty associated with the heat flux, which in turn depends on the uncertainty of the water temperature gradient. The other components of the overall uncertainty are associated with the wall-to-saturation temperature difference, and the hydraulic diameter.
In the present experimental technique, the experimental uncertainty associated with the temperature difference between wall and saturation is reduced since the
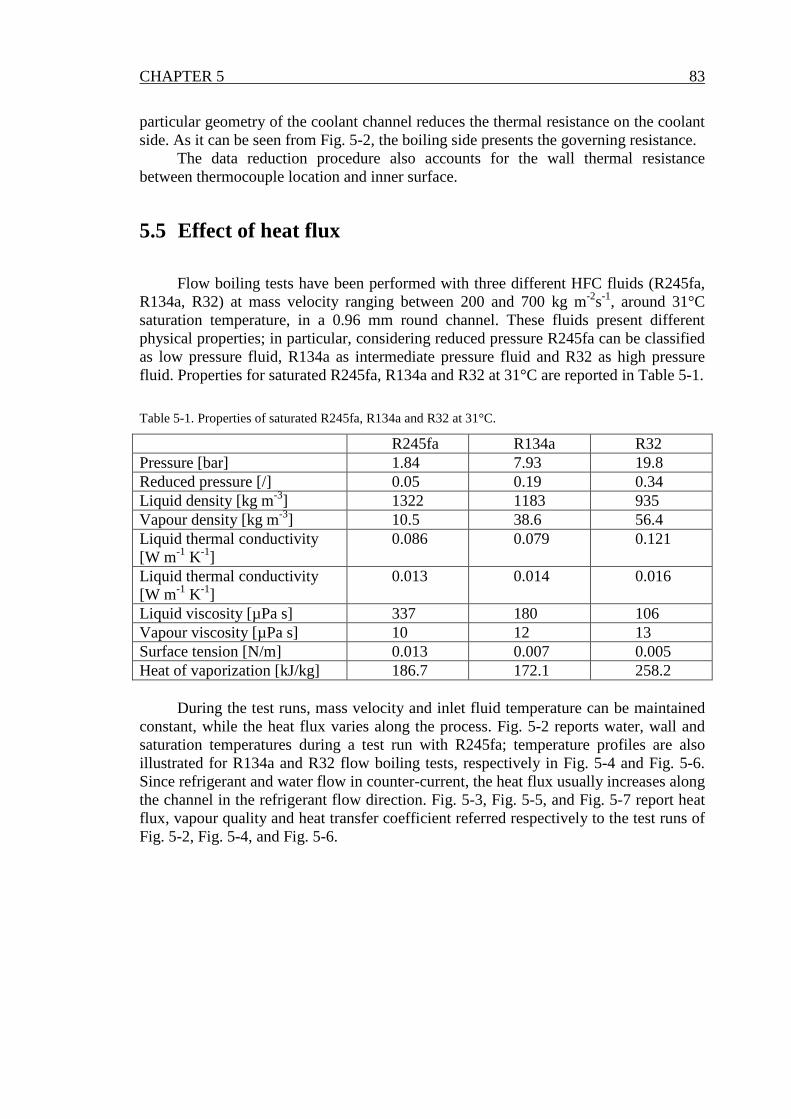
CHAPTER 5 83
particular geometry of the coolant channel reduces the thermal resistance on the coolant side. As it can be seen from Fig. 5-2, the boiling side presents the governing resistance.
The data reduction procedure also accounts for the wall thermal resistance between thermocouple location and inner surface.
5.5 Effect of heat flux
Flow boiling tests have been performed with three different HFC fluids (R245fa, R134a, R32) at mass velocity ranging between 200 and 700 kg m-2s-1, around 31°C saturation temperature, in a 0.96 mm round channel. These fluids present different physical properties; in particular, considering reduced pressure R245fa can be classified as low pressure fluid, R134a as intermediate pressure fluid and R32 as high pressure fluid. Properties for saturated R245fa, R134a and R32 at 31°C are reported in Table 5-1.
Table 5-1. Properties of saturated R245fa, R134a and R32 at 31°C.
R245fa R134a R32 Pressure [bar] 1.84 7.93 19.8 Reduced pressure [/] 0.05 0.19 0.34 Liquid density [kg m-3] 1322 1183 935 Vapour density [kg m-3] 10.5 38.6 56.4 Liquid thermal conductivity [W m-1 K-1]
0.086 0.079 0.121
Liquid thermal conductivity [W m-1 K-1]
0.013 0.014 0.016
Liquid viscosity [µPa s] 337 180 106 Vapour viscosity [µPa s] 10 12 13 Surface tension [N/m] 0.013 0.007 0.005 Heat of vaporization [kJ/kg] 186.7 172.1 258.2
During the test runs, mass velocity and inlet fluid temperature can be maintained
constant, while the heat flux varies along the process. Fig. 5-2 reports water, wall and saturation temperatures during a test run with R245fa; temperature profiles are also illustrated for R134a and R32 flow boiling tests, respectively in Fig. 5-4 and Fig. 5-6. Since refrigerant and water flow in counter-current, the heat flux usually increases along the channel in the refrigerant flow direction. Fig. 5-3, Fig. 5-5, and Fig. 5-7 report heat flux, vapour quality and heat transfer coefficient referred respectively to the test runs of Fig. 5-2, Fig. 5-4, and Fig. 5-6.

84 CHAPTER 5
24
26
28
30
32
34
36
38
40
42
44
46
-40 0 40 80 120 160 200 240 280POSITION [mm]
TE
MP
ER
AT
UR
E [°
C]
WaterWater IN/OUTWallRef IN/OUTSaturation(p)Tsat
Fig. 5-2. Water, wall and saturation temperatures during flow boiling of R245fa at G=300 kg m-2s-1. Inlet and outlet temperatures of the refrigerant are also directly measured (Ref IN/OUT).
0
2000
4000
6000
8000
10000
0.0 0.1 0.2 0.3 0.4 0.5 0.6 0.7 0.8VAPOUR QUALITY [/]
HT
C [W
m-2
K-1
]
0
10
20
30
40
50
60
70
80
90
100
HE
AT
FLU
X [k
W m
-2]
HTC
Heat flux
Fig. 5-3. Heat transfer coefficient and heat flux versus vapour quality during flow boiling of R245fa at G=300 kg m-2s-1.

CHAPTER 5 85
28
30
32
34
36
38
40
42
-40 0 40 80 120 160 200 240 280POSITION [mm]
TE
MP
ER
AT
UR
E [°
C]
WaterWater IN/OUTWallRef IN/OUTSaturation (p)Tsat
Fig. 5-4. Water, wall and saturation temperatures during flow boiling of R134a at G=500 kg m-2s-1. Inlet and outlet temperatures of the refrigerant are also directly measured (Ref IN/OUT).
0
5000
10000
15000
20000
25000
30000
0.0 0.1 0.2 0.3 0.4 0.5 0.6 0.7 0.8VAPOUR QUALITY [/]
HT
C [W
m-2
K-1
]
0
20000
40000
60000
80000
100000
120000
140000
HE
AT
FLU
X [W
m-2
]
HTC
Heat flux
Fig. 5-5. Heat transfer coefficient and heat flux versus vapour quality during flow boiling of R134a at G=500 kg m-2s-1.
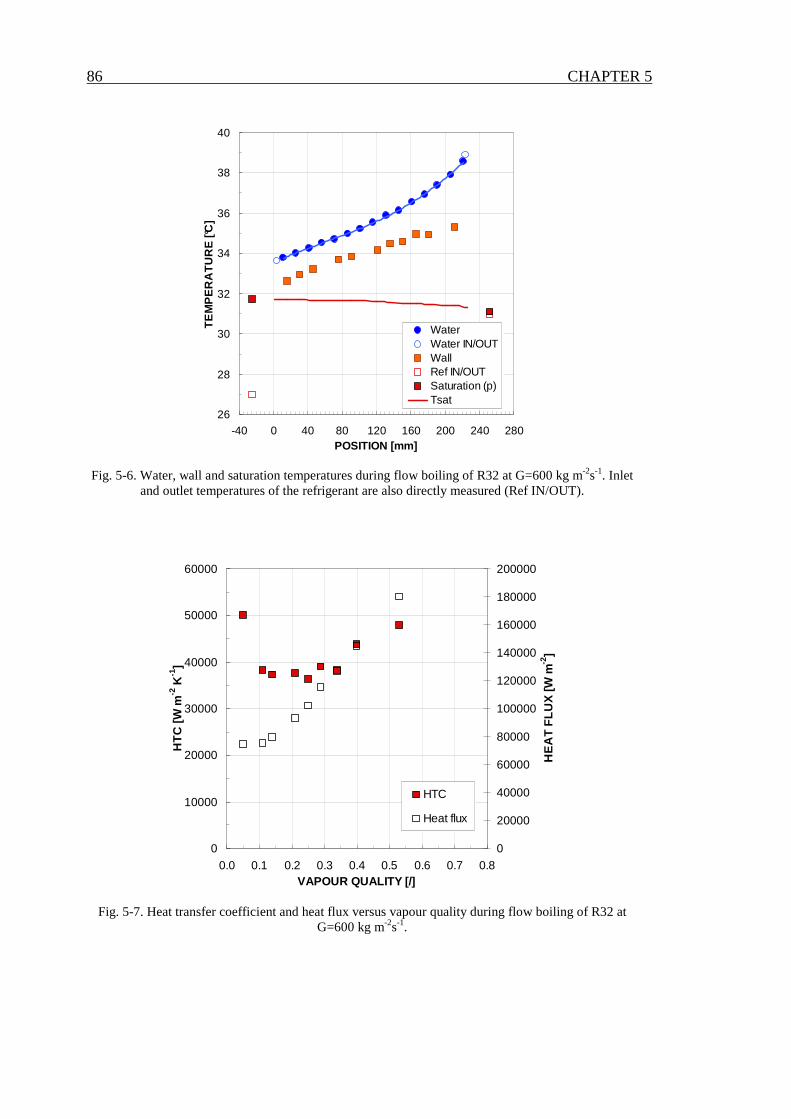
86 CHAPTER 5
26
28
30
32
34
36
38
40
-40 0 40 80 120 160 200 240 280POSITION [mm]
TE
MP
ER
AT
UR
E [°
C]
WaterWater IN/OUTWallRef IN/OUTSaturation (p)Tsat
Fig. 5-6. Water, wall and saturation temperatures during flow boiling of R32 at G=600 kg m-2s-1. Inlet and outlet temperatures of the refrigerant are also directly measured (Ref IN/OUT).
0
10000
20000
30000
40000
50000
60000
0.0 0.1 0.2 0.3 0.4 0.5 0.6 0.7 0.8VAPOUR QUALITY [/]
HT
C [W
m-2
K-1
]
0
20000
40000
60000
80000
100000
120000
140000
160000
180000
200000
HE
AT
FLU
X [W
m-2
]
HTC
Heat flux
Fig. 5-7. Heat transfer coefficient and heat flux versus vapour quality during flow boiling of R32 at G=600 kg m-2s-1.

CHAPTER 5 87
In some test runs, the refrigerant exits as superheated vapour or saturated vapour with high quality. In this case, the heat flux increases with vapour quality in the channel up to a certain point, where the wall starts to dry up and the wall temperature deviates from its trend to approach the water temperature.
All the data points reported in the present chapter refer to boiling conditions before the dryout occurs. The determination of the critical conditions in the present tests is done by looking at the standard deviation of the wall thermocouples, as described in Chapter 6.
At constant mass velocity and saturation temperature, the test runs have been performed by varying the inlet temperature of the water in order to vary the heat flux. The test runs have been performed in a double mode: by increasing first the temperature difference between inlet water and saturated refrigerant and then by decreasing it.
Fig. 5-8 illustrates flow boiling curves for R245fa; heat flux is reported versus the difference between wall temperature and saturation temperature. Data refer to the temperature measurement location z=46 mm from MS inlet; mass velocity is equal to 300 kg m-2 s-1. The boiling curves are determined increasing water temperature (and consequently increasing heat flux, points 1-8) and then decreasing water temperature (points 7-12). The boiling branches of the curve present no hysteresis, with the data for increasing and decreasing heat flux in agreement with one other.
Fig. 5-9 and Fig. 5-10 show flow boiling curves for R134a and R32. Data refer to the temperature measurement location z=136 mm from MS inlet for R134a and z=91 mm for R32; mass velocity is equal to 600 kg m-2 s-1 for R134a and to 400 kg m-2 s-1 for R32. The boiling branches of the curve present hysteresis; at a fixed vapour quality and heat flux, the data obtained increasing heat flux show a heat transfer coefficient greater than heat transfer coefficient obtained decreasing heat flux.
The heat transfer coefficient data for R134a and R32, that will be reported in the following paragraphs, refer only to test runs performed with decreasing heat flux, when all nucleation sites are activated.

88 CHAPTER 5
8; x=0.18
7; x=0.12
6; x=0.099; x=0.08
10; x=0.08 5; x=0.07
11; x=0.06
12; x=0.05
4; x=0.063; x=0.05
2; x=0.04
1; x=0.03
0
10000
20000
30000
40000
50000
0 1 2 3 4 5 6 7 8TWALL-TSAT [°C]
HE
AT
FLU
X [W
m-2
]
G300 z= 46 mm
Fig. 5-8. Boiling curves for R245fa. Data refer to the temperature measurement location z=46 mm from MS inlet.
x=0.1x=0.13
x=0.21x=0.18
x=0.09
x=0.12
x=0.24
x=0.16
x=0.07
x=0.29
0
20
40
60
80
100
120
0 2 4 6 8 10 12TWALL-TSAT [°C]
HE
AT
FLU
X [k
W m
-2]
z=136 mm
Fig. 5-9. Boiling curves for R134a. Data refer to the temperature measurement location z=136 mm from MS inlet and mass velocity G=600 kg m-2 s-1.

CHAPTER 5 89
x=0.13
x=0.19
x=0.23
x=0.44
x=0.18
x=0.16
x=0.11
x=0.06
0
20
40
60
80
100
120
140
160
180
200
0 1 2 3 4 5 6 7 8 9TWALL-TSAT [°C]
HE
AT
FLU
X [k
W m
-2]
z=91 mm
Fig. 5-10. Boiling curves for R32. Data refer to the temperature measurement location z=91 mm from MS inlet and mass velocity G=400 kg m-2 s-1.
The effect of axial conduction on the heat transfer coefficient has been determined
from an energy balance at the wall, using the measurement of the wall temperature along the channel. It was determined that the axial conduction does not affect the values of heat flux neither the heat transfer coefficient, provided that dryout is not occurring in the channel.
The graph in Fig. 5-12 shows the heat flux plotted versus vapour quality for all the R245fa tests performed in the channel. Vapour quality varies between 0.05 and 0.8, while the heat flux ranges from 5 up to 85 kW m-2.
The graph in Fig. 5-14 shows the heat flux plotted versus vapour quality for all the R134a tests performed in the channel. Vapour quality varies between 0.05 and 0.8, while the heat flux ranges from 10 up to 240 kW m-2.
Finally, the graph in Fig. 5-16 shows the heat flux plotted versus vapour quality for all the R32 tests performed in the channel. Vapour quality varies between 0.05 and 0.65, while the heat flux ranges from 40 up to 290 kW m-2.

90 CHAPTER 5
0
1000
2000
3000
4000
5000
6000
7000
8000
9000
10000
0 10 20 30 40 50 60 70 80 90 100
HEAT FLUX [kW m -2]
HT
C [W
m-2
K-1
]
G200
G300
G400
Fig. 5-11. Flow boiling data of R245fa at Tsat=31°C: local heat transfer coefficients versus heat flux.
0
10
20
30
40
50
60
70
80
90
100
0.0 0.1 0.2 0.3 0.4 0.5 0.6 0.7 0.8 0.9VAPOUR QUALITY [/]
HE
AT
FLU
X [k
W m
-2]
G200
G300
G400
Fig. 5-12. Flow boiling data of R245fa at Tsat=31°C: local heat flux versus vapour quality.

CHAPTER 5 91
0
5000
10000
15000
20000
25000
30000
35000
40000
45000
50000
0 20 40 60 80 100 120 140 160 180 200 220 240
HEAT FLUX [kW m -2]
HT
C [W
m-2
K-1
]
G300G400G500G600
Fig. 5-13. Flow boiling data of R134a at Tsat=31°C: local heat transfer coefficients versus heat flux.
0
10
20
30
40
50
60
70
80
90
100
0.0 0.1 0.2 0.3 0.4 0.5 0.6 0.7 0.8 0.9VAPOUR QUALITY [/]
HE
AT
FLU
X [k
W m
-2]
G200
G300
G400
Fig. 5-14. Flow boiling data of R134a at Tsat=31°C: local heat flux versus vapour quality.

92 CHAPTER 5
0
10000
20000
30000
40000
50000
60000
70000
80000
0 40 80 120 160 200 240 280 320
HEAT FLUX [kW m -2]
HT
C [W
m-2
K-1
]
G400
G500
G600
G700
Fig. 5-15. Flow boiling data of R32 at Tsat=31°C: local heat transfer coefficients versus heat flux.
0
40
80
120
160
200
240
280
320
0.0 0.1 0.2 0.3 0.4 0.5 0.6 0.7VAPOUR QUALITY [/]
HE
AT
FLU
X [k
W m
-2]
G500G600G700G400
Fig. 5-16. Flow boiling data of R32 at Tsat=31°C: local heat flux versus vapour quality.

CHAPTER 5 93
When the same database is plotted as heat transfer coefficient vs. heat flux (Fig. 5-11, Fig. 5-13, Fig. 5-15), all the data points lay in a pretty narrow band, showing a clear dependence of the heat transfer coefficient on the heat flux: the higher the heat flux, the higher the heat transfer coefficient. Only at higher values of heat flux, when the vapour quality span increases, the scattering increases too, showing a possible dependence of the heat transfer coefficient on the vapour quality.
In the analysis of present data, it should be considered that the average roughness in the present channel is equal to Ra = 2.34 µm. The surface roughness is known to be important in the nucleation process: the smoother the surface, the larger the nucleation superheat (and heat flux) required to activate boiling sites. Similarly, the surface roughness must play a role in microchannel boiling, although its effect is not completely understood and agreed upon yet.
From Fig. 5-11, Fig. 5-13, and Fig. 5-15, one can see that the heat transfer coefficient increases with heat flux. Nevertheless, the effect of vapour quality and mass velocity requires that data are appropriately filtered in order to make it clear.
5.6 Effect of vapour quality and mass velocity
By processing data at constant heat flux, it is possible to get some information on the influence of vapour quality.
Fig. 5-17, Fig. 5-18, and Fig. 5-19 show the experimental trend of heat transfer coefficient at 300 kg m-2s-1 mass velocity for R245fa and R134a, and a 400 kg m-2s-1 mass velocity for R32. Different values of heat flux are considered. The heat transfer coefficient decreases with vapour quality, for all the heat flux conditions and for all the fluids. In Fig. 5-20, Fig. 5-21, and Fig. 5-22 heat transfer data have been filtered at constant mass velocity and constant vapour quality. At a constant vapour quality, the heat transfer coefficient increases with heat flux. Mass velocity doesn’t affect heat transfer coefficient.

94 CHAPTER 5
0
1000
2000
3000
4000
5000
6000
7000
8000
9000
10000
0.0 0.1 0.2 0.3 0.4 0.5 0.6 0.7 0.8 0.9VAPOUR QUALITY [/]
HT
C [W
m-2
K-1
]
q=30-32 kW m-2
q=45-50 kW m-2
q=73-78 kW m-2
Fig. 5-17. Local heat transfer coefficient versus vapour quality during vaporization of R245fa at
300 kg m-2s-1 and constant heat flux.
0
5000
10000
15000
20000
25000
30000
0.0 0.1 0.2 0.3 0.4 0.5 0.6 0.7 0.8 0.9 1.0VAPOUR QUALITY [/]
HT
C [W
m-2
K-1
]
80-90 kW m-2
60-70 kW m-2
35-40 kW m-2
Fig. 5-18. Local heat transfer coefficient versus vapour quality during vaporization of R134a at 300
kg m-2s-1 and constant heat flux.
0
10000
20000
30000
40000
50000
60000
70000
0.0 0.1 0.2 0.3 0.4 0.5 0.6 0.7 0.8 0.9 1.0VAPOUR QUALITY [/]
HT
C [W
m-2
K-1
]
140-162 kW m-295-105 kW m-260-70 kW m-2
Fig. 5-19. Local heat transfer coefficient versus vapour quality during vaporization of R32 at 400 kg m-2s-1 and constant heat flux.

CHAPTER 5 95
x=0.28-0.31
0
1000
2000
3000
4000
5000
6000
7000
8000
9000
10000
0 5 10 15 20 25 30 35 40 45 50 55 60HEAT FLUX [kW m -2]
HT
C [W
m-2
K-1
]
G200
G300G400
Fig. 5-20. R245fa: local heat transfer coefficient versus heat flux at constant vapour quality.
0
5000
10000
15000
20000
25000
30000
35000
40000
45000
50000
0 20 40 60 80 100 120 140 160
HEAT FLUX [kW m -2]
HT
C [W
m-2
K-1
]
G400 x=0.25-0.35G300 x=0.25-0.35G500 x=0.25-0.35G600 x=0.25-0.35
Fig. 5-21. R134a: local heat transfer coefficient versus heat flux at constant vapour quality.
0
10000
20000
30000
40000
50000
60000
70000
0 20 40 60 80 100 120 140 160
HEAT FLUX [kW m -2]
HT
C [W
m-2
K-1
]
G400 x=0.15-0.25
G700 x=0.15-0.25
G500 x=0.15-0.25
Fig. 5-22. R32: local heat transfer coefficient versus heat flux at constant vapour quality.
5.7 Uncertainty analysis
The experimental uncertainties of the measured parameters are reported in Table 3-2. On-site calibrations of the thermocouples installed in the wall and in the water channel is carried out, in order to improve the accuracy of the measurements, especially with regards to the temperature difference among them.
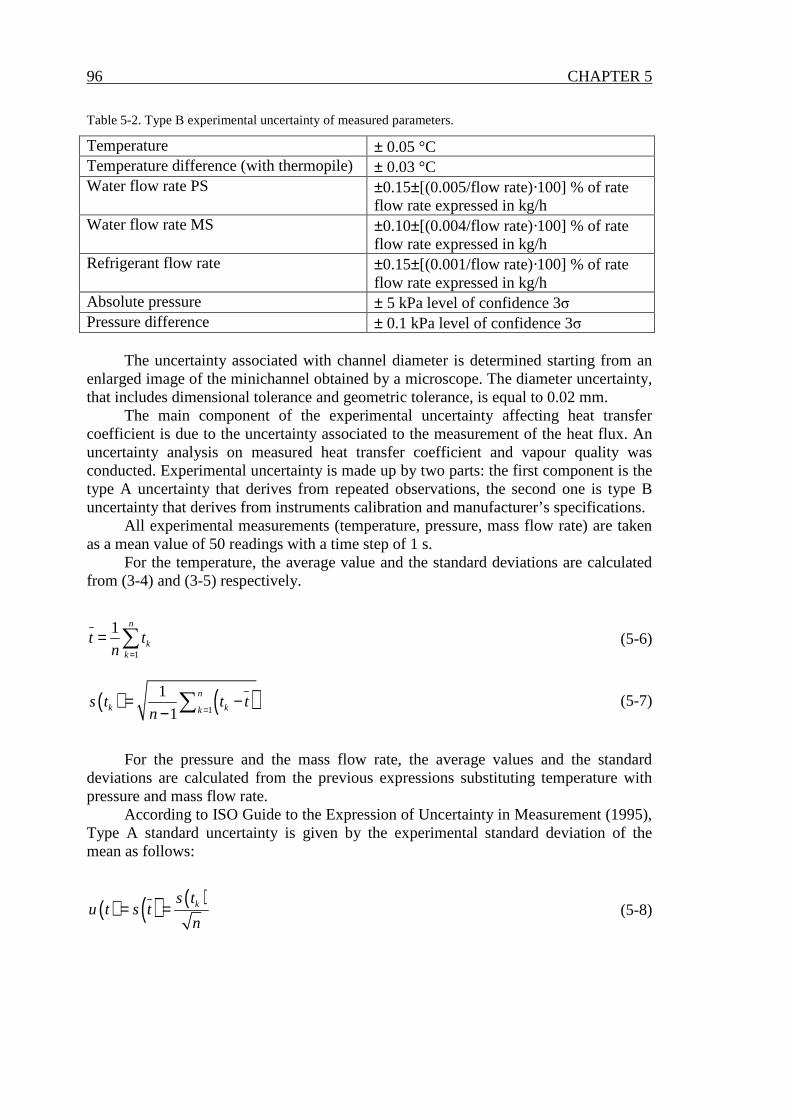
96 CHAPTER 5
Table 5-2. Type B experimental uncertainty of measured parameters.
Temperature ± 0.05 °C Temperature difference (with thermopile) ± 0.03 °C Water flow rate PS ±0.15±[(0.005/flow rate)·100] % of rate
flow rate expressed in kg/h Water flow rate MS ±0.10±[(0.004/flow rate)·100] % of rate
flow rate expressed in kg/h Refrigerant flow rate ±0.15±[(0.001/flow rate)·100] % of rate
flow rate expressed in kg/h Absolute pressure ± 5 kPa level of confidence 3σ Pressure difference ± 0.1 kPa level of confidence 3σ
The uncertainty associated with channel diameter is determined starting from an
enlarged image of the minichannel obtained by a microscope. The diameter uncertainty, that includes dimensional tolerance and geometric tolerance, is equal to 0.02 mm.
The main component of the experimental uncertainty affecting heat transfer coefficient is due to the uncertainty associated to the measurement of the heat flux. An uncertainty analysis on measured heat transfer coefficient and vapour quality was conducted. Experimental uncertainty is made up by two parts: the first component is the type A uncertainty that derives from repeated observations, the second one is type B uncertainty that derives from instruments calibration and manufacturer’s specifications.
All experimental measurements (temperature, pressure, mass flow rate) are taken as a mean value of 50 readings with a time step of 1 s.
For the temperature, the average value and the standard deviations are calculated from (3-4) and (3-5) respectively.
1
1 n
kk
t tn =
= ∑ (5-6)
( ) ( )1
1
1
n
k kks t t t
n == −
− ∑ (5-7)
For the pressure and the mass flow rate, the average values and the standard
deviations are calculated from the previous expressions substituting temperature with pressure and mass flow rate.
According to ISO Guide to the Expression of Uncertainty in Measurement (1995), Type A standard uncertainty is given by the experimental standard deviation of the mean as follows:
( ) ( ) ( )ks tu t s t
n= = (5-8)

CHAPTER 5 97
The heat transfer coefficient is obtained from measured quantities as reported below:
( ) ( )( ) ( )
( )
( ) ( )
( )
,
, , , ,
ww p w
i wall sat i wall sat
ww sat wall i
dT zm cq z dzHTC z
d T z T z d T z T z
dTHTC z f m T T d
dz
π π= =
⋅ − ⋅ −
=
ɺ
ɺ
(5-9)
Local vapour quality is calculated with a thermal balance between refrigerant and
water in the MS as reported in Eq. (5-10)
( )( )
( )( ), ,
,
( ), , ,p ww w w out r SL sub
w r w w outr LG
m c T z T m h hx z f m m T z T
m h
⋅ ⋅ − − ⋅ − = =⋅
ɺ ɺ
ɺ ɺ
ɺ (5-10)
The combined standard uncertainty is obtained by combining appropriately the
Type A and Type B standard uncertainties of the measured quantities as follows:
( )1,.. ny f x x= (5-11)
( ) ( )2
2
1
n
c iii
fu y u x
x=
∂= ∂ ∑ (5-12)
A specific procedure has been implemented for determining the uncertainty associated with temperature gradient. A temperature variation equal to thermocouple uncertainty has been imposed on each water thermocouple; therefore 215 varied water temperature profiles have been obtained, corresponding at all possible water temperature configurations compatible with experimental uncertainty. For each location z along the channel, 215 values of the temperature gradient have been calculated obtaining a Gaussian distribution. The standard deviation of temperature gradient distribution is the uncertainty associated with temperature gradient.
Heat flux distribution obtained varying all water temperature in the uncertainty range is reported in Fig. 5-23; the distribution has been calculated during R245fa flow boiling test at location z=151 mm from channel inlet.
The Gaussian probability density function shown in Fig. 5-24 is calculated using then mean value and the standard deviation of the heat flux distribution.
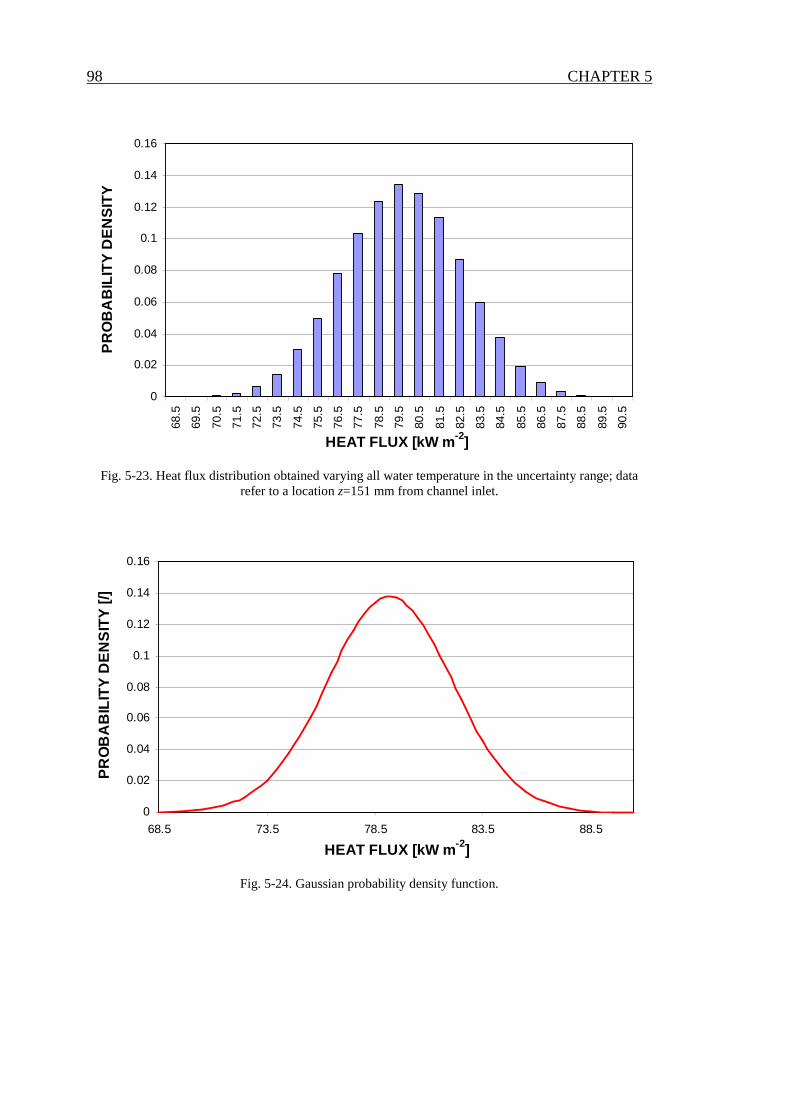
98 CHAPTER 5
0
0.02
0.04
0.06
0.08
0.1
0.12
0.14
0.16
68.5
69.5
70.5
71.5
72.5
73.5
74.5
75.5
76.5
77.5
78.5
79.5
80.5
81.5
82.5
83.5
84.5
85.5
86.5
87.5
88.5
89.5
90.5
HEAT FLUX [kW m -2]
PR
OB
AB
ILIT
Y D
EN
SIT
Y
Fig. 5-23. Heat flux distribution obtained varying all water temperature in the uncertainty range; data refer to a location z=151 mm from channel inlet.
0
0.02
0.04
0.06
0.08
0.1
0.12
0.14
0.16
68.5 73.5 78.5 83.5 88.5
HEAT FLUX [kW m -2]
PR
OB
AB
ILIT
Y D
EN
SIT
Y [/
]
Fig. 5-24. Gaussian probability density function.
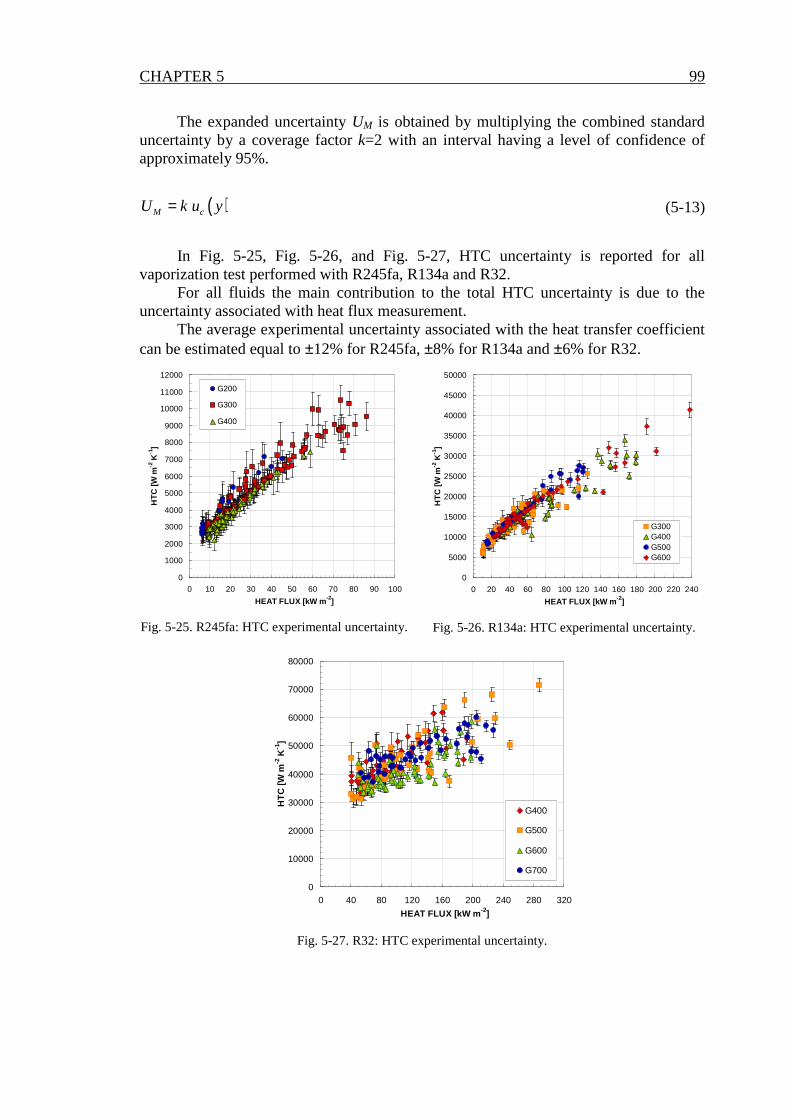
CHAPTER 5 99
The expanded uncertainty UM is obtained by multiplying the combined standard uncertainty by a coverage factor k=2 with an interval having a level of confidence of approximately 95%.
( )M cU k u y= (5-13)
In Fig. 5-25, Fig. 5-26, and Fig. 5-27, HTC uncertainty is reported for all
vaporization test performed with R245fa, R134a and R32. For all fluids the main contribution to the total HTC uncertainty is due to the
uncertainty associated with heat flux measurement. The average experimental uncertainty associated with the heat transfer coefficient
can be estimated equal to ±12% for R245fa, ±8% for R134a and ±6% for R32.
0
1000
2000
3000
4000
5000
6000
7000
8000
9000
10000
11000
12000
0 10 20 30 40 50 60 70 80 90 100
HEAT FLUX [kW m -2]
HT
C [W
m-2
K-1
]
G200
G300
G400
Fig. 5-25. R245fa: HTC experimental uncertainty.
0
5000
10000
15000
20000
25000
30000
35000
40000
45000
50000
0 20 40 60 80 100 120 140 160 180 200 220 240
HEAT FLUX [kW m -2]
HT
C [W
m-2
K-1
]
G300G400G500G600
Fig. 5-26. R134a: HTC experimental uncertainty.
0
10000
20000
30000
40000
50000
60000
70000
80000
0 40 80 120 160 200 240 280 320
HEAT FLUX [kW m -2]
HT
C [W
m-2
K-1
]
G400
G500
G600
G700
Fig. 5-27. R32: HTC experimental uncertainty.

100 CHAPTER 5
5.8 Comparison against models
Some comparisons have been performed between present data and four models available in the literature. Among others, the models by Lazarek and Black (1982), Kandlikar and Balasubramanian (2004), Thome et al. (2004), and Bertsch et al. (2009) have been considered.
The comparison with Lazarek and Black (1982) is shown in Fig. 5-28, Fig. 5-29, and Fig. 5-30. R245fa data points are under predicted, with average deviation equal to -30% and standard deviation equal to 11.0%; a better prediction is obtained for R134a and R32 data. On average, this model seems to be able to predict the experimental trend versus heat flux, while it does not catch the experimental trend versus vapour quality since the disagreement between predictions and experiments depends on vapour quality.
In Fig. 5-31, Fig. 5-32, and Fig. 5-33 experimental data are compared with predicted HTC values by Kandlikar and Balasubramanian (2004) model. R245fa and R134a heat transfer coefficients are strongly under predicted by present model.
The comparison with the model by Thome et al. (2004) is shown in Fig. 5-34, Fig. 5-35, and Fig. 5-36. R245fa data are under predicted; in particular when increasing the heat flux the scattering is low but the disagreement between model and data tends to increase. On the contrary, this model is able to catch the experimental trend with vapor quality. For R245fa the average deviation is equal to -29%, while the standard deviation is equal to 9.5%. The model by Thome et al. (2004) over predicts R32 experimental data; in addition for this fluid the scattering is high.
The comparison with the model by Bertsch et al. (2009) is shown in Fig. 5-37, Fig. 5-38, and Fig. 5-39; in this model the heat transfer coefficient is calculated as an addition of weighted nucleate boiling and convective heat transfer terms. The correlation by Bertsch et al. (2009) is able to predict R245fa experimental data with a deviation equal to -7.6% and a standard deviation equal to 10%. Experimental data for high pressure refrigerants are under predicted by present model.

CHAPTER 5 101
+30%
-30%
0
2000
4000
6000
8000
10000
0 2000 4000 6000 8000 10000EXPERIMENTAL HTC [W m -2 K -1]
PR
ED
ICT
ED
HT
C [W
m-2
K-1
]Model by Lazarek andBlack (1982)
Fig. 5-28. R245fa experimental data compared against model by Lazarek and Black (1982).
-30%
+30%
0
10000
20000
30000
40000
50000
0 10000 20000 30000 40000 50000EXPERIMENTAL HTC [W m -2 K -1]
PR
ED
ICT
ED
HT
C [W
m-2
K-1
]
Model by Lazarek andBlack (1982)
Fig. 5-29. R134a experimental data compared against model by Lazarek and Black (1982).
-30%
0
20000
40000
60000
80000
0 20000 40000 60000 80000EXPERIMENTAL HTC [W m -2 K -1]
PR
ED
ICT
ED
HT
C [W
m-2
K-1
]
Model by Lazarek andBlack (1982)
Fig. 5-30. R32 experimental data compared against model by Lazarek and Black (1982).
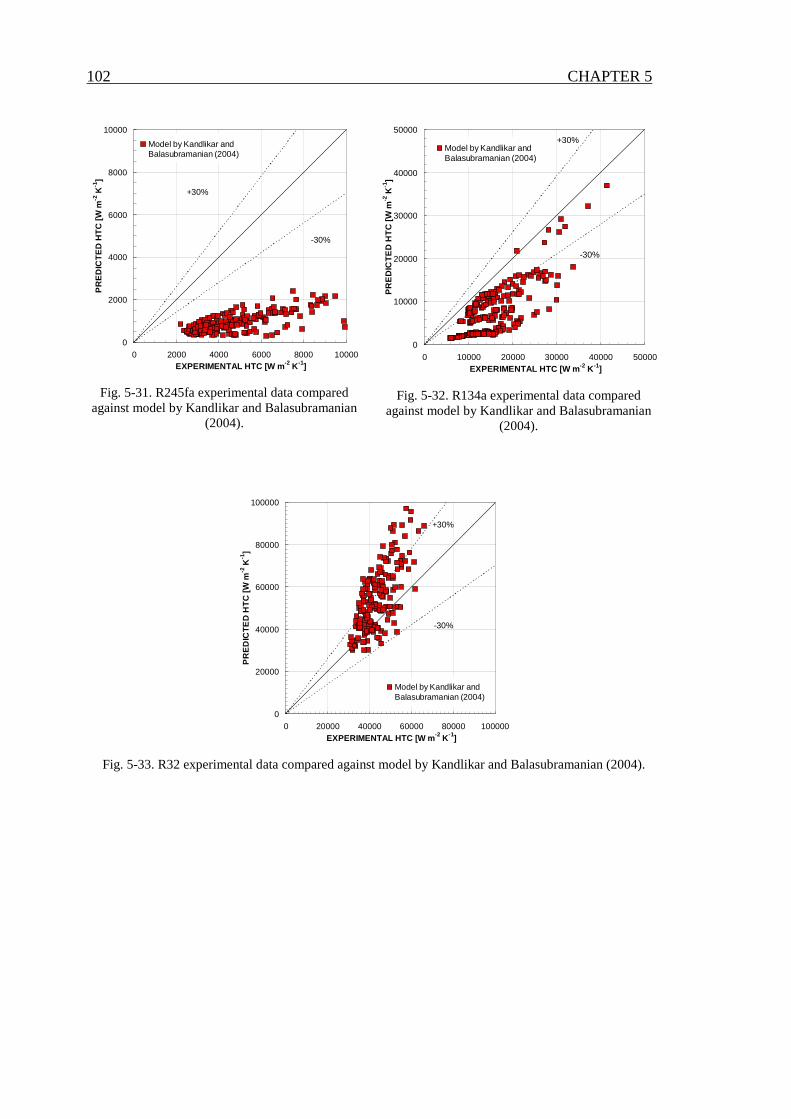
102 CHAPTER 5
-30%
+30%
0
2000
4000
6000
8000
10000
0 2000 4000 6000 8000 10000EXPERIMENTAL HTC [W m -2 K -1]
PR
ED
ICT
ED
HT
C [W
m-2
K-1
]
Model by Kandlikar andBalasubramanian (2004)
Fig. 5-31. R245fa experimental data compared against model by Kandlikar and Balasubramanian
(2004).
-30%
+30%
0
10000
20000
30000
40000
50000
0 10000 20000 30000 40000 50000EXPERIMENTAL HTC [W m -2 K -1]
PR
ED
ICT
ED
HT
C [W
m-2
K-1
]
Model by Kandlikar andBalasubramanian (2004)
Fig. 5-32. R134a experimental data compared against model by Kandlikar and Balasubramanian
(2004).
-30%
+30%
0
20000
40000
60000
80000
100000
0 20000 40000 60000 80000 100000EXPERIMENTAL HTC [W m -2 K -1]
PR
ED
ICT
ED
HT
C [W
m-2
K-1
]
Model by Kandlikar andBalasubramanian (2004)
Fig. 5-33. R32 experimental data compared against model by Kandlikar and Balasubramanian (2004).

CHAPTER 5 103
-30%
+30%
0
2000
4000
6000
8000
10000
0 2000 4000 6000 8000 10000EXPERIMENTAL HTC [W m -2 K-1]
PR
ED
ICT
ED
HT
C [W
m-2
K-1
]Model by Thome et al.(2004)
Fig. 5-34. R245fa experimental data compared against model by Thome et al. (2004).
+30%
-30%
0
10000
20000
30000
40000
50000
0 10000 20000 30000 40000 50000EXPERIMENTAL HTC [W m -2 K-1]
PR
ED
ICT
ED
HT
C [W
m-2
K-1
]
Model by Thome et al.(2004)
Fig. 5-35. R134a experimental data compared against model by Thome et al. (2004).
+30%
-30%
0
20000
40000
60000
80000
100000
0 20000 40000 60000 80000 100000EXPERIMENTAL HTC [W m -2 K -1]
PR
ED
ICT
ED
HT
C [W
m-2
K-1
]
Model by Thome et al.(2004)
Fig. 5-36. R32 experimental data compared against model by Thome et al. (2004).
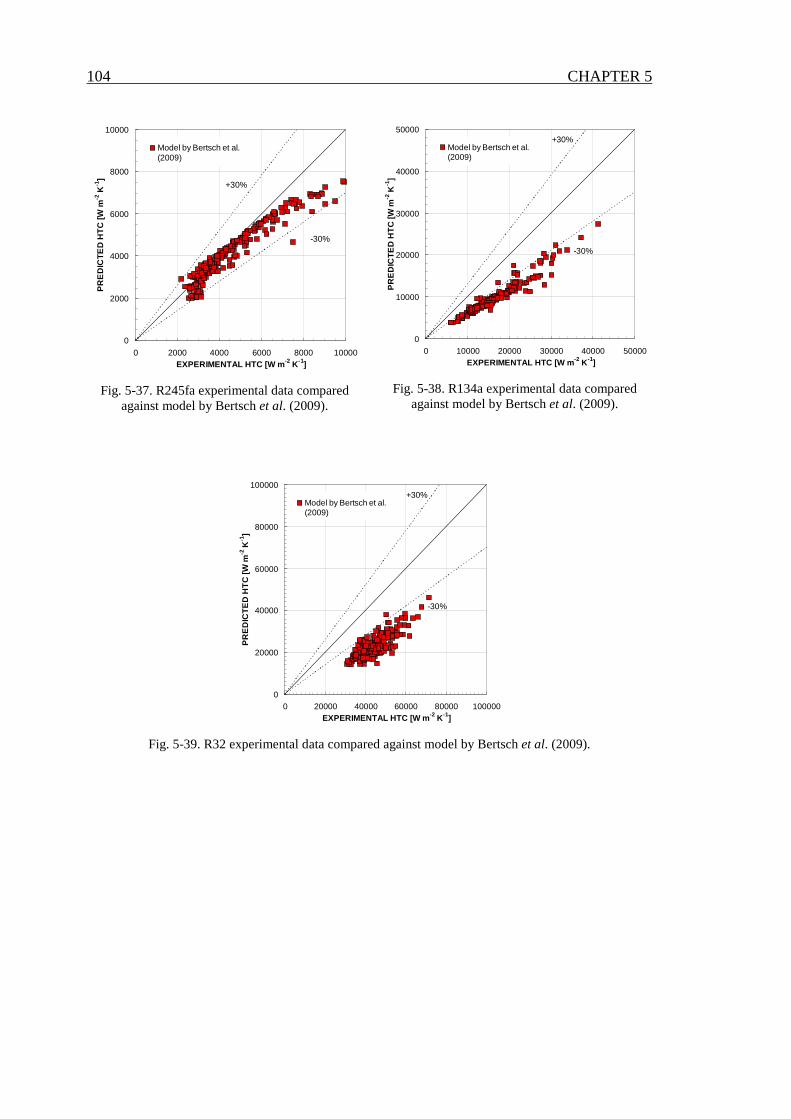
104 CHAPTER 5
-30%
+30%
0
2000
4000
6000
8000
10000
0 2000 4000 6000 8000 10000EXPERIMENTAL HTC [W m -2 K -1]
PR
ED
ICT
ED
HT
C [W
m-2
K-1
]
Model by Bertsch et al.(2009)
Fig. 5-37. R245fa experimental data compared against model by Bertsch et al. (2009).
+30%
-30%
0
10000
20000
30000
40000
50000
0 10000 20000 30000 40000 50000EXPERIMENTAL HTC [W m -2 K -1]
PR
ED
ICT
ED
HT
C [W
m-2
K-1
]
Model by Bertsch et al.(2009)
Fig. 5-38. R134a experimental data compared against model by Bertsch et al. (2009).
+30%
-30%
0
20000
40000
60000
80000
100000
0 20000 40000 60000 80000 100000EXPERIMENTAL HTC [W m -2 K -1]
PR
ED
ICT
ED
HT
C [W
m-2
K-1
]
Model by Bertsch et al.(2009)
Fig. 5-39. R32 experimental data compared against model by Bertsch et al. (2009).

105
Chapter 6.
Dryout during flow boiling in the single
circular minichannel
6.1 Introduction
This chapter presents an experimental investigation on the dryout during flow boiling of R245fa, R134a and R32 inside a 0.96 mm diameter single circular minichannel. In the present tests, the channel is not electrically heated; instead, the flow boiling is achieved by means of a secondary fluid (water). Therefore, the heat flux is not uniform in the channel since the temperature of the water varies.
The onset of dryout is detected by means of the standard deviation of the temperature readings in the wall. The wall temperature in fact displays larger fluctuations in the zone where dryout occurs, which are related to the presence of a liquid film drying up at the wall with some kind of an oscillating process. These temperature fluctuations are detected by means of the standard deviation in the wall temperature. These temperature fluctuations never appear during condensation tests, neither are present during flow boiling at low vapor qualities. The fluctuations also disappear in the post-dryout zone.
Experimental values of dryout quality measured with the above method are reported in this chapter at mass velocity ranging between 200 and 250 kg m-2s-1 for R245fa, 100 and 700 kg m-2s-1 for R134a, and between 200 and 900 kg m-2s-1 for R32. Since the heat flux is not uniform along the channel, each dryout point is characterized by its own boiling story. Nevertheless, an average value of heat flux can be defined in the channel, with the purpose of comparing it to critical heat flux values in uniformly heated channels. Present experimental data has been compared against some models available in the literature, which provide either the critical heat flux or the dryout quality in microchannels.
The onset of dryout in flow boiling causes a sharp decrease of the heat transfer coefficient due to a change in the heat transfer mechanism. Despite recent activity carried out in order to investigate the behaviour of flow boiling heat transfer and critical heat flux in mini and microchannels, there is still a lack of information and reliable data, if compared to the wide range of engineering design and possible applications.
In practical applications of evaporation inside mini and microchannels, the heat flux may be an independent variable as under Joule-effect heating or it may be a
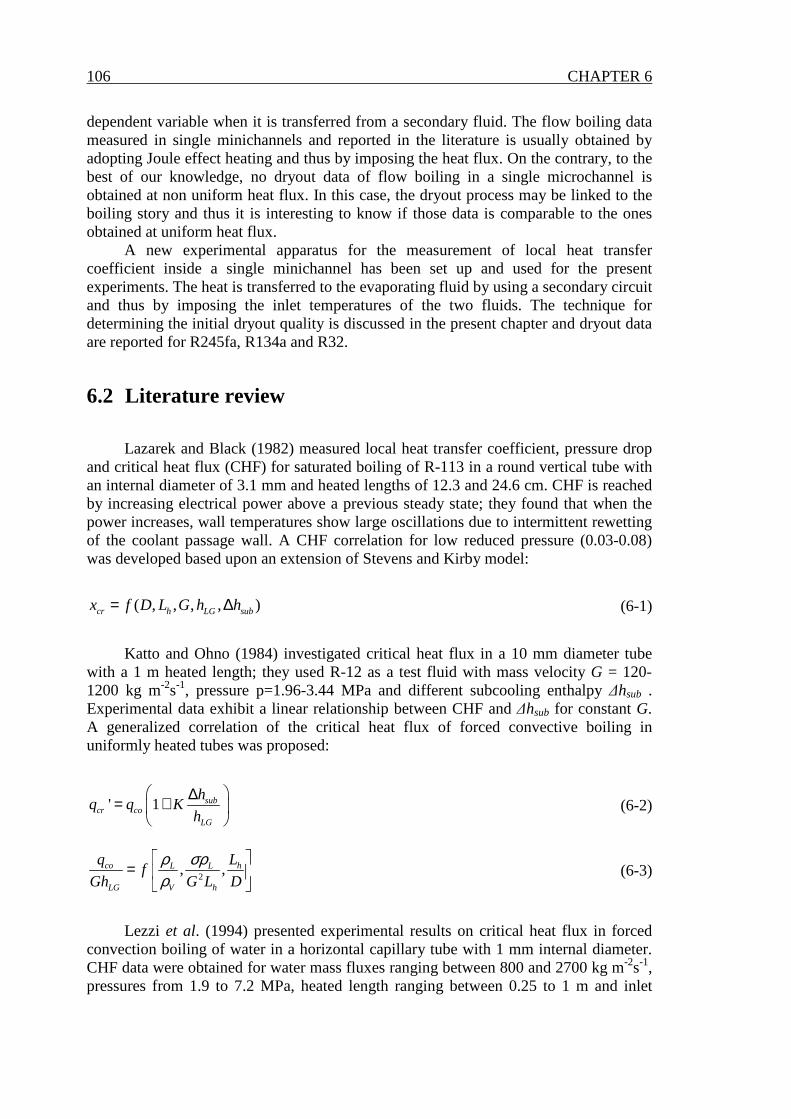
106 CHAPTER 6
dependent variable when it is transferred from a secondary fluid. The flow boiling data measured in single minichannels and reported in the literature is usually obtained by adopting Joule effect heating and thus by imposing the heat flux. On the contrary, to the best of our knowledge, no dryout data of flow boiling in a single microchannel is obtained at non uniform heat flux. In this case, the dryout process may be linked to the boiling story and thus it is interesting to know if those data is comparable to the ones obtained at uniform heat flux.
A new experimental apparatus for the measurement of local heat transfer coefficient inside a single minichannel has been set up and used for the present experiments. The heat is transferred to the evaporating fluid by using a secondary circuit and thus by imposing the inlet temperatures of the two fluids. The technique for determining the initial dryout quality is discussed in the present chapter and dryout data are reported for R245fa, R134a and R32.
6.2 Literature review
Lazarek and Black (1982) measured local heat transfer coefficient, pressure drop and critical heat flux (CHF) for saturated boiling of R-113 in a round vertical tube with an internal diameter of 3.1 mm and heated lengths of 12.3 and 24.6 cm. CHF is reached by increasing electrical power above a previous steady state; they found that when the power increases, wall temperatures show large oscillations due to intermittent rewetting of the coolant passage wall. A CHF correlation for low reduced pressure (0.03-0.08) was developed based upon an extension of Stevens and Kirby model:
( , , , , )cr h LG subx f D L G h h= ∆ (6-1)
Katto and Ohno (1984) investigated critical heat flux in a 10 mm diameter tube
with a 1 m heated length; they used R-12 as a test fluid with mass velocity G = 120-1200 kg m-2s-1, pressure p=1.96-3.44 MPa and different subcooling enthalpy ∆hsub . Experimental data exhibit a linear relationship between CHF and ∆hsub for constant G. A generalized correlation of the critical heat flux of forced convective boiling in uniformly heated tubes was proposed:
' 1 subcr co
LG
hq q K
h
∆= +
(6-2)
2, ,co hL L
LG V h
q Lf
Gh G L D
ρ σρρ
=
(6-3)
Lezzi et al. (1994) presented experimental results on critical heat flux in forced
convection boiling of water in a horizontal capillary tube with 1 mm internal diameter. CHF data were obtained for water mass fluxes ranging between 800 and 2700 kg m-2s-1, pressures from 1.9 to 7.2 MPa, heated length ranging between 0.25 to 1 m and inlet
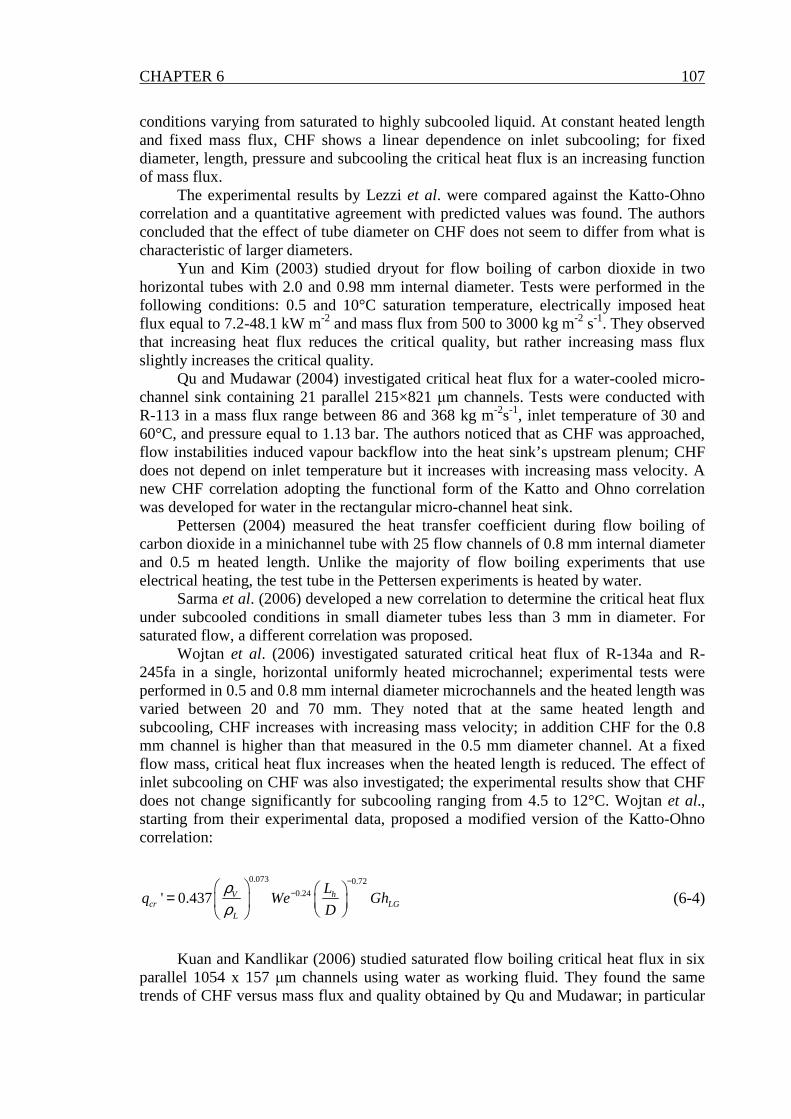
CHAPTER 6 107
conditions varying from saturated to highly subcooled liquid. At constant heated length and fixed mass flux, CHF shows a linear dependence on inlet subcooling; for fixed diameter, length, pressure and subcooling the critical heat flux is an increasing function of mass flux.
The experimental results by Lezzi et al. were compared against the Katto-Ohno correlation and a quantitative agreement with predicted values was found. The authors concluded that the effect of tube diameter on CHF does not seem to differ from what is characteristic of larger diameters.
Yun and Kim (2003) studied dryout for flow boiling of carbon dioxide in two horizontal tubes with 2.0 and 0.98 mm internal diameter. Tests were performed in the following conditions: 0.5 and 10°C saturation temperature, electrically imposed heat flux equal to 7.2-48.1 kW m-2 and mass flux from 500 to 3000 kg m-2 s-1. They observed that increasing heat flux reduces the critical quality, but rather increasing mass flux slightly increases the critical quality.
Qu and Mudawar (2004) investigated critical heat flux for a water-cooled micro-channel sink containing 21 parallel 215×821 µm channels. Tests were conducted with R-113 in a mass flux range between 86 and 368 kg m-2s-1, inlet temperature of 30 and 60°C, and pressure equal to 1.13 bar. The authors noticed that as CHF was approached, flow instabilities induced vapour backflow into the heat sink’s upstream plenum; CHF does not depend on inlet temperature but it increases with increasing mass velocity. A new CHF correlation adopting the functional form of the Katto and Ohno correlation was developed for water in the rectangular micro-channel heat sink.
Pettersen (2004) measured the heat transfer coefficient during flow boiling of carbon dioxide in a minichannel tube with 25 flow channels of 0.8 mm internal diameter and 0.5 m heated length. Unlike the majority of flow boiling experiments that use electrical heating, the test tube in the Pettersen experiments is heated by water.
Sarma et al. (2006) developed a new correlation to determine the critical heat flux under subcooled conditions in small diameter tubes less than 3 mm in diameter. For saturated flow, a different correlation was proposed.
Wojtan et al. (2006) investigated saturated critical heat flux of R-134a and R-245fa in a single, horizontal uniformly heated microchannel; experimental tests were performed in 0.5 and 0.8 mm internal diameter microchannels and the heated length was varied between 20 and 70 mm. They noted that at the same heated length and subcooling, CHF increases with increasing mass velocity; in addition CHF for the 0.8 mm channel is higher than that measured in the 0.5 mm diameter channel. At a fixed flow mass, critical heat flux increases when the heated length is reduced. The effect of inlet subcooling on CHF was also investigated; the experimental results show that CHF does not change significantly for subcooling ranging from 4.5 to 12°C. Wojtan et al., starting from their experimental data, proposed a modified version of the Katto-Ohno correlation:
0.073 0.72
0.24' 0.437 V hcr LG
L
Lq We Gh
D
ρρ
−− =
(6-4)
Kuan and Kandlikar (2006) studied saturated flow boiling critical heat flux in six
parallel 1054 x 157 µm channels using water as working fluid. They found the same trends of CHF versus mass flux and quality obtained by Qu and Mudawar; in particular
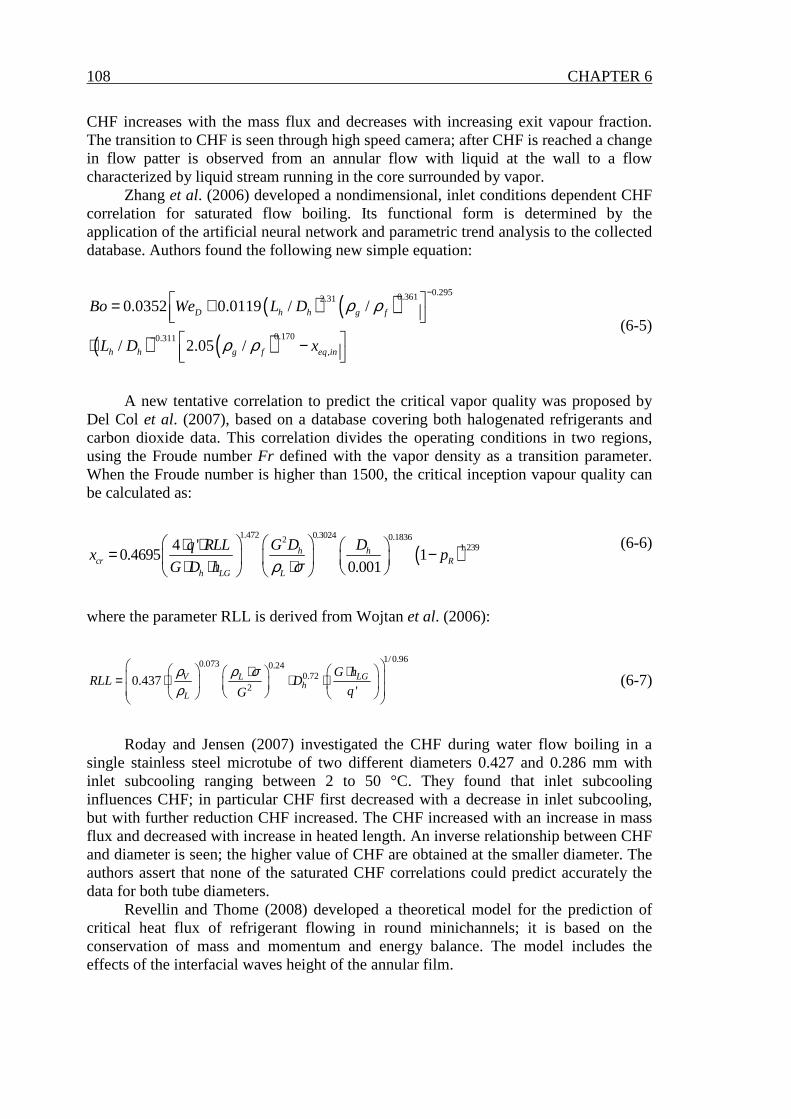
108 CHAPTER 6
CHF increases with the mass flux and decreases with increasing exit vapour fraction. The transition to CHF is seen through high speed camera; after CHF is reached a change in flow patter is observed from an annular flow with liquid at the wall to a flow characterized by liquid stream running in the core surrounded by vapor.
Zhang et al. (2006) developed a nondimensional, inlet conditions dependent CHF correlation for saturated flow boiling. Its functional form is determined by the application of the artificial neural network and parametric trend analysis to the collected database. Authors found the following new simple equation:
( ) ( )( ) ( )
0.2950.3612.31
0.1700.311
,
0.0352 0.0119 / /
/ 2.05 /
D h h g f
h h g f eq in
Bo We L D
L D x
ρ ρ
ρ ρ
−
−
= +
⋅ −
(6-5)
A new tentative correlation to predict the critical vapor quality was proposed by
Del Col et al. (2007), based on a database covering both halogenated refrigerants and carbon dioxide data. This correlation divides the operating conditions in two regions, using the Froude number Fr defined with the vapor density as a transition parameter. When the Froude number is higher than 1500, the critical inception vapour quality can be calculated as:
( )1.472 0.3024 0.18362
1.2394 '0.4695 1
0.001h h
cr Rh LG L
G D Dq RLLx p
G D h ρ σ ⋅ ⋅ = − ⋅ ⋅ ⋅
(6-6)
where the parameter RLL is derived from Wojtan et al. (2006):
1/0.960.073 0.24
0.722
0.437'
V LGLh
L
G hRLL D
qG
ρ ρ σρ
⋅⋅ = ⋅ ⋅ ⋅
(6-7)
Roday and Jensen (2007) investigated the CHF during water flow boiling in a
single stainless steel microtube of two different diameters 0.427 and 0.286 mm with inlet subcooling ranging between 2 to 50 °C. They found that inlet subcooling influences CHF; in particular CHF first decreased with a decrease in inlet subcooling, but with further reduction CHF increased. The CHF increased with an increase in mass flux and decreased with increase in heated length. An inverse relationship between CHF and diameter is seen; the higher value of CHF are obtained at the smaller diameter. The authors assert that none of the saturated CHF correlations could predict accurately the data for both tube diameters.
Revellin and Thome (2008) developed a theoretical model for the prediction of critical heat flux of refrigerant flowing in round minichannels; it is based on the conservation of mass and momentum and energy balance. The model includes the effects of the interfacial waves height of the annular film.

CHAPTER 6 109
Kosar (2009) proposed a new model to predict saturated critical heat flux in minichannels. The model was compared to experimental data points obtained from CHF studies on minichannels encompassing various working fluids (water, R123, R113, R134a, and R245fa) over a broad range of mass velocities (50-1600 kg m-2 s-1) and pressures (101-888 kPa).
6.3 Experimental test section
The test rig used for the CHF experimental tests is the same utilized for flow boiling test and described in Chapter 5. It consists of the primary (refrigerant) loop and of two auxiliary loops: the cooling water loop and the heating water loop.
During CHF tests, the fluid is pumped through the Coriolis-effect mass flow meter into the test section as a subcooled liquid. The subcooled liquid enters the test section, which is made of two counter-flow heat exchangers: the first one (pre-section) is used to control the inlet subcooling, the second one is the actual measuring sector.
The fluid pressure upstream and downstream of the test tube is measured by means of two pressure (absolute and differential) transducers. Two refrigerated thermal baths are used in the tests: the first one provides the water entering the measuring sector and the pre-sector at a desired temperature, the other one provides the coolant for the postcondenser. The water entering the pre-sector can be maintained at a lower temperature than refrigerant saturation with the aim to avoid vaporization in pre-sector.
The copper tube is externally machined to dig the water passage. It is a complex flow passage, which has been studied with the aim of increasing the external heat transfer area and thus decreasing the external heat transfer resistance, and promoting the water mixing in the channel, allowing the measurement of the effective mean water temperature during the heat transfer process. The minimum wall thickness between water and boiling refrigerant is equal to 1 mm.
The water flow rates, in the pre-sector and in the measuring section, are measured by means of two Coriolis-effect mass flow meters and water temperature difference across the sectors is measured with two copper-constantan thermopiles.
The measuring sector is equipped with a high number of thermocouples, both in the wall and in the water, and is thermally separated from the pre-sector and the exit tube through stainless steel capillary tubes (adiabatic segments). The test section is designed for measurement of local two-phase heat transfer coefficients by measuring the local wall temperature and the coolant temperature profile along the sector, which is used to calculate the local heat flux.
6.4 Dryout quality and critical heat flux
6.4.1 Temperature fluctuations in the wall
The present test apparatus allows to achieve the complete vaporization process in the channel. Fig. 6-1 shows the refrigerant, wall and water temperature measurements along the measuring sector at refrigerant G = 400 kg m-2 s-1. As the vaporization

110 CHAPTER 6
proceeds, the wall temperature does not show big variation up to the length of 160 mm. After that, an abrupt change in the wall temperature occurs, with diminishing water to wall temperature difference. In the last part of the channel, this temperature difference approaches zero. The above change in temperature is related to the dry-out of the liquid film at the internal surface.
The temperature reported here is actually the mean value of 50 readings recorded with a time step of 1 s:
1
1 n
kk
t tn =
= ∑ (6-8)
The experimental standard deviation of the readings can be expressed as:
( ) ( )1
1
1
n
k kks t t t
n == −
− ∑ (6-9)
Fig. 6-1 shows the standard deviation of the temperature measurements in the wall
(y-axis on the right): this standard deviation is pretty much constant in the first part of the channel but shows a great increase just at the location where the wall temperature variation occurs. The standard deviation of the fifty temperature readings become three times higher at the point where the wall temperature deviates from the previous trend and after some distance goes back to the initial values.
Depending on the test condition, the standard deviation can rise up to five times. This is due to the dryout of the film adjacent to the heated wall and the temperature fluctuation is the result of an oscillating drying process of the film at the wall.
This increase in the standard deviation of the wall temperature measurement has always been observed in this case. It must not be confused with the experimental uncertainty of the temperature measurement since it occurs systematically when the wall temperature starts approaching the water temperature and the heat flux decreases.
It may be of some interest to report here that during condensation tests no similar variation in the standard deviation of the wall temperature measurement was reported. As shown in Fig. 6-2, during condensation, the standard deviation of 50 readings has the same value as recorded for the initial part of the channel in the flow boiling process.
It is worth noting the relevance of such a criterion for the determination of the critical quality in the channel when the heat flux is not imposed. During tests with electrical heating, when the critical conditions occur, an abrupt change in the wall temperature is evident. When vaporizing by means of a secondary fluid, still there is a temperature change in the wall, but it is limited by the temperature of the secondary fluid. Fig. 6-1 shows the clear correspondence of the temperature variation in the wall with the significant increase of the standard deviation.

CHAPTER 6 111
22
24
26
28
30
32
34
36
38
40
42
0 40 80 120 160 200 240
POSITION [mm]
TE
MP
ER
AT
UR
E [°
C]
0.00
0.01
0.02
0.03
0.04
0.05
0.06
0.07
0.08
0.09
0.10
ST
AN
D. D
EV
. [°C
]
WATER TEMPERATURE IN THE CHANNELWATER TEMPERATURE INLET/OUTLETWALL TEMPERATUREREFRIGERANT SATURATION TEMPERATUREREFRIGERANT MEASURED TEMPERATURESTANDARD DEVIATION OF WALL TEMPERATURE
Fig. 6-1 Water, wall and saturation temperature during a boiling process of R134a in the 0.96 mm diameter channel at G=400 kg m-2s-1. The big square dots represent the standard deviation of the wall
temperature measurements.
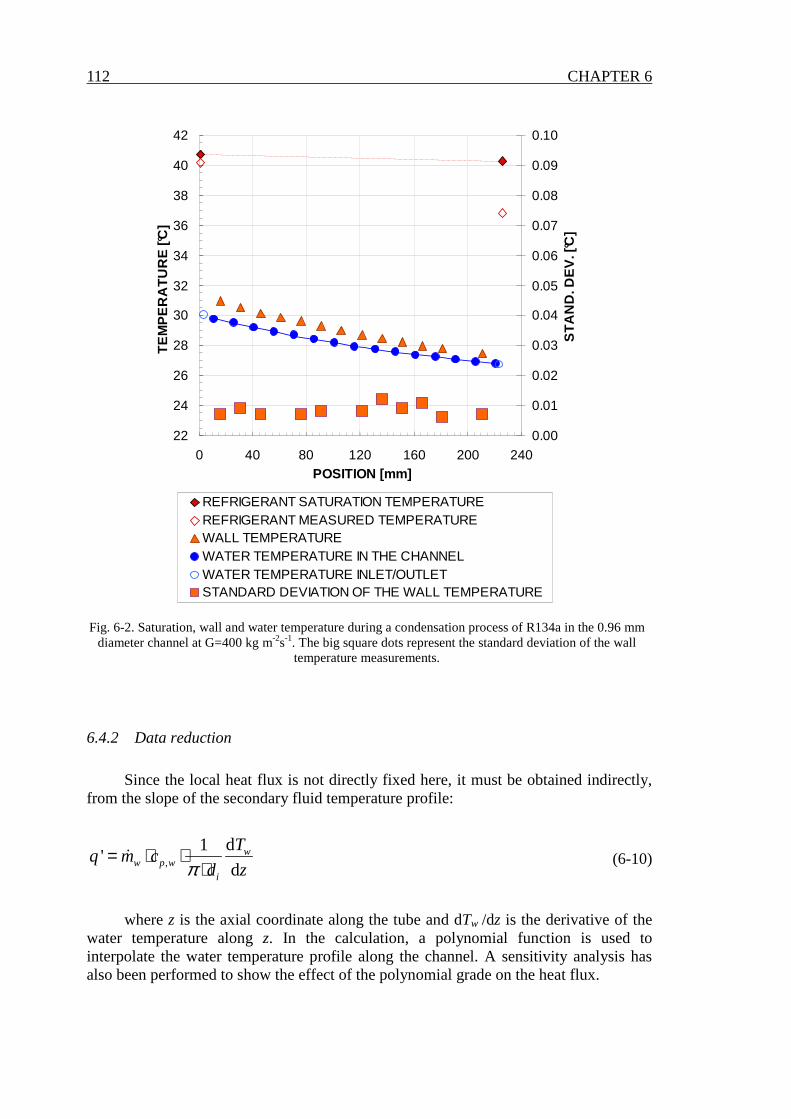
112 CHAPTER 6
22
24
26
28
30
32
34
36
38
40
42
0 40 80 120 160 200 240POSITION [mm]
TE
MP
ER
AT
UR
E [°
C]
0.00
0.01
0.02
0.03
0.04
0.05
0.06
0.07
0.08
0.09
0.10
ST
AN
D. D
EV
. [°C
]
REFRIGERANT SATURATION TEMPERATUREREFRIGERANT MEASURED TEMPERATUREWALL TEMPERATUREWATER TEMPERATURE IN THE CHANNELWATER TEMPERATURE INLET/OUTLETSTANDARD DEVIATION OF THE WALL TEMPERATURE
Fig. 6-2. Saturation, wall and water temperature during a condensation process of R134a in the 0.96 mm diameter channel at G=400 kg m-2s-1. The big square dots represent the standard deviation of the wall
temperature measurements.
6.4.2 Data reduction
Since the local heat flux is not directly fixed here, it must be obtained indirectly, from the slope of the secondary fluid temperature profile:
,
d1'
dw
w p wi
Tq m c
d zπ= ⋅ ⋅
⋅ɺ (6-10)
where z is the axial coordinate along the tube and dTw /dz is the derivative of the
water temperature along z. In the calculation, a polynomial function is used to interpolate the water temperature profile along the channel. A sensitivity analysis has also been performed to show the effect of the polynomial grade on the heat flux.

CHAPTER 6 113
For each test run, from the plot of the temperature readings and the standard deviation data of the wall temperature it is possible to determine the position (z,cr) where the initial dryout occurs. The onset of dryout is taken at the position z,cr corresponding to 5 mm distance prior to the wall thermocouple showing a jump in the standard deviation. The heated length is defined as the length of the tube up to position z,cr.
The total heat flow rate transferred to the refrigerant up to this location is determined from the thermal balance on the coolant side by using the water temperature difference between the given location (z,cr) and the water outlet (z=0) and can also be calculated by integrating the local heat flux between refrigerant inlet (z=0) and the given position z:
,
, , ,
0
'dz cr
z cr w p w w zq m c T d q zπ= ⋅ ⋅ ∆ = ⋅ ⋅ ∫ɺ (6-11)
The dryout vapour quality xcr at the axial position z,cr is obtained from:
,z cr r subcr
r LG
q m hx
m h
− ⋅∆=
⋅ɺ
ɺ (6-12)
where the vapour quality is a function of the total heat flow rate qz,cr up to that
location, of the difference between specific enthalpy of saturated liquid and specific enthalpy of the subcooled liquid (∆hsub) and of the latent heat ( hLG ). The enthalpy of the subcooled refrigerant is determined from the inlet pressure and temperature.
Because heat flux is not uniform, each dryout point should be referred to its own boiling story. Nevertheless, since all the experimental heat flux curves have similar trend, for the sake of comparison with dryout of uniformly heated channels, a value of the critical heat flux can be determined by averaging the heat flux q’ on the heated length, from 0 (refrigerant inlet) to z,cr.
,' z crcr
cr
d zπ=
⋅ ⋅ (6-13)
It is also possible to calculate the local heat transfer coefficient inside the
minichannel which represents an additional information for the determination of the dryout location. The local heat transfer coefficient is obtained as the ratio of heat flux to temperature difference:
( ) ( )'
wall sat
qHTC z
T T=
− (6-14)

114 CHAPTER 6
where the saturation temperature is obtained from pressure measurements. Pressure is measured at inlet and outlet of the measuring sector. The local saturation temperature along the sector is determined by calculating the pressure profile, which is then corrected to match the measured pressure drop.
Fig. 6-3 reports temperatures, standard deviation, local heat flux, vapour quality and heat transfer coefficient versus axial position for a test run performed with R134a at 400 kg m-2s-1 mass velocity.
22
24
26
28
30
32
34
36
38
40
42
0 40 80 120 160 200 240POSITION [mm]
TE
MP
ER
AT
UR
E [°
C]
0.00
0.02
0.04
0.06
0.08
0.10
0.12
0.14
0.16
0.18
0.20
ST
AN
D. D
EV
. [°C
]
Water
Water IN/OUT
Wall
Saturation (p)
Ref IN/OUT
0
20
40
60
80
100
120
140
160
180
200
0 40 80 120 160 200 240POSITION [mm]
HE
AT
FLU
X [k
W m
-2]
0
5
10
15
20
25
30
35
40
45
50
0 40 80 120 160 200 240POSITION [mm]
HT
C [k
W m
-2 K
-1]
0.0
0.1
0.2
0.3
0.4
0.5
0.6
0.7
0.8
0.9
1.0V
AP
OU
R Q
UA
LIT
Y [/
]HTC
Vapour quality
Fig. 6-3. Flow boiling process of R134a in the 0.96 single circular minichannel at 400 kg m-2s-1: Top) Water, wall and refrigerant temperatures, standard deviation of wall temperature and heat flux; Bottom)
Heat transfer coefficient and vapour quality along the channel.
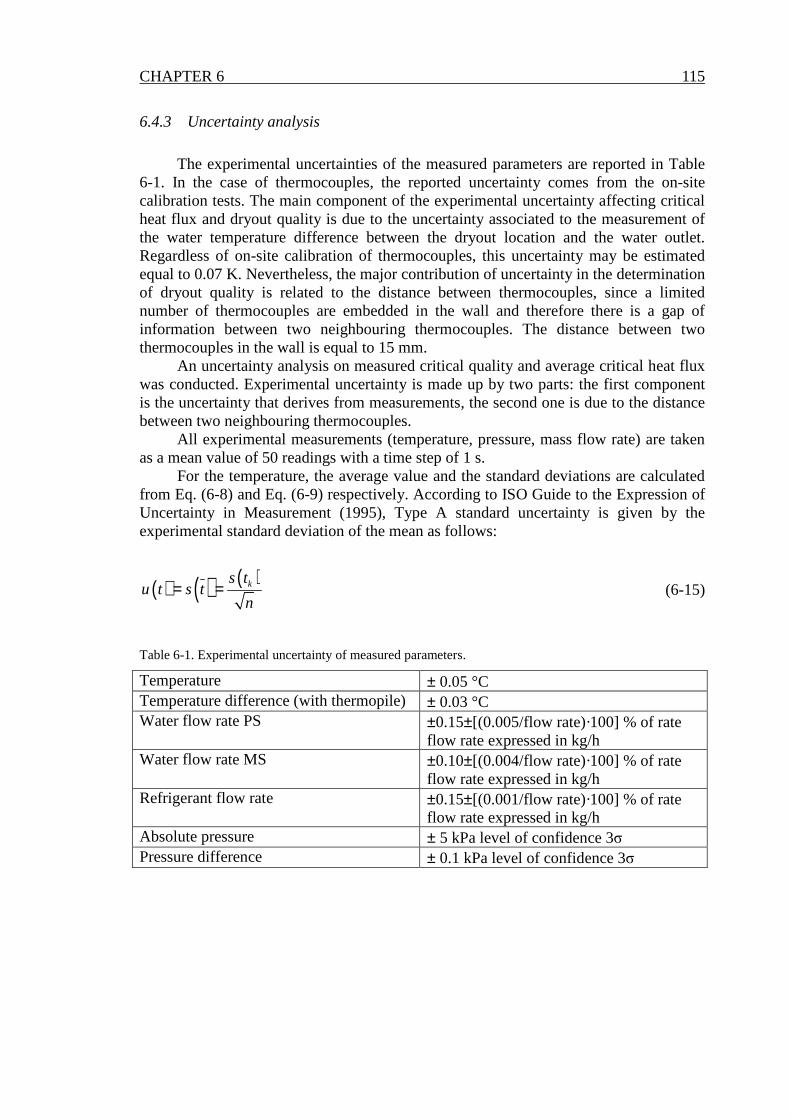
CHAPTER 6 115
6.4.3 Uncertainty analysis
The experimental uncertainties of the measured parameters are reported in Table 6-1. In the case of thermocouples, the reported uncertainty comes from the on-site calibration tests. The main component of the experimental uncertainty affecting critical heat flux and dryout quality is due to the uncertainty associated to the measurement of the water temperature difference between the dryout location and the water outlet. Regardless of on-site calibration of thermocouples, this uncertainty may be estimated equal to 0.07 K. Nevertheless, the major contribution of uncertainty in the determination of dryout quality is related to the distance between thermocouples, since a limited number of thermocouples are embedded in the wall and therefore there is a gap of information between two neighbouring thermocouples. The distance between two thermocouples in the wall is equal to 15 mm.
An uncertainty analysis on measured critical quality and average critical heat flux was conducted. Experimental uncertainty is made up by two parts: the first component is the uncertainty that derives from measurements, the second one is due to the distance between two neighbouring thermocouples.
All experimental measurements (temperature, pressure, mass flow rate) are taken as a mean value of 50 readings with a time step of 1 s.
For the temperature, the average value and the standard deviations are calculated from Eq. (6-8) and Eq. (6-9) respectively. According to ISO Guide to the Expression of Uncertainty in Measurement (1995), Type A standard uncertainty is given by the experimental standard deviation of the mean as follows:
( ) ( ) ( )ks tu t s t
n= = (6-15)
Table 6-1. Experimental uncertainty of measured parameters.
Temperature ± 0.05 °C Temperature difference (with thermopile) ± 0.03 °C Water flow rate PS ±0.15±[(0.005/flow rate)·100] % of rate
flow rate expressed in kg/h Water flow rate MS ±0.10±[(0.004/flow rate)·100] % of rate
flow rate expressed in kg/h Refrigerant flow rate ±0.15±[(0.001/flow rate)·100] % of rate
flow rate expressed in kg/h Absolute pressure ± 5 kPa level of confidence 3σ Pressure difference ± 0.1 kPa level of confidence 3σ

116 CHAPTER 6
The critical heat flux and the critical quality are obtained from measured quantities as reported below:
( ), ,,' , ,w p w w z
cr w w z ii cr
m c Tq f m T d
d zπ⋅ ⋅ ∆
= = ∆⋅ ⋅
ɺɺ (6-16)
( ),, , ,z cr r sub
cr z cr r subr LG
q m hx f q m h
m h
− ⋅∆= = ∆
⋅ɺ
ɺɺ
(6-17)
The combined standard uncertainty is obtained by combining appropriately the
Type A and Type B standard uncertainties of the measured quantities as follows:
( )1,.. ny f x x= (6-18)
( ) ( )2
2
1
n
c iii
fu y u x
x=
∂= ∂ ∑ (6-19)
The expanded uncertainty UM is obtained by multiplying the combined standard
uncertainty by a coverage factor k=2 with an interval having a level of confidence of approximately 95%.
( )M cU k u y= (6-20)
The expanded uncertainty on the dryout vapour quality UM is reported in Table
6-2. The uncertainty associated with the distance ∆z=0.015 m between two
thermocouples can be calculated from the heat flow rate ∆q transferred to the boiling fluid in the length ∆z . The vapour quality variation in this length ∆x, caused by the quantity ∆q , can be computed as reported in the equations below:
( ), , ,w p w w cr w cr zq m c t t −∆∆ = −ɺ (6-21)
r LG
qx
m h
∆∆ =ɺ
(6-22)
Finally the uncertainty derived from the measurement process UM and the
uncertainty associated to the distance between two thermocouples in the channel UD are combined to obtain the overall uncertainty UT of critical vapour quality:
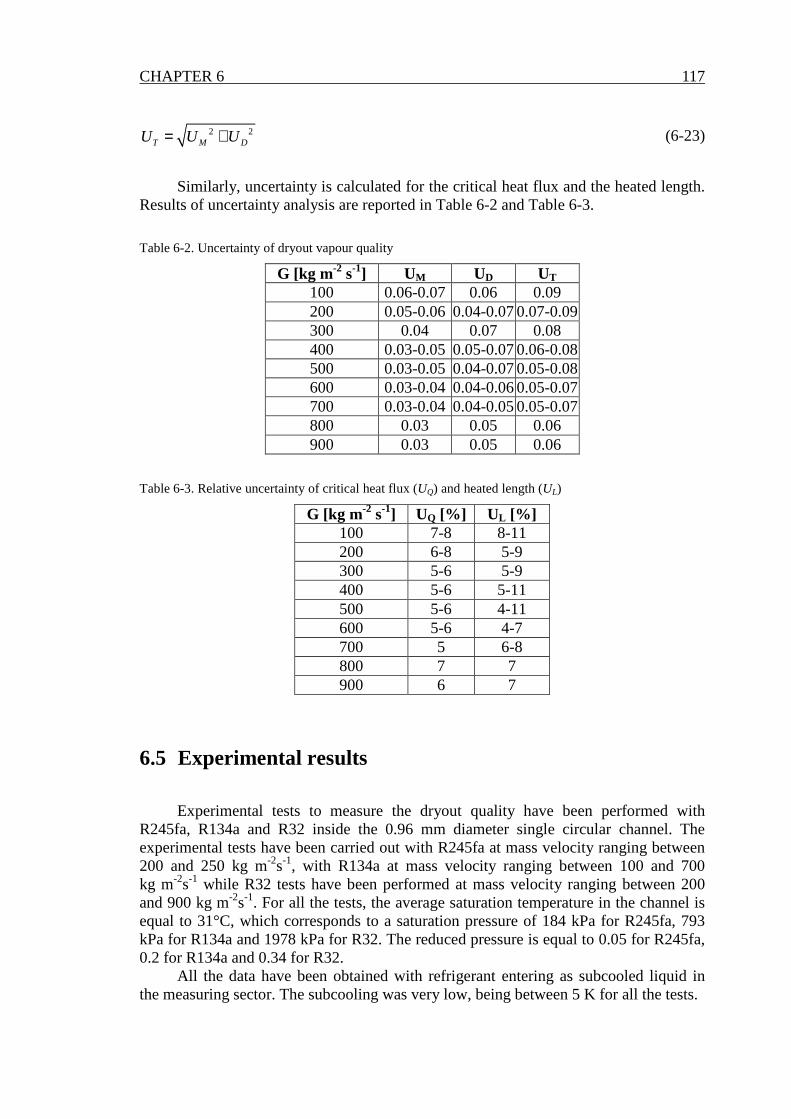
CHAPTER 6 117
2 2T M DU U U= + (6-23)
Similarly, uncertainty is calculated for the critical heat flux and the heated length.
Results of uncertainty analysis are reported in Table 6-2 and Table 6-3.
Table 6-2. Uncertainty of dryout vapour quality
G [kg m-2 s-1] UM UD UT 100 0.06-0.07 0.06 0.09 200 0.05-0.06 0.04-0.07 0.07-0.09 300 0.04 0.07 0.08 400 0.03-0.05 0.05-0.07 0.06-0.08 500 0.03-0.05 0.04-0.07 0.05-0.08 600 0.03-0.04 0.04-0.06 0.05-0.07 700 0.03-0.04 0.04-0.05 0.05-0.07 800 0.03 0.05 0.06 900 0.03 0.05 0.06
Table 6-3. Relative uncertainty of critical heat flux (UQ) and heated length (UL)
G [kg m-2 s-1] UQ [%] UL [%] 100 7-8 8-11 200 6-8 5-9 300 5-6 5-9 400 5-6 5-11 500 5-6 4-11 600 5-6 4-7 700 5 6-8 800 7 7 900 6 7
6.5 Experimental results
Experimental tests to measure the dryout quality have been performed with R245fa, R134a and R32 inside the 0.96 mm diameter single circular channel. The experimental tests have been carried out with R245fa at mass velocity ranging between 200 and 250 kg m-2s-1, with R134a at mass velocity ranging between 100 and 700 kg m-2s-1 while R32 tests have been performed at mass velocity ranging between 200 and 900 kg m-2s-1. For all the tests, the average saturation temperature in the channel is equal to 31°C, which corresponds to a saturation pressure of 184 kPa for R245fa, 793 kPa for R134a and 1978 kPa for R32. The reduced pressure is equal to 0.05 for R245fa, 0.2 for R134a and 0.34 for R32.
All the data have been obtained with refrigerant entering as subcooled liquid in the measuring sector. The subcooling was very low, being between 5 K for all the tests.
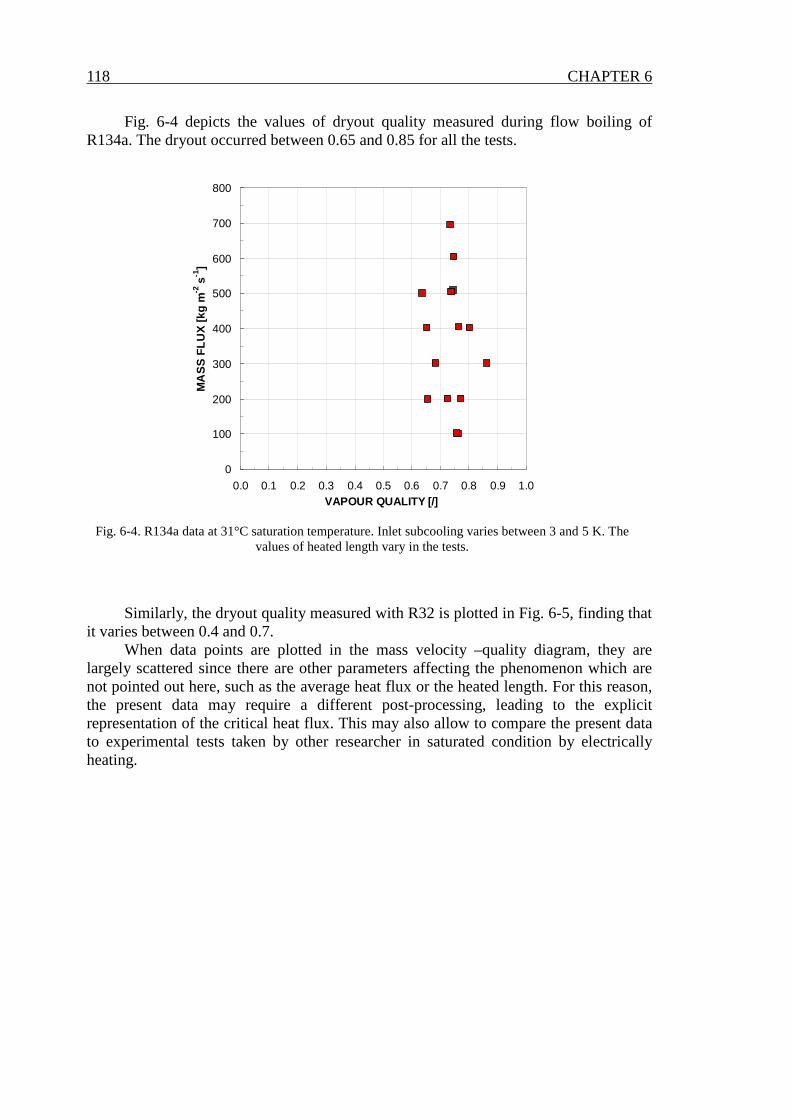
118 CHAPTER 6
Fig. 6-4 depicts the values of dryout quality measured during flow boiling of R134a. The dryout occurred between 0.65 and 0.85 for all the tests.
0
100
200
300
400
500
600
700
800
0.0 0.1 0.2 0.3 0.4 0.5 0.6 0.7 0.8 0.9 1.0VAPOUR QUALITY [/]
MA
SS
FLU
X [k
g m
-2 s
-1]
Fig. 6-4. R134a data at 31°C saturation temperature. Inlet subcooling varies between 3 and 5 K. The values of heated length vary in the tests.
Similarly, the dryout quality measured with R32 is plotted in Fig. 6-5, finding that
it varies between 0.4 and 0.7. When data points are plotted in the mass velocity –quality diagram, they are
largely scattered since there are other parameters affecting the phenomenon which are not pointed out here, such as the average heat flux or the heated length. For this reason, the present data may require a different post-processing, leading to the explicit representation of the critical heat flux. This may also allow to compare the present data to experimental tests taken by other researcher in saturated condition by electrically heating.

CHAPTER 6 119
0
100
200
300
400
500
600
700
800
900
1000
0.0 0.1 0.2 0.3 0.4 0.5 0.6 0.7 0.8 0.9 1.0DRY-OUT QUALITY [/]
MA
SS
FLU
X [k
g m
-2 s
-1]
Fig. 6-5. R32 data at 31°C saturation temperature. Inlet subcooling varies between 4 and 6 K. The values of heated length vary in the tests.
From observations taken by Garimella (2006) with R134a condensing in a 1 mm
diameter horizontal channel, no stratification can be seen down to 150 kg m-2s-1 . According to the Garimella (2006) map, the two-phase flow of R134a in a 1 mm diameter channel is a slug-plug flow at moderate values of mass velocity while it is annular type flow at higher vapour qualities, becoming annular-mist flow at high vapour quality and high mass velocity. By considering that the dryout occurs at quality above 0.5 for most of the present tests, and since the mass velocity is always above 200 kg m-
2s-1 (except for one R134a point only), one could speculate that an annular type of flow must be present in the channel before the dryout of the liquid film, with uniform liquid distribution at the wall.
The critical heat flux measured for R134a is plotted versus the mass velocity in Fig. 6-6, at constant values of heated length (97 mm and 142 mm). The critical heat flux increases with mass velocity. The higher critical heat flux is associated to the lower heated length.
The critical heat flux measured for R134a is plotted versus the heated length at constant mass velocity in Fig. 6-7. The heat flux decreases when increasing heated length. The critical heat flux values measured at 400 and 500 kg m-2s-1 mass velocity and reported here are in good agreement with the saturated critical heat flux measured in a single uniformly heated 0.8 mm diameter microchannel by Wojtan et al. (2006) during flow boiling of R134a. They tested the critical heat flux with R134a at roughly the same saturation temperature as the present data and mass velocity ranging from 400 up to 1500 kg m-2s-1.

120 CHAPTER 6
0
20
40
60
80
100
120
140
160
180
200
0 100 200 300 400 500 600 700 800MASS FLUX [kg m -2 s -1]
CR
ITIC
AL
HE
AT
FLU
X [k
W m
-2]
Lh=97 mmLh=142 mm
Fig. 6-6. Fig. R134a data: critical heat flux vs. mass velocity at constant heated length.
0
20
40
60
80
100
120
140
160
180
200
0 20 40 60 80 100 120 140 160 180 200 220 240HEATED LENGTH [mm]
CR
ITIC
AL
HE
AT
FLU
X [k
W m
-2]
G500G400G200
Fig. 6-7. R134a data: critical heat flux vs. heated length at constant mass velocity.
The critical heat flux measured during flow boiling of R32 is plotted versus
heated length at constant mass velocity in Fig. 6-8. As for R134a, the heat flux decreases when increasing heated length and increases with mass velocity.
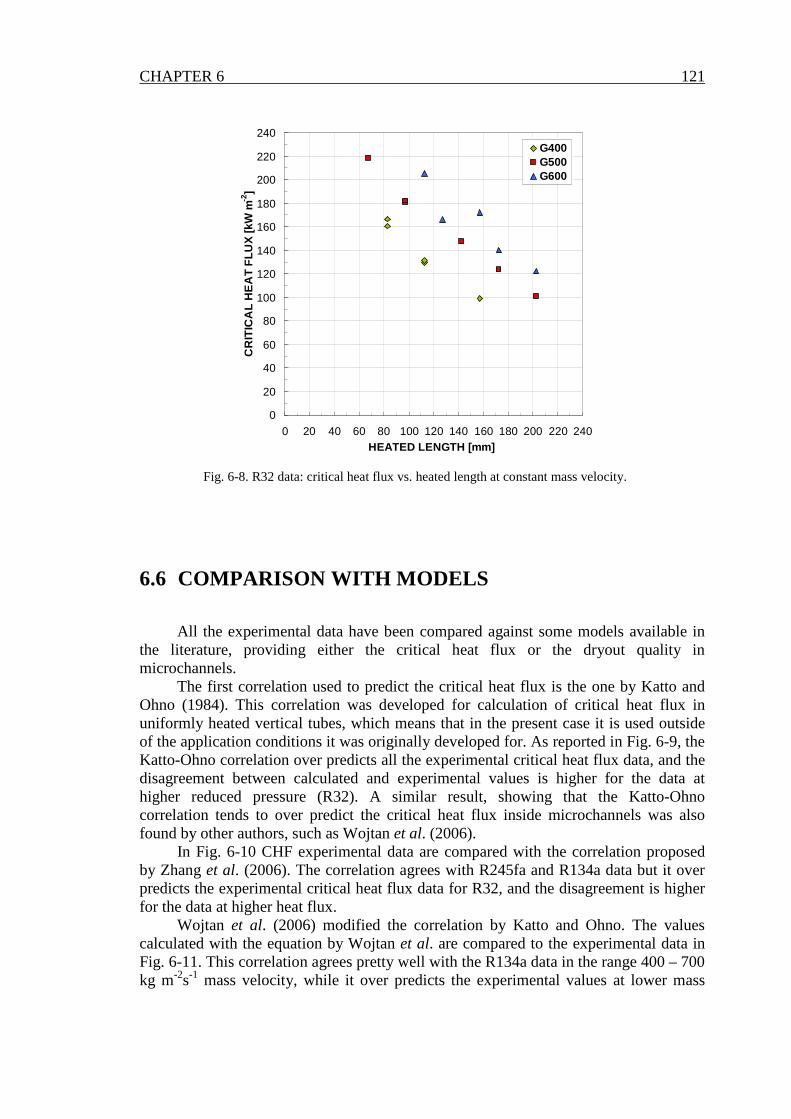
CHAPTER 6 121
0
20
40
60
80
100
120
140
160
180
200
220
240
0 20 40 60 80 100 120 140 160 180 200 220 240HEATED LENGTH [mm]
CR
ITIC
AL
HE
AT
FLU
X [k
W m
-2]
G400G500G600
Fig. 6-8. R32 data: critical heat flux vs. heated length at constant mass velocity.
6.6 COMPARISON WITH MODELS
All the experimental data have been compared against some models available in the literature, providing either the critical heat flux or the dryout quality in microchannels.
The first correlation used to predict the critical heat flux is the one by Katto and Ohno (1984). This correlation was developed for calculation of critical heat flux in uniformly heated vertical tubes, which means that in the present case it is used outside of the application conditions it was originally developed for. As reported in Fig. 6-9, the Katto-Ohno correlation over predicts all the experimental critical heat flux data, and the disagreement between calculated and experimental values is higher for the data at higher reduced pressure (R32). A similar result, showing that the Katto-Ohno correlation tends to over predict the critical heat flux inside microchannels was also found by other authors, such as Wojtan et al. (2006).
In Fig. 6-10 CHF experimental data are compared with the correlation proposed by Zhang et al. (2006). The correlation agrees with R245fa and R134a data but it over predicts the experimental critical heat flux data for R32, and the disagreement is higher for the data at higher heat flux.
Wojtan et al. (2006) modified the correlation by Katto and Ohno. The values calculated with the equation by Wojtan et al. are compared to the experimental data in Fig. 6-11. This correlation agrees pretty well with the R134a data in the range 400 – 700 kg m-2s-1 mass velocity, while it over predicts the experimental values at lower mass

122 CHAPTER 6
velocity. With regard to R32 data, most of the data points are predicted within ±20%, but on average R32 CHF is over predicted by this correlation. It should be reminded that the present correlation was obtained from data referred to low and medium pressure fluids. Besides, it was developed for uniformly heated microchannel, while in this case it is applied to a non uniformly heated channel.
The present experimental data have been predicted by the correlation by Del Col et al. (2007). This correlation provides the dryout quality but also allows to calculate the average critical heat flux by using the experimental heated length. A good estimation was found for all data points.
Finally experimental data are compared in Fig. 6-13 with the Kosar (2009) correlation. The model over predicts experimental CHF in particular for data points at high reduced pressure.
-20%
+20%
0
50
100
150
200
250
300
350
400
450
500
0 50 100 150 200 250 300 350 400 450 500EXPERIMENTAL CHF [kW m -2]
PR
ED
ICT
ED
CH
F [k
W m
-2]
R32
R134a
R245fa
0.0
0.5
1.0
1.5
2.0
2.5
3.0
0 50 100 150 200 250 300EXPERIMENTAL CHF [kW m -2]
PR
ED
ICT
ED
CH
F /
EX
PE
RIM
EN
TA
L C
HF
[/]
R32
R134a
R245fa
0.0
0.5
1.0
1.5
2.0
2.5
3.0
0 200 400 600 800 1000MASS VELOCITY [kg m -2 s -1]
PR
ED
ICT
ED
CH
F /
EX
PE
RIM
EN
TA
L C
HF
[/]
R32
R134a
R245fa
0.0
0.5
1.0
1.5
2.0
2.5
3.0
0.0 0.1 0.2 0.3 0.4 0.5REDUCED PRESSURE [/]
PR
ED
ICT
ED
CH
F /
EX
PE
RIM
EN
TA
L C
HF
[/]
R32
R134a
R245fa
Fig. 6-9. Katto and Ohno (1984) model.

CHAPTER 6 123
+20%
-20%
0
50
100
150
200
250
300
350
400
450
500
0 50 100 150 200 250 300 350 400 450 500EXPERIMENTAL CHF [kW m -2]
PR
ED
ICT
ED
CH
F [k
W m
-2]
R32
R134a
R245fa
0.0
0.5
1.0
1.5
2.0
2.5
3.0
0 50 100 150 200 250 300EXPERIMENTAL CHF [kW m -2]
PR
ED
ICT
ED
CH
F /
EX
PE
RIM
EN
TA
L C
HF
[/]
R32
R134a
R245fa
0.0
0.5
1.0
1.5
2.0
2.5
3.0
0 200 400 600 800 1000MASS VELOCITY [kg m -2 s-1]
PR
ED
ICT
ED
CH
F /
EX
PE
RIM
EN
TA
L C
HF
[/]
R32
R134a
R245fa
0.0
0.5
1.0
1.5
2.0
2.5
3.0
0.0 0.1 0.2 0.3 0.4 0.5REDUCED PRESSURE [/]
PR
ED
ICT
ED
CH
F /
EX
PE
RIM
EN
TA
L C
HF
[/]
R32
R134a
R245fa
Fig. 6-10. Zhang et al. (2006) model.

124 CHAPTER 6
-20%
+20%
0
40
80
120
160
200
240
280
320
0 40 80 120 160 200 240 280 320EXPERIMENTAL CHF [kW m -2]
PR
ED
ICT
ED
CH
F [k
W m
-2]
R32
R134a
R245fa
0.0
0.5
1.0
1.5
2.0
2.5
3.0
0 50 100 150 200 250 300EXPERIMENTAL CHF [kW m -2]
PR
ED
ICT
ED
CH
F /
EX
PE
RIM
EN
TA
L C
HF
[/]
R32
R134a
R245fa
0.0
0.5
1.0
1.5
2.0
2.5
3.0
0 200 400 600 800 1000MASS VELOCITY [kg m -2 s -1]
PR
ED
ICT
ED
CH
F /
EX
PE
RIM
EN
TA
L C
HF
[/]
R32
R134a
R245fa
0.0
0.5
1.0
1.5
2.0
2.5
3.0
0.0 0.1 0.2 0.3 0.4 0.5REDUCED PRESSURE [/]
PR
ED
ICT
ED
CH
F /
EX
PE
RIM
EN
TA
L C
HF
[/]
R32
R134a
R245fa
Fig. 6-11. Wojtan et al. (2006) model.

CHAPTER 6 125
-20%
+20%
0
50
100
150
200
250
300
350
400
450
500
0 50 100 150 200 250 300 350 400 450 500EXPERIMENTAL CHF [kW m -2]
PR
ED
ICT
ED
CH
F [k
W m
-2]
R32
R134a
R245fa
0.0
0.5
1.0
1.5
2.0
2.5
3.0
0 50 100 150 200 250 300EXPERIMENTAL CHF [kW m -2]
PR
ED
ICT
ED
CH
F /
EX
PE
RIM
EN
TA
L C
HF
[/]
R32
R134a
R245fa
0.0
0.5
1.0
1.5
2.0
2.5
3.0
0 200 400 600 800 1000MASS VELOCITY [kg m -2 s-1]
PR
ED
ICT
ED
CH
F /
EX
PE
RIM
EN
TA
L C
HF
[/]
R32
R134a
R245fa
0.0
0.5
1.0
1.5
2.0
2.5
3.0
0.0 0.1 0.2 0.3 0.4 0.5REDUCED PRESSURE [/]
PR
ED
ICT
ED
CH
F /
EX
PE
RIM
EN
TA
L C
HF
[/]
R32
R134a
R245fa
Fig. 6-12. Del Col et al. (2007) model.

126 CHAPTER 6
-20%
+20%
0
50
100
150
200
250
300
350
400
450
500
0 50 100 150 200 250 300 350 400 450 500EXPERIMENTAL CHF [kW m -2]
PR
ED
ICT
ED
CH
F [k
W m
-2]
R32
R134a
R245fa
0.0
0.5
1.0
1.5
2.0
2.5
3.0
0 50 100 150 200 250 300EXPERIMENTAL CHF [kW m -2]
PR
ED
ICT
ED
CH
F /
EX
PE
RIM
EN
TA
L C
HF
[/]
R32
R134a
R245fa
0.0
0.5
1.0
1.5
2.0
2.5
3.0
0 200 400 600 800 1000MASS VELOCITY [kg m -2 s-1]
PR
ED
ICT
ED
CH
F /
EX
PE
RIM
EN
TA
L C
HF
[/]
R32
R134a
R245fa
0.0
0.5
1.0
1.5
2.0
2.5
3.0
0.0 0.1 0.2 0.3 0.4 0.5REDUCED PRESSURE [/]
PR
ED
ICT
ED
CH
F /
EX
PE
RIM
EN
TA
L C
HF
[/]
R32
R134a
R245fa
Fig. 6-13. Kosar (2009) model.

127
Chapter 7.
Heat transfer and pressure drop during
R134a single-phase flow inside the square
minichannel
7.1 Introduction
In the recent years numerous single-phase experiments have been carried out in order to evaluate the accuracy of conventional theory in micro-scale. These works demonstrate that classical correlations can predict frictional factor in laminar flow without revealing any influence of the surface roughness; beyond this, in the fully development turbulent regime, an agreement between experimental data and Blasius correlation was found for smooth tubes.
Several investigations on single-phase flow in minichannels have demonstrated that the underlying mechanism in heat transfer is the same observed in conventional channels.
From this point of view, single-phase pressure drop has been measured to characterize the test channel and liquid-phase heat transfer tests have been performed to check the experimental procedure.
The friction factor has been measured during adiabatic flow of R134a in subcooled liquid state and in superheated vapour state. The local heat transfer coefficients have also been measured during liquid-phase flow of R134afa in heating and cooling mode.
7.2 Pressure drop during R134a single-phase flow
7.2.1 Friction factor for laminar flow
Flow is laminar when the velocities are free of macroscopic fluctuations at any point of the flow field. For steady-state laminar flow, all velocities at a stationary point in the flow field remain constant with respect to time, but velocities may be different at different points.

128 CHAPTER 7
Laminar flow in a two-dimensional stationary straight duct is designed as hydrodynamically fully developed when the fluid velocity distribution at a cross section is independent of the axial distance x:
( , )u u y z= (7-1)
, 0v w= (7-2)
In Eq. (7-1) u is the fluid axial velocity, in x direction, y and z are Cartesian
coordinates across the flow cross section; in Eq. (7-2) v is the fluid velocity component in y direction and w is the fluid velocity component in z direction.
The fluid particles move in definite paths called streamlines, and there are no components of fluid velocity normal to the duct axis.
In a fully developed laminar flow, the fluid appears to move by sliding laminae of infinitesimal thickness relative to adjacent layers. Fully developed laminar flow persists up to Re<2300 for a duct length greater then the hydrodynamic entry length.
Consider a fully developed, steady-state laminar flow in a two-dimensional stationary duct with the boundary Γ. The fluid is idealized as liquid or low-speed gas with the flow properties ρ, µ, and cp, constant (independent of fluid temperature). The applicable momentum equation is:
2 22
12 2
1u u dpu c
y z dxµ∂ ∂∇ = + = =∂ ∂
(7-3)
0 onu = Γ (7-4)
where c1 is defined as a pressure drop parameter.
The pressure drop in fully developed flow is caused by the wall shear; the axially local wall shear stress for a Newtonian fluid flowing through the duct is expressed as the average wall shear stress with respect to the perimeter of the duct:
,x
w m
u
nτ µ ∂ = − ∂
(7-5)
The flow length average wall shear stress is then defined as:
0
1 x
m xdxx
τ τ= ∫ (7-6)
The fluid mean axial velocity is defined as the integral average axial velocity with
respect to the flow area A:

CHAPTER 7 129
1m A
u udAA
= ∫ (7-7)
The ratio of wall shear stress τ to the kinetic energy per unit volume is defined as
the Fanning friction factor. The peripheral average axially local Fanning friction factor in then expressed as:
2 / 2x
xm
fu
τρ
= (7-8)
For the case of fully developed flow through a duct, the velocity profile is
invariant across any flow cross section. Consequently, the wall shear stress does not change axially, and the average friction factor is the same as the local friction factor. In this case, the constant-density pressure drop across two flow sections, separated by a distance L, takes the following form:
2
4
/ 2m h
p Lf
u dρ∆ = (7-9)
In the fully developed region, Eq. (7-9) may be rearranged using the definition of
Re and using the constant c1 from Eq. (7-3), so that
21Re2
h
m
c df
u= − (7-10)
Also, based on the solution of the differential equation (7-3), it can be shown that
Re ff K= (7-11)
where Kf is a constant value dependent on the geometry of the channel cross section.
Steady state fully developed laminar flow of an incompressible fluid through a stationary circular duct is referred to as Hagen-Poiseuille flow. For a circular tube the friction factor-Reynolds number product is:
Re 16f = (7-12)
In the literature the friction factor-Reynolds product has been calculated for
different type geometry. Shah and London (1978) reported analytical expressions and numerical values of Kf for rectangular ducts, concentric annular ducts, triangular ducts and other geometries. In particular for a square section channel they found the following value of the friction factor-Reynolds product:

130 CHAPTER 7
Re 14.227f = (7-13)
The microchannel of the present study, as reported in Chapter 1, has a square
cross section with side length a=1.18 mm. Each corner has a curvature radius R equal to 0.15 mm, which leads to a hydraulic diameter dh equal to 1.23 mm. In the literature, a Kf expression for a square with rounded corners has not been found. For this reason, the velocity field inside the square microchannel has been calculated resolving numerically the differential equation (7-3) with an arbitrary value of the constant c1 and boundary conditions given by Eq. (7-4). The partial differential equation (7-3) was resolved using finite elements method with a mesh composed by 335872 triangles and 168577 nodes. The resulting velocity field is reported in Fig. 7-1. The fluid mean axial velocity um has been calculated by Eq. (7-7) and finally the friction factor-Reynolds product has been obtained by Eq. (7-10):
Re 15.334f = (7-14)
With the proposal to test the numerical procedure, the friction factor-Reynolds product was also calculated for a circular channel and for a square channel. The numerical results perfectly agree with Hagen-Poiseuille equation (7-12) for the circular channel; in the case of the square channel Kf is equal to 14.227 as reported in Shah and London (1978).
Fig. 7-1. Velocity field inside square minichannel.
7.2.2 Friction factor for turbulent flow
Friction factor during turbulent flow, for smooth circular ducts, can be calculated following classical formula presented by Blasius in 1913; Blasius formula is applicable for 4000<Re<100000 covering a portion of the transition flow regime:

CHAPTER 7 131
0.25
0.079
Ref = (7-15)
The fully developed turbulent friction factor for rectangular ducts can be
determined from the circular duct formulas by introducing a correction factor. Bhatti and Shah (1987) performed calculations using the correlations for circular channels. On comparing these results with the experimental measurements for rectangular ducts in the range 5000<Re<107, they arrived at the following correlation for rectangular ducts:
( )*1.0875 0.1125 cf fα= − (7-16)
* /b aα = (7-17)
where a and b are the lengths of the two sides of a rectangular duct with a>b and fc is the friction factor for circular duct given by Blasius correlation (7-15).
7.2.3 Experimental results
The friction factor has been measured during adiabatic flow of R134a in subcooled liquid state and in superheated vapour state. The distance L between pressure ports is equal to 0.249 m. Since in the turbulent region it depends on the surface roughness, the internal surface roughness of the copper channel has been measured with the digital surface roughness machine ZEISS-TSK Surfcom 1400A. The measurements have been performed at different positions. The mean roughness Ra, as defined by the ISO 4287:1997, ranges between 0.80 µm and 1.32 µm, with a mean value equal to 1.02 µm.
The experimental friction factor has been obtained from pressure drop and mass flow rate measurements as reported in Eq. (7-18); fluid properties have been calculated using NIST Refprop Version 8.0 (2007).
22hd p
fG L
ρ ⋅ ⋅∆=⋅ ⋅
(7-18)
4 ih
i
Ad
p
⋅= (7-19)
( )2 2 4iA a R π= − − (7-20)
( )4 8 2ip L R π= ⋅ − − ⋅ (7-21)
In Fig. 7-2. the measured friction factor is reported as a function of Reynolds
number. Two different symbols are used in order to distinguish experimental points measured during vapour phase and liquid phase flow of R134a. In the laminar region experimental data are in good agreement with the correlation (7-14); in the turbulent
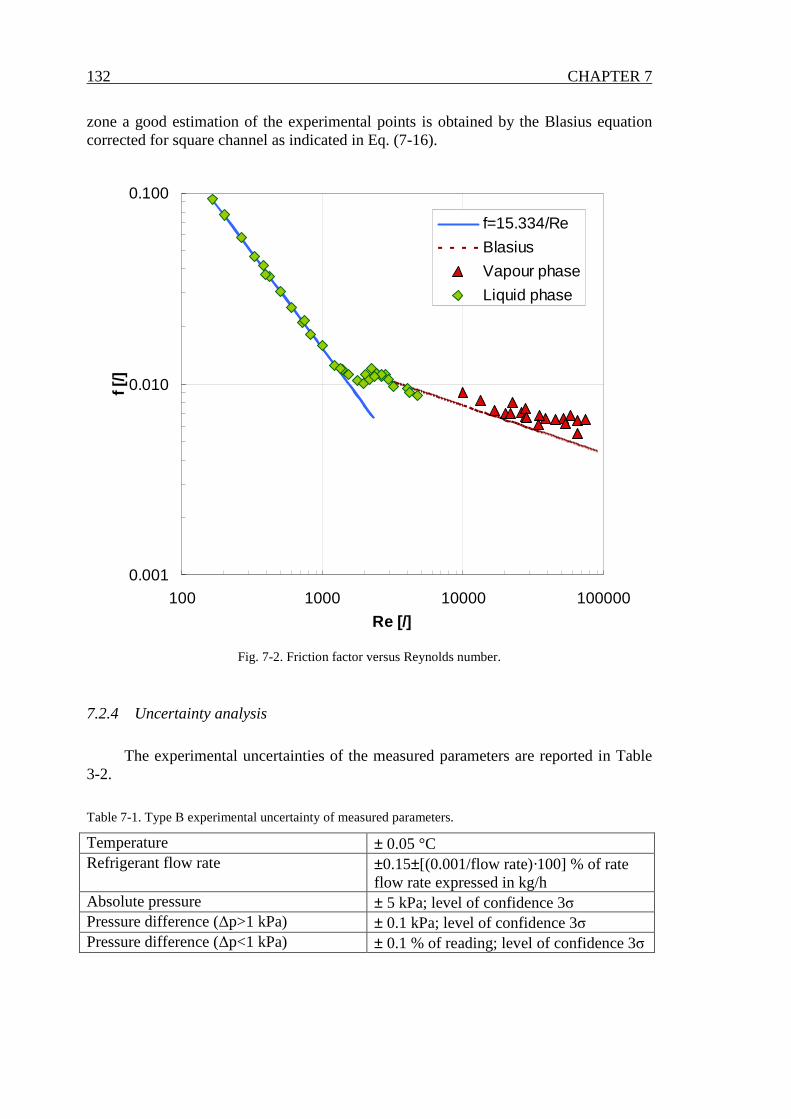
132 CHAPTER 7
zone a good estimation of the experimental points is obtained by the Blasius equation corrected for square channel as indicated in Eq. (7-16).
0.001
0.010
0.100
100 1000 10000 100000
Re [/]
f [/]
f=15.334/Re
Blasius
Vapour phase
Liquid phase
Fig. 7-2. Friction factor versus Reynolds number.
7.2.4 Uncertainty analysis
The experimental uncertainties of the measured parameters are reported in Table 3-2.
Table 7-1. Type B experimental uncertainty of measured parameters.
Temperature ± 0.05 °C Refrigerant flow rate ±0.15±[(0.001/flow rate)·100] % of rate
flow rate expressed in kg/h Absolute pressure ± 5 kPa; level of confidence 3σ Pressure difference (∆p>1 kPa) ± 0.1 kPa; level of confidence 3σ Pressure difference (∆p<1 kPa) ± 0.1 % of reading; level of confidence 3σ
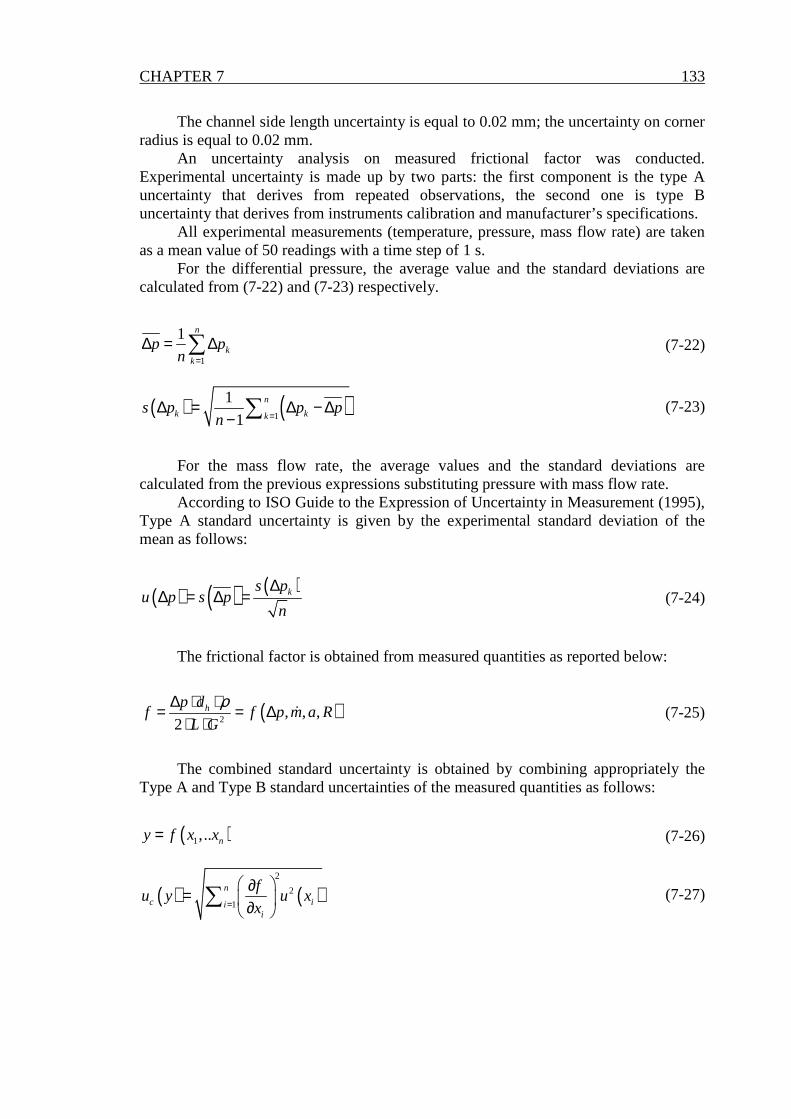
CHAPTER 7 133
The channel side length uncertainty is equal to 0.02 mm; the uncertainty on corner radius is equal to 0.02 mm.
An uncertainty analysis on measured frictional factor was conducted. Experimental uncertainty is made up by two parts: the first component is the type A uncertainty that derives from repeated observations, the second one is type B uncertainty that derives from instruments calibration and manufacturer’s specifications.
All experimental measurements (temperature, pressure, mass flow rate) are taken as a mean value of 50 readings with a time step of 1 s.
For the differential pressure, the average value and the standard deviations are calculated from (7-22) and (7-23) respectively.
1
1 n
kk
p pn =
∆ = ∆∑ (7-22)
( ) ( )1
1
1
n
k kks p p p
n =∆ = ∆ − ∆
− ∑ (7-23)
For the mass flow rate, the average values and the standard deviations are
calculated from the previous expressions substituting pressure with mass flow rate. According to ISO Guide to the Expression of Uncertainty in Measurement (1995),
Type A standard uncertainty is given by the experimental standard deviation of the mean as follows:
( ) ( ) ( )ks pu p s p
n
∆∆ = ∆ = (7-24)
The frictional factor is obtained from measured quantities as reported below:
( )2, , ,
2hp d
f f p m a RL G
ρ∆ ⋅ ⋅= = ∆⋅ ⋅
ɺ (7-25)
The combined standard uncertainty is obtained by combining appropriately the
Type A and Type B standard uncertainties of the measured quantities as follows:
( )1,.. ny f x x= (7-26)
( ) ( )2
2
1
n
c iii
fu y u x
x=
∂= ∂ ∑ (7-27)
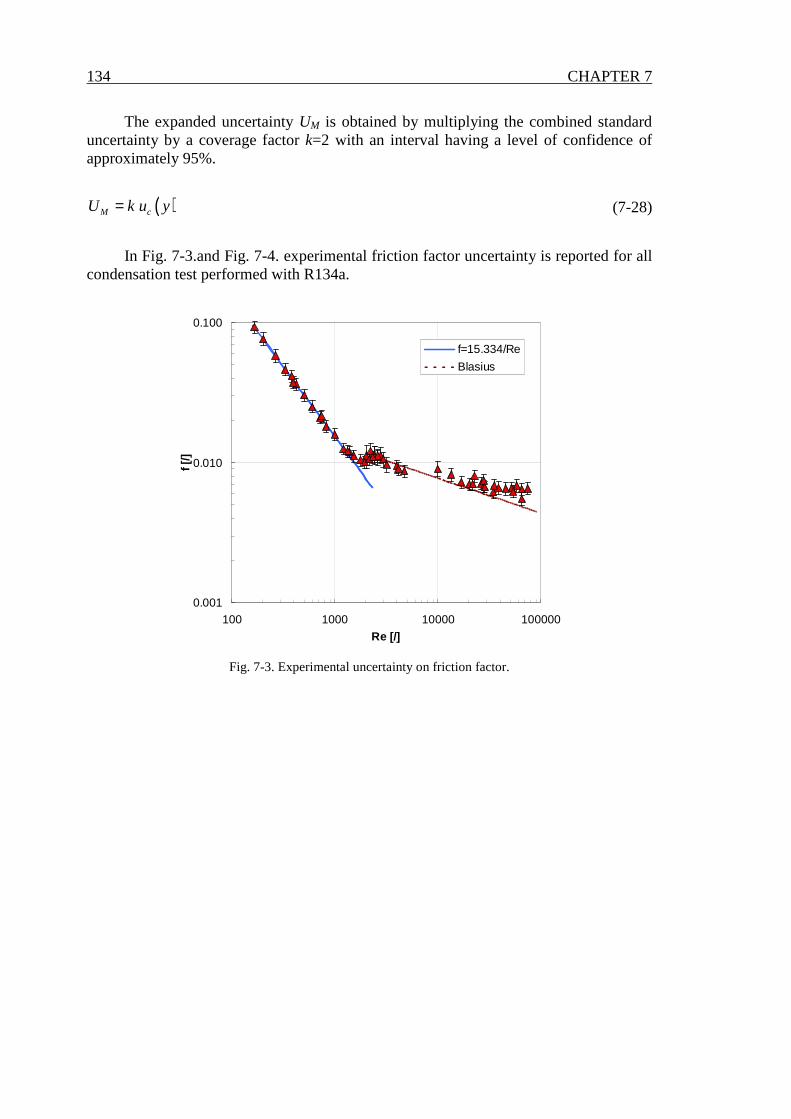
134 CHAPTER 7
The expanded uncertainty UM is obtained by multiplying the combined standard uncertainty by a coverage factor k=2 with an interval having a level of confidence of approximately 95%.
( )M cU k u y= (7-28)
In Fig. 7-3.and Fig. 7-4. experimental friction factor uncertainty is reported for all
condensation test performed with R134a.
0.001
0.010
0.100
100 1000 10000 100000
Re [/]
f [/]
f=15.334/Re
Blasius
Fig. 7-3. Experimental uncertainty on friction factor.

CHAPTER 7 135
0.001
0.010
0.100
100 1000 10000
Re [/]
f [/]
f=15.334/Re
Fig. 7-4. Experimental uncertainty on friction factor: laminar region.

136 CHAPTER 7
7.3 Heat transfer coefficient during R134a liquid-phase flow
Wall temperatures, water temperatures and refrigerant temperatures during cooling of R134a are shown in Fig. 7-5, Fig. 7-7, and Fig. 7-9 as function of the axial position along the channel, for a refrigerant mass velocity ranging from 500 to 800 kg m-2 s-1. Similar graphs are reported in Fig. 7-11, Fig. 7-13, and Fig. 7-15 for liquid-phase heat transfer test performed in heating mode.
In these test runs, the refrigerant enters the measuring sector in the thermodynamic state of subcooled liquid. R134a heating or cooling is obtained by heat transfer with the secondary fluid (water) that flows in counter-flow outside the minichannel.
Local liquid-phase heat transfer coefficient inside the minichannel is determined as follows:
( ) ( )( ) ( )
'
r w
q zHTC z
T z T z=
− (7-29)
An exponential function has been adopted for interpolation of water temperatures.
The fitting curve was calculated with minimum square method.
( ) 1 2z
wT z C e Cγ− ⋅= ⋅ + (7-30)
The slope of the water temperature profile measured along the channel is used to
calculate the local heat flux:
,
d ( )1'( )
dw
w p wi
T zq z m c
p z= − ⋅ ⋅ɺ (7-31)
The refrigerant temperature profile was determined from the temperature of
R134a measured at the channel inlet and from the thermal balance on the water side.
( ) ( ) ( ) ,,
,
0 w p wr r in w w
r p r
m cT z T T z T z
m c
⋅= − = − ⋅ ⋅
ɺ
ɺ (7-32)
A comparison between the measured heat transfer coefficient and correlations by
Gnielinski reported in VDI (1993) and VDI (2002) is illustrated in Fig. 7-6, Fig. 7-8, Fig. 7-10, Fig. 7-12, Fig. 7-14, and Fig. 7-16. The Reynolds number was varied from 3200 to 5100; the agreement between experimental data and calculated values is very satisfactory at all mass flow rates, although the temperature difference between refrigerant and wall is very low.

CHAPTER 7 137
16
18
20
22
24
26
28
30
32
34
36
38
0 40 80 120 160 200 240POSITION [mm]
TE
MP
ER
AT
UR
E [°
C]
R134aRef IN/OUTWallWaterWater IN/OUT
Fig. 7-5. Temperature profiles during cooling of R134a; the refrigerant flows in the minichannel as subcooled liquid with a mass velocity G=790 kg m-2 s-1.
0
1000
2000
3000
0 40 80 120 160 200 240POSITION [mm]
HT
C [W
m-2
K-1
]
EXPERIMENTAL HTCHTC Gnielinski 1993HTC Gnielinski 2002
Fig. 7-6. Experimental local heat transfer coefficient during liquid flow at G=790 kg m-2 s-1and Re=5100 compared to correlation for forced convective heat transfer.
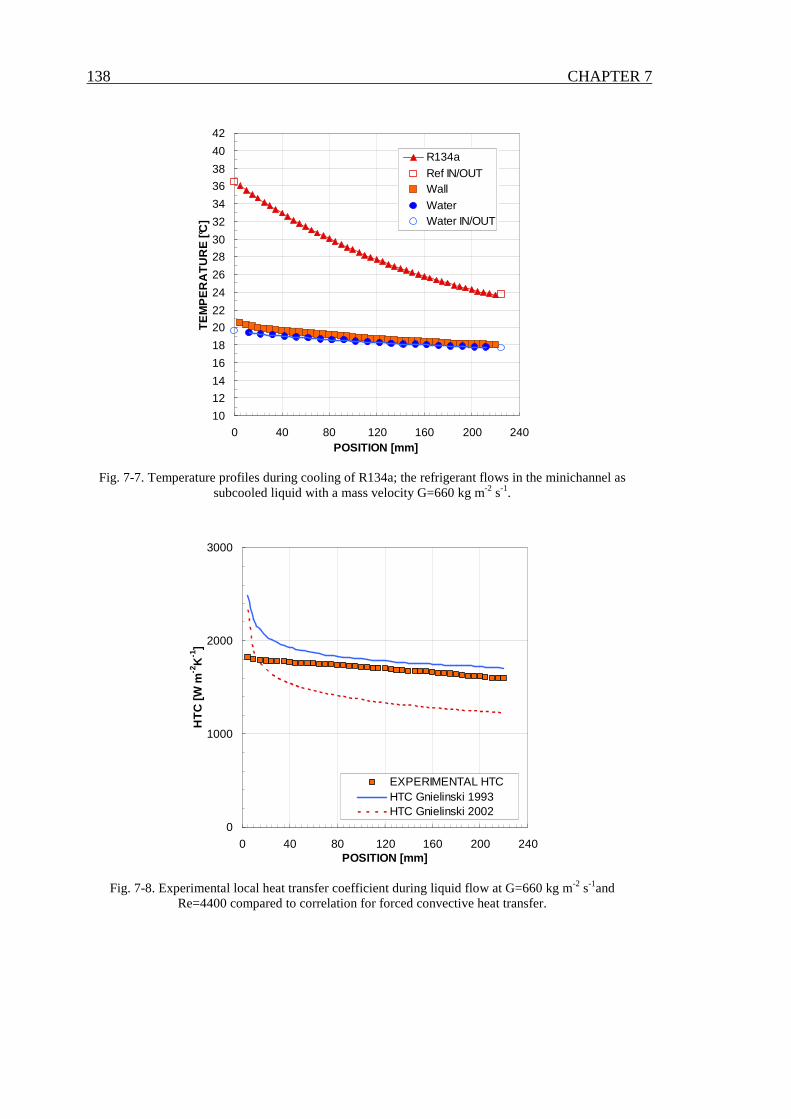
138 CHAPTER 7
10
12
14
16
18
20
22
24
26
28
30
32
34
36
38
40
42
0 40 80 120 160 200 240POSITION [mm]
TE
MP
ER
AT
UR
E [°
C]
R134aRef IN/OUTWallWaterWater IN/OUT
Fig. 7-7. Temperature profiles during cooling of R134a; the refrigerant flows in the minichannel as subcooled liquid with a mass velocity G=660 kg m-2 s-1.
0
1000
2000
3000
0 40 80 120 160 200 240POSITION [mm]
HT
C [W
m-2
K-1
]
EXPERIMENTAL HTCHTC Gnielinski 1993HTC Gnielinski 2002
Fig. 7-8. Experimental local heat transfer coefficient during liquid flow at G=660 kg m-2 s-1and Re=4400 compared to correlation for forced convective heat transfer.

CHAPTER 7 139
10
12
14
16
18
20
22
24
26
28
30
32
34
36
38
40
42
0 40 80 120 160 200 240POSITION [mm]
TE
MP
ER
AT
UR
E [°
C]
R134aRef IN/OUTWallWaterWater IN/OUT
Fig. 7-9. Temperature profiles during cooling of R134a; the refrigerant flows in the minichannel as subcooled liquid with a mass velocity G=520 kg m-2 s-1.
0
1000
2000
3000
0 40 80 120 160 200 240POSITION [mm]
HT
C [W
m-2
K-1
]
EXPERIMENTAL HTCHTC Gnielinski 1993HTC Gnielinski 2002
Fig. 7-10. Experimental local heat transfer coefficient during liquid flow at G=520 kg m-2 s-1and Re=3400 compared to correlation for forced convective heat transfer.
140 CHAPTER 7
10
12
14
16
18
20
22
24
26
28
30
32
34
36
38
40
42
0 40 80 120 160 200 240POSITION [mm]
TE
MP
ER
AT
UR
E [°
C]
WallWaterWater IN/OUTR134aRef IN/OUT
Fig. 7-11. Temperature profiles during heating of R134a; the refrigerant flows in the minichannel as subcooled liquid with a mass velocity G=790 kg m-2 s-1.
0
1000
2000
3000
0 40 80 120 160 200 240POSITION [mm]
HT
C [W
m-2
K-1
]
EXPERIMENTAL HTCHTC Gnielinski 1993HTC Gnielinski 2002
Fig. 7-12. Experimental local heat transfer coefficient during liquid flow at G=790 kg m-2 s-1and Re=4700 compared to correlation for forced convective heat transfer.

CHAPTER 7 141
10
12
14
16
18
20
22
24
26
28
30
32
34
36
38
40
42
0 40 80 120 160 200 240POSITION [mm]
TE
MP
ER
AT
UR
E [°
C]
WallWaterRef IN/OUTWater IN/OUTR134a
Fig. 7-13. Temperature profiles during heating of R134a; the refrigerant flows in the minichannel as subcooled liquid with a mass velocity G=660 kg m-2 s-1.
0
1000
2000
3000
0 40 80 120 160 200 240POSITION [mm]
HT
C [W
m-2
K-1
]
EXPERIMENTAL HTCHTC Gnielinski 1993HTC Gnielinski 2002
Fig. 7-14. Experimental local heat transfer coefficient during liquid flow at G=660 kg m-2 s-1and Re=4000 compared to correlation for forced convective heat transfer.
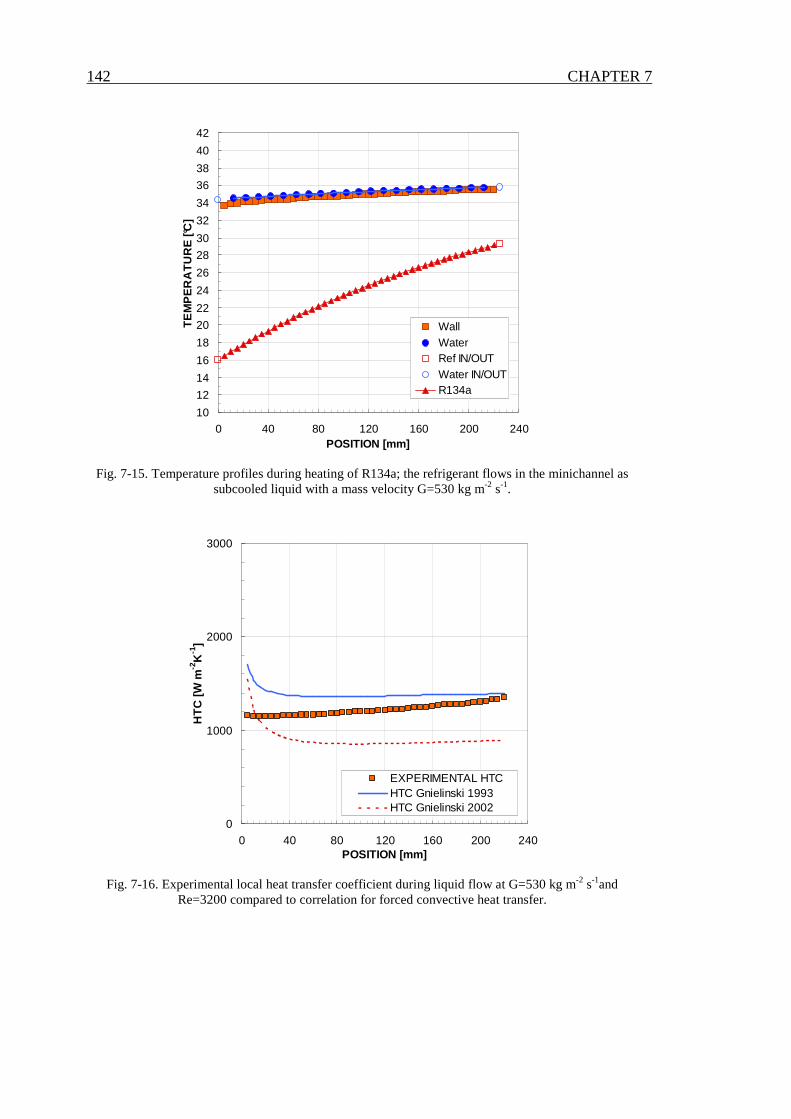
142 CHAPTER 7
10
12
14
16
18
20
22
24
26
28
30
32
34
36
38
40
42
0 40 80 120 160 200 240POSITION [mm]
TE
MP
ER
AT
UR
E [°
C]
WallWaterRef IN/OUTWater IN/OUTR134a
Fig. 7-15. Temperature profiles during heating of R134a; the refrigerant flows in the minichannel as subcooled liquid with a mass velocity G=530 kg m-2 s-1.
0
1000
2000
3000
0 40 80 120 160 200 240POSITION [mm]
HT
C [W
m-2
K-1
]
EXPERIMENTAL HTCHTC Gnielinski 1993HTC Gnielinski 2002
Fig. 7-16. Experimental local heat transfer coefficient during liquid flow at G=530 kg m-2 s-1and Re=3200 compared to correlation for forced convective heat transfer.

143
Chapter 8.
Condensation inside the square minichannel
8.1 Introduction
This work is aimed at presenting experimental heat transfer coefficients measured during condensation inside a single square cross section minichannel, having a 1.18 mm side length. The experimental heat transfer coefficients are compared to the ones previously obtained in the circular minitube.
This subject is particularly interesting since most of the mini and microchannels used in practical applications have non circular cross sections.
The test section used in the present work is obtained from a thick wall copper tube which is machined to draw a complex passage for the water; its geometry has been studied with the aim of increasing the external heat transfer area and thus decreasing the external heat transfer resistance. This experimental technique allows to measure directly the temperature in the tube wall and in the water channel. The heat flux is determined from the temperature profile of the coolant in the measuring sector. The wall temperature is measured by means of thermocouples embedded in the copper tube, while the saturation temperature is obtained from the saturation pressure measured at the inlet and outlet of the measuring sector. On the whole, more than sixty thermocouples have been placed in the 225 mm long measuring section.
Tests have been performed with R134a at 40°C saturation temperature, at mass velocities ranging between 70 and 800 kg m-2 s-1. As compared to the heat transfer coefficients measured in a circular minichannel, in the square minichannel it was found a heat transfer enhancement at the lowest values of mass velocity; this must be due to the effect of the surface tension. No heat transfer coefficient increase has been found at the highest values of the mass velocity where condensation is shear stress dominated.
Some numerical studies have been presented in the literature reporting that the channel shape may have great influence on the heat transfer coefficient during condensation inside minichannels (Wang and Rose, 2005). But, so far, to the best of our knowledge, no attempt to measure the local heat transfer coefficient in a square or rectangular cross section single minichannel has been published.
During condensation inside minichannels, in fact, the surface tension is supposed to enhance the heat transfer in the presence of corners as compared to the case of circular channels, because the liquid is pulled towards the corners leading to a thinner liquid film on the flat sides and therefore to a lower thermal resistance on these parts of the channel. This may provide a higher average heat transfer coefficient on the
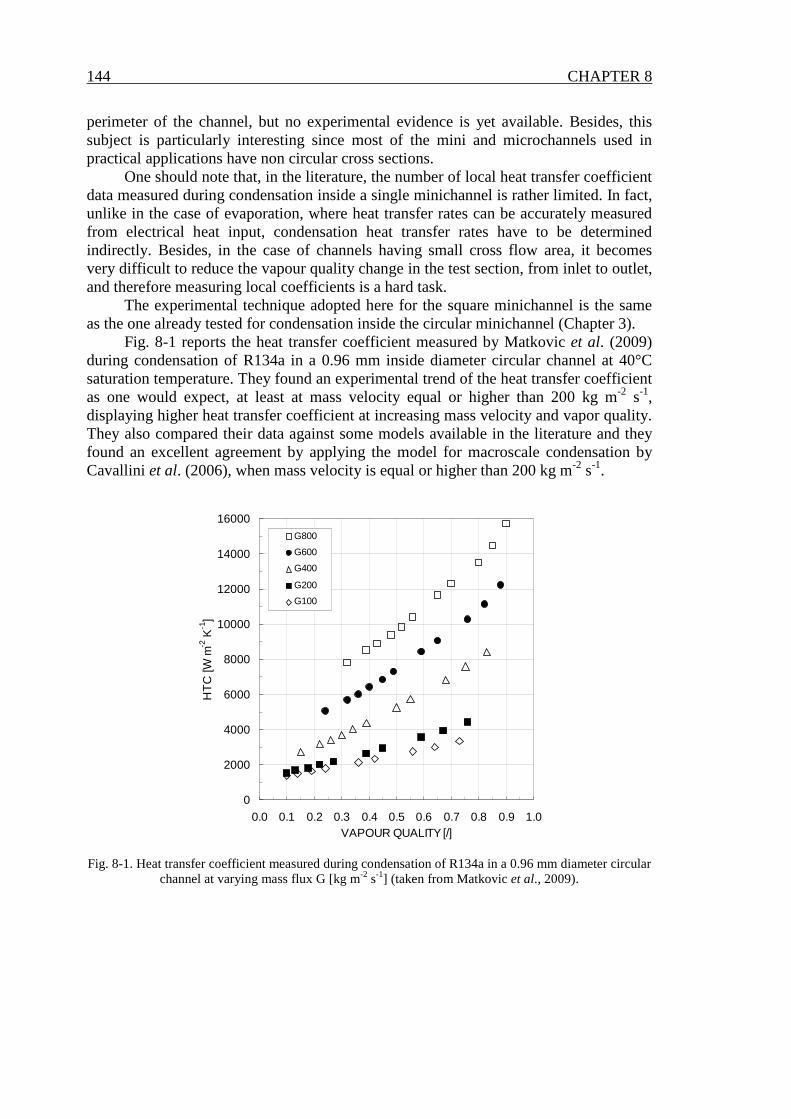
144 CHAPTER 8
perimeter of the channel, but no experimental evidence is yet available. Besides, this subject is particularly interesting since most of the mini and microchannels used in practical applications have non circular cross sections.
One should note that, in the literature, the number of local heat transfer coefficient data measured during condensation inside a single minichannel is rather limited. In fact, unlike in the case of evaporation, where heat transfer rates can be accurately measured from electrical heat input, condensation heat transfer rates have to be determined indirectly. Besides, in the case of channels having small cross flow area, it becomes very difficult to reduce the vapour quality change in the test section, from inlet to outlet, and therefore measuring local coefficients is a hard task.
The experimental technique adopted here for the square minichannel is the same as the one already tested for condensation inside the circular minichannel (Chapter 3).
Fig. 8-1 reports the heat transfer coefficient measured by Matkovic et al. (2009) during condensation of R134a in a 0.96 mm inside diameter circular channel at 40°C saturation temperature. They found an experimental trend of the heat transfer coefficient as one would expect, at least at mass velocity equal or higher than 200 kg m-2 s-1, displaying higher heat transfer coefficient at increasing mass velocity and vapor quality. They also compared their data against some models available in the literature and they found an excellent agreement by applying the model for macroscale condensation by Cavallini et al. (2006), when mass velocity is equal or higher than 200 kg m-2 s-1.
0
2000
4000
6000
8000
10000
12000
14000
16000
0.0 0.1 0.2 0.3 0.4 0.5 0.6 0.7 0.8 0.9 1.0VAPOUR QUALITY [/]
HT
C [W
m-2
K-1
]
G800
G600
G400
G200
G100
Fig. 8-1. Heat transfer coefficient measured during condensation of R134a in a 0.96 mm diameter circular channel at varying mass flux G [kg m-2 s-1] (taken from Matkovic et al., 2009).

CHAPTER 8 145
8.2 Experimental apparatus
The test rig used for the experimental tests is the same utilized during condensation inside circular minichannel and described in Chapter 3. For a major clarity schematic representation of the experimental apparatus is depicted in Fig. 8-2. It consists of the primary (refrigerant) loop and of two auxiliary loops: the cooling water loop and the heating water loop. The subcooled refrigerant from the post-condenser is sent through a mechanical filter and a dehumidifier into an independently controlled gear pump, which is magnetically coupled to a variable speed electric motor.
The fluid is pumped through a Coriolis-effect mass flow meter into the evaporator where it is vaporised and superheated in a tube-in-tube heat exchanger. The superheated vapour enters the square minichannel test section, which is made of two counter-flow heat exchangers: the first one (desuperheater) is used to achieve saturation conditions (desired inlet vapour quality), the second one is the actual measuring section.
Two refrigerated thermal baths are used in the tests: the first one provides the water entering the measuring sector and the pre-sector at a desired temperature, the other one provides the coolant for the postcondenser.
The fluid pressure upstream and downstream of the test tube is measured by means of two digital strain gauge pressure (absolute and differential) transducers.
The square minichannel is obtained from a copper rod and has a square cross section with side length a=1.18 mm. Each corner has a curvature radius R equal to 0.15 mm, which leads to a hydraulic diameter dh equal to 1.23 mm.
Fig. 8-2. Experimental test rig
(DESUP.=desuperheater, MF=mechanical filter, HF=drier, PV=pressure vessel, CFM=Coriolis-effect mass flow meter, P=pressure transducer, T=temperature transducer, DP=differential pressure transducer).

146 CHAPTER 8
8.3 Data reduction
Fig. 8-3 displays saturation, wall and water temperatures for a test run at 400 kg m-2 s-1 mass velocity with R134a. The same graph reports the saturation temperature obtained from the pressure transducers at inlet and outlet and the temperature directly measured in the adiabatic walls upstream and downstream of the condensation length. The slope of the water temperature profile measured along the channel is used to calculate the local heat flux:
,
d ( )1'( )
dw
w p wi
T zq z m c
p z= − ⋅ ⋅ɺ (8-1)
( )4 8 2ip a R π= − − (8-2)
where z is the axial coordinate along the tube oriented with the refrigerant flow,
dTw/dz is the derivative of the polynomial equation interpolating the water temperature along z, and pi is the internal perimeter of square minichannel. Similarly, it is possible to calculate the derivative of the equation interpolating the wall temperature, which provides information about the axial conduction along the channel.
The local heat transfer coefficient inside the minichannel can be obtained as the ratio of heat flux to saturation minus wall temperature difference:
( ) ( )( ) ( )
'
sat wall
q zHTC z
T z T z=
− (8-3)
It should be pointed out here that the saturation temperature is measured only at
the inlet and outlet of the measuring sector, and it is obtained from the saturation pressure measurements. Since the difference of saturation minus wall temperature is pretty large for typical test conditions and the saturation temperature drop due to pressure drop is rather small, for most of the test conditions the saturation temperature along the channel can be derived as a linear trend between inlet and outlet without making a significant error on the HTC.
As a matter of fact, the vapour quality changes during the condensation process and therefore the pressure gradient varies along the channel. Therefore, it would be desirable to plot a saturation temperature curve by implementing a correlation of the two phase pressure gradient and by matching the experimental total pressure drop (as reported in Chapters 3 and 5 for condensation and vaporization test inside the circular minichannel). With reference to the present tests, it was determined that the effect of the saturation temperature curve on the heat transfer coefficient is negligible as compared to the overall experimental uncertainty. However the present data are reduced by implementing the correlation of Cavallini et al. (2009) for the two phase pressure gradient. The heat flow rate transferred to the secondary fluid up to a certain position z is obtained by integrating the local heat flux q’ from 0 (refrigerant inlet) to z:

CHAPTER 8 147
0
( ) '( )dz
iq z p q z z= ⋅ ∫ (8-4)
The local thermodynamic vapour quality at any location z can be found from the
heat flow rate, the mass flow rate, the latent heat and the inlet vapour quality:
0
'( )d
( )
z
i
inr LG
p q z z
x z xm h
⋅= −
⋅
∫ɺ
(8-5)
The vapour quality at the inlet to the measuring sector xin is obtained from the
energy balance on the coolant side of the desuperheater (pre-sector). In fact, the specific enthalpy of the superheated refrigerant at the inlet to the pre-sector is known from the local pressure and temperature. The enthalpy variation in the desuperheater is obtained from the heat flow rate transferred in the desuperheater and, in turn, this enthalpy change is used to calculate the vapour quality at the inlet to the measuring sector.
18
20
22
24
26
28
30
32
34
36
38
40
42
0 40 80 120 160 200 240POSITION [mm]
TE
MP
ER
AT
UR
E [°
C]
Saturation (p)Ref IN/OUTWallWaterWater IN/OUT
Fig. 8-3. Condensation in square channel: test run during condensation of R134a at 400 kg m-2 s-1 mass velocity.
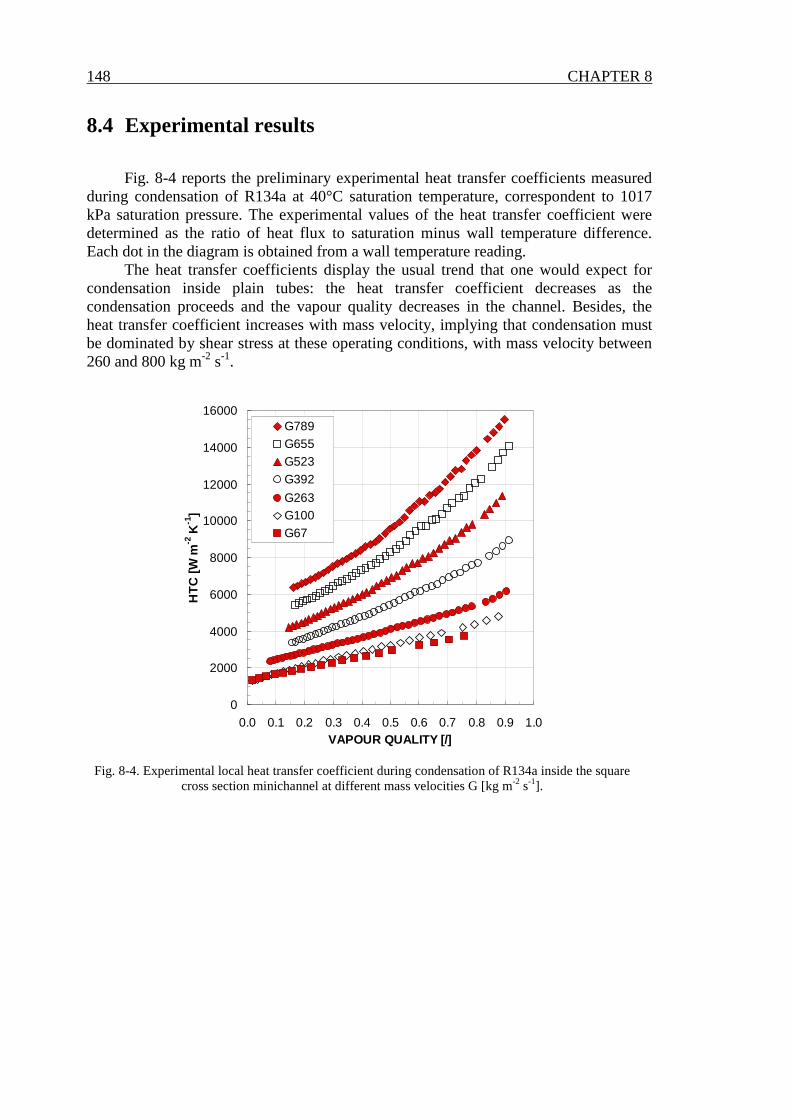
148 CHAPTER 8
8.4 Experimental results
Fig. 8-4 reports the preliminary experimental heat transfer coefficients measured during condensation of R134a at 40°C saturation temperature, correspondent to 1017 kPa saturation pressure. The experimental values of the heat transfer coefficient were determined as the ratio of heat flux to saturation minus wall temperature difference. Each dot in the diagram is obtained from a wall temperature reading.
The heat transfer coefficients display the usual trend that one would expect for condensation inside plain tubes: the heat transfer coefficient decreases as the condensation proceeds and the vapour quality decreases in the channel. Besides, the heat transfer coefficient increases with mass velocity, implying that condensation must be dominated by shear stress at these operating conditions, with mass velocity between 260 and 800 kg m-2 s-1.
0
2000
4000
6000
8000
10000
12000
14000
16000
0.0 0.1 0.2 0.3 0.4 0.5 0.6 0.7 0.8 0.9 1.0VAPOUR QUALITY [/]
HT
C [W
m-2
K-1
]
G789G655G523G392
G263G100G67
Fig. 8-4. Experimental local heat transfer coefficient during condensation of R134a inside the square cross section minichannel at different mass velocities G [kg m-2 s-1].

CHAPTER 8 149
8.5 Experimental uncertainty
The experimental uncertainties of the measured parameters are reported in Table 8-1. On-site calibrations of the thermocouples installed in the wall and in the water channel is carried out, in order to improve the accuracy of the measurements, especially with regards to the temperature difference among them.
Table 8-1. Type B experimental uncertainty of measured parameters.
Temperature ± 0.05 °C Temperature difference (with thermopile) ± 0.03 °C Water flow rate PS ±0.15±[(0.005/flow rate)·100] % of rate
flow rate expressed in kg/h Water flow rate MS ±0.10±[(0.004/flow rate)·100] % of rate
flow rate expressed in kg/h Refrigerant flow rate ±0.15±[(0.001/flow rate)·100] % of rate
flow rate expressed in kg/h Absolute pressure ± 5 kPa level of confidence 3σ Pressure difference ± 0.1 kPa level of confidence 3σ
The channel side length uncertainty is equal to 0.02 mm; the uncertainty on corner
radius is equal to 0.02 mm. The main component of the experimental uncertainty affecting heat transfer
coefficient is due to the uncertainty associated to the measurement of the heat flux. An uncertainty analysis on measured heat transfer coefficient and vapour quality was conducted. Experimental uncertainty is made up by two parts: the first component is the type A uncertainty that derives from repeated observations, the second one is type B uncertainty that derives from instruments calibration and manufacturer’s specifications.
All experimental measurements (temperature, pressure, mass flow rate) are taken as a mean value of 50 readings with a time step of 1 s.
For the temperature, the average value and the standard deviations are calculated from (8-6) and (8-7) respectively.
1
1 n
kk
t tn =
= ∑ (8-6)
( ) ( )1
1
1
n
k kks t t t
n == −
− ∑ (8-7)
For the pressure and the mass flow rate, the average values and the standard
deviations are calculated from the previous expressions substituting temperature with pressure and mass flow rate.
According to ISO Guide to the Expression of Uncertainty in Measurement (1995), Type A standard uncertainty is given by the experimental standard deviation of the mean as follows:

150 CHAPTER 8
( ) ( ) ( )ks tu t s t
n= = (8-8)
The heat transfer coefficient is obtained from measured quantities as reported
below:
( ) ( )( ) ( )
( )
( ) ( )
( )
,
, , , ,
ww p w
i sat wall i sat wall
ww sat wall i
dT zm cq z dzHTC z
p T z T z p T z T z
dTHTC z f m T T p
dz
π π
−= =
⋅ − ⋅ −
=
ɺ
ɺ
(8-9)
Vapour quality at MS inlet is obtained by thermal balance between refrigerant and
water in the PS as reported in Eq. (8-10) and Eq.(8-11). Local vapor quality is calculated with a thermal balance between refrigerant and
water in the MS as reported in Eq.(8-12).
,sup ,
w PSin p w PS
r
mh h c T
m= − ⋅ ⋅ ∆
ɺ
ɺ (8-10)
( ), , ,in Lin w PS r PS
V L
h hx f m m T
h h
−= = ∆−
ɺ ɺ (8-11)
( ) ( )( ), , ,
, ,( ) , , , ,w MS p w w out w
in in w MS r w out wr LG
m c T T zx z x f x m m T T z
m h
− = − =⋅
ɺ
ɺ ɺ
ɺ (8-12)
The combined standard uncertainty is obtained by combining appropriately the
Type A and Type B standard uncertainties of the measured quantities as follows:
( )1,.. ny f x x= (8-13)
( ) ( )2
2
1
n
c iii
fu y u x
x=
∂= ∂ ∑ (8-14)
A specific procedure has been implemented for determining the uncertainty
associated with temperature gradient. A temperature variation equal to thermocouple uncertainty has been imposed on each water thermocouple; therefore 219 varied water temperature profiles have been obtained, corresponding at all possible water temperature configurations compatible with experimental uncertainty. For each location z along the channel, 219 values of the temperature gradient have been calculated

CHAPTER 8 151
obtaining a Gaussian distribution. The standard deviation of temperature gradient distribution is the uncertainty associated with temperature gradient.
The expanded uncertainty UM is obtained by multiplying the combined standard uncertainty by a coverage factor k=2 with an interval having a level of confidence of approximately 95%.
( )M cU k u y= (8-15)
In Fig. 8-5 HTC and vapour quality uncertainty are reported for all condensation
test performed with R134a.
0
2000
4000
6000
8000
10000
12000
14000
16000
0.0 0.1 0.2 0.3 0.4 0.5 0.6 0.7 0.8 0.9 1.0VAPOUR QUALITY [/]
HT
C [W
m-2
K-1
]
G789G655G523G392
G263G100G67
Fig. 8-5. HTC and vapor quality experimental uncertainty during R134a condensation tests.
In Fig. 8-6. and Fig. 8-7. percentage uncertainty on HTC is illustrated for R134a
condensation tests at G=200 kg m-2 s-1 and at G=400 kg m-2 s-1; the contributions to total uncertainty due to diameter uncertainty, heat flux and saturation-to-wall temperature difference are also represented. For both test runs the main contribution to the total HTC uncertainty is due to the uncertainty associated with heat flux measurement.

152 CHAPTER 8
0
1
2
3
4
5
6
7
8
0.0 0.1 0.2 0.3 0.4 0.5 0.6 0.7 0.8 0.9 1.0VAPOUR QUALITY [/]
HT
C U
NC
ER
T. [
%]
Total
Perimeter
Heat flux
Tref-Twall
Fig. 8-6. HTC percentage uncertainty during R134a condensation at G200 kg m-2 s-1.
0
1
2
3
4
5
6
7
8
0.0 0.1 0.2 0.3 0.4 0.5 0.6 0.7 0.8 0.9 1.0VAPOUR QUALITY [/]
HT
C U
NC
ER
T. [
%]
Total
Perimeter
Heat flux
Tref-Twall
Fig. 8-7. HTC percentage uncertainty during R134a condensation at G400 kg m-2 s-1.

CHAPTER 8 153
8.6 Sensitivity to vapour quality inlet conditions
Several tests have been performed to check the accuracy and repeatability of the present experimental technique. Fig. 8-8. shows the experimental heat transfer coefficient measured with R134a at 400 kg m-2 s-1 . In this figure, different symbols refer to different inlet vapour qualities of the refrigerant entering the test section. The refrigerant has been first sent as saturated vapour with 0.98 quality to the measuring sector, and then at lower values of vapour quality, down to 68% quality. The local HTC determined in the different test runs overlap; some differences in the values measured at beginning and end of the measuring sector may be due to boundary effects in the measurements. Therefore, the present test apparatus provides the same HTC at the same refrigerant conditions, no matter at which location this coefficient is measured along the channel.
0
1000
2000
3000
4000
5000
6000
7000
8000
9000
10000
0.0 0.1 0.2 0.3 0.4 0.5 0.6 0.7 0.8 0.9 1.0VAPOUR QUALITY [/]
HT
C [W
m-2
K-1
]
G400 xin=0.98
G400 xin=0.92
G400 xin=0.81
G400 xin=0.73
G400 xin=0.68
Fig. 8-8. Experimental local heat transfer coefficient at varying inlet vapour conditions, from 0.98 to 0.68 quality.

154 CHAPTER 8
0
1000
2000
3000
4000
5000
6000
7000
8000
9000
10000
0.0 0.1 0.2 0.3 0.4 0.5 0.6 0.7 0.8 0.9 1.0VAPOUR QUALITY [/]
HT
C [W
m-2
K-1
]
G400 xin=0.98
G400 xin=0.68
Fig. 8-9. Experimental uncertainty on local heat transfer coefficient at varying inlet vapour conditions.
8.7 Water temperature influence on heat transfer coefficient
Beside mass velocity and vapour quality, the effect of the saturation to wall temperature difference can be investigated by varying the inlet temperature of the coolant. Such a study has been conducted at 260 kg m-2 s-1 with coolant temperature ranging between 19 and 32 °C, at constant refrigerant saturation temperature. Because of the peculiar design of the coolant channel, the dominant thermal resistance is on the refrigerant side and therefore these variations of the coolant temperature imply a consequent significant change in the wall temperature and thus in the saturation to wall temperature difference.
The results of tests at varying water temperature at mass velocity G=260 kg m-2 s-1 are plotted in Fig. 8-10, showing no effect of the temperature difference on the heat transfer coefficient at 260 kg m-2 s-1: the differences among HTC curves are within the experimental uncertainty. These results confirm that the effect of gravity in this channel is not significant in comparison with the other forces influencing the condensation heat transfer at this mass velocity.

CHAPTER 8 155
0
1000
2000
3000
4000
5000
6000
7000
8000
0.0 0.1 0.2 0.3 0.4 0.5 0.6 0.7 0.8 0.9 1.0VAPOUR QUALITY [/]
HT
C [W
m-2
K-1
]
G260 t=18.9°C
G260 t=22.4°C
G260 t=25.8°C
G260 t=29.9°C
G260 t=32.5°C
Fig. 8-10. Experimental local heat transfer coefficient during condensation of R134a at 260 kg m-2 s-1 when varying the inlet water temperature.
0
1000
2000
3000
4000
5000
6000
7000
8000
0.0 0.1 0.2 0.3 0.4 0.5 0.6 0.7 0.8 0.9 1.0VAPOUR QUALITY [/]
HT
C [W
m-2
K-1
]
G260 t=18.9°C
G260 t=25.8°C
G260 t=32.5°C
Fig. 8-11. Experimental uncertainty on local heat transfer coefficient during condensation of R134a at 260 kg m-2 s-1 when varying the inlet water temperature.

156 CHAPTER 8
8.8 Comparison between circular and square minichannel
In order to compare the heat transfer coefficients inside square channel to the ones in circular minitube, the heat transfer coefficients of Fig. 8-1 have been corrected to account for the different hydraulic diameter. This correction was applied following the Cavallini et al. (2006) correlation, which is able to predict HTC data of annular flow condensation from 10 mm down to 1 mm.
The heat transfer coefficients of the square channel and those corrected of the circular one are plotted in Fig. 8-12, Fig. 8-13 and Fig. 8-14 at three different mass fluxes G. At 800 kg m-2 s-1 (Fig. 8-12) the heat transfer coefficients measured in the two channels overlap. The two sets of values are very close to each other also at 400 kg m-2 s-1 (Fig. 8-13), considering that some experimental uncertainty must be taken into account and this is higher at lower vapour quality. Differently, at 200 kg m-2 s-1 (Fig. 8-14), the heat transfer coefficient in the square channel is always higher than that measured in the circular minitube by 20-30%. Since no effect of the gravity is expected, this HTC enhancement must be due to the effect of the corners, and in particular to the effect of the surface tension pulling the liquid towards the corners and reducing the average thermal resistance in the cross section.
0
2000
4000
6000
8000
10000
12000
14000
16000
0.0 0.2 0.4 0.6 0.8 1.0VAPOUR QUALITY [/]
HT
C [W
m-2
K-1
]
G790 SQUARE
G800 CIRCULAR
Fig. 8-12. Heat transfer coefficients in square and circular channels at G=800 kg m-2 s-1.

CHAPTER 8 157
0
2000
4000
6000
8000
10000
0.0 0.2 0.4 0.6 0.8 1.0VAPOUR QUALITY [/]
HT
C [W
m-2
K-1
]
G400 SQUARE xin=0.92
G400 SQUARE xin=0.68
G400 CIRCULAR
Fig. 8-13. Heat transfer coefficients in square and circular channels at G=400 kg m-2 s-1.
0
1000
2000
3000
4000
5000
6000
0.0 0.2 0.4 0.6 0.8 1.0VAPOUR QUALITY [/]
HT
C [W
m-2
K-1
]
G200 SQUARE
G200 CIRCULAR
Fig. 8-14. Heat transfer coefficients in square and circular channels at G=200 kg m-2 s-1.

158 CHAPTER 8
8.9 Comparison with the models
Experimental results have been compared against seven models available in the open literature and developed for HTC predictions inside macro-scale tubes and minichannels. The first correlation is the one by Akers et al. (1959); this correlation was developed for forced convective condensation within conventional tubes. As reported in Fig. 8-15 the model under predicts experimental data.
In Fig. 8-16 a comparison between experimental HTC and Cavallini et al. (2003) model has been presented. It has been designed for condensation inside macro-channels and encompasses all flow regimes. R134a data are well predicted by Cavallini et al. (2003) model at all mass velocities.
Cavallini et al. (2005) developed a model for heat transfer coefficient prediction during condensation inside minichannels. The model was designed for annular and annular-mist regime. All the data at mass velocities greater than 100 kg m-2 s-1 are well estimated by the model. R134a data points at G=100 kg m-2 s-1 and G=67 kg m-2 s-1 are under predicted by the model (Fig. 8-17).
The forth model used in the present comparison is the one by Cavallini et al. (2006), which was developed for macroscale condensation. It also accounts for the transition from ∆T-independent to ∆T-dependent region, where ∆T is the saturation minus wall temperature difference, but this transition is defined for conventional tubes, i.e. for channels with hydraulic diameters higher or equal to 3 mm. From flow pattern visualization available in the open literature (Coleman and Garimella, 2000), one should expect that the stratified flow region is reduced in the case of minichannels, as compared to conventional tubes.
Besides, it has shown no effect of the temperature difference in the heat transfer coefficient at 260 kg m-2s-1, confirming that the effect of gravity forces in an around 1 mm diameter channel is not significant in comparison with the other forces influencing the condensation heat transfer at this mass velocity.
Fig. 8-18 reports the comparison between experimental heat transfer coefficients vs. predicted values by using the correlation by Cavallini et al. (2006). Data are under predicted by this correlation, especially at low mass velocities.
In Fig. 8-19 a comparison between experimental HTC and predicted HTC by Koyama et al. (2003) model is presented. The model was developed to predict heat transfer coefficients in small diameter tube having an inside diameter around 1 mm. All experimental data are under predicted by the model in particular at high vapour qualities.
Moser et al. (1998) model was initially developed for conventional pipes and later on modified by using the Zhang and Webb (2001) method for pressure drop calculation inside small-diameter tubes. Although all the data points have been compared to the models, this correlation should be applied only to annular flow condensation.
The comparison between experimental values and predictions is depicted in Fig. 8-20. The values of the heat transfer coefficient measured with R134a are under predicted by this correlation, especially at low mass velocities.
Finally experimental data are compared in Fig. 8-21 with Wang et al. (2002) model. The model has been developed for condensation inside minichannels. R134a experimental data at high mass velocities are under predicted by 30%.
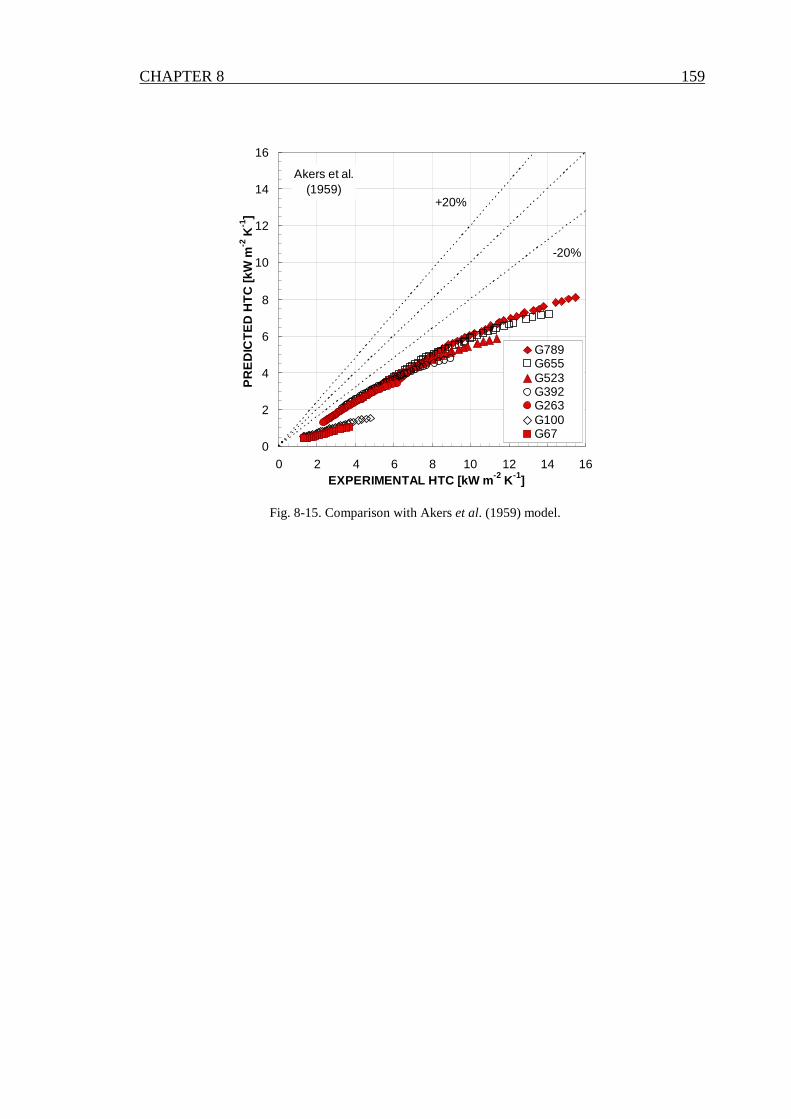
CHAPTER 8 159
Akers et al. (1959)
+20%
-20%
0
2
4
6
8
10
12
14
16
0 2 4 6 8 10 12 14 16EXPERIMENTAL HTC [kW m -2 K -1]
PR
ED
ICT
ED
HT
C [k
W m
-2 K
-1]
G789G655G523G392G263G100G67
Fig. 8-15. Comparison with Akers et al. (1959) model.

160 CHAPTER 8
Cavallini et al. (2003)
+20%
-20%
0
2
4
6
8
10
12
14
16
0 2 4 6 8 10 12 14 16EXPERIMENTAL HTC [kW m -2 K -1]
PR
ED
ICT
ED
HT
C [k
W m
-2 K
-1]
G789G655G523G392G263G100G67
Fig. 8-16. Comparison with Cavallini et al. (2003) model.
Cavallini et al. (2005)
+20%
-20%
0
2
4
6
8
10
12
14
16
0 2 4 6 8 10 12 14 16EXPERIMENTAL HTC [kW m -2 K -1]
PR
ED
ICT
ED
HT
C [k
W m
-2 K
-1]
G789G655G523G392G263G100G67
Fig. 8-17. Comparison with Cavallini et al. (2005) model.

CHAPTER 8 161
+20%
Cavallini et al. (2006)
-20%
0
2
4
6
8
10
12
14
16
0 2 4 6 8 10 12 14 16EXPERIMENTAL HTC [kW m -2 K -1]
PR
ED
ICT
ED
HT
C [k
W m
-2 K
-1]
G789G655G523G392G263G100G67
Fig. 8-18. Comparison with Cavallini et al. (2006) model.
+20%
Koyama et al. (2003)
-20%
0
2
4
6
8
10
12
14
16
0 2 4 6 8 10 12 14 16EXPERIMENTAL HTC [kW m -2 K -1]
PR
ED
ICT
ED
HT
C [k
W m
-2 K
-1]
G789G655G523G392G263G100G67
Fig. 8-19. Comparison with Koyama et al. (2003) model.

162 CHAPTER 8
Moser et al. (1998)
+20%
-20%
0
2
4
6
8
10
12
14
16
0 2 4 6 8 10 12 14 16EXPERIMENTAL HTC [kW m -2 K -1]
PR
ED
ICT
ED
HT
C [k
W m
-2 K
-1]
G789G655G523G392G263G100G67
Fig. 8-20. Comparison with Moser et al. (1998) model.
+20%
Wang et al. (2002)
-20%
0
2
4
6
8
10
12
14
16
0 2 4 6 8 10 12 14 16EXPERIMENTAL HTC [kW m -2 K -1]
PR
ED
ICT
ED
HT
C [k
W m
-2 K
-1]
G789G655G523G392G263G100G67
Fig. 8-21. Comparison with Wang et al. (2002) model.

163
Conclusions
In this thesis, condensation heat transfer coefficients and two-phase frictional pressure drop measured with R245fa and R32 in a 0.96 mm diameter single round channel have been reported. The two HFC fluids display far different thermodynamic properties. While the condensation heat transfer coefficient is roughly the same for the two fluids, at the same experimental conditions (mass flux and vapour quality), the frictional pressure drop is significantly higher in the case of the low pressure refrigerant, as one would expect.
Experimental local heat transfer coefficients measured during condensation inside a single 0.96 mm circular minichannel are used to assess predictive models available in the open literature for condensation. Present comparisons are performed against data taken at mass velocity higher or equal to 100 kg m-2 s-1 with R32 and R245fa. For the present operating conditions, the heat transfer coefficient shows no dependence on the saturation to wall temperature difference, while it increases with vapour quality and mass velocity. The experimental values of the heat transfer coefficient show that the condensation is shear stress dominated for most of the data points. As shown by comparisons, the best agreement is found using the model by Cavallini et al. (2006), which was developed for condensation inside conventional tubes. It means that models for macroscale condensation still holds for 1 mm diameter circular minichannels, during annular condensation. Further investigation is needed for the operating conditions at lower mass velocity.
Predictions are unsatisfactory at low mass velocity, and this is to be related to the peculiar flow and heat transfer characteristics inside the minichannel, which by the way depend very much on the fluid thermo-physical properties. At this mass velocity (100 kg m-2 s-1), the disagreement may be explained by considering that the experimental trend differs from the one during condensation in conventional ducts, and this is mostly true for R32 and R134a.
A new test section, designed and fabricated to measure the heat transfer coefficient during condensation in a square cross section channel, is presented. Single-phase pressure drop has been measured to characterized the test channel and liquid-phase heat transfer tests have been performed to check the experimental procedure. The friction factor has been measured during adiabatic flow of R134a as subcooled liquid state and superheated vapour. Satisfactory agreement between experimental friction factor and calculated friction factor for laminar flow has been found.
The preliminary results show that the condensation, between 260 and 800 kg m-2 s-1 mass flux, is shear stress dominated. By comparing the heat transfer coefficients to those previously measured inside a circular channel, it can be seen that the heat transfer is enhanced in the square channel at 200 kg m-2 s-1 by the effect of surface tension, but this enhancement is null at higher mass flux.
In this thesis, flow boiling in a 0.96 mm internal diameter channel is also studied by using a secondary fluid instead of imposing the heat flux. Local values of the heat transfer coefficient of R245fa, R134a and R32 at 30 °C saturation temperature have been reported.

164 CONCLUSIONS
A criterion for the determination of the critical conditions in the channel has been presented, showing that the wall temperature displays larger fluctuations in the zone where complete dryout occurs. Those temperature fluctuations in the wall denote the presence of a liquid film drying up at the wall with some kind of an oscillating process. Those temperature fluctuations never appear during condensation tests, neither are present during flow boiling at low vapour qualities. The fluctuations also disappear in the post-critical condition zone.
R32, which displays higher saturation and reduced pressure than R134a and R245fa, at the same temperature, is characterized by higher heat transfer coefficient as compared to the other fluids. The heat transfer coefficient measured during flow boiling shows to be highly dependent on the heat flux while the effect of mass velocity and vapour quality is less important. With regard to the effect of vapour quality, the heat transfer coefficient decreases when vapour quality increases.
The present flow boiling data have been compared against four models presented in the literature. The predicting accuracy which can be obtained for flow boiling, is far lower as compared to the modelling capabilities for condensation heat transfer.
Dryout tests have been performed during flow boiling of R245fa, R134a and R32 in a 0.96 mm diameter circular channel, where the boiling process is obtained by means of a secondary fluid instead of electrically heating. The experimental data have been reported both in the form of dryout quality and in the form of average critical heat flux. The average critical heat flux increases with mass velocity and decreases when the heated length increases.
The present experimental data are not well predicted by the well known Katto-Ohno (1984) correlation. Better agreement is found with the equation by Del Col et al. (2007), and with the model by Wojtan et al. (2006) developed for the prediction of dryout quality in minichannels.

165
References
Akers W.W., Deans H.A., and Crosser O.K., Condensing heat transfer within horizontal tubes, Chem. Eng.Prog. Symp. Series, vol. 55, pp. 171-176, 1959. Bhatti M. S. and Shah R. K., Turbulent and transition flow convective heat transfer in ducts, In: Kakac S., Shah R. K., and Aung W. (eds.), Handbook of Single-Phase Convective Heat Transfer, Chapter 4, Wiley, New York, 1987. Bertsch S. S., Groll E. A., and Garimella S. V., A composite heat transfer correlation for saturated flow boiling in small channels, Int. J. of Heat and Mass Transfer, vol. 52, pp., 2110-2118, 2009. Bertsch S. S., Groll E. A., and Garimella S. V., Effect of heat flux, mass flux, vapor quality, and saturation temperature on flow boiling heat transfer in microchannels, International Journal of Multiphase Flow, vol. 35, pp. 142-154, 2009b. Cavallini A., Censi G., Del Col D., Doretti L., Longo G.A., Rossetto L., and Zilio C., Condensation inside and outside smooth and enhanced tubes- a review of recent research, Int. J. of Refrigeration, vol. 26, pp. 373-392, 2003. Cavallini A., Del Col D., Doretti L., Matkovic M., Rossetto L., and Zilio C., A model for condensation inside minichannels, Proc. of HT05 National Heat Transfer Conf., ASME, San Francisco, July 17-22, 2005. Cavallini A., Del Col D., Doretti L., Matkovic M., Rossetto L., and Zilio C., Two-phase frictional pressure gradient of R236ea, R134a and R410A inside multi-port mini-channels, Experimental Thermal and Fluid Science, vol. 29(7), pp. 861-870, 2005b. Cavallini A., Censi G., Del Col D., Doretti L., Matkovic M., Rossetto L., and Zilio C., 2006, Condensation in Horizontal Smooth Tubes: A New Heat Transfer Model for Heat Exchanger Design. Heat Transfer Engineering, vol. 27(8), pp. 31-38, 2006. Cavallini A., Doretti L., Matkovic M., and Rossetto L., Update on condensation heat transfer and pressure drop in minichannels, Heat Transfer Eng., 27(4), pp. 74-87, 2006b. Cavallini A., Censi G., Da Riva E., Del Col D., and Mancin S., Shell-and-Tube Minichannel Condenser for Low Refrigerant Charge, Proc. 19th National & 8th ISHMT-ASME Heat and Mass Transfer Conference, JNTU Hyderabad, India, January 3-5, 2008. Cavallini A., Del Col D., Matkovic M., and Rossetto L., Frictional pressure drop during vapour-liquid flow in minichannels: Modelling and experimental evaluation, International Journal of Heat and Fluid Flow, vol. 30, pp. 131-139, 2009.

166 REFERENCES
Celata G. P., Cumo M., McPhail S. J., and Zummo G., Single-phase laminar and turbulent heat transfer in smooth and rough microtubes, Microfluid Nanofluid, vol. 3, pp. 697-707, 2007. Celata G. P., Lorenzini M., Morini G. L., and Zummo G., Friction factor in micropipe gas flow under laminar, transition and turbulent flow regime, International Journal of Heat and Fluid Flow, vol. 30, pp. 814-822, 2009. Chen I.Y., Yang K.S., Chang Y.J., and Wang C.C., Two-phase pressure drop of air-water and R-410A in small horizontal tubes, Int. J. of Multiphase Flow, vol. 27, pp. 1293-1299, 2001. Churchill S. W., Friction-factor equation spans all fluid-flow regimes, Chem. Eng., vol. 45, pp. 91-92, 1977. Coleman J.W. and Garimella S., Two-phase flow regimes in microchannel tubes: the effect of hydraulic diameter, Proc. of the ASME Heat Transfer Division, HTD-Vol. 366-4, 2000. Consolini L. and Thome J. R., Micro-channel flow boiling heat transfer of R-134a, R-236fa, and R-245fa, Microfluid Nanofluid, vol. 6, pp. 731-746, 2009. Da Riva E., Two-phase heat transfer in minichannel heat exchanger: heat pump applications, design, modelling, PhD thesis, University of Padova, Italy, 2009. Del Col D., Fantini F., and Rossetto L., Dryout quality in a minichannel flow boiling, XXV UIT National Congress of Heat Transfer, Trieste, Italy, June 18-20, 2007. Friedel L., Improved friction pressure drop correlations for horizontal and vertical two-phase pipe flow, Europ. Two-phase Flow Group Meet., Ispra, Paper E2, 1979. Garimella S, Agarwal A., and Killon J.D., Condensation pressure drops in circular minichannels, 2nd Int. Conf. on Microchannels and Minichannels, Rochester, pp. 649-656, 2004. Garimella S., Condensation in minichannels and microchannels, In: Kandlikar S. G., Garimella S., Li D., Colin S., King M. R., Heat transfer and fluid flow in minichannels and microchannels, Chapter 6, Elsevier, 2006. Gnielinski V., In: Heat transfer in pipe flow, VDI Heat Atlas/ed. Verein Deutscher Ingenieure, VDI-Gesellschaft Verfahrenstechnik und Chemieingenieurwesen (GVC) [Transl. J. W. Fullarton], VDI-Verl., Düsseldorf, Gb 1-Gb 8, 1993. Harirchian T. and Garimella S. V., Microchannel size effect on local flow boiling heat transfer to a dielectric fluid, Int. Journal of Heat and Mass transfer, vol. 51, pp. 3724-3735, 2008. ISO, Guide to the Expression of Uncertainty in Measurement, 1995.
REFERENCES 167
Kew P. A. and Cornwell K., Correlations for the prediction of boiling heat transfer in small diameter channels, Applied Thermal Engineering, vol. 17, pp. 705-715, 1997. Kandlikar S. G. and Grande W. J., Evolution of microchannel flow passages – thermohydraulic performance and fabrication technology, Heat Transfer Engineering, vol. 24(1), pp. 3-17, 2003. Kandlikar S. G., Heat Transfer Mechanisms during flow boiling in microchannels, J. of Heat Transfer, vol. 126, pp. 8-16, 2004. Kandlikar S. G. and Balasubramanian P., An extension of the flow boiling correlation to transition, laminar, and deep laminar flows in minichannels and microchannels, Heat Transfer Engineering, vol. 25(3), pp. 86-93, 2004. Katto Y.and Ohno H., An improved version of the generalized correlation of critical heat flux for the forced convective boiling in uniformly heated vertical tubes, Int. J. Heat Mass Transfer, vol. 27(9), pp. 1641-1648, 1984. Kosar A., A model to predict saturated critical heat flux in minichannels and microchannels, International J. of Thermal Sciences, vol. 48, 2009. Koyama S., Kuwara K., and Nakashita K. Condensation of refrigerant in a multi-port channel, 1st Int. Conf. on Microchannels and Minichannels, Rochester, April 24-25, pp. 193-205, 2003. Kuan W-K. and Kandlikar S.G., Experimental study on saturated flow boiling critical heat flux in microchannels, Fourth International Conference on Nanochannels, Microchannels and Minichannels, Limerick, Ireland, 2006. Lazarek G. M. and Black S. H., Evaporative heat transfer, pressure drop and critical heat flux in small vertical tube with R-113, Int. J. Heat Mass Transfer, vol. 25(7), pp 945-960, 1982. Lee J. and Mudawar I., Two phase flow in high-heat-flux micro-channel heat sink for refrigeration cooling applications: Part I-pressure drop characteristics, Part II-heat transfer characteristics, Int. Journal of Heat and Mass transfer, vol. 48, pp. 928-955, 2005. Lezzi A. M., Niro A., and Beretta G. P., Experimental data on CHF for forced convection water boiling in long horizontal capillary tubes, Proceedings of The Tenth International Heat Transfer Conference, Brighton, UK, vol. 7, pp. 491-496, 1994. Lockhart R. W. and Martinelli R. C., Proposed correlation of data for isothermal two-phase, two-component flow in pipes, Chem. Eng. Prog., pp. 39-45, 1949. Matkovic M., Experimental condensation inside minichannels, PhD thesis, University of Padova, Italy, 2006.
168 REFERENCES
Matkovic M., Cavallini A., Del Col D., and Rossetto L., Experimental study on condensation heat transfer inside a single circular minichannel, Int. J. of Heat and Mass Transfer, vol. 54, pp. 2311-2323, 2009. Mishima K. and Hibiki T., Some characteristics of air-water two-phase flow in small diameter vertical tubes, Int. J. of Multiphase Flow, vol. 22, pp. 703-712, 1996. Moser K.W., Webb R.L., and Na B., A new equivalent Reynolds number model for condensation in smooth tubes, J. of Heat Transfer, vol. 120, pp. 410-417, 1998. Müller-Steinhagen H. and Heck K., A simple friction pressure drop correlation for two-phase flow in pipes, Chemical Engineering Progress, vol. 20, pp. 297-308, 1986. NIST, National Institute of Standard and Technology, Refprop Version 8.0, Boulder Colorado, 2007. Paliwoda A., Generalized method of pressure drop calculation across pipe components containing two-phase flow of refrigerants, Rev. Int. Froid, vol. 15(2), pp. 119-125, 1992. Pettersen J., Flow vaporization of CO2 in minichannel tube, Experimental Thermal and Fluid Science, Vol. 28, pp. 111-121, 2004. Qu W. and Mudawar I., Measurement and correlation of critical heat flux in two-phase micro-channel heat sink, Int. J. of Heat and Mass Transfer, vol. 47, pp. 2045-2059, 2004. Revellin R. and Thome J. R., A theoretical model for the prediction of critical heat flux in a heated microchannels, Int. J. of Heat and Mass Transfer, vol. 51, pp. 1216-1225, 2008. Roday A. P. and Jensen M. K. Proceedings of ASME-JSME Thermal Engineering Summer Heat Transfer Conference, Vancouver, Canada, July 8-12, 2007. Sarma P. K., Srinivas V., Sharma K. V., Dharma Rao V., and Celata G. P., A correlation to evaluate critical heat flux in small diameter tubes under subcooled conditions of the coolant, Int. J. of Heat and Mass Transfer, vol. 49, pp. 42-51, 2006. Shah R. K. and London A. L., Laminar flow forced convection in ducts, Academic Press, New York, 1978. Shiferaw D., Karayiannis T. G., and Kenning D. B. R., Flow boiling in a 1.1 mm tube with R134a: Experimental results and comparison with model, Int. J. of Thermal Sciences, vol. 48, pp. 331–341, 2009. Thome J. R., Dupont V., and Jacobi A. M., Heat transfer model for evaporation in microchannels. Part I: presentation of the model, Int. J. of Heat and Mass Transfer, vol. 47, pp. 3375-3385, 2004.

REFERENCES 169
Thome J. R., Boiling in microchannels: a review of experiment and theory, Int. J. of Heat and Fluid Flow, vol. 25, pp. 128-139, 2004b. Thome J. R., State-of-the-art overview of boiling and two-phase flows in microchannels, Heat Transfer Engineering, vol. 27(9), pp. 4-19, 2006. Tran T.N., Chyu M.C., Wambsganss M.W., and France D.M., Two-phase pressure drop of refrigerants during flow boiling in small channels: an experimental investigation and correlation development, Int. J. of Multiphase Flow, vol. 26, pp. 1739-1754, 2000. VDI heat atlas/ed. Verein Deutscher Ingenieure, VDI-Gesellschaft Verfahrenstechnik und Chemieingenieurwesen (GVC) [Transl. J. W. Fullarton], VDI-Verl., Düsseldorf, 1993. VDI-Wärmeatlas, Verein Deutscher Ingenieure, VDI-Gesellschaft Verfahrenstechnik und Chemieingenieurwesen (GVC), Springer-Verlag, Berlin, Hedelberg, New York, 2002. Wang H. and Rose J.W., Film condensation in horizontal microchannels: effect of channels shape, 3rd Int. Conf. on Microchannels, Toronto, 2005. Wang W.W., Radcliff T.D., and Christensen R.N., A condensation heat transfer correlation for millimetre-scale tubing with flow regime transition, Experimental Thermal and Fluid Science, vol. 26, pp. 473-485, 2002. Wojtan L., Revellin R., and Thome J. R., Investigation of saturated critical heat flux in a single, uniformly heated microchannel, Experimental Thermal and Fluid Science, vol. 30, pp. 765-774, 2006. Yan Y.Y. and Lin T.F., Condensation heat transfer and pressure drop of refrigerant R134a in a small pipe, Int. J. Heat Mass Transfer, vol. 42, pp. 697-708, 1999. Yun R. and Kim Y., Critical quality prediction for saturated flow boiling of CO2 in horizontal small diameter tubes, Int. J. of Heat and Mass Transfer, vol. 46, pp. 2527-2535, 2003. Zhang M. and Webb R.L., Correlation of two-phase friction for refrigerants in small-diameter tubes, Experimental Thermal and Fluid Science, vol. 25, pp. 131-139, 2001. Zhang W., Hibiki T., Mishima K., and Mi Y., Correlation of critical heat flux for boiling of water in mini-channels, Int. J. of Heat and Mass Transfer, vol. 49, pp.1058-1072, 2006.

170 REFERENCES
171
Publications
Cavallini A., Bortolin S., Del Col D., Matkovic M., Rossetto L., Flow boiling inside a single circular minichannel: measurement of local heat transfer coefficient, HT2007 ASME-JSME Thermal Engineering Summer Heat Transfer Conference, Vancouver, July 8-12, 2007. Cavallini A., Bortolin S., Del Col D., Matkovic M., Rossetto L., Experiments on Dry-Out During Flow Boiling in a Round Minichannel, Microgravity Science and Technology, vol. XIX-3/4, Z-Tec Publishing, Bremen, 2007, ISSN: 0938-0108. Del Col D., Cavallini A., Bortolin S., Matkovic M., Rossetto L., Heat transfer coefficient during flow boiling of R134a in a circular minichannel, EUROTHERM2008 5th European Thermal-Sciences Conference, Eindhoven, May 18-22, 2008, ISBN 978-90-385-1274-4. Matkovic M., Cavallini A., Bortolin S., Del Col D., Rossetto L., Heat transfer coefficient during condensation of high pressure refrigerant inside a circular minichannel, EUROTHERM2008 5th European Thermal-Sciences Conference, Eindhoven, May 18-22, 2008, ISBN 978-90-385-1274-4. Bortolin S., Cavallini A., Del Col D., Matkovic M., Rossetto L., Flow boiling of refrigerants inside a single circular minichannel, ICNMM2008 6th International Conference on Nanochannels, Microchannels and Minichannels, Darmstadt, June 23-25, 2008, ISBN 0-7918-3826-9. Cavallini A., Bortolin S., Del Col D., Matkovic M., Rossetto L., Two-phase heat transfer and pressure losses of high pressure refrigerant condensing in a single circular minichannel, HEFAT2008 6th International Conference on Heat Transfer, Fluid Mechanics and Thermodynamics, Pretoria, 30 June to 2 July 2008. Cavallini A., Bortolin S., Del Col D., Matkovic M., Rossetto L., Heat transfer and pressure drop experimentation inside single minichannel, 10th International Conference on Advanced Computational Methods and Experimental Measurements in Heat Transfer, Maribor, July 9-11, 2008. Cavallini A., Bortolin S., Del Col D., Matkovic M., Rossetto L., Condensation and vaporization of halogenated refrigerants inside a circular minichannel, 12th International Refrigeration and Air Conditioning Conference at Purdue, West Lafayette, Indiana, Usa, July 14-17, 2008. Del Col D., Cavallini A., Bortolin S., Matkovic M., Rossetto L., Dryout during flow boiling in a single circular minichannel: experimentation and modeling, HT2008 ASME Summer Heat Transfer Conference, Jacksonville, Aug 10-14, 2008.

172 PUBLICATIONS
Del Col D., Cavallini A., Bortolin S., Matkovic M., Rossetto L., Local heat transfer coefficients during condensation inside a single circular minichannel, XXVII UIT Congress, Reggio Emilia, Jun 22-24, 2009. Cavallini A., Bortolin S., Del Col D., Matkovic M., Rossetto L., Condensation of HFC refrigerants inside a single circular minichannel, 3rd IIR Conference on Thermophysical Properties and Transfer Processes of Refrigerants, Boulder, CO, Jun 23-26, 2009. Bortolin S., Del Col D., Rossetto L., Flow boiling of R245fa in a single circular microchannel, 2nd Micro and Nano Flows Conference, West London, UK, Sept 1-2, 2009. Matkovic M., Bortolin S., Cavallini A., Del Col D., Experimental study of condensation inside a horizontal single square minichannel, ASME 2nd Micro/Nanoscale Heat & Mass Transfer International Conference, Shanghai, China, Dec 18-22, 2009. Cavallini A., Bortolin S., Del Col D., Matkovic M., Rossetto L., Condensation heat transfer and pressure losses of high and low pressure refrigerants flowing in a single circular minichannel, Heat Transfer Enginnering, (Accepted), 2009.

173
Nomenclature
a square minichannel side length [m] A cross sectional area [m2] Bo boiling number = q’/( hLG G) [/] cp specific heat [J kg-1 K-1] d,D diameter [m] f frictional factor [/] Fr Froude number = G2/(ρ2 g dh)
[/] g gravity acceleration [m/s2] G mass velocity [kg m-2 s-1] h enthalpy [J kg-1] hLG heat of vaporization [J kg-1] HTC heat transfer coefficient [W m-2 K-1] k cover factor [/] Kf friction factor Re number product [/] L distance between pressure ports [m] Lh heated length [m] MS measuring sector mɺ mass flow rate [kg/s] n number of readings [/] Nu Nusselt number = α d / λ [/] p pressure [Pa] pi perimeter [m] pr reduced pressure [/] PS pre-sector q heat flow rate [W] q’ heat flux [W m-2] q heat flow rate per unit length [W m-1] Ra arithmetical mean deviation of the assessed profile (according to ISO
4287 : 1997) [µm] Rz maximum height of profile (according to ISO 4287 : 1997) [µm] Re Reynolds number =G D/µ [/] s standard deviation t temperature [°C] T temperature [K] TS test section u uncertainty uc combined uncertainty UM expanded uncertainty WeD Weber number =G2 Dh/(σ ρ) [/] x thermodynamic vapor mass quality [/] z axial position [m]

174 NOMENCLATURE
Greek letters α heat transfer coefficient [W m-2 K-1] ∆p pressure difference [Pa] ∆T temperature difference [K] λ thermal conductivity [W m-1 K-1] µ dynamic viscosity [Pa s] ρ density [kg/m3] σ surface tension [N/m] Subscripts cr critical e external G gas/vapour phase h hydraulic i internal L liquid phase in inlet m mean MS measuring sector out outlet PS pre-sector r refrigerant sat saturation SL saturated liquid sub subcooled sup superheated w water

175
Acknlowledgements
This study concerning condensation and vaporization of refrigerants inside minichannels has been carried out at the Dipartimento di Fisica Tecnica, Università degli Studi di Padova, under the direction of Prof. Alberto Cavallini, Prof. Davide Del Col and Prof. Luisa Rossetto.
Dr. Marko Matkovic, is acknowledged for his important work in the design and realization of the minichannels experimental test apparatus.
Special thanks to Ing. Daniele Torresin, PhD student at the Dipartimento di Fisica Tecnica, for his helpful cooperation during the set-up and instrumentation of the new square minichannel test section.