Tweeter Case INSPECTION - Columbia Business · PDF file · 2015-09-29Tweeter was...
28
Retailing Tweeter Home Entertainment -1- Copyright © Trustees of Columbia University in the City of New York For permission contact [email protected] 212-854-7173 COLUMBIA BUSINESS SCHOOL REINVENTING TWEETER On March 19 th 2003, Tweeter Home Entertainment Group’s CEO Jeff Stone walked into Uris 142 to lecture in Professor Kane’s Retailing Leadership class at Columbia Business School. Accompanied by CFO Joe McGuire, Stone was prepared to speak candidly about the specialty consumer electronics retailer’s growing difficulties—eight quarters of negative comp store growth, shrinking profits and a vanishing customer base. An open-minded leader, he was curious to hear what a roomful of MBAs thought of Tweeter’s dilemma, and he looked forward to a lively discussion about his proposed solution. One fact was certain: Any successful effort to improve Tweeter’s performance would have to bring more traffic to its 174 stores. To Stone and McGuire, another point was equally obvious: Tweeter’s strong gross margins, which, at nearly 36% of sales were five to ten percentage points above the industry average. He was questioning whether reducing that percent could produce top-line growth and increase earnings per share. Unlike the consumer electronics superstores with which it competed, Tweeter prided itself on its award-winning customer service, which though costly, had always been an important differentiator in the retail market. With its high costs, the retailer needed strong gross margins to earn an acceptable return on its invested capital. Spring’s early arrival made for an unseasonably warm lecture hall, its still air broken by a single fan near the podium. Unmoved by the heat, Stone stood before his audience and began his address. Industry Overview The consumer electronics (CE) industry spans several categories of manufactured goods, including televisions and video products, audio equipment and supplies, computers, cameras, games and home security. According to the Consumer Electronics Association (CEA), the industry’s largest trade association, factory sales to retail in 2002 topped $96.2 billion, a 3.7% increase from the previous year (see Exhibit I for 2001 market composition and Exhibit II for 2001 market share of top product brands). This case was written in July, 2003 by Edmund Lim, Charles Marcus and Juan Martinez, all MBA ’03, under the supervision of Professor Alan Kane as the basis for class discussion, rather than to illustrate either effective or ineffective handling of a strategic situation. Copyright © 2003 Columbia Business School
Transcript of Tweeter Case INSPECTION - Columbia Business · PDF file · 2015-09-29Tweeter was...
Retailing Tweeter Home Entertainment
-1- Copyright © Trustees of Columbia University in the City of New York For permission contact [email protected] 212-854-7173
COLUMBIA
BUSINESS SCHOOL
REINVENTING TWEETER On March 19th 2003, Tweeter Home Entertainment Group’s CEO Jeff Stone walked into Uris 142 to lecture in Professor Kane’s Retailing Leadership class at Columbia Business School. Accompanied by CFO Joe McGuire, Stone was prepared to speak candidly about the specialty consumer electronics retailer’s growing difficulties—eight quarters of negative comp store growth, shrinking profits and a vanishing customer base. An open-minded leader, he was curious to hear what a roomful of MBAs thought of Tweeter’s dilemma, and he looked forward to a lively discussion about his proposed solution. One fact was certain: Any successful effort to improve Tweeter’s performance would have to bring more traffic to its 174 stores. To Stone and McGuire, another point was equally obvious: Tweeter’s strong gross margins, which, at nearly 36% of sales were five to ten percentage points above the industry average. He was questioning whether reducing that percent could produce top-line growth and increase earnings per share. Unlike the consumer electronics superstores with which it competed, Tweeter prided itself on its award-winning customer service, which though costly, had always been an important differentiator in the retail market. With its high costs, the retailer needed strong gross margins to earn an acceptable return on its invested capital. Spring’s early arrival made for an unseasonably warm lecture hall, its still air broken by a single fan near the podium. Unmoved by the heat, Stone stood before his audience and began his address. Industry Overview The consumer electronics (CE) industry spans several categories of manufactured goods, including televisions and video products, audio equipment and supplies, computers, cameras, games and home security. According to the Consumer Electronics Association (CEA), the industry’s largest trade association, factory sales to retail in 2002 topped $96.2 billion, a 3.7% increase from the previous year (see Exhibit I for 2001 market composition and Exhibit II for 2001 market share of top product brands). This case was written in July, 2003 by Edmund Lim, Charles Marcus and Juan Martinez, all MBA ’03, under the supervision of Professor Alan Kane as the basis for class discussion, rather than to illustrate either effective or ineffective handling of a strategic situation. Copyright © 2003 Columbia Business School
Retailing Tweeter Home Entertainment
-2- Copyright © Trustees of Columbia University in the City of New York For permission contact [email protected] 212-854-7173
Within the CE industry, the video and audio product categories represent about 25% of industry sales volume. Though this segment experienced strong growth in the late 1990s, sales had been decidedly sluggish since 2000, when DVD equipment sales began to reach their peak in a deteriorating economic environment. Unlike many other industries, the CE industry depends deeply on product innovation to fuel its expansion. Over the past 40 years, CE manufacturers and retailers have ridden waves of growth spurred by such innovations as color and remote control TVs, VCRs, camcorders, CD players, digital cameras and DVD technology. In the troughs of these waves, many manufacturers and retailers folded. In 1972, when Tweeter was founded, CE retailers were relatively fragmented, with the largest 20 firms accounting for only 20% of overall industry sales. Competition intensified over the following thirty years, and today the top two retailers—Best Buy and Circuit City account for an estimated 30% of industry sales.1 While men have historically been the primary target for most CE retailers, demographic trends show that women now account for half of industry sales. Today’s retail CE industry can be segmented as follows:
• Category killers. Best Buy and Circuit City are the undisputed leading category killers in retail consumer electronics, offering a broad selection of merchandise at a range of price points and across multiple product categories of consumer electronics. Together these two retailers command more than 45% of the retail market for video and audio-related products2. Stores range in size between 50,000 to 100,000 square feet, and tend to be stand-alone units or part of strip center malls.
• National and regional specialty retailers . These stores typically range from 5,000 to
20,000 square feet in size, and are usually located in strip centers and malls. They carry limited assortments that are consistent with the retailer’s positioning. Examples include Tweeters, Radio Shack, Ultimate Electronics, BrandSmart and The Good Guys.
• Mom & pop stores. As in other retail segments, the single store proprietor is a dying
breed in the consumer electronics space. With hundreds of such shops, New York City appears to be one of the last refuges for the segment.
• Mass Merchandisers . Walmart, Kmart and Target operate stores ranging from 50,000 to
200,000 square feet in size, though they dedicate little selling space to consumer electronics. Offering narrow assortments and little customer service, mass merchandisers typically only compete at the low end of the price scale, but the pressure these companies exert is sure to be felt across the whole retail spectrum.3 Target and Walmart jointly command an estimated 8.5% of the retail CE market.
1 Business Week , “The Promise of Consumer Electronics,” Jan 22, 2003. Best Buy is estimated to have 20% market share in the retail sales of CE, and Circuit City, 10%. 2 Consumer Electronics Retailers, Industry Report – Prudential Financial, April 2002. 3 According to Stone, Walmart sold 1 million units of $99.99 DVD players over the 2002 Thanksgiving holiday, alone. DVD penetration in the US was estimated to be 25% in 2002.

Retailing Tweeter Home Entertainment
-3- Copyright © Trustees of Columbia University in the City of New York For permission contact [email protected] 212-854-7173
The Growth of Price Promotion Since the late 1980s price promotion has spelled the end of many CE retailers, including some of the biggest. In the New England market, which was home to more than a dozen Tweeter stores at the time, the 1985 arrival of warehouse electronics chains Highland Superstores, and Fretter Superstores, quickly put many small retailers out of business. In 1988 the dominant CE retailer in the region, Lechmere, signaled a new era of price promotion by instituting an ongoing series of weekend “sale” campaigns that conditioned consumers to expect year-round sale prices for merchandise.4 The period between the late 1980s to the mid-1990s, in addition to seeing more price promotion, witnessed little advancement in marketable product innovation. The sale of color TVs, VCRs and CD players had already peaked and the “next big thing” for consumers would not arrive until digital technology came to market. With high fixed costs and shrinking margins, Lechmere, Highland and Fretter soon found themselves unable to compete with broad market retailers Circuit City and—mostly outside of New England—Best Buy. By the mid-1990s, all three had filed for bankruptcy protection. (See Exhibit III for a description of competitors). As most consumers have experienced, CE products are generally introduced at a relatively high retail price that falls rapidly depending on the speed and level of consumer adoption. 5 The product innovation cycle thus offers CE retailers a narrow time frame for selling higher-margin merchandise to early adopters and to the forward edge of the mass market. As product prices fall and the market penetration of new technology rises, specialty retailers have had either to match prices, increase their services offering—with warranty add-ons and financing, for example—or risk losing the sale to mass merchandisers. (See Exhibit IV for an example of the relationship between product pricing and market penetration). Internet retailers have only heightened the challenge for their bricks and mortar competitors. The online sale of CE, not including computers, is projected to quadruple from 2000 to 2006, going from 2% to 8% of total sales for the category. 6 Emphasizing convenience and price competitiveness, online retailers allow for both product education and price comparison, making price the most important determinant of product selection. The Promise of Digital Television For many if not most CE retailers, 2003 and the years to follow offer new hope, thanks to advancements in video display technology and some welcome regulation from the Federal Communications Commission. On the technology front, flat-screen and high-definition television (HDTV) products have crossed a price threshold clearing the way for an accelerated pace of consumer adoption. Moreover, December 31, 2006 marks the current deadline for the DTV (digital television) conversion mandated for broadcasters and equipment manufacturers. Under the auspices of the Telecommunications Act of 1996, the FCC requires broadcasters to forfeit their assigned portions of the analog spectrum in exchange for the digital spectrum most
4 Harvard Business School Case 9-597-028, Rev. April 15, 1997 5 For example, the first VCRs, CD players and DVD equipment were priced over $1000 when introduced to the market. 6 Jupiter Research, “Market Forecast Report—Retail, through 2007.” Jupiter anticipates the US online consumer electronics market will reach $4.7billion in 2007, approximately four times the size of the market in 2000.
Retailing Tweeter Home Entertainment
-4- Copyright © Trustees of Columbia University in the City of New York For permission contact [email protected] 212-854-7173
broadcasters have already acquired. Under this requirement, most broadcasters will have to cease transmission of their analog signal, sending a digital signal instead. Simultaneously, the FCC has mandated that TV manufacturers equip all new televisions with digital tuners, which will be necessary for receiving DTV broadcasts. (See Exhibit V for growth in DTV equipment sales). Though it is widely accepted that the “digital convergence” will not be complete by the 2006 deadline, the regulation has sweeping implications for the CE industry. In Jeff Stone’s words,
“Over the next 10 to 15 years, because of the digitalization of the airwaves, all 250 million television sets are going to have to be replaced in the US…That’s a huge opportunity.”
Stone is not alone in his enthusiasm for digital television and the wave of product replacement its arrival will bring. Since the beginning of 2001, the strong sales growth of DTV equipment has been one of the brightest success stories in the consumer electronics business. Tweeter’s History—From Inception Until 1996 7 Early Beginnings Tweeter was founded in 1972 when Sandy Bloomberg, the company’s current chairman, and his cousin Michael opened a stereo store, Tweeter etc., near the Boston University campus. The 1970s saw much advancement in stereo technology and Tweeter quickly gained a reputation for carrying high-end brands and for having a knowledgeable and friendly staff. Under the corporate name, New England Audio Company, Inc., Tweeter began to open new stores in and around Boston in 1977. By the end of the decade the company had expanded to seven retail locations, with an average store size of 10,000 square feet—its current size—and the retailer’s product line had grown to include high-end video equipment. Tweeter’s customer focus since its inception was on Baby Boomers. As late as 1999, according to Sandy Bloomberg, the average Tweeter customer was a 40-year-old male earning more than $70,000 a year. “The prime demographic for the audio/video business is 18 to 54,” he added. “Our customer is someone who graduated college in 1968, who grew up with the Beatles and the Vietnam War, and who has a passion for music.” 8 Tweeter continued to grow through the mid-1980s, thanks to strong national and regional economies as well as to the growing demand for VCRs, camcorders and CD players. By 1986, the company owned 13 stores in Massachusetts and Rhode Island, and by the end of the 1980s it claimed 5% of Boston’s CE market and 2% of New England’s. All the while, Tweeter strengthened its reputation for offering premium products and service.
7 The following two sections draw heavily from the early company history detailed in Harvard Business School (HBS) Case 9-597-028, Rev. April 15, 1997. Unless otherwise cited, management’s quotations and figures in these two sections come directly from HBS. 8 Quoted in TWICE (This Week In Consumer Electronics), September 20, 1999

Retailing Tweeter Home Entertainment
-5- Copyright © Trustees of Columbia University in the City of New York For permission contact [email protected] 212-854-7173
The challenge of price promotion The New England CE market became increasingly less hospitable in the second half of the 1980s, with the arrival of superstores Highland, Fretter, and later, Circuit City. Tweeter soon found itself struggling to convey its price competitiveness, in part because of its focus on higher-end merchandise. In the words of Noah Herschman, Tweeter’s vice president of marketing,
“The consumers just wanted price, price, price. But we didn’t carry entry- level products like a $139 VCR or a $399 camcorder. We carried middle and high-end stuff. So people would look at our ads and they would look at Lechmere’s ads…They’d have a $399 camcorder, and we’d have a $599 camcorder. Even though their middle and high-end equipment sold for the same price as ours, we seemed to be more expensive to the inexperienced consumer. Our print advertising was actually driving people away—doing more damage to our business than if we never used it.”
In response to this growing challenge, Tweeter first broadened its product line to include a few lower-end models. Then, in 1988, it joined the Progressive Retailers Organization (PRO), a CE industry buying group capable of securing sale prices comparable to those obtained by the superstores. However, the company was unable to shake its reputation for premium products and prices, and it began to experience a decline in revenue and profitability in 1989. In 1990 the company recruited a new President and COO, Jeff Stone, who had previously been the executive vice president of Boston-based Bread & Circus supermarkets. With a background in human resources, Stone was chosen to lead the company’s turnaround. In addition to securing loans to ease through the cash crunch, Stone quickly cut the company headcount, increased training for store managers and put an end to the company’s losses. In 1991 Highland withdrew from the New England market, closing 10 stores, and Fretter followed suit in 1995. This might have been good news for Tweeter, were it not for the 1993 arrival of Circuit City, an aggressive category killer emphasizing both price and product selection. With Circuit City operating in its backyard, Tweeter found itself in search of a new approach. New Strategies in 1993: EDFP, APP and a New Marketing Approach In the spring of 1993, Tweeter’s senior management team convened at a retreat in Vermont to develop a new game plan. Together they reviewed the results of customer survey and focus group research, which gave the company high marks for merchandise quality and customer service, and low marks for price competitiveness. The research also suggested that price really was the most important factor in purchase behavior, and that newspaper advertising—the principal forum for price promotion—was the most important factor in store selection. Seeing an urgent need to be perceived as price competitive, management decided on a three-fold initiative to improve Tweeter’s positioning:
Retailing Tweeter Home Entertainment
-6- Copyright © Trustees of Columbia University in the City of New York For permission contact [email protected] 212-854-7173
1) Move to “Every Day Fair Pricing” The first component of the new strategy was to put an end to the weekly sale promotions. Despite its advertising effort, Tweeter was clearly being overtaken by Lechmere and Circuit City. As Tweeter’s Herschman put it:
“Even though we were competitively priced, because of our high-price image, no one was listening. And, even more frustrating, was the fact that our increasing reliance on the weekend ‘sale’ drew attention from our unique selling proposition—high quality products and great customer service.”
Abandoning sales for “Every Day Fair Pricing” (EDFP) would thus highlight Tweeter’s quality edge without encouraging unfair comparisons with product makes and models not available elsewhere. Neither Tweeter nor its competitors had tried EDFP before. 2) A new approach: Automatic Price Protection Automatic Price Protection (APP), a term coined by Bloomberg at the retreat, was a radical new concept, designed to communicate Tweeter’s price competitiveness and commitment to customer service. The biggest challenge with APP would be getting customers to understand it. The idea behind the initiative was a low price guarantee with Tweeter’s commitment to monitor competitors’ prices and, upon finding a lower advertised price, to send rebate checks to customers for 100% of the price difference. APP was a groundbreaking move. At the time most retailers in New England, including Tweeter, were practicing some form of price protection, offering customers a refund of 100% or more of the difference between the purchase price and the competitor’s advertised lower price for a period of 30 days after the transaction. For example, if a consumer bought a TV at Tweeter and paid $499 for it, and then found it advertised by a competitor for $399, the consumer could bring the ad to a Tweeter store for a refund of $100. With APP, Tweeter would automatically send the check to the consumer unsolicited, with no action needed to be taken by the customer. Historically, price guarantees had required an action on behalf of the consumer, as mentioned above, and consequently, only a small fraction of customers followed through. By contrast, APP only required consumers to cash the checks that came through the mail. Furthermore, to complement APP, Tweeter extended the former price protection plan to 60 days, re- labeling it “Regular Price Protection.” To cap administrative costs, APP applied to items over $50 and for price differences greater than two dollars. The APP program was managed by a dedicated department in corporate HQ. Every day, APP’s staff would check every issue of eight ma jor New England newspapers. Any product carried by Tweeter and advertised by a competitor was logged, with its price, model number and date of advertising entered into the APP database. This information was cross-referenced with order historical data, and checks were automatically generated and sent within five days. Stone estimated that the company sent out checks for $3,000 to $4,000 per month under this plan.
Retailing Tweeter Home Entertainment
-7- Copyright © Trustees of Columbia University in the City of New York For permission contact [email protected] 212-854-7173
3) A new marketing mix The third element of the new strategy was a shift in the marketing mix away from print advertising, which had long emphasized promotional pricing. In the past, Tweeter’s marketing budget had averaged 8% of sales, mostly in the form of print inserts in local newspapers. (i.e. 80% of the 1993 $3.1M marketing budget). Now, without a blatant “on sale” message, it no longer made sense to advertise in circulars, so Tweeter shifted virtually its entire advertising budget to radio and TV to explain and build awareness for APP and EDFP. The company also launched a direct marketing campaign centered on a seasonal “Buyer’s Guide.” Although, as Stone noted in his lecture, advertising “what’s coming soon” can delay the purchase decision, the guide was produced quarterly with great success. By 1996, it had reached 325,000 homes, of which 270,000 were estimated to have purchased at Tweeter within the previous 18 months. By 1998, 10,000 of these homes made part of a newly created “frequent flyer” style customers loyalty program. Performance Improves, but…was it thanks to APP? Tweeter’s management credited the strategy shift for a sharp improvement in financial performance. When Tweeter hired Stone in 1990, its annual revenue was approximately $25 million. By August of 1994, the company had opened its 14th and 15th stores and was on its way to record annual revenue of $47.4 million. In 1994, comparable store sales jumped 11.2%, followed by a 12.5% gain in 1995.9 By end of 1995, 2 ½ years after the initiation of the program, the company had mailed a total of 29,526 APP checks totaling over $780,000. However, Bloomberg wondered why they were sending out any checks at all, if Tweeter’s prices were truly competitive. Furthermore, based on its current sales volume, was this an acceptable number? Was the message of price competitiveness really reaching potential customers? Some surveys in the Boston area showed continued perceptions of Tweeter’s premium pricing, while others suggested that few people fully understood APP, and even fewer—only 22%—were aware that it was Tweeter who offered it. To complicate the picture, the same surveys also showed that after two years and extensive promotion of APP, only 32% of the market had heard of the program, while only 2% had shopped at Tweeter. What did this suggest about the program’s overall effectiveness? The Big Boom of the Late 1990s The economic expansion of the late 1990s was a boom for much of the consumer electronics industry, and Tweeter was uniquely positioned to benefit from it. Low interest rates and unemployment, combined with a soaring stock market and the “hi- tech bubble” encouraged heavy consumer spending on big-ticket home audio and video equipment. From 1996 to 2002 Tweeter saw nearly a ten-fold increase in revenue from $80.6 million to $796 million. While much of the revenue ga in could be attributed to the company’s acquisition spending spree, Tweeter’s comp store sales growth signaled the underlying strength of its business through 2000, when it topped 13%.10 9 Tweeter, S-1, 1998. 10 Tweeter 10K, 2001.

Retailing Tweeter Home Entertainment
-8- Copyright © Trustees of Columbia University in the City of New York For permission contact [email protected] 212-854-7173
Aggressive Growth through Acquisition After re-establishing itself in New England as a successful niche retailer emphasizing higher-end merchandise and outstanding customer service, Tweeter sought to extend its model through store expansion and consolidation (see Exhibit VI for Tweeter’s acquisition timetable and Exhibit VII for its store footprint in 2002). In May 1996 Tweeter completed its first strategic acquisition of Bryn Mawr Stereo & Video, a $35 million, 13-store chain headquartered in King of Prussia, PA. With a reputation for its high-end merchandise and strong customer service, Bryn Mawr also faced the consumer perception that it was premium priced, and thus not competitive with the superstores. Bloomberg convinced Bryn Mawr eight months before it acquired the company to move to APP. Bryn Mawr followed his advice, but at the time of acquisition, few results could firmly be attributed to the policy. Talks between Tweeter and Bryn Mawr had gone on for years before Sandy Bloomberg felt comfortable moving ahead. Bloomberg envisioned taking Tweeter national by acquiring a select group of family-run businesses that also addressed the upper end of the CE market. Tweeter evaluated potential acquisition targets by looking at four aspects of the business: brand name, physical assets, market demographics and, most importantly, sales people. It is no surprise that Tweeter should be so focused on the human side of its business, given its long-standing reputation for customer service. Behind this reputation is an investment in employee training which, at $7,000 per store employee, management believes to be the highest in the industry. Following the Bryn Mawr acquisition, Tweeter continued to expand its market reach to Georgia, Texas, California, Illinois, North Carolina, Florida and Arizona. In four years, the company acquired 11 companies, ranging from a two-store specialty retailer in Dallas to a 33-store chain operating throughout Florida and Arizona. The company also expanded is sales channel to the Internet, initially through a 1999 joint venture with online retailers Cyberian Outpost, and later by launching its own e-commerce initiative.11 Tweeter’s acquisition plan call for the integration of acquired companies into its operating environment by applying Tweeter’s sales and marketing strategies (including APP, high-margin product mix and customer service philosophy), in addition to utilizing its purchasing, distribution and administrative infrastructure. In practice, the pace of integration has depended on the individual acquisition; its largest acquisition to date, the $200 million Sound Advice retail chain out of Florida, was consummated in August 2001, but as of January 2003, Sound Advice still retained both its name and most of its corporate infrastructure.12 To finance store expansion and consolidation, Tweeter raised more than $160 million from 1996 to 2000. It obtained equity investments of $10.6 million from a group of private investors in 1996, and raised an additional $22 million in both equity and subordinated debt a year later. The company’s IPO in July of 1998 raised $46 million, much of which went to repay its previous
11 The joint venture with Cyberian was eventually terminated upon that company’s acquisition by Tweeter’s competitor Frys Electronics. The deal was written off in February of 2002. In September of 2002, Tweeter teamed with a leading outsourced e-commerce services provider to launch Tweeter.com. 12 Tweeter, 10K, 2002.

Retailing Tweeter Home Entertainment
-9- Copyright © Trustees of Columbia University in the City of New York For permission contact [email protected] 212-854-7173
investors, and a follow-on offering seven months later netted just over $24 million. The company’s most recent public offering, in February 2000, raised close to $60 million. Tweeter’s Merchandise Assortments Beginning in 1997 most consumer electronics retailers began to experience a dramatic change in their sales mix, with the lower-margin video equipment category growing in size relative to the higher-margin audio and other product categories (See Exhibit VIII for company sales revenue by product category). This shift reflected both the dearth of product innovation in audio equipment and the robust demand for DVD players and other video products. But even with this shift toward lower-margin merchandise, Tweeter managed to maintain its gross margins at an industry- leading 35.7%, and maintain its status as one of the most profitable CE retailers. 13 (See Exhibit IX for trends in company financial and operating performance and Exhibit X for 2002 financials). What helped the company maintain good results was its formalized “Sell Audio With Video” strategy, which emphasized audio equipment as a performance enhancement to video and home theater equipment purchases. Referring to this important cross-selling initiative, merchandising executive Bernie Sapienza noted at the time,
“We’re highly focused on selling audio with video…You’re doing an injustice to the consumer to sell them a big-screen TV without an audio system that will allow them to enjoy the full experience…Now people are buying six speakers instead of two.” 14
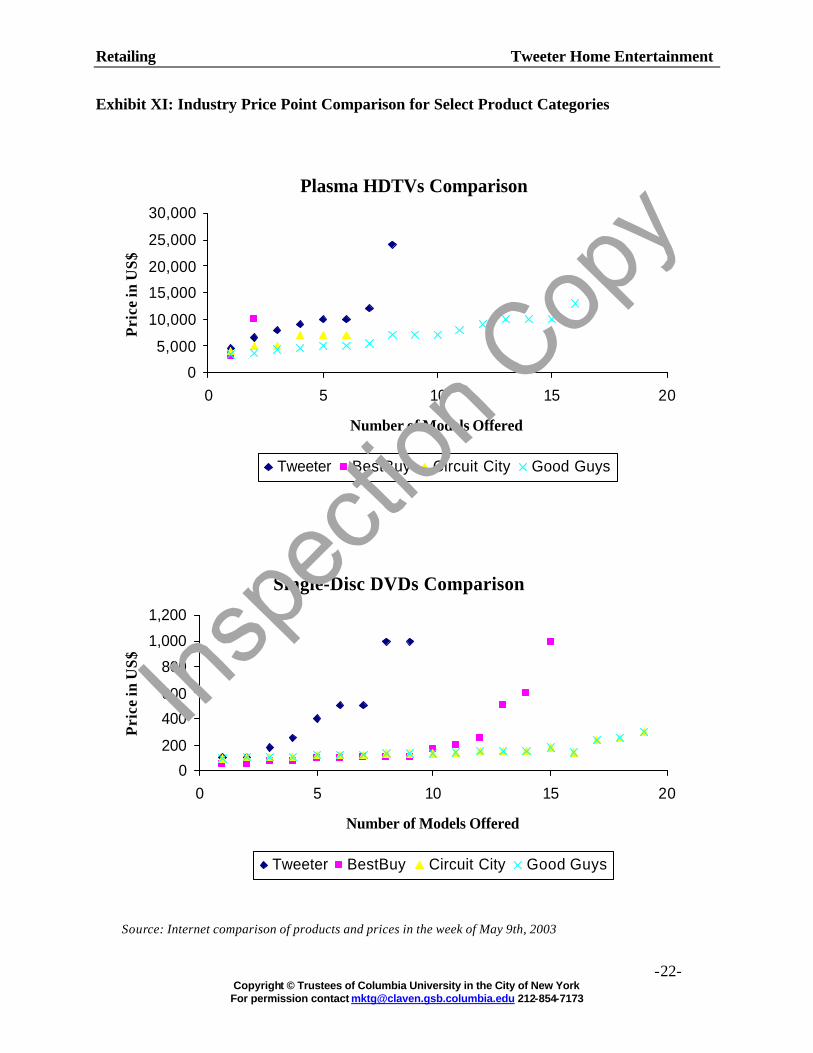
Consistent with the company’s historical positioning, Tweeter continued to focus on selling mid- to high-end audio and video consumer electronics, an approach management believed was critical for differentiating the retailer from mass merchandisers and superstores. While these other retailers typically carried a large portion of their product lines at introductory price points, Tweeter carried few if any in this price range. (See Exhibit XI for an industry price point comparison). The emphasis on higher-end products won favor with manufacturers selling more advanced products or seeking limited distribution—an important concern for Tweeter’s early adopter customer base. With most of Tweeter’s consolidated (i.e. acquired) stores also using EDFP and APP, the company maintained its focus on gross margin management, which Stone had considered a key to the company’s success. As a result, it consistently led the industry in profitability, as measured by net margin as a percentage of sales. A Sharp Turn in 2001: Is a New Strategy Needed? After introducing himself to his audience at Columbia Business School, Jeff Stone began a brisk slide presentation about his company and its market conditions, the latter he summarized with a
13 From 10K filings for Tweeter, Best Buy, Circuit City, Ultimate Electronics and The Good Guys. 14 TWICE, September 20, 1999.

Retailing Tweeter Home Entertainment
-10- Copyright © Trustees of Columbia University in the City of New York For permission contact [email protected] 212-854-7173
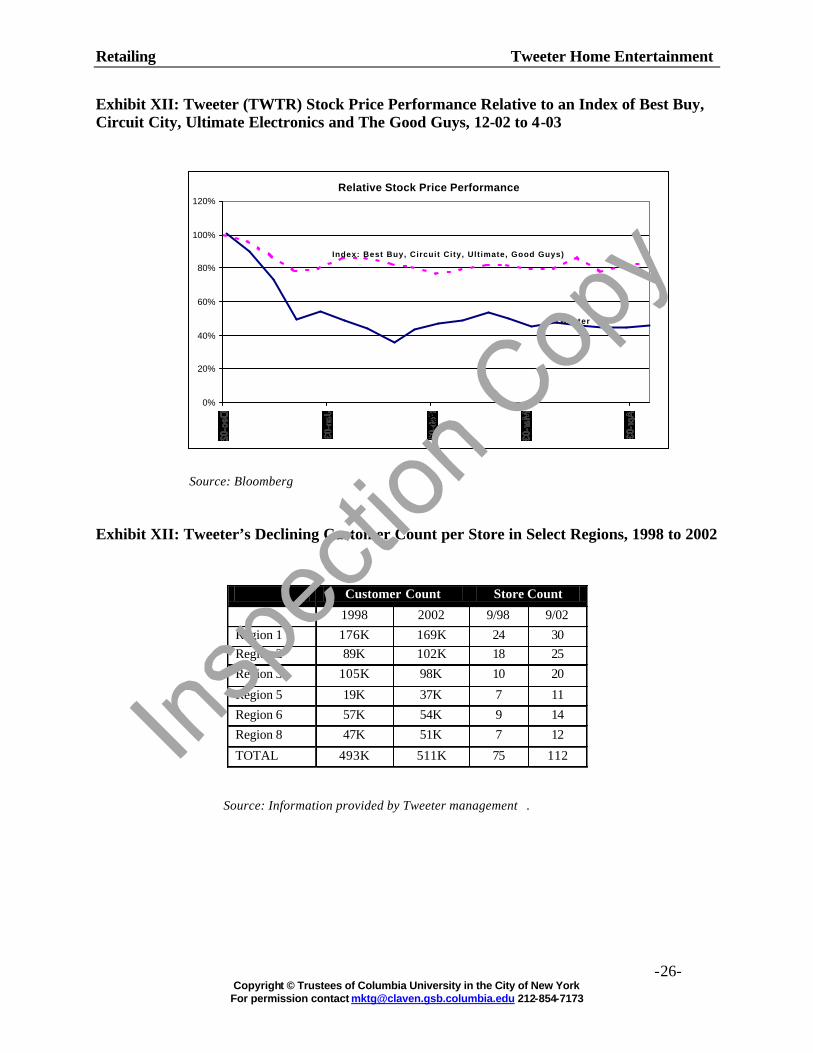
photograph of a toilet bowl—a visual synopsis of the poor market conditions troubling most retailers in 2003. Despite its remarkable run, in 2001 Tweeter ended the year with flat same store sales, and entered what would mark the beginning of at least eight consecutive quarters of negative comp store growth. The company ended FY 2002 with particularly disappointing results, missing its fourth-quarter sales target by a whopping $37 million. The trend worsened in the following quarter, when Tweeter experienced a year-over-year decline in quarterly revenue, and a 10.4% decline in comp store sales. Making matters worse, Tweeter’s declining sales prevented the company from earning coveted manufacturers rebates, which could be as high as four or five percentage points of sales, depending on the manufacturer and the volume achieved. Not surprisingly, the company’s stock performance relative to its peers also declined (see Exhibit XII for Tweeter stock price performance). To Stone, one of Tweeter’s problems stood out against the rest:
“The single biggest issue we face today is customer loss…We know customers like us, we know that when they come in they get a good experience, but how do we attract more of them?”
In support of his comment, he presented a chart detailing Tweeter’s loss of customers across regions. In one region, for example, between 1998 and 2002, the customer count had fallen from 176,000 to 169,000, even while the number of stores had expanded from 24 and 30 doors. Across six select regions during the same time frame, the total number of customers had grown from 493,000 to 511,000 while the number of stores in the region had jumped 75 to 112. This equated to a 30% drop in the average number of customers per store from 1998 to 2002 (see Exhibit XIII for detail on its declining customer count across eight of the company’s nine regions). Contributing to Tweeter’s poor performance were the recent economic downturn and the lingering effects of the events of 9/11 on consumer confidence and spending. In Jeff Stone’s view these two factors, in addition to limiting consumer purchases of big-ticket electronics, had made consumers increasingly value conscious—a trend that did not favor Tweeter, despite the previous successes attributed to APP. Stone pointed out an all- to-familiar problem: “We are known as having high prices on the good stuff, and in this particular economy, that doesn’t play too well.” Tweeter’s trouble was compounded by the apparent failure of its radio and TV advertising to communicate the retailer’s “value” message and drive traffic into stores. This fact, Stone claimed, was one of the biggest teachings of the company’s acquisition history. He summarized the challenge during the company’s Q2 2003 earnings conference call:
“[The] problem today with our strategy is it’s not driving foot traffic, because we don’t look like we have those values everybody else has, when in fact we do. When Sony has a price drop, we have those same price drops; we just don’t have a good vehicle for telling the customer…Really what we’ve done with our
Retailing Tweeter Home Entertainment
-11- Copyright © Trustees of Columbia University in the City of New York For permission contact [email protected] 212-854-7173
existing strategy is, we sit there and wait for the customers to come in and say, ‘I was shopping and I saw it priced at so-and-so,’ and we say, ‘Yeah, we know, we have it priced that way too.”15
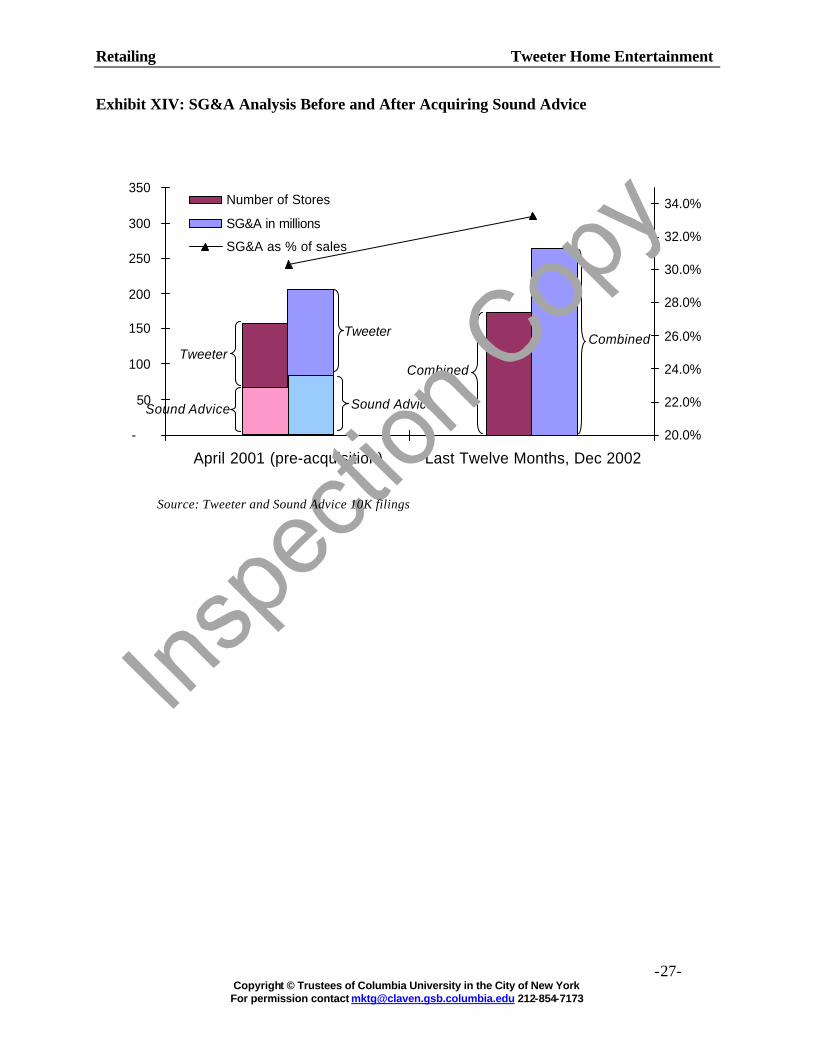
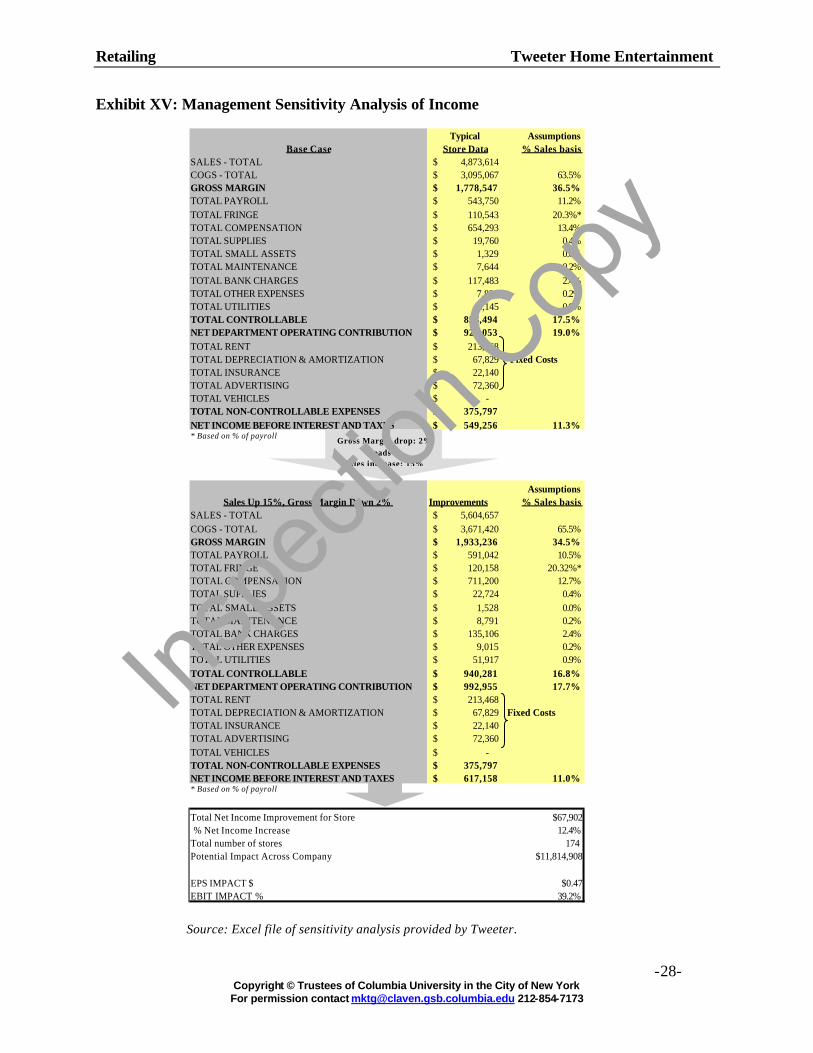
Although Tweeter’s declining sales were part of a larger industry and economic trend, Tweeter’s debt burden and acquisition spree were certainly not meant to help prepare it for such dire times. As of the beginning of 2003, Tweeter had not managed to gain real synergies from its acquisition of Sound Advice, which, with its 40 stores and revenues in 2001 of more than $200 million, accounted for a substantial chunk of Tweeter’s business. One indication of integration trouble could be seen through the proportional increase of SG&A expense ratios following the acquisition (see Exhibit XIV for an analysis of SG&A expense both before and after the Sound Advice acquisition). By most standards of measurement, a successful acquisition of this magnitude would result in substantial cost savings to the company, as duplicative costs are eliminated. Many Potential Options A Need for Sales Expansion and Margin Protection Management’s sensitivity analysis indicated that if they expanded sales by simply slashing prices, the company’s bottom line would quickly suffer. Instead, Stone presented a model allowing for a modest drop in gross margins, from 36% to 34%, and a 15% increase in sales, which, for a typical store, could result in a 12% increase in net income. However, with lower margins and high fixed costs, Tweeter’s bottom-line performance would become more susceptible to any shortfall in the projected increase in sales. In other words, the risks were enormous. What would happen if prices were reduced to gain sales and they did not materialize? (See Exhibit XV for a sensitivity analysis of net income for a typical store). A growing concern for Tweeter was Best Buy’s move toward higher-end merchandise, a trend that was evident from the competitor’s escalating product margins and price points. Stone speculated that discounters like Walmart, who had recently begun selling low-priced DVD players, were forcing Best Buy toward a higher end of the price spectrum. Best Buy was already the market leader in the sale of $149-$999 handheld digital products like the Apple iPod, which is seen as an important driver of traffic into stores. Tweeter, by contrast, long held a bias towards “the big game hunt”— the sale of big-ticket items like home entertainment systems. With traffic such a concern, should Tweeter expand its assortments to include more handheld electronics? Flat Panel Television: Holding on to Market Leadership With an estimated 23% share of the flat-panel TV market in FY 2002, Tweeter in 2003 was an undisputed leader in the retail market for this emerging technology. 16 While Tweeter’s historical approach would have been to de-emphasize the category as price points and margins creep downward, the retailer’s experience in the DVD player market of the late 1990s encouraged a new line of thinking. With DVD players, according to Stone, Tweeter gave up its market 15 Quoted from Tweeter’s Q2 2003 earnings conference call, April 24, 2003. 16 SG Cowen market analysis, April 21, 2003.
Retailing Tweeter Home Entertainment
-12- Copyright © Trustees of Columbia University in the City of New York For permission contact [email protected] 212-854-7173
leadership when the average price point was $499, and as Exhibit IV indicates, this was the price point at which industry sales began to accelerate dramatically. Stone was certain that Tweeter had left a fortune on the table by not expanding its DVD equipment offering toward lower price points, and he did not wish to repeat this mistake with the hottest product category of the new millennium. Citing the last 400% Q4 growth in plasma TV sales, he noted,
“We own emerging television, we always have. But what we have typically done, is when a product comes down to the commodity level, we let it commoditize and stay on the higher end. If we are going to own this space, we think we need to change our strategy, and stay with the product as it comes down in price.”
By management’s estimates, the digital and flat-panel TV opportunity alone could increase comp sales up to 30% per year for the next five years. Even with a shrinking product margin for these TVs, Tweeter might make up the difference by selling the complementary audio equipment—including profitable private label accessories and installation services—that maximize the perceived value of these sophisticated video displays. Finally, flat-panel displays, in Stone’s view, were critical for generating sorely needed foot traffic into stores. An Uncertain Future for Automatic Price Protection From the customer’s viewpoint, according to Stone, APP was no easier to understand in 2003 than it was 10 years prior. What should be one of the company’s most powerful marketing weapons was still not fully understood by customers. In effect, APP guarantees the customer the lowest price (within its stated provisions), but APP does not make the lowest price apparent until the customer receives his or her rebate check. In other words, APP ensures that Tweeter offers the most competitive price, but it does not allow Tweeter to advertise the most competitive price. Without seeing a competitive price advertised in the newspaper, management questioned whether customers were simply concluding that the price competitiveness was never there in the first place. However, when APP was first introduced, the company saw enormous comp store increases, so did the policy not give the impetus to growth? Stone also wondered how difficult it would be to eliminate APP. Unanswered Questions To redress its problems, should the company continue its high gross margin full service strategy? Or should it ride prices down on flat panel TVs and other products in order to increase customer traffic and to use formerly untouched vendor volume rebates? To be sure, the opportunity existed, but should the company not just focus on its existing customer base of early adopters and patiently wait for the next new product cycle? However, periods between brand new product waves are long, while customer adoption rates were getting shorter and shorter. Private label for accessories was a huge success, but it only dealt with commodity products. Should the company (as its competitor Radio Shack did) lever on its image to introduce private label equipment?
Retailing Tweeter Home Entertainment
-13- Copyright © Trustees of Columbia University in the City of New York For permission contact [email protected] 212-854-7173
And, of course, there remained the question of APP: Did it really work? It seemed to give the company an edge in controlling its competitor moves and in portraying a superior image, but it did not seem to have been properly communicated. APP remained an elusive concept to explain. Should its name be changed so customers could better understand its meaning? Should it be modified and integrated with sales promotions? How would Tweeter’s most loyal customers react to a modified APP? Would they accept anything different? And then, how could any change be implemented and supported? Would a shift in the media mix back to newspaper advertising address the company’s concerns about traffic? Finally, should Tweeter’s assortments be modified, by bringing in more opening price points? Would this hurt the image of the company or would it expand the customer base? Conversely, should the assortments be moved up to avoid competition from Best Buy and Circuit City? Would this solidify the image as the high quality, high service store? Stone acknowledged that something fundamental had to change: “We are currently, potentially, in the throes of reinventing ourselves.”
Retailing Tweeter Home Entertainment
-14- Copyright © Trustees of Columbia University in the City of New York For permission contact [email protected] 212-854-7173
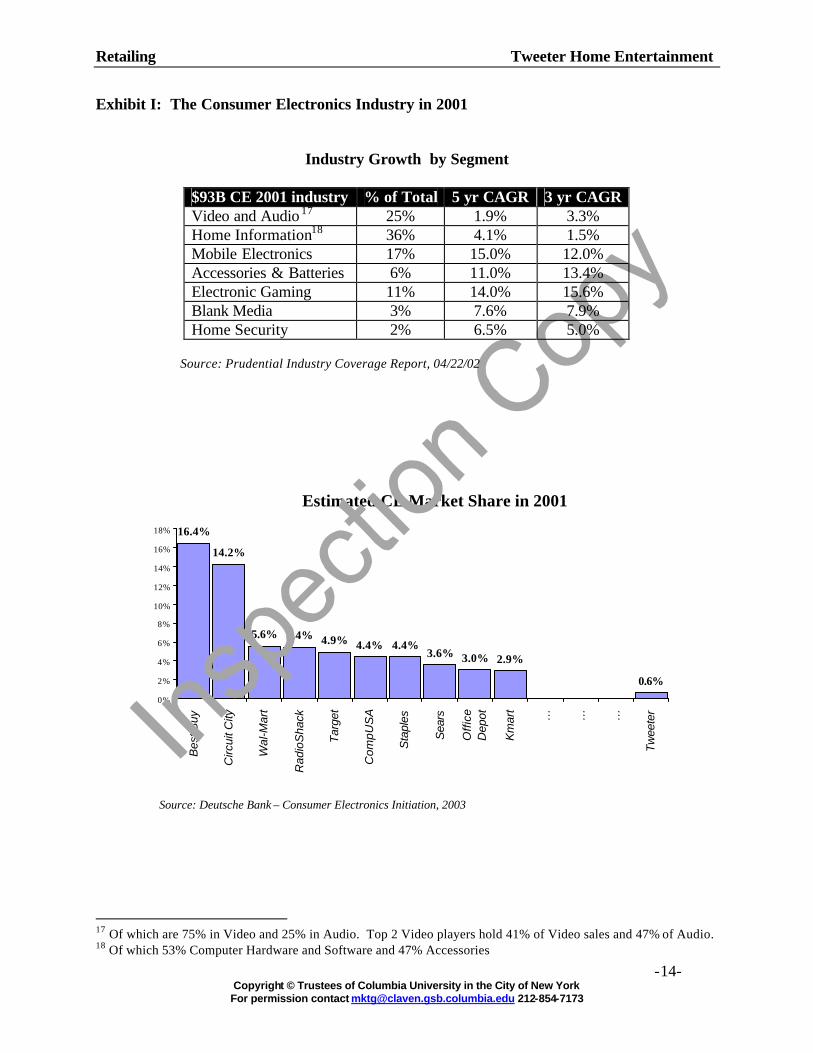
Estimated CE Market Share in 2001
0.6%
2.9%3.0%3.6%4.4% 4.4%4.9%5.4%5.6%
16.4%
14.2%
0%
2%
4%
6%
8%
10%
12%
14%
16%
18%
Bes
t Buy
Circ
uit C
ity
Wal
-Mar
t
Rad
ioS
hack
Targ
et
Com
pUS
A
Sta
ples
Sea
rs
Offi
ceD
epot
Km
art
… … …
Twee
ter
Exhibit I: The Consumer Electronics Industry in 2001
Industry Growth by Segment
$93B CE 2001 industry % of Total 5 yr CAGR 3 yr CAGR Video and Audio 17 25% 1.9% 3.3% Home Information18 36% 4.1% 1.5% Mobile Electronics 17% 15.0% 12.0% Accessories & Batteries 6% 11.0% 13.4% Electronic Gaming 11% 14.0% 15.6% Blank Media 3% 7.6% 7.9% Home Security 2% 6.5% 5.0%
Source: Prudential Industry Coverage Report, 04/22/02
Source: Deutsche Bank – Consumer Electronics Initiation, 2003
17 Of which are 75% in Video and 25% in Audio. Top 2 Video players hold 41% of Video sales and 47% of Audio. 18 Of which 53% Computer Hardware and Software and 47% Accessories

Retailing Tweeter Home Entertainment
-15- Copyright © Trustees of Columbia University in the City of New York For permission contact [email protected] 212-854-7173
Exhibit II: Top Brand by Share of Market for Audio and Video Equipment
Exhibit III: Tweeter’s Primary Competitors in 2003 Best Buy Founded in 1966, by Chairman Richard Schulze, the company began as a small electronics store in St. Paul, Minnesota, known as Sound of Music. Although originally geared towards audio enthusiasts, Best Buy expanded its product offering and number of stores gradually up to 40 superstores around the nation in 1990. Just before it changed its name to Best Buy in 1983, a key store in the company was destroyed by a tornado. This led to the clearance sale in the company which then gave birth to its every day low pricing concept. Since its inception, Best Buy differentiated itself through a different shopping experience for its customers. It was the first store in its industry to introduce noncommissioned sales force, to add entertainment products such as music, movies and computer hardware and software to its product mix, and to introduce interactive merchandising with hands-on displays and demonstrations of new products. It has rapidly expanded in recent years and, as of the end of 2002, had 481 superstores across the country, with an average size of 45,000 square feet. Its latest purchases of Musicland and Magnolia Hi-Fi strengthened its position in music and movie retail and in the high-end consumer electronics business. Circuit City In 1949, when the first TV broadcasting station in the region went on the air, Sam Wurtzel started selling televisions out of a tire-recapping store in Richmond, VA called Ward’s TV. Over the next several decades, Ward’s TV went on to expand through the acquisitions of audio specialty retailers, stand-alone discount stores, and warehouse showrooms into what would come to be known as Circuit City Stores. By 2002, Circuit City had expanded to 580 superstores around the country averaging 40,000 to 60,000 square feet per store. Its phenomenal growth was tied to the successful credit card operations that it had established in 1991. This operation, now known as First North American National Bank (FNANB), is a wholly owned subsidiary with over 1,760 employees. To further boost their online sales, Circuit City also forged an online partnership with Amazon in January 2002. Lately, the company’s financial performance has suffered. In an effort to bring about a turnaround, the company moved from a commission-based compensation scheme to a non-commission-based scheme for its sales staff. The move remains questionable in a falling sales environment amid stiff competition.
companies (brands) 2001 companies (brands) 2001
Sony Corporation 23 Sony Corporation 20Sharp Corporation 14 Philips Group NV 13Royal Philips Electronics 12 Matsushita Electric
Industrial Co Inc11
Matsushita Electric Industrial Co Inc
11 Sharp Corporation 9
Pioneer Electronic Corporation
8 Zenith Electronics Corporation
3
Kenwood Corporation Others 44
Others 32
Source: Euromonitor
Share of Market 2001 for TV, VCRs and Camcorders
Share of Market 2001 for Audio
% value % value
Source: Euromonitor
Retailing Tweeter Home Entertainment
-16- Copyright © Trustees of Columbia University in the City of New York For permission contact [email protected] 212-854-7173
$491
$390
$270
$202
$165 $155
13000
16250
4072
1079349
8499
$0
$100
$200
$300
$400
$500
$600
1997 1998 1999 2000 2001E 2002E
Ave
rag
e P
rice
0
2,000
4,000
6,000
8,000
10,000
12,000
14,000
16,000
18,000
Un
its
So
ld (
'000
)
Price Units Sold
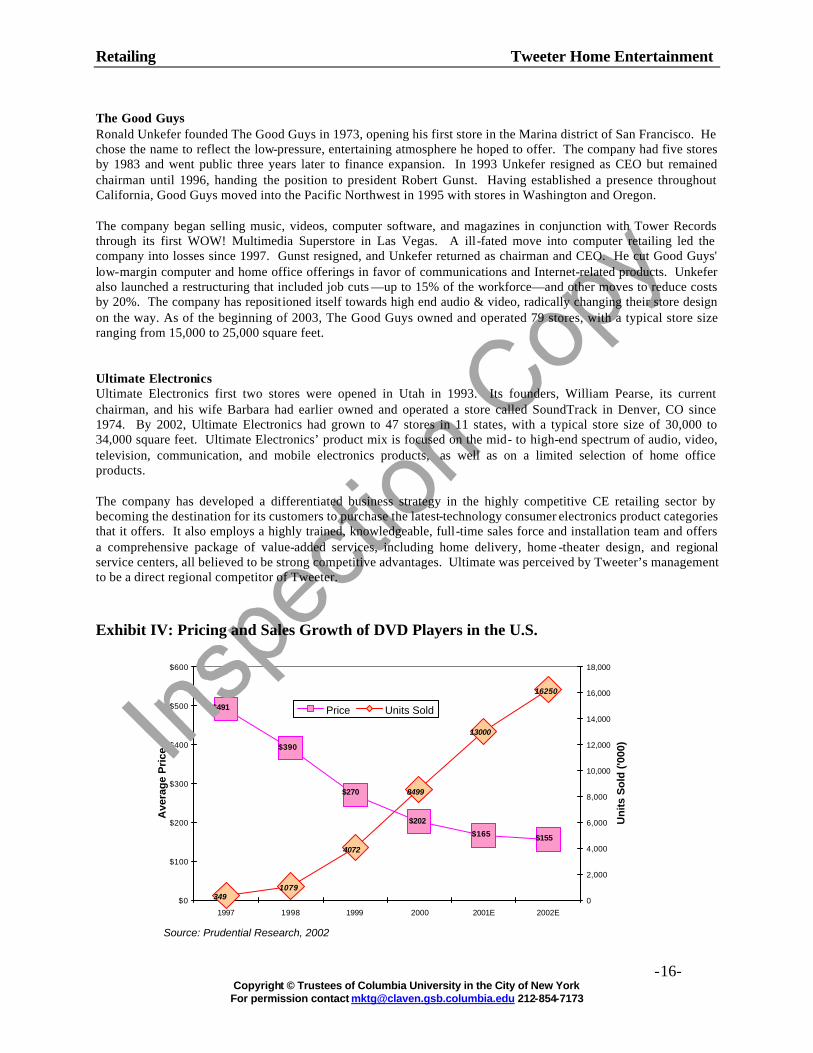
Source: Prudential Research, 2002
The Good Guys Ronald Unkefer founded The Good Guys in 1973, opening his first store in the Marina district of San Francisco. He chose the name to reflect the low-pressure, entertaining atmosphere he hoped to offer. The company had five stores by 1983 and went public three years later to finance expansion. In 1993 Unkefer resigned as CEO but remained chairman until 1996, handing the position to president Robert Gunst. Having established a presence throughout California, Good Guys moved into the Pacific Northwest in 1995 with stores in Washington and Oregon. The company began selling music, videos, computer software, and magazines in conjunction with Tower Records through its first WOW! Multimedia Superstore in Las Vegas. A ill-fated move into computer retailing led the company into losses since 1997. Gunst resigned, and Unkefer returned as chairman and CEO. He cut Good Guys' low-margin computer and home office offerings in favor of communications and Internet-related products. Unkefer also launched a restructuring that included job cuts —up to 15% of the workforce—and other moves to reduce costs by 20%. The company has repositioned itself towards high end audio & video, radically changing their store design on the way. As of the beginning of 2003, The Good Guys owned and operated 79 stores, with a typical store size ranging from 15,000 to 25,000 square feet. Ultimate Electronics Ultimate Electronics first two stores were opened in Utah in 1993. Its founders, William Pearse, its current chairman, and his wife Barbara had earlier owned and operated a store called SoundTrack in Denver, CO since 1974. By 2002, Ultimate Electronics had grown to 47 stores in 11 states, with a typical store size of 30,000 to 34,000 square feet. Ultimate Electronics’ product mix is focused on the mid- to high-end spectrum of audio, video, television, communication, and mobile electronics products, as well as on a limited selection of home office products. The company has developed a differentiated business strategy in the highly competitive CE retailing sector by becoming the destination for its customers to purchase the latest-technology consumer electronics product categories that it offers. It also employs a highly trained, knowledgeable, full-time sales force and installation team and offers a comprehensive package of value-added services, including home delivery, home -theater design, and regional service centers, all believed to be strong competitive advantages. Ultimate was perceived by Tweeter’s management to be a direct regional competitor of Tweeter. Exhibit IV: Pricing and Sales Growth of DVD Players in the U.S.
Retailing Tweeter Home Entertainment
-17- Copyright © Trustees of Columbia University in the City of New York For permission contact [email protected] 212-854-7173
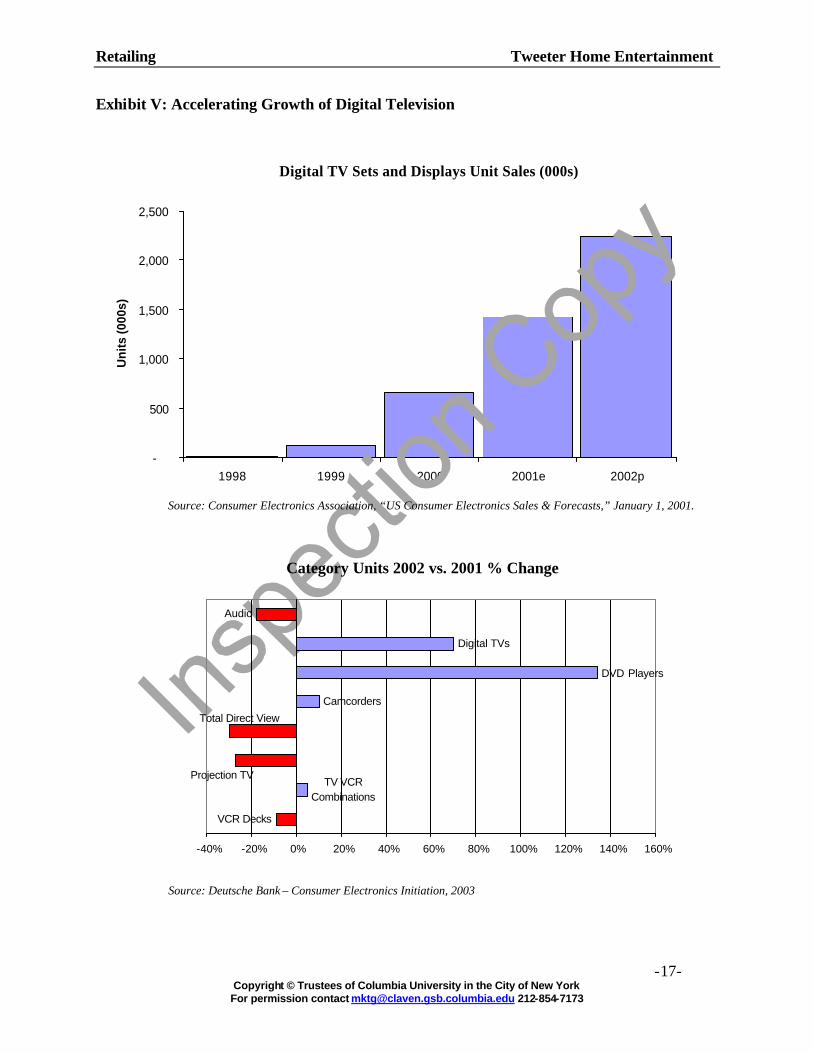
Digital TV Sets and Displays Unit Sales (000s)
-
500
1,000
1,500
2,000
2,500
1998 1999 2000 2001e 2002p
Uni
ts (0
00s)
Exhibit V: Accelerating Growth of Digital Television
Source: Consumer Electronics Association, “US Consumer Electronics Sales & Forecasts,” January 1, 2001.
Source: Deutsche Bank – Consumer Electronics Initiation, 2003
VCR Decks
TV VCR Combinations
Camcorders
DVD Players
Digital TVs
Audio
Total Direct View
Projection TV
-40% -20% 0% 20% 40% 60% 80% 100% 120% 140% 160%
Category Units 2002 vs. 2001 % Change

Retailing Tweeter Home Entertainment
-18- Copyright © Trustees of Columbia University in the City of New York For permission contact [email protected] 212-854-7173
Exhibit VI: Tweeter’s Acquisitions Timetable
Source: Tweeter S-1 and 10K filings, 1996 to 2002 Exhibit VII: Tweeter’s Store Footprint in 2002 Source: Tweeter 10K, 2002.
19 At the time of acquisition.
Date Company Name Number of stores19
Revenue Location Tweeter name change
APP implementation
05/96 Bryn Mawr 13 $35M PA YES YES 06/97 HiFi Buys 10 n/a GA NO YES 02/99 Home
Entertainment 9 $25M CA YES YES
07/99 DOW 7 $38M TX YES YES 04/00 United Audio
Ctrs. 7 $48M IL YES YES
10/00 Douglas TV 4 $30M IL YES YES 05/01 Big Screen 4 $16M CA YES YES 06/01 Audio Video 3 $15M NC YES YES 08/01 Sound Advice 32 $200M FLA AZ NO NO 03/02 Hillcrest 2 $14M TX NO NO
16
5
17
34
3 14 4
4 3
16 15
2
4
1 16-MA
1-RI 1-CT
6-MD
4-NJ
2-DE
1-NH

Retailing Tweeter Home Entertainment
-19- Copyright © Trustees of Columbia University in the City of New York For permission contact [email protected] 212-854-7173
Tweeter 1996 1997 1998 1999 2000 2001 2002Audio equipment 35% 33% 33% 32% 31% 28% 25%Video equipment 36% 36% 43% 42% 45% 50% 51%Other 29% 31% 24% 26% 24% 22% 24%
Best Buy 1996 1997 1998 1999 2000 2001 2002
Audio equipment 13% 12% 11% 11% 11% 11% n/a
Video equipment 18% 17% 15% 16% 19% 22% n/a
Other 69% 71% 74% 73% 70% 67% n/a
Circuit City 1996 1997 1998 1999 2000 2001 2002Audio equipment 19% 18% 18% 17% 16% 16% 15%Video equipment 30% 30% 31% 31% 32% 35% 39%Other 51% 52% 51% 52% 52% 49% 46%
Ultimate Electronics 1996 1997 1998 1999 2000 2001 2002Audio equipment 23% 22% 23% 24% 24% 22% 20%Video equipment 42% 42% 42% 46% 48% 51% 56%Other 35% 36% 35% 30% 28% 27% 24%
Good Guys 1996 1997 1998 1999 2000 2001 2002Audio equipment n/a n/a n/a 16% 18% 16% 15%Video equipment n/a 38% 41% 45% 53% 56% 58%Other n/a n/a n/a 39% 29% 28% 27%
Percentage of Retail Revenues by Product Category
Exhibit VIII: Sales Revenue by Product Category in the Audio & Video Segment Source: 10K filings, 1996 to 2002.

Retailing Tweeter Home Entertainment
-20- Copyright © Trustees of Columbia University in the City of New York For permission contact [email protected] 212-854-7173
Revenue Gross Operating Net # of Comps Revenue Gross Operating Net # of Comps Revenue Gross Operating Net # of Comps
$ MM Margin % Profit % Income % Stores Growth $ MM Margin % Profit % Income % Stores Growth $ MM Margin % Profit % Income % Stores Growth
1996 7,217 13.0% 1.7% 0.7% 251 5.5% 6,753 23.9% 4.7% 2.7% 419 5.0% 926 23.1% -1.0% -0.7% 75 -8.0%
1997 7,771 13.6% 0.7% 0.0% 272 -4.7% 7,154 24.0% 3.6% 1.9% 493 -8.0% 890 25.1% -2.1% -1.3% 76 -8.0%
1998 8,338 15.7% 2.0% 1.0% 284 2.0% 7,996 24.6% 3.2% 1.4% 556 -1.0% 928 24.6% -1.8% -1.3% 77 3.0%
1999 10,065 18.0% 3.5% 2.1% 311 13.5% 9,344 24.4% 4.1% 1.6% 587 8.0% 916 24.3% -4.4% -4.4% 79 -4.0%
2000 12,494 19.2% 4.3% 2.8% 357 11.1% 10,600 24.7% 5.1% 1.9% 616 8.0% 851 29.0% -2.0% -2.0% 79 5.0%
2001 15,327 20.0% 3.9% 2.6% 419 4.9% 10,460 24.1% 2.4% 1.1% 629 -4.0% 874 28.1% -0.1% -2.0% 79 2.9%
2002 17,115 21.2% 5.2% 3.3% 481 1.9% 9,590 24.4% 2.3% 1.3% 624 -10.0% 820 28.7% -4.3% -4.9% 79 -6.2%
Average 17.2% 3.0% 1.8% Average 24.3% 3.6% 1.7% Average 26.1% -2.3% -2.4%
Does not include MusicLand or Magnolia Hi-Fi Does not include CarMax Average store size is between 15,000 and 25,000 SF
Average store size is 45,000 square fee (SF) Average store size is between 40,000 and 60,000
Revenue Gross Operating Net # of Comps Revenue Gross Operating Net # of Comps
$ MM Margin % Profit % Income % Stores Growth $ MM Margin % Profit % Income % Stores Growth
1996 81 35.7% 2.4% 2.2% 33 5.6% 244 27.7% 2.7% 0.8% 18 -2.0%
1997 133 34.9% 1.5% 0.1% 47 -7.2% 254 26.5% 1.4% 0.1% 18 -16.0%
1998 229 35.4% 5.3% 2.4% 52 12.5% 298 27.0% 1.0% -0.2% 30 -6.0%
1999 280 35.9% 5.4% 3.2% 73 5.0% 329 29.0% 2.2% 0.7% 30 2.0%
2000 400 36.6% 6.4% 4.1% 90 13.5% 385 30.0% 4.0% 2.2% 31 16.0%
2001 540 35.6% 5.1% 3.1% 147 0.6% 484 31.4% 4.9% 3.0% 36 13.0%
2002 796 36.0% 3.7% 2.2% 167 -3.3% 580 31.0% 3.4% 2.1% 46 -2.0%
Average 35.7% 4.3% 2.5% Average 29.0% 2.8% 1.2%
Average store size is approximately 10,000 SF Average store size is 30,000 to 34,000 SF
* 2002 Net Income % excludes impairmen charge of $165MM. With the impairment charge, N/I % is -20%.
Good GuysBest Buy
Tweeter Ultimate Electronics
Circuit City
Exhibit IX: Trends in Performance—1996 to 2002
Source: 10K filings, 1996 to 2002

Retailing Tweeter Home Entertainment
-21- Copyright © Trustees of Columbia University in the City of New York For permission contact [email protected] 212-854-7173
Income Statement 1998 1999 2000 2001 2002
Total revenue $228,946 $279,562 $399,926 $540,123 $796,072 Cost of sales 147,938 179,227 253,672 347,942 509,258 Gross profit 81,008 100,335 146,254 192,181 286,814
Selling expenses 56,907 69,225 99,645 135,766 213,663 Corporate, general andadministrative expenses 11,128 14,822 19,342 26,250 41,437 Amortization of intangibles 917 1,056 1,522 2,380 1,573 Impairment charge -- -- -- -- 194,902 Income (loss) from operations 12,056 15,232 25,745 27,785 (164,761)
Income (loss) from joint venture -- -- 518 843 (26)Loss on investment -- -- -- 1,162 --Interest income (expense), net (2,737) (106) 1,147 692 (2,255)Income (loss) before income taxes 9,319 15,126 27,410 28,158 (167,042)
Income tax expense (benefit) 3,724 6,050 10,964 11,263 (1,913)Extraordinary item (340) -- -- -- --
Net income (loss) 5,255 9,076 16,446 16,895 (165,129)
Balance Sheet 1998 1999 2000 2001 2002
Current AssetsCash and cash equivalents $776,709 $999,495 $34,292,555 $3,277,969 $2,282,635 Accounts receivable 6,207,837 9,556,846 14,662,914 31,251,444 23,116,040 Inventory 38,362,311 62,135,516 85,967,261 129,172,638 143,234,060 Deferred tax assets 1,598,352 1,899,604 2,424,294 4,054,489 3,943,838 Prepaid expenses and other current assets 590,788 678,804 1,578,893 11,490,313 17,084,739 Total current assets 47,535,997 75,270,265 138,925,917 179,246,853 189,661,312
Property and equipment, net 23,978,118 34,243,241 51,937,902 109,141,981 134,310,705 Long-term investments -- 1,846,366 4,867,560 4,592,147 1,103,280 Intangible assets, net -- 7,604,832 2,606,667 Other assets, net 35,789 191,616 1,262,874 536,675 8,196,237 Goodwill, net 20,093,107 30,067,691 38,043,290 186,546,849 --
Total $91,643,011 $141,619,179 $235,037,543 $487,669,337 $335,878,201
Current LiabilitiesCurrent portion of long-term debt -- $35,551 $63,074 $305,594 $288,745 Amount due to bank 4,071,310 6,023,056 8,865,870 8,464,682 4,520,513 Accounts payable 10,663,216 18,377,139 21,499,910 50,650,219 51,550,051 Accrued expenses 12,006,824 16,197,306 19,509,166 34,816,712 27,449,859 Customer deposits 1,422,557 2,440,090 5,153,801 13,998,996 16,259,734 Deferred warranty 1,109,325 673,139 294,477 532,681 301,583 Total current liabilities 29,273,232 43,746,281 55,386,298 108,768,884 100,370,485
Long-Term Debt 5,250,000 5,716,805 13,638 35,936,306 50,073,501 Rent related accruals 2,821,202 3,197,657 3,489,645 9,326,705 10,338,737 Deferred warranty 1,066,251 338,238 72,504 1,048,562 484,673 Deferred tax liabilities 1,423,283 1,095,527 1,124,656 197,353 --Total other long-term liabilities 5,509,396 4,910,922 4,686,805 10,572,620 10,823,410 Total liabilities 40,032,628 54,374,008 60,086,741 155,277,810 161,267,396
Stockholders' Equity 53,617,198 89,158,036 176,845,695 334,269,784 176,462,712 Less treasury stock: and (2,006,815) (1,912,865) (1,894,893) (1,878,257) (1,851,907)Total stockholders’ equity 51,610,383 87,245,171 174,950,802 332,391,527 174,610,805
Total $91,643,011 $141,619,179 $235,037,543 $487,669,337 $335,878,201
Exhibit X: Company Financials 1998 to 2002
Source: Tweeter 10K filings
Retailing Tweeter Home Entertainment
-22- Copyright © Trustees of Columbia University in the City of New York For permission contact [email protected] 212-854-7173
Plasma HDTVs Comparison
0
5,000
10,000
15,000
20,000
25,000
30,000
0 5 10 15 20
Number of Models Offered
Pri
ce in
US$
Tweeter BestBuy Circuit City Good Guys
Single-Disc DVDs Comparison
0
200
400
600
800
1,000
1,200
0 5 10 15 20
Number of Models Offered
Pri
ce in
US$
Tweeter BestBuy Circuit City Good Guys
Exhibit XI: Industry Price Point Comparison for Select Product Categories Source: Internet comparison of products and prices in the week of May 9th, 2003

Retailing Tweeter Home Entertainment
-23- Copyright © Trustees of Columbia University in the City of New York For permission contact [email protected] 212-854-7173
Digital Camcorders Comparison
0
1,000
2,000
3,000
4,000
5,000
0 5 10 15 20 25 30
Number of Models Offered
Pric
e in
US$
Tweeter BestBuy Circuit City Good Guys
Surround Sound Systems Comparison
0
500
1,000
1,500
2,000
2,500
3,000
0 5 10 15 20
Number of Models Offered
Pric
e in
US$
Tweeter BestBuy Circuit City Good Guys
Exhibit XI (continued): Industry Price Point Comparison for Select Product Categories Source: Internet comparison of products and price made the week of May 9th, 2003

Retailing Tweeter Home Entertainment
-24- Copyright © Trustees of Columbia University in the City of New York For permission contact [email protected] 212-854-7173
Manufacturer Model Tweeter Best Circuit GoodBuy City Guys
Aiwa XDAX1 $90Apex AD-1200 $50Denon DVD-900 $250
DVD-1600 $450 $500DVD-2800 $700DVD-2900 $1,000DVD-3800 $1,200
Harman Kardon DVD-25 $300DVD-101 $350
Initial DVD-2540 $58JVC XV-N30BK $90
XV-N50BK $120 $120XV-N55SL $120XV-S402SL $130XV-S500BK $120
KLH KD-1220 $50Magnavox MDV-410SL $70
MDV-421SL $70Mintek DVD-1600 $50Mitsubishi DD-4030 $90
DD-6030 $180Panasonic DVD-S35S $100 $100
DVD-S55S $130DVD-RP62S $90DVD-RV32K $100 $90 $110
Philips DVD-Q35 $140DVD-Q50 $400 $300DVD-724AT $80DVD-795SA $250DVD-963SA $500
Pioneer DV-45A $500DV-47AI $1,000
Samsung DVD-P231P $90Sharp DV-S2U $180Sony DVP-NS315B $100
DVP-NS325S $100 $100 $100DVP-NS415S $130DVP-NS715P $150 $150DVP-NS725P $150DVP-NS755V $250 $250DVP-NS999ES $1,000
Toshiba SD-1800 $70SD-2900 $80SD-3900 $100 $100SD-4800 $180 $230
Zenith DVB-211 $79DVB-312 $80
Singe-Disc DVD Players
Manufacturer Model Tweeter Best Circuit GoodBuy City Guys
BenQ PDP46W1 $4,000Daewoo DP-42SM $3,300Hitachi 32HDT20 $5,000
42HDT20A $7,000Panasonic PT-37PD4-P $4,500 $4,600
PT-42PD3-P $5,000 $4,500 $5,000 $4,280PT-42PHD4-P $7,000 $6,700PT-50PHD4-P $10,000 $10,000
Philips 32FD9954 $4,000 $4,00042FD9954 $5,500 $5,50042FD9934 $6,50050FD9955 $10,000
Pioneer PDP-4330HD $8,000 $7,000 $6,700PDP-5030HD $10,000 $10,000PDP-610MX $24,000PRO-800HD $9,000PRO-1000HD $12,000
Sampo PME-42S6 $3,300Samsung HPL5025K $10,000
SPL4225K $3,200 $3,700SPN4235 $4,000 $5,000
Sony KE-32TS2 $5,000 $5,000 $5,000KE-42TS2 $7,000 $7,000
Toshiba 42HP82 $7,00050HP82 $10,000
Viewsonic VPW425 $3,500VPW505 $8,000
Plasma HDTVs
Exhibit XI (continued): Industry Price Point Comparison for Select Product Categories Source: Internet comparison of products and price made the week of May 9th, 2003

Retailing Tweeter Home Entertainment
-25- Copyright © Trustees of Columbia University in the City of New York For permission contact [email protected] 212-854-7173
Manufacturer Model Tweeter Best Circuit GoodBuy City Guys
Athena Point 5 II $500Bose AM6 IIIB $700
AM10 IIIB $1,000 $1,000AM15 II $1,300 $1,300 $1,300AM16B $1,500VCS-30II $320
Boston Acoustics SYS-8000B $500SYS-9000B $1,000SYS-9500B $1,500
Denon TAKE-1603 $1,000 $1,000Energy TAKE-5 $600
TAKE-6 $700Harman Kardon HKT-S6 $400Infinity HTS-20 $600Jensen JHT-525 $130JBL SCS-135SI $350
SCS-150SI $500NSP1 $400
Kenwood HTB-205 $300HTB-505 $400
KHL HT-300AW $180HT-9930 $100
Magnavox MMX-45037 $250Onkyo GXW-51 $250
HTS-650 $550SKS-HT500 $300
Panasonic SC-HT400 $400Polk RM-6005 $300
RM-6700 $600RM-7200 $1,300
Sharp SD-AT1000 $300Sony HTDD-W750 $300
HTDD-W840 $400 $400SAVE-335 $300SAVE-445 $400SAVE-535 $500
Tivoli TDHT1 $280TDHT1S $280
Velodyne 80-DECO8 $1,200Wharfedale MOVIESTAR 60 $400Yamaha YHT-340 $400
NS-P220 $200
Home Theater Systems (w/out DVD)
Manufacturer Model Tweeter Best Circuit GoodBuy City Guys
Canon XL1S $4,500GL2 $2,800ELURA 40MC $1,000OPTURA 20MC $900 $900OPTURA 200MC $1,500ZR-60 $500 $500ZR-65MC $600 $600ZR-70MC $700 $700 $700
Hitachi DZ-MV350A $900DZ-MV380A $1,000
JVC GR-D30 $400GR-D70 $500 $500 $500GR-D90US $600 $600 $600GR-DV500U $700GR-DV800U $800 $800GR-DV2000U $1,600GR-DV3000U $1,500GR-DX95 $800
Panasonic PV-DV53 $400PV-DV102 $500 $600PV-DV103 $500PV-DV203 $600PV-DV402 $700 $800PV-GS50S $700PV-VM202 $2,000
Samsung SC-D23 $400SC-D27 $500
Sharp VL-Z5U $600VL-Z7U $700
Sony DCR-PC101 $1,000 $1,000DCR-PC120 $1,800DCR-TRV19 $600 $600DCR-TRV22 $700 $700 $700DCR-TRV33 $800 $800DCR-TRV38 $900 $900 $900DCR-TRV39 $1,000DCR-TRV50 $1,600DCR-TRV70 $1,300DCR-TRV80 $1,500 $1,500DCR-TRV950 $2,000DCR-VX2000 $3,000 $3,000 $3,000
Digital MiniDV Camcorders
Exhibit XI (continued): Industry Price Point Comparison for Select Product Categories Source: Internet comparison of products and price made the week of May 9th, 2003
Retailing Tweeter Home Entertainment
-26- Copyright © Trustees of Columbia University in the City of New York For permission contact [email protected] 212-854-7173
Customer Count Store Count
1998 2002 9/98 9/02 Region 1 176K 169K 24 30 Region 2 89K 102K 18 25 Region 3 105K 98K 10 20
Region 5 19K 37K 7 11 Region 6 57K 54K 9 14 Region 8 47K 51K 7 12
TOTAL 493K 511K 75 112
Exhibit XII: Tweeter (TWTR) Stock Price Performance Relative to an Index of Best Buy, Circuit City, Ultimate Electronics and The Good Guys, 12-02 to 4-03
Source: Bloomberg
Exhibit XII: Tweeter’s Declining Customer Count per Store in Select Regions, 1998 to 2002
Source: Information provided by Tweeter management .
Relative Stock Price Performance
0%
20%
40%
60%
80%
100%
120%
Tweeter
Index: Best Buy, Circuit City, Ultimate, Good Guys)
Retailing Tweeter Home Entertainment
-27- Copyright © Trustees of Columbia University in the City of New York For permission contact [email protected] 212-854-7173
-
50
100
150
200
250
300
350
April 2001 (pre-acquisition) Last Twelve Months, Dec 200220.0%
22.0%
24.0%
26.0%
28.0%
30.0%
32.0%
34.0%Number of Stores
SG&A in millions
SG&A as % of sales
Sound AdviceSound Advice
Tweeter
TweeterCombined
Combined
Exhibit XIV: SG&A Analysis Before and After Acquiring Sound Advice
Source: Tweeter and Sound Advice 10K filings
Retailing Tweeter Home Entertainment
-28- Copyright © Trustees of Columbia University in the City of New York For permission contact [email protected] 212-854-7173
Typical AssumptionsBase Case Store Data % Sales basis
SALES - TOTAL 4,873,614$ COGS - TOTAL 3,095,067$ 63.5%GROSS MARGIN 1,778,547$ 36.5%TOTAL PAYROLL 543,750$ 11.2%TOTAL FRINGE 110,543$ 20.3%*TOTAL COMPENSATION 654,293$ 13.4%TOTAL SUPPLIES 19,760$ 0.4%TOTAL SMALL ASSETS 1,329$ 0.0%TOTAL MAINTENANCE 7,644$ 0.2%TOTAL BANK CHARGES 117,483$ 2.4%TOTAL OTHER EXPENSES 7,839$ 0.2%TOTAL UTILITIES 45,145$ 0.9%TOTAL CONTROLLABLE 853,494$ 17.5%NET DEPARTMENT OPERATING CONTRIBUTION 925,053$ 19.0%TOTAL RENT 213,468$ TOTAL DEPRECIATION & AMORTIZATION 67,829$ Fixed CostsTOTAL INSURANCE 22,140$ TOTAL ADVERTISING 72,360$ TOTAL VEHICLES -$ TOTAL NON-CONTROLLABLE EXPENSES 375,797$ NET INCOME BEFORE INTEREST AND TAXES 549,256$ 11.3%* Based on % of payroll
AssumptionsSales Up 15%, Gross Margin Down 2% Improvements % Sales basis
SALES - TOTAL 5,604,657$ COGS - TOTAL 3,671,420$ 65.5%GROSS MARGIN 1,933,236$ 34.5%TOTAL PAYROLL 591,042$ 10.5%TOTAL FRINGE 120,158$ 20.32%*TOTAL COMPENSATION 711,200$ 12.7%TOTAL SUPPLIES 22,724$ 0.4%TOTAL SMALL ASSETS 1,528$ 0.0%TOTAL MAINTENANCE 8,791$ 0.2%TOTAL BANK CHARGES 135,106$ 2.4%TOTAL OTHER EXPENSES 9,015$ 0.2%TOTAL UTILITIES 51,917$ 0.9%TOTAL CONTROLLABLE 940,281$ 16.8%NET DEPARTMENT OPERATING CONTRIBUTION 992,955$ 17.7%TOTAL RENT 213,468$ TOTAL DEPRECIATION & AMORTIZATION 67,829$ Fixed CostsTOTAL INSURANCE 22,140$ TOTAL ADVERTISING 72,360$ TOTAL VEHICLES -$ TOTAL NON-CONTROLLABLE EXPENSES 375,797$ NET INCOME BEFORE INTEREST AND TAXES 617,158$ 11.0%* Based on % of payroll
Total Net Income Improvement for Store $67,902% Net Income Increase 12.4%
Total number of stores 174 Potential Impact Across Company $11,814,908
EPS IMPACT $ $0.47EBIT IMPACT % 39.2%
Gross Margin drop: 2%Leads to
Sales increase: 15%
Exhibit XV: Management Sensitivity Analysis of Income Source: Excel file of sensitivity analysis provided by Tweeter.