TURKISH EXPORTERS ASSEMBLY ECONOMY AND … Trade... · In line with this goal, Turkish Exporters...
144
Turkish Exporters Assembly Dış Ticaret Kompleksi Çobançeşme Mevkii Sanayi Cad. B Blok Kat:9 (34196) Yenibosna-İstanbul Tel: 0212 454 04 90 / 454 04 91 Faks: 0212 454 04 13 / 454 04 83 [email protected] Production This report was prepared for publıcatıon by Küçük MucızelerYayıncılık ve İletişim Hızmetlerı on behalf of TEA. www.kucukmucizeler.com ECONOMY AND FOREIGN TRADE REPORT 2016 TURKISH EXPORTERS ASSEMBLY
Transcript of TURKISH EXPORTERS ASSEMBLY ECONOMY AND … Trade... · In line with this goal, Turkish Exporters...

Turkish Exporters Assembly Dış Ticaret Kompleksi Çobançeşme Mevkii
Sanayi Cad. B Blok Kat:9 (34196) Yenibosna-İstanbulTel: 0212 454 04 90 / 454 04 91
Faks: 0212 454 04 13 / 454 04 [email protected]
ProductionThis report was prepared for publıcatıon by Küçük MucızelerYayıncılık ve İletişim Hızmetlerı on behalf of TEA.
www.kucukmucizeler.com
ECONOMY AND FOREIGN TRADE REPORT
2016
TURKISH EXPORTERS ASSEMBLY


ECONOMY AND FOREIGN TRADE REPORT 2016
MINISTER OF ECONOMYNİHAT ZEYBEKCİ
Countries, organizations and companies have to make an objective reckoning of the past in order to become more powerful economically and to progress further. In this context, problems encountered in the past must be assessed objectively as much as the successes achieved and lessons must be derived from them. In the global trade, there might be years of rapid growth and development as well as years which the markets do not wish them to be repeated. Unfortunately, 2015 was not a very bright year for the global trade. All economies, from the biggest ones down to the smallest ones, had a very bumpy period because of the risks they encountered in the economic and the political arenas. According to the temporary data provided by World Trade Organizations, it is estimated that the global export had a very sharp fall of 11% in 2015. Our country, which is integrated with the world trade network, was unfortunately directly impacted by these adverse developments. In 2015, our exports have become 143.9 billion dollars, imports 207.2 billion dollars. On the other hand, the rate of exports meeting imports has risen to 69.5 % from the 2014 figure of 65.1%.The process of change and progress that began in 2000’s has brought about a quantitative increase as well as a qualitative transformation in our export; with the contribution of exports, the Turkish economy has made a technological progress and gained depth and dynamism. Also, our country has become an active player of the global trade that makes exports to all countries of the world. Furthermore, the developments in the product diversification and market growth play a significant role for our country’s export to become powerful on the global basis. While the number of countries to which exports over 1 billion dollars was made was 8 in 2002, this number became 32 in 2015. Similarly, while the number of products which were exported in amounts over 1 billion dollars was made was 9 in 2002, this number went up to 31 in 2015.As a result of the activities we have carried out for the purpose of developing our export qualitatively even more, while increasing it in value; we have determined the Target and High Priority Countries on which we can focus in the next period. We designed detailed market penetration plans for these
countries and in this context; we carry out many activities such as sectoral board programs, procurement boards, fair organizations and promotion group operations. In addition, we aim to increase our export unit price with our supports for design, branding efforts and support programs. With the bilateral and multi-lateral negotiations we execute, our efforts to eliminate the obstacles that our exports encounter in foreign markets continues without reducing speed. In this context, in order to facilitate the access of our exporters to new markets, we attach a distinct priority to signing Free Trade Agreements and expanding the scopes of our existing agreements.Furthermore, in order to achieve the status of a country having a say in the global economy, it is very important that our country become an attractive location for especially technology-focused investors. In order to achieve this, the significance of structural reforms and incentive programs to be implemented is quite high. As a matter of fact, it is very important to establish investment basins in our country with our province-based regional incentive system with a dynamic structure, to provide clustering for increasing the efficiency, and to attract large-scale investments that will decrease the dependence of our sectors with growth potential on intermediate goods and provide competitive advantage by increasing the technology and R&D capacity. As a result of the efforts we have made for this purpose, we became one of the most favorite countries of the foreign investors and we have attracted a direct international investment of 165.4 billion dollars in total since year 2002. Cyclical fluctuations are a natural outcome of free market economy. For this reason, preparing our economy for all possible adverse developments and taking precautions is the most important duty of the government bodies. By way of this awareness, our economy will become resistant to all kinds of problems we might face.We made significant progress to strengthen our economy with the reforms we have implemented for many years; from now on, also we will continue to go forward with the same determination and work together with our exporters to achieve the 2023 targets. I congratulate the Turkish Exporters Assembly that prepared this excellent survey that makes a detailed analysis of the events of 2015 and thank everybody who contributed to it.
Turkish Economy gained depth and dynamism
3


ECONOMY AND FOREIGN TRADE REPORT 2016 5
CHAIRMAN OF TIM MEHMET BÜYÜKEKŞİ
We believe that it of significant importance that Turkey, a major player of the global economy, develop correct policies by analyzing at the right place and at the right time the dynamics that give direction to the global trade. In line with this goal, Turkish Exporters Assembly, as the representative of 63 thousand exporters, continues to examine our export and foreign trade very closely this year, as we have done in 2014 and 2015. In “Economy and Foreign Trade Report 2016”, which is the third report we have published, we analyze the basic macroeconomic developments in the global economy and Turkish economy in detail and evaluate the developments in the last 3 years. We believe that our report is a guide survey for Turkey’s foreign trade.2015 was quite a difficult year for the world economy. Exchange rate effect, decline in goods prices and geopolitical problems caused a serious setback in the world trade. According to the World Trade Organization data, world trade shrank 11% in 2015. The setback in our country’s export on dollar basis occurred at a good point compared to the other leading countries and became 8.7%. This situation caused our country to increase its share in the world trade. Among 71 World Trade Organization countries, the share we receive from the world trade volume broke a record with 0.95 percent. Similarly, the share we get from EU market reached its peak points in history with 1.21%.With year 2106, we observe that the risks in the global economy continue. IMF has revised the global growth expectations for years 2016 and 2017 0.2 points downwards and lowered them to 3.4% and 3.6% respectively. World Bank and OECD brought down the expectations for the next period. Even though the expectations in the global economy are being revised downwards, as Turkey, we continue to raise our export targets even higher. As of January 11, 2016, our export
target for 2016 revised within the scope of 2016-2018 Medium Term Program was raised from 150 billion dollars to 155.5 billion dollars. We see that with the targets aimed at export being raised, the contribution of net export to growth will be positive. As the Turkish Exporters who reach ever point of the world and who did not leave even one customs port through which export was not made, we believe that we will achieve the 2016 targets As Turkish Exporters Assembly, we continue to work for production of high value added goods and proliferation of innovative ideas. We felt great happiness in that our recommendations were included in the R&D reform package announced by our Prime Minister on January 14.We are working on the project related with opening 250 R&D and 500 Design centers. Turkish Innovation Week, İnova-LİG and İnovaTİM projects continue at full speed.We are planning to increase the number of enterprise houses we have opened in 2015 to nine in 2016.In 2016, we are planning to make trade board visits to 34 countries that make up about one third of the world trade and about half of the world economy. We are beginning to implement our Turkey Trade Centers project that we are progressing with 365 days of fair logic. Another issue that we attach great importance for our country is the updating of Customs Union agreement. We are conducting a comprehensive study with the Ministry of Economy that describes the impact of the agreement on our country in case of a possible updating of Customs Union agreement.We hope that year 2016 will be year when we approach our targets even more and a year full of successes. In this context, I would like to thank everybody who made contribution to this work that we believe will shed light on the foreign trade developments in 2015 and will make significant contribution to our 2023 targets.
Our Foreign Trade and Economy Report Completes its 3rd Year

6
›Turkey continues to realize the highest integration with the global economy and markets in the field of goods trade.With this integration Turkey became the 31st largest exporters and 21st largest importer of the world in 2015.Turkey continues its efforts to reach the target of 500 billion dollars of export that it has set for year 2023.The 2023 export strategy that has been implemented in this framework constitutes a significant road map for foreign trade. Monitoring of the export and foreign trade realizations and evaluations as well as making improvements in the export strategy have great importance for Turkey to reach its long term export targets.
Economy and Foreign Trade Report has been prepared for the purpose of analyzing Turkey’s economic and, in particular, foreign trade data and aims to provide contribution especially in the implementation of general and sectoral foreign trade policies.Economy and Foreign Trade Report consists of eight sections. In each section world trade and Turkey’s foreign trade are examined in detail and developments in the last 3 years are evaluated.We hope that Economy and Foreign Trade Report will make contributions to Turkey’s 2023 export strategy and export targets.
RespectfullyDr. Can Fuat GÜRLESEL
PREFACE

ECONOMY AND FOREIGN TRADE REPORT 2016 7
14 I. DEVELOPMENTS AND TRENDS IN THE WORLD ECONOMY14 I.1 Basic Developments In The World Economy And Their Impacts On The World Trade14 I.1.1 Growth In World Economy16 I.1.2 General Trends In The World Economy17 I.1.3 Impacts Of Developments In World Economy On World Trade18 I.2 Developments In World Trade Volume19 I.3 General Trends In World Trade20 I.4 Exports According To Regions And Countries21 I.5 Imports According To Regions And Countries23 I.6 Exports According To Sectors
26 II. TURKISH ECONOMY AND DEVELOPMENTS IN FOREIGN TRADE26 II.1 Economy Policies In Turkey And Determining Factors26 II.2 Developments In Main Economic Indicators27 II.3 Central Bank Monetary Policy And Financial Indicators29 II.4 Developments In Main Foreign Trade Indicators30 II.5 Net Exports And Its Contribution To Economic Growth30 II.6 Current Accounts Balance And Goods Trade31 II.7 Developments In Economic Activities And Exports-Imports Relation31 II.7.1 Exports And Economic Activities33 II.7.2 Imports And Economic Activities
36 III. EXPORTS36 III.1 Main Export Indicators36 III.1.1 Total Exports And Our Place In World Goods Exports38 III.1.2 Exports By Economic Activities And Large Economic Groups Classification 39 III.1.3 Exports By Currency Types And Exports With TL 39 III.1.4 Exports By Payment Methods And Transportation Modes40 III.2 Manufacturing Industry Exports By Technology Intensiveness 41 III.3 Price And Quantity Developments In Exports43 III.4 Exports In Provinces44 III.5 Exports By Country Groups And Countries44 III.5.1 Exports By Country Groups46 III.5.2 Exports By Countries 46 III.6 Exports By Firm Scales And Concentration In Exports 49 III.7 Exports By Sections And Subsections49 III.7.1 Exports By Main Sections50 III.7.2 Exports By Subsections 64 III.8 Exports By Countries And Sections
80 IV. IMPORT 80 IV.1 Basic Import Indicators80 IV.1.1 Total Import And Our Position In The Goods Import Worldwide 82 IV.1.2 Import According To Economic Activities And Classification Of Large Economic Groups 83 IV.1.3 Import In Foreign Currency And TL 84 IV.1.4 Import According To Payment Modes And Transport Means 85 IV.2 Import Of Manufacturing Industry In Terms Of Technology 85 IV.3 Developments In Process And Amounts Of Import 87 IV.4 Import In Provinces 87 IV.5 Import According To Country Groups And Countries 87 IV.5.1 Import According To Country Groups 88 IV.5.2 Import According To Countries 89 IV.6 Import And Export Concentration According To Scales Of Firms90 IV.7 Import According To Main And Sub-Section Groups 90 IV.7.1 Import According To Main Sections 91 IV.7.2 Import According To Sub-Sections 104 IV.8 Import Basing On Countries And Sections
120 V. NET EXPORT120 V.1 Net Export In Terms Of Countries 120 V.2 Net Export In Terms Of Sections124 V.3 Net Export Analysis In The Context Of Countries And Sections125 V.3.1 Evaluation Of Countries On Sections Basis125 V.3.2 Evaluation Of Sections On Country Basis
130 VI. FOREIGN TRADE POLICY OF TURKEY 130 VI.1 General Evaluation 130 VI.2 Customs Union With Un And Foreign Trade131 VI.3 Foreign Trade With Regional Establishments133 VI.4 Free Trade Agreements And Foreıgn Trade Effect134 VI.5 Supports And Effects Of Foreign Trade
136 VII. EVALUATION FOR LONG TERM EXPORT GOALS 136 VII.1 Global Propensities And Their Effects On Turkey136 VII.2 Export Performances Of Countries In Global Scale 138 VII.3 Turkey’s 2023 Export Goals And Realizations
144 VIII. STRATEGIC EVALUATION AND RECOMMENDATIONS
TABLE OF CONTENTS

EXECUTIVE SUMMARY
8
›
1. World Economy Grows Below Expectations Again in 2016 World economy had a growth of 2.5 percent in 2015, again below the expectations and below its potential. Developed countries had a growth of 1.9 percent in 2015 after their growth of 1.8 percent in 2014. Performance of the developing countries weakened in 2015. Developing countries had a growth of 4.0 percent in 2015.
2. Six Main Distinctive Trends Experienced in World Economy in 2015 Six main tends are: monetary policies of developed countries, transition to new growth model and eco-nomic slowdown in Chinese economy, new global financial conditions and sharp decline in goods prices, excessive setback in oil prices, concern for deflation in developed countries and geopolitical developments.
3. Developments and Trends in World Economy Affect World Goods Trade Directly or Indirectly Acceleration of growth in developed countries af-fected world goods trade positively. In Euro zone, growth caused increase in imports first time after a long period and made a positive contribution to the world trade. Slowdown in China and develop-ing countries are limiting the demand. Decline in oil prices and other goods are causing decrease in trade. Geopolitical developments are limiting the trade possibilities. Deflation tendency is limiting the trade size by lowering the prices of commercial goods.
4. World Goods Trade Shrinks 10.9% in 2015 After three years of slow down, world goods trade has shrunk 10.9 percent in 2015. Due to this slow down, world goods trade went down to 16.48 tril-lion dollars in 2015, while it was 18.49 trillion dol-lars in 2014. Quantitative growth continued in world goods trade in 2015 and increased 2.8 percent quantitatively.
5. Prices of Goods Used in World Trade Fall Significantly in 2015 Price of oil and energy products used in trade fell 14.4 percent on average in 2015 compared to the previous year. Also, the prices of metals and other commercial goods fell 11.0 percent compared to the previous year. Average prices of manufacturing industry products decreased 2.0 for the first time after a long period.
6. There Are Important Tendencies in World Goods Trade Whose Impacts Were Felt in 2015 Slowdown in developing countries is limiting the demand. Growth in developed countries is gen-erating demand in imports. Oil and goods prices may remain low for a long time. Inactive capaci-ties are limiting the demand for investment goods. Commercial flexibility of income growth is de-creasing. Slowdown in China is limiting the export growth to this country. Regional and new genera-tion trade agreements are emerging.
7. Exports Decrease in All Sectors The most important determining factor in 2015 as of the sectors was the decrease in the prices of commercial goods. Accordingly exports decreased in all of the agricultural raw materials and food ag-ricultural goods, oil-natural gas- mining products and industry products.
8. Economic Growth Recovers in Turkey With two general elections, acts of terror and geo-political developments 2015 was a relatively static year for economic activities. In spite of this, eco-nomic growth recovered gradually in 2015 especial-ly with the increase in the internal consumption.
9. Turkish Lira Depreciates 20 percent in 2015 In 2015, Turkish Lira depreciated 20 percent in steps on basket basis in general. Turkish Lira’s principal loss of value occurred against dollar with the set-back in Euro-Dollar exchange rate. Central Bank’s remaining unresponsive to the depreciation of Turk-ish Lira accelerated its decrease of value.
10. Global and Regional Events Affect Foreign Trade Setback in global goods trade, especially on value basis affected the foreign trade indicators of Turkey, also. While setback was experienced on value ba-sis, quantitative expansions remained very limited. Developments in exchange rates and declines in energy and goods prices were also decisive. Espe-cially, decrease in energy prices was influential in the reduction of the imports. An important factor affect-ing the export was the geopolitical events emerging in important export markets.
11. Exports, Imports and Foreign Trade Deficit Decrease Together In 2015, exports declined 8.7 percent and became 143.9 billion dollars. Imports decreased 14.5 percent
INTRODUCTION

ECONOMY AND FOREIGN TRADE REPORT 2016 9
and fell down to 207.2 billion dollars. Foreign trade deficit was reduced to 63.3 billion dollars. The rate of exports meeting imports reached its peak value of the last four years with 69.6 percent.
12. Net Exports’ Contribution to Growth Negative In the evaluation of economic growth regarding the sources, net exports’ contribution was negative in 2015. Despite a real growth rate of 3.98 percent, net exports made a contribution of 0.30 points in 2015.
13. Decrease of Deficit in Goods Trade Lowers Current Accounts Deficit While goods trade balance and other income-ex-penditure balance have a deficit in Turkey’s current accounts balance, services balance and current transfer balance have a surplus. In 2015, goods trade balance decreased to 47.8 billion dollars, pro-viding the best recovery in the current accounts bal-ance.
14. Setback in Exports Below World Exports Setback Both the world exports and Turkey’s exports declined both in 2015. Decline in Turkey’s exports of 8.7 percent in value remained below the 10.9 percent reduction of world exports
15. Our Share in World Goods Trade Rises to 0.87 Percent Turkey’s share in world goods trade rose to 0.87 per-cent in 2015. This share was 0.83 in 2013 and had increased to 0.85 in 2014. With our exports having a decline less than the reduction in the world goods trade, our share went up to 0.87 percent in 2015.
16. Our World Export Ranking of 31 Remains Same in 2015 Turkey kept its ranking at the 31st palce in the world exports with 143.9 billion dollars realized in 2015 and its ranking remained the same. Compared the top largest 30 exporters, Turkey is among the coun-tries whose decrease of exports remained limited in 2015, with 8.7 percent.
17. Highest Export Made in Low Technology Products Turkey’s manufacturing industry products exports were 134.5 billion dollars in 2015. The highest share in manufacturing industry products belongs to low technology products with 35.0 percent. On the other
hand, the share of high technology products rose from 3.4 percent to 3.7 percent.
18. Exports Increase in Limited Quantity in 2015 Turkey’s exports increased 2.0 percent in quantities in 2015. Despite the reduction in global demand in the last two years, quantity of exports is increasing.
19. Setback in Turkey’s Unit Exports Value Below Setback in World’s Unit Exports Value The setback in Turkey’s unit exports value remained below the setback in world’s unit exports value in 2015. The most important reason for this is that while significant reductions occurred in energy and goods prices in the world, Turkey is not dependent on the exports of these products and export manu-facturing industry products to a large extent.
20. Setback Higher in Important Exporter Provinces Besides Istanbul Exports declined in all of the 20 provinces that make the highest exports in 2015. The intensity of decline had significant differences among the provinces. While the exports of Istanbul, the largest exporter province, decreased 6.1 percent, the decrease in important exporter provinces such as İzmir, Kocaeli, Ankara, Denizli, Kayseri, Sakarya, and Tekirdağ had double digit values.
21. Exports to European Union Decrease 4.5 Billion Dollars in Terms of Dollars, Euro-Dollar Exchange Rate Influential in Decrease, Exports Increase 11.2 Percent in Terms of Euro Turkey’s exports to European Union increased 11.2 percent in 2015 and went up from 51.7 billion Euros to 57.7 billion Euros. However, while the Euro-Dollar exchange rate annual average was 1.3250 in 2014, it went down to 1.1130 in 2015. If the average ex-change rate had remained at 1.3250 in 2015, Tur-key’s exports to European Union would have risen to 76.5 billion dollars. The loss due to exchange rate difference was 12.4 billion dollars.
22. Share of EU Countries Rise to 44.5 Percent Among the country groups the share of EU coun-tries continued to rise in 2015 and reached the level of 44.5 percent. The share of Middle East countries fell down to 21.6 percent. The share of other European countries is seen to have reached 9.8 percent. North American countries’ share is 4.9 percent; Asian countries’ share remains below their potential with 7.2 percent.

10
›
23. Our Share in Top 30 Countries Export Market Rises 0.6 points The share of our export market in top 30 countries in the total exports increased 0.6 points to reach 78.5 percent. It is seen that Turkey’s exports are depend-ent on susceptible to the same markets and need new markets.
24. Number of Firms Exporting Over 1 Billion Dollars in 2014 is 9 The number of firms exporting over 1 billion dollars in 2014 became 9. Number of firms making exports between 100 million dollars and 1 billion dollars was 136. These 145 firms making exports over 100 mil-lion dollars make 38.1 percent of the total exports.
25. Turkey’s Imports Decline Faster World goods imports decreased 10.9 percent in val-ue in terms of dollars in 2015. Turkey’s imports de-creased 14.5 percent in 2015. Turkey’s imports had a higher decline than the decline in world goods im-ports. Turkey’s high dependence on energy imports had a role in this, whose prices had a significant de-crease.
26. Turkey’s Share in World Goods Imports Falls Down to 1.24 Percent Turkey’s goods imports share in world goods im-ports fell down to 1.24 in 2014, which was 1.29 in 2014. In the last two years Turkey’s share in world goods imports decreased 0.11 points.
27. Turkey Becomes Twenty First Largest Importer of the World Turkey is placed within the first twenty countries among the goods importer countries of the world. In 2014, it became the 20th largest importer of the world. In 2015, became the 21st importer of the world with the decline in its imports
28. Turkish Lira’s Share of Use in Imports Rises The share of imports made with Turkish Lira contin-ues to rise. In 2015, the amount of imports made with TL was 13.6 billion dollars. The share of imports with made Turkish Lira rose up to 6.5 percent.
29. Medium-High Technology Products Has The Highest Share In The Total Imports Of TurkeyMedium-High technology products had the highest share in the total imports of Turkey. The imports of medium-high technology products totaled 73.9 bil-lion dollars despite a decrease of 6.6 percent in 2015 and its share in the total imports rose to 44.3 percent.
30. Imports Increase 1.7 Percent in Value in 2015 Turley’s imports fell down 14.5 percent in 2015 in value and became 207.2 billion dollars in 2015. How-ever, in quantity, Turkey’s imports increased 1.7 per-cent in 2015. In spite of the precautions taken in the economy, there was no decrease in the imports in quantity in the last four years.
31. Imports Decline in 18 of Largest 20 Importers While the imports declined in 2015 in general, prov-inces had a similar performance. Among 20 prov-inces that make the largest amount of imports, 18 of them had decreased imports; only Antalya and Kocaeli had increased imports.
32. Highest Decline in Imports From Near and Middle East Countries Turkey’s imports decreased from all country groups in 2015. This decrease occurred at different rates among country groups. This difference was caused by the fact that energy, commercial goods and man-ufacturing industry products were imported. As a matter of fact, imports from near and Middle East countries fell by 33.7 percent, from which oil and natural gas are imported.
33. Expansion Effect of Reciprocal Trade of Customs Union with European Union PreservedThe expansion effect of reciprocal trade of cus-toms union with European Union is being preserved. Based on these, the share of foreign trade volume made with EU in the Turkey’s foreign trade volume is increasing again since 2013. This ratio increase gradually and went up to 40.6 percent in 2015.
34. Decline in Foreign Trade with Regional Bodies and Organizations The share of Turkey’s foreign trade with the regional bodies in the total foreign trade volume declined in the last three years. In 2015 the share of Black Sea Economic Cooperation Organization fell down to 13.2 percent, Economic Cooperation Organization’s share to 5.4 percent and Islam Cooperation Coop-eration’s share decreased to 18.6 percent.
35. Foreign Trade in FTA Scope Still Remains Limited The share of exports made to FTA countries in the total exports increased to 1.4 percent in 2015. The share of imports declined to 8.0 percent. Its share in total foreign trade volume rose to 10.5 percent. It is seen that the foreign trade volume within the FTA scope remained limited.
INTRODUCTION
11ECONOMY AND FOREIGN TRADE REPORT 2016
36. Foreign Trade with Countries in FTA Scope Gives Surplus While the total foreign trade made with FTA coun-tries had a deficit of 1.62 billion dollars in 2014, it had a surplus of 3.73 billion dollars surplus in 2015. However, this was caused by the significant increase in the gold exports to Switzerland, which is included in EFTA countries.
37. Ratio of Total Export Supports to Exports Remain Low Total export supports in terms of dollars are calculated to be 550.3 million dollars in 2014 and 435.8 million dol-lars in 2015. The ratio of total export supports to exports fell down to 0.30 percent. The ratio of total export sup-ports to exports is decreasing and continues to remain low.
38. Performances of EU Countries and Energy and Goods Exporter Countries Weaken Evaluating the exports performances of 30 largest ex-porter countries between 2008-2015, it is seen that the export shares of 15 countries increased and shares of 15 countries decrease. Export shares of countries de-pendent on energy and goods exports as well as EU countries decreased.
39. Turkey Becomes One of 15 Countries Among Top 30 Exporters to Increase Its Exports Share Turkey managed to become one of the 15 countries that have increased their exports share. Turkey’s ex-ports had increased in the 2008-2015 period in ab-solute terms, although limited, its share in the world exports rose 0.04 percent. Turkey displayed a suc-cessful performance in this period compared to the countries whose exports declined.
40. Turkey’s Declining Exports Stay Behind Target in 2015 Despite the fact that the exports target for 2015 was
set at 207.5 billion dollars in the exports strategy document and at 173.0 billion dollars in the medium term program, exports totaled 143.9 billion dollars.
41. Realization 0.23 Points Below 2015 Share Target in World Trade In Turkey’s 2023 export strategy, absolute export figures and the shares to be obtained from the world goods trade were set as targets. With 0.87 percent realization in 2015 compared to the target of 1.10 a deviation of 0.23 percent occurred from the target.
42. Our Exports’ Share in 30 Largest Importers Rises from 0.54 Percent to 0.67 Percent Turkey’s exports to 30 largest importers decreased to 80.7 billion dollars in 2015. However, Turkey’s share in the imports of top-30 market rose to 0.67 percent. The reason for this increase was the fact that despite the high decline in the total imports of the importer countries, the decline in the imports made from Turkey was more limited in extent.
43. Sectors’ Rate of Realization of Targets 64.4 Percent in 2015 In 2023 Export Strategy total exports target for 26 sub-sectors was set as 207.5 billion dollars, but the actual amount of exports was 133.6 billion dollars. Leaving gold aside, realization ratio for 2015 export targets of 297.5 billion dollars was 64.4 percent. There were only 2 sub-sectors which reached or ex-ceeded the 2015 export targets.
44. Export Must Increase 20.0 Percent on Average Annually for the Sectors to Achieve 2023 Targets Comparing exports figures obtained in 2015 with the 2023 targets, Turkey needs to increase its exports by 20.0 every year on average. Two-digit increases are needed in 19 sub-sectors on average until the year 2023

1DEVELOPMENTS AND TRENDS IN THE WORLD ECONOMY
1DEVELOPMENTS AND TRENDS IN THE WORLD ECONOMY
14
›
14
›I.1 BASIC DEVELOPMENTS IN THE WORLD ECONOMY AND THEIR IMPACTS ON THE WORLD TRADE
I.1.1 Growth in World Economy
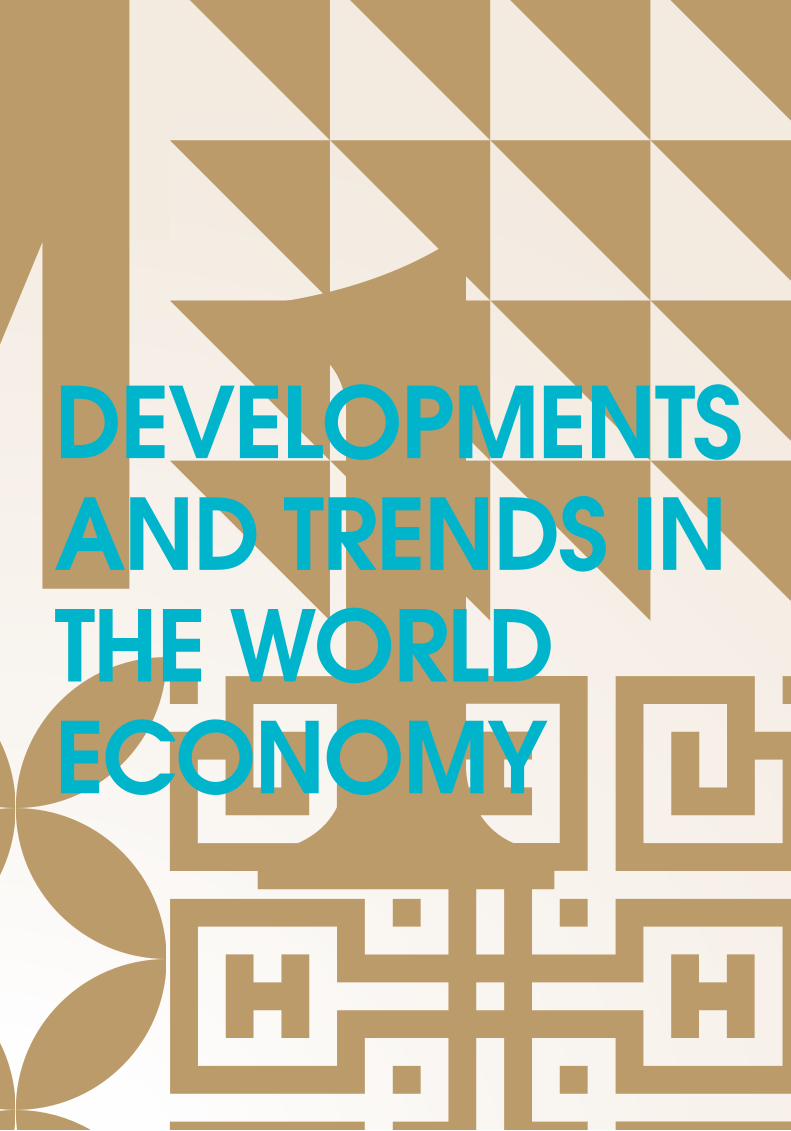
World Economy Grew Below Expectations in 2015 World economy achieved a growth of 2.4 percent in 2015; once again below the expectations and its po-tential. World economy that grew 2.4 percent in 2015 had a growth even less than the 2.7 percent growth in 2014. The growth in 2015 remained much below the 3.0 percent figure estimated at the beginning of the year. Mainly three factors were influential for the growth in the world economy to lag behind the expec-tations and its potential. These are; new global cir-cumstances caused by the normalization of American Central Bank FED’s monetary policy, slowdown in China and especially in countries that export energy and goods and the tension, confrontation and geopo-litical events in Middle East.
Balanced Growth Could Not Be Achieved in the World Economy Still in 2015 World economy was not able to enter a balanced and permanent growth process after the global cri-sis it went through. A balanced growth could not be achieved still in 2015. A recovery is being observed in the growths of developed countries in 2015. After a growth of 1.4 percent in 2013 and 1.8 percent in 2014, developed countries grew 1.4 percent in 2015. Growth is visible especially in the Euro Zone and Eu-ropean Union. On the other hand, the growth performance of devel-oping countries weakened in 2015. After a growth of 4.7 percent in 2013 and 4.6 percent in 2014, develop-ing countries grew 4.0 percent in 2015. Impacts of the new global financial conditions, decline in energy and goods prices and geopolitical event affected the performance of developing countries adversely.With the acceleration of growth in developed coun-tries, improvements were achieved in unemploy-ment, which is the biggest problem after the global crisis. After USA and England, unemployment began to recede in Euro Zone and European Union in 2015. Unemployment rate in USA returned to the pre-crisis period with 5.3 percent.Within the developing countries, which form the sec-ond engine of the world economy, slowdown espe-cially in Chinese economy is a determining factor. Chinese economy grew 6.9 percent in 2015. Chinese economy is in the process of transition from growth based on export and new investment to a growth model where internal consumption makes more con-
COUNTRIES 2013 2014 2015
WORLD 2.5 2.7 2.4
DEVELOPED COUNTRIES 1.4 1.8 1.9
USA 2.2 2.4 2.4
EURO ZONE -0.4 0.9 1.6
EU 28 0.2 1.5 2.0
JAPAN 1.6 0.0 0.5
OTHER COUNTRIES 2.2 2.8 2.0
DEVELOPING COUNTRIES 4.7 4.6 4.0
CENTRAL AND EASTERN EUROPE 2.9 2.8 3.5
CIS 2.2 1.0 -2.8
ASIA 6.6 6.8 6.6
MIDDLE EAST AND AFRICA 2.4 2.7 2.5
SAHARAN AFRICA 5.2 5.0 3.4
LATIN AMERICA 2.9 1.3 -0.1
TABLE.1 GROWTH IN WORLD ECONOMY, PERCENT
SOURCE: IMF WORLD ECONOMIC OUTLOOK 2016 APRIL
tribution to growth. Because of this, growth is slowing down in China, which has many structural problems. Slowdown in China affected adversely the growth of other countries which has extensive economic and commercial relations with it in 2015.Reform-oriented policies of the new government that came to power in India started to speed up the growth. India grew 7.3 percent again in 2015. Russia was quite affected by the falling energy and goods prices in 2015 after the reciprocal sanctions were started to be implemented with the Western countries. Due to this, Russian economy shrank 3.7 percent in 2015.
FIGURE.1 GROWTH IN WORLD ECONOMY
ECONOMIC GROWTH, PERCENT
5
4
3
2
1
0WORLD
2.5 2.7
2013 2014 2015
2.4
1.41.8
1.9
4.74.6
4.0
DEVELOPED COUNTRIES
DEVELOPING COUNTRIES

15
COUNTRIES 2013 2014 2015
USA 2.2 2.4 2.4
GERMANY 0.5 1.6 1.5
JAPAN 1.6 0.0 0.5
CANADA 2.0 2.5 1.2
ENGLAND 1.7 2.9 2.2
AUSTRALIA 2.1 2.7 2.5
FRANCE 0.3 0.2 1.1
ITALY -1.7 -0.4 0.8
SPAIN -1.2 1.4 3.2
SOUTH KOREA 3.0 3.3 2.6
TABLE.2 GROWTH IN DEVELOPED COUNTRIES, PERCENT
SOURCE: IMF WORLD ECONOMIC OUTLOOK 2016 APRIL
COUNTRIES 2013 2014 2015
CHINA 7.8 7.3 6.9
INDIA 6.9 7.3 7.3
RUSSIA 2.2 0.6 -3.7
BRAZIL 2.7 0.1 -3.8
MEXICO 1.4 2.3 2.5
SOUTH AFRICA 2.2 1.5 1.3
INDONESIA 5.4 5.0 4.8
MALAYSIA 6.2 6.0 5.0
POLAND 1.3 3.4 3.6
S.ARABIA 3.6 3.6 3.4
TABLE.4 GROWTH IN DEVELOPING COUNTRIES, PERCENT
SOURCE: IMF WORLD ECONOMIC OUTLOOK 2015 APRIL
COUNTRIES 2013 2014 2015
DEVELOPED COUNTRIES 7.9 7.3 7.0
USA 7.4 6.2 5.3
EURO ZONE 12.1 11.6 10.9
JAPAN 4.0 3.6 3.4
ENGLAND 7.6 6.2 5.4
CANADA 7.1 6.9 6.9
OTHER DEVELOPED COUNTRIES 4.6 4.7 4.6
TABLE.3 UNEMPLOYMENT IN DEVELOPED COUNTRIES, PERCENT
SOURCE: IMF WORLD ECONOMIC OUTLOOK 2016 APRIL, 2016 DATABASE
10
5
0
-5
7.8 7.3 7.3 7.36.9 6.9
2.2 2.7
0.10.6
-3.7 -3.8
FIGURE.2 GROWTH IN BRIC COUNTRIES
GROWTH IN BRIC COUNTRIES, PERCENT
2013 2014 2015
CHINA INDIA RUSSIA BRAZIL
ECONOMY AND FOREIGN TRADE REPORT 2016
Due to its high dependence on energy and goods exports, Brazil is one of the countries most adverse-ly by the falling prices in 2015. Brazilian economy shrank 3.8 percent in 2015. South Africa has similar characteristics and grew less than the previous year with 1.3 percent. Poland is gradually becoming the new industrial center of European Union is growing rapidly; it increased its growth rate to 3.6 percent.With the effect of recovery in USA, Mexico sustained a growth of 2.5 percent in 2015 after a growth of 2.3 percent in 2014.Growths in Indonesia and Malaysia were slightly lower than the previous year due to the slowdown in China and falling goods prices. Saudi Arabia man-aged to hold its economic growth at 3.4 percent de-spite the significant decline in oil prices.

1DEVELOPMENTS AND TRENDS IN THE WORLD ECONOMY
16
›
I.1.2 General Trends in the World Economy There have been 6 main influential trends in 2015.
1- Monetary Policies of Developed Countries Monetary policies of the Central Banks of the developed countries that applied the lowest interest rates of the his-tory with the extraordinary expanding monetary policies after the global crisis continued to become influential in the global economy in 2015 as well.USA Central Bank FED, after ending its monetary expan-sion in October 2014 approached the process of increas-ing its extraordinarily low interest rates. 2015 in general passed with the interest rate increase expectation from USA Central Bank. USA Central Bank FED implemented the expected interest rate increase in December. With the FED effect, Dollar gained value against all monetary units; dollar index exceeded the level of 100.On the other hand, European Central Bank reinforced its monetary expansion measures even more in 2015. Espe-cially due to the imminent deflation risk, ECB extended the program period it implemented and expanded its scope.England and Japan Central Banks maintained their expan-sive monetary policies over the year USA implemented them. Among the developed countries Switzerland, Den-mark, Sweden and ECB started to apply negative interest rates in 2015.
2- Transformation, New Growth Model and Economic Slowdown in Chinese Economy China is making a transformation from the state capitalism special to itself that included hidden public supports that it applied since the middle of 1990’s to a market economy, again special to itself, as of the beginning of 2015. The tar-get of the new management that came to power in 2014 is to complete this transition by 2020 in the process of the
new development plan. This transition is causing changes in the economic growth model of China. China is making a transition from a growth model based on investments and exports to a growth model based on internal demand. For this reason, its economic growth rate falls down from 10-11 percent levels to 6-7 percent.Chinese economy became the second largest economy of the world in a short time. With 11 percent average growth it sustained in the last twenty five years, it functioned as an engine in the world economy. China speeded up the growth of many countries with the demand effect it gen-erated with its fast growth. With its demand of energy, commercial goods, intermediate goods and end products, China speeded up the economic growth in the countries that export these products. Countries such as Germany, South Korea, Japan, Indonesia, Saudi Arabia, Angola and Australia formed dependence with Chinese economy with the different product groups they export. The slowdown in Chinese economy is limiting the goods demand directed at these countries; many developed and developing countries are being affected by the slowdown in China. This way, growth in the world economy and trade is being limited, also. 3- Transformation, New Growth Model and Economic Slowdown in Chinese Economy China is making a transformation from the state capitalism special to itself that included hidden public supports that it applied since the middle of 1990’s to a market economy, again special to itself, as of the beginning of 2015. The tar-get of the new management that came to power in 2014 is to complete this transition by 2020 in the process of the new development plan. This transition is causing changes in the economic growth model of China. China is making a transition from a growth model based on investments and exports to a growth model based on internal demand. For this reason, its economic growth rate falls down from 10-11 percent levels to 6-7 percent.
FIGURE.3 EURO / DOLLAR EXCHANGE RATEEURO / DOLLAR EXCHANGE RATE
2013
Dec
embe
r
Janu
ary
Febr
uary
Mar
ch
April
May
June
1,4
1,35
1,3
1,25
1,2
1,15
1,1
1,05
1
July
Augu
st
Sept
embe
r
Octo
ber
Nove
mbe
r
2014
Dec
embe
r
Janu
ary
Febr
uary
Mar
ch
April
May
June July
Augu
st
Sept
embe
r
Octo
ber
Nove
mbe
r
2015
Dec
embe
r

17ECONOMY AND FOREIGN TRADE REPORT 2016
FIGURE.4 BRENT OIL PRICE BARREL DOLLAR
BRENT OIL PRICE BARREL DOLLAR
Chinese economy became the second largest economy of the world in a short time. With 11 percent average growth it sustained in the last twenty five years, it functioned as an engine in the world economy. China speeded up the growth of many countries with the demand effect it gen-erated with its fast growth. With its demand of energy, commercial goods, intermediate goods and end products, China speeded up the economic growth in the countries that export these products. Countries such as Germany, South Korea, Japan, Indonesia, Saudi Arabia, Angola and Australia formed dependence with Chinese economy with the different product groups they export. The slowdown in Chinese economy is limiting the goods demand directed at these countries; many developed and developing coun-tries are being affected by the slowdown in China. This way, growth in the world economy and trade is being lim-ited, also.
4- Excessive Fall in Oil Prices An important trend in 2015 was the decline in oil prices. Trend of decrease in goods prices occurred at the expect-ed rate in 2015. However, a very high decline occurred in oil prices disconnected from the developments in the de-mand and supply. New supply capacities at the produc-tion side were more influential in this decline than the slow-down in the global economy. Lifting of the embargo from Iran, restoration of the infrastructure in Iraq and USA’s starting to make oil exports were influential. Also, producer countries in and outside OPEC not limiting the production and starting competition at lower prices caused a sharp fall in oil prices.
5- Concern of Deflation in Developed Countries In spite of the implemented expanding monetary policies, as a result of significant decline in the prices of oil and all
2013
Dec
embe
r
109.6 11
2.4
106.0
103.2
Janu
ary
Febr
uary
Mar
ch
April
May
June July
Augu
st
Sept
embe
r
Octo
ber
Nove
mbe
r
2014
Dec
embe
r
Janu
ary
Febr
uary
Mar
ch
April
May
June July
Augu
st
Sept
embe
r
Octo
ber
Nove
mbe
r
2015
Dec
embe
r
SOURCE: BRENT OIL MARKET
commercial goods, the concern for deflation strengthened in developed countries, which is defined as decrease of prices. Deflation is felt in EU, Euro Zone and Japan most strongly. USA and England got a little more away from the 2.0 percent inflation target that they are trying to reach. Deflation risk remains as a factor that delays normalization in monetary policies.
6- Geopolitical EventsAnother development in 2015 that had impact on the world economy was the increase in geopolitical risks. The ten-sion and reciprocal sanctions between West and Russia that started as a result of the disagreement between Rus-sia and Ukraine continued in 2015.Another geopolitical development was the DAESH threat that emerged in Syria and expanded in Iraq. DAESH threat affected the regional stability and trade significantly. Rus-sia’s de facto military intervention into the conflict in Syria increased the risks. A new tension line was formed between S. Arabia and Iran blocs due to the fact that the embargo on Iran was lifted. High risks of Middle East origin affect the trade adversely, although they are not reflected to the finan-cial prices as they used to be in the past.
EURO / DOLLAR EXCHANGE RATE
110.9
106.4 10
9.1
107.8
108.2
94.7
85.9
70.2
57.3
53.0 62
.2
55.3
66.8
67.5
62.6
49.8 54
.2
48.4 49.6
44.5
37.3
120
110
100
90
80
70
60
50
40
30
INFLATION IN DEVELOPED AND DEVELOPING COUNTRIES
COUNTRIES 2012 2013 2014 2015
DEVELOPED COUNTRIES 2.0 1.4 1.4 0.3
USA 2.1 1.5 1.6 0.1
EURO ZONE 2.5 1.3 0.4 0.0
EU-28 2.6 1.5 0.5 0.1
JAPAN 0.0 0.4 2.7 0.8
OTHER DEVELOPED COUNTRIES 2.2 1.7 1.5 1.3
DEVELOPING COUNTRIES 6.1 5.9 5.1 5.5
SOURCE: IMF, DATABASE 2016

1DEVELOPMENTS AND TRENDS IN THE WORLD ECONOMY
18
›
I.1.3 Impacts of Developments in World Economy on World Trade The developments and trends in the world economy in 2015 affected the world goods trade directly or indirectly.Positive Impacts;a- Demand effect due to speeding up of the growth in developed countries affected the world trade positivelyb- Growth in Euro zone first time in a long period caused increase in imports and provided positive
I.2 DEVELOPMENTS IN WORLD TRADE VOLUME World goods trade decreased significantly in 2015 after a slowdown for three years. After an increase of 2.0 percent in 2013 and 1.2 percent in 2014, the world goods trade in decreased 10.9 percent in 2015.Quantitative increase in world goods trade continued in 2015. After an increase of 2.8 percent in 2014, world goods trade increased 2.8 percent again in 2015.Due to this decrease, world goods trade fell down to 16.48 trillion dollars in 2015 from 18.49 trillion dollars in 2014.
COUNTRIES 2013 2014 2015
GOODS TRADE, BILLION DOLLARS 18,270 18,404 16,482
GOODS TRADE GROWTH ON PERCENT
VALUE BASIS 2.0 1.2 -10.9
GOODS TRADE GROWTH ON PERCENT
QUANTITY BASIS2.4 2.8 2.8
TABLE.6 WORLD GOODS TRADE, BILLION DOLLARS
SOURCE: WORLD TRADE ORGANIZATION
FIGURE.5 WORLD GOODS TRADE (TRILLION $)
19.00
18.50
18.00
17.50
17.00
16.50
16.00
15.502013
18.27
18.49
16.48
2014 2015
There were important quantitative developments in imports and exports in developed and developing countries in 2015. After decreasing for a few years consecutively, imports in developed countries increased 3.5 percent in 2014 and 4.5 percent in 2015. Imports in developing countries increased only 0.2 percent in 2015 in quantity.
FIGURE.6 GROWTH IN WORLD TRADE
VALUE GROWTH PERCENT QUANTITY GROWTH PERCENT
5.0
0.0
-5.0
-10
-15
GROWTH IN WORLD TRADE, PERCENT
2013 2014 2015
2 2.42.8 2.8
1.2
-10.9
contribution to the world trade. Negative Impacts;a- Slowdown in developing countries especially in China is limiting the demand for all kinds of raw materials.b- Decline in the prices of oil and other goods are imposing difficulty in import costs and also causing decrease in the trade in value.c- Geopolitical events and reciprocal sanctions are limiting the trade possibilities. d- Deflation tendency is lowering the prices of commercial goods and limiting the trade volume.
COUNTRIES 2013 2014 2015
DEVELOPED COUNTRIES IMPORTS
GROWTH %-0.2 3.5 4.5
DEVELOPING COUNTRIES IMPORTS
GROWTH %5.2 2.1 0.2
DEVELOPED COUNTRIES EXPORTS GROWTH
%1.7 2.4 2.6
DEVELOPING COUNTRIES EXPORTS
GROWTH %3.8 3.1 3.3
TABLE .7 QUANTITATIVE GROWTH IN WORLD TRADE, PERCENT
SOURCE: WORLD TRADE ORGANIZATION

19ECONOMY AND FOREIGN TRADE REPORT 2016
I.3 GENERAL TRENDS IN WORLD TRADE
There were important trends in the world goods trade in 2015 whose effects were felt. Majority of these trends cause slowdown in the world goods trade.
1-Slowdown in developing countries is limiting the demandGrowth performance is weakening in developing countries. For this reason, import demand of the de-veloping countries is being limited, also. Import po-tential of the developing countries is changing down-wards.
2-Growth in developed countries is generating demand in importsAfter the global economic crisis, growth in developed countries entered a tendency of recovery perma-nently. Due to this, import demand of the developed countries began to increase again. Especially in Euro-pean Union, non-union imports are increasing again.
3-Oil and goods prices may remain low for a long time Excessive fluctuation in oil and goods prices is in a stage of strong decrease. There is a risk for oil and goods prices to remain low for a long time and this will limit the world goods trade.
4-Inactive capacities are limiting the demand for investment tendencies and investment goods demand Because of the reason that there are still inactive ca-pacities in many industries after the global crisis, the global investment tendency stays limited. Due to this, investment goods demand that is supplied through imports still remains weak.
5-Commercial flexibility of income growth is decreasingCommercial flexibility, defined as imports demand gener-ated by income increase, is falling. Income-trade flexibility of 2.3 between 1986-2007 fell down to 1.2 between 2011-2015. Increases in income do not generate sufficient imports demand. Especially the flexibility for manufacturing industry products decreased even more. Protection measures and increasing regionalization of the trade have influence on this.
6-Slowdown in China is limiting the export growth to this countryChina, which has been growing based on exports and new investments and has been a significant exports market for many supplier countries with this feature, is limiting its new investments and export-oriented production with the new growth model; the import in-crease generated by this is also getting static.
7-Growth in Global Supply Chain Slowed Down Diversification of industrial production and the growth in the global supply chain generated because of it slowed down. New rings are not being added to the value chain. Expansion in trade will only be supported by the trade be-tween existing rings. For this reason, the imports increase based on the supply chain has also slowed down.
8-Regional and new generation trade agreements are emergingTransition is being made from multi-lateral trade agree-ment process to regional and new generation compre-hensive agreements process in the world trade. These agreements have the risk of concentrating the trade in the regions covered by the agreements.
COUNTRIES 2013 2014 2015
GROWTH IN WORLD TRADE ON VALUE
BASIS %2.0 1.2 -10.9
OIL AND ENERGY PRODUCTS PRICES % -2.0 -11.0 -14.5
METALS AND OTHER GOODS PRICES % 1.5 -5.0 -11.0
MANUFACTURING INDUSTRY PRODUCTS
PRICES %0.0 0.0 -2.0
TABLE .8 DEVELOPMENTS IN GOODS PRICES IN WORLD TRADE, PERCENT
SOURCE: WORLD TRADE ORGANIZATION
On the exports side, quantitative increase in developed countries was 4.5 percent in 2015; higher than the increase in 2013 and 2014. Exports of the developing countries increased 3.3 percent in 2015; lower than 2013 and slightly higher than 2014.Significant declines occurred in the prices of the commercial goods used in the world trade. Because of this, world goods trade decreased on value basis. Prices of oil and energy products used in trade fell down 14.5 percent on average in 2015 compared to the previous year. Also, prices of metals and other goods used in trade decline 11.0 on average. In the average prices of manufacturing industry products 2.0 percent decrease was observed after a long time.

1DEVELOPMENTS AND TRENDS IN THE WORLD ECONOMY
20
›
I.4 EXPORTS ACCORDING TO REGIONS AND COUNTRIES
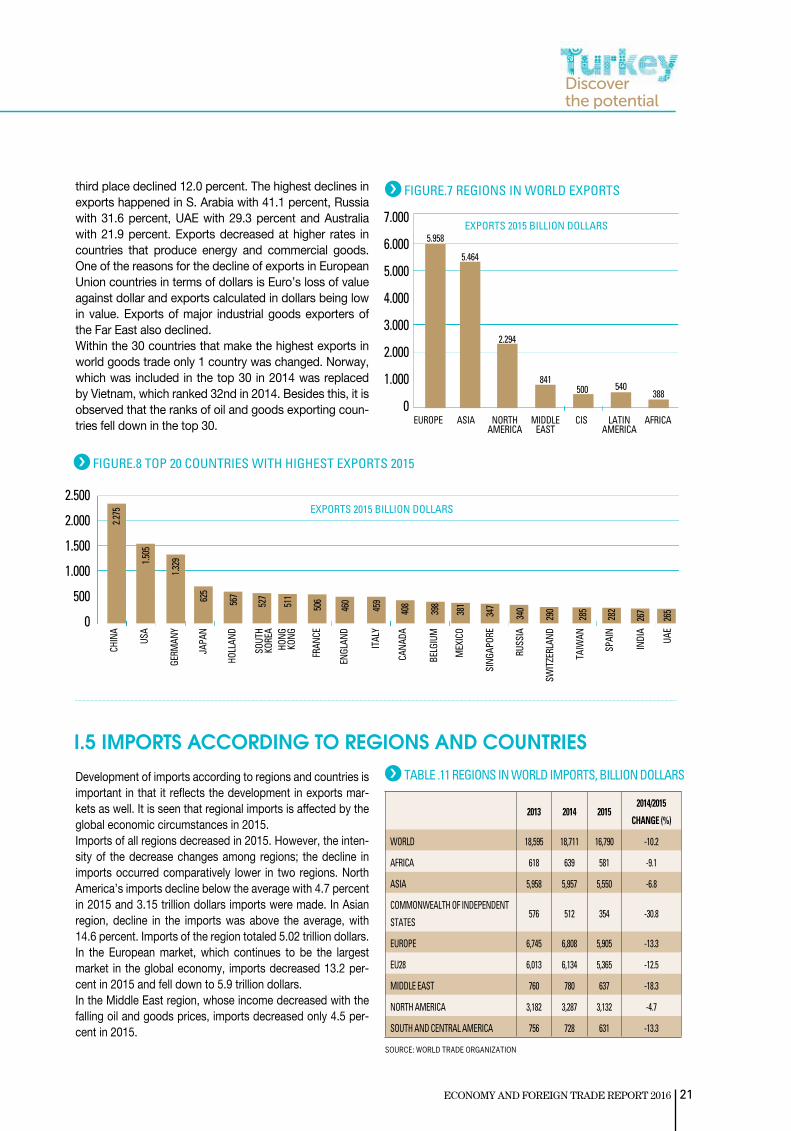
With the decrease in the world trade in global scale, ex-ports of all the regions declined in 2015. However, decline in exports in the regions were different depending on dif-ferent impacts of the economic and commercial trends of global scale on the regions.Exports of the European Union and more generally of Europe fell down 12.4 percent and 12.5 percent respec-tively in 2015. Despite that, Europe and the European Union continued to be the region that makes the high-est exports. Asia’s exports decreased for the first time after many years. Asian region made 5.46 trillion dollars of exports in 2015 as the second largest exporter region. Exports of North America decreased 8.0 percent in 2015.Exports of three regions decreased more than the aver-age in 2015. The common characteristics of these regions is that they have mainly developing countries and coun-tries that export energy and commercial goods. Goods exports of the Commonwealth of Independent States de-creased 32.0 percent in 2015, South and Central America 21.2 percent, Middle East 34.7 percent and African Re-gion 29.6 percent. Decline in the prices of oil and goods was influential in the decrease of exports.
2013 2014 20152014/2015
CHANGE (%)
AFRICA 602 555 388 -29.6
ASIA 5,773 5,916 5,464 -7.9
COMMONWEALTH OF
INDEPENDENT STATES779 735 500 -32.0
EUROPE 6,646 6,810 5,958 -12.4
EU28 6,020 6,235 5,387 -12.5
MIDDLE EAST 1,347 1,288 841 -34.7
NORTH AMERICA 2,418 2,493 2,294 -8.0
SOUTH AND CENTRAL AMERICA 736 695 540 -21.2
TABLE.10 COUNTRIES IN WORLD EXPORTS
SOURCE: WORLD TRADE ORGANIZATION
SOURCE: WORLD TRADE ORGANIZATION
TABLE .9 REGIONS IN WORLD EXPORTS, BILLION DOLLARS
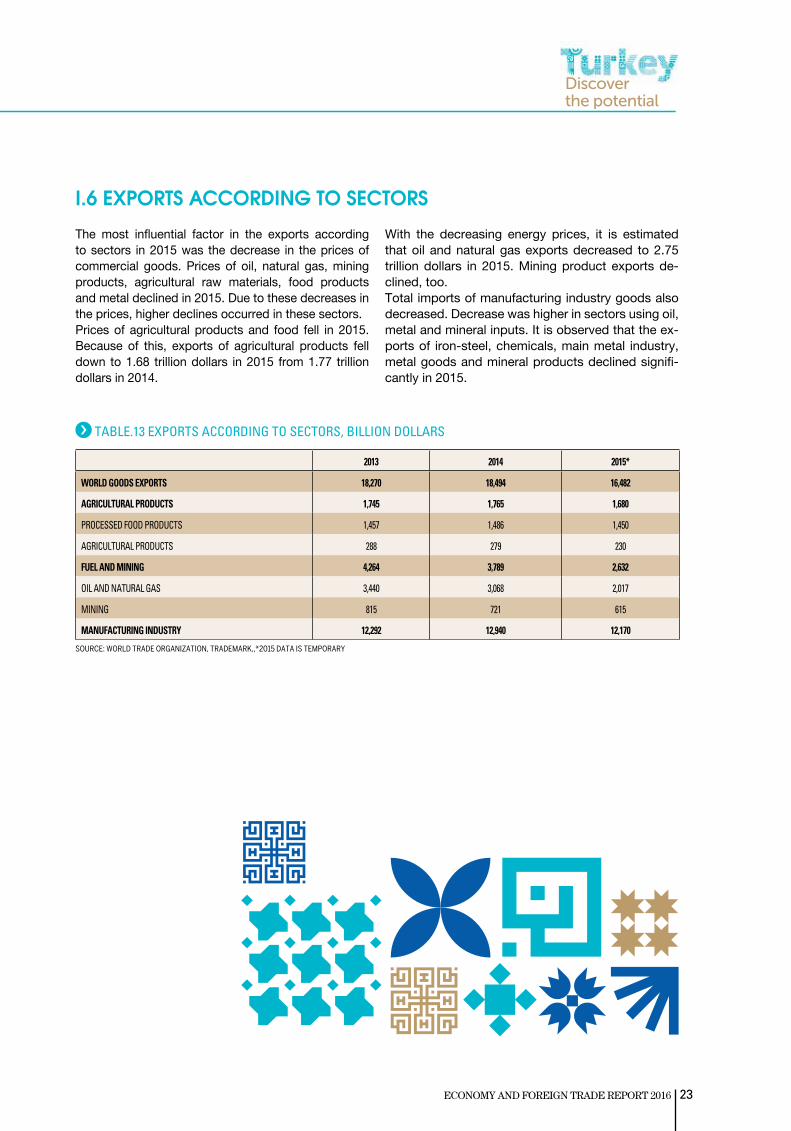
Exports performance of 30 countries that make the high-est exports in world goods trade declined in 2015. Of the top 30 countries, only Vietnam increased its exports. Exports declined in the remaining 29 countries. Decline in the exports of 29 countries occurred in quite different rates.China’s exports declines 2.9 percent for the first time after many years. China maintained its place at the top with 2.28 trillion dollars of exports. Exports of USA, at the sec-ond place, decreased 7.3 percent and of Germany, at the
1 CHINA 2.343 2.275 -2.9 13.70 1
2 USA 1623 1.505 -7.3 9.07 2
3 GERMANY 1.511 1.329 -12.0 8.01 3
4 JAPAN 684 625 -8.6 3.77 4
5 HOLLAND 672 567 -15.6 3.42 5
6 SOUTH KOREA 573 527 -8.0 3.17 7
7 HONG KONG 524 511 -2.5 3.08 9
8 FRANCE 583 506 -13.2 3.05 6
9 ENGLAND 507 460 -9.3 2.77 10
10 ITALY 529 459 -13.2 2.77 8
11 CANADA 474 408 -13.9 2.46 12
12 BELGIUM 469 398 -15.1 2.40 13
13 MEXICO 398 381 -4.3 2.30 15
14 SINGAPORE 410 347 -15.4 2.09 14
15 RUSSIA 497 340 -31.6 2.05 11
16 SWITZERLAND 312 290 -6.9 1.75 22
17 TAIWAN 314 285 -9.2 1.72 20
18 SPAIN 323 282 -12.7 1.70 18
19 INDIA 317 267 -15.8 1.61 19
20 UAE 360 265 -29.3 1.61 16
21 THAILAND 228 214 -6.1 1.29 24
22 S.ARABIA 354 202 -41.1 1.20 17
23 MALAYSIA 234 200 -14.5 1.20 23
24 POLAND 217 198 -8.8 1.19 26
25 BRAZIL 225 191 -15.1 1.15 25
26 AUSTRALIA 240 188 -21.7 1.13 21
27 VIETNAM 150 162 +8.0 0.98 32
28 CHECK REP. 174 158 -9.2 0.95 29
29 AUSTRIA 177 152 -14.1 0.92 27
30 INDONESIA 176 150 -14.8 0.90 28
EXPORTS (BILLION DOLLARS)
RANK COUNTRY 2014 2015
2014/2015CHANGE
(%)
2015SHARE
(%)
2014RANK
21ECONOMY AND FOREIGN TRADE REPORT 2016
2013 2014 20152014/2015
CHANGE (%)
WORLD 18,595 18,711 16,790 -10.2
AFRICA 618 639 581 -9.1
ASIA 5,958 5,957 5,550 -6.8
COMMONWEALTH OF INDEPENDENT
STATES576 512 354 -30.8
EUROPE 6,745 6,808 5,905 -13.3
EU28 6,013 6,134 5,365 -12.5
MIDDLE EAST 760 780 637 -18.3
NORTH AMERICA 3,182 3,287 3,132 -4.7
SOUTH AND CENTRAL AMERICA 756 728 631 -13.3
FIGURE.7 REGIONS IN WORLD EXPORTS
SOURCE: WORLD TRADE ORGANIZATION
TABLE .11 REGIONS IN WORLD IMPORTS, BILLION DOLLARS
EXPORTS 2015 BILLION DOLLARS
EXPORTS 2015 BILLION DOLLARS
EUROPE ASIA NORTH AMERICA
MIDDLE EAST
CIS LATIN AMERICA
AFRICA
7.000
6.000
5.000
4.000
3.000
2.000
1.000
0
5.958
5.464
2.294
540388
third place declined 12.0 percent. The highest declines in exports happened in S. Arabia with 41.1 percent, Russia with 31.6 percent, UAE with 29.3 percent and Australia with 21.9 percent. Exports decreased at higher rates in countries that produce energy and commercial goods. One of the reasons for the decline of exports in European Union countries in terms of dollars is Euro’s loss of value against dollar and exports calculated in dollars being low in value. Exports of major industrial goods exporters of the Far East also declined.Within the 30 countries that make the highest exports in world goods trade only 1 country was changed. Norway, which was included in the top 30 in 2014 was replaced by Vietnam, which ranked 32nd in 2014. Besides this, it is observed that the ranks of oil and goods exporting coun-tries fell down in the top 30.
Development of imports according to regions and countries is important in that it reflects the development in exports mar-kets as well. It is seen that regional imports is affected by the global economic circumstances in 2015.Imports of all regions decreased in 2015. However, the inten-sity of the decrease changes among regions; the decline in imports occurred comparatively lower in two regions. North America’s imports decline below the average with 4.7 percent in 2015 and 3.15 trillion dollars imports were made. In Asian region, decline in the imports was above the average, with 14.6 percent. Imports of the region totaled 5.02 trillion dollars.In the European market, which continues to be the largest market in the global economy, imports decreased 13.2 per-cent in 2015 and fell down to 5.9 trillion dollars. In the Middle East region, whose income decreased with the falling oil and goods prices, imports decreased only 4.5 per-cent in 2015.
FIGURE.8 TOP 20 COUNTRIES WITH HIGHEST EXPORTS 2015
2.500
2.000
1.500
1.000
500
0
CHIN
A
USA
GERM
ANY
JAPA
N
HOLL
AND
SOUT
H KO
REA
FRAN
CE
ENGL
AND
ITAL
Y
CANA
DA
BELG
IUM
MEX
ICO
SING
APOR
E
RUSS
IA
SWIT
ZERL
AND
TAIW
AN
SPAI
N
INDI
A
HONG
KO
NG
2.275
1.505
1.329
625
567
527
511
506
460
459
408
398
381
347
340
290
285
282
267
265
I.5 IMPORTS ACCORDING TO REGIONS AND COUNTRIES
841500
UAE

1DEVELOPMENTS AND TRENDS IN THE WORLD ECONOMY
22
›
In the Commonwealth of Independent States, imports declined 31.99 percent. Declining energy prices cou-pled with the implemented sanctions caused a sharp fall in the imports. In the South and Central America, which depend on energy and goods, imports de-ceased 15.9 percent.Imports of the top 30 countries with highest imports in the world goods trade declined except for one country; the country whose imports increased was Vietnam.There has been a change in the 30 countries with high-est imports in the world goods imports. Switzerland,
FIGURE.9 REGIONS IN WORLD IMPORTS
IMPORTS 2015 BILLION DOLLARS
ASIAEUROPE NORTH AMERICA
MIDDLE EAST
LATIN AMERICA
AFRICA CIS
7.0006.000
5.000
4.000
3.000
2.000
1.000
0
5.899
5.018
3.151
747622 559 345
which was among the top 30 importers, was replaced by Vietnam. Imports of the largest import market, USA, decreased 4.2 percent and fell down to 2.3 trillion dollars. China’s imports declined at the high-est rate with 14.2 percent. The third largest importer Germany’s imports declined 13.7 percent. The fourth ranking Japan’s imports decreased 21.0 percent; the country whose imports decreased the most was Rus-sia with 37.0 percent.
TABLO.12 COUNTRIES IN WORLD IMPORTS
COUNTRIES IN WORLD IMPORTS
1 USA 2,409 2,308 -4.2 13.77 1
2 CHINA 1,960 1,682 -14.2 10.04 2
3 GERMANY 1,217 1,050 -13.7 6.26 3
4 JAPAN 822 648 -21.0 3.87 4
5 ENGLAND 683 626 -8.3 3.74 5
6 FRANCE 679 573 -15.8 3.41 6
7 HONG KONG 601 559 -7.0 334 7
8 HOLLAND 587 506 -13.8 332 8
9 SOUTH KOREA 526 436 -17.1 230 9
10 CANADA 475 436 -9.1 230 10
11 ITALY 472 409 -13.3 2.44 11
12 MEXICO 412 405 -1.7 2.42 14
13 INDIA 460 392 -14.8 234 12
14 BELGIUM 451 375 -16.9 2..24 13
15 SPAIN 356 309 -13.2 1.84 16
16 SINGAPORE 366 297 -18.9 1.77 15
17 SWITZERLAND 276 252 -8.7 1.50 26
18 TAIWAN 274 238 -13.1 1.42 18
19 UAE 262 230 -15.7 1.40 19
20 AUSTRALIA 238 208 -12.0 1.20 22
21 TURKEY 242 207 -14.5 1.24 20
22 THAILAND 228 203 -11.0 121 23
23 RUSSIA 308 194 -37.0 1.16 17
24 POLAND 218 193 -11.5 1.15 24
25 BRAZIL 239 179 -25.1 1.17 21
26 MALAYSIA 209 176 -15.8 1.05 25
27 S.ARABIA 174 172 -0.9 1.03 29
28 VIETNAM 149 166 +11.4 0.99 32
29 AUSTRIA 182 155 -14.8 0.92 27
30 INDONESIA 178 143 -19.7 0.85 28
IMPORTS (BILLION DOLLARS)
RANK COUNTRY 2014 2015
2014/2015 CHANGE
%
2015 SHARE
%
2014 RANK
IMPORTS 2015 BILLION DOLLARS
10 TOP 20 COUNTRIES WITH HIGHEST IMPORTS
2.500
2.000
1.500
1.000
500
0
USA
CHIN
A
GERM
ANY
JAPA
N
ENGL
AND
FRAN
CE
HOLL
AND
SOUT
H KO
REA
CANA
DA
İTALY
MEX
ICO
INDI
A
BELG
IUM
SPAI
N
SİNGAPORE
SWIT
ZERL
AND
TAIW
AN UAE
AUST
RIA
HONG
KO
NG
2.308
1.682
1.050
648
626
573
559
506
436
436
409
405
392
375
309
297
252
238
230
208
23ECONOMY AND FOREIGN TRADE REPORT 2016
TABLE.13 EXPORTS ACCORDING TO SECTORS, BILLION DOLLARS
SOURCE: WORLD TRADE ORGANIZATION, TRADEMARK,,*2015 DATA IS TEMPORARY
The most influential factor in the exports according to sectors in 2015 was the decrease in the prices of commercial goods. Prices of oil, natural gas, mining products, agricultural raw materials, food products and metal declined in 2015. Due to these decreases in the prices, higher declines occurred in these sectors.Prices of agricultural products and food fell in 2015. Because of this, exports of agricultural products fell down to 1.68 trillion dollars in 2015 from 1.77 trillion dollars in 2014.
With the decreasing energy prices, it is estimated that oil and natural gas exports decreased to 2.75 trillion dollars in 2015. Mining product exports de-clined, too.Total imports of manufacturing industry goods also decreased. Decrease was higher in sectors using oil, metal and mineral inputs. It is observed that the ex-ports of iron-steel, chemicals, main metal industry, metal goods and mineral products declined signifi-cantly in 2015.
I.6 EXPORTS ACCORDING TO SECTORS
2013 2014 2015*
WORLD GOODS EXPORTS 18,270 18,494 16,482
AGRICULTURAL PRODUCTS 1,745 1,765 1,680
PROCESSED FOOD PRODUCTS 1,457 1,486 1,450
AGRICULTURAL PRODUCTS 288 279 230
FUEL AND MINING 4,264 3,789 2,632
OIL AND NATURAL GAS 3,440 3,068 2,017
MINING 815 721 615
MANUFACTURING INDUSTRY 12,292 12,940 12,170


TURKISH ECONOMY AND DEVELOPMENTS IN FOREIGN TRADE2

2TURKISH ECONOMY AND DEVELOPMENTS IN FOREIGN TRADE
26
› In 2015, there were five major factors that affected the Turkish economy. These factors are; newly emerging global economic conditions, Central Bank’s cautious monetary policy, conditions caused by two general elections in the country, acts of terror and geopolitical events taking place in the neighboring countries.In 2015, there were three basic developments that determined the global economic conditions. Expectations for USA Central Bank’s interest rate hike continued all the year long and FED increased the interest rate in December. Slowdown in China and mini deval-uation of its currency unit, Yuan, affected the global markets nega-tively. Finally, prices of oil and goods decreased significantly. With these global economic developments, there have been significant capital exits from developing countries and Turkey was adversely affected from this, also. In this framework, there was loss of value in Turkish Lira and increase in interest rates.In 2015, in the “wait and see” atmosphere caused by global de-velopments and the two general elections, the government imple-mented polices that emphasized financial stability. In this frame-work, public financial discipline was maintained with the macro
cautionary measures that were started to be taken in the past years Even though the Central Bank followed a tight and cautious monetary policy over the year in general, it remained un-responsive to the Turkish Lira’s loss of value. Policy communica-tion of the Central Bank affected the inflation expectations nega-tively and inflation escalated considerably. Two general elections in 2015 carried politics beyond economy and caused a “wait and see” atmosphere to occur that lasted quite a long time. Acts of terror occurring in the same period adversely affected the confi-dence and expectations.In 2015, the geopolitical events occurring in neighboring coun-tries affected economy negatively with their limiting effect on es-pecially foreign trade. DAESH threat that emerged in our southern neighbors, Iraq and Syria, generated an adverse effect on regional trade and economic activities. Russia’s direct intervention to Syr-ia further complicated the problem. The aircraft crisis with Russia that happened at the end of the year caused all relations to be severed. Weakening of economic and commercial relations with these countries adversely affected the Turkish economy in 2015.
TABLE.1 MAIN ECONOMIC INDICATORSNegative effects of long term wait-and-see period caused by two general elections, acts of terror and geopolitical events on confidence and expectations had impact on economic activities and a relatively static year has passed in economic activities in 2015. In spite of this, economic growth gradually recovered in 2015 with especially the increase in the internal consump-tion. A growth rate of 4.0 percent was realized over the year in general, in line with medium term program expectations. With the loss of value in Turkish Lira national income de-creased to 720.0 billion dollars and income per capita fell down to 9,261 dollars.A significant result of the slowdown in economic activities has been an increase in unemployment rate and number of unemployed persons. Unemployment rate rose to 10.3 per-cent and number of unemployed people went up to 3.06 million in 2015.Due to the implemented economy policies and especially falling prices of energy and metal that occupy a large part in imports, a significant improvement was achieved in foreign trade deficit and current deficit. Over the year in general, ex-ports declined 8.7 percent, imports fell down 14.5 percent and foreign trade deficit became 63.3 billion dollars.For the same reasons, a significant improvement was achieved in current deficit. Current deficit came down from 45.8 billion dollars to 32.2 billion dollars; ratio of current defi-cit to national income decreased to 4.5 percent.Improvement in foreign trade deficit and current deficit re-
GROWTH % 4.2 3.0 4.0
NATIONAL INCOME BILLION DOLLARS 823.0 799.0 720
INCOME PER CAPITA DOLLARS 10.822 10.395 9.261
EMPLOYMENT THOUSAND PERSONS 24.601 25.933 26.621
UNEMPLOYMENT RATE % 9.0 9.9 10.3
UNEMPLOYMENT THOUSAND PERSONS 2.445 2.853 3.057
MIDYEAR POPULATION THOUSAND
PERSONS
76.903 77.738 78.559
EXPORTS BILLION DOLLARS 151.9 157.6 143.9
IMPORTS BILLION DOLLARS 251.7 242.2 207.2
FOREIGN TRADE DEFICIT -99.8 -84.5 -63.3
CURRENT DEFICIT BILLION DOLLARS -64.9 -43.6 -32.2
CURRENT DEFICIT/ NATIONAL INCOME % -7.9 -5.5 -4.5
FOREIGN DEBTS BILLION DOLLARS 388.2 402.4 398.0
FOREIGN DEBTS/NATIONAL INCOME % 47.3 50.3 55.3
CPI % 7.40 8.20 8.81
DOMESTIC CPI% 6.97 6.36 5.71
PUBLIC SECTOR BALANCE//GDP % 0.8 0.6 0.8
BUDGET BALANCE//GDP % -1.2 -1.3 -1.2
INDICATORS 2013 2014 2015
II.1 ECONOMY POLICIES IN TURKEY AND DETERMINING FACTORS
II.2 DEVELOPMENTS IN MAIN ECONOMIC INDICATORS

ECONOMY AND FOREIGN TRADE REPORT 2016 27
SOURCE: TURKISH STATISTICAL INSTITUTE
FIGURE.3 GROWTH IN MANUFACTURING INDUSTRY
5
4
3
2
1
02013
NATIONAL INCOME MANUFACTURING INDUSTRY
4,2
3,7
3,03,7
4,0 3,8
2014 2015
NATIONAL INCOME AND GROWTH IN MANUFACTURING INDUSTRY
TABLE.2 SECTORAL GROWTH RATES
FIGURE.1 GROWTH IN TURKISH ECONOMY
4,54
3,53
2,52
1,51
0,50
2013
4.2
3.0
4.0
2014 2015
ECONOMIC GROWTH, PERCENT
FIGURE.2 CURRENT DEFICIT AND ITS RATIO TO NATIONAL INCOME
70
60
50
40
30
20
10
02013
CURRENT DEFICIT BILLION DOLLARS
CURRENT DEFICIT NATIONAL INCOME PERCENT
7,9
5,5
4,5
2014 2015
CURRENT DEFICIT AND ITS RATIO TO NATIONAL INCOME, PERCENT9876543210
The Central Bank followed a cautious and relatively tight monetary policy in the face of the economic and political uncertainties that emerged in 2015. However, the Central Bank was faced three important pressures over the year. First of these is the increasing inflation and spoiling of inflation expectations with the depreciation Turkish Lira. The second
one is the impacts of the new global financial conditions caused by the monetary policies of global large Central Banks. The third one is that the Central Bank was subjected to significant political criticisms in the field of interest policy.Under these pressures, the Central Bank maintained the tightening and macro cautionary precautions over the
II.3 CENTRAL BANK MONETARY POLICY AND FINANCIAL INDICATORS
duced the need for foreign resources. Accordingly, Turkey’s foreign debts increased in a quite limited manner in the first three quarters of 2015 and reached 398 billion dollars; ratio of foreign debts to national income rose to 55.3 percent.Despite the cautious and relatively tight monetary policy of the Central Bank in 2015, targets were not achieved on price stability and inflation.at the end of 2015 CPI became 8.81 percent, domestic PPI stood at 5.71 percentDespite the problems encountered in 2015, the slowdown in economic activities and the elections public financial dis-cipline was preserved. Accordingly, ratio of public general balance to GDP gave 0.8 percent surplus and ratio of gen-eral budget deficit to GDP became 1.2 percent. 2015 has been a year when real sector expectations and consumer confidence remained weak in general. Within the framework of all these macroeconomic events, Turkey has preserved its investable country credit ratings and outlooks from two credit rating bodies.
PERIOD GNP MANUFACTURING
INDUSTRY
COMMERCE TRANSPORTATION FINANCIAL
SERVICES
CONSTRUCTION TOURISM AGRICULTURE MINING
2013 4,2 3,7 5,1 3,9 9,8 7,4 9,2 3,5 -3,4
2014 3,0 3,7 1,9 3,1 7,3 2,2 2,8 -2,1 5,6
2015 4,0 3,8 2,1 2,9 10,0 1,7 4,6 7,6 -2,3

28
›
2TURKISH ECONOMY AND DEVELOPMENTS IN FOREIGN TRADE
TABLE.3 FINANCIAL INDICATORS, AS OF YEAR END
FIGURE.5 REAL EFFECTIVE EXCHANGE RATE INDEX
SOURCE: CENTRAL BANK OF REPUBLIC OF TURKEY
SOURCE: CENTRAL BANK OF REPUBLIC OF TURKEY
SOURCE: CENTRAL BANK OF REPUBLIC OF TURKEY
year. The Central Bank held the credit growth adjusted for exchange rate hikes around 15 percent, and was forced to increase the TL liquidity in the market in a controlled and gradual manner. The main determining policy tool of the Central Bank in 2015 was the interest policy. At the beginning of the year the Central Bank lowered the policy interest from 8.25 percent to 7.50 percent and overnight lending rate from 11.25 percent to 10.75 percent. In the rest of the year it did not make any changes in the interest rates. The Central Bank did not use the interest rate tool directly against the increasing inflation and depreciation of Turkish Lira and raised the market funding costs in the multi interest rate monetary policy.Republic of Turkey Central Bank declared in August 2015 that it will simplify its monetary policy and signaled a turn from multi interest rate monetary policy to single interest rate monetary policy. However, it did not make any move towards simplification until the end of the year.Within the monetary policy implemented by the Central Bank,
REAL EFFECTIVE EXCHANGE RATE INDEX 2003=100
2010
Janu
aryFe
bruary
Marc
hAp
rilM
ayJu
ne July
Augu
stSe
ptemb
erOc
tober
Nove
mber
Dece
mber
2011
Janu
aryFe
bruary
Marc
hAp
rilM
ayJu
ne July
Augu
stSe
ptemb
erOc
tober
Nove
mber
Dece
mber
2012
Janu
aryFe
bruary
Marc
hAp
rilM
ayJu
ne July
Augu
stSe
ptemb
erOc
tober
Nove
mber
Dece
mber
2013
Janu
aryFe
bruary
Marc
hAp
rilM
ayJu
ne July
Augu
stSe
ptemb
erOc
tober
Nove
mber
Dece
mber
2014
Janu
aryFe
bruary
Marc
hAp
rilM
ayJu
ne July
Augu
stSe
ptemb
erOc
tober
Nove
mber
Dece
mber
2015
Janu
aryFe
bruary
Marc
hAp
rilM
ayJu
ne July
Augu
stSe
ptemb
erOc
tober
Nove
mber
Dece
mber
INDICATORS 2013 2014 2015
CENTRAL BANK POLICY INTEREST % 4,50 8,25 7,50
CENTRAL BANK OVERNIGHT LENDING INTEREST
RATE %7,75 11,25 10,75
2-YEAR TERM INDICATIVE BOND INTEREST RATE% 10,10 8,02 10,86
TL COMMERCIAL LOAN INTERESTS % 11,75 11,70 14,50
TURKISH LIRA / DOLLAR EXCHANGE RATE 2,15 2,33 2,92
TURKISH LIRA / EURO EXCHANGE RATE 2,94 2,83 3,19
TURKISH LIRA BASKET EXCHANGE RATE 2,55 2,58 3,06
CENTRAL BANK REAL EFFECTIVE EXCHANGE RATE
2003=100100,95 105,46 98,36
FIGURE.4 DEVELOPMENTS IN TURKISH LIRA BASKET EXCHANGE RATE
BASKET EXCHANGE RATE TL
31.De
c04
.Jan
08.Ja
n12
.Jan
20.Ja
n28
.Jan
01.Fe
b05
.Feb
09.Fe
b13
.Feb
17.Fe
b21
.Feb
25.Fe
b01
.Mar
05.M
ar09
.Mar
13.M
ar17
.Mar
21.M
ar25
.Mar
29.M
ar02
.Apr
06.Ap
r10
.Apr
14.Ap
r18
.Apr
22.Ap
r26
.Apr
30.Ap
r04
.May
08.M
ay12
.May
16.M
ay20
.May
24.M
ay28
.May
01.Ju
n09
.Jun
13.Ju
n17
.Jun
21.Ju
n25
.Jun
29.Ju
n03
.Jul
07.Ju
l11
.Jul
15.Ju
l19
.Jul
23.Ju
l27
.Jul
31.Ju
l04
.Aug
08.Au
g12
.Aug
16.Au
g20
.Aug
24.Au
g28
.Aug
01.Se
p05
.Sep
09.Se
p13
.Sep
17.Se
p21
.Sep
25.Se
p29
.Sep
03.Oc
t07
.Oct
11.Oc
t15
.Oct
19.Oc
t23
.Oct
27.Oc
t31
.Oct
04.N
ov08
.Nov
12.N
ov16
.Nov
20.N
ov24
.Nov
28.N
ov02
.Dec
06.De
c10
.Dec
14.De
c18
.Dec
22.De
c26
.Dec
30.De
c
3,30
3,20
3,10
3,00
2,90
2,80
2,70
2,60
2,50
2,40

29ECONOMY AND FOREIGN TRADE REPORT 2016
inflation increased significantly, Turkish Lira depreciated about 20 percent and market interest rates went up significantly.The indicative bond interest rate of 8.02 percent at the end of 2014 became 10.86 percent at the end of 2015. TL loan rates increased about 2.9 points to reach 14.60 at the end of the year.In 2015 in general, Turkish Lira depreciated significantly. Turkish Lira lost value against Dollar and Euro; however, with the decrease in Euro-Dollar exchange rate, the main loss of value occurred against Dollar.
The Central Bank’s unresponsiveness to the depreciation of Turkish Lira accelerated its loss of value. Turkish Lira became one of the three most depreciated developing country currencies in 2015. The basket exchange rate of 2.55 TL at the end of 2014 closed the year 2015 at the level of 3.06 TL. According to the Central Bank’s Real Effective Exchange Rate Index, Turkish Lira depreciated about 6.7 percent compared to the previous year. The resulting fluctuation and rapid loss of value in Turkish Lira limited the foresight capability of the real sector and exporters.
TABLE.4 MAIN FOREIGN TRADE INDICATORS
SOURCE: TURKISH STATISTICAL INSTITUTE
INDICATORS 2013 2014 2015
EXPORTS BILLION DOLLARS 151,8 157,6 143,9
EXPORTS/NATIONAL INCOME % 18,4 19,7 20,0
IMPORTS BILLION DOLLARS 251,6 242,2 207,2
IMPORTS/NATIONAL INCOME % 30,6 30,3 28,8
FOREIGN TRADE BALANCE BILLION DOLLARS -99,8 -84,5 -63,3
FOREIGN TRADE BALANCE/ NATIONAL INCOME % -12,1 -10,6 -8,8
FOREIGN TRADE VOLUME BILLION DOLLARS 403,5 399,8 351,1
FOREIGN TRADE VOLUME/NATIONAL INCOME % 49 50 48,8
RATE OF EXPORTS MEETİNG İMPORTS % 60,3 65,1 69,5
Significant developments occurred in the main foreign trade in-dicators in 2015. The decline in global goods trade especially in value affected the main foreign indicators of Turkey, too. While declines occurred on value basis, increases did happen on quantitative basis, although limited. Developments in exchange rates and declines in energy and goods prices were also in-fluential. Decline in energy prices is influential especially in the decrease of imports. Protection measures implemented in the economy and depreciation of Turkish Lira were also determin-ing factors in foreign trade relations and shaped especially the imports side; another important factor affecting the exports was the geopolitical events emerging in major exports markets.
Exports declined 8.7 percent with 143.9 billion dollars in 2015 and its share in national income rose to 20 percent. Decrease in national income calculated in terms of dollars was influential in the increase in the share in national income.Imports decreased 14.5 percent down to 207.2 billion dollars; the share of imports in national income also decreased to 28.8 percent.Foreign trade deficit fell down to 63.3 billion dollars and its ratio to national income came down to 8.8 percent.Foreign trade volume also shrank to 351.1 billion dollars.
Ratio of foreign trade volume to national income, which reflects index of openness, decreased to 48.8 percent. Impact of the de-crease in national income in terms of dollar is seen in this ratio; rate of exports meeting imports reached its maximum level of the last four years with 69.5 percent.
FIGURE.6 EXPORTS AND EXPORTSNATIONAL INCOME RATIO
160155150145140135
20,5
19
18
172013
EXPORTS BILLION DOLLARS RATIO OF EXPORTS TO NATIONAL INCOME, PERCENT
18,4
151,8
157,6
143,9
19,7
20,0
2014 2015
EXPORTS AND EXPORTS/NATIONAL INCOME RATIO PERCENT
2013
60,3
65,1
69,5
2014 2015
FIGURE.7 RATE OF EXPORTS MEETING IMPORTS
RATE OF EXPORTS MEETING IMPORTS PERCENT
71
69
67
65
63
61
59
II.4 DEVELOPMENTS IN MAIN FOREIGN TRADE INDICATORS

30
›
2TURKISH ECONOMY AND DEVELOPMENTS IN FOREIGN TRADE
Within the framework of the existing global and lo-cal circumstances a more healthy, higher quality and sustainable economic growth is seen as a growth based on net exports. According to this, “balancing in economy” policies are being implemented in the economy for the purpose of ensuring growth based on net exports since 2012. The effect of these policies on growth was weak; it became more effective in 2014. It is seen that the effect of these policies weakened again. Assessing the economic growth by its sources in 2015, it is seen that growth is based on consump-
tion expenditures to a large extent, again. Net exports contribution is negative.Despite a real growth rate of 3.98 net exports made 0.30 negative points contribution in 2015. Exports decreased and made a contribution of 0.22 points, imports increased and made a contribution of 0.08 points; thus 0.30 points of net exports was generated.Economic growth displayed a better performance with 3.98 compared to the prevailing conditions in 2015. Pri-vate consumption expenditures led the way for growth. Effect of investment expenditures remained limited.
Current accounts balance consists of goods trade, service trade, other incomes and expenditures and current transfer incomes and expenditures. Foreign currency incomes of Tur-key within its current accounts balance decreased 10.1 per-cent in 2015 to 205.0 billion dollars. Goods trade and services trade incomes in foreign currency incomes decreased com-pared to the previous year. Goods trade decreased 10.0 per-cent to 152.1 billion dollars. The share of goods trade in total incomes went from 74.1 percent up to 74.2 percent. In ser-vices incomes, a setback of 10.5 percent was experienced.Total foreign currency expenditures decreased 12.7 percent to 237.2 billion dollars. Goods imports in foreign currency expenditures decreased 14.0 percent to 199.9 billion dollars; services expenditures decreased 10.5 percent. The share of goods imports in total foreign currency expenditures became
SOURCE: CENTRAL BANK OF REPUBLIC OF TURKEY
TABLE.6 GOODS TRADE IN CURRENT ACCOUNTS BALANCE, MILLION DOLLARS
TABLE.5 CONTRIBUTION OF NET EXPORTS TO ECONOMIC GROWTH
GROWTH ITEMS 2013 2014 2015
GROWTH 4,20 3,02 3,98
NET EXPORTS -2,21 +1,85 -0,30
EXPORTS +0,13 +1,80 -0,22
IMPORTS -2,34 -(-0,05) -(+0,08)
CONSUMPTION +3,79 +1,52 +3,72
PUBLIC CONSUMPTION +0,68 +0,90 +0,74
PRIVATE CONSUMPTION +3,11 +0,62 +2,98
INVESTMENTS +1,05 -0,33 0,85
PUBLIC INVESTMENTS +0,91 -0,42 0,32
PRIVATE INVESTMENTS +0,14 +0,09 0,53
STOCK CHANGE +1,57 -0,02 -0,30
SOURCE CALCULATED FROM TURKISH STATISTICAL INSTITUTE DATA
FIGURE.8 CONTRIBUTION OF EXPORTS TO GROWTH
3,00
2,00
1,00
0,00
-1,00
-2,00
-3,00
NET EXPORTS EXPORTS IMPORTS
-2,21
0,13
-2,34
1,80
-0,05
1,85
-0,30-0,22
0,08
2014 20152013
CONTRIBUTION OF EXPORTS TO GROWTH, POINTS
2013 2014 2015
A. CURRENT ACCOUNTS BALANCE (l-ll) -64,910 -43,552 -32,192
I. TOTAL INCOMES 216,718 227,970 204,964
1. GOODS EXPORTS 163,371 168,926 152,066
2. SERVICE INCOMES 46,584 51,657 46,225
3. OTHER INCOMES 4,523 4,874 4,470
4. CURRENT TRANSFER INCOMES 2,240 2,513 2,203
II. TOTAL EXPENDITURES 281,628 271,522 237,156
1. GOODS IMPORTS 243,294 232,523 199,886
2. SERVICE EXPENDITURES 23,398 24,889 22,266
3. OTHER EXPENDITURES 13,877 13,004 13,993
4. CURRENT TRANSFER EXPENDITURES 1,059 1,106 1,011
II.5 NET EXPORTS AND ITS CONTRIBUTION TO ECONOMIC GROWTH
II.6 CURRENT ACCOUNTS BALANCE AND GOODS TRADE

31ECONOMY AND FOREIGN TRADE REPORT 2016
SOURCE: CENTRAL BANK OF REPUBLIC OF TURKEY
TABLE.7 GOODS TRADE IN CURRENT ACCOUNTS BALANCE, MILLION DOLLARS
FIGURE .9 DEVELOPMENTS IN ITEMS CONSTITUTING CURRENT ACCOUNTS BALANCE
GOODS BALANCE
OTHER INCOMES BALANCE
SERVICES BALANCE
CURRENT TRANSFERS BALANCE
ELEMENTS OF CURRENT ACCOUNTS BALANCEBILLION DOLLARS
2013 2014 2015
A. CURRENT ACCOUNTS BALANCE (l+ll+lll+IV) -65,110 -43,552 -32,192
I. GOODS BALANCE -80,023 -63,597 -47,820
1.1 GOODS EXPORTS 163,371 168,926 152,066
1.2 GOODS IMPORTS -243,394 232,523 199,886
II. SERVICES BALANCE 23,086 26,768 23,959
11.1 SERVICES INCOMES 46,584 51,657 46,225
11.2 SERVICES EXPENDITURES -23,498 -24,889 22,266
III. OTHER INCOMES BALANCE -9,354 -8,130 -9,523
111.1 OTHER INCOMES 4,523 4,874 4,470
III.2 OTHER EXPENDITURES -13,877 -13,004 13,993
IV. CURRENT TRANSFERS BALANCE 1,181 1,407 1,192
IV.1 CURRENT TRANSFER INCOMES 2,240 2,513 2,203
IV.2 CURRENT TRANSFER EXPENDITURES -1,059 1,106 1,011
84.3 percent.In Turkey’s current accounts balance, while the goods trade and other incomes-expenditures balance have deficit, servic-es balance and current transfers balance have surplus.Goods trade balance deficit decreased from 63.6 billion dol-lars to 47.8 billion dollars, making a significant improvement in current accounts balance. On the other hand, surplus of services balance declined 10.5 percent to 23.96 billion dollars
in 2015. Other incomes-expenditures deficit increased 17.1 percent to reach 9.5 billion dollars.Services incomes and services balance is influential in the current accounts balance with the surplus they provide; nev-ertheless goods balance keeps its importance in the current accounts balance. Significant reduction in the goods balance in 2015 made the improvement in the current accounts bal-ance possible.
-9,4 -8,1 -9,5
-80 -63,6 -47,8
23,1 26,8 24
1,21,4 1,2
2013 2014 2015
Assessments are being made about the relation between the development of imports according to
goods groups and the performance of economic activities in 2015.
II.7 DEVELOPMENTS IN ECONOMIC ACTIVITIES AND EXPORTS-IMPORTS RELATION
II.7.1 Exports and economic activitiesInvestment goods imports decreased 4.3 percent in 2015. Due to the weakening of the foreign demand be-cause of the global slowdown and global supply surplus in many fields, the investment goods producers had to turn to the domestic market mostly.Agriculture, mining and industry sectors intermediate goods exports declined 8.9 percent in 2015. Exports of unprocessed raw materials for industry consisting of mostly minerals and ores decreased 20.3 percent. The decrease of 5.1 percent observed in the mining sector
in the first nine months indicates that the mining sector also shrank in the country.In 201, when both the imports and the exports declined, economic activities had to turn to the domestic market.Consumer goods exports decreased 9.1 percent in 2015. The decline in the exports of private cars, durable consumer goods, semi- durable consumer goods, non- durable consumer goods and processed and unpro-cessed food and beverage based consumer goods was the main factor for the slowdown in the manufacturing industry. By contrast, domestic private consumption expenditures that relatively increased in these product groups supported the production in these industries.
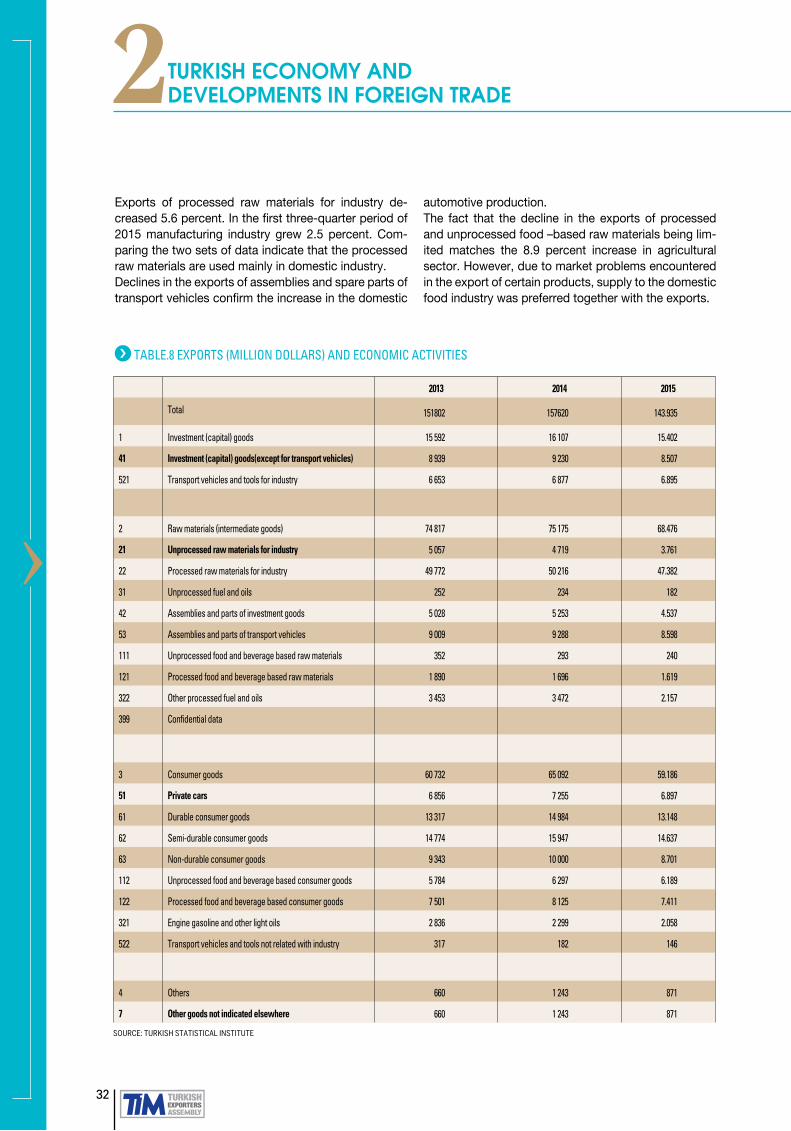
32
›
2TURKISH ECONOMY AND DEVELOPMENTS IN FOREIGN TRADE
Exports of processed raw materials for industry de-creased 5.6 percent. In the first three-quarter period of 2015 manufacturing industry grew 2.5 percent. Com-paring the two sets of data indicate that the processed raw materials are used mainly in domestic industry.Declines in the exports of assemblies and spare parts of transport vehicles confirm the increase in the domestic
automotive production.The fact that the decline in the exports of processed and unprocessed food –based raw materials being lim-ited matches the 8.9 percent increase in agricultural sector. However, due to market problems encountered in the export of certain products, supply to the domestic food industry was preferred together with the exports.
2013 2014 2015
Total 151802 157620 143.935
1 Investment (capital) goods 15 592 16 107 15.402
41 Investment (capital) goods(except for transport vehicles) 8 939 9 230 8.507
521 Transport vehicles and tools for industry 6 653 6 877 6.895
2 Raw materials (intermediate goods) 74 817 75 175 68.476
21 Unprocessed raw materials for industry 5 057 4 719 3.761
22 Processed raw materials for industry 49 772 50 216 47.382
31 Unprocessed fuel and oils 252 234 182
42 Assemblies and parts of investment goods 5 028 5 253 4.537
53 Assemblies and parts of transport vehicles 9 009 9 288 8.598
111 Unprocessed food and beverage based raw materials 352 293 240
121 Processed food and beverage based raw materials 1 890 1 696 1.619
322 Other processed fuel and oils 3 453 3 472 2.157
399 Confidential data
3 Consumer goods 60 732 65 092 59.186
51 Private cars 6 856 7 255 6.897
61 Durable consumer goods 13 317 14 984 13.148
62 Semi-durable consumer goods 14 774 15 947 14.637
63 Non-durable consumer goods 9 343 10 000 8.701
112 Unprocessed food and beverage based consumer goods 5 784 6 297 6.189
122 Processed food and beverage based consumer goods 7 501 8 125 7.411
321 Engine gasoline and other light oils 2 836 2 299 2.058
522 Transport vehicles and tools not related with industry 317 182 146
4 Others 660 1 243 871
7 Other goods not indicated elsewhere 660 1 243 871
TABLE.8 EXPORTS (MILLION DOLLARS) AND ECONOMIC ACTIVITIES
SOURCE: TURKISH STATISTICAL INSTITUTE

33ECONOMY AND FOREIGN TRADE REPORT 2016
2013 2014 2015
Total 251 661 242 176 207 203
1 Investment (capital) goods 36 771 35 995 34897
41 Investment (capital) goods(except for transport vehicles) 32 034 30 437 28 509
521 Transport vehicles and tools for industry 4 736 5 558 6 388
2 Raw materials (intermediate goods) 183 811 176 721 143293
21 Unprocessed raw materials for industry 13 926 13 298 9 329
22 Processed raw materials for industry 85 896 78 849 67 932
31 Unprocessed fuel and oils 923 847 2 976
42 Assemblies and parts of investment goods 12 411 12 152 11 421
53 Assemblies and parts of transport vehicles 11 890 12 187 12 088
111 Unprocessed food and beverage based raw materials 3 414 4 289 3 456
121 Processed food and beverage based raw materials 2 244 2 628 2 389
322 Other processed fuel and oils 17 425 17 702 10 277
399 Confidential data 35 679 34 765 23 425
3 Consumer goods 30 415 29 006 28587
51 Private cars 9 126 7 717 9 223
61 Durable consumer goods 4 962 4 663 3 766
62 Semi-durable consumer goods 6 794 6 912 6.279
63 Non-durable consumer goods 5 392 5 642 5 267
112 Unprocessed food and beverage based consumer goods 844 978 1 025
122 Processed food and beverage based consumer goods 1 619 1 778 1 903
321 Engine gasoline and other light oils 1 415 1 048 814
522 Transport vehicles and tools not related with industry 260 263 309
4 Others 662 453 426
7 Other goods not indicated elsewhere 662 453 426
TABLE.9 IMPORTS (MILLION DOLLARS) AND ECONOMIC ACTIVITIES
SOURCE: TURKISH STATISTICAL INSTITUTE
II.7.2 Imports and economic activitiesInvestment goods imports decreased 3.1 percent in 2015. While the imports of transport vehicles related with industry increased 14.9 percent, the decline in manufacturing industry machines imports is 6.3 percent. Investment goods imports de-clined together with the stagnation in investment expenditures.Intermediate goods imports decreased 18.9 percent. Unpro-cessed raw materials for industry imports decreased 29.8 percent; processed raw materials imports decreased 13.8 percent. Comparing the 2.5 percent growth in the manufac-turing industry with the decrease in the imports of processed intermediate goods, it is seen that mainly domestic intermedi-ate goods are used in the industrial production in 2015. The
sharp decline in the imports of unprocessed raw materials for industry came about mostly due to the declines in the prices.Imports of processed fuels, oils, petroleum and natural gas decreased significantly. The decline in the oil and natural gas prices in 2015 was influential in this. Slow growths in manufac-turing industry, transportation and energy sectors had limiting effects on the growth of energy consumption in 2015. The small decrease of 1.4 percent in the imports of consumer goods matches the increase in the domestic consumption ex-penditures. Especially the increase in the imports of private cars matches the increase in the sales of private cars. The decline in the imports of semi-durable and non-durable con-sumer goods, on the other hand, matches the fact that the growth especially in the modern retail sector remained under the expectations.


3EXPORTS

3EXPORTS
36
› III.1 MAIN EXPORT INDICATORS
Our Share in World Goods Exports Rose to 0.87 Percent Turkey’s share in world goods exports rose to 0.87 percent in 2015. This share was 0.83 percent in 2013 and had increased to 0.85 percent in 2014. With the exports declining under the decrease in the world goods exports in 2015, our share rose to 0.87 percent.As a result of the geopolitical events in the regions close to Tur-key and decrease in their incomes due to their dependence on energy, there was significant shrinkage in many of our important markets. Russia and Iraq are the most significant markets. In spite of this, the decline in exports remained below the decline in world exports and this must be considered a success.
2013 2014 2015
WORLD GOODS EXPORTS GROWTH ON VALUE BASIS %
2.0 1.2 -10.9
TURKEY EXPORTS GROWTH ON VALUE BASIS %
-0.4 3.8 -8.7
2013 2014 2015
TURKEY EXPORTS (BILLION DOLLARS)
151,9 157,6 143,9
WORLD GOODS EXPORTS (BILLION DOLLARS)
18.270 18.494 16.482
TURKEY SHARE (%) 0,83 0,85 0,87
TABLE.2 COMPARISON OF GROWTH WITH WORLD GOODS EXPORTS
TABLE.3 OUR SHARE IN WORLD GOODS TRADE
SOURCE: TURKISH STATISTICAL INSTITUTE, WORLD TRADE ORGANIZATION
SOURCE: TURKISH STATISTICAL INSTITUTE, WORLD TRADE ORGANIZATION
FIGURE.2 OUR SHARE IN WORLD GOODS EXPORTS
0,880,870,860,850,840,830,820,81
2013
0,83
2014 2015
0,85
0,87
OUR SHARE IN WORLD GOODS EXPORTS, PERCENT
III.1.1 Total Exports and Our Place in World Goods Exports
Exports decreased 8.7 percent in 2014 Exports decreased 8.7 percent in 2015 to 143.9 bil-lion dollars; after the increase in 2014 exports de-creased significantly in 2015. 2015 has been a year when the global goods trade had a sharp decline. In this framework Turkey’s exports showed a similar decline.
6420-2-4-6-8-10
2013 2014 2015
EXPORTS BILLION DOLLARS 151.9 157.6 143.9
CHANGE ON VALUE BASIS (%) -0.4 3.8 -8.7
TABLE.1 EXPORTS
SOURCE: TURKISH STATISTICAL INSTITUTE
FIGURE.1 EXPORTS AND ITS ANNUAL GROWTH
160
155
150
145
140
1352013 2014 2015
3,8
-8,7
EXPORTS BILLION DOLLARS
ANNUAL GROWTH%
EXPORTS BILLION DOLLARS AND GROWTH PERCENT
-0,5
151,9
157,6
143,9
Decline in Exports Lower than Decline in World The increase in our exports in the last three years on value basis is compared to the increase of world goods exports on value basis. In 2013, Turkey’s exports decreased in value and was placed lower than the increase in world goods exports. In 2014, Turkey’s exports increase of 3.8 percent on value basis was above the 1.2 percent increase in the world exports.In 2015, both the world exports and Turkey’s exports declined. Turkey’s 8.7 percent decline in exports was lower than the 10.9 decrease in the world exports.

ECONOMY AND FOREIGN TRADE REPORT 2016 37
TABLE.4 OUR RANK IN WORLD GOODS EXPORTS
SOURCE: WORLD TRADE ORGANIZATION
1 CHINA 2.343 2.275 -2,9 13,70 1
2 USA 1.623 1.505 -7,3 9,07 2
3 GERMANY 1.511 1.329 -12,0 8,01 3
4 JAPAN 684 625 -8,6 3,77 4
5 HOLLAND 672 567 -15,6 3,42 5
6 SOUTH KOREA 573 527 -8,0 3,17 7
7 HONG KONG 524 511 -2,5 3,08 9
8 FRANCE 583 506 -13,2 3,05 6
9 ENGLAND 507 460 -9,3 2,77 10
10 ITALY 529 459 -13,2 2,77 8
11 CANADA 474 408 -13,9 2,46 12
12 BELGIUM 469 398 -15,1 2,40 13
13 MEXICO 398 381 -4,3 2,30 15
14 SİNGAPORE 410 347 -15,4 2,09 14
15 RUSSIA 497 340 -31,6 2,05 11
16 SWITZERLAND 312 290 -6,9 1,75 22
17 TAIWAN 314 285 -9,2 1,72 20
18 SPAIN 323 282 -12,7 1,70 18
19 INDIA 317 267 -15,8 1,61 19
20 UAE 360 265 -29,3 1,61 16
21 THAILAND 228 214 -6,1 1,29 24
22 S. ARABIA 354 202 -41,1 1,20 17
23 MALAYSIA 234 200 -14,5 1,20 23
24 POLAND 217 198 -8,8 1,19 26
25 BRAZIL 225 191 -15,1 1,15 25
26 AUSTRALIA 240 188 -21,7 1,13 21
27 VİETNAM 150 162 +8,0 0,98 32
28 CHECK REP. 174 158 -9,2 0,95 29
29 AUSTRIA 177 152 -14,1 0,92 27
30 INDONESIA 176 150 -14,8 0,90 28
31 TURKEY 158 144 -8,7 0,87 31
EXPORTS (BILLION DOLLARS) 2014/2015 CHANGE (%)
2015 SHARE (%) 2014 RANK
RANK COUNTRY 2014 2015
Our world exports ranking of 31 did not change in 2015 With 143.9 (144) billion dollars of exports it made in 2015, Turkey kept its 31st place in the world ex-ports ranking and there was no change in its rank-ing.Compared with the top 30 exporters, Turkey is among the countries whose exports decreased in a more limited manner in 2015, with 8.7 percent. The
only country in the top 30 that increased its exports was Vietnam.All of the remaining 29 countries’ exports declined; the sharpest declines in exports occurred in energy exporting countries such as Russia and S. Arabia. Among the developing countries like Turkey, Ma-laysia’s exports decreased 14.5 percent, Indone-sia’s 14.8 percent, Poland’s 8.8 percent and Mexi-co’s 4.3 percent.
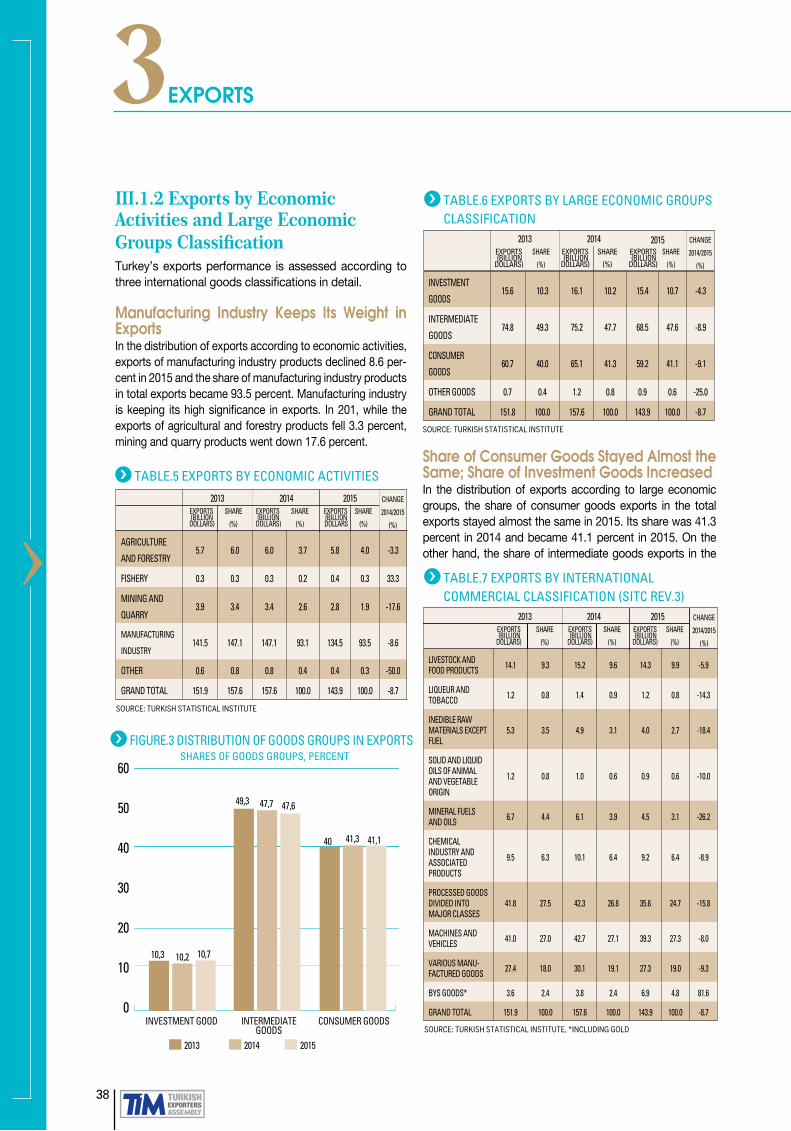
38
›
3EXPORTS
INVESTMENT
GOODS15.6 10.3 16.1 10.2 15.4 10.7 -4.3
INTERMEDIATE
GOODS74.8 49.3 75.2 47.7 68.5 47.6 -8.9
CONSUMER
GOODS60.7 40.0 65.1 41.3 59.2 41.1 -9.1
OTHER GOODS 0.7 0.4 1.2 0.8 0.9 0.6 -25.0
GRAND TOTAL 151.8 100.0 157.6 100.0 143.9 100.0 -8.7
2013 2014 CHANGE
2014/2015
(%)
SHARE
(%)
SHARE
(%)
SHARE
(%)
EXPORTS (BILLION DOLLARS)
EXPORTS (BILLIONDOLLARS)
EXPORTS (BILLION DOLLARS)
TABLE.5 EXPORTS BY ECONOMIC ACTIVITIES
TABLE.6 EXPORTS BY LARGE ECONOMIC GROUPS CLASSIFICATION
TABLE.7 EXPORTS BY INTERNATIONAL COMMERCIAL CLASSIFICATION (SITC REV.3)
III.1.2 Exports by Economic Activities and Large Economic Groups Classification Turkey’s exports performance is assessed according to three international goods classifications in detail.
Manufacturing Industry Keeps Its Weight in Exports In the distribution of exports according to economic activities, exports of manufacturing industry products declined 8.6 per-cent in 2015 and the share of manufacturing industry products in total exports became 93.5 percent. Manufacturing industry is keeping its high significance in exports. In 201, while the exports of agricultural and forestry products fell 3.3 percent, mining and quarry products went down 17.6 percent.
SOURCE: TURKISH STATISTICAL INSTITUTE
SOURCE: TURKISH STATISTICAL INSTITUTE, *INCLUDING GOLD
AGRICULTURE
AND FORESTRY5.7 6.0 6.0 3.7 5.8 4.0 -3.3
FISHERY 0.3 0.3 0.3 0.2 0.4 0.3 33.3
MINING AND
QUARRY3.9 3.4 3.4 2.6 2.8 1.9 -17.6
MANUFACTURING
INDUSTRY141.5 147.1 147.1 93.1 134.5 93.5 -8.6
OTHER 0.6 0.8 0.8 0.4 0.4 0.3 -50.0
GRAND TOTAL 151.9 157.6 157.6 100.0 143.9 100.0 -8.7
2013 2014 CHANGE
2014/2015
(%)
SHARE
(%)
SHARE
(%)
SHARE
(%)
EXPORTS (BILLION DOLLARS
EXPORTS (BILLION
DOLLARS)
EXPORTS (BILLION
DOLLARS)
LIVESTOCK AND FOOD PRODUCTS 14.1 9.3 15.2 9.6 14.3 9.9 -5.9
LIQUEUR AND TOBACCO 1.2 0.8 1.4 0.9 1.2 0.8 -14.3
INEDIBLE RAW MATERIALS EXCEPT FUEL
5.3 3.5 4.9 3.1 4.0 2.7 -18.4
SOLID AND LIQUID OILS OF ANIMAL AND VEGETABLE ORIGIN
1.2 0.8 1.0 0.6 0.9 0.6 -10.0
MINERAL FUELS AND OILS 6.7 4.4 6.1 3.9 4.5 3.1 -26.2
CHEMICAL INDUSTRY AND ASSOCIATED PRODUCTS
9.5 6.3 10.1 6.4 9.2 6.4 -8.9
PROCESSED GOODS DIVIDED INTO MAJOR CLASSES
41.8 27.5 42.3 26.8 35.6 24.7 -15.8
MACHINES AND VEHICLES 41.0 27.0 42.7 27.1 39.3 27.3 -8.0
VARIOUS MANU-FACTURED GOODS 27.4 18.0 30.1 19.1 27.3 19.0 -9.3
BYS GOODS* 3.6 2.4 3.8 2.4 6.9 4.8 81.6
GRAND TOTAL 151.9 100.0 157.6 100.0 143.9 100.0 -8.7
2013 2014 CHANGE
2014/2015
(%)
SHARE
(%)
SHARE
(%)
SHARE
(%)
EXPORTS (BILLIONDOLLARS)
EXPORTS (BILLIONDOLLARS)
EXPORTS (BILLION DOLLARS)
Share of Consumer Goods Stayed Almost the Same; Share of Investment Goods Increased In the distribution of exports according to large economic groups, the share of consumer goods exports in the total exports stayed almost the same in 2015. Its share was 41.3 percent in 2014 and became 41.1 percent in 2015. On the other hand, the share of intermediate goods exports in the
FIGURE.3 DISTRIBUTION OF GOODS GROUPS IN EXPORTS
60
50
40
30
20
10
0INVESTMENT GOOD
2013 2014 2015
10,3
49,3
40 41,3 41,1
47,7
10,2 10,7
INTERMEDIATE GOODS
CONSUMER GOODS
SHARES OF GOODS GROUPS, PERCENT
2015
2015
2015
47,6
SOURCE: TURKISH STATISTICAL INSTITUTE

39ECONOMY AND FOREIGN TRADE REPORT 2016
TABLE.8 EXPORTS BY CURRENCY TYPESIII.1.3 Exports by Currency Types and Exports with TL Share of Exports with TL did not Change When the distribution of Turkey’s exports is evaluated accord-ing to currency types, the dominance of Dollar and Euro is seen; approximately 92-93 percent of the exports is still being made in these currencies. In 2015, the share of the exports with Dollar is 47.3 percent; the share of exports with Euro, on the other hand, increased 0.3 percent to 44.7 percent. Turkish Lira became the third most commonly used currency used in exports in 2015 with 4.2 percent. Pound Sterling has a share of 3.4 percent; exports with Ruble decreased significantly.
SOURCE: TURKISH STATISTICAL INSTITUTE
total exports came out to be 47.6 percent in 2015, while it was 47.6 percent 2014. The share of investment goods in-creased from 10.2 percent in 2014 to 10.7 percent in 2015In 2015 when exports decreased the shares of intermediate goods and consumer goods remained almost the same, the share of investment goods increased. In 2015 when exports decreased the shares of intermediate goods and consumer goods remained almost the same, the share of investment goods increased.
Machine and Vehicle Exports Climbed to the Top When the distribution of the exports is evaluated according to Inter-national Commercial Classification (SITC Rev.3) machines and ve-hicles rose to 27.3 percent exports shares with 39.3 billion dollars in 2015 and became the most exported product group. Exports of the processed goods divided into major classes, which are mostly in-dustrial intermediate goods, decreased to 24.7 percent. The share of the various manufactured goods that consist of semi-durable consumer goods was placed third with 19.0 percent in 2015.
BILLION
DOLLARS
SHARE
(%)
BILLION
DOLLARS
SHARE
(%)
BILLION
DOLLARS
SHARE
(%)
DOLAR 71,9 47,4 74,7 47,4 68,0 47,3
EURO 69,3 45,6 70,0 44,4 64,3 44,7
STERLING 4,3 2,8 5,1 3,2 4,9 3,4
RUBLE 0,5 0,3 0,5 0,3 0,2 0,1
TL 5,4 3,6 6,7 4,3 6,1 4,2
OTHER 0,5 0,3 0,6 0,4 0,4 0,3
TOTAL 151,9 100,0 157,6 100,0 143,9 100,0
201520142013
FIGURE.4 EXPORTS BY CURRENCY TYPES
50
40
30
20
10
0 DOLAR EURO STERLIN TL
47,3 45,6 44,4 44,7
2,8 3,2 3,4 3,6 4,3 4,2
47,4 47,4
2013 2014 2015
EXPORTS BY CURRENCY TYPES, PERCENT
III.1.4 Exports By Payment Methods and Transportation Modes Share of Cash against Goods Keeps Increasing in Payment Methods When the distribution of Turkey’s exports is evaluated according to payment methods, it is seen that while the share of cash against goods is increasing, the shares of cash against documents and
letter of credit are decreasing. The share of cash against goods was 61.8 percent in 2013 and it rose to 66.02 percent in 2015. In 2015, 95.0 billion dollars of exports was made with cash against goods payment. The share of payment with letter of credit was 9.68 percent in 2013 and decreased to 8.20 percent in 2015.
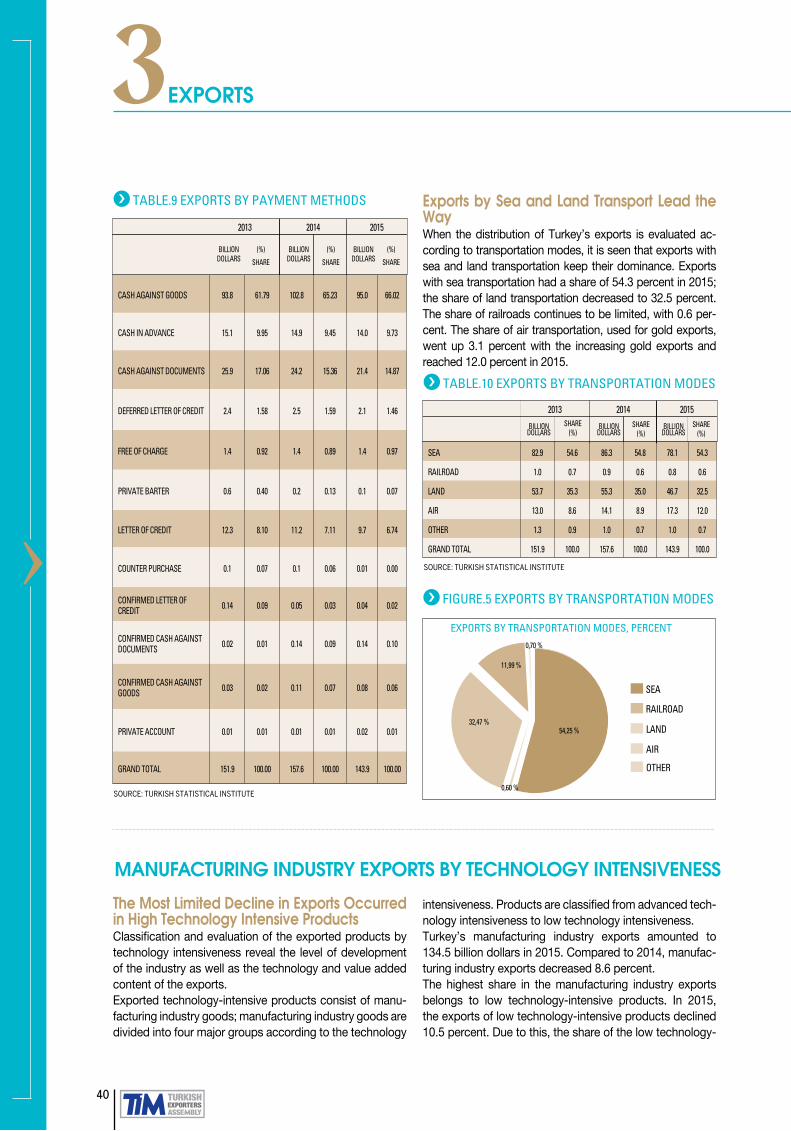
40
›
3EXPORTS
TABLE.10 EXPORTS BY TRANSPORTATION MODES
SOURCE: TURKISH STATISTICAL INSTITUTE
TABLE.9 EXPORTS BY PAYMENT METHODS
CASH AGAINST GOODS 93.8 61.79 102.8 65.23 95.0 66.02
CASH IN ADVANCE 15.1 9.95 14.9 9.45 14.0 9.73
CASH AGAINST DOCUMENTS 25.9 17.06 24.2 15.36 21.4 14.87
DEFERRED LETTER OF CREDIT 2.4 1.58 2.5 1.59 2.1 1.46
FREE OF CHARGE 1.4 0.92 1.4 0.89 1.4 0.97
PRIVATE BARTER 0.6 0.40 0.2 0.13 0.1 0.07
LETTER OF CREDIT 12.3 8.10 11.2 7.11 9.7 6.74
COUNTER PURCHASE 0.1 0.07 0.1 0.06 0.01 0.00
CONFIRMED LETTER OF CREDIT 0.14 0.09 0.05 0.03 0.04 0.02
CONFIRMED CASH AGAINST DOCUMENTS 0.02 0.01 0.14 0.09 0.14 0.10
CONFIRMED CASH AGAINST GOODS 0.03 0.02 0.11 0.07 0.08 0.06
PRIVATE ACCOUNT 0.01 0.01 0.01 0.01 0.02 0.01
GRAND TOTAL 151.9 100.00 157.6 100.00 143.9 100.00
2013 2014
(%)
SHARE
(%)
SHARE
(%)
SHARE
BILLION DOLLARS
BILLION DOLLARS
BILLION DOLLARS
2015
SOURCE: TURKISH STATISTICAL INSTITUTE
SEA 82.9 54.6 86.3 54.8 78.1 54.3
RAILROAD 1.0 0.7 0.9 0.6 0.8 0.6
LAND 53.7 35.3 55.3 35.0 46.7 32.5
AIR 13.0 8.6 14.1 8.9 17.3 12.0
OTHER 1.3 0.9 1.0 0.7 1.0 0.7
GRAND TOTAL 151.9 100.0 157.6 100.0 143.9 100.0
2013 2014SHARE
(%)SHARE
(%)SHARE
(%)BILLION
DOLLARS BILLION
DOLLARS BILLION
DOLLARS
2015
Exports by Sea and Land Transport Lead the Way When the distribution of Turkey’s exports is evaluated ac-cording to transportation modes, it is seen that exports with sea and land transportation keep their dominance. Exports with sea transportation had a share of 54.3 percent in 2015; the share of land transportation decreased to 32.5 percent. The share of railroads continues to be limited, with 0.6 per-cent. The share of air transportation, used for gold exports, went up 3.1 percent with the increasing gold exports and reached 12.0 percent in 2015.
FIGURE.5 EXPORTS BY TRANSPORTATION MODES
SEA
RAILROAD
LAND
AIR
OTHER
EXPORTS BY TRANSPORTATION MODES, PERCENT
The Most Limited Decline in Exports Occurred in High Technology Intensive Products Classification and evaluation of the exported products by technology intensiveness reveal the level of development of the industry as well as the technology and value added content of the exports.Exported technology-intensive products consist of manu-facturing industry goods; manufacturing industry goods are divided into four major groups according to the technology
intensiveness. Products are classified from advanced tech-nology intensiveness to low technology intensiveness.Turkey’s manufacturing industry exports amounted to 134.5 billion dollars in 2015. Compared to 2014, manufac-turing industry exports decreased 8.6 percent. The highest share in the manufacturing industry exports belongs to low technology-intensive products. In 2015, the exports of low technology-intensive products declined 10.5 percent. Due to this, the share of the low technology-
MANUFACTURING INDUSTRY EXPORTS BY TECHNOLOGY INTENSIVENESS
54,25 %
11,99 %
0,70 %
32,47 %
0,60 %
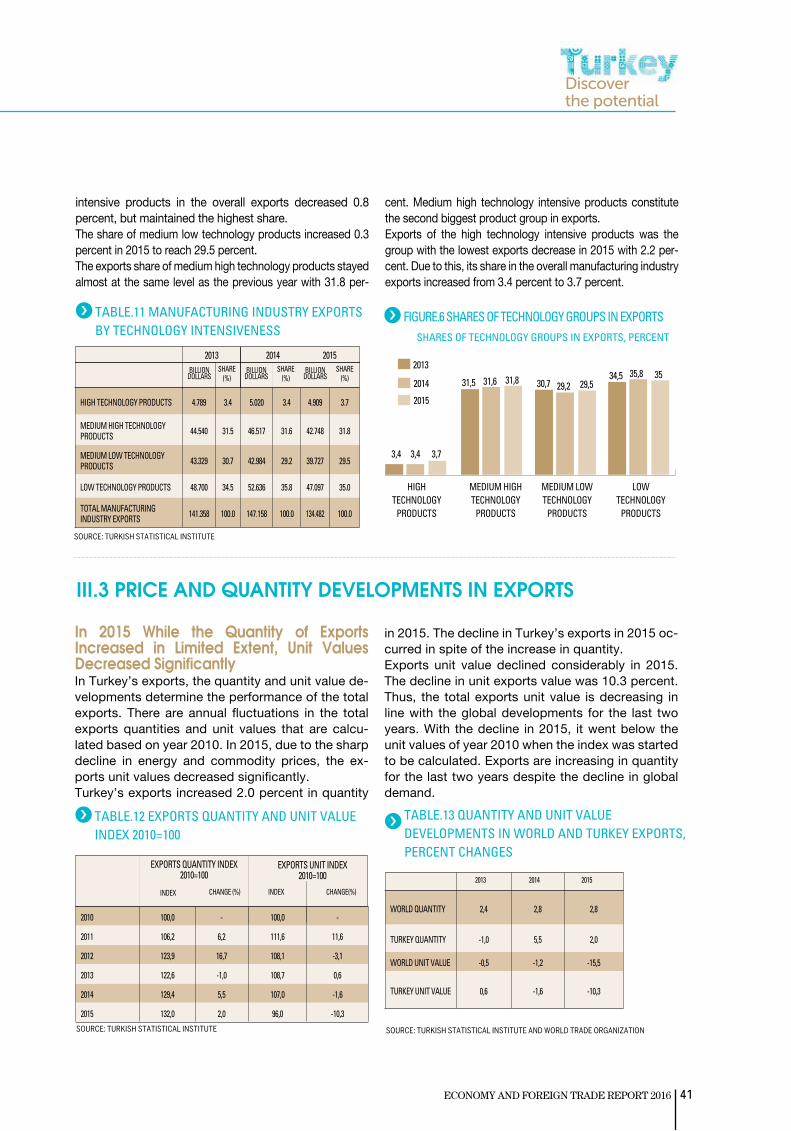
41ECONOMY AND FOREIGN TRADE REPORT 2016
intensive products in the overall exports decreased 0.8 percent, but maintained the highest share.The share of medium low technology products increased 0.3 percent in 2015 to reach 29.5 percent.The exports share of medium high technology products stayed almost at the same level as the previous year with 31.8 per-
cent. Medium high technology intensive products constitute the second biggest product group in exports.Exports of the high technology intensive products was the group with the lowest exports decrease in 2015 with 2.2 per-cent. Due to this, its share in the overall manufacturing industry exports increased from 3.4 percent to 3.7 percent.
TABLE.11 MANUFACTURING INDUSTRY EXPORTS BY TECHNOLOGY INTENSIVENESS
SOURCE: TURKISH STATISTICAL INSTITUTE
HIGH TECHNOLOGY PRODUCTS 4.789 3.4 5.020 3.4 4.909 3.7
MEDIUM HIGH TECHNOLOGY PRODUCTS 44.540 31.5 46.517 31.6 42.748 31.8
MEDIUM LOW TECHNOLOGY PRODUCTS 43.329 30.7 42.984 29.2 39.727 29.5
LOW TECHNOLOGY PRODUCTS 48.700 34.5 52.636 35.8 47.097 35.0
TOTAL MANUFACTURING INDUSTRY EXPORTS 141.358 100.0 147.158 100.0 134.482 100.0
2013 2014 2015SHARE
(%)BILLION
DOLLARS
FIGURE.6 SHARES OF TECHNOLOGY GROUPS IN EXPORTS
HIGH TECHNOLOGY
PRODUCTS
2013
2014
2015
3,4 3,4 3,7
31,5 31,6 31,8 30,7 29,2 29,534,5 35,8 35
MEDIUM HIGH TECHNOLOGY
PRODUCTS
MEDIUM LOW TECHNOLOGY
PRODUCTS
LOW TECHNOLOGY
PRODUCTS
SHARES OF TECHNOLOGY GROUPS IN EXPORTS, PERCENT
TABLE.12 EXPORTS QUANTITY AND UNIT VALUE INDEX 2010=100
TABLE.13 QUANTITY AND UNIT VALUE DEVELOPMENTS IN WORLD AND TURKEY EXPORTS, PERCENT CHANGES
SOURCE: TURKISH STATISTICAL INSTITUTE SOURCE: TURKISH STATISTICAL INSTITUTE AND WORLD TRADE ORGANIZATION
2010 100,0 - 100,0 -
2011 106,2 6,2 111,6 11,6
2012 123,9 16,7 108,1 -3,1
2013 122,6 -1,0 108,7 0,6
2014 129,4 5,5 107,0 -1,6
2015 132,0 2,0 96,0 -10,3
WORLD QUANTITY 2,4 2,8 2,8
TURKEY QUANTITY -1,0 5,5 2,0
WORLD UNIT VALUE -0,5 -1,2 -15,5
TURKEY UNIT VALUE 0,6 -1,6 -10,3
EXPORTS QUANTITY INDEX 2010=100
EXPORTS UNIT INDEX 2010=100
CHANGE (%) CHANGE(%) 2014
INDEX INDEX2013
In 2015 While the Quantity of Exports Increased in Limited Extent, Unit Values Decreased Significantly In Turkey’s exports, the quantity and unit value de-velopments determine the performance of the total exports. There are annual fluctuations in the total exports quantities and unit values that are calcu-lated based on year 2010. In 2015, due to the sharp decline in energy and commodity prices, the ex-ports unit values decreased significantly.Turkey’s exports increased 2.0 percent in quantity
in 2015. The decline in Turkey’s exports in 2015 oc-curred in spite of the increase in quantity.Exports unit value declined considerably in 2015. The decline in unit exports value was 10.3 percent. Thus, the total exports unit value is decreasing in line with the global developments for the last two years. With the decline in 2015, it went below the unit values of year 2010 when the index was started to be calculated. Exports are increasing in quantity for the last two years despite the decline in global demand.
III.3 PRICE AND QUANTITY DEVELOPMENTS IN EXPORTS
2015
BILLION DOLLARS
BILLION DOLLARS
SHARE(%)
SHARE(%)

42
›
3EXPORTS
SOURCE: TURKISH STATISTICAL INSTITUTE SOURCE: TURKISH STATISTICAL INSTITUTE
TABLE.14 QUANTITY DEVELOPMENTS IN EXPORTS (EXPORTS QUANTITY INDEX) (2010=100) ACCORDING TO INTERNATIONAL COMMERCIAL CLASSIFICATION (SITC REV.3)
TABLE.15 UNIT VALUE DEVELOPMENTS IN EXPORTS (EXPORTS QUANTITY INDEX) (2010=100) ACCORDING TO INTERNATIONAL COMMERCIAL CLASSIFICATION (SITC REV.3)
2013 2014 2015 2013/2014 CHANGE
(%)
2014/2015 CHANGE
(%)
LIVESTOCK AND FOOD
PRODUCTS 107,8 113,0 111,4 4,8 0,9
LIQUEUR AND
TOBACCO127,1 126,3 117,7 -0,6 -6,8
INEDIBLE RAW
MATERIALS EXCEPT
FUEL
107,5 106,6 95,2 -0,8 -10,7
SOLID AND LIQUID OILS OF
ANIMAL AND VEGETABLE
ORIGIN
104,5 111,7 106,7 6,9 -4,5
MINERAL FUELS AND OILS 132,8 120,4 72,0 -9,3 -40,2
CHEMICAL INDUSTRY AND
ASSOCIATED PRODUCTS 115,0 113,9 104,7 -0,9 -8,1
PROCESSED GOODS DIVIDED
INTO MAJOR CLASSES 107,1 105,2 92,5 -1,8 -12,0
MACHINES AND VEHICLES 103,5 101,9 92,3 -1,5 -9,4
VARIOUS MANUFACTURED
GOODS112,1 110,0 100,6 -1,9 -8,5
Decline in Turkey’s Unit Exports Value is Below the Exports Unit Value Decline in the World Quantity and value developments in Turkey’s exports are compared to quantity and value trends in world’s goods trade.It is observed that the total exports unit value is dropping in world goods trade for the last three years; exports unit value decreased 0.5 percent in 2013, 1.2 percent in 2014 and 15.5 percent in 2015. Prices of oil and all commercial goods are de-
EXPORTS QUANTITY AND UNIT VALUE INDEX 2010=100
FIGURE.7 QUANTITY AND UNIT VALUE DEVELOPMENTS IN EXPORTS
132
2010 2011 2012 2013 2014 2015
EXPORTS UNIT VALUE INDEX EXPORTS QUANTITY INDEX
100
111,6
123,9 122,6129,4
107
96
108,7108,1106,2
140
130
120
110
100
90
2013 2014 2015 2013/2014 CHANGE
(%)
2014/2015 CHANGE
(%)
LIVESTOCK AND FOOD
PRODUCTS 124.7 127.8 122.8 2.5 -3.9
LIQUEUR AND
TOBACCO103.5 122.4 116.2 18.3 -5.1
INEDIBLE RAW
MATERIALS EXCEPT
FUEL
124.4 119.3 108.2 -4.1 -9.3
SOLID AND LIQUID
OILS OF ANIMAL AND
VEGETABLE ORIGIN
340.4 260.9 232.2 -23.4 -11.0
MINERAL FUELS AND
OILS113.1 113.6 140.8 0.4 23.9
CHEMICAL INDUSTRY
AND ASSOCIATED
PRODUCTS
120.8 130.3 128.7 7.9 -1.2
PROCESSED GOODS
DIVIDED INTO MAJOR
CLASSES
117.7 121.2 116.3 3.0 -4.0
MACHINES AND
VEHICLES124.6 131.9 134.0 5.9 1.6
VARIOUS
MANUFACTURED
GOODS
123.2 138.7 137.5 12.6 -0.9
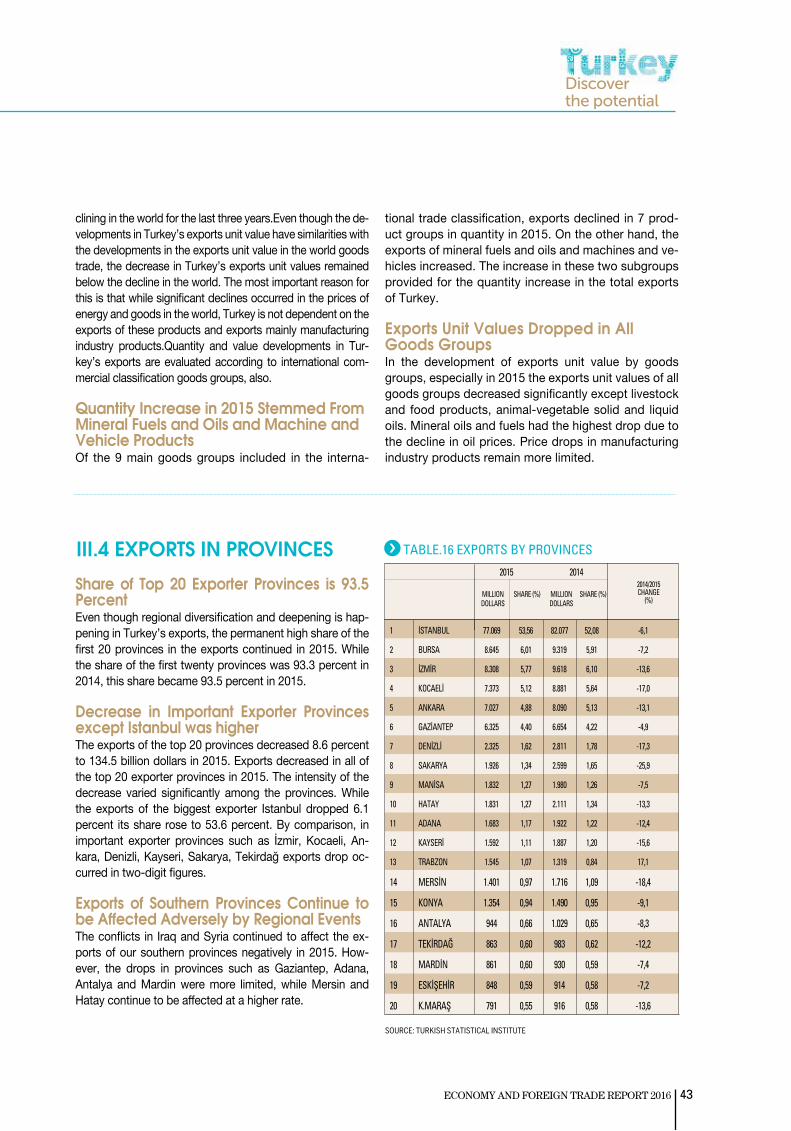
43ECONOMY AND FOREIGN TRADE REPORT 2016
SOURCE: TURKISH STATISTICAL INSTITUTE
Share of Top 20 Exporter Provinces is 93.5 Percent Even though regional diversification and deepening is hap-pening in Turkey’s exports, the permanent high share of the first 20 provinces in the exports continued in 2015. While the share of the first twenty provinces was 93.3 percent in 2014, this share became 93.5 percent in 2015.
Decrease in Important Exporter Provinces except Istanbul was higher The exports of the top 20 provinces decreased 8.6 percent to 134.5 billion dollars in 2015. Exports decreased in all of the top 20 exporter provinces in 2015. The intensity of the decrease varied significantly among the provinces. While the exports of the biggest exporter Istanbul dropped 6.1 percent its share rose to 53.6 percent. By comparison, in important exporter provinces such as İzmir, Kocaeli, An-kara, Denizli, Kayseri, Sakarya, Tekirdağ exports drop oc-curred in two-digit figures.
Exports of Southern Provinces Continue to be Affected Adversely by Regional Events The conflicts in Iraq and Syria continued to affect the ex-ports of our southern provinces negatively in 2015. How-ever, the drops in provinces such as Gaziantep, Adana, Antalya and Mardin were more limited, while Mersin and Hatay continue to be affected at a higher rate.
clining in the world for the last three years.Even though the de-velopments in Turkey’s exports unit value have similarities with the developments in the exports unit value in the world goods trade, the decrease in Turkey’s exports unit values remained below the decline in the world. The most important reason for this is that while significant declines occurred in the prices of energy and goods in the world, Turkey is not dependent on the exports of these products and exports mainly manufacturing industry products.Quantity and value developments in Tur-key’s exports are evaluated according to international com-mercial classification goods groups, also.
Quantity Increase in 2015 Stemmed From Mineral Fuels and Oils and Machine and Vehicle Products Of the 9 main goods groups included in the interna-
tional trade classification, exports declined in 7 prod-uct groups in quantity in 2015. On the other hand, the exports of mineral fuels and oils and machines and ve-hicles increased. The increase in these two subgroups provided for the quantity increase in the total exports of Turkey.
Exports Unit Values Dropped in All Goods Groups In the development of exports unit value by goods groups, especially in 2015 the exports unit values of all goods groups decreased significantly except livestock and food products, animal-vegetable solid and liquid oils. Mineral oils and fuels had the highest drop due to the decline in oil prices. Price drops in manufacturing industry products remain more limited.
III.4 EXPORTS IN PROVINCES TABLE.16 EXPORTS BY PROVINCES
1 İSTANBUL 77.069 53,56 82.077 52,08 -6,1
2 BURSA 8.645 6,01 9.319 5,91 -7,2
3 İZMİR 8.308 5,77 9.618 6,10 -13,6
4 KOCAELİ 7.373 5,12 8.881 5,64 -17,0
5 ANKARA 7.027 4,88 8.090 5,13 -13,1
6 GAZİANTEP 6.325 4,40 6.654 4,22 -4,9
7 DENİZLİ 2.325 1,62 2.811 1,78 -17,3
8 SAKARYA 1.926 1,34 2.599 1,65 -25,9
9 MANİSA 1.832 1,27 1.980 1,26 -7,5
10 HATAY 1.831 1,27 2.111 1,34 -13,3
11 ADANA 1.683 1,17 1.922 1,22 -12,4
12 KAYSERİ 1.592 1,11 1.887 1,20 -15,6
13 TRABZON 1.545 1,07 1.319 0,84 17,1
14 MERSİN 1.401 0,97 1.716 1,09 -18,4
15 KONYA 1.354 0,94 1.490 0,95 -9,1
16 ANTALYA 944 0,66 1.029 0,65 -8,3
17 TEKİRDAĞ 863 0,60 983 0,62 -12,2
18 MARDİN 861 0,60 930 0,59 -7,4
19 ESKİŞEHİR 848 0,59 914 0,58 -7,2
20 K.MARAŞ 791 0,55 916 0,58 -13,6
2015 2014
SHARE (%)SHARE (%)2014/2015 CHANGE
(%)MILLION DOLLARS
MILLION DOLLARS
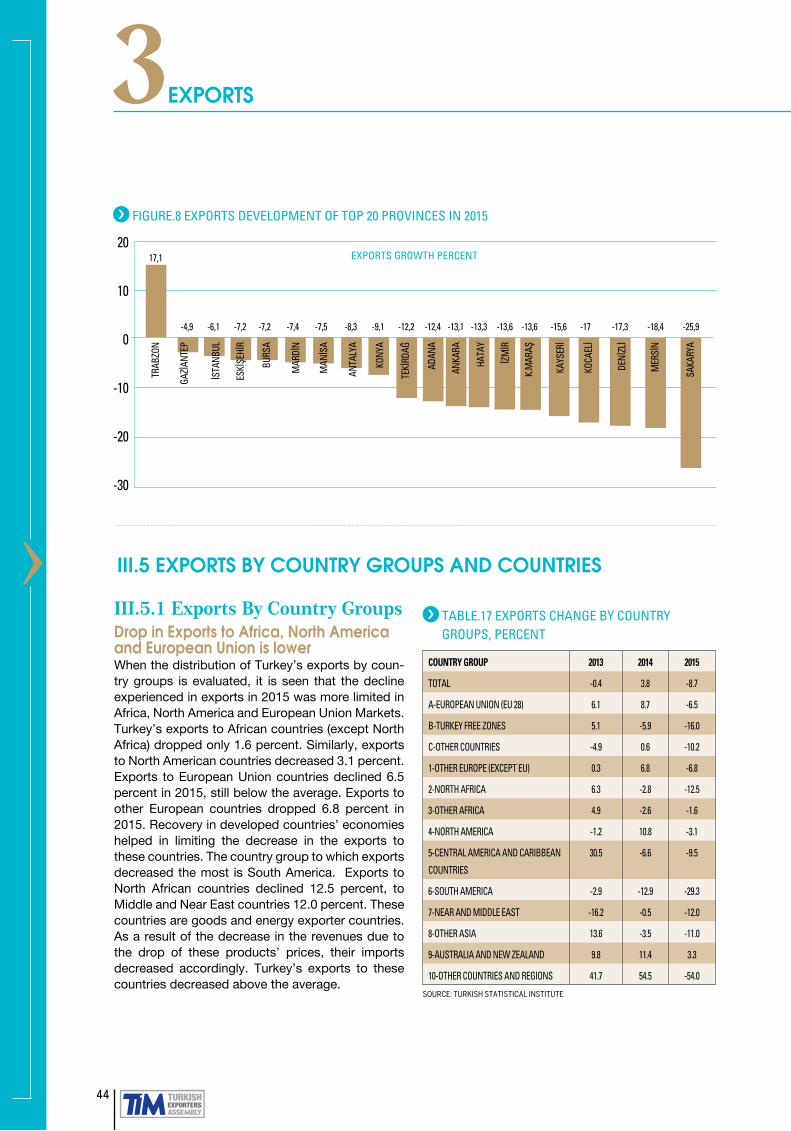
44
›
3EXPORTS
TABLE.17 EXPORTS CHANGE BY COUNTRY GROUPS, PERCENT
FIGURE.8 EXPORTS DEVELOPMENT OF TOP 20 PROVINCES IN 2015
20
10
0
-10
-20
-30
17,1
-4,9 -6,1 -7,2 -7,2 -7,4 -7,5 -8,3 -9,1 -12,2 -12,4 -13,1 -13,3 -13,6 -13,6 -15,6 -17 -17,3 -18,4 -25,9
TRAB
ZON
GAZİ
ANTE
P
İSTA
NBUL
ESKİ
ŞEHİ
R
BURS
A
MAR
DİN
MAN
İSA
ANTA
LYA
KONY
A
TEKİ
RDAĞ
ADAN
A
ANKA
RA
HATA
Y
İZM
İR
K.M
ARAŞ
KAYS
ERİ
KOCA
ELİ
DENİ
ZLİ
MER
SİN
SAKA
RYA
EXPORTS GROWTH PERCENT
III.5 EXPORTS BY COUNTRY GROUPS AND COUNTRIES
III.5.1 Exports By Country GroupsDrop in Exports to Africa, North America and European Union is lower When the distribution of Turkey’s exports by coun-try groups is evaluated, it is seen that the decline experienced in exports in 2015 was more limited in Africa, North America and European Union Markets. Turkey’s exports to African countries (except North Africa) dropped only 1.6 percent. Similarly, exports to North American countries decreased 3.1 percent. Exports to European Union countries declined 6.5 percent in 2015, still below the average. Exports to other European countries dropped 6.8 percent in 2015. Recovery in developed countries’ economies helped in limiting the decrease in the exports to these countries. The country group to which exports decreased the most is South America. Exports to North African countries declined 12.5 percent, to Middle and Near East countries 12.0 percent. These countries are goods and energy exporter countries. As a result of the decrease in the revenues due to the drop of these products’ prices, their imports decreased accordingly. Turkey’s exports to these countries decreased above the average.
COUNTRY GROUP 2013 2014 2015
TOTAL -0.4 3.8 -8.7
A-EUROPEAN UNION (EU 28) 6.1 8.7 -6.5
B-TURKEY FREE ZONES 5.1 -5.9 -16.0
C-OTHER COUNTRIES -4.9 0.6 -10.2
1-OTHER EUROPE (EXCEPT EU) 0.3 6.8 -6.8
2-NORTH AFRICA 6.3 -2.8 -12.5
3-OTHER AFRICA 4.9 -2.6 -1.6
4-NORTH AMERICA -1.2 10.8 -3.1
5-CENTRAL AMERICA AND CARIBBEAN
COUNTRIES
30.5 -6.6 -9.5
6-SOUTH AMERICA -2.9 -12.9 -29.3
7-NEAR AND MIDDLE EAST -16.2 -0.5 -12.0
8-OTHER ASIA 13.6 -3.5 -11.0
9-AUSTRALIA AND NEW ZEALAND 9.8 11.4 3.3
10-OTHER COUNTRIES AND REGIONS 41.7 54.5 -54.0
SOURCE: TURKISH STATISTICAL INSTITUTE

45ECONOMY AND FOREIGN TRADE REPORT 2016
Absolute Exports Decreased to All Country Groups The decline of trade experienced in 2015 in global scale and the decrease seen in the imports of all countries made an immediate impact on Turkey’s exports performance. In 2015, exports to all country groups included in Turkey’s ex-ports decreased.
Our Share in EU-28’s Total Imports Reached a Historical High with 1.21 Percent. Exports Increased 11.2 Percent in Terms of EuroWithin the framework of these developments in the ex-ports by country groups experienced in 2015, the exports to EU-28 countries dropped to 64.0 billion dollars. Another important reason for the decrease in the exports made to
TABLE.19 DISTRIBUTION OF EXPORTS BY COUNTRY GROUPS, PERCENT
SOURCE: TURKISH STATISTICAL INSTITUTE
COUNTRY GROUP 2013 2014 2015
TOTAL 100,0 100,0 100,0
A-EUROPEAN UNION (EU 28) 41,5 43,5 44,5
B-TURKEY FREE ZONES 1,6 1,4 1,3
C-OTHER COUNTRIES 56,9 55,1 54,2
1-OTHER EUROPE (EXCEPT EU) 9,4 9,6 9,8
2-NORTH AFRICA 6,6 6,2 5,9
3-OTHER AFRICA 2,7 2,5 2,7
4-NORTH AMERICA 4,3 4,6 4,9
5-CENTRAL AMERICA AND CARIBBEAN COUNTRIES 0,7 0,6 0,6
6-SOUTH AMERICA 1,4 1,2 0,9
7-NEAR AND MIDDLE EAST 23,4 22,4 21,6
8-OTHER ASIA 7,9 7,4 7,2
9-AUSTRALIA AND NEW ZEALAND 0,4 0,4 0,4
10-OTHER COUNTRIES AND REGIONS 0,1 0,1 0,1
European Union countries calculated in terms of dollars is the drop in Euro-Dollar exchange rate. Turkey’s exports to European Union in terms of Euro in-creased 11.2 percent to reach from 51.7 billion Euros to 57.7 billion Euros in 2015. However, the annual average Euro-Dollar exchange rate dropped from 1.3250 in 2014 to 1.1130 in 2015.If the average exchange rate had remained at 1.3250 level, Turkey’s exports to EU would have increased to 76.5 billion dollars. The loss due to exchange rate has been 12.4 billion dollars.
Share of EU Countries Rose to 44.5 Percent The share of EU countries maintained its rise in the country groups in 2015 to reach 44.5 percent level. The share of Near or Middle East countries declined to 21.6 percent. The share of other European countries reached 9.8 per-cent. The shares of North American countries and Asian countries remain below their potentials with 4.9 and 7.2 percent respectively.
TABLE.18 EXPORTS BY COUNTRY GROUPS, MILLION DOLLARS
SOURCE: TURKISH STATISTICAL INSTITUTE
COUNTRY GROUP 2013 2014 2015
TOTAL 151 803 157 620 143.935
A-EUROPEAN UNION (EU 28) 63 040 68 519 64.034
B-TURKEY FREE ZONES 2 413 2 270 1.907
C-OTHER COUNTRIES 86 350 86 832 77.993
1-OTHER EUROPE (EXCEPT EU) 14 214 15 185 14.150
2-NORTH AFRICA 10 042 9 758 8.535
3-OTHER AFRICA 4 104 3 997 3.934
4-NORTH AMERICA 6 580 7 293 7.070
5-CENTRAL AMERICA AND CARIBBEAN COUNTRIES 1 004 938 849
6-SOUTH AMERICA 2 127 1 852 1.310
7-NEAR AND MIDDLE EAST 35 575 35 386 31.106
8-OTHER ASIA 12 017 11 592 10.312
9-AUSTRALIA AND NEW ZEALAND 538 600 620
10-OTHER COUNTRIES AND REGIONS 149 231 106
FIGURE.9 DISTRIBUTION OF EXPORTS BY COUNTRY GROUPS, PERCENT
44,5
9,85,9
2,7
4,90,60,9
21,6
7,2
0,4 0,1EUROPEAN UNION (EU 28)
OTHER EUROPE NORTH AFRICA
OTHER AFRICA
NORTH AMERICACENTRAL AMERICA AND CARIBBEAN COUNTRIESSOUTH AMERICA
NEAR AND MIDDLE EAST
OTHER ASIA

46
›
3EXPORTS
Share of Our Export market in Top 30 Countries Increased 0.6 Percent Turkey’s top 30 export market remains almost the same over the years. Division of the top 30 market in ordered groups of 10 presents three important export market groups for Turkey.The share of the first 10 countries in our country’s ex-ports is around 50 percent. The share of the second
10 countries in our country’s exports is around 20 percent. The share of the third 10 countries dropped 1.0 point to 10.1 percent. The share of these three groups in our total exports is rising in a limited manner in the last three years. The share of top 30 countries in our total exports increased 0.6 points to reach 78.5 percent. It is seen that Turkey’s exports is dependent on the same markets and new markets are needed.
TABLE.20 SHARES OF TURKEY’S TOP 30 COUNTRIES EXPORT MARKET IN OUR EXPORTS BY GROUPS
TOP 10 MARKET 73.629 48.5 75.123 47.7 70.456 48.9
SECOND 10 MARKET 27.404 18.1 30.049 19.1 28.071 19.5
THIRD 10 MARKET 16.922 11.1 17.649 11.1 14.466 10.1
TOP 30 MARKET 117.955 77.7 122.821 77.9 112.993 78.5
TOTAL 151.802 100.0 157.620 100.0 143.935 100.0
2013 2014
SHARE
(%)
SHARE
(%)
SHARE
(%)
EXPORTS(MILLIONDOLLARS)
EXPORTS(MILLIONDOLLARS)
EXPORTS(MILLIONDOLLARS)
2015
MARKETS
SOURCE: CALCULATED FROM TURKISH STATISTICAL INSTITUTE DATATop 10 Countries; Germany, England, Iraq, Italy, USA, France, Switzerland, Spain, UAE, Iran Second 10 Countries; Russia, S. Arabia, Holland, Egypt, Romania, Israel, Belgium, China, Poland, Azerbaijan Third 10 Countries; Turkmenistan, Algiers, Libya, Bulgaria, Syria, Ukraine, Greece, Georgia, Morocco, Sweden
FIGURE.10 SHARES OF EXPORT MARKETS IN EXPORTS
2013
47,7
19,1
11,1
19,5
10,1
48,9
2014 2015
TOP 10 MARKET TOP 20 MARKET THIRD MARKET
SHARES OF MARKETS IN EXPORTS, PERCENT
48,5
18,111,1
III.5.2 Exports By Countries In 2015 Turkey’s top 20 export market did not change compared to 2014. Total exports dropped 8.7 percent; the exports to top-20 market also dropped 8.7 percent to 98.5 billion dollars in 2015.In 2015, exports increased to 5 countries in the top 20 market. These countries were rapidly recovering devel-
Exports’ Concentration in Big Firms Increased Distribution of exports according to firm scales yields im-portant conclusions for exporters in Turkey. Firm scales are grouped according to the number of employees. The share the firms with 250+ employees, which are consid-ered large scale firms for Turkey, in the total exports in-creased 2.8 percent in 2014 to reach 43.5 percent. Con-centration of exports in large scale firms in Turkey keeps
oped countries such as USA and England. E x p o r t s to Switzerland increased because of gold exports. The other two countries to which exports increased were UAE and S. Arabia, whose imports decreased signifi-cantly. Russia, Azerbaijan and Iraq were the countries to which exports decreased the most.
III.6 EXPORTS BY FIRM SCALES AND CONCENTRATION IN EXPORTS
increasing. The share the firms with 50-249 employees, which are considered medium scale firms for Turkey, in the total exports increased from 17.3 percent to 18.4 per-cent. The share of small scale firms with 1-9 employees dropped from 17.9 to 17.4 percent in 2014. The most sig-nificant decrease in the exports share was in small scale firms with 10-49 employees. The share of these firms in the total exports dropped from 24.1 to 20.7 percent.
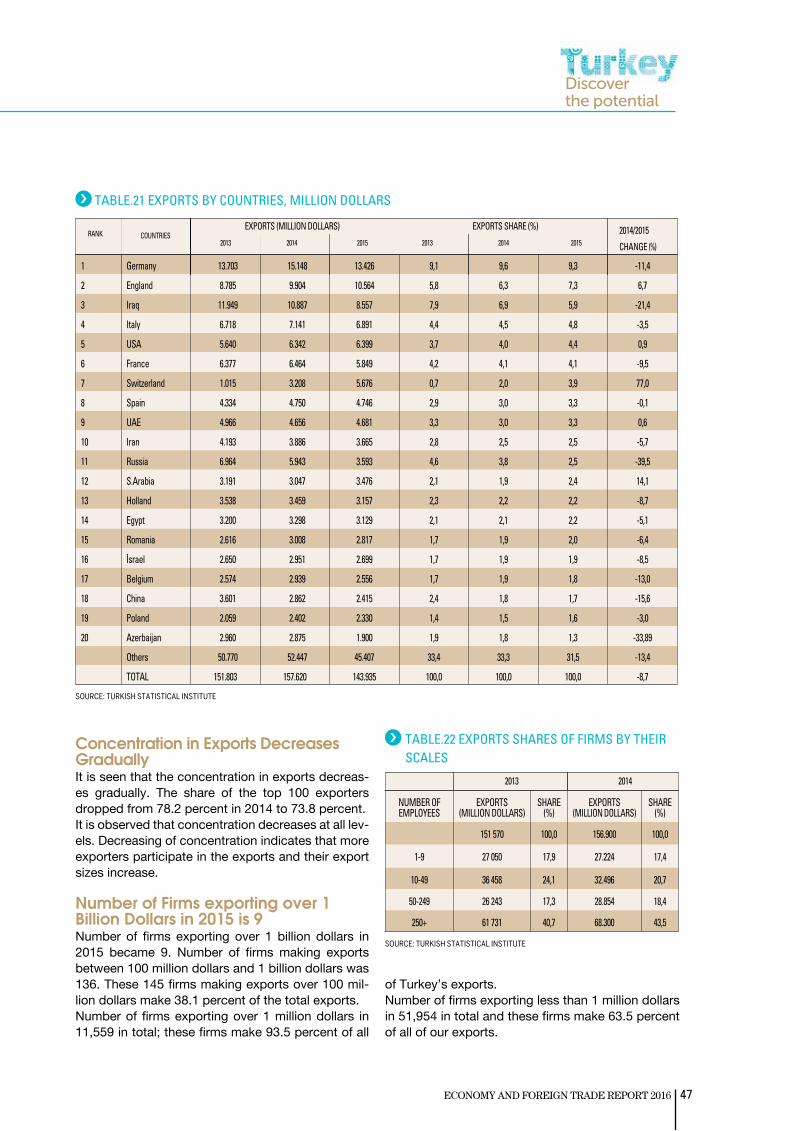
47ECONOMY AND FOREIGN TRADE REPORT 2016
TABLE.22 EXPORTS SHARES OF FIRMS BY THEIR SCALES
TABLE.21 EXPORTS BY COUNTRIES, MILLION DOLLARS
SHARES OF MARKETS IN EXPORTS, PERCENT
SOURCE: TURKISH STATISTICAL INSTITUTE
SOURCE: TURKISH STATISTICAL INSTITUTE
1 Germany 13.703 15.148 13.426 9,1 9,6 9,3 -11,4
2 England 8.785 9.904 10.564 5,8 6,3 7,3 6,7
3 Iraq 11.949 10.887 8.557 7,9 6,9 5,9 -21,4
4 Italy 6.718 7.141 6.891 4,4 4,5 4,8 -3,5
5 USA 5.640 6.342 6.399 3,7 4,0 4,4 0,9
6 France 6.377 6.464 5.849 4,2 4,1 4,1 -9,5
7 Switzerland 1.015 3.208 5.676 0,7 2,0 3,9 77,0
8 Spain 4.334 4.750 4.746 2,9 3,0 3,3 -0,1
9 UAE 4.966 4.656 4.681 3,3 3,0 3,3 0,6
10 Iran 4.193 3.886 3.665 2,8 2,5 2,5 -5,7
11 Russia 6.964 5.943 3.593 4,6 3,8 2,5 -39,5
12 S.Arabia 3.191 3.047 3.476 2,1 1,9 2,4 14,1
13 Holland 3.538 3.459 3.157 2,3 2,2 2,2 -8,7
14 Egypt 3.200 3.298 3.129 2,1 2,1 2,2 -5,1
15 Romania 2.616 3.008 2.817 1,7 1,9 2,0 -6,4
16 İsrael 2.650 2.951 2.699 1,7 1,9 1,9 -8,5
17 Belgium 2.574 2.939 2.556 1,7 1,9 1,8 -13,0
18 China 3.601 2.862 2.415 2,4 1,8 1,7 -15,6
19 Poland 2.059 2.402 2.330 1,4 1,5 1,6 -3,0
20 Azerbaijan 2.960 2.875 1.900 1,9 1,8 1,3 -33,89
Others 50.770 52.447 45.407 33,4 33,3 31,5 -13,4
TOTAL 151.803 157.620 143.935 100,0 100,0 100,0 -8,7
EXPORTS (MILLION DOLLARS) EXPORTS SHARE (%) 2014/2015
CHANGE (%) 2013 20132014 20142015 2015COUNTRIESRANK
Concentration in Exports Decreases Gradually It is seen that the concentration in exports decreas-es gradually. The share of the top 100 exporters dropped from 78.2 percent in 2014 to 73.8 percent.It is observed that concentration decreases at all lev-els. Decreasing of concentration indicates that more exporters participate in the exports and their export sizes increase.
Number of Firms exporting over 1 Billion Dollars in 2015 is 9Number of firms exporting over 1 billion dollars in 2015 became 9. Number of firms making exports between 100 million dollars and 1 billion dollars was 136. These 145 firms making exports over 100 mil-lion dollars make 38.1 percent of the total exports.Number of firms exporting over 1 million dollars in 11,559 in total; these firms make 93.5 percent of all
of Turkey’s exports.Number of firms exporting less than 1 million dollars in 51,954 in total and these firms make 63.5 percent of all of our exports.
NUMBER OF EMPLOYEES
EXPORTS (MILLION DOLLARS)
SHARE (%)
EXPORTS (MILLION DOLLARS)
SHARE (%)
151 570 100,0 156.900 100,0
1-9 27 050 17,9 27.224 17,4
10-49 36 458 24,1 32.496 20,7
50-249 26 243 17,3 28.854 18,4
250+ 61 731 40,7 68.300 43,5
2013 2014

48
›
3EXPORTS
SOURCE: TURKISH STATISTICAL INSTITUTE
SOURCE: TURKISH EXPORTERS ASSEMBLY
SOURCE: TURKISH EXPORTERS ASSEMBLY
TABLE.23 CONCENTRATION IN EXPORTS
FIGURE.11 DISTRIBUTION OF EXPORTS TO FIRM GROUPS ON SELECTED EXPORT SIZE BASIS IN TOTAL EXPORTS
TABLE.25 18 DETAILED FIRM BREAKDOWN IN DIFFERENT EXPORTS SCALE, 2015
TABLE.24 FIRMS BREAKDOWN ON SELECTED EXPORTS SIZES 2015
All Enterprises 156,900 100 .0 113.391 100 .0
Top 5 enterprises 23,980 15 .3 19.235 20 0 17 .0
Top 10 enterprises 33,564 21 .4 26.749 23. 6
Top 20 enterprises 42,338 27 .0 34.261 30 .2
Top 50 enterprises 54,647 34 .8 44.630 39 .4
Top 100 enterprises 66,096 42 .1 53.326 47 .0
Top 500 enterprises 99,702 63 .5 77.409 68 .3
Top 1000 enterprises 115,739 73 .8 88.638 78 .2
2014 2015
SHARE (%) SHARE (%)MILLIONDOLLARS
MILLIONDOLLARS
55,4
6,5
15,1
23
FIRMS EXPORTING OVER 1 BILLION DOLLARS
FIRMS EXPORTING BETWEEN 100 MILLION AND 1 BILLION DOLLARS
FIRMS EXPORTING BETWEEN 1 MILLION AND 100 MILLION DOLLARS
FIRMS EXPORTING LESS THAN 1 MILLION DOLLARS
SHARE IN EXPORTS %
GROUP
(MILLION
DOLLARS)
NUMBER
OF FIRMS
NUMBER
OF FIRMS
(1)
SHARE
(%)
SHARE
(%)
(1)
MILLION
DOLLARS
MILLION
DOLLARS (1)
SHARE
(%)
SHARE
(%) (1)
1 >= 1.000 9 9 0,014 0,014 20.142 20.142 15,1% 15,1%
2 >= 500 - <
1.000
9 18 0,014 0,029 6.888 27.029 5,2% 20,2%
3 >= 250 - < 500 25 43 0,040 0,069 8.639 35.668 6,5% 26,7%
4 >= 100 - < 250 102 145 0,16 0,23 15.192 50.860 11,4% 38,1%
5 >= 50 - < 100 174 319 0,28 0,51 11.731 62.591 8,8% 46,8%
6 >= 25 - < 50 407 726 0,65 1,16 14.207 76.798 10,6% 57,5%
7 >= 10 - < 25 1.150 1.876 1,84 2,99 17.877 94.675 13,4% 70,8%
8 >= 5 - < 10 1.719 3.595 2,75 5,73 12.000 106.674 9,0% 79,8%
9 >= 3 - < 5 1.960 5.555 3,14 8,85 7.602 114.276 5,7% 85,5%
10 >= 2 - < 3 1.895 7.450 3,03 11,87 4.659 118.935 3,5% 89,0%
11 >= 1 - < 2 4.245 11.695 6,79 18,64 6.001 124.936 4,5% 93,5%
12 >= 0,5 - < 1 5.458 17.153 8,74 27,34 3.893 128.829 2,9% 96,4%
13 >= 0,25 - < 0,5 6.506 23.659 10,41 37,70 2.329 131.158 1,7% 98,1%
14 >= 0,10 - <
0,25
9.520 33.179 15,24 52,88 1.549 132.706 1,2% 99,3%
15 >= 0,05 - <
0,10
7.308 40.487 11,70 64,52 527 133.233 0,4% 99,7%
16 >= 0,025 - <
0,05
6.838 47.325 10,94 75,42 248 133.481 0,2% 99,9%
17 >= 0,010 - <
0,025
7.245 54.570 11,60 86,97 121 133.603 0,1% 100,0%
18 < 0,010 8.179 62.749 13,09 100,00 40 133.642 0,0% 100,0%
TİM Toplam 62.749 100,0 133.642 133.642 100,0% 100,0%
TUİK Toplam 143.996 143.996
GROUPNUMBER OF FIRMS
SHARE (%)
EXPORTS
(MILLION
DOLLARS)
SHARE (%)
OVER 1 BILLION DOLLARS 9 0.014 20.142 15.1
BETWEEN 100 MILLION
AND 1 BILLION DOLLARS136 0.216 30.718 23.0
BETWEEN 1 MILLION
AND 100 MILLION
DOLLARS
11.559 18.424 74.076 55.4
LESS THAN 1 MILLION
DOLLARS51.954 81.346 8.706 6.5
TOTAL 62.749 100.00 133.642 100.0

49ECONOMY AND FOREIGN TRADE REPORT 2016
SOURCE: TURKISH STATISTICAL INSTITUTE
Turkey’s sectoral exports developments are examined and evaluated in this section in detail. Sectors are grouped according to the Harmonized System section classification, which is an international application, in the evaluation of
sectoral exports developments. In the Harmonized system, sections classifications group 2-digit main sections and 4-digit detailed sections. In this framework, first of all sectoral developments by main section groups are evaluated.
III.7 EXPORTS BY SECTIONS AND SUBSECTIONS
III.7.1 Exports By Main SectionsTop 20 Sectors’ Share Rose to 75.9 Percent According to section classification, exports decreased 7.6 per-cent in the first 20 exports sectors in 2015 and retreated to 109.4 billion dollars. Despite the decrease of first 20 sectors’ exports, its share in the total exports went up to 75.9 percent in 2015.
Precious Stone (Gold) Exports Increased at Record Level; Exports Decreased in All Other Sections In 2014 the first three places were taken by Motor Land Ve-hicles, Machines and Knitted Garments; in 2015 Knitted Gar-ments was replaced by Precious Stones (Gold) and Metals. In the top 20 most exported sections, exports increased in only three sections; it decreased in all the other 17 sections. The most exported section, Motor Land Vehicles exports in-creased its share in total exports despite a drop of 3.3 percent in exports; however, drop in this section remained limited. Ma-chine exports dropped 9.2 percent; the third most exported section, Precious Stones (Gold), exports increased 46 percent.In the first 20 sections Iron-Steel and Mineral Fuels and Oils were the ones whose exports declined the most in 2015. Iron-steel exports dropped 29 percent due to the decrease in ex-ports unit prices; Mineral Fuels exports dropped 26 percent due to the decrease in crude oil prices.
Only Vegetable Fruit Preparations and Fruit Exports Increased Besides Gold While gold exports increased 46 percent in 2015 to reach 11.26 billion dollars, Vegetable and Fruit products closed the year without loss. In spite of the difficulties encountered with the countries that this section is exported most, Vegetable and Fruit preparations managed to close the tear with an exports increase of 4.7 percent. Fruit exports increased slightly.
Biggest Decrease in Iron-Steel Exports Slowdown in the demand for commodities in the world econ-omy and the retreat in commodity-metal prices affected the Turkish exports increasingly in 2015 and made very negative impact on the exports of many sectors, especially the Iron-Steel sector. Iron-Steel exports decreased 6.8 percent in 2014 and 29 per-cent in 2015; thus displayed a very bad performance in two years in a row.
TABLE.26 DISTRIBUTION OF EXPORTS BY 2-DIGIT MAIN SECTIONS, FIRST 20 PRODUCTS
87 Motor land vehicles 18.064 11,5 17.465 12,1 -3,3
84 Machines 13.592 8,6 12.344 8,6 -9,2
71Precious or semi-precious stones
7.717 4,9 11.264 7,8 46
61 Knitted garment articles 10.026 6,4 8.935 6,2 -10,9
85Electrical machines and devices
9.693 6,2 8.291 5,8 -14,5
72 Iron and steel 9.244 5,9 6.563 4,6 -29
62Nonwoven (textile) garment articles
6.233 3,9 5.921 4,1 -5
73 Iron or steel articles 6.357 4 5.471 3,8 -13,9
39 Plastics and plastic articles 6.098 3,8 5.371 3,7 -11,9
27 Mineral fuels and mineral oils 6.112 3,8 4.519 3,1 -26
8 Fruits and edible shelled fruits 4.327 2,7 4.358 3 0,7
94 Furnitures 2.971 1,9 2.755 1,9 -7
76 Aluminum and aluminum articles 2.547 1,6 2.371 1,6 -6,9
25 Marble Cement Salt Sulfur 2.549 1,6 2.254 1,6 -11,6
20 Vegetable and fruit preparations 2.090 1,3 2.188 1,5 4,7
40 Rubber and rubber articles 2.597 1,6 2.166 1,5 -16,6
57 Carpets 2.348 1,5 2.010 1,4 -14,4
63Ready-made articles from woven material
2.228 1,4 1.901 1,3 -14,7
52Cotton, cotton yarn and cotton textile
1.875 1,2 1.704 1,2 -9,1
54 Synthetic and artificial filaments 1.773 1,1 1.565 1,1 -11,7
First 20 sections 118.441 74,9 109.416 75,9 -7,6
2014 2015
SHARE
(%)
SHARE
(%)
2014 / 2015 CHANGE
(%)MILLIONDOLLARS
MILLIONDOLLARS
SECTIONSITEM

50
›
3EXPORTS
Motor land vehiclesMachines
Precious stonesKnitted garment articles
Electrical machines and devicesIron and steel
Nonwoven garment articlesIron or steel articles
Plastics and plastic articlesMineral fuels and mineral oils
Edible fruitFurnitures
Aluminum and aluminum articlesMarble
Vegetable and fruit preparationsRubber and rubber articles
CarpetsReady-made articles from woven material
Cotton yarn and textileSynthetic and artificial filaments
0 2000 4000 6000 8000 10,000 12,000 14,000 16,000 18,000 20,000
17,46512,344
11,2648,935
8,2916,563
5,9215,4715,371
4.5192,7552,755
2,3712,254
2,1882,166
2,0101,901
1,7041,565
FIGURE.12 FIRST 20 MOST EXPORTED SECTIONS, 2015
EXPORTS, MILLION DOLLARS
III.7.2 Exports by Subsections 1-1- MOTOR LAND VEHICLES
Exports Slowed Down, But Still the Most Exported Section Motor land vehicles main and side industry displayed a relatively better performance compared to general exports performance in 2015. Car exports, which is the most exported subsection of the motor land vehicles exports, declined 4.9 percent in 2014. The increase performance of 7.5 percent of truck exports in 2014 decreased, even slightly, and still increased 2.7 percent. Decline in tractor exports is 10.4 percent. The subsection that had the best performance was Minibus and Bus exports. Exports in this group increased 7.1 percent; the decrease in exports was caused partly by decline of the prices of goods in all subsec-tions. Last year’s unit prices decreased about 15 percent.
CODE PRODUCT2013
(Million Dollars)
2014
(Million Dollars)
2015
(Million Dollars)14/15 Change (%) 2014 Unit Price ($/kg) 2015 Unit Price ($/kg)
8703 Cars 6.856 7.256 6.897 -4,9 9,69 8,31
8704 Truck 3.851 4.139 4.249 2,7 8,18 6,89
8708 Components and parts for motor land vehicles 3.905 4.134 3.805 -7,9 4,91 4,37
8702 Minibus, Bus 1.103 1.119 1.199 7,1 13,47 11,63
8701 Tractors 422 479 429 -10,4 7,13 6,11
8716 Trailers 313 385 381 -0,9 3,16 2,77
8705Tow trucks, fire trucks, road sweepers, tar vehicles
149 175 156 -10,9 8,86 7,96
TABLE.27 SUBSECTIONS IN MOTOR LAND VEHICLE EXPORTS
SOURCE: TURKISH STATISTICAL INSTITUTE
FIGURE.13 MOST EXPORTED SUBSECTIONS, 2015
8,0007,0006,0005,0004,0003,0002,0001,000
0CARS TRUCKS PARTS AND
ACCESSORIES FOR LAND VEHICLES
MINIBUSBUS
TRACTORS
4,249
1,199
EXPORTS, MILLION DOLLARS
429
6,897
3,805

51ECONOMY AND FOREIGN TRADE REPORT 2016
EXPORTS, MILLION DOLLARS
2-MACHINES
Exports Dropped in All Subsections Machine exports, which include the highest number of subsections, decreased 9.2 percent in 215. Even though exports increased almost in all subsections in 2014, the opposite happened in 2015 and exports dropped in almost all subsections. In 10 subsections in machine exports that we make the most exports, both the exports declined and the unit prices of all products declined. The biggest exports decrease in these 10 subsections occurred in crushing and grinding machines, parts of work and construction machines, faucets, valves and liquid pumps.Industrial washing machines exports maintained the same level; exports decreased in industrial refrigera-tors, motor parts, centrifuge and central heating boil-ers subsections.
SOURCE: TURKISH STATISTICAL INSTITUTE
EXPORTS, MILLION DOLLARS
FIGURE.14 MOST EXPORTED SUBSECTIONS, 2015
TABLE.28 SUBSECTIONS IN MACHINE EXPORTS
CODE PRODUCT 2013 (Million Dollars) 2014 (Million Dollars) 2015 (Million Dollars) 14/15 Change (%) 2014 Unit Price 2015 Unit Price ($/kg)
($/kg) Industrial refrigerators, coolers 1.952 2.019 1.724 -14,6 4,69 3,96
8409 Motor parts 1.514 1.733 1.547 -10,7 19,21 17,98
8450 Industrial Washing machines 811 925 925 -0,1 2,93 2,49
8422 Industrial Dishwash-ers, 558 591 535 -9,6 6,10 5,31
8481 Faucets and valves 566 599 492 -17,9 10,50 9,07
8431Work and construction machine parts
553 597 474 -20,7 4,83 4,11
8413 Pumps for liquids 422 472 384 -18,7 10,10 8,60
8421 Centrifuges 398 403 384 -4,9 9,19 9,34
8403 Central heating boilers 386 418 378 -9,7 8,96 8,68
8474 Crushing and grinding machines 408 433 333 -23 4,40 3,81
2,500
2,000
1,500
1,000
500
0Industrial
refrigerators and coolers
Parts for motors
Industrial washing
machines
Industrial Dishwashers
Faucets, valves
Machine parts
Liquid pumps
1,724 1,574
535
384
EXPORTS, MILLION DOLLARS
925
492 474
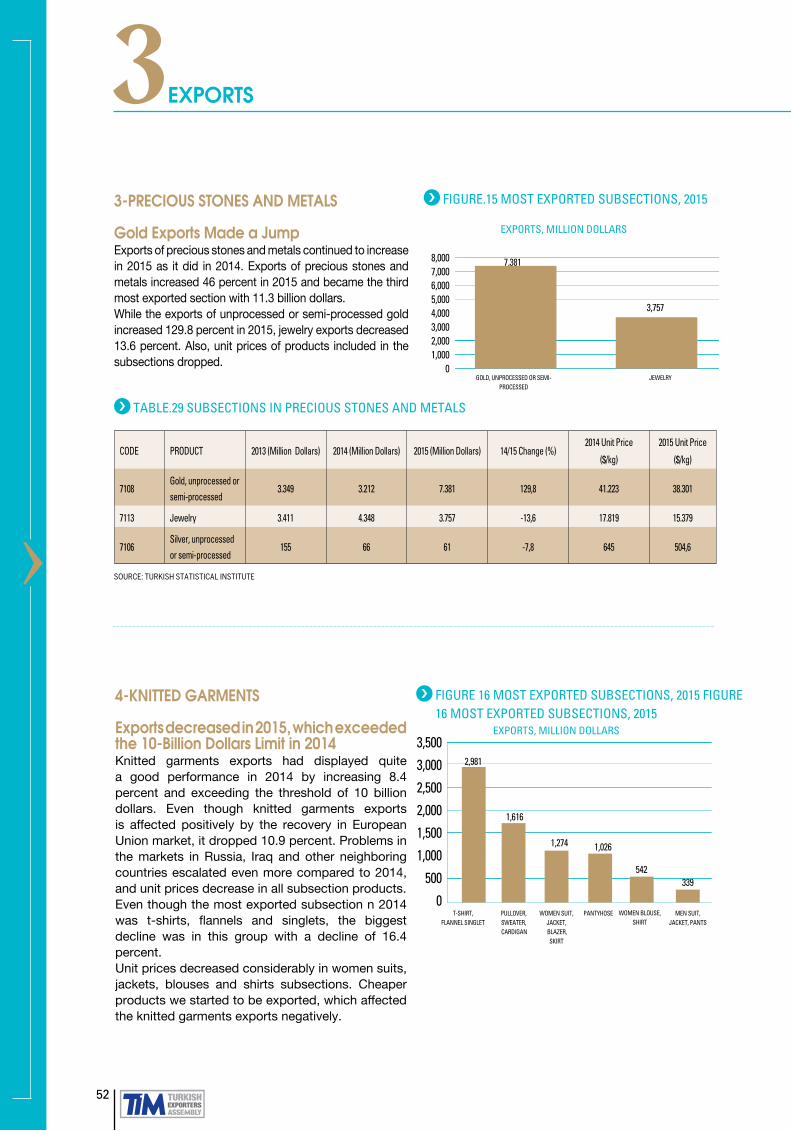
52
›
3EXPORTS
3-PRECIOUS STONES AND METALS
Gold Exports Made a Jump Exports of precious stones and metals continued to increase in 2015 as it did in 2014. Exports of precious stones and metals increased 46 percent in 2015 and became the third most exported section with 11.3 billion dollars.While the exports of unprocessed or semi-processed gold increased 129.8 percent in 2015, jewelry exports decreased 13.6 percent. Also, unit prices of products included in the subsections dropped.
4-KNITTED GARMENTS
Exports decreased in 2015, which exceeded the 10-Billion Dollars Limit in 2014 Knitted garments exports had displayed quite a good performance in 2014 by increasing 8.4 percent and exceeding the threshold of 10 billion dollars. Even though knitted garments exports is affected positively by the recovery in European Union market, it dropped 10.9 percent. Problems in the markets in Russia, Iraq and other neighboring countries escalated even more compared to 2014, and unit prices decrease in all subsection products.Even though the most exported subsection n 2014 was t-shirts, flannels and singlets, the biggest decline was in this group with a decline of 16.4 percent.Unit prices decreased considerably in women suits, jackets, blouses and shirts subsections. Cheaper products we started to be exported, which affected the knitted garments exports negatively.
SOURCE: TURKISH STATISTICAL INSTITUTE
FIGURE 16 MOST EXPORTED SUBSECTIONS, 2015 FIGURE 16 MOST EXPORTED SUBSECTIONS, 2015
3,500
3,000
2,500
2,000
1,500
1,000
500
0T-SHIRT,
FLANNEL SINGLETPULLOVER, SWEATER, CARDIGAN
WOMEN SUIT, JACKET, BLAZER,
SKIRT
PANTYHOSE WOMEN BLOUSE, SHIRT
MEN SUIT, JACKET, PANTS
1,616
1,274 1,026
542339
EXPORTS, MILLION DOLLARS
2,981
FIGURE.15 MOST EXPORTED SUBSECTIONS, 2015
8,0007,0006,0005,0004,0003,0002,0001,000
0GOLD, UNPROCESSED OR SEMI-
PROCESSED JEWELRY
EXPORTS, MILLION DOLLARS
7,381
3,757
TABLE.29 SUBSECTIONS IN PRECIOUS STONES AND METALS
CODE PRODUCT 2013 (Million Dollars) 2014 (Million Dollars) 2015 (Million Dollars) 14/15 Change (%)2014 Unit Price
($/kg)
2015 Unit Price
($/kg)
7108Gold, unprocessed or semi-processed
3.349 3.212 7.381 129,8 41.223 38.301
7113 Jewelry 3.411 4.348 3.757 -13,6 17.819 15.379
7106Silver, unprocessed or semi-processed
155 66 61 -7,8 645 504,6

53ECONOMY AND FOREIGN TRADE REPORT 2016
5-ELECTRICAL MACHINES AND DEVICES
2015 Was Not a Good Year Electrical machines and devices include two different product groups such as investment goods and consumer electronics; exports of this section decreased 14.5 per-cent in 2015. Price reductions in steel, copper, aluminum and many other metals were influential in this decline.In subsection groups, exports of transformers and tel-ephones increased; the other subsections declined in the range of 10-30 percent. Exports of insulated wires, cables, which is the most exported product group, fell down 19.6 percent, televisions 14.3 percent, electric
SOURCE: TURKISH STATISTICAL INSTITUTE
EXPORTS, MILLION DOLLARS
SOURCE: TURKISH STATISTICAL INSTITUTE
TABLE 31 SUBSECTIONS IN ELECTRICAL MACHINES AND DEVICES EXPORTS
TABLE.30 SUBSECTIONS IN KNITTED GARMENTS EXPORTS
CODE PRODUCT 2013 (Million Dollars) 2014 (Million Dollars) 2015 (Million Dollars) 14/15 Change (%) 2014 Unit Price($/kg)
2015 Unit Price($/kg)
6109 T-shirt, flannel singlet 3.276 3.566 2.981 -16,4 24,30 22,38
6110 Pullover, Sweater, Cardigan 1.629 1.754 1.616 -7,9 22,96 20,53
6104 Women suit, jacket, blazer, skirt 1.212 1.370 1.274 -7 26,30 20,57
6115 Pantyhose 1.151 1.217 1.026 -15,7 17,55 15,27
6106 Women blouse, shirt 533 573 542 -5,5 29,12 21,26
6103 Men suit, jacket, pants 349 374 339 -9,5 22,32 16,90
6108 Women nightgown, pajama 293 320 312 -2,4 15,81 14,75
6105 Men shirt 243 259 238 -8,3 34,65 28,96
6107 Man slips, pajama bathrobe, 118 151 165 9,4 15,49 15,29
6111 Baby garments 142 146 145 -1 19,09 16,91
FIGURE.17 MOST EXPORTED SUBSECTIONS, 2015
2,5002,0001,5001,000
5000 INSULATED WIRES,
CABLESTELEVISIONS ELECTRIC
HEATERSTRANSFORMERS SWITCHES, RELAYS,
FUSES
EXPORTS, MILLION DOLLARS
1,9471,632
874 836485
EXPORTS, MILLION DOLLARS
heaters 14.8 percent, switch, relay, fuse 14.7 percent, control and distribution panels 29.1 percent. Unit prices of these products decreased 5-10 percent on average compared to last year.
CODE PRODUCT 2013 (Million Dollars)
2014 (Million Dollars)
2015 (Million Dollars)
14/15 Change (%)
2014 Unit Price($/kg)
2015 Unit Price ($/kg)
8544 Insulated wires, cables 2.500 2.421 1.947 -19,6 5,82 5,01
8528 Televisions. Monitors, projectors , 1.711 1.905 1.632 -14,3 27,13 27,48
8516 Electric heaters 968 1.071 874 -18,4 4,63 4,12
8504 Transformers 906 769 836 8,6 7,12 6,57
8536 Switches, relays, fuses, 572 569 485 -14,7 14,59 13,33
8537 Electric control distribution board and panels 676 665 472 -29,1 16 14,23
8502 Electricity 239 259 251 -3,1 9,06 8,60
8507 Batteries 305 288 222 -22,9 2,71 2,47
8512 Lighting and signal devices for motor vehicles 188 222 212 -4,3 14,82 14,31
8517 Telephone sets 177 171 179 5 59,67 58,06

54
›
3EXPORTS
6-IRON-STEEL
Long and Flat Products Exports Continued to Drop with Acceleration Iron-steel exports declined 29 percent in 2015. In Iron-Steel subsection products, exports decreased in all subsections except for the stainless steel flat rolled mill products.In 2015, economic performance either stalled or de-clined in all world countries except USA. This eco-nomic performance decreased demand for all com-modity groups; many countries, especially China, faced idle capacities. The biggest sector that such a situation happened is iron-steel sector. In 2015, the world iron-steel exports was negatively affected by the exports China made at quite low prices. All coun-tries were forced to impose protection measures and additional taxes, which affected all the markets. Turk-ish iron-steel exports was also affected by this situa-tion quite negatively.Exports of iron-steel subsections decreased both in quantity and in value, exports unit prices dropped in the range of 10-40 percent.
3,5003,0002,5002,0001,5001,000
5000
FIGURE.18 MOST EXPORTED SUBSECTIONS, 2015
BARS PROFILES COATED FLAT ROLLED PRODUCTS
WIRE ROD COATED FLAT ROLLED PRODUCTS
EXPORTS, MILLION DOLLARS
3,081
801 778
342272
SOURCE: TURKISH STATISTICAL INSTITUTE
TABLE.32 SUBSECTIONS IN IRON AND STEEL EXPORTS
CODE PRODUCT 2013 (Million Dollars) 2014 (Million Dollars) 2015 (Million Dollars) 14/15 Change (%) 2014 Unit Price($/kg)
2015 Unit Price ($/kg)
7214 Bars 4.849 4.341 3.081 -29 0,56 0,42
7216 Profiles 1.141 1.171 801 -31,6 0,68 0,53
7208 Uncoated flat rolled products 939 995 778 -21,8 0,60 0,43
7213 Wire rod 562 556 342 -38,4 0,59 0,44
7210 Coated flat rolled products 516 396 272 -31,3 0,93 0,77
7219 Flat mill products from stainless steel 80 218 232 6,8 2,54 2,13
7204 Scrap 137 235 147 -37,6 1,40 1,01
7228Bars and profiles made of other steel alloys
132 164 141 -13,7 0,91 0,65
7217 Wires 164 198 124 -37,4 0,86 0,71
7202 Ferro alloys 148 163 122 -25,2 1,47 1,51
Turkey is the country that exports iron in the highest amount in the world; however, due to the problems in nearby markets, it had to turn to distant markets, this brought about freight issues, that in turn, caused the low performance in the last years in this product group.Exports in the long flat product subgroups decreased in the range of 20-40 percent.

55ECONOMY AND FOREIGN TRADE REPORT 2016
SOURCE: TURKISH STATISTICAL INSTITUTE
TABLE.33 SUBSECTIONS IN WOVEN GARMENTS EXPORTS
CODE PRODUCT 2013 (MillionDollars)
2014 (MillionDollars)
2015 (MillionDollars) 14/15 Change (%) 2014 Unit Price
($/kg)2015 Unit Price
($/kg)
6204 Women suits, jackets, blazers, skirts 2.283 2.417 2.197 -9,1 31,72 26,85
6203 Men suits, jackets, pants 1.512 1.566 1.494 -4,6 25,33 22,18
6206 Women blouses, shirts 631 733 736 0,4 39,73 33,98
6205 Men shirts 533 630 607 -3,6 30,92 27,46
6208 Women corset, petticoats, nightgowns, pajamas 205 217 220 1,1 11,96 9,95
6211 Sports, ski and swimming garments 98 130 134 3,4 16,42 16,26
6202 Women coats 109 142 111 -21,8 23,21 20,79
7-WOVEN GARMENTS
Woven Garments Exports Did Not Drop AS Much As Knitted Garments Woven Garment exports dropped 5 percent to 5.9 billion dollars in 2015. In all women product groups of woven garments, even higher drops were experienced. In men garments relatively lower decrease was seen. Women suits, jackets, skirts subsection exports it the most ex-ported subsection with 2.2 billion dollars. In this group, exports decreased 9.1 percent in 2015. Women blouse, shirts and night gowns remained at last year’s level; women coats and short coats decreased 21.8 percent. Product unit prices declined 10 percent on average.
FIGURE.19 MOST EXPORTED SUBSECTIONS, 2015
3,5003,0002,5002,0001,5001,000
5000
WOMEN SUITS, JACKETS, BLAZERS, SKIRTS
MEN SUITS, JACKETS, PANTS
WOMEN BLOUSES, SHIRTS
MEN SHIRTS WOMEN CORSET, PETTICOATS,
NIGHTGOWNS, PAJAMAS
EXPORTS, MILLION DOLLARS
2,917
1,494
736607
220
EXPORTS, MILLION DOLLARS

56
›
3EXPORTS
8-IRON and STEEL ARTICLES
Unit Prices Fell Down in Iron and Steel Articles Exports Exports of iron and steel articles decreased 13.9 percent to 5.47 billion dollars in 2015.In the 10 most exported subsections in iron and steel articles subsection, only the exports of other thin and thick pipes increased. Exports declined in all other subsections.Metal sheets for construction, profiles and con-struction components are the most exported prod-ucts. Exports fell 15.4 percent in 2015 to 1.25 bil-lion dollars. Steel pipe exports is the subsection that decreased the most. Exports decreased 24.5 percent to 1.02 billion dollars. 2015 exports unit prices dropped 10-20 percent on average.The most exported two subsections are products
SOURCE: TURKISH STATISTICAL INSTITUTE
TABLE.34 SUBSECTIONS IN IRON AND STEEL ARTICLES EXPORTS
CODE PRODUCT 2013 (Million Dollars) 2014 (Million Dollars) 2015 (Million Dollars) 14/15 Change (%) 2014 Unit Price($/kg)
2015 Unit Price ($/kg)
7308Metal sheet for construction, bar, profile
1.385 1.473 1.246 -15,4 2,04 1,88
7306 Pipe and hollow profile 1.345 1.353 1.021 -24,5 0,81 0,65
7326 Other iron and steel articles: 625 645 588 -8,8 2,57 2,34
7322 Radiators 451 451 389 -13,8 1,68 1,43
7321 Stove, cooking range, barbecue 358 385 327 -15 4,06 3,62
7318 Screw, Bolt, Nut 261 308 288 -6,6 3,71 3,15
7323 Kitchen Table And Articles 267 298 255 -14,6 5,07 4,74
7305 Other thin and thick pipes 161 141 194 38,3 0,96 0,98
7325 Other cast articles 201 211 161 -23,4 2,32 2,07
7311 Vessels 169 143 141 -1,5 2,30 2,09
FIGURE.20 MOST EXPORTED SUBSECTIONS, 2015 EXPORTS, MILLION DOLLARS
140012001000800600400200
0
1,2461,021
588389 327 288 255
Metal sheet for construction, bar,
profile
Pipe and hollow profile
Other iron and
steel articles
Radiators Stove, cooking range,
barbecue
Screw, bolt,nut
Kitchen table and articles
used in the construction and infrastructure; ex-ports decreased to the Middle East and Euro-Asia countries quite sharply due to economic and politi-cal problems. USA is the only market that our steel pipe exports increased.
FIGURE.21 MOST EXPORTED SUBSECTIONS, 2015 EXPORTS, MILLION DOLLARS
1000800600400200
0
915 809718
346 330 297
Nonporous plate,
sheet, foil
Hoses and pipes
Carrying, packaging
articles
Other plates, sheets,
foils and stripes
Polyacetats, polyethers
Bars and
profiles
Construction articles
Other plastic articles
Table, kitchen, house, health,
toilet articles
9-PLASTIC and PLASTIC ARTICLES
Decreasing Oil Prices Pulled Down Unit Prices of Plastic Products Exports Plastic articles exports decreased 11.9 percent in 2015 and the unit prices of the groups in all subsections dropped around 20 percent due to the decrease in oil prices. Exports dropped in all of the 10 most exported
386 351264

57ECONOMY AND FOREIGN TRADE REPORT 2016
SOURCE: TURKISH STATISTICAL INSTITUTE
TABLE.35 SUBSECTIONS IN PLASTIC AND PLASTIC ARTICLES EXPORTS
CODE PRODUCT 2013 (Million Dollars) 2014 (Million Dollars) 2015 (Million Dollars) 14/15 Change (%) 2014 Unit Price($/kg)
2015 Unit Price ($/kg)
3920 Nonporous plate, sheet, foil 888 967 915 -5,5 3,20 2,70
3923 Carrying, packaging articles 763 816 809 -0,8 2,93 2,50
3917 Hoses and pipes 899 925 718 -22,4 2,63 2,54
3921 Other plates, sheets, foils and stripes 350 420 386 -8,1 3,48 3
3926 Other plastic articles 342 402 351 -12,7 5,89 5,10
3924Table, kitchen, house, health, toilet articles
323 396 346 -12,6 3,71 3,11
3907 Polyacetats, polyethers 355 410 330 -19,4 2,10 1,64
3916 Bars and profiles 405 407 297 -27,2 2,09 1,90
3925 Construction articles 323 326 264 -18,8 2,82 2,48
3906 Acrylic polymers 210 229 199 -13,3 1,51 1,19
EXPORTS, MILLION DOLLARS
EXPORTS, MILLION DOLLARS
product groups. The highest decrease was in plastic bars and profiles, and hoses and pipes. The decrease in these products is above 20 percent.
With 809 million dollars of exports, plastic packaging ma-terials showed a relatively better performance compared to other subsections.
10-MINERAL FUELS and OILS
Rapidly Dropping Oil Prices and Dwindling Demand Affected Exports Very Adversely With oil prices hitting a historical low in 2015, exports of Mineral Fuels and oils dropped 26 percent in 2015. The main reason for this decrease was the fact that the oil pric-es worldwide dropped down to 26 dollars level. Oil supply started to exceed the demand because of the reasons that Iran was to start exporting with lifting of the sanctions, USA was to begin exporting again and disagreements among OPEC members and these pressed down the oil prices
SOURCE: TURKISH STATISTICAL INSTITUTE
TABLE.36 SUBSECTIONS IN MINERAL FUEL AND OIL EXPORTS
CODE PRODUCT 2013 (Million Dollars)
2014 (Million Dollars)
2015 (Million Dollars) 14/15 Change (%) 2014 Unit Price
($/kg)2015 Unit Price
($/kg)
2710 Petrol oils 5.963 5.480 3.967 -27,6 0,76 0,47
2700Mineral fuels, mineral oils and products
249 226 220 -2,7 Gizli veri Gizli veri
2711 Petrol gases 267 184 105 -43 0,90 0,42
FIGURE.22 MOST EXPORTED SUBSECTIONS, 2015
EXPORTS, MILLION DOLLARS
4,5004,0003,5003,0002,5002,0001,5001,000
5000
3,967
220 105
PETROL OILS MINERAL OILS PETROL GASES

58
›
3EXPORTS
SOURCE: TURKISH STATISTICAL INSTITUTE
TABLE.37 SUBSECTIONS IN FRUIT EXPORTS
11-FRUITS
Section Where Exports Did Not Decrease Exports of shelled fruits increased 9 percent in 2014 and 0.7 percent in 2015 to reach 4.36 billion dollars. Exports declined in fruits such as citrus family, grapes and figs. Besides these products, exports increased 19.9 percent in other shelled fruits subsection, which we export the most. Unit prices of other shelled fruits increased 26.6 percent. The biggest de-cline occurred in the unit prices of apricot, plumb and peach. The decrease in these products’ prices is 37 percent.In spite of the problems we encountered with Russia, the country we export most, the exports did not decrease. In 2016, exports performance will be in line with the exports to be made to alternate markets.In 2016, exports performance will be in line with the exports to be made to alternate markets.
12-FURNITURE
Stable Increase of Recent Years Stopped Furniture exports had a stable and relatively fast increase trend in recent years; however this trend did not continue in 2015 and furniture exports dropped 7 percent to 2.75 bil-lion dollars. When we examine the performances of furniture exports subsections we see that the lighting devices had the biggest export drop. Lighting devices decrease 21.2 percent and dropped from 315 million dollars to 248 million dollars. Decline in the exports of sitting group furniture is 5.2 percent; decrease in other furnitures (dentist, barber, vehicle, cinema) was 7.2 percent and 2 percent in bed sets.
FIGURE.23 MOST EXPORTED SUBSECTIONS, 2015
FIGURE.24 MOST EXPORTED SUBSECTIONS, 2015
EXPORTS, MILLION DOLLARS
EXPORTS, MILLION DOLLARS
2,0001,8001,6001,4001,2001,000
800600400200
0
1600140012001000800600400200
0
1,872
1,352
248130
328 261 217119
Other shelled fruits
Other furniture
Citrus family Grapes
Furniture for sitting
Hard and shelled
fruit mixture
Lighting devices
Prefabricates structures
Bed sets
Date, fig, pineapples,
avocado and mangos
Apricot, cherry, peach,
plumb and bullace
Other fresh fruits
over the year. It look like that the same process will contin-ue in 2016. Therefore, due to this reason and also because the prices of crude oil and natural gas as well as oil refinery products will remain at low levels, Turkey’s exports of min-eral fuel and oil products will be below its performance in
recent year.There are two important exports items in mineral fuels and oils. Of these two items, petrol oils exports decreased 27.6 percent in 2015 and its exports unit prices dropped 38.2 percent. Petrol gas exports declined 43 percent.
571
249
747
831
CODE PRODUCT 2013 (Million Dollars)
2014 (Million Dollars)
2015 (Million Dollars) 14/15 Change (%) 2014 Unit Price
($/kg)2015 Unit Price
($/kg)
0802 Other shelled fruits 1.254 1.560 1.872 19,9 9,12 11,55
0805 Citrus family 897 932 831 -10,8 0,60 0,55
0806 Grapes 683 679 571 -15,9 1,41 1,43
0813 Hard and shelled fruit mixtures 315 380 328 -13,8 4,42 4,50
0804 Date, fig, pineapples, avocado and mangos 201 288 261 -9,4 3,72 3,62
0809 Apricot, cherry, peach, plumb and bullace 242 219 217 -1,2 1,66 1,04
0810 Other fresh fruits 94 126 119 -5,7 0,83 0,72
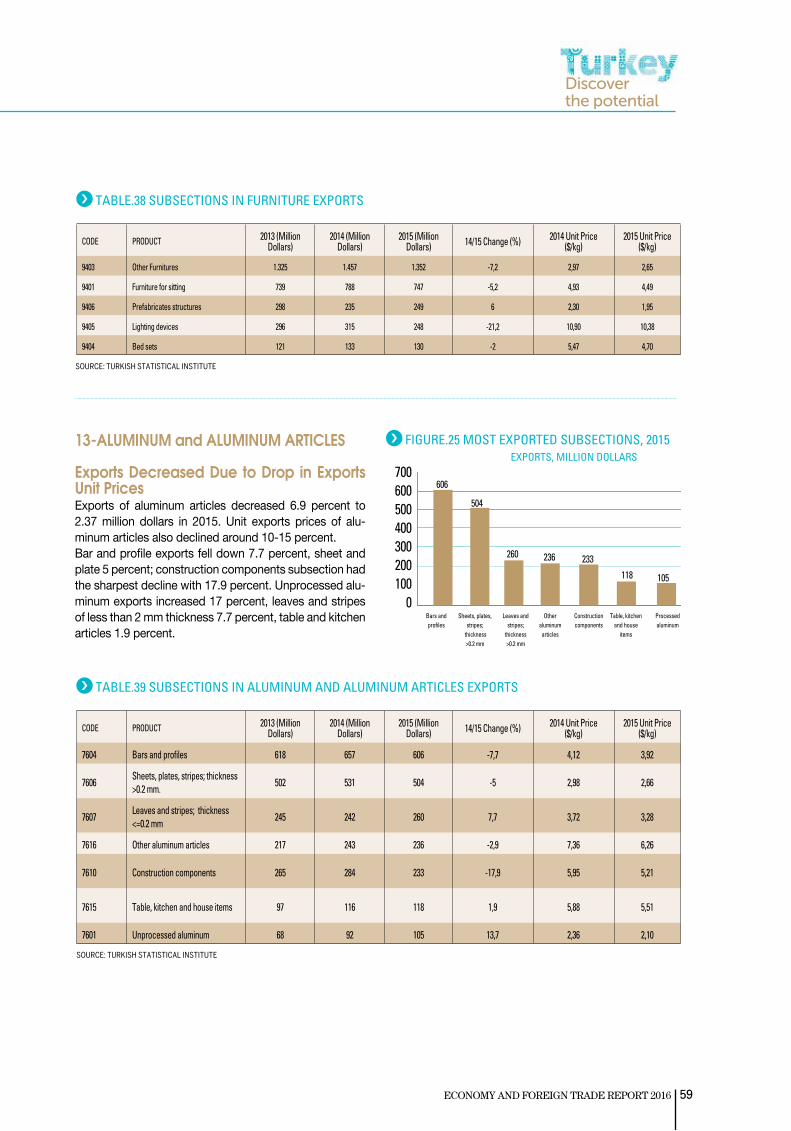
59ECONOMY AND FOREIGN TRADE REPORT 2016
SOURCE: TURKISH STATISTICAL INSTITUTEEXPORTS, MILLION DOLLARS
EXPORTS, MILLION DOLLARS
TABLE.38 SUBSECTIONS IN FURNITURE EXPORTS
CODE PRODUCT 2013 (Million Dollars)
2014 (Million Dollars)
2015 (Million Dollars) 14/15 Change (%) 2014 Unit Price
($/kg)2015 Unit Price
($/kg)
9403 Other Furnitures 1.325 1.457 1.352 -7,2 2,97 2,65
9401 Furniture for sitting 739 788 747 -5,2 4,93 4,49
9406 Prefabricates structures 298 235 249 6 2,30 1,95
9405 Lighting devices 296 315 248 -21,2 10,90 10,38
9404 Bed sets 121 133 130 -2 5,47 4,70
SOURCE: TURKISH STATISTICAL INSTITUTE
TABLE.39 SUBSECTIONS IN ALUMINUM AND ALUMINUM ARTICLES EXPORTS
CODE PRODUCT 2013 (Million Dollars)
2014 (Million Dollars)
2015 (Million Dollars) 14/15 Change (%) 2014 Unit Price
($/kg)2015 Unit Price
($/kg)
7604 Bars and profiles 618 657 606 -7,7 4,12 3,92
7606Sheets, plates, stripes; thickness >0.2 mm.
502 531 504 -5 2,98 2,66
7607Leaves and stripes; thickness <=0.2 mm
245 242 260 7,7 3,72 3,28
7616 Other aluminum articles 217 243 236 -2,9 7,36 6,26
7610 Construction components 265 284 233 -17,9 5,95 5,21
7615 Table, kitchen and house items 97 116 118 1,9 5,88 5,51
7601 Unprocessed aluminum 68 92 105 13,7 2,36 2,10
13-ALUMINUM and ALUMINUM ARTICLES
Exports Decreased Due to Drop in Exports Unit Prices Exports of aluminum articles decreased 6.9 percent to 2.37 million dollars in 2015. Unit exports prices of alu-minum articles also declined around 10-15 percent.Bar and profile exports fell down 7.7 percent, sheet and plate 5 percent; construction components subsection had the sharpest decline with 17.9 percent. Unprocessed alu-minum exports increased 17 percent, leaves and stripes of less than 2 mm thickness 7.7 percent, table and kitchen articles 1.9 percent.
FIGURE.25 MOST EXPORTED SUBSECTIONS, 2015 EXPORTS, MILLION DOLLARS
700600500400300200100
0
606
504
260 236 233
118 105
Bars and profiles
Sheets, plates, stripes;
thickness >0.2 mm
Leaves and stripes;
thickness >0.2 mm
Other aluminum
articles
Construction components
Table, kitchen and house
items
Processed aluminum
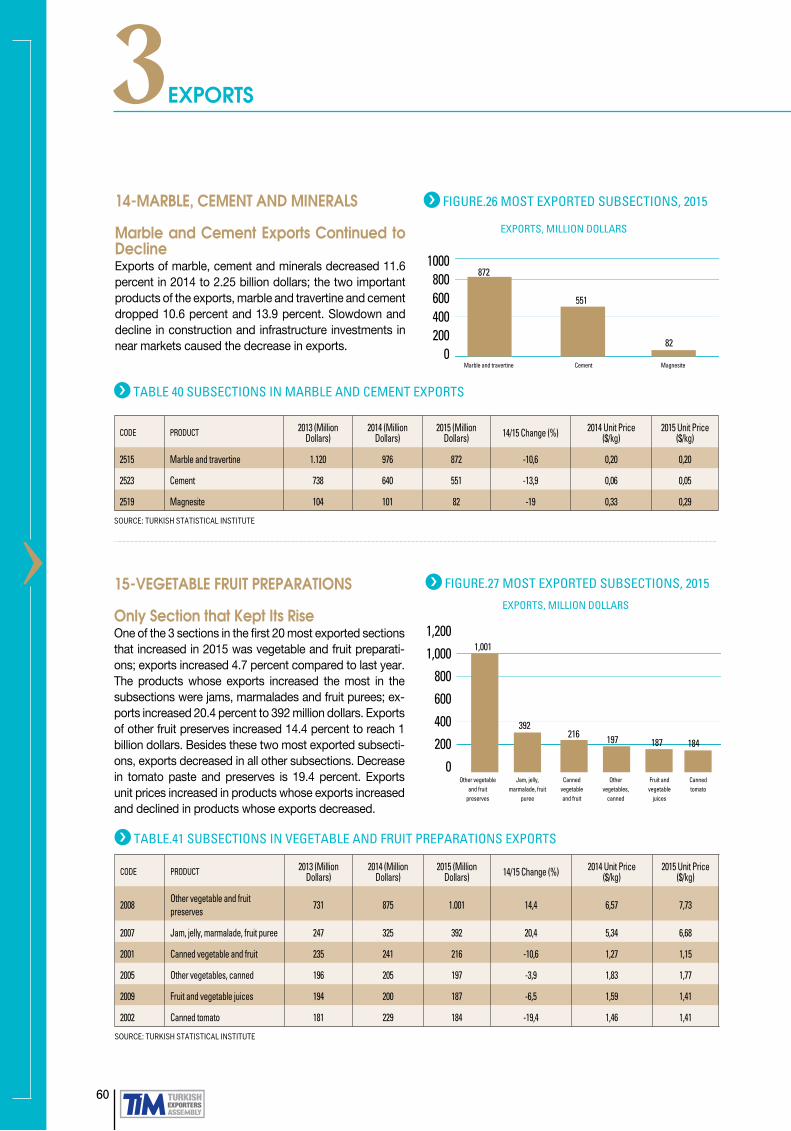
60
›
3EXPORTS
SOURCE: TURKISH STATISTICAL INSTITUTE
TABLE 40 SUBSECTIONS IN MARBLE AND CEMENT EXPORTS
CODE PRODUCT 2013 (Million Dollars)
2014 (Million Dollars)
2015 (Million Dollars) 14/15 Change (%) 2014 Unit Price
($/kg)2015 Unit Price
($/kg)
2515 Marble and travertine 1.120 976 872 -10,6 0,20 0,20
2523 Cement 738 640 551 -13,9 0,06 0,05
2519 Magnesite 104 101 82 -19 0,33 0,29
14-MARBLE, CEMENT AND MINERALS
Marble and Cement Exports Continued to Decline Exports of marble, cement and minerals decreased 11.6 percent in 2014 to 2.25 billion dollars; the two important products of the exports, marble and travertine and cement dropped 10.6 percent and 13.9 percent. Slowdown and decline in construction and infrastructure investments in near markets caused the decrease in exports.
FIGURE.26 MOST EXPORTED SUBSECTIONS, 2015
EXPORTS, MILLION DOLLARS
1000800600400200
0
872
82
551
Marble and travertine Cement Magnesite
SOURCE: TURKISH STATISTICAL INSTITUTE
TABLE.41 SUBSECTIONS IN VEGETABLE AND FRUIT PREPARATIONS EXPORTS
CODE PRODUCT 2013 (Million Dollars)
2014 (Million Dollars)
2015 (Million Dollars) 14/15 Change (%) 2014 Unit Price
($/kg)2015 Unit Price
($/kg)
2008Other vegetable and fruit preserves
731 875 1.001 14,4 6,57 7,73
2007 Jam, jelly, marmalade, fruit puree 247 325 392 20,4 5,34 6,68
2001 Canned vegetable and fruit 235 241 216 -10,6 1,27 1,15
2005 Other vegetables, canned 196 205 197 -3,9 1,83 1,77
2009 Fruit and vegetable juices 194 200 187 -6,5 1,59 1,41
2002 Canned tomato 181 229 184 -19,4 1,46 1,41
15-VEGETABLE FRUIT PREPARATIONS
Only Section that Kept Its Rise One of the 3 sections in the first 20 most exported sections that increased in 2015 was vegetable and fruit preparati-ons; exports increased 4.7 percent compared to last year. The products whose exports increased the most in the subsections were jams, marmalades and fruit purees; ex-ports increased 20.4 percent to 392 million dollars. Exports of other fruit preserves increased 14.4 percent to reach 1 billion dollars. Besides these two most exported subsecti-ons, exports decreased in all other subsections. Decrease in tomato paste and preserves is 19.4 percent. Exports unit prices increased in products whose exports increased and declined in products whose exports decreased.
FIGURE.27 MOST EXPORTED SUBSECTIONS, 2015
EXPORTS, MILLION DOLLARS
1,200
1,000
800
600
400
200
0
1,001
392216 197
Other vegetable and fruit
preserves
Jam, jelly, marmalade, fruit
puree
Canned vegetable and fruit
Canned tomato
Other vegetables,
canned
Fruit and vegetable
juices
184187

61ECONOMY AND FOREIGN TRADE REPORT 2016
SOURCE: TURKISH STATISTICAL INSTITUTE
TABLE.42 SUBSECTIONS IN RUBBER AND RUBBER ARTICLES EXPORTS
CODE PRODUCT 2013 (Million Dollars)
2014 (Million Dollars)
2015 (Million Dollars) 14/15 Change (%) 2014 Unit Price
($/kg)2015 Unit Price
($/kg)
4011 New rubber tires 1.173 1.161 980 -15,6 4,63 3,80
4016 Uncured vulcanized rubber articles 634 705 613 -13 7,92 6,62
4009 Vulcanized rubber pipes and hoses 394 432 345 -20,1 5,74 5,44
4005 Mixed rubber 92 104 76 -26,8 2,82 2,29
16-RUBBER AND RUBBER ARTICLES
Drop in Rubber Goods Exports Exports of rubber and rubber articles decreased 16.6 percent in 2015 and declined to 2.16 billion dollars. Exports of new rubber tires, the most important exports item in rubber subsections, declined 15.6 percent; exports of uncured vulcanized rubber articles decreased 13 percent, vulcanized rubber pipes and hoses 20.1 percent and mixed rubber products 26.8 percent.Exports unit prices decreased in all rubber subsection products compared to 2014.
FIGURE.28 MOST EXPORTED SUBSECTIONS, 2015
EXPORTS, MILLION DOLLARS
12001000800600400200
0
980
613
345
New rubber tires Uncured vulcanized rubber articles
Vulcanized rubber pipes and hoses
EXPORTS, MILLION DOLLARS
EXPORTS, MILLION DOLLARS
17-CARPET
Carpet Exports Could not Keep its Stable Increase Carpet exports had a stable and relatively fast increase in recent years; however it fell 14.4 percent and fell down to 2 billion dollars in 2015.In woven carpet subsections, a decline of 14.9 percent was experienced and exports fell down to 1.7 billion dollars. Exports of carpets and tufted floor covers in-creased 0.9 percent to 208 million dollars. Exports o knotted carpets fell 33.5 percent. Exports unit prices decreased in all subsection products.
SOURCE: TURKISH STATISTICAL INSTITUTE
TABLE.43 SUBSECTIONS IN CARPET AND FLOOR COVERING EXPORTS
CODE PRODUCT 2013 (Million Dollars)
2014 (Million Dollars)
2015 (Million Dollars) 14/15 Change (%) 2014 Unit Price
($/kg)2015 Unit Price
($/kg)
5702 Woven carpet and floor cover 1.877 2.012 1.713 -14,9 3,42 3,19
5703 Carpets and tufted floor covers 173 206 208 0,9 3,71 3,05
5701 Knotted or wrapped carpets 123 116 77 -33,5 47,07 34,88
FIGURE.29 MOST EXPORTED SUBSECTIONS, 2015
EXPORTS, MILLION DOLLARS
1,8001,6001,4001,2001,000
800600400200
0
1,713
20877
Woven carpet and floor cover Carpets and tufted floor covers Knotted or wrapped carpets

62
›
3EXPORTS
SOURCE: TURKISH STATISTICAL INSTITUTE
TABLE.45 SUBSECTIONS IN COTTON AND COTTON FABRICS
CODE PRODUCT 2013 (Million Dollars)
2014 (Million Dollars)
2015 (Million Dollars) 14/15 Change (%) 2014 Unit Price
($/kg)2015 Unit Price
($/kg)
5209 Textiles, over 200 gr/m2 600 560 474 -15,4 10,74 9,08
5205 Cotton yarn 397 384 385 0,4 3,63 3
5208 Textiles, less than 200 gr/m2 309 314 294 -6,3 10,52 9,19
5211 Mixed with synthetic or artificial fiber, m2>200 gr 223 232 235 1,6 13,80 11,95
5210 Mixed with synthetic or artificial fiber, m2<200 gr 128 118 86 -27,6 11,98 11,81
19-COTTON AND COTTON FABRIC
Cotton Exports Continues to Drop Exports of cotton and cotton textiles decreased 9.1 percent and declined to 1.7 billion dollars.Within the most exported subsection products, exports decreased approximately 27.6 percent in cotton textile products lighter than 200 grams/m2 mixed with synthetic or artificial fibers and came down from 118 million dollars to 86 million dollars. Exports is falling in this product rapidly. While the cotton yard exports remained the same; exports of textiles heavier than 200 grams decreased 15.4
SOURCE: TURKISH STATISTICAL INSTITUTE
TABLE.44 SUBSECTIONS IN TEXTILE EXPORTS
CODE PRODUCT 2013 (Million Dollars)
2014 (Million Dollars)
2015 (Million Dollars) 14/15 Change (%) 2014 Unit Price
($/kg)2015 Unit Price
($/kg)
6302 Linen, quilt, fabric 1.326 1.371 1.149 -16,2 9,57 8,33
6305 Packaging bag and sack 391 381 331 -13,1 4,01 3,53
6304 Other furnishing articles 166 134 123 -8,1 12,27 9,76
6303 Curtains 126 128 121 -5,6 13,30 12,68
18-TEXTILE ARTICLES
Both Exports and Unit Prices Decreased Exports of textile articles, which includes the house tex-tiles as an important branch of textile sector decreased 16.2 percent in 2015 and exports declined to 1.15 billion dollars. The developments in Russia, Ukraine, Iraq and other neighboring markets affected the exports of these products adversely. Linen, quilt and fabric exports, which has a significant sha-re in textiles, dropped 16.2 percent; packaging bag and sack exports fell 13.1 percent, other furnishing articles 8.1 percent, curtains 5.6 percent. The drop in the unit prices of subsection products varies between 5 and 20 percent.
FIGURE.30 MOST EXPORTED SUBSECTIONS, 2015
EXPORTS, MILLION DOLLARS
1,4001,2001,000
800600400200
0
1,149
331
123 121
Linen, quilt, fabric Packaging bag and sack Other furnishing articles Curtains
FIGURE.31 MOST EXPORTED SUBSECTIONS, 2015
500450400350300250200150100500
Textiles, over 200 gr/m2
Textiles, less than 200 gr/m2
Mixed with synthetic or artificial fiber,
m2>200 gr
Mixed with synthetic or artificial fiber,
m2>200 gr
Cotton yarn
EXPORTS, MILLION DOLLARS
474385
294
235
86

63ECONOMY AND FOREIGN TRADE REPORT 2016
EXPORTS, MILLION DOLLARS
20-SYNTHETIC AND ARTIFICIAL FILAMENTS
Synthetic And Artificial Filament Exports Decreased, too Exports of synthetic and artificial filaments declined 11.7 percent to 1.56 billion dollars in 2015; exports increase slowed down.There are two important items in synthetic and artificial filaments exports. Exports of fabrics made from synthetic filament yarns decreased 13.23 percent to 878 million dollars; synthetic filament yarns exports decreased 9.3 percent to 574 million dollars.
SOURCE: TURKISH STATISTICAL INSTITUTE
TABLE.46 SUBSECTIONS IN SYNTHETIC AND ARTIFICIAL FILAMENTS
CODE PRODUCT 2013 (Million Dollars)
2014 (Million Dollars)
2015 (Million Dollars) 14/15 Change (%) 2014 Unit Price
($/kg)2015 Unit Price
($/kg)
5407Fabrics made from synthetic filament yarns
981 1.013 878 -13,3 9,85 8,74
5402 Synthetic filament yarns 595 633 574 -9,3 3,30 2,89
5408Fabrics made from synthetic filament yarns
76 84 72 -14,6 18,06 17,13
FIGURE.32 MOST EXPORTED SUBSECTIONS, 2015
1,000900800700600500400300200100
0Fabrics made from synthetic
filament yarnsSynthetic filament yarns
878
574
EXPORTS, MILLION DOLLARS
percent and fell from 560 million dollars to 474 million dollars.Even though the cotton prices increased compared
to 2014, the decline in unit prices of cotton products and problems in the near and neighboring markets continued to affect the exports negatively.

64
›
3EXPORTS
SOURCE: TURKISH STATISTICAL INSTITUTE
TABLO.47 SECTIONS IN EXPORTS TO GERMANY
CODE PRODUCT 2013 (Million Dollars) 2014 (Million Dollars) 2015 (Million Dollars) 14/15 Change (%)
84 Machines 2.162 2.352 2.085 -11,4
87 Motor land vehicles and components. parts 1.722 2.142 2.012 -6
61 Knitted garment articles 2.220 2.384 1.888 -20,8
85 Electrical machines and devices 881 995 900 -9,5
62 Nonwoven garments 895 937 799 -14,7
20 Vegetables and fruits 461 555 687 23,7
73 Iron or steel articles 483 553 499 -9,8
63 Ready-made articles from woven material 557 550 472 -14,1
8 Fruits and edible hard shelled fruits 448 478 459 -4
40 Rubber and rubber articles 479 514 422 -18
III.8 EXPORTS BY COUNTRIES AND SECTIONS
1-GERMANY
Germany Continues to be Our Biggest Export market Exports to Germany decreased 11.4 percent to 13.43 billion dollars in 2015. Germany’s share in total exports declined from 9.6 percent to 9.3 percent.In the exports made to Germany, exports decreased in many sections. The first three ranks in the exports to Germany changed as Machines, Motor land vehicles and Knitted garment articles. The largest drops in the exports to Germany occurred in Knitted garment articles with 20.8 percent and rubber and rubber articles with 18 percent. Motor land vehicles exports decline in a more limited manner with 6 percent.
The product group whose exports increased to Germany was vegetables and fruits with 23.7 percent.
19,8
9,6
9,4
9,2
9
8,8
FIGURE.33 EXPORTS TO GERMANY AND ITS SHARE IN OUR EXPORTS
15,50015,00014,50014,00013,50013,00012,500
2013 2014 2015
EXPORTS MILLION DOLLARS
SHARE IN OUR EXPORTS %
EXPORTS AND SHARE IN OUR EXPORTS
9,1
9,3
9,6
2-ENGLAND
England rises to Second Place in Our ExportsWhile our exports to many countries decreased in 2015, exports to England increased. England rose to the second place in our export markets. Exports to England went up 6.7 percent to reach 10.56 billion dol-lars in 2015. England’s share in our exports rose from 6.3 percent to 7.3 percent. Precious and semi-precious stones exports to England made a jump to 1.26 billion dollars. The most exported section to England, Motor land vehicles, increased 10.6 percent. The exports of other products, on the other hand, decreased. Knitted
8
6
4
2
0
FIGURE.34 EXPORTS TO ENGLAND AND ITS SHARE IN OUR EXPORTS
15,000
10,000
5,000
0
EXPORTS MILLION DOLLARS
SHARE IN OUR EXPORTS %
EXPORTS AND SHARE IN OUR EXPORTS
5,8
7,36,3
2013 2014 2015

65ECONOMY AND FOREIGN TRADE REPORT 2016
3-IRAQ
Decrease in Iraq Market Deepens Our commercial loss in Iraq continued and deepened in 2015 and Iraq declined to the third place in the ranking of our export markets. Exports decreased
CODE PRODUCT 2013 (Million Dollars) 2014 (Million Dollars) 2015 (Million Dollars) 14/15 Change (%)
15 Solid and liquid animal and vegetable oils 661 606 504 -16,8
39 Plastics and plastic articles 671 588 493 -16,2
11 Grinding mill products 528 550 486 -11,7
94 Furnitures 577 564 482 -14,4
85 Electrical machines and devices 949 759 477 -37,1
73 Iron or steel articles 906 793 471 -40,6
71 Precious or semi-precious stones 452 493 464 -5,7
72 Iron and steel 1.240 671 445 -33,7
61 Knitted garment articles and accessories 352 408 440 8
84 Machines 674 513 371 -27,7
SOURCE: TURKISH STATISTICAL INSTITUTE
TABLE.49 SECTIONS IN EXPORTS TO IRAQ
EXPORTS AND SHARE IN OUR EXPORTS
21.4 percent to 8.56 billion dollars in 2015. Its share in total exports fell from 6.9 percent to 5.9 percent; there has been a loss of 2 points in two
CODE PRODUCT 2013 (Million Dollars) 2014 (Million Dollars) 2015 (Million Dollars) 14/15 Change (%)
87 Motor land vehicles and components, parts 1.865 2.220 2.456 10,6
61 Knitted garment articles and accessories 1.442 1.641 1.459 -11,1
71 Precious or semi-precious stones 55 135 1.261 832,6
85 Electrical machines and devices 1.028 1.170 1.087 -7,1
84 Machines 910 892 780 -12,6
62 Nonwoven garments and accessories 613 713 634 -11,2
73 Iron or steel articles 389 449 390 -13,1
39 Plastics and plastic articles 221 239 226 -5,6
8 Fruits and edible hard shelled fruits 215 212 210 -1
48 Articles made of paper or cardboard 120 132 139 5,7
TABLE.48 SECTIONS IN EXPORTS TO ENGLAND
SOURCE: TURKISH STATISTICAL INSTITUTE
EXPORTS AND SHARE IN OUR EXPORTS
garment articles exports fell 11.1 percent, Machines ex-ports 12.6 percent and Electrical machines and devices 7.1 percent.
England continues to be one of the fastest growing economies of the European Union. Turkey benefited from England’s recovery in 2015.

66
›
3EXPORTS
years. Almost all important sections decreased in the exports to Iraq. The biggest decline was in iron-steel products with 40.6 percent. Electrical machines and devices declined 37.1 percent, Machines 27.7 percent.The only section whose exports to Iraq increased was knitted garment articles. The political and safety issues with Iraq affected our export in 2015, too.
10
8
6
4
2
0
FIGURE.35 EXPORTS TO IRAQ AND ITS SHARE IN OUR EXPORTS
14,00012,00010,0008,0006,0004,0002,000
02013 2014 2015
5,8
EXPORTS MILLION DOLLARS
SHARE IN OUR EXPORTS %
EXPORTS AND SHARE IN OUR EXPORTS
7,9
5,9
CODE PRODUCT 2013 (Million Dollars) 2014 (Million Dollars) 2015 (Million Dollars) 14/15 Change (%)
87 Motor land vehicles and components, parts 1.524 1.566 1.655 5,7
8 Fruits and edible hard shelled fruits 432 663 647 -2,4
84 Machines 439 520 529 1,7
61 Knitted garments and accessories 374 372 324 -13
85 Electrical machines and devices 237 240 315 31,3
60 Knitted articles and accessories 311 329 260 -21
52 Cotton, cotton yarn and cotton textile 289 289 250 -13,4
39 Plastics and plastic articles 177 228 203 -11
72 Iron and steel 389 196 200 2
62 Nonwoven garments and accessories 231 228 191 -16,4
TABLE.50 SECTIONS IN EXPORTS TO ITALY
4-ITALY
Decline in Exports to Italy was More Limited Our exports decreased significantly in many export markets in 2015. However, exports to Italy decline in a relatively limited manner. Italy continued to be our fourth largest export market. Exports to Italy decreased 3.5 percent in 2015 and exports totaled 6.89 billion dollars. Italy’s share in our exports rose to 4.8 percent.In 2015, there was increase in three sections in the exports to Italy. Electrical machines and devices exports increased 31.3 percent, machines 1.7 percent, iron and steel 2 percent; exports decreased in the other sections. The biggest drop in exports to Italy was in knitted articles and accessories with 21 percent.Italy grew economically in 2015 again. With the contribution of this growth, Turkey’s exports to Italy declined less compared to the declines in exports to other countries.
SOURCE: TURKISH STATISTICAL INSTITUTE
4,94,84,74,64,54,44,34,2
FIGURE.36 EXPORTS TO ITALY AND ITS SHARE IN OUR EXPORTS
7,2007,1007,0006,9006,8006,7006,6006,500
3,7
EXPORTS MILLION DOLLARS
SHARE IN OUR EXPORTS %
EXPORTS AND SHARE IN OUR EXPORTS
4,4
4,5
4,8
6,9
2013 2014 2015

67ECONOMY AND FOREIGN TRADE REPORT 2016
6-FRANCE
Despite the Drop in Exports France is Our Sixth Biggest Market Now Exports to France declined 9.5 percent to 5.85 billion dollars in 2015. France’s share in our exports became 4.1 percent. France fell back one place with USA’s rise and became our 6th largest export market. Exports to France declined almost in all major sections. The biggest declines occurred in ready-made garments and house textiles products. Motor land vehicles fell 11.9 percent, electrical machines and devices 10.3 percent and machines 11.8 percent. France had a weak economic growth in 2015 and Turkey’s exports performance was limited.
4,25
4,2
4,15
4,1
4,05
FIGURE.38 EXPORTS TO FRANCE AND ITS SHARE IN OUR EXPORTS
6,600
6,400
6,200
6,000
5,800
5,600
5,400
3,7
EXPORTS MILLION DOLLARS
SHARE IN OUR EXPORTS %
EXPORTS AND SHARE IN OUR EXPORTS
4,2
4,14,1
CODE PRODUCT 2013 (Million Dollars) 2014 (Million Dollars) 2015 (Million Dollars) 14/15 Change Ratio (%)
72 Iron and steel 513 1.141 913 -20
87 Motor land vehicles and components, parts 664 458 763 66,7
84 Machines 619 711 680 -4,4
68 Mineral products 309 346 348 0,5
73 Iron or steel articles 296 341 335 -1,8
88 Air vehicles, components and parts 305 254 281 10,5
57 Carpets 221 272 274 0,8
63 Ready-made articles from woven material 214 226 220 -2,8
71 Precious or semi-precious stones 133 153 165 8,4
61 Knitted garment articles and accessories 114 123 149 21,3
TABLE.51 SECTIONS IN EXPORTS TO USA
5-USA
Exports Increased, USA became Our Fifth Biggest Market While our exports to a few countries increased in 2015, USA became our fifth biggest market in 2015. Exports to USA increased 0.9 percent in 2015 and reached 6.40 billion dollars. USA’s share in our exports rose from 4 percent to 4.4 percent. In the exports to USA, exports increased in many important product groups. Motor land vehicles, and components and parts exports increased 66.7 percent. Aerospace vehicles components and parts exports increased 10.5 percent, Knitted garment articles 21.3 percent. On the other hand, exports of iron and steel products decreased 20 percent. USA economy continued to grow in 2015 rapidly. Its imports demand is growing accordingly.
4,64,44,243,83,63,43,2
FIGURE.37 EXPORTS TO USA AND ITS SHARE IN OUR EXPORTS
6,6006,4006,2006,0005,8005,6005,4005,200
2013 2014 2015
4,4
EXPORTS MILLION DOLLARS
SHARE IN OUR EXPORTS %
EXPORTS AND SHARE IN OUR EXPORTS
3,7
SOURCE: TURKISH STATISTICAL INSTITUTE
4
2013 2014 2015

68
›
3EXPORTS
CODE PRODUCT 2013 (Million Dollars) 2014 (Million Dollars) 2015 (Million Dollars) 14/15 Change (%)
87 Motor land vehicles and components. parts 2.091 2.068 1.822 -11,9
85 Electrical machines and devices 661 704 631 -10,3
84 Machines 563 594 524 -11,8
61 Knitted garment articles and accessories 606 603 463 -23,3
8 Fruits and edible hard shelled fruits 250 247 326 31,7
62 Nonwoven garments and accessories 311 328 261 -20,4
73 Iron or steel articles 212 181 177 -2,1
39 Plastics and plastic articles 177 191 176 -7,7
63 Ready-made articles from woven material 194 182 149 -18,5
94 Furnitures 112 125 131 4,9
TABLE.52 SECTIONS IN EXPORTS TO FRANCE
SOURCE: TURKISH STATISTICAL INSTITUTE
SOURCE: TURKISH STATISTICAL INSTITUTE
CODE PRODUCT 2013 (Million Dollars) 2014 (Million Dollars) 2015 (Million Dollars) 14/15 Change (%)
71 Precious or semi-precious stones 231 2.342 4.889 108,7
87 Motor land vehicles and components. parts 116 149 121 -19
8 Fruits and edible hard shelled fruits 67 88 115 30,5
76 Aluminum and aluminum articles 64 68 65 -3,7
85 Electrical machines and devices 50 105 62 -40,9
61 Knitted garments and accessories 77 68 58 -14,3
TABLE.53 SECTIONS IN EXPORTS TO SWITZERLAND
7-SWITZERLAND
Gold Exports Still Dominant in Swiss Market Exports to Switzerland grew 77 percent to 5.68 billion dollars in 2015. Switzerland’s share in Turkey’s export market went up to 3.9 percent. Switzerland became the only country in the top 20 exports ranking that escalated rapidly. Gold exports is influential on exports to Switzerland. God exports to Switzerland increased 108.7 percent to 4.89 billion dollars. Motor land vehicles, electrical machines and devices decreased considerably.
5
4
3
2
1
0
FIGURE.39 EXPORTS TO SWITZERLAND AND ITS SHARE IN OUR EXPORTS
6,000
5,000
4,000
3,000
2,000
1,000
0
3,9
EXPORTS MILLION DOLLARS
SHARE IN OUR EXPORTS %
EXPORTS AND SHARE IN OUR EXPORTS
0,7
2
2013 2014 2015

69ECONOMY AND FOREIGN TRADE REPORT 2016
8-SPAIN
Recovery in Spain is Reflected in Our Exports Exports to Spain declined only 0.1 percent to 4.75 billion dollars in 2015. Exports to Spain increased in four sections. Woven garments exports increased 6.3 percent, Motor land vehicles components and parts 15.1 percent, Cotton, cotton yarn and cotton textile 11.7 percent, plastic and plastic articles 8.9 percent. Machine exports went up 1.3 percent. On the other hand, mineral fuels and electrical machines and devices exports fell considerably. Spanish economy grew relatively rapidly in 2015; fast growth in Spanish economy is reflected to Turkey’s exports positively.
33,43,33,23,132,92,82,7
FIGURE.40 EXPORTS TO SPAIN AND ITS SHARE IN OUR EXPORTS
4,8004,7004,6004,5004,4004,3004,2004,100
EXPORTS MILLION DOLLARS
SHARE IN OUR EXPORTS %
EXPORTS AND SHARE IN OUR EXPORTS
EXPORTS AND SHARE IN OUR EXPORTS
CODE PRODUCT 2013 (Million Dollars) 2014 (Million Dollars) 2015 (Million Dollars) 14/15 Change (%)
87 Motor land vehicles and components. parts 629 819 942 15,1
62 Nonwoven garments and accessories 699 823 875 6,3
61 Knitted garment articles and accessories 753 766 754 -1,5
84 Machines 290 353 357 1,3
27 Mineral fuels and mineral oils 302 247 184 -25,3
85 Electrical machines and devices 206 184 156 -15,2
72 Iron and steel 137 155 140 -9,4
39 Plastics and plastic articles 88 114 124 8,9
40 Rubber and rubber articles 110 107 93 -13,2
52 Cotton. cotton yarn and cotton textile 81 78 87 11,7
TABLE.54 SECTIONS IN EXPORTS TO SPAIN
SOURCE: TURKISH STATISTICAL INSTITUTE
3
3,3
2,9
9-UNITED ARAB EMIRATES
Exports to UAE increased, Whose Oil Revenues Dropped Exports to United Arab Emirates increased 0.6 percent to 4.68 billion dollars. UAE’s share in our export markets rose to 3.3 percent. UAE’s imports was affected negatively by the fall in their revenues due to dwindling oil prices. Despite that, Turkey managed to increase its exports to UAE, even slightly. Exports of precious and semi-precious stones to UAE increased 4.6 percent and exceeded the 2 billion dollars level again. Exports of electrical machines and devices increased 20.5 percent,
FIGURE.41 EXPORTS TO UAE AND ITS SHARE IN OUR EXPORTS
EXPORTS AND SHARE IN OUR EXPORTS
3,43,33,23,132,92,8
5,000
4,900
4,800
4,700
4,600
4,500
3
3,3
EXPORTS MILLION DOLLARS
SHARE IN OUR EXPORTS %
3,3
4,966
4,656 4,681
2013 2014 2015
2013 2014 2015
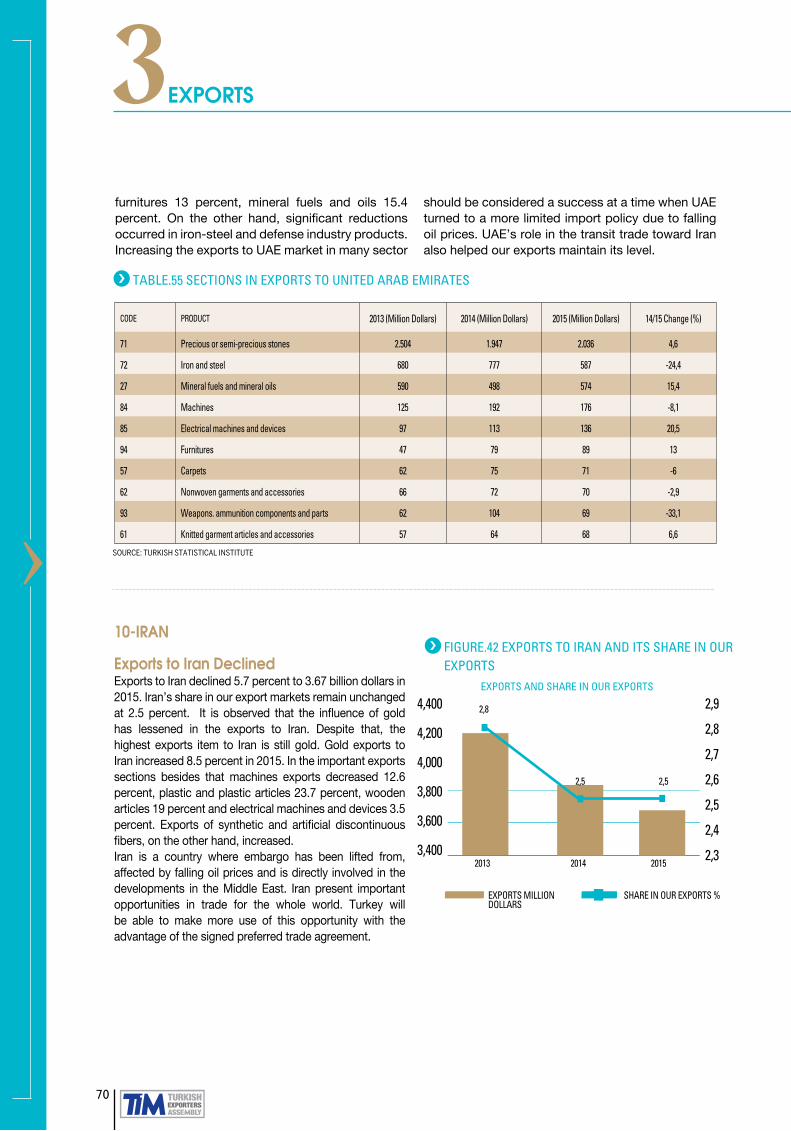
70
›
3EXPORTS
CODE PRODUCT 2013 (Million Dollars) 2014 (Million Dollars) 2015 (Million Dollars) 14/15 Change (%)
71 Precious or semi-precious stones 2.504 1.947 2.036 4,6
72 Iron and steel 680 777 587 -24,4
27 Mineral fuels and mineral oils 590 498 574 15,4
84 Machines 125 192 176 -8,1
85 Electrical machines and devices 97 113 136 20,5
94 Furnitures 47 79 89 13
57 Carpets 62 75 71 -6
62 Nonwoven garments and accessories 66 72 70 -2,9
93 Weapons. ammunition components and parts 62 104 69 -33,1
61 Knitted garment articles and accessories 57 64 68 6,6
TABLE.55 SECTIONS IN EXPORTS TO UNITED ARAB EMIRATES
SOURCE: TURKISH STATISTICAL INSTITUTE
10-IRAN
Exports to Iran Declined Exports to Iran declined 5.7 percent to 3.67 billion dollars in 2015. Iran’s share in our export markets remain unchanged at 2.5 percent. It is observed that the influence of gold has lessened in the exports to Iran. Despite that, the highest exports item to Iran is still gold. Gold exports to Iran increased 8.5 percent in 2015. In the important exports sections besides that machines exports decreased 12.6 percent, plastic and plastic articles 23.7 percent, wooden articles 19 percent and electrical machines and devices 3.5 percent. Exports of synthetic and artificial discontinuous fibers, on the other hand, increased. Iran is a country where embargo has been lifted from, affected by falling oil prices and is directly involved in the developments in the Middle East. Iran present important opportunities in trade for the whole world. Turkey will be able to make more use of this opportunity with the advantage of the signed preferred trade agreement.
2,9
2,8
2,7
2,6
2,5
2,4
2,3
FIGURE.42 EXPORTS TO IRAN AND ITS SHARE IN OUR EXPORTS
4,400
4,200
4,000
3,800
3,600
3,400
2,5 2,5
EXPORTS AND SHARE IN OUR EXPORTS
EXPORTS MILLION DOLLARS
SHARE IN OUR EXPORTS %
2,8
furnitures 13 percent, mineral fuels and oils 15.4 percent. On the other hand, significant reductions occurred in iron-steel and defense industry products. Increasing the exports to UAE market in many sector
should be considered a success at a time when UAE turned to a more limited import policy due to falling oil prices. UAE’s role in the transit trade toward Iran also helped our exports maintain its level.
2013 2014 2015

71ECONOMY AND FOREIGN TRADE REPORT 2016
CODE PRODUCT 2013 (Million Dollars) 2014 (Million Dollars) 2015 (Million Dollars) 14/15 Change (%)
71 Precious or semi-precious stones 1.679 820 890 8,5
84 Machines 349 484 423 -12,6
39 Plastics and plastic articles 209 244 186 -23,7
44 Wood and wooden articles 130 209 169 -19
85 Electrical machines and devices 144 164 158 -3,5
24 Tobacco 113 133 133 0,2
55 Synthetic and artificial discontinuous fibers 91 95 120 26,4
87 Motor land vehicles components and parts 73 108 99 -8
96 Various manufactured articles 25 44 93 111,5
73 Iron or steel articles 107 116 90 -22,1
TABLE.56 SECTIONS IN EXPORTS TO IRAN
SOURCE: TURKISH STATISTICAL INSTITUTE
EXPORTS AND SHARE IN OUR EXPORTS
CODE PRODUCT 2013 (Million Dollars) 2014 (Million Dollars) 2015 (Million Dollars) 14/15 Change (%)
8 Fruits and edible hard shelled fruits 614 622 600 -3,6
7 Vegetables 347 385 337 -12,5
84 Machines 730 577 319 -44,7
87 Motor land vehicles components and parts 947 647 214 -66,9
39 Plastics and plastic articles 319 307 186 -39,4
60 Knitted articles 365 230 169 -26,7
85 Electrical machines and devices 363 330 138 -58,1
73 Iron or steel articles 163 137 93 -31,6
54 Synthetic and artificial filaments 211 178 90 -49,1
55 Synthetic and artificial discontinuous fibers 126 114 90 -21,6
TABLE.57 SECTIONS IN EXPORTS TO RUSSIA
SOURCE: TURKISH STATISTICAL INSTITUTE
11-RUSSIA
High Loss in Russian Market Exports to Russia declined 39.5 percent in 2015 to 3.59 billion dollars. Russia’s share in our export market fell from 3.8 to 2.5 percent. Russia declined rapidly and became our eleventh market. There have been significant declines in all exports sections. Motor land vehicles exports decreased 66.9 percent. Electrical machines and devices 58.1 percent, plastic and plastic articles 39.4 percent. In addition to the economic downsizing due to the decline in oil prices, the political crisis we began to have with this country towards the end of the year affected Turkey’s export very negatively.
5
4
3
2
1
0
FIGURE.43 EXPORTS TO IRAQ AND ITS SHARE IN OUR EXPORTS
8,000
6,000
4,000
2,000
0
3,8
2,5
EXPORTS MILLION DOLLARS
SHARE IN OUR EXPORTS %
EXPORTS AND SHARE IN OUR EXPORTS
4,6
2013 2014 2015

72
›
3EXPORTS
CODE PRODUCT 2013 (Million Dollars) 2014 (Million Dollars) 2015 (Million Dollars) 14/15 Change (%)
85 Electrical machines and devices 377 269 417 55,2
57 Carpets 321 370 388 4,8
27 Mineral fuels and mineral oils 22 197 280 42,1
84 Machines 194 233 271 16,4
94 Furnitures 98 135 196 45,4
87 Motor land vehicles and components. parts 78 103 141 37
72 Iron and steel 738 205 131 -36,1
62 Nonwoven garments and accessories 126 135 130 -3,6
73 Iron or steel articles 98 120 130 8,1
68 Mineral products 96 111 115 3,2
TABLE.58 SECTIONS IN EXPORTS TO SAUDI ARABIA
12-SAUDI ARABIA
Highest Exports Increase to Saudi Arabia In Turkey’s top twenty export markets, exports to six-teen countries decreased and to four countries it inc-reased. S.Arabia has been the fastest growing market for our exports in 2015. Our exports to S. Arabia inc-reased 14.1 percent to 3.48 billion dollars. S.Arabia’s share in our exports went up to 2.4 percent. Exports to S.Arabia increase significantly in all important sec-tions except iron-steel and woven garment products. Exports of mineral fuels and oils increased 42.1 per-cent, furnitures 45.4 percent, Motor land vehicles and components parts 37 percent. Despite the decline in S. Arabia’s revenues, significant exports increases
32,521,510,50
FIGURE.44 EXPORTS TO S. ARABIA AND ITS SHARE IN OUR EXPORTS
3,6003,5003,4003,3003,2003,1003,0002,9002,800
2,11,9
2,4
EXPORTS MILLION DOLLARS
SHARE IN OUR EXPORTS %
EXPORTS AND SHARE IN OUR EXPORTS
continued in 2015 in many sections. Despite the decli-ne in S. Arabia’s oil revenues, significant exports incre-ases continued in 2015 in many sections.
13-HOLLAND
Exports Performance to Holland Weakened Exports to Holland decreased 8.7 percent to 3.16 billion dollars in 2015. Holland’s share in our exports became 2.2 percent and its ranking in top twenty fell down two places. Exports of ready-made garments and iron-steel decreased, while in all other important sectors exports increased. Motor land vehicles exports, the highest exports item, increased 0.9 percent in 2015. Machine exports increased 6.1 percent, electrical machines and devices 5.9 percent, water products 9.1 percent. Holland’s economy grew rapidly in 2015; Turkey benefitted from this growth by increasing its exports in many sections.
2,35
2,3
2,25
2,2
2,15
FIGURE.45 EXPORTS TO HOLLAND AND ITS SHARE IN OUR EXPORTS
3,6003,5003,4003,3003,2003,1003,0002,900
2,2 2,2
EXPORTS MILLION DOLLARS
SHARE IN OUR EXPORTS %
EXPORTS AND SHARE IN OUR EXPORTS
2,3
2013 2014 2015
2013 2014 2015
SOURCE: TURKISH STATISTICAL INSTITUTE

73ECONOMY AND FOREIGN TRADE REPORT 2016
CODE PRODUCT 2013 (Million Dollars) 2014 (Million Dollars) 2015 (Million Dollars) 14/15 Change (%)
87 Motor land vehicles and components. parts 447 417 421 0,9
61 Knitted garment articles and accessories 434 452 393 -13
62 Nonwoven garments and accessories 354 361 308 -14,7
84 Machines 144 165 175 6,1
3 Water products 110 132 144 9,1
20 Vegetable and fruit preparations 121 131 135 2,9
8 Fruits and edible hard shelled fruits 126 140 127 -9,3
72 Iron and steel 182 228 123 -46,1
27 Mineral fuels and mineral oils 401 111 114 2,9
85 Electrical machines and devices 118 104 111 5,9
TABLE.59 SECTIONS IN EXPORTS TO HOLLAND
SOURCE: TURKISH STATISTICAL INSTITUTE
CODE PRODUCT 2013 (Million Dollars) 2014 (Million Dollars) 2015 (Million Dollars) 14/15 Change (%)
27 Mineral fuels and mineral oils 1.164 859 619 -28
72 Iron and steel 294 329 484 47
84 Machines 187 202 228 12,4
73 Iron or steel articles 121 124 152 22,4
87 Motor land vehicles components and parts 109 200 139 -30,5
39 Plastics and plastic articles 121 141 138 -2,2
85 Electrical machines and devices 103 117 110 -6,1
57 Carpets 42 68 78 14,5
28 Inorganic chemicals 67 88 77 -12,4
62 Nonwoven garments and accessories 59 68 71 3,7
SOURCE: TURKISH STATISTICAL INSTITUTE
14-EGYPT
Exports Decreased While Problems Persist in Bilateral Relations Problems persist in the bilateral political relation with Egypt. Exports to Egypt decreased 5.1 percent to 3.13 billion dollars in 2015. Egypt had a share of 2.2 percent in Turkey’s export markets. Exports to Egypt increased in many important subsections and decreased in many sections. Iron and steel exports increased 47 percent, machines 12.4 percent, iron and steel articles 22.4 percent. By contrast Motor land vehicles exports decreased 30.5 percent. The highest exports item, mineral fuels and oils exports declined 28 percent.
TABLE.60 SECTIONS IN EXPORTS TO EGYPT
2,25
2,2
2,15
2,1
2,05
FIGURE.46 EXPORTS TO EGYPT AND ITS SHARE IN OUR EXPORTS
3,500
3,300
3,250
3,200
3,100
3,050
3,000
2,2
EXPORTS MILLION DOLLARS
SHARE IN OUR EXPORTS %
EXPORTS AND SHARE IN OUR EXPORTS
2,12,1
2013 2014 2015

74
›
3EXPORTS
16-ISRAEL
Export to Israel decreased by 8,5% Export to Israel decreased by 8,5% in 2015 and amounted to 2,7 billion dollars. Share of Israel in our export did not change by 1,9%. Iron-steel export to Israel decreased by 36%, motor land vehicles export decreased by 8,3% and electrical equipment and devices decreased by 5,8%. Export of woven wear increased by 11,8% and export of plastics and plastic goods increased by 11,8% as well. However, export of iron and steel goods dropped considerably.Our potential of export to Israel, which keeps growing among the regional problems, continues despite the decreases in 2015.
FIGURE.48 EXPORT TO ISRAEL AND SHARE OF ISRAEL IN OUR EXPORT
1,951,91,851,81,751,71,651,6
3,0002,9002,8002,7002,6002,5002,400
1,9 1,9
EXPORT MILLION $ SHARE IN OUR EXPORT %
EXPORT AND SHARE IN OUR EXPORT
15-ROMANIA
Export to Romania decreased Import to Romani decreased by 6,4% in 2015 and amounted to 2,82 billion dollars. Share of Romania in our total export increased by 2%. The rapid increase of import in recent years has slowed down.In 2015, export to Romania dropped in many sections but increased in machinery by 3,6%, woven wear by 11,9%, iron and steel goods by 1,6%. Export of motor land vehicles decreased by 11,7%. Export of iron and steel dropped by 18,8% as well.Despite the reduction in 2015, potential increase of export is preserved with growth in Romanian economy and growing commercial merge between two countries.
CODE PRODUCT 2013 (Million dollars) 2014 (Million dollars) 2015 (Million dollars) 14/15 Change (%)
84 Machinery 356 336 348 3,6
87 Parts of motor land vehicles 285 305 269 -11,7
61 Woven wear and accessories 140 263 254 -3,3
62 Unwoven wear and accessories 102 188 211 11,9
73 Iron or steel goods 167 189 193 1,6
72 Iron and steel 205 225 183 -18,8
39 Plastics and plastic products 177 185 163 -11,7
85 Electrical equipment and devices 101 103 97 -6
60 Woven wear and home accessories 94 95 71 -25,6
54 Synthetic and artificial filaments 60 65 58 -9,8
TABLE.61 SECTIONS IN EXPORT TO ROMANIA
SOURCE: TURKISH STATISTICAL INSTITUTE
2,1
2
1,9
1,8
1,7
1,6
1,5
FIGURE.47 EXPORT TO ROMANIA AND SHARE OF ROMANIA IN OUR EXPORT
3,1003,0002,9002,8002,7002,6002,5002,400
1,9
2
EXPORT MILLION $ SHARE IN OUR EXPORT %
EXPORT AND SHARE IN OUR EXPORT
1,7
1,7
2013 2014 2015
2013 2014 2015

75ECONOMY AND FOREIGN TRADE REPORT 2016
17-BELGIUM
Export to Belgium decreased rapidly Export to Belgium decreased by 13% in 2015 and amounted to 2,56 billion dollars. Share of Belgium in our total export decreased to 1,8%. Belgium became the country to which our export de-creased relatively more rapidly among European Union countries.Belgium continues to be the market which we export in many sections. In 2015, export of synthetic and artificial filaments, vegetable and fruit products and plastics and plastic products increased. However, export of motor land vehicles, woven and knitted wear, machinery and electrical equipment and devices decreased. Despite the improvement in Benelux region, our export to Bel-gium decreased over the average.
CODE PRODUCT 2013 (Million Dolars) 2014 (Million Dollars) 2015 (Million Dollars) 14/15 Change (%)
87 Parts of motor land vehicles 389 507 465 -8,3
72 Iron and steel 459 508 325 -36
85 Electrical equipment and devices 195 193 182 -5,8
39 Plastics and plastic products 143 172 181 5,5
62 Unwoven wear and accessories 120 140 156 11,8
84 Machinery 154 154 144 -6,2
73 Iron or steel goods 75 120 81 -32,1
25 Mineral products 69 69 76 10,2
71 Precious and semi-precious stones 58 67 72 7,2
61 Woven wear and home accessories 46 60 67 12,1
CODE PRODUCT 2013 (Million dollars) 2014 (Million dollars) 2015 (Million dollars) 14/15 Change (%)
87 Parts of motor land vehicles 841 916 870 -5,1
61 Woven wear and accessories 245 247 207 -16,3
84 Machinery 186 184 178 -3
54 Synthetic and artificial filaments 114 124 129 4,1
62 Unwoven wear and accessories 133 126 84 -33
85 Electrical equipment and devices 108 106 84 -20,5
20 Vegetable and fruit products 46 61 80 30,1
71 Precious and semi-precious stones 30 88 78 -11,4
39 Plastics and plastic products 69 72 76 4,5
26 Metal ores, cinder and ash 102 119 70 -40,9
TABLE.62 SECTIONS IN EXPORT TO ISRAEL
TABLE.63 SECTIONS ON EXPORT TO BELGIUM
SOURCE: TURKISH STATISTICAL INSTITUTE
SOURCE: TURKISH STATISTICAL INSTITUTE
1,951,91,851,81,751,71,651,6
FIGURE.49 EXPORT TO BELGIUM AND SHARE OF BELGIUM IN OUR EXPORT
3,0002,9002,8002,7002,6002,5002,4002,300
1,9
1,8
EXPORT MILLION $ SHARE IN OUR EXPORT %
EXPORT AND SHARE IN OUR EXPORT
EXPORT AND SHARE IN OUR EXPORT
1,7
2013 2014 2015

76
›
3EXPORTS
CODE PRODUCT 2013 (Million dollars) 2014 (Million dollars) 2015 (Million dollars) 14/15 Change (%)
25 Mineral products 1.091 952 840 -11,7
26 Metal ores, cinder and ash 1.363 842 550 -34,7
28 Inorganic chemicals 289 268 227 -15
84 Machinery 95 117 124 6,2
55 Synthetic and artificial discontinuous fibers 64 32 54 66
32 Dyes 33 34 37 8,3
73 Iron and steel goods 36 41 36 -12
90 Sensitive measurement and weighing equipment 22 31 35 15,6
52 Cotton, cotton yarn and cotton textiles 69 40 34 -15,6
TABLE.64 SECTIONS IN EXPORT TO CHINA
SOURCE: TURKISH STATISTICAL INSTITUTE
1,7
1,6
1,5
1,4
1,3
FIGURE.51 EXPORT TO POLAND AND SHARE OF POLAND IN OUR EXPORT
2,600
2,400
2,200
2,000
1,800
1,5
1,6
EXPORT MILLION $ SHARE IN OUR EXPORT %
EXPORT AND SHARE IN OUR EXPORT
18-CHINA
Economic slowdown in China affected our export negatively Export to China decreased considerably in 2014 and then in 2015. Export to China dropped by 15,6% in 2015 and amounted to 2,42 billion dollars. Among our first 20 export markets, China was included in the countries with relatively high export decrease. Share of China in our export decreased to 1,7%. Marble export, which is very important in our exports to China, decreased by 11,7%, export of metal ores decreased by 34,7% and export of inorganic chemicals decreased by 15%. On the other hand, export of machinery, dye and synthetic and artificial discontinuous fibers increased. Growth in infrastructure, construction and industry investments of China is reducing and rate of economic growth is dropping. Therefore, import of China in metal, mineral and raw material is decreasing. China export of Turkey, which concentrated on such products, was affected badly in 2015 due to these reasons.
3
2,5
2
1,5
1
0,5
0
FIGURE.50 EXPORT TO CHINA AND SHARE OF CHINA IN OUR EXPORT
4,000
3,000
2,000
1,000
0
1,8 1,7
EXPORT MILLION $ SHARE IN OUR EXPORT %
EXPORT AND SHARE IN OUR EXPORT
19-POLAND
Rapid growth in Poland limits our export losses Export to Poland decreased by 3% in 2015 and amounted to 2,33 billion dollars. However, share of Poland in our export increased to 1,6%. Poland became one of the few countries which our export decreased only limited in 2015. In our export to Poland, some sections decreased while some sections increased. Export of motor land vehicles decreased by 6,3%. Export of woven and knitted wear increased. Export of machinery dropped by 2,5% and export of electrical equipment and devices decreased by 4,4%. Poland was the fastest growing economy in 2015 among EU-28. Rapid economical growth of Poland limits decrease of our export to this country.
2,4
1,4
2013 2014 2015
2013 2014 2015

77ECONOMY AND FOREIGN TRADE REPORT 2016
CODE PRODUCT 2013 (Million dollars) 2014 (Million dollars) 2015 (Million dollars) 14/15 Change (%)
87 Parts of motor land vehicles 374 396 372 -6,3
61 Woven wear and accessories 191 253 254 0,6
84 Machinery 191 252 246 -2,5
8 Fruit and nuts 79 96 166 71,9
62 Unwoven wear and accessories 112 151 162 6,9
85 Electrical equipment and devices 194 226 133 -41,4
39 Plastics and plastic products 92 103 101 -2,3
76 Aluminum and aluminum products 69 77 87 13,6
52 Cotton, cotton yarn and cotton textiles 108 98 81 -18
73 Iron or steel goods 85 78 71 -9,3
TABLE.65 SECTIONS ON EXPORT TO POLAND
SOURCE: TURKISH STATISTICAL INSTITUTE
20-AZERBAIJAN
Devaluation in Azerbaijan caused sharp decrease in our export Export to Azerbaijan decreased by 33,9% in 2015 and amounted to 1,9 billion dollars. Share of Azerbaijan in our export dropped to 1,3%. Among the first 20 markets, Azerbaijan became the country with the highest decrease in export. Reduction in oil prices and high devaluation in currency affected our expert adversely. In our exports to Azerbaijan, machinery decreased by 43,1%, iron and steel goods decreased by 38,4%, iron-steel goods decreased by 38,4%, electrical equipment and devices decreased by 45,5%, plastics and plastics products decreased by 35,3% and furniture decreased by 42,1%.
EXPORT AND SHARE IN OUR EXPORT
CODE PRODUCT 2013 (Million dollars) 2014 (Million dollars) 2015 (Million dollars) 14/15 Change (%)
84 Machinery 387 345 196 -43,1
39 Plastics and plastic products 258 270 175 -35,3
85 Electrical equipment and devices 265 272 148 -45,5
73 Iron or steel goods 259 240 148 -38,4
94 Furniture 221 224 130 -42,1
34 Cleaning materials 71 79 71 -10,6
87 Parts of motor land vehicles 96 90 68 -24,1
96 Various finished products 65 66 67 2
76 Aluminum and aluminum products 66 71 59 -15,8
72 Iron and steel 142 107 59 -45,2
TABLE.66 SECTIONS ON EXPORT TO AZERBAIJAN
SOURCE: TURKISH STATISTICS INSTITUTE
2
1,5
1
0,5
0
FIGURE.52 EXPORT TO AZERBAIJAN AND SHARE OF AZERBAIJAN IN OUR EXPORT
3,5003,0002,5002,0001,5001,000
5000
1,8
1,3
EXPORT MILLION $ SHARE IN OUR EXPORT %
EXPORT AND SHARE IN OUR EXPORT
1,9
2013 2014 2015


4IMPORT

4IMPORT
80
› IV.1 BASIC IMPORT INDICATORS
IV.1.1 Total Import and Our Position in the Goods Import Worldwide Import has decreased considerably following global developments, en-ergy politics and reduction in energy prices In 2015, import of Turkey decreased by 14,5%to $207,2 billion. Import dropped by $35 billion in 2015. There are four important causes of the re-duction in import. The foremost of these causes is the important reduction in oil and natural gas prices as well as the other goods in 2015. Energy import of Turkey which is foreign-dependent in energy decreased considerably in 2015. The second cause is the
ever-increasing protection measures in import by means of the economy politics applied as of 2012. The third cause is the value loss of Turkish Lira in 2015 by about 20%, making import even more ex-pensive. The fourth cause is the shrinkage in merchandise
2013 2014 2015
IMPORT (BILLION DOLLARS) 251,6 242,2 207,2
VALUE-BASED VARIANCE % 6,4 -3,8 -14,5
2013 2014 2015
MERCHANDISE TRADE WORLD-WIDE – VALUE-BASED GROWTH %
2,0 1,2 -10,9
IMPORT OF TURKEY VALUE-BASED GROWTH %
6,4 -3,8 -14,5
TABLE 1. IMPORT
TABLE.2 MERCHANDISE TRADE WORLDWIDE AND GROWTH COMPARISON
SOURCE: TURKISH STATISTICAL INSTITUTE
SOURCE: TURKISH STATISTICAL INSTITUTE, WORLD TRADE ORGANIZATION
2013 2014 2015
IMPORT OF TURKEY (BILLION DOLLARS)
251,6 242,2 207,2
MERCHANDISE TRADE WORLDWIDE (BILLION DOLLARS)
18.595 18.711 16.766
SHARE OF TURKEY% 1,35 1,29 1,24
TABLE 3.OUR SHARE IN MERCHANDISE TRADE WORLDWIDE
SOURCE: TURKISH STATISTICAL INSTITUTE, WORLD TRADE ORGANIZATION
10
5
0
-5
-10
-15
-20
FIGURE.1 DEVELOPMENTS IN IMPORT
300
250
200
150
100
50
02013 2014 2015
207,2
-14,5
IMPORT (BILLION DOLLARS)
ANNUAL GROWTH %
IMPORT (BILLION DOLLARS) AND GROWTH (PERCENT)
-3,8
trade due to recession in global economics and its effect on the import of Turkey.
Import of Turkey slowed down more rapidly Import increase of Turkey is compared with devel-opment of merchandise trade worldwide. In 2015, merchandise trade worldwide lost value by 10,9% in dollars. Merchandise import of Turkey dropped by 14,5% in 2015. Merchandise import of Turkey decreased far more than the merchandise trade worldwide in 2015. High dependence of Turkey on energy import whose prices decreased consider-ably played an important role in these figures.
FIGURE.2 OUR SHARE IN MERCHANDISE TRADE WORLDWIDE
1,36
1,34
1,32
1,3
1,28
1,26
1,24
1,22
1,2
1,18
1,162013 2014 2015
1,29
1,24
OUR SHARE IN MERCHANDISE TRADE WORLDWIDE PERCENT1,35
6,4
251,6242,2

ECONOMY AND FOREIGN TRADE REPORT 2016 81
TABLE.4 OUR RANK IN THE MERCHANDISE IMPORT WORLDWIDE
SOURCE: WORLD TRADE ORGANIZATION
1 USA 2.409 2.308 -4,2 13,77 1
2 CHINA 1.960 1.682 -14,2 10,04 2
3 GERMANY 1.217 1.050 -13,7 6,26 3
4 JAPON 822 648 -21,0 3,87 4
5 ENGLAND 683 626 -8,3 3,74 5
6 FRANCE 679 573 -15,8 3,41 6
7 HONG KONG 601 559 -7,0 3,34 7
8 NETHERLANDS 587 506 -13,8 3,02 8
9 SOUTH KOREA 526 436 -17,1 2,60 9
10 CANADA 475 436 -9,1 2,60 10
11 ITALY 472 409 -13,3 2,44 11
12 MEXICO 412 405 -1,7 2,42 14
13 INDIA 460 392 -14,8 2,34 12
14 BELGIUM 451 375 -16,9 2,24 13
15 SPAIN 356 309 -13,2 1,84 16
16 SINGAPORE 366 297 -18,9 1,77 15
17 SWITZERLAND 276 252 -8,7 1,50 26
18 TAIWAN 274 238 -13,1 1,42 18
19 UAE 262 230 -15,7 1,40 19
20 AUSTRALIA 238 208 -12,0 1,20 22
21 TURKEY 242 207 -14,5 1,24 20
22 THAILAND 228 203 -11,0 1,21 23
23 RUSSIA 308 194 -37,0 1,16 17
24 POLAND 218 193 -11,5 1,15 24
25 BRAZIL 239 179 -25,1 1,07 21
26 MALAYSIA 209 176 -15,8 1,05 25
27 SAUDI ARABIA 174 172 -0,9 1,03 29
28 VIETNAM 149 166 +11,4 0,99 32
29 AUSTRIA 182 155 -14,8 0,92 27
30 INDONESIA 178 143 -19,7 0,85 28
IMPORT (BILLION DOLLARS) 2014/2015 CHANGE (%) 2015 SHARE (%) RANKING IN 2014
NO COUNTRY
Share of Turkey in merchandise trade worldwide decreased by 1,24% Share of Turkey in merchandise trade worldwide decreased from 1,29% in 2014 to 1,24% in 2015. In the last two years, share of Turkey in the import worldwide decreased by 0,11 points.
Turkey has become the twenty first biggest importer of the world In recent years, Turkey has been among the first twenty countries in terms of important merchan-dise importer of the world.
2014 2015

82
›
4IMPORT
TABLE.5 IMPORT ACCORDING TO ECONOMIC ACTIVITIES
TABLE.6 IMPORT ACCORDING TO CLASSIFICATION OF LARGE ECONOMIC GROUPS
TABLE.7 IMPORT ACCORDING TO INTERNATIONAL TRADE CLASSIFICATION (SITC REV.3)
IV.1.2 Import according to Economic Activities and Classification of Large Economic Groups Sectoral distribution and development of the merchandise import in Turkey are evaluated by using three different international merchandise classifications.
The Highest Share in Import belongs to the Manufacturing Industry Products According to the classification of economic activities, the highest share in import of Turkey belongs to the manufacturing industry products. While the share of the manufacturing industry products was 77,5% in 2015, it increased to 80,5% in 2015. Mining and stone quarry products constituted the second biggest import group. Share of the mining and stone
SOURCE: TURKISH STATISTICAL INSTITUTE
SOURCE: TURKISH STATISTICAL INSTITUTE
SOURCE: TURKISH STATISTICAL INSTITUTE, *INCLUDING GOLD
2013 2014 CHANGE
2014
2015 (%) SHARE (%) SHARE (%) SHARE (%)IMPORT
(MILLION $)IMPORT
(MILLION $)IMPORT
(MILLION $)
2013 2014 CHANGE
2014
2015 (%) SHARE (%)IMPORT (MILLION $)
2013 2014 CHANGE
2014
2015 (%)
quarry within the total import decreased to 13,3% in 2014 and 2015. Import of agriculture forestry, fishery and other products is very limited within the total import.
Import of Intermediate Goods Decreased Considerably while Decrease in the Import of Investment and Consumption Goods Remained Restricted According to classification of large economic groups, there are
80
70
60
50
40
30
20
10
0INVESTMENT GOODS
2013 2014 2015
14,6
73,1
12,2 1213,8
7369,2
14,8 16,8
INTERMEDIATE GOODS
CONSUMPTION GOODS
SHARE OF MERCHANDISE GROUPS – PERCENTAGE
2015
2015
2015
AGRICULTURE
AND FORESTRY 7.718 3,1 8.588 3,5 7.178 3,5 -16,4
FISHERY 58 0,1 69 0,1 88 0,1 27,5
MINING AND
STONE QUARRY 38.205 15,2 37.126 15,3 27.610 13,3 -25,6
MANUFACTUR-
ING INDUSTRY
196.823 78,2 187.742 77,5 166.788 80,5 -11,2
OTHER 8.857 3,4 8.652 3,6 5.539 2,7 -36,0
GRAND TOTAL 251.661 100,0 242.177 100,0 207.203 100,0 -14,5
FIGURE.3 DISTRIBUTION OF IMPORT ACCORDING TO MERCHANDISE GROUPS
SHARE (%) SHARE (%)IMPORT (MILLION $)
IMPORT (MILLION $)
INVESTMENT
GOODS36.771 14,6 35.996 14,8 34.897 16,8 -3,1
INTERMEDIATE
GOODS183.811 73,1 176.722 73,0 143.293 69,2 -18,9
CONSUMPTION
GOODS30.416 12,2 29.006 12,0 28.587 13,8 -1,4
OTHER 663 0,3 453 0,2 426 0,2 -6,0
GRAND TOTAL 251.661 100,0 242.177 100,0 207.203 100,0 -14,5
SHARE (%) SHARE (%) SHARE (%)IMPORT (MILLION $)
IMPORT (MILLION $)
IMPORT (MILLION $)
LIVESTOCK AND FOOD PRODUCTS 6.784 2,7 6.970 2,9 6.509 3,1 -6,6
ALCOHOL AND TOBACCO 703 0,3 792 0,3 759 0,4 -4,2
INEDIBLE RAW MATERIALS EXCEPT FUEL OIL
16.798 6,7 16.975 7,0 12.595 6,1 -25,8
ANIMAL AND VEGETAL SOLID AND LIQUID OIL
1.871 0,7 2.187 0,9 1.899 0,9 -13,2
MINERAL FUELS AND OILS 55.916 22,2 54.889 22,7 37.842 18,3 -31,1
CHEMICAL INDUSTRY AND RELEVANT PRODUCTS
31.873 12,7 33.211 13,7 28.960 14,0 -12,8
CLASSIFIED PROCESSED PRODUCTS
38.713 15,4 38.447 15,9 35.608 17,2 -7,4
MACHINERY AND VEHICLES 68.407 27,2 65.809 27,2 65.422 31,6 -0,6
VARIOUS MANUFACTURED GOODS
15.124 6,0 15.498 6,4 13.922 6,7 -10,2
BYS GOODS* 15.472 6,1 7.398 3,1 3.686 1,8 -50,0
GRAND TOTAL 251.661 100,0 242.177 100,0 207.203 100,0 -14,5
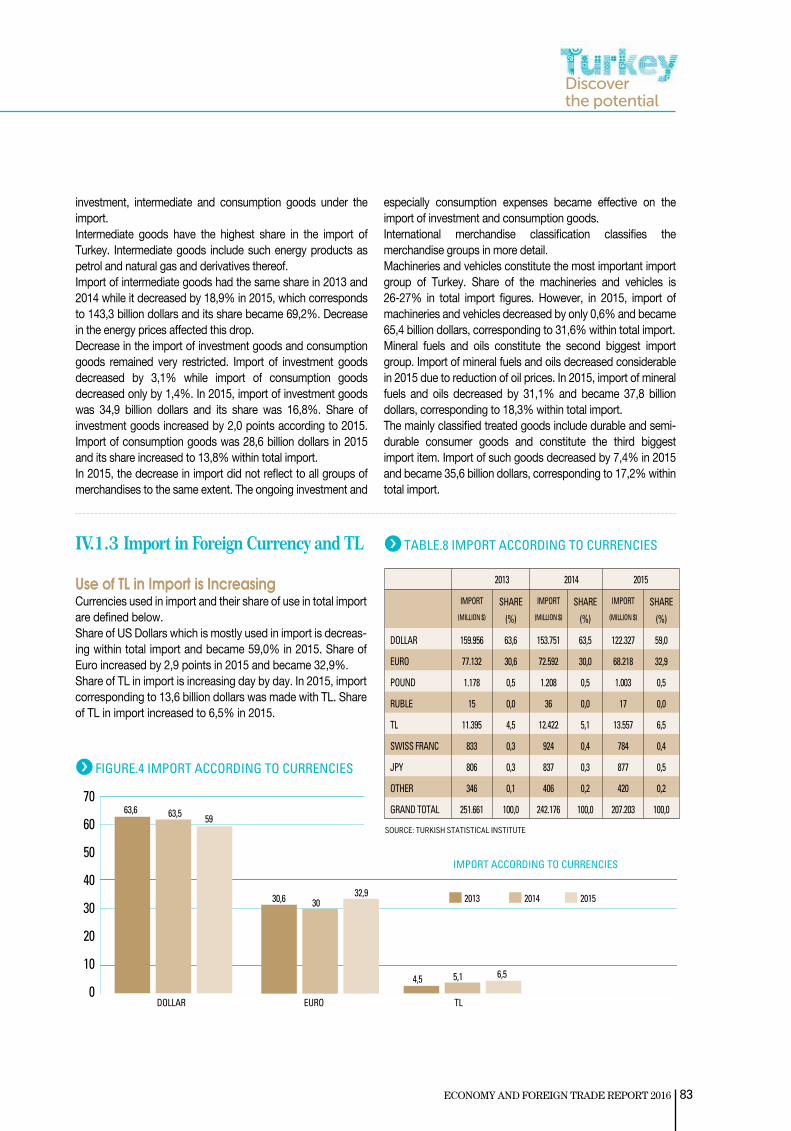
83ECONOMY AND FOREIGN TRADE REPORT 2016
investment, intermediate and consumption goods under the import. Intermediate goods have the highest share in the import of Turkey. Intermediate goods include such energy products as petrol and natural gas and derivatives thereof. Import of intermediate goods had the same share in 2013 and 2014 while it decreased by 18,9% in 2015, which corresponds to 143,3 billion dollars and its share became 69,2%. Decrease in the energy prices affected this drop. Decrease in the import of investment goods and consumption goods remained very restricted. Import of investment goods decreased by 3,1% while import of consumption goods decreased only by 1,4%. In 2015, import of investment goods was 34,9 billion dollars and its share was 16,8%. Share of investment goods increased by 2,0 points according to 2015. Import of consumption goods was 28,6 billion dollars in 2015 and its share increased to 13,8% within total import. In 2015, the decrease in import did not reflect to all groups of merchandises to the same extent. The ongoing investment and
especially consumption expenses became effective on the import of investment and consumption goods. International merchandise classification classifies the merchandise groups in more detail. Machineries and vehicles constitute the most important import group of Turkey. Share of the machineries and vehicles is 26-27% in total import figures. However, in 2015, import of machineries and vehicles decreased by only 0,6% and became 65,4 billion dollars, corresponding to 31,6% within total import. Mineral fuels and oils constitute the second biggest import group. Import of mineral fuels and oils decreased considerable in 2015 due to reduction of oil prices. In 2015, import of mineral fuels and oils decreased by 31,1% and became 37,8 billion dollars, corresponding to 18,3% within total import. The mainly classified treated goods include durable and semi-durable consumer goods and constitute the third biggest import item. Import of such goods decreased by 7,4% in 2015 and became 35,6 billion dollars, corresponding to 17,2% within total import.
TABLE.8 IMPORT ACCORDING TO CURRENCIES IV.1.3 Import in Foreign Currency and TL
Use of TL in Import is Increasing Currencies used in import and their share of use in total import are defined below.Share of US Dollars which is mostly used in import is decreas-ing within total import and became 59,0% in 2015. Share of Euro increased by 2,9 points in 2015 and became 32,9%. Share of TL in import is increasing day by day. In 2015, import corresponding to 13,6 billion dollars was made with TL. Share of TL in import increased to 6,5% in 2015.
SOURCE: TURKISH STATISTICAL INSTITUTE
IMPORT
(MILLION $)
SHARE
(%)
IMPORT
(MILLION $)
SHARE
(%)
IMPORT
(MILLION $)
SHARE
(%)
DOLLAR 159.956 63,6 153.751 63,5 122.327 59,0
EURO 77.132 30,6 72.592 30,0 68.218 32,9
POUND 1.178 0,5 1.208 0,5 1.003 0,5
RUBLE 15 0,0 36 0,0 17 0,0
TL 11.395 4,5 12.422 5,1 13.557 6,5
SWISS FRANC 833 0,3 924 0,4 784 0,4
JPY 806 0,3 837 0,3 877 0,5
OTHER 346 0,1 406 0,2 420 0,2
GRAND TOTAL 251.661 100,0 242.176 100,0 207.203 100,0
201520142013
FIGURE.4 IMPORT ACCORDING TO CURRENCIES
70
60
50
40
30
20
10
0DOLLAR EURO TL
59
30,6
4,5 5,1 6,5
3032,9
63,6 63,5
2013 2014 2015
IMPORT ACCORDING TO CURRENCIES

84
›
4IMPORT
IV.1.4 Import According to Payment Modes and Transport Means Cash against Goods increased while Cash Payment decreased in Import When we evaluate the distribution of import according to payment modes, two payment modes stand out which are cash payment and cash against goods.Amount of import made with cash payment and its share within total import increased in 2012-2014. However, in 2015, import made with cash payment decreased to 46,0% and became 95,4 billion dollars.Share of the cash against goods remained almost the same in 2012-2014 but increased from 29,5% to 33,2% in 2015. Reduction in global goods demands and slowdown in trade became effective in prevailing of cash against goods over cash payment. The other two payment modes whose shares decreased as well are the payments made with letter of credit and cash against documents.
TABLE.9 IMPORT ACCORDING TO PAYMENT MODES
CASH AGAINST GOODS 77.764 30,9 71.529 29,5 68.789 33,2
CASH PAYMENT 117.640 46,7 119.326 49,3 95.345 46,0
CASH AGAINST DOCUMENTS 15.523 6,2 14.920 6,2 10.692 5,2
DEFERRED LETTER OF CREDIR 12.206 4,9 10.543 4,4 9.978 4,8
FREE OF CHARGE 5.200 2,1 6.243 2,6 6.845 3,3
PRIVATE BARTER 850 0,3 33 0,0 19 0,0
LETTER OF CREDIR 21.271 8,5 18.442 7,6 14.661 7,1
COUNTER PURCHASE 6 0,0 13 0,0 12 0,0
L/C WITH ACCEPTANCE CREDIT
171 0,1 118 0,1 77 0,0
CASH AGAINST DOCUMENTS WITH ACCEPTANCE CREDIT
555 0,2 493 0,2 473 0,2
CASH AGAINST GOODS WITH ACCEPTANCE CREDIT
474 0,2 516 0,2 312 0,2
PRIVATE ACCOUNT 0,5 0,0 0,1 0,0 0,0 0,0
GRAND TOTAL 251.661 100,0 242.177 100,0 207.203 100,0
2013 2014
SHARE (%)SHARE (%)SHARE (%) MILLION DOLLAR
MILLION DOLLAR
MILLION DOLLAR
2015
SOURCE: TURKISH STATISTICAL INSTITUTE
TABLE.10 IMPORT ACCORDING TO TRANSPORT MEANS
SOURCE: TURKISH STATISTICAL INSTITUTE
SEA 139.927 55,6 141.381 58,4 124.436 60,0
RAILWAY 1.773 0,7 1.207 0,5 1.170 0,6
ROAD 40.058 15,9 37.301 15,4 34.364 16,6
AIR 32.603 13,0 24.697 10,2 19.976 9,6
PIPELINES 37.300 14,8 37.591 15,5 27.258 13,2
GRAND TOTAL 251.661 100,0 242.177 100,0 207.203 100,0
2013 2014
SHARE (%)SHARE (%)SHARE (%) MILLION DOLLAR
MILLION DOLLAR
MILLION DOLLAR
2015
FIGURE.5 DISTRIBUTION OF IMPORT ACCORDING TO TRANSPORT MEANS 2015
SEA
RAILWAY
ROAD
AIRPIPELINE
SHARES OF TRANSPORT MEANS IN IMPORT - PERCENTAGE
60 %
13 %
17 %
9 %
1 %
Share of Import by Sea is increasing There are five ways of import in distribution of import based on transport means: by sea, railway, road and air as well as pipelines used for import of natural gas. Amount and share of sea transport is increasing for the last four years. Import by sea decreased to 124,4 billion dollars in 2015 whereas its share in total import increased to 60,0%. Shares of import by road and railway increased as well but in a limited manner. Share of import with pipelines is changing based on the oil and natural gas prices. Due to price reduction in the last three years, amount and share of the pipelines decreased.

85ECONOMY AND FOREIGN TRADE REPORT 2016
Medium-High Technology Products have the highest share in total import of TurkeyImport of the sectors and their shares within total import are evaluated in terms of technology. Medium-high technology products have the highest share in total import of Turkey. Import of medium-high technology products decreased by 6,6% in 2015; however it amounted to 73,9 billion dollars and its share increased to 44,3% within total import. Share of medium-low technological products in import
IV.2 IMPORT OF MANUFACTURING INDUSTRY IN TERMS OF TECHNOLOGY
TABLE.11 IMPORT OF MANUFACTURING INDUSTRY IN TERMS OF TECHNOLOGY
SOURCE: TURKISH STATISTICAL INSTITUTE
FIGURE.6 DISTRIBUTION OF IMPORT OF INDUSTRY GOODS IN TERMS OF TECHNOLOGY
HIGH TECHNOLOGY PRODUCTS
2013
2014
2015
12,3
41,2
33,6
12,714,1
42,1
30,3
13,515,7
44,3
26,5
13,5
MEDIUM- HIGH TECHNOLOGY
PRODUCTS
MEDIUM-LOW TECHNOLOGY
PRODUCTS
LOW TECHNOLOGY PRODUCTS
SHARE OF TECHNOLOGY GROUPS IN IMPORT – PERCENTAGE
In 2015, amount of import increased by 1,7% İDevelopment of import in terms of total value depends on the amount of import and unit import value. In 2015, value of the Turkish import decreased by 14,5% and amounted to 207,2 billion dollars. However, amount of import increased by 1,7% in 2015. Decrease of import in the sense of value arose from reduc-tion of unit value of import by 15,9%. In spite of the economic regression and the precautions, there has not been any decrease in the amount of import for the last four years. Increase in foreign currency has not caused and quantitative reduction in import.Unit values of import have been falling for the last four years. The global reductions in the prices of energy, metal, goods and raw materials in the last four years are causing the unit values of import to fall in Turkey. Therefore, value decrease in import of Turkey is mostly stemming from the reductions in the prices worldwide. Amount and value-based developments in world import and import of Turkey are being compared for the last three years.
IV.3 DEVELOPMENTS IN PROCESS AND AMOUNTS OF IMPORT
TABLE.12 AMOUNT AND UNIT VALUE INDEX OF IMPORT 2010=100
SOURCE: TURKISH STATISTICAL INSTITUTE
2010 100 - 100 -
2011 112,9 12,9 115,1 15,1
2012 114,1 1,1 111,8 -2,9
2013 122,6 7,4 110,6 -1,1
2014 122,4 -0,2 106,7 -3,5
2015 124,5 1,7 89,7 -15,9
IMPORT AMOUNT INDEX 2010=100
IMPORT UNIT VALUE INDEX 2010=100
CHANGE (%)INDEX
TABLE.13 AMOUNT AND UNIT VALUE CHANGES IN WORLD AND TURKEY IMPORT - CHANGES IN %
SOURCE: TURKISH STATISTICAL INSTITUTE AND WORLD TRADE ORGANIZATION
AMOUNT IN WORLD 2,4 2,8 2,8
AMOUNT IN TURKEY 7,4 -0,2 1,7
UNIT VALUE IN WORLD -0,5 -1,2 -15,4
UNIT VALUE IN TURKEY -1,1 -3,5 -15,9
20142013 2015
2013 2014 2015
CLASSIFICATION MILLION ($) SHARE (%) MILLION ($) SHARE (%) MILLION ($) SHARE (%)
HIGH TECHNOL-OGY PRODUCTS 24.258 12,3 26.365 14,1 26.219 15,7
MEDIUM- HIGH TECHNOLOGY PRODUCTS
81.012 41,2 79.121 42,1 73.896 44,3
MEDIUM-LOW TECHNOLOGY PRODUCTS
66.504 33,6 56.961 30,3 44.214 26,5
LOW TECHNOL-OGY PRODUCTS 25.049 12,7 25.344 13,5 22.457 13,5
TOTAL IMPORT OF MANU-FACTURING INDUSTRY
196.823 100,0 187.790 100,0 166.788 100,0
of Turkey decreased to 26,5%. In 2015, import of medium technology products decreased by 22,3% and amounted to 44,21 billion dollars. Import of main metal industry and metal goods industry, which are included in the medium-low technology products, fell due to significant decreases in metal prices. High technology products have an important share in the import. Import of high technology products, a considerable part of which is not produced in Turkey, decreased only by 0,6% in 2015 and amounted to 26,21 billion dollars and its share in total import increased to 15,7%.
CHANGE (%)INDEX

86
›
4IMPORT
The global import of goods increased by 8,0% in the last three years while the import of Turkey increased by 8,9%. In the global import of goods, Unit value of import decreased by 17,1% in the last three years and this decrease was 21,1% for Turkey. Import of Turkey increased by 0,9 points com-pared with the world average whereas unit value of import decreased by 4,0 points based on the same comparison.
SOURCE: TURKISH STATISTICAL INSTITUTE
TABLE.15 UNIT VALUE DEVELOPMENTS IN IMPORT (IMPORT UNIT VALUE INDEX (2010=100) ACCORDING TO INTERNATIONAL TRADE CLASSIFICATION (SITC REV.3)
2013 2014 2015
CHANGE
2013/
2014 (%)
CHANGE
2014/
2015 (%)
LIVESTOCK AND FOOD PRODUCTS 135,2 144,5 148,1 6,9 2,5
ALCOHOL AND TOBACCO 139,7 150,0 157,8 7,4 5,2
INEDIBLE RAW MATERIALS EXCEPT FUEL OIL
102,9 107,4 101,3 4,4 -5,7
ANIMAL AND VEGETAL SOLID AND LIQUID OIL
150,7 175,1 167,4 16,2 -4,4
MINERAL FUELS AND OILS 113,8 119,9 130,3 5,4 8,7
CHEMICAL INDUS-TRY AND RELEVANT PRODUCTS
119,1 125,6 124,8 5,5 -0,6
CLASSIFIED PRO-CESSED PRODUCTS 120,7 122,2 129,6 1,2 6,1
MACHINERY AND VEHICLES 117,3 115,7 121,5 -1,4 5,0
VARIOUS MANUFACTURED GOODS
112,0 113,0 103,0 0,9 -8,8
SOURCE: TURKISH STATISTICAL INSTITUTE
TABLE.14 AMOUNT DEVELOPMENTS IN IMPORT (IMPORT AMOUNT INDEX (2010=100) ACCORDING TO INTERNATIONAL TRADE CLASSIFICATION (SITC REV.3)
2013 2014 2015
CHANGE
2013/
2014 (%)
CHANGE
2014/
2015 (%)
LIVESTOCK AND FOOD PRODUCTS 111,4 107,1 97,6 -3,9 -8,9
ALCOHOL AND TOBACCO 111,8 117,4 107,0 5,0 -8,9
INEDIBLE RAW MATERIALS EXCEPT FUEL OIL
106,0 102,7 80,7 -3,1 -19,5
ANIMAL AND VEGETAL SOLID AND LIQUID OIL 118,6 119,3 107,6 0,6 -9,8
MINERAL FUELS AND OILS 127,7 118,9 75,4 -6,9 -36,6
CHEMICAL INDUSTRY AND RELEVANT PRODUCTS
105,2 103,9 91,2 -1,2 -12,2
CLASSIFIED PROCESSED PRODUCTS 100,9 99,0 86,4 -1,9 -12,7
MACHINERY AND VEHICLES 108,2 105,6 99,9 -2,4 -5,4
VARIOUS MANUFACTURED GOODS
115,9 117,9 116,2 1,7 -1,4
UNIT VALUE OF IMPORT AND AMOUNT INDEX 2010=100
FIGURE.7 DEVELOPMENTS IN TERMS OF AMOUNT AND UNIT VALUE OF IMPORT
100
115,1 114,1
122,6 122,4124,5
106,7
110,6111,8112,9
2010 2011 2012 2013 2014 2015
UNIT VALUE OF IMPORT INDEX IMPORT AMOUNT INDEX
130
120
110
100
90
Import of Many Sectors increased in quantitative terms In 2015, import of many sub-sectors increased in quantitative terms despite the significant reduction in total import. Mineral oils and fuels increased by 8,7%. Import increased in quantitative terms due to reduction in oil and natural gas prices and the newly established operating capacity. In 2015, import of machinery and vehicles increased by 5,0% as well. Demands in automobile and increase in the sales became effective. Import of the mainly classi-fied processed goods also increased by 6,1% in quantitative terms.

87ECONOMY AND FOREIGN TRADE REPORT 2016
SOURCE: TURKISH STATISTICAL INSTITUTE
Import decreased in 18 of the 20 biggest importer provinces Total import decreased in 2015 and import performances of the provinces turned out to be similar. In 2015, 18 of the 20 big-gest importer provinces dropped while only 2 provinces lived an increase in import. Import of Istanbul, which had the highest im-port rates, decreased by 13,4% in 2015 and amounted to 117,8 billion dollars. Share of Istanbul in total import became 56,9%. Among other big importer provinces following Istanbul, Kocaeli lived an increase while import of Ankara, Izmir, Bursa and Ga-ziantep dropped. Decrease in import of Turkey remained very restricted among these four provinces. In 2015, Zonguldak, Denizli and Adana experienced the highest decrease in import. Another province which made the highest import in 2015 among the first 20 provinces became Antalya. Import of Antalya increased by 20,9%.
IV.4 IMPORT IN PROVINCES TABLE.16 IMPORT ACCORDING TO PROVINCES
1 İSTANBUL 117.785 56,85 136.005 56,16 -13,4
2 KOCAELİ 9.894 4,78 9.369 3,87 5,6
3 ANKARA 9.812 4,74 10.984 4,54 -10,7
4 İZMİR 8.847 4,27 9.934 4,10 -10,9
5 BURSA 8.066 3,89 8.103 3,35 -0,5
6 GAZİANTEP 4.877 2,35 5.808 2,40 -16,0
7 MANİSA 3.286 1,59 3.396 1,40 -3,2
8 HATAY 3.232 1,56 3.358 1,39 -3,8
9 ADANA 2.102 1,01 2.549 1,05 -17,5
10 DENİZLİ 1.771 0,85 2.176 0,90 -18,6
11 SAKARYA 1.513 0,73 1.664 0,69 -9,1
12 KAYSERİ 1.470 0,71 1.715 0,71 -14,3
13 MERSİN 1.181 0,57 1.421 0,59 -16,9
14 KONYA 1.168 0,56 1.342 0,55 -13,0
15 K.MARAŞ 1.043 0,50 1.227 0,51 -15,0
16 ZONGULDAK 994 0,48 1.254 0,52 -20,7
17 ANTALYA 977 0,47 808 0,33 20,9
18 TEKİRDAĞ 890 0,43 1.072 0,44 -17,0
19 OSMANİYE 752 0,36 909 0,38 -17,3
20 SAMSUN 718 0,34 787 0,32 -8,8
20142015
SHARE (%)CHANGE
2014/2015 (%)
(MILLION $)(MILLION $)
FIGURE.8 IMPORT DEVELOPMENTS OF THE FIRST 20 PROVINCES IN 201525
20
15
10
5
0
-10
-15
-20
-25
20,9
5,6
-0,5 -3,2 -3,8 -8,8-9,1
-10,7 -10,9 -13,4 -13-14,3 -15
-16,9 -17 -17,3 -17,5 -18,6-20,7
-16
ANTA
LYA
KOCA
ELİ
BURS
A
MAN
İSA
HATA
Y
SAM
SUN
SAKA
RYA
ANKA
RA
İZM
İR
İSTA
NBUL
KON
YA
KAYS
ERİ
K.M
ARAŞ
GAZİ
ANTE
P
MER
SİN
TEKİ
RDAĞ
OSM
ANİY
E
ADAN
A
DENİ
ZLİ
ZONG
ULDA
K
PERCENTAGE OF IMPORT INCREASE
IV.5 IMPORT ACCORDING TO COUNTRY GROUPS AND COUNTRIES IV.5.1 Import according to country groups Near and Middle East Countries lived the highest decrease in import In 2015, import of Turkey from all country groups dropped. The decrease took place in different rates according to coun-try groups. This differentiation highly resulted from the import in energy, goods and manufacturing industry products. As a mat-ter of fact, import decreased by 33,7% in near and middle east countries which exports oil and natural gas.
FIGURE.9 DISTRIBUTION OF IMPORT ACCORDING TO COUNTRY GROUPS – PERCENTAGE
EUROPEAN UNION
OTHER EUROPENORTH AFRICA
OTHER AFRICA
NORTH AMERICACENT. AMERICA AND CARIBBEANSOUTH AMERICANEAR AND MIDDLE EAST
OTHER
38
13,6
1,51
5,80,5
1,8
6,6
25,7
0,34,7
PROVINCE NO
Import prices are decreasing due to reductions in global prices In 2015, import unit prices of mineral fuels and oils showed the highest decrease (with 36,6%) due to reductions in oil prices.
Unit import prices of all other products decreased. Unit import prices of chemical industry and relevant products dropped by 12,2% while the unit import prices of mainly classified pro-cessed goods decreased by 12,7%.
SHARE (%)

88
›
4IMPORT
TABLE.18 IMPORT ACCORDING TO COUNTRY GROUPS (MILLION DOLLARS)
TABLE.19 DISTRIBUTION OF IMPORT AMONG COUNTRY GROUPS
SOURCE: TURKISH STATISTICAL INSTITUTE
COUNTRY GROUP 2013 2014 2015
TOTAL 251.661 242.177 207.203
A-EUROPEAN UNION (EU 28) 92.458 88.784 78.670
B-FREE ZONES OF TURKEY 1.268 1.261 1.227
C-OTHER COUNTRIES 157.935 152.133 127.307
1-OTHER EUROPE (EXCEPT EU) 41.319 36.367 28.110
2-NORTH AFRICA 3.508 3.436 3.007
3-OTHER AFRICA 2.523 2.502 2.093
4-NORTH AMERICA 13.953 13.835 12.057
5-CENTRAL AMERICA AND CARIBBEAN 1.362 1.124 1.040
6-SOUTH AMERICA 3.666 3.935 3.664
7-NEAR AND MIDDLE EAST 22.214 20.481 13.575
8-OTHER ASIA 54.648 56.162 53.331
9-AUSTRALIA AND NEW ZELAND 1.318 638 609
10-OTHER COUNTRIES AND REGIONS 13.424 13.653 9.821
COUNTRY GROUP 2013 2014 2015
TOTAL 100,0 100,0 100,0
A-EUROPEAN UNION (EU 28) 36,7 36,7 38,0
B-FREE ZONES OF TURKEY 0,5 0,5 0,6
C-OTHER COUNTRIES 62,8 62,8 61,4
1-OTHER EUROPE (EXCEPT EU) 16,4 15,0 13,6
2-NORTH AFRICA 1,4 1,4 1,5
3-OTHER AFRICA 1,0 1,0 1,0
4-NORTH AMERICA 5,5 5,7 5,8
5-CENTRAL AMERICA AND CARIBBEAN 0,5 0,5 0,5
6-SOUTH AMERICA 1,5 1,6 1,8
7-NEAR AND MIDDLE EAST 8,8 8,5 6,6
8-OTHER ASIA 21,7 23,2 25,7
9-AUSTRALIA AND NEW ZELAND 0,5 0,3 0,3
10-OTHER COUNTRIES AND REGIONS 5,3 5,6 4,7
TABLE.17 IMPORT INCREASE ACCORDING TO COUNTRY GROUPS (%)
SOURCE: TURKISH STATISTICAL INSTITUTE
COUNTRY GROUP 2013 2014 2015
TOTAL 6,4 -3,8 -14,5
A-EUROPEAN UNION (EU 28) 5,5 -4,0 -11,4
B-FREE ZONES OF TURKEY 21,2 -0,6 -2,7
C-OTHER COUNTRIES 6,8 -3,7 -16,3
1-OTHER EUROPE (EXCEPT EU) 11,1 -12,0 -22,7
2-NORTH AFRICA 6,0 -2,1 -12,5
3-OTHER AFRICA -3,5 -0,8 -16,3
4-NORTH AMERICA -7,5 -0,8 -12,9
5-CENTRAL AMERICA AND CARIBBEAN 27,4 -17,5 -7,5
6-SOUTH AMERICA -10,1 7,3 -6,9
7-NEAR AND MIDDLE EAST 3,8 -7,8 -33,7
8-OTHER ASIA 10,2 2,8 -5,0
9-AUSTRALIA AND NEW ZELAND 53,1 -51,6 -4,5
10-OTHER COUNTRIES AND REGIONS 6,5 1,7 -28,0
In 2015, import from the European Union (11,4%) decreased more slowly than the average decrease in import. Import from other European countries decreased by 22,7%. Import from North America countries dropped very close to the average figure by 12,9%. Asian countries experienced the lowest decrease by 5,0%.
The highest import is from European Union again In 2015, import from the European Union became 78,7 billion dol-lars based on such developments. Import from Asian countries de-creased to 53,3 billion dollars and import from other Europe including Russia dropped to 28,1 billion dollars while import from Near and Middle East fell to 13,6 billion dollars.
Share of import from European Union increased to 38% Following such developments in import, European Union countries had the highest share again in our total import with 38,0% in 2015. Share of the EU countries increased by 1,3 points in 2015. Share of the other European countries decreased to 13,6 and Russia became effective in this drop. Share of Asia countries is gradually increasing. In 2015, share of the import from Asia increased to 25,7% within our total import. Share of the import from Near and Middle East dropped to 6,6% while that of North America increased to 5,8%.
IV.5.2 Import according to Countries
In 2015, two among 20 countries from which Turkey makes the highest import changed. Greece and United Arab Emirates which were included in the first 20 in 2014
were replaced with Bulgaria and Czech Republic. Total import of Turkey decreased by 14,5% and import from the first 20 countries decreased by 12,8 and amount-ed to 151,0 billion dollars in 2015. Import from all of the 20 countries where Turkey imports most dropped in 2015.
SOURCE: TURKISH STATISTICAL INSTITUTE

89ECONOMY AND FOREIGN TRADE REPORT 2016
TABLE.20 IMPORT ACCORDING TO COUNTRIES
SOURCE: TURKISH STATISTICAL INSTITUTE
1 China 24 685 24 918 24.864 9,8 10,3 12,0 -0,2
2 Germany 24 182 22 369 21.352 9,6 9,2 10,3 -4,5
3 Russia 25 064 25 288 20.400 10,0 10,4 9,8 -19,3
4 USA 12 596 12 727 11.127 5,0 5,3 5,4 -12,6
5 Italy 12 884 12 055 10.640 5,1 5,0 5,1 -11,7
6 France 8 079 8 122 7.583 3,2 3,4 3,7 -6,6
7 South Korea 6 088 7 548 7.057 2,4 3,1 3,4 -6,5
8 Iran 10 383 9 833 6.096 4,1 4,1 2,9 -38,0
9 India 6 367 6 898 5.613 2,5 2,8 2,7 -18,6
10 Spain 6 417 6 075 5.588 2,6 2,5 2,7 -8,0
11 England 6 281 5 932 5.541 2,5 2,4 2,7 -6,6
12 Ukraine 4 516 4 242 3.448 1,8 1,8 1,7 -18,7
13 Belgium 3 843 3 863 3.146 1,5 1,6 1,5 -18,6
14 Japan 3 453 3 199 3.140 1,4 1,3 1,5 -1,9
15 Poland 3 184 3 082 2.977 1,3 1,3 1,4 -3,4
16 Netherlands 3 363 3 517 2.914 1,3 1,5 1,4 -17,1
17 Romania 3 592 3 363 2.600 1,4 1,4 1,3 -22,7
18 Switzerland 9 645 4 821 2.445 3,8 2,0 1,2 -49,3
19 Bulgaria 2 760 2 846 2.254 1,1 1,2 1,1 -20,8
20 Czech Republic 2 627 2 420 2 218 1,0 1,0 1,1 -8,3
Others 71 642 69 050 56 191 28,5 28,5 27,1 -18,6
Total 251.661 242.177 207.203 100,0 100,0 100,0 -14,5
IMPORT (MILLION DOLLARS) IMPORT SHARE (%) 2014/2015
Change (%)2013 20132014 20142015 2015COUNTRIES NO
IV.6 IMPORT AND EXPORT CONCENTRATION ACCORDING TO SCALES OF FIRMS Import is mostly performed by the large-scale firms Import is mostly performed by the large-scale firms. Share of the firms with 250 and more employees was 60,1% within total import in 2013 and it was increased to 62,2% in 2014. Share of the medium-scale firms with 50-249 employees increased to 18,4% from 17,9%.
TABLE.2 IMPORT SHARES ACCORDING TO SCALES OF THE FIRMS
SOURCE: TURKISH STATISTICAL INSTITUTE
The sharpest decrease (49,3%) in import took place from Switzerland due to decrease in gold imports. Import from Iran and Russian decreased respectively by 38,0% and
19,3% due to reduction in oil and natural gas prices. China became the country with the lowest decrease in import (0,5%).
NUMBER OF EMPLOYEES
IMPORT (MILLION DOLLARS)
SHARE (%)
IMPORT (MILLION DOLLARS)
SHARE (%)
TOTAL 251.358 100,0 241.406 100,0
1-9 14.292 5,7 15.038 6,2
10-49 40.849 16,3 31.773 13,2
50-249 45.035 17,9 44.400 18,4
250+ 151.001 60,1 150.116 62,2
2013 2014

90
›
4IMPORT
Concentration rate of the first 100 firms in import is changing Share of the first 1000 firms in total import was 84,1% in 2010 while it increased to 83,4% in 2014. Concentration in import remained almost the same within the last five years for the first 1000 firms. However, concentration increases when the number of entrepreneurs is reduced. From 2010 to 2014, concentration increased by 2,5 points for the first 5 importer firms; 2,0 points for the first 10 firms; 1,3 points for the first 20 importing firms and 0,1 points for the first 50 importer firms.
SOURCE: TURKISH STATISTICAL INSTITUTE
TABLO. 22 CONCENTRATION IN IMPORT
All entrepreneurs 241.406 100,0 184.977 100,0
The first 5 entrepreneurs 59.223 24,5 40.677 22,0
The first 10 entrepreneurs 73.596 30,5 52.764 28,5
The first 20 entrepreneurs 92.258 38,2 68.295 36,9
The first 50 entrepreneurs 117.068 48,5 89.442 48,4
The first 100 entrepreneurs 137.322 56,9 105.892 57,2
The first 500 entrepreneurs 183.185 75,9 141.587 76,5
The first 1000 entrepreneurs 201.364 83,4 155.527 84,1
Sectoral import developments of Turkey are elaborated and evaluated herein. While evaluating the sectoral import developments, sectors are classified according to Harmonized System classification, which is an international practice, as is the case in the evaluation of exports.
In the harmonized system, the section classification groups the two-digit main sections and 4-digit detailed sections. Within this framework, developments in sectoral import are evaluated for the main section groups.
IV.7 IMPORT ACCORDING TO MAIN AND SUB-SECTION GROUPS
IV.7.1 Import according to main sections Share of the first 20 sectors in total import is 82% According to the classification, import decreased by 15,1% in 2014 in the first 20 sectors and amounted to 169,9 billion dollars. Thus, share of the first 20 sectors in total import became 82% in 2015 while it was 82,7% in 2014.
Reduction in oil prices resulted in decrease of import in 2015 In 2014, mineral fuels and oils, machinery and electrical equipment and devices were the first leading import groups. This ordering did not change in 2015 but import of these three groups, especially mineral fuels decreased considerably.
Reduction in crude oil prices affected so many sections such as mineral fuels and oils, plastic, various chemicals, synthetic and artificial filaments directly and many other sections indirectly and caused a big decrease in import. Import of mineral fuels and oils dropped by 31,1%, plastic products by 13,3%, various chemical products by 10% and synthetic filaments by 11%.
Decrease in gold import continued In 2014, import of precious and semi-precious stones decreased by 50% and dropped from 16,23 billion dollars to 8,12 billion dollars. In 2015, import decreased again sharply by 48,5% and reduced to 4,18 billion dollars.
Mineral fuels and oils Machinery
Electrical equipment and devices Motor land vehicles
Iron and steelPlastics and plastic goods
Organic chemical productsSensitive optical, measurement and weighing devices
Pharmaceuticals Precious stones
Aircraft and spacecrafts Aluminum and aluminum products
Copper and copper productsIron and steel products
Paper, carton and relevant goodsRubber and rubber products
Cotton, cotton thread and cotton textilesSynthetic and artificial filaments
Various chemical productsSynthetic and artificial discontinuous fibers
37,84328,104
17,63917,544
14,77512,268
4,7164,621
4,2964,184
3,8303,334
2,9862,7422,684
2,5252,2652,0972,049
1,966
FIGURE.10 THE FIRST 20 GROUPS WITH THE HIGHEST IMPORT
IMPORT –MILLION DOLLAR
2014 2010
SHARE
(%) MILLIONDOLLAR
MILLIONDOLLAR
SHARE
(%)

91ECONOMY AND FOREIGN TRADE REPORT 2016
IV.7.2 Import according to sub-sections 1-MINERAL FUELS AND MINERAL OILS
Record decrease in crude oil prices and unprecedented reduction in import Import of Mineral Fuels and Oils decreased by 2,6% in 2014 and amounted to 54,9 billion dollars. In 2015, it decreased again by 31,1% and dropped to 37,8 billion dollars. This reduction was con-siderably affected by the reduction in crude oil prices down to 25 dollars in December 2015. Oil prices decreased almost every month from the beginning to the end of 2015 saw the lowest level of the last 15-20 years and consequently import of Mineral Fuels and Oils decreased by 31% and contributed to reduction of current deficit.Among the sub-sections, since information of crude oil no 2709 was included in 2799, crude oil and natural gas cannot be separa-ted completely. However, import of oil and natural gas decreased by 32,6% in 2015 and amounted to 23,4 billion dollars. Since TUIK (Turkish Statistical Institute) has not published any quantitative in-formation, we could not include unit prices of these products in our table.
SOURCE: TURKISH STATISTICAL INSTITUTE
TABLE.23 DISTRIBUTION OF IMPORT ACCORDING TO MAIN SECTIONS
Surprise increases in imports of Motor Land Vehicles and Iron Steel Goods Increases in the import of cars, motorcycles and tractors increased the import of motor land vehicles by 11,5% and its share in total import rose from 6,5% to 8,5%. Import of iron steel goods increased by 4,7% in 2015 due to extreme reduction in unit import prices.
Import decreased in 17 of 20 most imported sections In 2015, Import decreased in 17 of 20 most imported sections. Precious Stones (gold) became the section with the highest decrease. Import of gold and jewel decreased from 16 billion dollars to 4 billion dollar within 2 years. The section with the second highest decrease among the relevant 20 sections was the Mineral Fuels and Oils due to great reduction in crude oil prices. Share of both sections in total import decreased as well. Other sections with decreasing import were Cotton, Cotton Yarn and Cotton Textiles, Organic Chemical Products, Copper and Copper Products, Iron-Steel and Paper-Carton. Import dropped more than 15% in all these sections. The section with the most increased import became Aircrafts and Spacecrafts, whose import rose also in 2014. Import of Aircrafts and Spacecrafts increased 2 times within 2 years. Import of Motor Land Vehicles increased by 11,5% and that of Iron-Steel Goods increased by 4,7%.
FIGURE.11 SUB-SECTIONS WITH THE HIGHEST IMPORT 2015
25,00020,00015,00010,0005,000
0Oil and natural gas Petroleum Solid fuels from
hard coals Petroleum gases
23,425IMPORT –MILLION DOLLAR
9,024
2,958 1,455
SHARE (%)
27 Mineral fuels and oils 54.889 22,67 37.843 18,26 -31,1
84 Machinery 28.104 11,60 25.550 12,33 -9,1
85Electrical equipment and devices
17.949 7,41 17.639 8,51 -1,7
87 Motor land vehicles 15.736 6,50 17.544 8,47 11,5
72 Iron and steel 17.576 7,26 14.775 7,13 -15,9
39 Plastics and plastic goods 14.151 5,84 12.268 5,92 -13,3
29 Organic chemical products 5.833 2,41 4.716 2,28 -19,1
90
Sensitive optical, measurement and weighing devices
4.878 2,01 4.621 2,23 -5,3
30 Pharmaceuticals 4.428 1,83 4.296 2,07 -3
71 Precious stones 8.121 3,35 4.184 2,02 -48,5
88 Aircraft and spacecrafts 3.022 1,25 3.830 1,85 26,7
76 Mineral fuels and oils 3.500 1,45 3.334 1,61 -4,7
74Aluminum and aluminum products
3.570 1,47 2.986 1,44 -16,4
73 Copper and copper products 2.618 1,08 2.742 1,32 4,7
48 Iron and steel products 3.171 1,31 2.684 1,30 -15,4
40 Rubber and rubber products 2.856 1,18 2.525 1,22 -11,6
52Cotton, cotton yarn and cotton textiles
3.022 1,25 2.265 1,09 -25
54Cotton, cotton yarn and cotton textiles
2.361 0,98 2.097 1,01 -11,2
38 Various chemical products 2.276 0,94 2.049 0,99 -10
55 Synthetic and artificial filaments 2.164 0,89 1.966 0,95 -9,1
Total of the first 20 sections 200.225 82,68 169.914 82 -15,1
2014 2015
SHARE (%)
2014/2015 CHANGE
(%) MILLION DOLLAR
MILLION DOLLARSECTIONSNO SHARE (%)

92
›
4IMPORT
2-MACHINERY
Slowdown in investments decreased the import of machinery Import of machinery, which is the leading investment goods, continued decreasing in 2015, as is the case in 2014 and decreased by 9,1% and amounted to 25,55 billion dollars. Turkey makes export of machinery, among sub-sections,
in very high amounts. Reduction took place in 7 of the 10 product groups which are imported mostly. Sub-section with the highest increase became centrifuges. In 2015, import of centrifuges increased by 5,6% and rose to 1 billion dollars. Import of spare parts of motors increased by 4% as well. The sub-section with the highest decrease in import became automated data processing machines (computers)
CODE PRODUCT2013 (Million
Dollar)
2014 (Million
Dollar)2015 (Million Dollar) 14/15 Change (%) 2014 Unit Price ($/kg) 2015 Unit Price ($/kg)
2799 Oil and natural gas 35.680 34.766 23.425 -32,6
2710 Petroleum 15.439 15.369 9.024 -41,3 0,91 0,54
2701 Solid fuels obtained from hard coal 900 826 2.958 257,9 0,03 0,09
2711Hydrocarbons with petroleum gases and other gases
2.734 2.677 1.455 -45,7 0,81 0,42
2713Other residuals of petroleum coke and petroleum
569 587 396 -32,6 0,13 0,09
2716 Electrical energy 334 439 325 -25,9
TABLE.24 SUB-SECTIONS IN IMPORT OF MINERAL FUEL AND OIL
SOURCE: TURKISH STATISTICAL INSTITUTE
SOURCE: TURKISH STATISTICAL INSTITUTE
CODE PRODUCT 2013 (Million dollars) 2014 (Million dollars) 2015 (Million dollars) 14/15 Change (%) 2014 Unit price ($/kg) 2015 Unit price ($/kg)
8408 Motors with piston 2.276 2.278 2.265 -0,6 16,48 14
8471Automated data pro-cessing machines
2.651 2.716 2.200 -19 130,55 130,89
8479Other special machinery and mechanical devices
1.072 1.151 1.059 -8 24,02 12,99
8421 Centrifuges 1.107 959 1.012 5,6 18,72 14,80
8481 Taps and valves 1.106 1.057 1.005 -4,8 20,85 19,69
8414Air pumps and compres-sors
1.261 1.166 999 -14,3 8,96 7,72
8429 Heavy equipment 1.268 1.028 996 -3,2 6,94 6,41
8413 Pumps for liquids 969 881 852 -3,4 16,15 14,34
8409 Parts of motors 753 817 850 4,1 13,49 11,18
8411Turbojets and other gas turbines
577 773 786 1,7 126,04 168,81
TABLE.25 SECTIONS IN IMPORT OF MACHINERY
The sub-section with the second highest import is petroleum. Import of petroleum decreased by 41,3% in 2015 and dropped to 9 billion dollars from 15,3 billion dollars. While import of oil products decreased, import of hard coal increased by 257,9%
and rose to 2,96 billion dollars from 826 million dollars. Import of petroleum gases decreased by 54,7% and dropped to 1,45 billion dollars from 2,67 billion dollars. Import of electrical energy dropped by 25,9%.
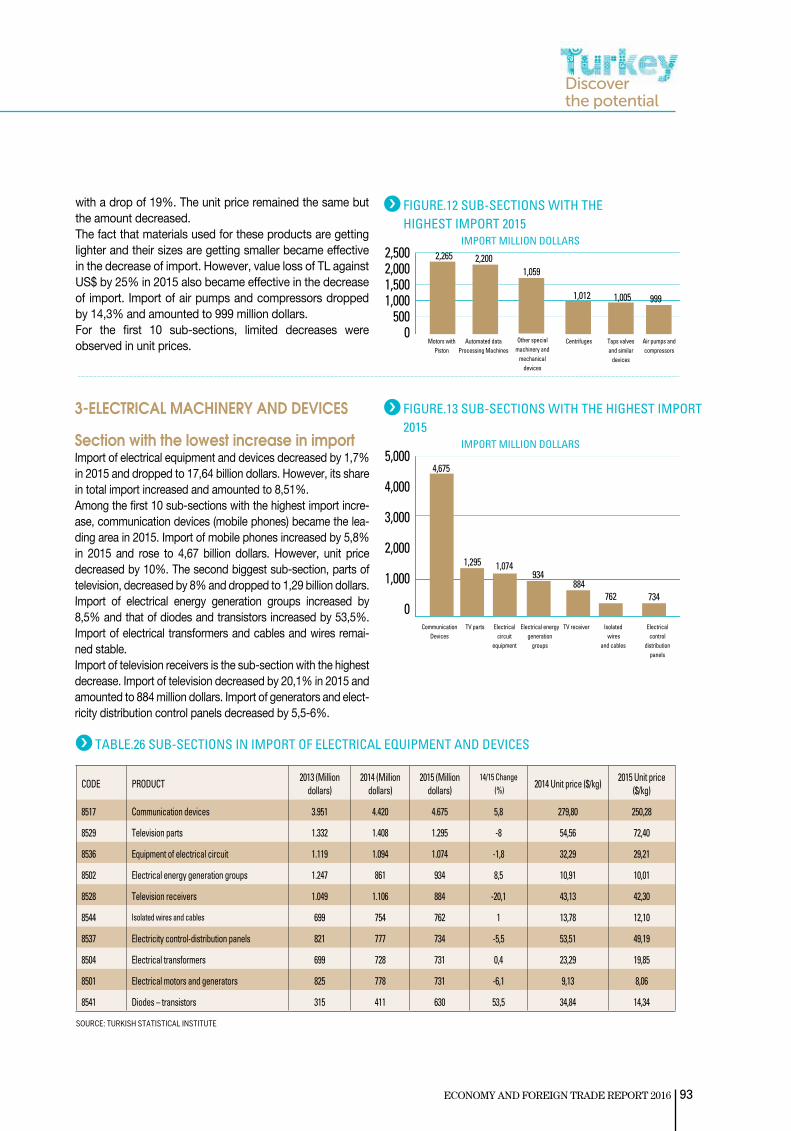
93ECONOMY AND FOREIGN TRADE REPORT 2016
with a drop of 19%. The unit price remained the same but the amount decreased. The fact that materials used for these products are getting lighter and their sizes are getting smaller became effective in the decrease of import. However, value loss of TL against US$ by 25% in 2015 also became effective in the decrease of import. Import of air pumps and compressors dropped by 14,3% and amounted to 999 million dollars.For the first 10 sub-sections, limited decreases were observed in unit prices.
3-ELECTRICAL MACHINERY AND DEVICES
Section with the lowest increase in import Import of electrical equipment and devices decreased by 1,7% in 2015 and dropped to 17,64 billion dollars. However, its share in total import increased and amounted to 8,51%. Among the first 10 sub-sections with the highest import incre-ase, communication devices (mobile phones) became the lea-ding area in 2015. Import of mobile phones increased by 5,8% in 2015 and rose to 4,67 billion dollars. However, unit price decreased by 10%. The second biggest sub-section, parts of television, decreased by 8% and dropped to 1,29 billion dollars.Import of electrical energy generation groups increased by 8,5% and that of diodes and transistors increased by 53,5%. Import of electrical transformers and cables and wires remai-ned stable. Import of television receivers is the sub-section with the highest decrease. Import of television decreased by 20,1% in 2015 and amounted to 884 million dollars. Import of generators and elect-ricity distribution control panels decreased by 5,5-6%.
FIGURE.13 SUB-SECTIONS WITH THE HIGHEST IMPORT 2015
5,000
4,000
3,000
2,000
1,000
0Communication
Devices TV parts TV receiver Electrical
circuitequipment
Electrical energy generation
groups
Isolated wires
and cables
Electricalcontrol
distributionpanels
4,675
1,295 1,074934
884762 734
IMPORT MILLION DOLLARS
FIGURE.12 SUB-SECTIONS WITH THE HIGHEST IMPORT 2015
2,5002,0001,5001,000
5000
Automated dataProcessing Machines
Motors with Piston
Air pumps andcompressors
Other special machinery and
mechanicaldevices
Taps valves and similar
devices
Centrifuges
2,265
1,0592,200
IMPORT MILLION DOLLARS
SOURCE: TURKISH STATISTICAL INSTITUTE
TABLE.26 SUB-SECTIONS IN IMPORT OF ELECTRICAL EQUIPMENT AND DEVICES
CODE PRODUCT 2013 (Million
dollars)2014 (Million
dollars)2015 (Million
dollars)14/15 Change
(%) 2014 Unit price ($/kg)
2015 Unit price ($/kg)
8517 Communication devices 3.951 4.420 4.675 5,8 279,80 250,28
8529 Television parts 1.332 1.408 1.295 -8 54,56 72,40
8536 Equipment of electrical circuit 1.119 1.094 1.074 -1,8 32,29 29,21
8502 Electrical energy generation groups 1.247 861 934 8,5 10,91 10,01
8528 Television receivers 1.049 1.106 884 -20,1 43,13 42,30
8544 Isolated wires and cables 699 754 762 1 13,78 12,10
8537 Electricity control-distribution panels 821 777 734 -5,5 53,51 49,19
8504 Electrical transformers 699 728 731 0,4 23,29 19,85
8501 Electrical motors and generators 825 778 731 -6,1 9,13 8,06
8541 Diodes – transistors 315 411 630 53,5 34,84 14,34
1,012 1,005 999

94
›
4IMPORT
SOURCE: TURKISH STATISTICAL INSTITUTE
TABLE.27 SUB-SECTIONS IN IMPORT OF MOTOR LAND VEHICLES
CODE PRODUCT 2013 (Million dollars) 2014 (Million dollars) 2015 (Million dollars) 14/15 Change (%) 2014 Unit price ($/kg)2015 Unit price
($/kg)
8703 Private cars 9.130 7.721 9.228 19,5 12,50 11,05
8708Parts for road vehicles
4.894 4.951 4.966 0,3 10,06 8,85
8704Motor vehicles for transportation of goods
1.089 1.133 1.323 16,8 9,71 8,36
8701 Tractors 646 875 1.039 18,8 9,53 8,13
8702Motor vehicles for 10 or more people
249 269 253 -5,9 12,20 10,25
8711 Motorcycles 151 178 204 14,6 10,32 12,60
8716Trailers and semi-trailers
206 197 162 -17,9 5,23 4,31
8714 8711-8713 Parts 131 141 149 5,6 5,06 5,02
4-MOTOR LAND VEHICLES
Record increase in import of private cars In 2015, import of motor land vehicles increased by 11,5% contrary to 2014 and rose to 17,54 billion dollars. Its share in total import increased to 8,47% from 6,5%. For the increase in import of motor land vehicles, high import of private cars became determinant. Import of private cars decreased by 15,4% in 2014 while it increased by 19,5% in 2015. Increase in import amounted to 1,5 billion dollars despite the drop of 10% in the unit prices and import of private cars rose to 9,2 billion dollars. Other sub-sections with the increased import are tractors by 18,8%, trucks and pickup trucks by 16,8% and motorcycles by 14,6%.
FIGURE.14 SUB-SECTIONS WITH THE HIGHEST IMPORT 2015
10,0009,0008,0007,0006,0005,0004,0003,0002,0001,000
0 Private cars Parts for road vehicles Motor vehicles fortransportation of goods
Tractors
IMPORT MILLION DOLLARS 9,228
4,966
1,323 1,039
Import of parts, which are generally considered as intermediate goods, increased by 5,6%. Sub-sections with the decreased import are trailers and minibuses-midi buses. Except these two, unit prices of all sub-sections decreased by 10% on average.

95ECONOMY AND FOREIGN TRADE REPORT 2016
5-IRON AND STEEL
Unit Prices fell and import decreased Iron-steel prices, which we previously mentioned in ex-port chapter, and dominance of China over the global production and foreign trade increased the import of iron-steel on quantitative base. Import of steel which was 13,8 million ton in 2014 increased up to 19 million ton in 2015. Import of iron-steel in 2015 is 36,4 million ton in total under the chapter no 72. On value base, im-port decreased by 15,9% in 2015 and dropped to 14,77 billion dollars. Iron-steel prices dropped considerably worldwide and unit import prices of iron-steel products of Turkey decreased by around 25%. Among the 10 sub-sections with the highest import, flat rolled products with over 600 mm width came to the fore with an increase of 72,4%. While import was 764 million dollars in 2014, it increased to 1,3 billion dollars in 2015. Another import increase took place in semi-finished products made or iron and unalloyed steel. Im-port increased by 14% and amounted to 2,87 billion dollars. The highest decrease took place in ingot irons among
SOURCE: TURKISH STATISTICAL INSTITUTE
KAYNAK: TÜRKİYE İSTATİSTİK KURUMU
TABLE.28 SUB-SECTIONS IN IMPORT OF IRON-STEEL
CODE PRODUCT 2013 (Million
dollars)2014 (Million
dollars)2015 (Million
dollars)14/15 Change (%) 2014 Unit price ($/kg)
2015 Unit price ($/kg)
7204 Ingot iron 7.511 7.150 4.288 -40 0,37 0,26
7207Semi-finished products from iron and
unalloyed steel 2.881 2.515 2.869 14 0,53 0,37
7208Flat-rolled products from iron or unalloyed
steel 2.460 1.997 1.824 -8,7 0,59 0,44
7225 Flat-rolled products (600 mm or wider) 563 764 1.318 72,4 0,86 0,67
7219 Flat-rolled products from stainless steel 1.000 1.044 932 -10,7 2,25 1,96
7210 Flat-rolled products (600 mm or wider) 837 893 781 -12,5 0,89 0,73
7202 Ferro alliage 551 572 455 -20,4 1,31 1,14
7209Flat-rolled products (width > 600 mm, cold-
rolled, uncovered)500 495 365 -26,1 0,68 0,54
7201 Cast iron and mirror iron 414 392 343 -12,4 0,43 0,29
7216 Profiles from iron or unalloyed steel 376 253 256 1,4 0,73 0,60
FIGURE.15 SUB-SECTIONS WITH THE HIGHEST IMPORT 2015
5,000
4,000
3,000
2,000
1,000
0IngotIron
Semi-finished products from
Iron andunalloyed steel
Flat rolledproducts
from iron oror unalloyed
steel
Flat-rolledproducts
fromstainless
steel
Flat-rolledproducts600mm
or wider
Flat-rolledproducts
600 mm or wider
Ferro alliage
IMPORT MILLION DOLLARS
4,288
2,869
1,318 932
455
the imported sub-sections. Import of ingot iron de-creased by 40% and dropped to 4,29 billion dollars. The second biggest decrease took place in cold-rolled uncovered flat mill products with over 600 mm width following a decrease of 26,1%.
1,824
781

96
›
4IMPORT
7-ORGANIC CHEMICAL PRODUCTS
Import of foreign-dependent organic chemical decreased Import of organic chemicals increased by 9,8% in 2014 and amounted to 5,83 billion dollars while it decreased by 19,1 in 2015 and dropped to 4,71 billion dollars. Even though Turkey is considerably foreign-dependent about organic chemical prod-ucts, decreases in unit prices reduced the import on value basis. Among the sub-sections, the highest decrease took place in polycarboxylic acid and its derivatives and import decreased by 27,9% and dropped to 538
FIGURE.17 SUB-SECTIONS WITH THE HIGHEST IMPORT 2015
800700600500400300200100
0Acyclic alcohols
and its derivatives Polycarboxylic acids
and itsderivatives
Cyclichydrocarbons
Only nitrousheterocycliccomponents
Unsaturatedacyclic and
cyclic monocarboxylicacids and derivatives
IMPORT MILLION DOLLARS
674
538486
383300
TABLE.29 SUB-SECTIONS IN IMPORT OF PLASTICS AND PLASTIC PRODUCTS
CODE PRODUCT 2013 (Million
dollars)2014 (Million
dollars)2015 (Million
dollars)14/15 Change (%) 2014 Unit price ($/kg)
2015 Unit price ($/kg)
3902Propylene and other olefin polymer
2.974 3.314 2.650 -20,1 1,75 1,36
3901 Ethylene polymer 2.557 2.618 2.406 -8,1 1,75 1,50
3907 Polyacetals and other polyethers 1.438 1.280 1.174 -8,3 2,35 1,87
3920Other plates, sheets and strips made of plastics
937 1.004 922 -8,2 3,98 3,60
3904Vinyl chloride or polymers of other halogenated olefins
1.117 1.022 816 -20,1 1,15 0,98
3903 Styrene polymers 1.075 974 795 -18,3 2,04 1,55
3926 Other goods from plastics 642 703 658 -6,4 10,05 9,66
3909 Amino resins, phenolic resins 554 534 447 -16,3 2,60 2,06
3906 Acrylic polymers 447 452 370 -18 2,33 1,87
3919Self-adhesive plates, sheets, bands, strips, films, folios
323 339 323 -4,8 6,11 5,62
SOURCE: TURKISH STATISTICAL INSTITUTE
6-PLASTICS AND PLASTIC PRODUCTS
Record reduction in oil prices decreased the import of plastics Import of plastics and plastic products decreased by 13,3% in 2015 and dropped to 12,27 billion dollars.Severe reduction in oil prices in 2015 dropped the unit import prices of plastics raw materials. Unit prices of all sub-section products decreased by 5-20%. All of the sub-section imports were decreased on value basis. Import of propylene and other olefin polymer, which are the most imported materials, decreased by 20,1% and dropped to 2,65 billion dollars from 3,3 billion dollars. Import of eth-ylene polymer, which is another raw material, decreased by 8,1%. Polyacetals and polyethers, the third biggest sub-sec-tion, decreased by 8,3%. Decrease in vinyl chloride, styrene
3,0002,5002,0001,5001,000
5000
Propylene and other olefin
polymer
Ethylenepolymer
Polyacetals,other polyethers
Vinyl chlorideor polymers
of other halogenated
plefins
Other plates, sheets,
strips made of plastics
IMPORT MILLION DOLLARS 2,650
1,174 922 816
2,406
polymers and amino resin varies between 20 and 16%.
FIGURE.16 SUB-SECTIONS WITH THE HIGHEST IMPORT 2015

97ECONOMY AND FOREIGN TRADE REPORT 2016
8-SENSITIVE OPTIC MEASURING MEDICAL DEVICES
Import of sensitive measuring-optic and medical devices decreased below the average Import of sensitive measuring-optic and medical devices, which are critically important and technologically most advanced products, increased by 7% in 2014 and rose to 4,88 billion dollars. In 2015, its import decreased by 5,3% and became the product group with the least decrease
SOURCE: TURKISH STATISTICAL INSTITUTE
SOURCE: TURKISH STATISTICAL INSTITUTE
TABLE.30 SUB-SECTIONS IN IMPORT OF ORGANIC CHEMICAL PRODUCTS
TABLE.31 SUB-SECTIONS IN IMPORT OF SENSITIVE OPTIC MEASURING MEDICAL DEVICES
CODE PRODUCT 2013 (Million
dollars)2014 (Million
dollars)2015 (Million
dollars)14/15 Change (%) 2014 Unit price ($/kg)
2015 Unit price ($/kg)
2905 Acyclic alcohols and its derivatives 782 850 674 -20,7 0,87 0,68
2917Polycarboxylic acids and its derivatives
621 746 538 -27,9 1,21 0,85
2902 Cyclic hydrocarbons 635 579 486 -16 1,53 1,08
2933 Only nitrous heterocyclic components 356 426 383 -10,1 4,97 4,63
2916Unsaturated acyclic and cyclic mono-carboxylic acids and derivatives
340 356 300 -15,6 2,12 1,66
2915Saturated acyclic monocarboxylic acids
295 347 292 -15,8 1,21 1,02
2941 Antibiotics 196 179 188 5,2 92,87 95,61
million dollars from 746 million dollars. Unit import price of this product decreased by 29% as well. The sub-section with the second highest decrease was acyclic alco-hols and derivatives, which are the most imported goods. Import
dropped by 20,7% and amounted to 674 million dollars.Unit import price of acyclic alcohol decreased by 21,8%. De-creases in value of import and reductions in unit import prices are very parallel.
FIGURE.18 SUB-SECTIONS WITH THE HIGHEST IMPORT 2015IMPORT MILLION DOLLARS 1,000
900800700600500400300200100
0
925
564
327
Medical equipmentand devices
Automated control and setting instruments
Orthopedicdevices
Other measuring or examination
instrumentsand devices
Liquid-crystal equipment lasers
other optic devices
359424
CODE PRODUCT 2013 (Million
dollars)2014 (Million
dollars)2015 (Million
dollars)14/15 Change (%) 2014 Unit price ($/kg)
2015 Unit price ($/kg)
9018 Medical equipment and devices 993 1.113 925 -16,8 46,94 40,71
9032 Automated control and setting devices 558 586 564 -3,9 30,33 27,14
9021 Orthopedic devices 484 493 424 -14 554,06 495,85
9031Other measuring or examination instru-ments and devices
340 370 359 -2,8 65,75 67,36
9013Liquid-crystal equipment, lasers, other optic devices
266 290 327 12,7 109,40 101,50
9027Physical-chemical analysis instruments and devices
336 335 308 -7,8 128,39 101,91
9022 X-alpha, beta or gamma beam devices 241 250 270 8,1 105,70 98,66
9026Devices measuring flow, level and pres-sure of liquids and gases
208 212 226 7 76,83 71,92
9001 Optic fibers, bundles and cables 137 187 170 -9,2 13,45 11,41
9004 Glasses and etc. 140 156 153 -1,6 90,67 91,44

98
›
4IMPORT
SOURCE: TURKISH STATISTICAL INSTITUTE
TABLE.32 SUB-SECTIONS IN IMPORT OF PHARMACEUTICAL PRODUCTS
CODE PRODUCT 2013 (Million
dollars)2014 (Million
dollars)2015 (Million
dollars)14/15 Change (%) 2014 Unit price ($/kg)
2015 Unit price ($/kg)
3004 Medicines 2.823 2.875 2.643 -8,1 76,45 62,98
3002 Human blood, animal blood, serum, vaccination 1.052 1.268 1.384 9,2 355,05 471,04
3006 Other pharmaceutical products 126 139 120 -13,7 84,28 72,93
3003 Mixed drugs to be used for treatment or protection 99 97 103 5,8 116,76 105,37
9-PHARMACEUTICAL PRODUCTS
Increase in the import of pharmaceutical products stopped Import of pharmaceutical products decreased by 3% in 2015 and dropped to 4,29 billion dollars. Turkey is still foreign-dependent in certain pharmaceutical products. Therefore, import of pharmaceutical products was in-creasing until 2014 but in 2015, this situation reversed a bit. The main reason of this is the decrease of 17,6% in the unit prices of medicines, the most imported sub-section, in 2015. The other sub-section with the second highest import rate is human blood, serum and vaccines and their unit import price increased by 32,6% and im-port rose by 9,2% and amounted to 1,38 billion dollars.
on value basis.Import decreased to 4,6 billion dollars in 2015. Concerning the import of sub-sections, import of medical devices and instruments, which are the most imported products, decreased by 16,8% and dropped to 925
million dollars. Import of orthopedic devices, another important equipment of health sector, decreased by 14%. Sub-sections whose import increased are liquid-crystal equipment, lasers and x-ray devices. Unit import prices of all sub-section products either remained on the same level or decreased a bit.
FIGURE.19 SUB-SECTIONS WITH THE HIGHEST IMPORT 2015
IMPORT MILLION DOLLARS
3,0002,5002,0001,5001,000
5000
2,643
1,384
120
Medicines Human blood, animal blood, serum vaccination
Other pharmaceuticalproducts
FIGURE.20 SUB-SECTIONS WITH THE HIGHEST IMPORT 2015
IMPORT MILLION DOLLARS
10-PRECIOUS AND SEMI-PRECIOUS STONES
Import of gold and jewels continued decreasingGold prices were very stable in 2015 and fluctuated less than previous years. Prices of silver and many other precious stones were parallel as well. In 2012, the import was 8,64 billion dollars but it increased to 16,23 billion dollars in 2013 and then decreased to 8,12 billion dollars in 2014 and to 4,18 billion dollars in 2015 with a drop of 48,5%. Concerning the sub-sections, import of gold decreased by 51,8% and dropped to 3,4 billion dollars. Import of jewels decreased by 37,9% and that of silver and imitation jewels decreased by 7,5%.
4,0003,5003,0002,5002,0001,5001,000
5000
3,426
Gold Goods of jewelers
Silver Imitation jewelergoods
409 162 101

99ECONOMY AND FOREIGN TRADE REPORT 2016
12-ALUMINUM AND ALUMINUM WARE
Aluminum Import Decreased below AverageAluminum and aluminum ware import rank the first in product groups with the least decrease in import. Import dropped limitedly by %4,7 and was reduced to 3,33 billion dollars. %6,6 decrease in raw aluminum import was determinant in decrease of import. While 2,49 billion dollars’ worth raw aluminum was imported in 2014, this amount was lowered to 2,33 billion dollars in 2015. Aluminum plates, sheets, sheet tapes, wires and sticks import increased at the least.
FIGURE.22 SUB-SECTIONS IMPORTED MOST 2015
IMPORT MILLION DOLLAR
2,500
2,000
1,500
1,000
500
0
2,327
417155
Rough aluminum Aluminum sheets, plates, bands (with more than 0,2 mm thickness)
Aluminum leafs and bands (0,2≥ thickness)
IMPORT MILLION DOLLARS
SOURCE: TURKISH STATISTICAL INSTITUTION
TABLE.33 SUB-SECTIONS IN GEM AND METAL IMPORT
CODE PRODUCT2013 (Million
Dollars)2014 (Million
Dollars)2015 (Million
Dollars)14/15 Change (%) 2014 Unit Price ($/kg)
2015 Unit Price ($/kg)
7108 Gold 15.127 7.107 3.426 -51,8 37.033 32.670
7113 Jeweler Ware and Accessories 725 659 409 -37,9 8.264 5.358
7106 Silver 203 175 162 -7,4 551,4 488,3
7117 Imitation Jeweler Ware 104 109 101 -7,5 55,6 60,6
IMPORT MILLION DOLLARS
SOURCE: TURKISH STATISTICAL INSTITUTION
TABLE.34 SUB-SECTIONS IN AIR AND SPACECRAFT IMPORT
CODE PRODUCT2013 (Million
Dollars)2014 (Million
Dollars)2015 (Million
Dollars)14/15 Change (%) 2014 Unit Price ($/kg)
2015 Unit Price ($/kg)
8802 Air and spacecraft 1.960 2.677 3.442 28,6 978,4 927,1
8803 Component and parts of air and spacecraft 349 313 351 12,2 563,7 493,9
11-AVIATION AND SPACECRAFT
Air and Spacecraft Import in IncreaseImport of air and spacecraft and their components and parts increased in 2015 by %26,7 and rose from 3 billion dollars to 3,8 billion dollars. Airplane and helicopter import moved up from 2,68 billion dollars to 3,44 billion dollars and import of their components and parts increased by %12,2
FIGURE.21 SUB-SECTIONS IMPORTED MOST 2015
IMPORT MILLION DOLLARS4,0003,5003,0002,5002,0001,5001,000
5000
3,442
351
Air and spacecraft Components and parts of air and space crafts

100
›
4IMPORT
14- IRON AND STEEL WARE
Iron and Steel Ware was among a few number of Sub-Sections with Increased ImportWhile iron and steel ware import decreased in 2014 by %5,1, it increased by %4,7 in 2015. Decrease of iron and steel raw material prices created a major downward effect on iron and steel ware prices. Competition among countries exporting such products in Global markets moved to an advanced stage. China chose to compensate its problem of idle capac-ity in iron and steel sector by price decreases and it was fol-lowed by many producer countries. Therefore, iron and steel ware import increased in Turkey as well. Furthermore, by ap-plying protection measures and compensatory taxes, many countries put Global iron and steel commerce into trouble.
FIGURE 24. SUB-SECTIONS IMPORTED THE MOST 2015
IMPORT MILLION DOLLAR
700600500400300200100
0
664
306311 291213
187
Screws, bolts, nuts t hick and thin pipes
and hollow profiles
Iron or steel ware
Building and building
components
Other thinand thickpipes and
hollowprofiles
Pipe fittings
SOURCE: TURKISH STATISTICAL INSTITUTION
SOURCE: TURKISH STATISTICAL INSTITUTION
TABLE.35 SUB-SECTIONS IN ALUMINUM AND ALUMINUM WARE IMPORT
CODE PRODUCT2013 (Million
Dollars)2014 (Million
Dollars)2015 (Million
Dollars)14/15 Change (%) 2014 Unit Price ($/kg)
2015 Unit Price ($/kg)
7601 Raw aluminum 2.189 2.491 2.327 -6,6 2,28 2,06
7606Aluminum plates, sheets, tapes (with more than 0,2 mm thickness)
410 395 417 5,5 3,62 3,31
7607 Aluminum sheets and tapes (thickness ≥0,2mm) 159 153 155 1,3 4,73 4,38
KAYNAK: TÜRKİYE İSTATİSTİK KURUMU
TABLE.36 SUB-SECTIONS IN COPPER AND COPPER WARE IMPORT
CODE PRODUCT2013 (Million
Dollars)2014 (Million
Dollars)2015 (Million
Dollars)14/15 Change (%)
2014 Unit Price ($/kg)
2015 Unit Price ($/kg)
7403 Refined copper and copper alloys 2.730 2.577 2.209 -14,3 7,04 5,70
7408 Copper wires 575 575 304 -47,1 7,27 6,19
7411 Pipers thicker and thinner than copper 157 144 145 1,1 8,45 6,90
FIGURE.23 SUB-SECTIONS IMPORTED MOST 2015IMPORT MILLION DOLLAR
2,500
2,000
1,500
1,000
500
0
13-COPPER AND COPPER WARE
Ongoing Decrease in Copper Prices Re-duced Import as WellImport of copper and copper ware was lowered by %3,8 in 2014 and fell down to 3,57 billion dollars. With the effect of decreases in copper prices in 2015, import went down by %16,4 and was reduced below 3 billion dollars. Import unit prices continued going down.Refined copper and copper alloy import in 2015 was low-ered by %14,3 and decreased to 2,2 billion dollars, while the biggest decrease took place in copper wires by %47,1.
2,209
304145
Relined copper and copper alloys
Relined wires thick and thin pipes made of copper

101ECONOMY AND FOREIGN TRADE REPORT 2016
SOURCE: TURKISH STATISTICAL INSTITUTION
TABLE.37 SUB-SECTIONS IN IRON AND STEEL WARE IMPORT
CODE PRODUCT2013 (Million
Dollars)2014 (Million
Dollars)2015 (Million
Dollars)14/15 Change (%)
2014 Unit Price ($/kg)
2015 Unit Price ($/kg)
7318 Screws, bolts, nuts 617 626 664 6 6,21 6,83
7326 Other iron and steel ware 306 294 311 5,9 3,89 3,50
7304 Thick and thin pipes and hollow profiles 412 391 306 -21,8 1,37 1,12
7308 Building and building components 238 263 291 10,8 2,96 3,16
7306 Other thick and thin pipes and hollow profiles 314 244 213 -12,5 2,08 1,87
7307 Pipe fittings 180 166 187 12,5 6,19 5,48
SOURCE: TURKISH STATISTICAL INSTITUTION
TABLE.38 SUB-SECTIONS IN PAPER, PAPERBOARD AND PAPER WARE IMPORT
CODE PRODUCT2013 (Million
Dollars)2014 (Million
Dollars)2015 (Million
Dollars)14/15 Change (%) 2014 Unit Price ($/kg)
2015 Unit Price ($/kg)
4810 Smeared paper and paperboards 712 778 622 -20 0,88 0,76
4802 Non-smeared paper and paperboard 536 500 511 2,1 1 0,97
4804 Primary fiber (craft) paper and paperboards 410 421 344 -18,2 0,76 0,69
4811 Paper, paperboard, cellulose fiber layers 365 384 342 -11 2,57 2,01
4805 Other paper and paperboards 284 279 209 -25,2 0,71 0,64
4801 Newsprint 276 244 173 -29,2 0,62 0,50
15-PAPER BOARD AND PAPER WARE
Decrease in Unit Import Prices Reduced ImportPaper, paperboard and paper ware import decreased in 2015 by %15,4 and became 2,68 billion dollars. Along with cellulose which is Turkey’s paper raw material, a significant amount of import occurs in paper, paperboard and paper ware as well.Import decreased in 5 of 6 sub-sections which are imported the most. The biggest decrease in import, respectively, was in newsprint by %29,2, other paper and paperboards by %25,2, smeared paper, paperboards and craft papers by %20. Import of non-smeared paperboard and paper increased by %2,1 at the least.
FIGURE.25 SUB-SECTIONS IMPORTED THE MOST 2015
IMPORT MILLION DOLLARS700600500400300200100
0
622
511
344 342
209 173
Smeared paperAnd paperboards
Non-smeared paper and
paperboards
Primary fibers (craft) paper
and paperboards
Paper paperboard
cellulosefiber layers
Other paper and
paperboards
Newsprint
Once net exporter countries became net importer countries.Although Turkey maintains its position as net exporter, its net export value decreases every year. There were different de-velopments in significant importation items in import in terms
of sub-sections. Import of screws, bolts, nuts, building com-ponents and pipe fitting parts increased. On the other hand, import of steel pipe and other thin and thick pipe import were reduced.

102
›
4IMPORT
TABLE.39 SUB-SECTIONS OF RUBBER AND RUBBER WARE IMPORT
CODE PRODUCT2013 (Million
Dollars)2014 (Million
Dollars)2015 (Million
Dollars)14/15 Change (%) 2014 Unit Price ($/kg)
2015 Unit Price ($/kg)
4011 New tires made of rubber 1.028 936 824 -11,9 4,98 4,12
4002 Imitation rubber 691 631 524 -16,9 2,31 1,78
4016Unhardened vulcanized rubber ware
336 360 344 -4,5 12,09 10,27
4001 Natural rubber 396 326 257 -21,4 2,07 1,56
4015All kinds of wear and accesso-ries made of vulcanized rubber
109 110 126 15,2 5,71 5,58
4009Pipes and hoses made of vulcan-ized rubber
128 132 125 -5,1 10,77 10,41
16-RUBBER AND RUBBER WARE
Rubber and Rubber Ware Import DroppedRubber and rubber ware import in 2015 dropped by %11,6 and became 2,52 billion dollars.Import of new tires made of rubber which has an important place among sub-sections went down by %11,9, imitation rubber import by %16,9 and natural rubber by %21,4. Vulcanized rubber wear import increased %15,2.
FIGURE.26 SUB-SECTIONS IMPORTED THE MOST 2015IMPORT MILLION DOLLARS
900800700600500400300200100
0New tires made
of rubberImitation rubber Unhardened vulcanized
rubber wareNatural rubber
824
524
344257
SOURCE: TURKISH STATISTICAL INSTITUTION
TABLE.40 COTTON, COTTON YARN AND COTTON FABRIC IMPORT SUB-SECTIONS
CODE PRODUCT2013 (Million
Dollars)2014 (Million
Dollars)2015 (Million
Dollars)14/15 Change (%) 2014 Unit Price ($/kg)
2015 Unit Price ($/kg)
5201 Cotton 1.681 1.750 1.232 -29,6 1,92 1,54
5205 Cotton yarn 435 440 384 -12,7 3,37 2,96
5209 Cotton fabric (m2 weight over 200 gr.) 300 283 257 -9,2 7,57 7
5208 Cotton fabric (m2 weight below 200 gr.) 389 340 238 -30 8,64 8,64
17-COTTON, COTTON YARN AND COTTON FABRIC
Cotton Import Went DownCotton, cotton yarn and cotton fabric import decreased in 2015 by %25 and became 2,26 billion dollars. Raw cotton kg unit price also dropped by %19,8. Consequently, import of all other cotton fabric and threads decreased depending on the price. Cotton import went down in 2015 by %29,5 and became 1,223 billion dollars. In terms of amounts, it decreased in 2015 by %12,1 and dropped from 913 thousand tons to 803 thousand
FIGURE.27 SUB-SECTIONS IMPORTED THE MOST 2015
IMPORT MILLION DOLLARS1,4001,2001,000
800600400200
0Cotton Cotton yarn Cotton fabric
(m2 weight below 200 gr.) Cotton fabric
(m2 weight over 200 gr.)
1,232
384 257 238
tons. There was also decrease in imports of cotton yarn and cotton fabric sub-sections.
SOURCE: TURKISH STATISTICAL INSTITUTION

103ECONOMY AND FOREIGN TRADE REPORT 2016
SOURCE: TURKISH STATISTICAL INSTITUTION
TABLE.42 SUB-SECTIONS OF VARIOUS CHEMICAL PRODUCTS IMPORT
CODE PRODUCT2013 (Million
Dollars)
2014 (Million Dollars)
2015 (Million Dollars)
14/15 Change (%)
2014 Unit Price ($/kg)
2015 Unit Price ($/kg)
3824 Other chemicals used in chemistry and related industry 601 622 557 -10,5 2,48 2,13
3808 Agricultural pesticides 324 330 363 10,1 7,04 6,88
3822 Reagents used in laboratories, identification 236 255 239 -6,4 38,02 26,19
3811 Anti-knock patent medicines 202 207 187 -9,6 4 3,48
3817 Alkali benzene and alkali naphthalene mixtures 163 148 106 -28,4 1,82 1,25
3823 Industrial mono carboxylic oil acids 104 115 93 -18,5 1,15 0,95
3815 Reaction initiators, accelerators, catalytic patent medicines 50 126 84 -33,2 15,46 11,29
SOURCE: TURKISH STATISTICAL INSTITUTION
18-SYNTHETIC AND ARTIFICIAL FILAMENTS
Threat and Fabric Import Dropped This YearSynthetic and artificial filament import increased in 2014 by %13 and decreased in 2015 by %11,6 and became 2,1 billion dollars. There was a decrease of %8,3 in synthetic filament threads which is imported the most among sub-sections; import of fabrics woven from synthetic filament threads went down by %15,6.
TABLE.41 SUB-SECTIONS OF SYNTHETIC AND ARTIFICIAL FILAMENT IMPORT
CODE PRODUCT2013 (Million
Dollars)2014 (Million
Dollars)2015 (Million
Dollars)14/15 Change (%) 2014 Unit Price ($/kg)
2015 Unit Price ($/kg)
5402 Synthetic filament threads 1.436 1.615 1.482 -8,3 2,52 2,29
5407Fabrics made of synthetic filament threads
485 549 463 -15,6 6,20 5,89
FIGURE.28 SUB-SECTIONS IMPORTED MOST 2015
IMPORT MILLION DOLLAR1,6001,4001,2001,000
800600400200
0
1,482
463
Synthetic filament threads Fabrics made of synthetic filament threads
19-VARIOUS CHEMICAL PRODUCTS
Unit Prices of Various Chemicals Decrea-sed more than ImportImport of various chemical substances went down in 2015 by %10 and became 2,05 billion dollars. There were decreases in unit prices of all imported various chemical substances. Rates of decreases in unit prices reached %35 in some of the products.Import of all products other than agricultural pesticides decre-ased in sub-sections which are imported the most. While ag-ricultural pesticide import increased by %10,1; import of che-micals used in various industries dropped by %10,5, reagents used in laboratories decreased by %6,4, anti-knock patent medicines by %9,6, alkali benzenes and alkali naphthalene import by %28,4.
FIGURE.29 SUB-SECTIONS IMPORTED THE MOST 2015
IMPORT MILLION DOLLARS600500400300200100
0
557
363
239 187106
Chemicals used in Chemistry and
Related industry
Pesticides Reagents used in laboratories
identifications
Anti-blockpatent
medicines
alkali benzene alkali naphthalene as
mixtures

104
›
4IMPORT
IV.8 IMPORT BASING ON COUNTRIES AND SECTIONS
SOURCE: TURKISH STATISTICAL INSTITUTION
TABLE 43. SUB-SECTIONS SYNTHETIC AND ARTIFICIAL DISCONTINUOUS FIBER IMPORT
CODE PRODUCT2013 (Million
Dollars)2014 (Million
Dollars)2015 (Million
Dollars)14/15 Change (%)
2014 Unit Price ($/kg)
2015 Unit Price ($/kg)
5504 Artificial discontinuous fibers (crude) 513 485 479 -1,3 1,91 1,83
5509Thread made of synthetic discontinu-ous fiber (excluding sewing thread) (wholesale)
454 449 390 -13,1 3,32 3,19
5503 Synthetic discontinuous fibers (Crude) 354 390 377 -3,5 1,94 1,76
5510Threads made of artificial discontinu-ous fiber (excluding sewing thread)
188 150 148 -1,1 3,26 3,16
5502 Artificial filament bundles 99 111 112 0,7 5,86 5,62
5516Fabrics woven from artificial discon-tinuous fibers
122 125 110 -11,8 7,49 6,89
5501 Synthetic filament bundles 144 145 99 -32,1 2,49 2,10
5515Other fabrics woven from synthetic discontinuous fibers
129 126 98 -21,9 8,46 8,91
20-SYNTHETIC AND ARTIFICIAL DISCONTINUOUS FIBERS
Import Decreased but its Share in Total Import Increased Import of synthetic and artificial discontinuous fiber drop-ped in 2015 by %9,1 and decreased from 2,16 billion dol-lars to 1,96 billion dollars.There were decreases in all sub-section products in different rates but artificial filament bundle import did not change.
FIGURE.30 SUB-SECTIONS IMPORTED THE MOST 2015
IMPORT MILLION DOLLARS600500400300200100
0
479
390 377
148 112
Artificial discontinuousfibers (crude)
Thread made of Synthetic Discontinuous fiber
(excluding sewing thread)(wholesale)
Syntheticdiscontinuousfibers (crude)
Threads made of artificial discontinuous
fibers (excluding sewing threads)
Artificialfilament bundles
1. CHINA
China Ranks the First in ImportImport from China decreased also in 2015 by %0,2 and beca-me 24,86 billion dollars. Share of the import made from China increased to %12. Therefore, China left behind Russia and became the country that we import from the most. There are numerous sections of import from China. In 2015, import of electrical devices and machinery which are imported the most rose by %7,3. Import increased in many other lines of product. Iron steel import rose by %103. There was a decrease in im-port of machinery, furniture and plastic products.
14121086420
FIGURE.31 IMPORT FROM CHINA AND DEVELOPMENT OF IMPORT
25,000
24,900
24,800
24,700
24,600
24,5002013 2014 2015
5,8
9,8
12
10,3
ITS SHARE IN IMPORT AND IN OUR IMPORT
IMPORT MILLION DOLLARS
ITS SHARE % IN OUR IMPORT

105ECONOMY AND FOREIGN TRADE REPORT 2016
CODE SECTIONS 2013 (Million Dollars) 2014 (Million Dollars) 2015 (Million Dollars) 14/15 Change Rate (%)
85 Electrical machinery and devices 6.697 6.483 6.953 7,3
84 Machinery 6.017 5.249 5.226 -0,4
72 Iron and steel 365 649 1.317 103
39 Plastic and plastic products 1.020 994 889 -10,5
73 Iron or steel ware 688 695 804 15,7
29 Organic chemical products 599 719 741 3,1
94 Furniture 689 777 671 -13,6
87 Motor land vehicles components and parts 552 604 665 10,2
90 Precise measuring and weighing tools 611 625 584 -6,5
54 Synthetic and artificial filaments 547 578 535 -7,5
SOURCE: TURKISH STATISTICAL INSTITUTION
TABLE.44 SUB-SECTIONS OF IMPORT FROM CHINA
2. GERMANY
Limited Decrease of Germany in Import Import from Germany in 2015 decreased by %4,5 in a more limited way compared to first twenty importers and became 21,4 billion dollars. Germany’s share in our import increased to %10,3. Import of motor land vehicles from Germany rose by %9,2. Increase of automobile sales in homeland and decrease of Euro increased the import. Machinery import dropped by %16,3, electrical machinery and devices import by %3,8, plastic and plastic products import by %11,9. Aviation vehicles import showed an increase over %1000. Due to fleet expansion of airlines, airplane import increased.
10,5
10
9,5
9
8,5
FIGURE.32 IMPORT FROM GERMANYAND DEVELOPMENT OF IMPORT
25,00024,00023,00022,00021,00020,00019,000
2013 2014 2015
9,6
10,3
IMPORT MILLION DOLLARS
ITS SHARE % IN OUR IMPORT
ITS SHARE IN IMPORT AND IN OUR IMPORT
9,2
CODE SECTIONS 2013 (Million Dollars) 2014 (Million Dollars) 2015 (Million Dollars) 14/15 Change (%)
87 Motor land vehicles component and parts 5.622 5.223 5.706 9,2
84 Machinery 5.527 5.428 4.541 -16,3
85 Electrical machinery and devices 1.996 1.709 1.645 -3,8
39 Plastic and plastic products 1.682 1.612 1.420 -11,9
90 Optics, photography, cinema, measuring, control devices 828 861 830 -3,7
30 Pharmacy products 824 857 794 -7,4
72 Iron and steel 854 719 608 -15,4
88 Air vehicles and components and parts 559 50 580 1.069,6
38 Various chemical substances 433 455 454 -0,2
48 Paper, paperboard and ware made of them 533 518 420 -18,9
TABLE 45. SUB-SECTIONS OF IMPORT FROM GERMANY
SOURCE: TURKISH STATISTICAL INSTITUTION

106
›
4IMPORT
4. USA
Effect of Air and Spacecraft on Import from USAImport from USA dropped in 2015 by %12,6 and became 11,13 billion dollars. USA’s share in our import became %5,4.There were significant developments in 2015 in the most significant items of import from USA. While iron-steel im-port decreased by %32,7, air and spacecraft import rose %21,6. There were important decreases in import of mi-neral fuels and oils, cotton, plastic, cotton ware and plastic ware.
5,55,45,35,25,154,94,8
FIGURE.34 IMPORT FROM USA AND DEVELOPMENT OF IMPORT
13,00012,50012,00011,50011,00010,50010,000
2013 2014 2015
5
12,096
12,728 11,127
5,4
IMPORT MILLION DOLLARS
ITS SHARE % IN OUR IMPORT
ITS SHARE IN IMPORT AND IN OUR IMPORT
SOURCE: TURKISH STATISTICAL INSTITUTION
TABLE.46 SUB-SECTIONS OF IMPORT FROM RUSSIA
CODE SECTIONS 2013 (Million Dollars) 2014 (Million Dollars) 2015 (Million Dollars) 14/15 Change (%)
27 Mineral fuels and mineral oils 17.119 16.493 12.939 -21,6
72 Iron and steel 2.925 2.689 2.744 2
10 Cereal 1.005 1.451 883 -39,2
76 Aluminum and aluminum ware 841 1.109 868 -21,7
15 Animal and herbal solid and liquid oils, 549 876 798 -8,9
23Residuals and remainders of food industry, rough-ages prepared for animals
240 288 264 -8,2
31 Fertilizers 324 363 217 -40,3
44 Wood and woodenware 197 179 213 18,8
28 Inorganic chemicals 267 203 191 -5,9
74 Copper and copperware 348 301 179 -40,7
3. RUSSIA
Sharp Decrease of Russia in ImportThere was %19,3 decrease in import from Russia in 2015 and import was reduced to 20,4 billion dollars. With its share reduced to %9,8, Russia was no longer the country we import from the most and ranked down to third pla-ce. The decline in import from Russia mostly resulted from high decreases in prices of products such as mineral fuels and oils, cereals, iron steel, copper and aluminum. Import declined in many of these products. Import also decreased in many other products as well. Iron and steel import, ho-wever, increased.
10,610,410,2109,89,69,4
FIGURE.33 IMPORT FROM RUSSIA AND DEVELOPMENT OF IMPORT
30,00025,00020,00015,00010,0005,000
0 2013 2014 2015
10
9,8
10,4
IMPORT MILLION DOLLARS
ITS SHARE % IN OUR IMPORT
ITS SHARE IN IMPORT AND IN OUR IMPORT
5,3

107ECONOMY AND FOREIGN TRADE REPORT 2016
CODE SECTIONS 2013 (Million Dollars) 2014 (Million Dollars) 2015 (Million Dollars) 14/15 Change (%)
88 Aircrafts components and parts 836 1.398 1.699 21,6
84 Machinery 1.174 1.258 1.224 -2,8
72 Iron and steel 2.066 1.555 1.047 -32,7
90 Optic, photography, measurement and control devices 755 833 730 -12,4
27 Mineral fuels and mineral oils 1.149 1.075 689 -35,9
30 Pharmaceutical products 506 598 557 -6,9
52 Cotton, cotton thread and cotton fabric 874 918 532 -42
85 Electrical machinery and devices 440 484 478 -1,2
39 Plastics and plastic products 636 532 433 -18,6
29 Organic chemical products 430 497 415 -16,5
TABLE.47 SUB-SECTIONS OF IMPORT FROM USA
SOURCE: TURKISH STATISTICAL INSTITUTION
CODE SECTIONS 2013 (Million Dollars) 2014 (Million Dollars) 2015 (Million Dollars) 14/15 Change (%)
84 Machinery 3.248 3.215 2.829 -12
27 Mineral fuels and mineral oils 1.840 1.442 1.045 -27,6
87 Motor land vehicles components and parts 975 969 1.021 5,3
39 Plastics and plastic products 754 796 674 -15,3
85 Electrical machinery and devices 712 666 636 -4,4
72 Iron and steel 523 471 449 -4,5
73 Iron or steel ware 344 298 310 3,8
30 Pharmaceutical products 379 306 277 -9,7
90Optic, photography, measurement, control, adjust-ment devices
287 305 275 -9,7
71 Gemstones or semiprecious stones 255 249 216 -13,2
TABLE.48 SUB-SECTIONS OF IMPORT FROM ITALY
5. ITALY
Import from Italy Decreased with Mineral FuelsImport from Italy in 2015 decreased by %11,7 and became 10,64 billion dollars. Italy’s share in our import went up to %5,1.Import of mineral fuels and oils from Italy in 2015 decrea-sed by %27,6, machinery import %12, plastic and plastic products by %15,3. Iron-steel import went down by %4,5. Import of motor land vehicles component and parts in 2015 from Italy increased.
SOURCE: TURKISH STATISTICAL INSTITUTION
5,15
5,10
5,05
5,00
4,95
FIGURE.35 IMPORT FROM ITALY AND DEVELOPMENT OF IMPORT
14,000
12,000
10,000
8,000
6,000
4,000
2,0002013 2014 2015
3,7
5,1
5
5,1
ITS SHARE IN IMPORT AND IN OUR IMPORT
IMPORT MILLION DOLLARS
ITS SHARE % IN OUR IMPORT

108
›
4IMPORT
6. FRANCE
Effect of Aircraft and Motor Land Vehicle in Relatively Restricted Decrease of Import from FranceImport from France in 2015 decreased by %6,6 and be-came 7,58 billion dollars. France’s share in total import became %3,7. Import from France was reduced below average.In import from France, aircraft import increased by %8,8 and motor land vehicle import went up %14,6 and they became determinant in 2015. In other four sig-nificant items imported from France, there was a decre-ase in import by %2,5 in machinery, plastic and plastic products by %20,4, electrical machinery and devices by %12,2 and iron and steel by %41,3.
3,8
3,6
3,4
3,2
3
2,8
FIGURE.36 IMPORT FROM FRANCE AND DEVELOPMENT OF IMPORT
8,200
8,000
7,800
7,600
7,400
7,2002013 2014 2015
3,4
3,7
3,2
3,4
CODE SECTIONS 2013 (Million Dollars) 2014 (Million Dollars) 2015 (Million Dollars) 14/15 Change (%)
88 Aircrafts and their components and parts 510 1.060 1.154 8,8
84 Machinery 1.295 1.178 1.149 -2,5
87 Motor land vehicles components and parts 1.162 939 1.075 14,6
39 Plastics and plastic products 668 702 560 -20,4
85 Electrical machinery and devices 698 636 559 -12,2
72 Iron and steel 850 899 528 -41,3
30 Pharmaceutical products 428 439 382 -13
90Optic, photography, cinema, measurement, control
and adjustment devices296 249 242 -2,8
38 Various chemical substances 240 239 235 -1,6
29 Organic chemical products 162 158 179 13,8
TABLE 49. SUB-SECTIONS OF IMPORT FROM FRANCE
SOURCE: TURKISH STATISTICAL INSTITUTION
IMPORT MILLION DOLLARS
ITS SHARE % IN OUR IMPORT
ITS SHARE IN IMPORT AND IN OUR IMPORT
7. SOUTH KOREA
Import from South Korea Dropped %6,5 Having rapidly increased after Free Trade Agreement, import from South Korea went down by %6,5 in 2015. While import from South Korea in 2015 was reduced to 7,06 billion dollars, South Korea’s share in our import increased to %3,4. Trade with South Korea was also affected from the general slow-down in import.In spite of the decrease in import from South Korea, there was increase in import of iron-steel, motor land vehicles, pharmaceutical products and precision measurement devi-ces. Import of other lines of product declined. Highest decline of import occurred in machinery by %25,9.
4
3
2
1
0
FIGURE.37 IMPORT FROM SOUTH KOREA AND DEVELOPMENT OF IMPORT
8,000
6,000
4,000
2,000
3,4
2,4
IMPORT MILLION DOLLARS
ITS SHARE % IN OUR IMPORT
ITS SHARE IN IMPORT AND IN OUR IMPORT
2013 2014 2015
3,1
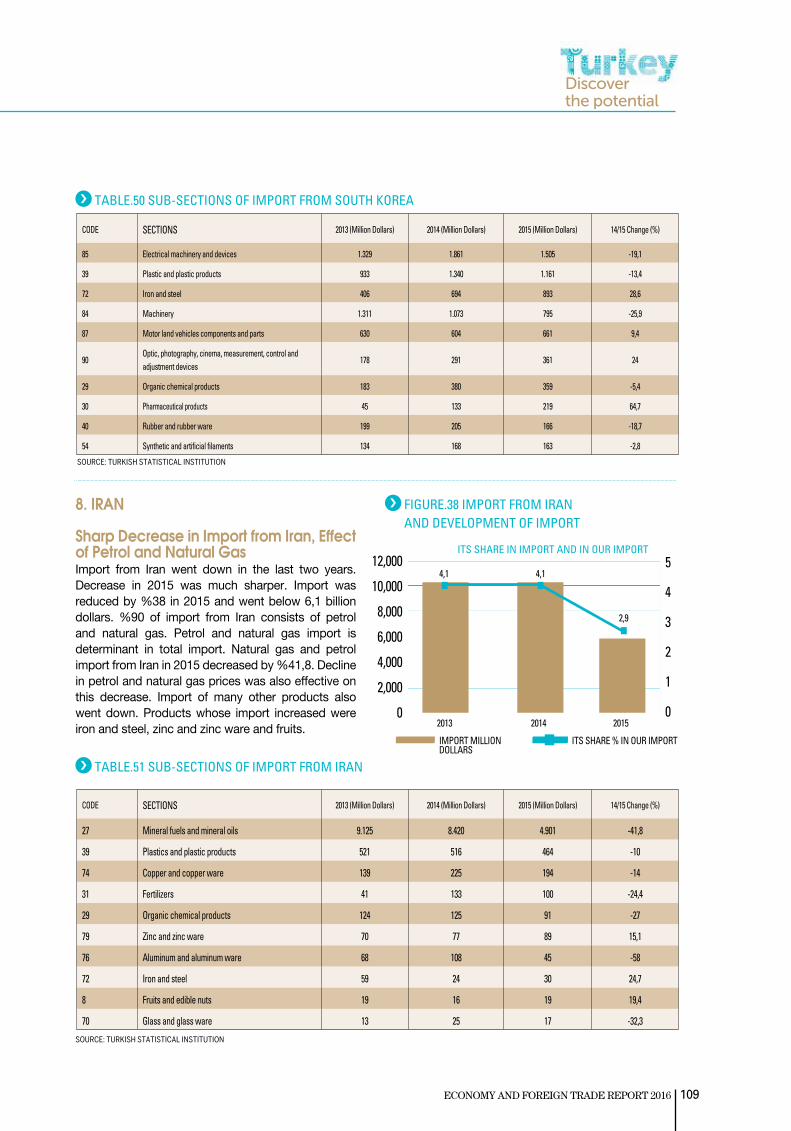
109ECONOMY AND FOREIGN TRADE REPORT 2016
CODE SECTIONS 2013 (Million Dollars) 2014 (Million Dollars) 2015 (Million Dollars) 14/15 Change (%)
27 Mineral fuels and mineral oils 9.125 8.420 4.901 -41,8
39 Plastics and plastic products 521 516 464 -10
74 Copper and copper ware 139 225 194 -14
31 Fertilizers 41 133 100 -24,4
29 Organic chemical products 124 125 91 -27
79 Zinc and zinc ware 70 77 89 15,1
76 Aluminum and aluminum ware 68 108 45 -58
72 Iron and steel 59 24 30 24,7
8 Fruits and edible nuts 19 16 19 19,4
70 Glass and glass ware 13 25 17 -32,3
TABLE.51 SUB-SECTIONS OF IMPORT FROM IRAN
SOURCE: TURKISH STATISTICAL INSTITUTION
CODE SECTIONS 2013 (Million Dollars) 2014 (Million Dollars) 2015 (Million Dollars) 14/15 Change (%)
85 Electrical machinery and devices 1.329 1.861 1.505 -19,1
39 Plastic and plastic products 933 1.340 1.161 -13,4
72 Iron and steel 406 694 893 28,6
84 Machinery 1.311 1.073 795 -25,9
87 Motor land vehicles components and parts 630 604 661 9,4
90Optic, photography, cinema, measurement, control and adjustment devices
178 291 361 24
29 Organic chemical products 183 380 359 -5,4
30 Pharmaceutical products 45 133 219 64,7
40 Rubber and rubber ware 199 205 166 -18,7
54 Synthetic and artificial filaments 134 168 163 -2,8
TABLE.50 SUB-SECTIONS OF IMPORT FROM SOUTH KOREA
SOURCE: TURKISH STATISTICAL INSTITUTION
8. IRAN
Sharp Decrease in Import from Iran, Effect of Petrol and Natural GasImport from Iran went down in the last two years. Decrease in 2015 was much sharper. Import was reduced by %38 in 2015 and went below 6,1 billion dollars. %90 of import from Iran consists of petrol and natural gas. Petrol and natural gas import is determinant in total import. Natural gas and petrol import from Iran in 2015 decreased by %41,8. Decline in petrol and natural gas prices was also effective on this decrease. Import of many other products also went down. Products whose import increased were iron and steel, zinc and zinc ware and fruits.
5
4
3
2
1
0
FIGURE.38 IMPORT FROM IRAN AND DEVELOPMENT OF IMPORT
12,000
10,000
8,000
6,000
4,000
2,000
02013 2014 2015
3,7
4,1
2,9
4,1
IMPORT MILLION DOLLARS
ITS SHARE % IN OUR IMPORT
ITS SHARE IN IMPORT AND IN OUR IMPORT
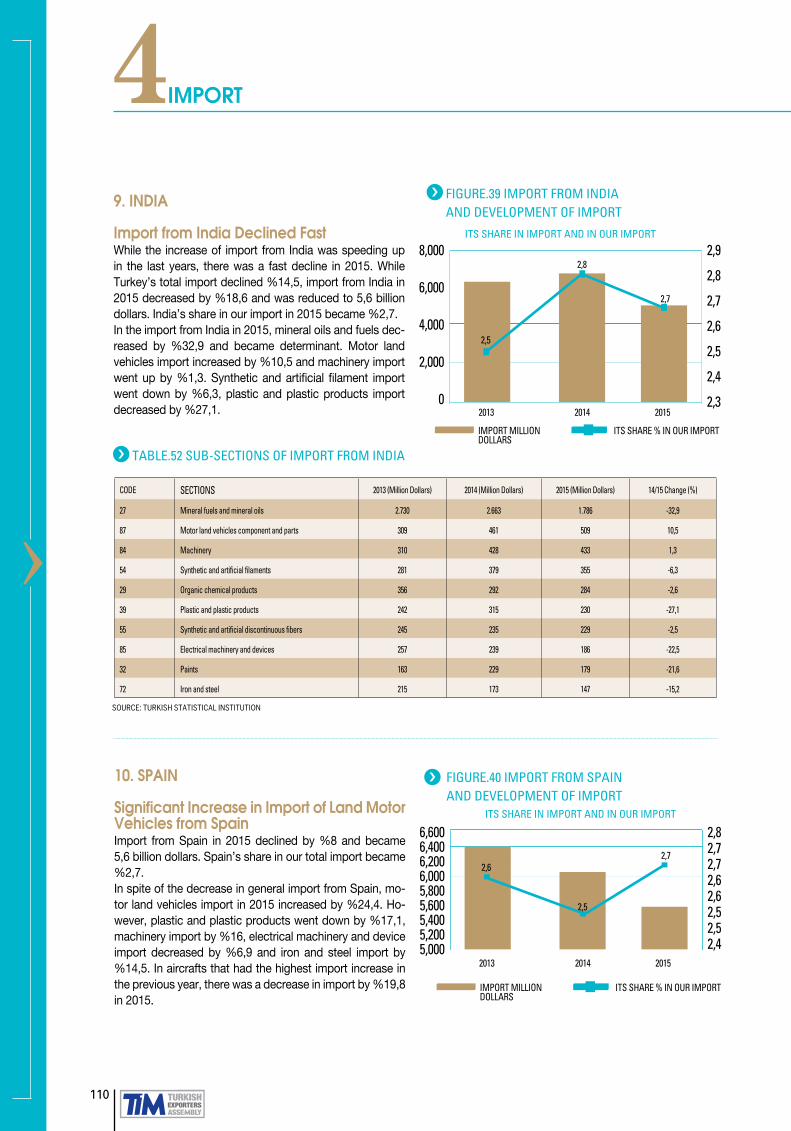
110
›
4IMPORT
CODE SECTIONS 2013 (Million Dollars) 2014 (Million Dollars) 2015 (Million Dollars) 14/15 Change (%)
27 Mineral fuels and mineral oils 2.730 2.663 1.786 -32,9
87 Motor land vehicles component and parts 309 461 509 10,5
84 Machinery 310 428 433 1,3
54 Synthetic and artificial filaments 281 379 355 -6,3
29 Organic chemical products 356 292 284 -2,6
39 Plastic and plastic products 242 315 230 -27,1
55 Synthetic and artificial discontinuous fibers 245 235 229 -2,5
85 Electrical machinery and devices 257 239 186 -22,5
32 Paints 163 229 179 -21,6
72 Iron and steel 215 173 147 -15,2
TABLE.52 SUB-SECTIONS OF IMPORT FROM INDIA
SOURCE: TURKISH STATISTICAL INSTITUTION
9. INDIA
Import from India Declined Fast While the increase of import from India was speeding up in the last years, there was a fast decline in 2015. While Turkey’s total import declined %14,5, import from India in 2015 decreased by %18,6 and was reduced to 5,6 billion dollars. India’s share in our import in 2015 became %2,7. In the import from India in 2015, mineral oils and fuels dec-reased by %32,9 and became determinant. Motor land vehicles import increased by %10,5 and machinery import went up by %1,3. Synthetic and artificial filament import went down by %6,3, plastic and plastic products import decreased by %27,1.
2,9
2,8
2,7
2,6
2,5
2,4
2,3
FIGURE.39 IMPORT FROM INDIA AND DEVELOPMENT OF IMPORT
8,000
6,000
4,000
2,000
02013 2014 2015
2,8
2,7
2,5
10. SPAIN
Significant Increase in Import of Land Motor Vehicles from Spain Import from Spain in 2015 declined by %8 and became 5,6 billion dollars. Spain’s share in our total import became %2,7.In spite of the decrease in general import from Spain, mo-tor land vehicles import in 2015 increased by %24,4. Ho-wever, plastic and plastic products went down by %17,1, machinery import by %16, electrical machinery and device import decreased by %6,9 and iron and steel import by %14,5. In aircrafts that had the highest import increase in the previous year, there was a decrease in import by %19,8 in 2015.
2,82,72,72,62,62,52,52,4
FIGURE.40 IMPORT FROM SPAIN AND DEVELOPMENT OF IMPORT
6,6006,4006,2006,0005,8005,6005,4005,2005,000
2013 2014 2015
2,5
2,72,6
ITS SHARE IN IMPORT AND IN OUR IMPORT
IMPORT MILLION DOLLARS
ITS SHARE % IN OUR IMPORT
IMPORT MILLION DOLLARS
ITS SHARE % IN OUR IMPORT
ITS SHARE IN IMPORT AND IN OUR IMPORT
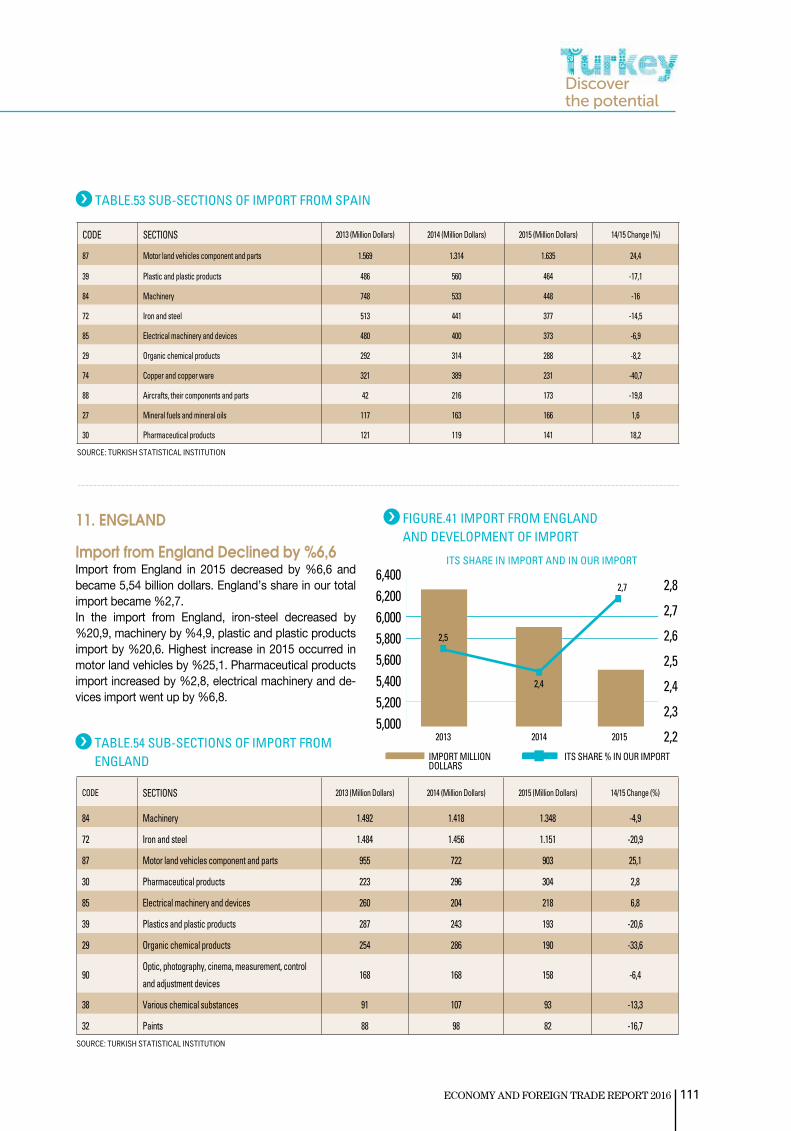
111ECONOMY AND FOREIGN TRADE REPORT 2016
CODE SECTIONS 2013 (Million Dollars) 2014 (Million Dollars) 2015 (Million Dollars) 14/15 Change (%)
87 Motor land vehicles component and parts 1.569 1.314 1.635 24,4
39 Plastic and plastic products 486 560 464 -17,1
84 Machinery 748 533 448 -16
72 Iron and steel 513 441 377 -14,5
85 Electrical machinery and devices 480 400 373 -6,9
29 Organic chemical products 292 314 288 -8,2
74 Copper and copper ware 321 389 231 -40,7
88 Aircrafts, their components and parts 42 216 173 -19,8
27 Mineral fuels and mineral oils 117 163 166 1,6
30 Pharmaceutical products 121 119 141 18,2
TABLE.53 SUB-SECTIONS OF IMPORT FROM SPAIN
SOURCE: TURKISH STATISTICAL INSTITUTION
11. ENGLAND
Import from England Declined by %6,6Import from England in 2015 decreased by %6,6 and became 5,54 billion dollars. England’s share in our total import became %2,7.In the import from England, iron-steel decreased by %20,9, machinery by %4,9, plastic and plastic products import by %20,6. Highest increase in 2015 occurred in motor land vehicles by %25,1. Pharmaceutical products import increased by %2,8, electrical machinery and de-vices import went up by %6,8.
2,8
2,7
2,6
2,5
2,4
2,3
2,2
FIGURE.41 IMPORT FROM ENGLAND AND DEVELOPMENT OF IMPORT
6,4006,2006,0005,8005,6005,4005,2005,000
2013 2014 2015
2,4
2,7
2,5
ITS SHARE IN IMPORT AND IN OUR IMPORT
IMPORT MILLION DOLLARS
ITS SHARE % IN OUR IMPORT
CODE SECTIONS 2013 (Million Dollars) 2014 (Million Dollars) 2015 (Million Dollars) 14/15 Change (%)
84 Machinery 1.492 1.418 1.348 -4,9
72 Iron and steel 1.484 1.456 1.151 -20,9
87 Motor land vehicles component and parts 955 722 903 25,1
30 Pharmaceutical products 223 296 304 2,8
85 Electrical machinery and devices 260 204 218 6,8
39 Plastics and plastic products 287 243 193 -20,6
29 Organic chemical products 254 286 190 -33,6
90Optic, photography, cinema, measurement, control
and adjustment devices168 168 158 -6,4
38 Various chemical substances 91 107 93 -13,3
32 Paints 88 98 82 -16,7
TABLE.54 SUB-SECTIONS OF IMPORT FROM ENGLAND
SOURCE: TURKISH STATISTICAL INSTITUTION

112
›
4IMPORT
CODE SECTIONS 2013 (Million Dollars) 2014 (Million Dollars) 2015 (Million Dollars) 14/15 Change (%)
72 Iron and steel 2.303 2.349 1.623 -30,9
12 Oil seeds and fruits 136 213 393 84,5
44 Wood and wooden ware 180 204 261 28
31 Fertilizer 343 215 241 12,1
15 Animal and herbal solid and liquid oils 360 252 219 -13
23Residuals and remainders of food industry, rough-ages prepared for animals
151 190 204 7,5
26 Metal ores, clinker and ash 280 155 119 -23,2
10 Cereals 201 137 76 -44,6
28 Inorganic chemicals 72 92 75 -18
74 Copper and Copper ware 9 26 34 33,4
TABLE.55 SUB-SECTIONS OF IMPORT FROM UKRAINE
SOURCE: TURKISH STATISTICAL INSTITUTION
12. UKRAINE
Strong Decrease in Import from Ukraine Ukraine felt effects of its political crisis with Russia in last year also in 2015 economically. Consequently, there was an economic recession. Turkey’s import from Ukraine decreased in 2015 by %18,7 and became 3,44 billion dol-lars.Highest decline in import was in iron and steel products, which we import the most, by %30,9. Import went down in animal and herbal oils by %13, in cereals by %44,6. Oil seed and fruit import in 2015 increased in 2015 by %84,5 and fertilizer by %12,1. Metal ore and inorganic chemical import also declined.
1,9
1,8
1,8
1,7
1,7
FIGURE.42 IMPORT FROM UKRAINEAND DEVELOPMENT OF IMPORT
5,000
4,000
3,000
2,000
1,000
02013 2014 2015
1,8
1,7
1,8
IMPORT MILLION DOLLARS
ITS SHARE % IN OUR IMPORT
ITS SHARE IN IMPORT AND IN OUR IMPORT
13. BELGIUM
Import from Belgium Declined over Average Import from Belgium in 2015 decreased over the average and by %18,6; it was reduced to 3,15 billion dollars. Belgium’s sha-re in our import is %1,5.Plastic and plastic product import from Belgium in 2015 decre-ased by %17,3, iron-steel import by %28,5, machinery import %3,6, motor land vehicle import %4,2 and organic chemical products import by %39,4. Import declined in all significant items from Belgium except gemstones.
1,7
1,6
1,5
1,4
FIGURE.43 IMPORT FROM BELGIUM AND DEVELOPMENT OF IMPORT
5,0004,0003,0002,0001,000
02013 2014 2015
1,6
1,5
IMPORT MILLION DOLLARS
ITS SHARE % IN OUR IMPORT
ITS SHARE IN IMPORT AND IN OUR IMPORT
1,5
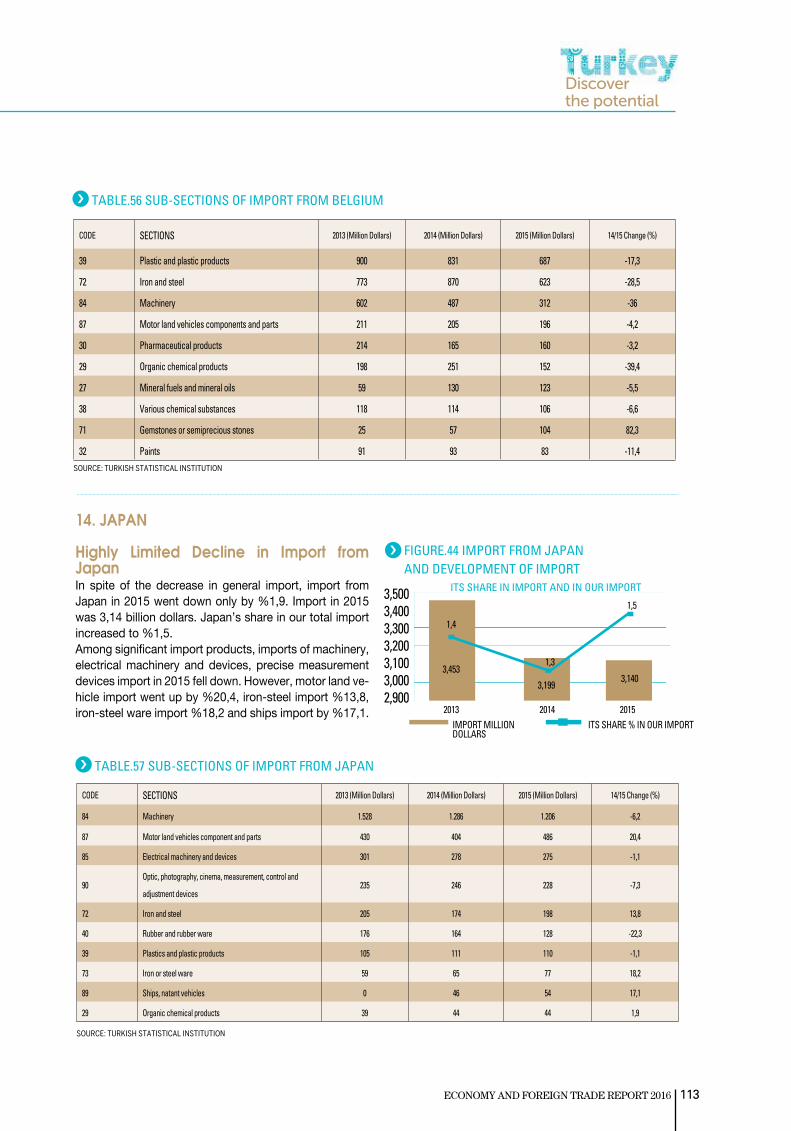
113ECONOMY AND FOREIGN TRADE REPORT 2016
CODE SECTIONS 2013 (Million Dollars) 2014 (Million Dollars) 2015 (Million Dollars) 14/15 Change (%)
39 Plastic and plastic products 900 831 687 -17,3
72 Iron and steel 773 870 623 -28,5
84 Machinery 602 487 312 -36
87 Motor land vehicles components and parts 211 205 196 -4,2
30 Pharmaceutical products 214 165 160 -3,2
29 Organic chemical products 198 251 152 -39,4
27 Mineral fuels and mineral oils 59 130 123 -5,5
38 Various chemical substances 118 114 106 -6,6
71 Gemstones or semiprecious stones 25 57 104 82,3
32 Paints 91 93 83 -11,4
TABLE.56 SUB-SECTIONS OF IMPORT FROM BELGIUM
SOURCE: TURKISH STATISTICAL INSTITUTION
CODE SECTIONS 2013 (Million Dollars) 2014 (Million Dollars) 2015 (Million Dollars) 14/15 Change (%)
84 Machinery 1.528 1.286 1.206 -6,2
87 Motor land vehicles component and parts 430 404 486 20,4
85 Electrical machinery and devices 301 278 275 -1,1
90Optic, photography, cinema, measurement, control and
adjustment devices235 246 228 -7,3
72 Iron and steel 205 174 198 13,8
40 Rubber and rubber ware 176 164 128 -22,3
39 Plastics and plastic products 105 111 110 -1,1
73 Iron or steel ware 59 65 77 18,2
89 Ships, natant vehicles 0 46 54 17,1
29 Organic chemical products 39 44 44 1,9
TABLE.57 SUB-SECTIONS OF IMPORT FROM JAPAN
SOURCE: TURKISH STATISTICAL INSTITUTION
FIGURE.44 IMPORT FROM JAPAN AND DEVELOPMENT OF IMPORT
3,5003,4003,3003,2003,1003,0002,900
2013 2014 2015
1,3
1,5
14. JAPAN
Highly Limited Decline in Import from JapanIn spite of the decrease in general import, import from Japan in 2015 went down only by %1,9. Import in 2015 was 3,14 billion dollars. Japan’s share in our total import increased to %1,5. Among significant import products, imports of machinery, electrical machinery and devices, precise measurement devices import in 2015 fell down. However, motor land ve-hicle import went up by %20,4, iron-steel import %13,8, iron-steel ware import %18,2 and ships import by %17,1.
IMPORT MILLION DOLLARS
ITS SHARE % IN OUR IMPORT
ITS SHARE IN IMPORT AND IN OUR IMPORT
1,4
3,453
3,1993,140

114
›
4IMPORT
16. THE NETHERLANDS
Import from the Netherlands Declined over the AverageImport from the Netherlands in 2015 declined over the average by %17,1 and became 2,91 billion dollars. The Netherlands’ share in our total import was reduced to %1,4.Import of almost all of significant products from the Net-herlands decreased in 2015. Iron-steel import went down by %34,8, organic chemical products import decreased relatively fast by %31,9. Motor land vehicle became the only line of product that increased among important im-port products by %32,4.
1,6
1,5
1,5
1,4
1,4
1,3
1,3
1,2
4,000
3,000
2,000
1,000
02013 2014 2015
1,5
1,4
IMPORT MILLION DOLLARS
ITS SHARE % IN OUR IMPORT
ITS SHARE IN IMPORT AND IN OUR IMPORT
1,3
15. POLAND
Poland Reserves its Place in first 20Import from Poland in 2015 went down by %3,4 and was redu-ced to 2,98 billion dollars. Nonetheless, Poland reserved its place in our first 20 importers where it was included in last five years; it also increased its share in 2015 to %1,4. It is also a significant development that import from Poland in 2015 remained limited.It is also observed that import from Poland has become diversi-fied. Machinery import from Poland in 2015 decreased by %5,9, rubber and rubber ware by %11,3, plastic and plastic products import by %2,1. However, motor land vehicles import increased by %7,1 and electrical machinery and device import by %17,7. Paper and paperboard ware import declined by %16,1.
TABLE 58. SUB-SECTIONS OF IMPORT FROM POLAND
SOURCE: TURKISH STATISTICAL INSTITUTION
1,5
1,4
1,4
1,3
1,3
FIGURE.45 IMPORT FROM POLAND AND DEVELOPMENT OF IMPORT
3,2503,2003,1503,1003,0503,0002,9502,900
2013 2014 2015
IMPORT MILLION DOLLARS
ITS SHARE % IN OUR IMPORT
ITS SHARE IN IMPORT AND IN OUR IMPORT
1,3 1,3
1,4
FIGURE.46 IMPORT FROM THE NETHERLANDS AND DEVELOPMENT OF IMPORT
CODE SECTIONS 2013 (Million Dollars) 2014 (Million Dollars) 2015 (Million Dollars) 14/15 Change (%)
84 Machinery 970 868 817 -5,9
87 Motor land vehicles component and parts 644 679 728 7,1
85 Electrical machinery and devices 368 342 402 17,7
40 Rubber and rubber ware 114 99 88 -11,3
39 Plastics and plastic products 100 83 81 -2,1
48 Paper and paperboard or paperboard ware 82 86 72 -16,1
33Volatile oils and resinoid, perfumery, cosmetics or toilet
patent medicines89 83 71 -14,5
34 Cleaning materials 54 73 63 -14
94 Furniture 65 73 61 -16,7

115ECONOMY AND FOREIGN TRADE REPORT 2016
17. ROMANIA
Import from Romania Considerably Decreased this TimeImport from Romania was increasing in the last years but went down in 2014. Import from Romania decreased in 2015 substantially by %22,7 and became 2,6 billion dollars. In spite of this decrease, the increase of product diversity continues in import from Romania.The number of significant products imported from Ro-mania is on the increase. In 2015, there was increase in import of significant products such as motor land vehic-les, machinery, gemstones and cereals. Highest decline in import occurred in iron and steel by %40,4. Decline of import in this group was determinant in decrease of
CODE SECTIONS 2013 (Million Dollars) 2014 (Million Dollars) 2015 (Million Dollars) 14/15 Change (%)
39 Plastic and plastic products 512 521 453 -12,9
72 Iron and steel 636 688 449 -34,8
87 Motor land vehicles component and parts 237 239 317 32,4
84 Machinery 323 320 266 -16,8
29 Organic chemical products 309 351 239 -31,9
21 Various edible food patent medicines 106 107 103 -3,7
32 Paints 78 86 84 -1,9
48 Paper and paperboard or paperboard ware 61 67 70 4
30 Pharmaceutical products 70 71 68 -4,1
90Optic, photography, cinema, measurement, control
and adjustment devices62 66 64 -3
TABLE.59 SUB-SECTIONS OF IMPORT FROM THE NETHERLANDS
FIGURE.47 IMPORT FROM ROMANIA AND DEVELOPMENT OF IMPORT
1,5
1,4
1,4
1,3
1,3
4,000
3,000
2,000
1,000
0
1,4
1,3
IMPORT MILLION DOLLARS
ITS SHARE % IN OUR IMPORT
ITS SHARE IN IMPORT AND IN OUR IMPORT
SOURCE: TURKISH STATISTICAL INSTITUTION
CODE SECTIONS 2013 (Million Dollars) 2014 (Million Dollars) 2015 (Million Dollars) 14/15 Change (%)
87 Motor land vehicles components and parts 649 470 508 8,1
72 Iron and steel 1.120 764 456 -40,4
84 Machinery 267 237 241 1,4
27 Mineral fuels and mineral oils 233 526 231 -56,1
85 Electrical machinery and devices 175 164 158 -3,6
44 Wood and wooden ware, wood coal 206 175 142 -19
40 Rubber and rubber ware 132 147 128 -13,1
12 Oil seeds and fruits 126 173 94 -45,9
71 Gemstones or semiprecious stones 81 71 87 22,8
10 Cereals 33 74 82 11,6
TABLE.60 SUB-SECTIONS OF IMPORT FROM INDIA
SOURCE: TURKISH STATISTICAL INSTITUTION
1,4
general import. There was a considerable decline in import of mineral oils and fuels, oil seeds and fruits.
2013 2014 2015

116
›
4IMPORT
18. SWITZERLAND
Switzerland’s Significant Decline in Gold ImportImport from Switzerland in 2015 declined by %49,3 and was reduced to 2,44 billion dollars. Switzerland’s share in total import also decreased to %1,22.Import of gold is determinant in the import made from Swit-zerland. In 2015, import of gold declined by %73,8 and was only 730 million dollars. In the items aside from gold, machi-nery import decreased by %27,8, pharmaceutical products import by %1,7, watch import by %10,6 and precision mea-surement tools import by %7.
FIGURE.48 IMPORT FROM SWITZERLAND AND DEVELOPMENT OF IMPORT
4
3
2
1
0
12,000
10,000
8,000
6,000
4,000
2,000
02013 2014 2015
2
1,2
IMPORT MILLION DOLLARS
ITS SHARE % IN OUR IMPORT
ITS SHARE IN IMPORT AND IN OUR IMPORT3,8
CODE SECTIONS 2013 (Million Dollars) 2014 (Million Dollars) 2015 (Million Dollars) 14/15 Change (%)
71 Precious or semiprecious stones 7.702 2.784 730 -73,8
84 Machinery 539 597 431 -27,8
30 Pharmaceutical products 414 410 403 -1,7
90Optic, photography, cinema, measurement, control and adjustment devices
126 134 125 -7
91 Watches and watch components and parts 135 139 124 -10,6
29 Organic chemical products 85 103 90 -12,3
85 Electrical machinery and devices 113 108 83 -23,2
33Volatile oils and resinoid, perfumery, cosmetic or toilet patent medicines
85 78 65 -16,6
32 Paints 63 61 54 -12,4
39 Plastic and plastic products 58 50 48 -4,9
TABLE.61 SUB-SECTIONS OF IMPORT FROM SWITZERLAND
SOURCE: TURKISH STATISTICAL INSTITUTION
19. BULGARIA
Bulgaria Joined in the First 20 ImportersBulgaria joined in the first 20 country that we import from the most in 2015 by 19th place. Although import from Bulgaria in 2015 declined by %20,8 and became 2,23 billion dollars, Bulgaria increased into the first twenty. Bulgaria’s share in our import as of 2015 became %1,1.Mineral fuels and oils are determinant in import from Bulgaria. These products constitute a major part of our import. In 2015, mineral oil and fuels import decreased by %28,2 and copper and copper ware import, which is the second most important item of import, declined by %37,8. Electrical machinery and devices import, which is another significant product of import, went up by %7,3.
1,4
1,3
1,2
1,1
1,0
FIGURE.49 IMPORT FROM BULGARIA AND DEVELOPMENT OF IMPORT
3,0002,5002,0001,5001,000
5000
2013 2014 2015
1,2
1,11,1
IMPORT MILLION DOLLARS
ITS SHARE % IN OUR IMPORT
ITS SHARE IN IMPORT AND IN OUR IMPORT

117ECONOMY AND FOREIGN TRADE REPORT 2016
CODE SECTIONS 2013 (Million Dollars) 2014 (Million Dollars) 2015 (Million Dollars) 14/15 Change (%)
27 Mineral fuels and mineral oils 827 835 600 -28,2
74 Copper and copper ware 454 545 339 -37,8
85 Electrical machinery and devices 134 199 213 7,3
44 Wood and wooden ware 129 170 130 -23,3
12 Oil seeds and fruits 196 143 114 -20,2
78 Lead and lead ware 67 100 83 -17,6
39 Plastic and plastic products 69 81 72 -11,2
23Residuals and remainders of food industry, roughage
prepared for animals45 49 58 18,7
84 Machinery 101 59 57 -3
72 Iron and steel 235 139 57 -59,4
SOURCE: TURKISH STATISTICAL INSTITUTION
TABLE.62 SUB-SECTIONS OF IMPORT FROM BULGARIA
20. CZECH REPUBLIC
Czech Republic Joined in the first 20 Countries We Import from the MostImport from Czech Republic declined in 2015 by %8,3 and became 2,2 billion dollars. Nevertheless, Czech Republic joined in the first 20 countries we import from the most in 2015. Czech Republic’s share in our import became %1,1.There a considerable import from Czech Republic in a gre-at number of product lines. In 2015, import of motor land vehicles, which is the product that is imported the most, increased by %10,4. Rubber ware and iron-steel import also went up. On the other hand, import went down in many other significant products.
CODE SECTIONS 2013 (Million Dollars) 2014 (Million Dollars) 2015 (Million Dollars) 14/15 Change (%)
87 Motor land vehicles component and parts 770 693 765 10,4
84 Machinery 769 617 548 -11,3
85 Electrical machinery and devices 313 309 280 -9,3
39 Plastic and plastic products 94 92 86 -6,3
90 Optic, photography, cinema, measurement, control and adjustment devices 79 74 71 -3,6
83 Various wares made of base metal 64 64 60 -5,9
40 Rubber and rubber ware 87 56 58 4,3
86 Vehicles and materials of railway etc. lines 44 169 48 -71,5
72 Iron and steel 54 40 48 20,4
73 Iron or steel ware 72 31 28 -8,7
TABLE.63 SUB-SECTIONS OF IMPORT FROM CZECH REPUBLIC
SOURCE: TURKISH STATISTICAL INSTITUTION
1,2
1,1
1,1
1
1
FIGURE.50 IMPORT FROM CZECH REPUBLICAND DEVELOPMENT OF IMPORT
2,7002,6002,5002,4002,3002,2002,1002,000
2013 2014 2015
1
1,1
ITS SHARE IN IMPORT AND IN OUR IMPORT
IMPORT MILLION DOLLARS
ITS SHARE % IN OUR IMPORT
1


5NET EXPORT

5NET EXPORT
120
›After separate and detailed review of export and im-port, net export evaluation should also be made both on countries and sectors basis. Net export is calcu-lated with the difference between total export and total import values for countries and sections. Evalu-ation of net export in terms of countries and sections deepens the analysis in foreign trade and creates a dataset for prospective improvement decision.
Turkey had a deficit of 63,3 billion dollars in foreign trade in 2015 and is net importer. In 2014, foreign trade deficit was 84,5 billion dollars and Turkey was net im-porter. Therefore, %14,5 decline was obtained in 2015 in foreign trade deficit or net export deficit.Turkey has a significant position of net importer com-pany in World trade. Net export analyses and evalua-tions will contribute in turning Turkey into a company that has net export surplus.
Net export in terms of countries involves the countries, which Turkey has the highest net export surplus and the highest net export deficit, among Turkey’s foreign trade partners. On this purpose, with addition of its other significant trade partners to the first 20 countries that Turkey export and import the most, 26 countries were determined. In this section, Turkey’s 2015 net export is evaluated in terms of 26 leading countries.
Turkey is Net Exporter in Ten Countries out of Selected 26Turkey became net exporter in ten countries out of 26 that were selected in 2015. Last year this number was 7 coun-tries. Iraq, England, UAE, Egypt, Azerbaijan, Saudi Arabia and Israel, which are 7 countries to whom Turkey had net export surplus last year, were protected. Switzerland, the Netherlands and Romania are added to these countries. Iraq, Azerbaijan, England, Egypt, UAE, Saudi Arabia and Israel are observed as significant and permanent countries in Turkey’s net export in three-year results within this regard. Turkey caught advantages in foreign trade with these countries.Our total net export against 10 countries for whom we were net exporters increased to 25,6 billion dollars in 2015. Net export total given to 7 countries in 2014 was 22,11 billion dollars. Net export increased at the rate of %20,6.In 2015, net export to 5 countries out of 7, which Turkey had surplus in the last year as well, increased compared to 2014. Net export surplus to Israel increased 14,5 times. Net export increased in Saudi Arabia by %92,9, UAE by %90,5 and
England by %26,5. Net export to Iraq was declined in 2015 by %22,2, Azerbaijan by %35,5.
Net Import Declined by %14,1Turkey was net importer against 16 countries out of 26 se-lected in 2015. This number was 18 in 2014. Turkey had sur-plus in 2015 to Switzerland, Romania and the Netherlands which are three countries out of 18 that Turkey had deficit the last year. Greece, which Turkey had deficit to, was excluded from the first 26 countries. Bulgaria and Czech Republic were included in countries that Turkey had deficit in 2015. Other countries that Turkey had deficit remained same.Total net import to 16 countries against which Turkey was net importer in 2015 was reduced to 80,52 billion dollars. Total net import to 18 countries against which Turkey was net importer in 2014 was 93,72 billion dollars. Therefore, net import total given to 16 countries in 2015 declined by %14,1. The deficit to 11 countries out of 16 countries against which Turkey was net importer decreased when compared to 2014. The deficit to 5 countries increased.Iron and Russia were two countries where the deficit decreased the fastest among countries against which Turkey was net importer in 2015. Net import with Iran decreased by %59,1 and Russia by %13,1. Decreases in petrol and natural gas prices were effective in this development. Net import sizes with UN countries were approximately the same with the last year. Net import with China increased by %1,8.
Net export in terms of sections presents in which sectors Turkey is net exporter or importer and evaluations are per-formed within this frame.
In this regard, while evaluations are performed concerning countries, first 20 sections in Turkey’s export and import se-quencing are based on. As a result of combination of these
SECTION V. NET EXPORT
V.1 NET EXPORT IN TERMS OF COUNTRIES
V.2 NET EXPORT IN TERMS OF SECTIONS
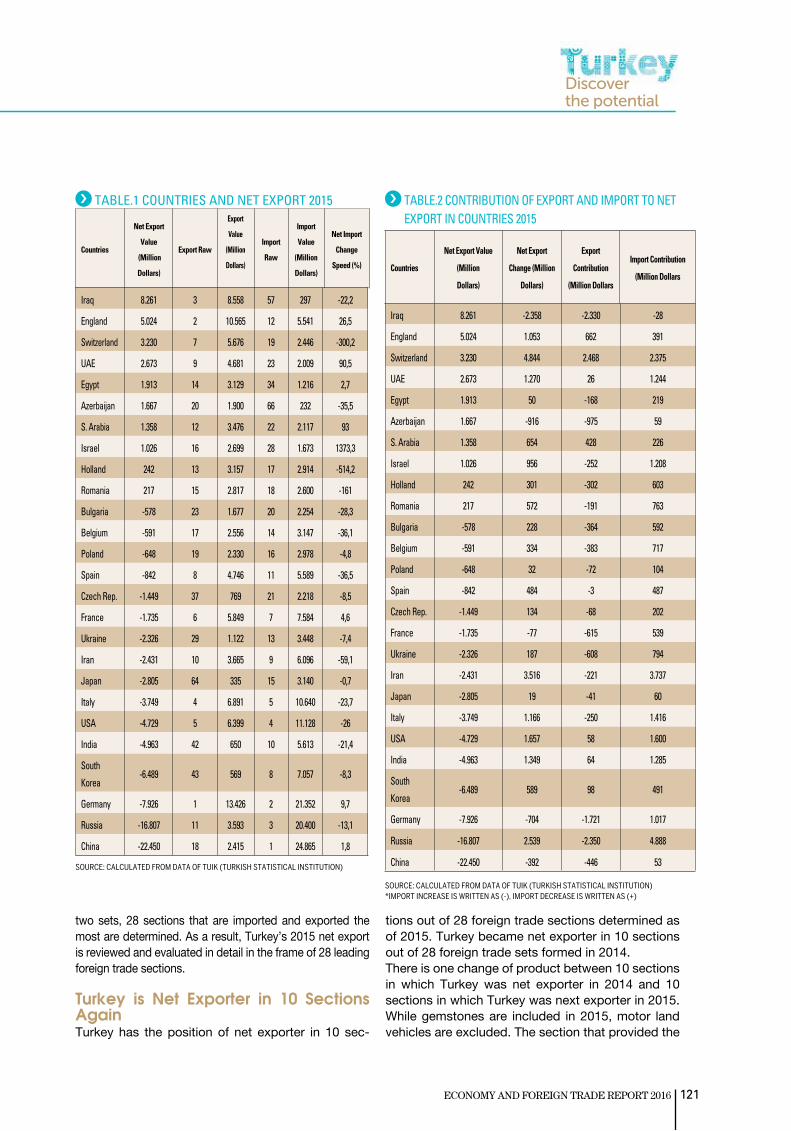
ECONOMY AND FOREIGN TRADE REPORT 2016 121
TABLE.1 COUNTRIES AND NET EXPORT 2015 TABLE.2 CONTRIBUTION OF EXPORT AND IMPORT TO NET EXPORT IN COUNTRIES 2015
SOURCE: CALCULATED FROM DATA OF TUIK (TURKISH STATISTICAL INSTITUTION)
SOURCE: CALCULATED FROM DATA OF TUIK (TURKISH STATISTICAL INSTITUTION)*IMPORT INCREASE IS WRITTEN AS (-), IMPORT DECREASE IS WRITTEN AS (+)
Iraq 8.261 -2.358 -2.330 -28
England 5.024 1.053 662 391
Switzerland 3.230 4.844 2.468 2.375
UAE 2.673 1.270 26 1.244
Egypt 1.913 50 -168 219
Azerbaijan 1.667 -916 -975 59
S. Arabia 1.358 654 428 226
Israel 1.026 956 -252 1.208
Holland 242 301 -302 603
Romania 217 572 -191 763
Bulgaria -578 228 -364 592
Belgium -591 334 -383 717
Poland -648 32 -72 104
Spain -842 484 -3 487
Czech Rep. -1.449 134 -68 202
France -1.735 -77 -615 539
Ukraine -2.326 187 -608 794
Iran -2.431 3.516 -221 3.737
Japan -2.805 19 -41 60
Italy -3.749 1.166 -250 1.416
USA -4.729 1.657 58 1.600
India -4.963 1.349 64 1.285
South
Korea-6.489 589 98 491
Germany -7.926 -704 -1.721 1.017
Russia -16.807 2.539 -2.350 4.888
China -22.450 -392 -446 53
Countries
Net Export
Value
(Million
Dollars)
Export Raw
Export
Value
(Million
Dollars)
Import
Raw
Import
Value
(Million
Dollars)
Net Import
Change
Speed (%) Countries
Net Export Value
(Million
Dollars)
Net Export
Change (Million
Dollars)
Export
Contribution
(Million Dollars
Import Contribution
(Million Dollars
two sets, 28 sections that are imported and exported the most are determined. As a result, Turkey’s 2015 net export is reviewed and evaluated in detail in the frame of 28 leading foreign trade sections.
Turkey is Net Exporter in 10 Sections AgainTurkey has the position of net exporter in 10 sec-
tions out of 28 foreign trade sections determined as of 2015. Turkey became net exporter in 10 sections out of 28 foreign trade sets formed in 2014. There is one change of product between 10 sections in which Turkey was net exporter in 2014 and 10 sections in which Turkey was next exporter in 2015. While gemstones are included in 2015, motor land vehicles are excluded. The section that provided the
Iraq 8.261 3 8.558 57 297 -22,2
England 5.024 2 10.565 12 5.541 26,5
Switzerland 3.230 7 5.676 19 2.446 -300,2
UAE 2.673 9 4.681 23 2.009 90,5
Egypt 1.913 14 3.129 34 1.216 2,7
Azerbaijan 1.667 20 1.900 66 232 -35,5
S. Arabia 1.358 12 3.476 22 2.117 93
Israel 1.026 16 2.699 28 1.673 1373,3
Holland 242 13 3.157 17 2.914 -514,2
Romania 217 15 2.817 18 2.600 -161
Bulgaria -578 23 1.677 20 2.254 -28,3
Belgium -591 17 2.556 14 3.147 -36,1
Poland -648 19 2.330 16 2.978 -4,8
Spain -842 8 4.746 11 5.589 -36,5
Czech Rep. -1.449 37 769 21 2.218 -8,5
France -1.735 6 5.849 7 7.584 4,6
Ukraine -2.326 29 1.122 13 3.448 -7,4
Iran -2.431 10 3.665 9 6.096 -59,1
Japan -2.805 64 335 15 3.140 -0,7
Italy -3.749 4 6.891 5 10.640 -23,7
USA -4.729 5 6.399 4 11.128 -26
India -4.963 42 650 10 5.613 -21,4
South
Korea-6.489 43 569 8 7.057 -8,3
Germany -7.926 1 13.426 2 21.352 9,7
Russia -16.807 11 3.593 3 20.400 -13,1
China -22.450 18 2.415 1 24.865 1,8

122
›
5NET EXPORT
highest net export in 2015 was knitwear with 8,08 billion dollars. Gemstones rose to second place. Woven ware was third, fruit and nuts fourth and iron and steel ware was fifth.Excluding gemstones, vegetables and fruit sections from net exported sections in 2014, export size of other 8 sections decreased. Decreases in sections change between 8 to 14%. Total net export of sections that were net export in
2015 went up to 34,8 billion dollars with an increase of %5,2 compared to 2014. Increase of net export occurred mostly due to higher declines in import and gold export.
Deficit Decreased %18,5 in 18 Sections18 sections that were net exports in 2015 were determined and the number remained same with 2014. Total net import or deficit in these sections
61 Knitwear and accessories 8.075 4 8.935 33 860 -10,9
71 Gemstones or semiprecious stones 7.080 3 11.264 10 4.184 46
62 Unwoven ware and accessory 4.130 7 5.921 24 1.791 -5
8 Fruits and nuts 3.893 11 4.358 51 465 0,7
73 Iron or steel ware 2.729 8 5.471 14 2.742 -13,9
20 Fruits and vegetables 2.073 15 2.188 78 114 4,7
57 Carpets 1.906 17 2.010 81 103 -14,4
25 Mineral products 1.862 14 2.254 55 392 -11,5
63 Ready-to-wear goods made of wovable materials 1.704 18 1.901 69 196 -5
94 Furniture 1.379 12 2.755 28 1.376 -7,3
87 Motor land vehicles -79 1 17.465 4 17.544 -3,3
40 Rubber and rubber ware -359 16 2.166 16 2.525 -16,6
54 Synthetic and artificial filaments -532 20 1.565 18 2.097 -11,7
52 Cotton, cotton thread and cotton fabric -561 19 1.704 17 2.265 -9,1
55 Synthetic and artificial discontinuous fibers -618 23 1.348 20 1.966 -7,4
76 Aluminum and aluminum ware -962 13 2.371 12 3.334 -6,9
48 Paper, paperboard and paper ware -1.498 26 1.186 15 2.684 -1,5
38 Various chemical substances -1.503 51 546 19 2.049 -7,9
74 Copper and copper ware -1.817 28 1.170 13 2.986 -18,1
88 Aircrafts components and parts -3.141 44 689 11 3.830 15,6
30 Pharmaceutical products -3.418 36 879 9 4.296 9,1
90 Optic, photography, cinema and measuring
devices
-3.896 40 725 8 4.621 1,2
29 Organic chemical products -4.241 54 474 7 4.716 -11,3
39 Plastic and plastic products -6.897 9 5.371 6 12.268 -11,9
72 Iron and steel -8.212 6 6.563 5 14.775 -29
85 Electrical machinery and devices -9.349 5 8.291 3 17.639 -14,5
84 Machinery -13.206 2 12.344 2 25.550 -9,2
27 Mineral fuels and mineral oils -33.323 10 4.519 1 37.843 -26,1
CODES SECTIONS
Net Export
Value
(Million Dollars)
Export OrderExport Value
(Million Dollars)Import Order
Import Value
(Million Dollars)
Net Export Rate
Of Change(%)
SOURCE: CALCULATED FROM DATA OF TUIK (TURKISH STATISTICAL INSTITUTION)
TABLE.3 SECTIONS AND NET EXPORT 2015

123ECONOMY AND FOREIGN TRADE REPORT 2016
61 Knitwear and accessories 8.075 -964 -1.089 125
71 Gemstones or semiprecious stones 7.080 7.484 3.547 3.937
62 Unwoven ware and accessory 4.130 -220 -312 92
8 Fruits and nuts 3.893 -18 30 -49
73 Iron or steel ware 2.729 -1.009 -885 -125
20 Fruits and vegetables 2.073 82 98 -16
57 Carpets 1.906 -267 -338 71
25 Mineral products 1.862 -261 -294 33
63 Ready-to-wear goods made of wovable materials 1.704 -329 -327 -2
94 Furniture 1.379 -3 -216 213
87 Motor land vehicles -79 -2.406 -598 -1.808
40 Rubber and rubber ware -359 -100 -431 331
54 Synthetic and artificial filaments -532 57 -207 264
52 Cotton, cotton thread and cotton fabric -561 586 -171 757
55 Synthetic and artificial discontinuous fibers -618 90 -108 198
76 Aluminum and aluminum ware -962 -9 -176 166
48 Paper, paperboard and paper ware -1.498 469 -18 487
38 Various chemical substances -1.503 180 -47 227
74 Copper and copper ware -1.817 326 -258 584
88 Aircrafts components and parts -3.141 -715 93 -808
30 Pharmaceutical products -3.418 205 73 132
90 Optic, photography, cinema and measuring
devices
-3.896 266 9 257
29 Organic chemical products -4.241 1.058 -60 1.118
39 Plastic and plastic products -6.897 1.156 -726 1.883
72 Iron and steel -8.212 120 -2.681 2.801
85 Electrical machinery and devices -9.349 -1.092 -1.401 309
84 Machinery -13.206 1.307 -1.247 2.554
27 Mineral fuels and mineral oils -33.323 15.454 -1.592 17.047
CODES SECTIONSNet Export Value
(Million Dollars)
Net Export Change
(Million Dollars)
Export Contribution
(Million Dollars)
Import Contribution
(Million Dollars)
SOURCE: CALCULATED FROM DATA OF TUIK (TURKISH STATISTICAL INSTITUTION)*IMPORT INCREASE IS WRITTEN AS (-), IMPORT DECREASE IS WRITTEN AS (+)
TABLE.4 CONTRIBUTION OF EXPORT AND IMPORT IN NET EXPORT IN THE SECTIONS 2015
decreased by %18,5 compared to 2014 and was reduced from 114,8 billion dollars to 93,6 billion dol-lars. Decreases in import were mostly effective in decline of net import.18 sections that were net exports in 2015 are the same with 16 sections in 2014. While motor land vehicles and synthetic and artificial discontinuous fibers were added in 2015, gemstones and cereal
products were excluded. While deficit increased in 6 sections out of 18 sections which had deficit or were net imports in 2015, the deficit went down in 12 sections. The section where the deficit in 2015 went down the most among sections which were net imports were mineral oils and fuels which include petrol and natural gas with %31,7 and approximate-ly 15,5 billion dollars.

124
›
5NET EXPORT
61 Knitwear and accessories 8.075 24 2
71 Gemstones or semiprecious stones 7.080 17 9
62 Unwoven ware and accessory 4.130 23 3
8 Fruits and nuts 3.893 24 2
73 Iron or steel ware 2.729 18 8
20 Fruits and vegetables 2.073 26 0
57 Carpets 1.906 25 1
25 Mineral products 1.862 22 4
63 Ready-to-wear goods made of wovable materials 1.704 23 3
94 Furniture 1.379 18 8
87 Motor land vehicles -79 16 10
40 Rubber and rubber ware -359 16 10
54 Synthetic and artificial filaments -532 19 7
52 Cotton, cotton thread and cotton fabric -561 21 5
55 Synthetic and artificial discontinuous fibers -618 17 9
76 Aluminum and aluminum ware -962 17 9
48 Paper, paperboard and paper ware -1.498 11 15
38 Various chemical substances -1.503 9 17
74 Copper and copper ware -1.817 13 13
88 Aircrafts components and parts -3.141 13 13
30 Pharmaceutical products -3.418 11 15
90 Optic, photography, cinema and measuring devices -3.896 7 19
29 Organic chemical products -4.241 5 21
39 Plastic and plastic products -6.897 9 17
72 Iron and steel -8.212 9 17
85 Electrical machinery and devices -9.349 13 13
84 Machinery -13.206 11 15
27 Mineral fuels and mineral oils -33.323 11 15
CODES SECTIONS Net Export Value (Million $)Number of Countries We
had Surplus to
Number of Countries We had
Deficit to
SOURCE: CALCULATED FROM DATA OF TUIK (TURKISH STATISTICAL INSTITUTION)
TABLE.5 NUMBER OF COUNTRIES WE HAD NET SURPLUS AND DEFICIT IN TERMS OF SELECTED SECTIONS 2015
With net export analysis on the basis of countries and sec-tions, in which countries Turkey is net exporter or importer in sections basis and in which sections Turkey is net export-
er or importer in countries basis are presented. According to this, net export matrix that includes 26 countries and 28 sections was prepared.
V.3 NET EXPORT ANALYSIS IN THE CONTEXT OF COUNTRIES AND SECTIONS

125ECONOMY AND FOREIGN TRADE REPORT 2016
V.3.1. Evaluation of Countries on Sections BasisThere are 5 important results in evaluation of countries on sec-tions basis.1. Surpluses and deficits against countries in sections basis in 2015 remained nearly the same with 2014 and this development reflects the stability of product-market diversifying in foreign trade.2. Main factors affecting surpluses and deficits against countries in sections basis in 2015 were sharp declines in energy, metal and com-modity prices and problems experiences with important markets. 3. Turkey continued to have surplus in 2015 to numerous coun-tries in the sections which it is net exporter. This reflects diversi-fying of sections where Turkey is net exporter and preserving of
competitive power. 4. In the 6 sections among the sections where Turkey is net im-porter, the number of countries where Turkey is net exporter is more than the number of countries it is net importer; the number is the same in 3 sections. Turkey shows in these sections that it is also a significant producer and exporter.5. The number of countries where Turkey is net importer is more in 9 sections where it is net importer. These sections are the products which Turkey highly imports and is foreign-dependent in terms of technology and resource. These sections are; miner-al fuels and oils, machinery, iron-steel, plastic and plastic prod-ucts, organic chemical products, precision-optic-measurement and medical devices, pharmaceutical products, various chemi-cals, paper and paperboard products.
V.3.2. Evaluation of Sections on Country BasisThere are 6 results in evaluation of sections on countries basis.1. The number of sections where surplus is had is high in 10 countries where Turkey is net exporter. In this regard, in order for Turkey to be net exporter against countries, the necessity emerges that Turkey becomes net exporter in majority of the products. Turkey can be net exporter in the countries where it is a net exporter not with a few sections but product diversity.2. Turkey is net exporter in 21 sections to England for which it is a net exporter. Among other European Union countries, England constitutes a favorable trade partner-target.
3. There are 16 countries for which Turkey is net importer. The number of sections that have surplus in 8 countries out of this 16 is higher than the number of sections that have deficit. The number of sections that have deficit is higher only in 5 countries.4. Iran and Russia are two countries for which Turkey is highly net exporter but these countries also have the sections that have the highest surplus with numbers of 23 and 19. In spite of petrol and natural gas import, Turkey is net exporter in numer-ous sections to keep the trade balanced. However, political problems might reduce the number of surplus to these coun-tries.5. While Turkey is net importer against countries such as Ger-many, France, Belgium and Poland, the number of sections where it is net exporter is higher. In countries whose produc-tion pattern are similar such as Spain and Italy, the number sections where Turkey is net importer is higher. It is a success to have evened out the number of sections having surplus and deficit to USA.6. The number of sections where Turkey is net exporter is sub-stantially limited against countries such as China, South Korea and India for which Turkey is highly net importer. The export made to these countries is considerably below the potential. In terms import, Turkey became high exporter in almost all sec-tors. For a more balanced trade with these 3 countries, it is vital to be net exporter in more sections. SOURCE: CALCULATED FROM DATA OF TUIK (TURKISH STATISTICAL INSTITUTION)
Iraq 8.261 28 0
England 5.024 21 7
Switzerland 3.230 16 12
UAE 2.673 24 4
Egypt 1.913 21 7
Azerbaijan 1.667 23 5
S. Arabia 1.358 25 3
Israel 1.026 22 6
Holland 242 20 8
Romania 217 20 8
Bulgaria -578 22 6
Belgium -591 15 13
Poland -648 17 11
Spain -842 14 14
Czech Rep. -1.449 13 15
France -1.735 15 13
Ukraine -2.326 21 7
Iran -2.431 23 5
Japan -2.805 9 19
Italy -3.749 14 14
USA -4.729 14 14
India -4.963 5 23
South Korea -6.489 10 18
Germany -7.926 15 13
Russia -16.807 19 9
China -22,450 4 24
Countries Net Export Value (Million Dollars)
Number of Sections We had
Surplus
Number of Sections We had
Deficit
TABLE.6 NUMBER OF SECTIONS WE HAD SURPLUS AND DEFICIT IN TERMS OF COUNTRIES 2015

126
›
5NET EXPORT
CODE SECTIONS IRQ ENG SWI UAE EGY AZE SA ISR HOL ROM BUL BEL POL
61 Knitwear and accessories 440 1.453 58 67 33 23 111 66 391 248 31 202 253
71 Gemstones or semiprecious stones 251 1.258 4.159 428 2 25 8 59 9 -64 -16 -27 16
62 Unwoven ware and accessory 259 626 20 69 -41 16 130 156 306 186 3 83 157
8 Fruits and nuts 282 208 112 35 42 13 75 19 126 40 17 63 165
73 Iron or steel ware 470 345 -8 60 143 148 129 79 60 171 43 32 23
20 Fruits and vegetables 159 93 28 13 12 12 34 9 130 21 21 74 22
57 Carpets 181 76 5 71 72 15 388 35 3 22 7 15 26
25 Mineral products 32 -10 1 9 16 8 15 30 14 15 1 13 9
63 Ready-to-wear goods made of wovable materials 42 89 33 14 16 14 37 28 102 17 14 18 29
94 Furniture 482 63 8 88 29 130 196 39 42 16 -1 26 -48
87 Motor land vehicles 103 1.553 115 53 139 68 141 464 104 -239 106 673 -356
40 Rubber and rubber ware 29 24 12 20 44 19 53 13 4 -77 58 12 -26
54 Synthetic and artificial filaments 14 87 -13 -4 -12 5 20 2 81 57 39 122 43
52 Cotton, cotton thread and cotton fabric 0 28 4 1 -63 -8 3 4 15 46 35 12 80
55 Synthetic and artificial discontinuous fibers 6 56 0 -1 -39 1 12 4 16 43 47 -5 26
76 Aluminum and aluminum ware 123 93 55 -175 57 -8 -189 36 38 11 63 6 69
48 Paper, paperboard and paper ware 76 97 -17 12 67 38 17 48 -53 18 24 -11 -67
38 Various chemical substances 39 -88 -38 14 -23 26 20 -1 -33 8 3 -104 -2
74 Copper and copper ware 10 54 12 9 -15 -6 6 25 7 54 -248 -12 -38
88 Aircrafts components and parts 0 7 0 2 0 0 12 -1 8 0 0 -1 1
30 Pharmaceutical products 55 -287 -356 5 4 32 9 -30 -67 7 2 -157 -6
90 Optic, photography, cinema and measuring devices 28 -132 -118 10 8 35 31 -46 -40 -3 -3 -5 -44
29 Organic chemical products 3 -184 -89 3 1 -16 -368 -65 -226 -7 2 -148 -13
39 Plastic and plastic products 480 33 -38 -100 -188 112 -1.241 31 -347 116 91 -611 19
72 Iron and steel 445 -1.026 -17 581 452 59 131 297 -326 -273 5 -566 14
85 Electrical machinery and devices 473 869 -21 131 102 147 417 120 49 -61 -112 37 -270
84 Machinery 370 -567 -406 171 223 195 268 64 -91 107 69 -133 -572
27 Mineral fuels and mineral oils 28 57 47 574 594 -3 143 -883 61 -217 -588 -66 -7
Other Sections 3.382 148 -316 511 237 568 750 424 -141 -45 -291 -133 -153
TOTAL 8.261 5.024 3.230 2.673 1.913 1.667 1.358 1.026 242 217 -578 -591 -648 -1.613
TABLE.7 COUNTRY-SECTIONS NET EXPORT MATRIX 2015 MILLION DOLLARS

127ECONOMY AND FOREIGN TRADE REPORT 2016
CODE SECTIONS IRQ ENG SWI UAE EGY AZE SA ISR HOL ROM BUL BEL POL
61 Knitwear and accessories 440 1.453 58 67 33 23 111 66 391 248 31 202 253
71 Gemstones or semiprecious stones 251 1.258 4.159 428 2 25 8 59 9 -64 -16 -27 16
62 Unwoven ware and accessory 259 626 20 69 -41 16 130 156 306 186 3 83 157
8 Fruits and nuts 282 208 112 35 42 13 75 19 126 40 17 63 165
73 Iron or steel ware 470 345 -8 60 143 148 129 79 60 171 43 32 23
20 Fruits and vegetables 159 93 28 13 12 12 34 9 130 21 21 74 22
57 Carpets 181 76 5 71 72 15 388 35 3 22 7 15 26
25 Mineral products 32 -10 1 9 16 8 15 30 14 15 1 13 9
63 Ready-to-wear goods made of wovable materials 42 89 33 14 16 14 37 28 102 17 14 18 29
94 Furniture 482 63 8 88 29 130 196 39 42 16 -1 26 -48
87 Motor land vehicles 103 1.553 115 53 139 68 141 464 104 -239 106 673 -356
40 Rubber and rubber ware 29 24 12 20 44 19 53 13 4 -77 58 12 -26
54 Synthetic and artificial filaments 14 87 -13 -4 -12 5 20 2 81 57 39 122 43
52 Cotton, cotton thread and cotton fabric 0 28 4 1 -63 -8 3 4 15 46 35 12 80
55 Synthetic and artificial discontinuous fibers 6 56 0 -1 -39 1 12 4 16 43 47 -5 26
76 Aluminum and aluminum ware 123 93 55 -175 57 -8 -189 36 38 11 63 6 69
48 Paper, paperboard and paper ware 76 97 -17 12 67 38 17 48 -53 18 24 -11 -67
38 Various chemical substances 39 -88 -38 14 -23 26 20 -1 -33 8 3 -104 -2
74 Copper and copper ware 10 54 12 9 -15 -6 6 25 7 54 -248 -12 -38
88 Aircrafts components and parts 0 7 0 2 0 0 12 -1 8 0 0 -1 1
30 Pharmaceutical products 55 -287 -356 5 4 32 9 -30 -67 7 2 -157 -6
90 Optic, photography, cinema and measuring devices 28 -132 -118 10 8 35 31 -46 -40 -3 -3 -5 -44
29 Organic chemical products 3 -184 -89 3 1 -16 -368 -65 -226 -7 2 -148 -13
39 Plastic and plastic products 480 33 -38 -100 -188 112 -1.241 31 -347 116 91 -611 19
72 Iron and steel 445 -1.026 -17 581 452 59 131 297 -326 -273 5 -566 14
85 Electrical machinery and devices 473 869 -21 131 102 147 417 120 49 -61 -112 37 -270
84 Machinery 370 -567 -406 171 223 195 268 64 -91 107 69 -133 -572
27 Mineral fuels and mineral oils 28 57 47 574 594 -3 143 -883 61 -217 -588 -66 -7
Other Sections 3.382 148 -316 511 237 568 750 424 -141 -45 -291 -133 -153
TOTAL 8.261 5.024 3.230 2.673 1.913 1.667 1.358 1.026 242 217 -578 -591 -648 -1.613
SPA CZE FRA UKR IRA JAP ITA USA IND SKR GER RUS CHI OTH TOTAL
730 24 460 165 71 12 280 146 -32 4 1.876 76 -205 1.090 8.075
-47 12 4 13 890 5 -163 104 111 -1 -139 -7 -114 305 7.080
837 51 252 105 36 7 91 115 -59 5 782 81 -507 364 4.130
38 15 321 82 17 21 643 -22 -4 2 448 599 30 508 3.893
-2 -3 53 12 89 -75 -173 187 -39 -129 114 85 -768 1.684 2.729
29 12 88 11 8 23 71 117 1 9 668 19 15 373 2.073
9 9 16 9 9 12 22 271 -16 0 115 23 6 505 1.906
36 0 0 -11 -5 6 65 74 78 9 12 51 813 580 1.862
38 12 146 12 17 2 74 216 -9 -1 465 24 -81 336 1.704
1 -10 90 7 46 -5 -67 68 -10 -25 73 40 -668 770 1.379
-693 -633 747 42 87 -456 634 402 -494 -648 -3.694 209 -654 2.146 -79
26 -24 -29 7 32 -124 -4 5 -47 -162 178 -32 -128 -242 -359
15 4 6 31 57 -7 3 73 -352 -162 18 85 -523 -221 -532
60 12 41 42 22 3 162 -499 -55 6 112 32 -105 -550 -561
55 -1 14 12 114 -29 68 57 -227 -23 -136 89 -185 -593 -618
69 24 77 3 4 -9 47 -14 -135 -17 154 -844 -155 -346 -962
-66 -8 -48 3 65 -5 -152 -237 -3 -50 -380 -130 -269 -467 -1.498
-68 -2 -231 6 22 -34 -166 -161 -30 -16 -439 10 -136 -79 -1.503
-219 14 -28 -32 -176 -6 134 29 7 -5 16 -155 -30 -1.226 -1.817
-132 0 -1.071 0 0 -1 -17 -1.418 2 12 -481 -1 0 -63 -3.141
-140 -1 -374 5 25 -26 -274 -556 -35 6 -746 26 -42 -496 -3.418
-57 -66 -208 -1 19 -226 -255 -701 -43 -358 -768 8 -549 -411 -3.896
-254 -4 -175 -1 -80 -43 11 -331 -279 -359 -369 -162 -735 -353 -4.241
-340 -45 -383 58 -278 -108 -471 -347 -212 -1.156 -1.059 71 -865 -117 -6.897
-237 -41 -496 -1.604 33 -195 -249 -133 -125 -886 -516 -2.712 -1.314 488 -8.212
-216 -222 73 29 155 -270 -321 -426 -165 -1.484 -744 107 -6.924 -820 -9.349
-90 -441 -625 54 411 -1.196 -2.300 -544 -343 -723 -2.456 293 -5.102 158 -13.206
18 0 -45 -9 -4.898 -1 -950 -641 -1.783 3 19 -12.875 -25 -11.878 -33.323
-242 -137 -413 -1.375 777 -82 -492 -562 -663 -340 -1.051 -1.816 -3.228 192 -4.488
-842 -1.449 -1.735 -2.326 -2.431 -2.805 -3.749 -4.729 -4.963 -6.489 -7.926 -16.807 -22.450 -8.362 -63.268


FOREIGN TRADE POLICY OF TURKEY6

6FOREIGN TRADE POLICY OF TURKEY
130
› SECTION VI. FOREIGN TRADE POLICY OF TURKEY
VI. 1 GENERAL EVALUATION
These are primary objectives of Turkey’s foreign trade po-licy in recent years; to increase foreign trade volume with third countries and to form balanced trade relations. To increase the share in close and contiguous markets, to reach new markets, to raise average unit export price by exporting products with higher added value. Replacement with in-country production in import and to take protective measures against preventing unfair competition in import.Turkey’s foreign trade regime is applied in accordance with
European Union’s foreign trade regime due to Customs uni-on made with European Union. Obligation to be in compli-ance with European Union foreign trade regime brings rest-rictions on Turkey’s foreign trade policy.There is a close relation between Turkey’s foreign policy and foreign trade policy. While Turkey aims to improve dual relations in its region, recent geopolitical developments in the region have started to block the trade between Turkey and regional countries.
Customs Union’s Effect of Expanding the Mutual Trade with European Union is ProtectedCustoms Union that Turkey ensured with European Union shapes Turkey’s foreign policy at a significant extent. The first and direct effect of Customs Union is revealed in the mutual trade made with the European Union.Within the frame of this direct effect, Customs Union’s effect of expanding the mutual trade between European Union and Turkey is being protected. Hence, both trade increases absolutely and share of Turkey’s export and import with UN in its total export and import goes up again.There are three effective factors on this matter. The first one
is that it started to overcome economic problems it had as a result of global crisis in 2008, its economy is growing and its import out of UN starts to increase again. The second one is problems and declines in Turkey’s trade with close and contiguous countries. The third one is that trade capacities of energy-dependent countries such as especially Russia and Gulf countries that conduct a high trade went down with the decline in petrol prices. In relation to these, the share of foreign trade volume with European Union in Turkey’s foreign trade has been on the increase since 2013. The share of Turkey’s trade with UN in its total trade was reduced down to %36,9 in 2012. In the last three years, this rate went up gradually and became %40,6 in 2015.
TABLE.1 FOREIGN TRADE WITH EUROPEAN UNION
SOURCE: TURKISH STATISTICAL INSTITUTION
VI. 2 CUSTOMS UNION WITH UN AND FOREIGN TRADE
2005 73,48 41,53 56,5 117,77 52,78 44,8 191,25 94,31 49,3
2006 85,53 48,15 56,3 139,58 59,45 42,6 225,11 107,6 47,8
2007 107,27 60,75 56,6 170,06 68,47 40,3 277,33 129,22 46,6
2008 132,03 63,72 48,3 201,96 74,51 36,9 333,99 138,23 41,4
2009 101,14 47,23 46,7 140,93 56,62 40,2 242,07 103,85 42,9
2010 113,88 52,93 46,5 185,54 72,39 39 299,42 125,32 41,9
2011 134,91 62,59 46,4 240,84 91,44 38 375,75 154,03 41
2012 162,46 59,40 36,6 236,55 87,66 37,1 399,01 147,06 36,9
2013 151,80 63,04 41,5 251,66 92,46 36,7 403,46 155,5 38,5
2014 157,62 68,52 43,5 242,18 88,78 36,7 399,80 157,3 39,3
2015 143,94 64,03 44,5 207,2 78,67 38 351,14 142,7 40,6
YEARS
TURKEY
EXPORT
(BILLION
DOLLARS)
EXPORT TO
UN
(BILLION
DOLLARS)
SHARE OF
EXPORT TO
UN (%)
TURKEY
IMPORT
(BILLION
DOLLARS)
IMPORT
FROM UN
(BILLION
DOLLARS)
SHARE OF
IMPORT
FROM UN (%)
TURKEY FOR-
EIGN TRADE
(BILLION
DOLLARS)
FOREIGN
TRADE WITH
UN (BILLION
DOLLARS)
SHARE OF
TRADE WITH
UN (%)
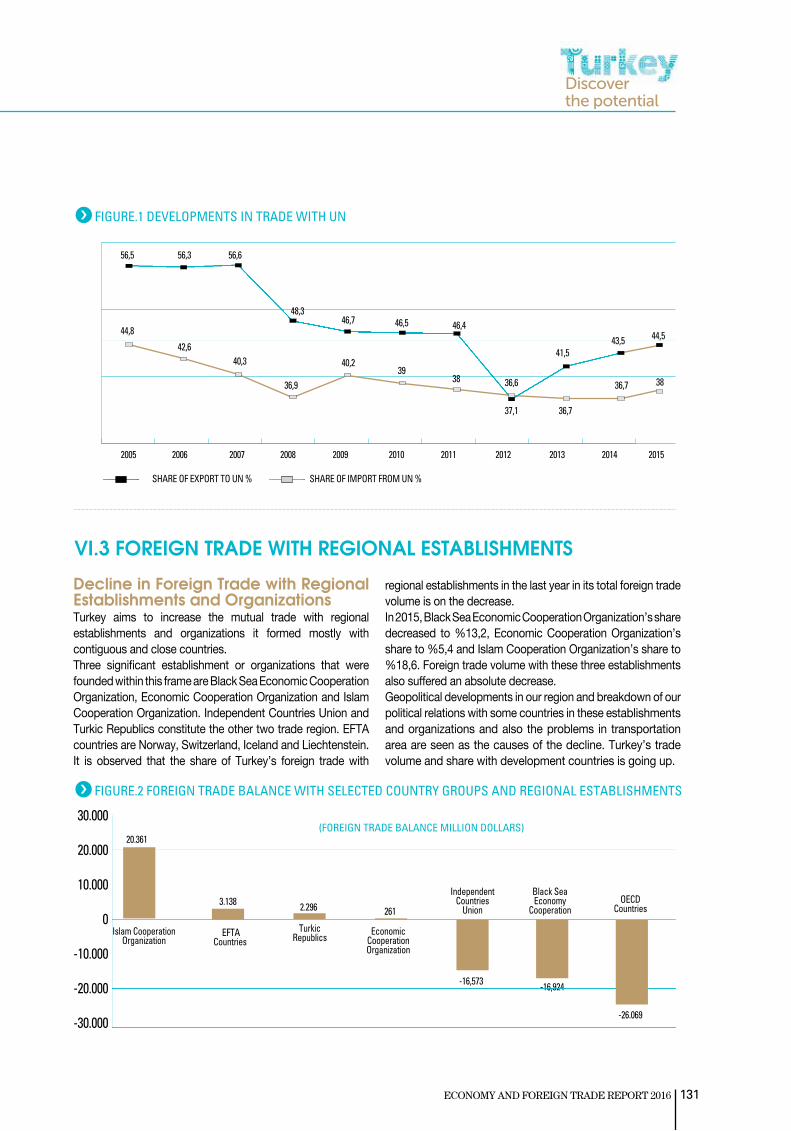
ECONOMY AND FOREIGN TRADE REPORT 2016 131
Decline in Foreign Trade with Regional Establishments and OrganizationsTurkey aims to increase the mutual trade with regional establishments and organizations it formed mostly with contiguous and close countries.Three significant establishment or organizations that were founded within this frame are Black Sea Economic Cooperation Organization, Economic Cooperation Organization and Islam Cooperation Organization. Independent Countries Union and Turkic Republics constitute the other two trade region. EFTA countries are Norway, Switzerland, Iceland and Liechtenstein. It is observed that the share of Turkey’s foreign trade with
regional establishments in the last year in its total foreign trade volume is on the decrease. In 2015, Black Sea Economic Cooperation Organization’s share decreased to %13,2, Economic Cooperation Organization’s share to %5,4 and Islam Cooperation Organization’s share to %18,6. Foreign trade volume with these three establishments also suffered an absolute decrease.Geopolitical developments in our region and breakdown of our political relations with some countries in these establishments and organizations and also the problems in transportation area are seen as the causes of the decline. Turkey’s trade volume and share with development countries is going up.
FIGURE.1 DEVELOPMENTS IN TRADE WITH UN
VI.3 FOREIGN TRADE WITH REGIONAL ESTABLISHMENTS
2005 20072006 2008 2009 2010 2011 2012 2013 2014 2015
SHARE OF EXPORT TO UN % SHARE OF IMPORT FROM UN %
FIGURE.2 FOREIGN TRADE BALANCE WITH SELECTED COUNTRY GROUPS AND REGIONAL ESTABLISHMENTS
(FOREIGN TRADE BALANCE MILLION DOLLARS)30.000
20.000
10.000
0
-10.000
-20.000
-30.000
20.361
Islam Cooperation Organization
EFTA Countries
Turkic Republics
Economic Cooperation Organization
Independent Countries
Union
Black SeaEconomy
CooperationOECD
Countries3.138 2.296 261
-16,573 -16,924
-26.069
56,5 56,3 56,6
48,346,7 46,5 46,4
36,6
41,543,5 44,5
36,7 38
36,737,1
3839
40,2
36,9
40,342,6
44,8

132
›
6FOREIGN TRADE POLICY OF TURKEY
TABLE.2 FOREIGN TRADE WITH SELECTED COUNTRY GROUPS AND REGIONAL ESTABLISHMENTS
SOURCE: TURKISH STATISTICAL INSTITUTION
2013 2014 2015
1-OECD Countries 68.684 76.680 75.408
2-EFTA Countries 1.662 3.795 6.203
3-Black Sea Economy Cooperation 20.368 19.688 14.600
4-Economic Cooperation Organization 11.898 11.718 9.572
5-Independent Countries Union 16.924 15.618 10.578
6-Turkic Republics 6.908 7.109 5.293
7-Islam Cooperation Organization 49.371 48.629 42.768
1-OECD Countries 124.207 116.518 101.477
2-EFTA Countries 10.652 5.717 3.138
3-Black Sea Economy Cooperation 41.271 40.927 31.524
4-Economic Cooperation Organization 14.802 13.443 9.311
5-Independent Countries Union 34.000 33.085 27.151
6-Turkic Republics 3.600 2. 997 2.688
7-Islam Cooperation Organization 32.074 29. 107 22.407
1-OECD Countries -55.523 -39.838 -26.069
2-EFTA Countries -8.990 -1.922 3.065
3-Black Sea Economy Cooperation -20.903 -21.239 -16.924
4-Economic Cooperation Organization -2.904 -1.725 261
5-Independent Countries Union -17076 -17.467 -16.573
6-Turkic Republics 3.308 4.112 2.296
7-Islam Cooperation Organization 17.297 19.522 20.361
1-OECD Countries 192.891 193.198 176.885
2-EFTA Countries 12.314 9.512 9.341
3-Black Sea Economy Cooperation 61.639 60.615 46.124
4-Economic Cooperation Organization 26.700 25.161 18.883
5-Independent Countries Union 50.924 48.703 37.729
6-Turkic Republics 10.508 10.106 7.981
7-Islam Cooperation Organization 81.445 77.736 65.175
1-OECD Countries 47,8 48,3 50,4
2-EFTA Countries 3,1 2,4 2,7
3-Black Sea Economy Cooperation 15,3 15,2 13,2
4-Economic Cooperation Organization 6,6 6,3 5,4
5-Independent Countries Union 12,6 12,2 10,7
6-Turkic Republics 2,6 2,5 2,3
7-Islam Cooperation Organization 20,2 19,4 18,6
EXPORT TO SELECTED COUNTRY GROUPS (MILLION DOLLARS)
IMPORT FROM SELECTED COUNTRIES (MILLION DOLLARS)
BALANCE OF FOREIGN TRADE WITH SELECTED COUNTRY GROUPS (MILLION DOLLARS)
VOLUME OF FOREIGN TRADE WITH SELECTED COUNTRY GROUPS (MILLION DOLLARS)
SHARE OF FOREIGN TRADE WITH SELECTED COUNTRY GROUPS IN OUR TOTAL FOREIGN TRADE VOLUME (%)

133ECONOMY AND FOREIGN TRADE REPORT 2016
TABLE.3 FOREIGN TRADE WITH COUNTRIES OF FREE TRADE AGREEMENT 2015
TABLE.4 SHARE OF FOREIGN TRADE WITH COUNTRIES OF FREE TRADE AGREEMENT IN OUR FOREIGN TRADE TOTAL 2015
SOURCE: TURKISH STATISTICAL INSTITUTION
Foreign Trade Volume within STA (Free Trade Agreement) is yet Limited Free Trade Agreements that Turkey signed with third countries has an important place in foreign trade policy and foreign trade regime. Turkey still applies free trade agreement with 17 countries and EFTA countries and improves its mutual trade within these agreements. Newly signed STA with Malesia took effect in 2015. While export to countries we apply STA has increased as of
VI 4. FREE TRADE AGREEMENTS AND FOREIGN TRADE EFFECT
COUNTRIES
EXPORT
(MILLION
DOLLARS)
IMPORT
(MILLION
DOLLARS)
FOREIGN
TRADE
(MILLION
DOLLARS)
TRADE
BALANCE
(MILLION
DOLLARS)
ALBANIA 287 50 337 237
BOSNIA HERZEGOVINA 293 250 543 43
EFTA* 6.204 3.139 9.343 3.065
MOROCCO 1.338 711 2.049 627
PALESTINE 82 2 84 80
SOUTH KOREA 569 7.057 7.626 -6.488
GEORGIA 1.109 223 1.332 886
MONTENEGRO 38 8 46 30
MACEDONIA 325 81 406 244
MORITIUS 34 7 41 27
EGYPT 3.129 1.216 4.345 1.913
SYRIA 1.525 52 1.577 1.473
SERBIA 493 238 731 255
TUNISIA 820 144 964 676
JORDAN 836 128 964 708
ISRAEL 2.699 1.673 4.372 1.026
CHILE 188 283 471 -95
MALEZIA 357 1.339 1.696 -982
FIGURE.3 FOREIGN TRADE BALANCE WITH COUNTRIES WITH WHOM STA MADE 2015
*SWITZERLAND, ICELAND, NORWAY, LIECHTENSTEIN
FOREIGN TRADE BALANCE MILLION DOLLARS
2015 and reached 20,32 billion dollars, import decreased to 16,60 billion dollars; total trade volume declined by %3,2 and was reduced to 36,92 billion dollars.Turkey have foreign trade deficit to 3 countries in 2015 in foreign trade made with countries within STA. South Korea, Chile and Malesia are the countries Turkey had trade deficit in 2015. However, Turkey has surplus in trade with EFTA region and other countries. In total foreign trade with the countries with whom STA made, while Turkey had 1,62 billion dollars deficit in 2014, it had 3,73 billion dollars of surplus in 2015. However, this surplus resulted from the significant increase in gold export to Switzerland which is within EFTA countries.While share of the export we make to countries within STA was %12 in total export in 2014, it went up to %14,1 in 2015. Share of import was reduced from %8,2 to %8. Its share in total foreign trade increased from %9,5 to %10,5. When evaluated considering these data, it is observed that the volume of foreign trade within STA is still limited.Recently, European Union changed its foreign trade policy,
COUNTRIES
EXPORT
(MILLION
DOLLARS)
IMPORT
(MILLION
DOLLARS)
FOREIGN
TRADE
(MILLION
DOLLARS)
TRADE
BALANCE
(MILLION
DOLLARS)
TURKEY 143.935 207.203 351.138 -63.268
COUNTRIES OF
STA20.326 16.601 36.927 3.725
SHARE OF
COUNTRIES OF
STA
14,1 8 10,5 +5,9
-7,000 -6,000 -5,000 -4,000 -3,000 -2,000 -1,000 0 1,000 2,000 3,000
1.9131.864
SYRIAEGYPTEFTA*
-6.488 SOUTH KOREA-982
-9527304380237244255627676
7088861.026
MAURUTIUSMONTENEGRO
BOSNIA HERZEGOVINAPALESTINE
ALBANIAMACEDONIA
SERBIAMOROCCO
TUNISIAJORDANGEORGIA
ISRAEL
MALESIA
1,473
CHILE

6
134
›
canalized from multilateral negotiation and agreements to mutual negotiation and agreements; within this scope, it has started to make comprehensive new generation agreements with third countries such as liberalization in goods and service trade, public purchases, investments and intellectual property rights.Within this scope, Europe maintains negotiations for new generation agreements with USA, Canada, Malesia, Vietnam, Thailand, Japan and India. Negotiations with Singapore ended and the agreement is expected to be approved and take effect in 2016.The one with the highest effects among these agreements will be USA T-TIP negotiations. This agreement will have substantial effects in foreign trade of Turkey as well. While Turkey did not participate in negotiation process, initiatives to be a simultaneous partner to the agreement continued in 2015 as well. In accordance with Customs Union between Turkey and European Union, Turkey has the obligation to assume UN’s Common Commercial Policy and undertakes UN’s preferential trade system towards third countries. Within this frame, Turkey places similar contracts based on mutual benefit with the countries UN makes preferential commercial agreement with.Turkey is within inside approval
process of STA whose negotiations with Kosovo, Moldova, Faroe Islands and Lebanon were completed. It is also involved in abbreviated signature process of STA whose negotiations with Ghana were completed. Turkey completed signing phase of STA whose negotiations with Singapore were completed.Additionally, its STA negotiations with 12 countries/country groups (Peru, Ukraine, Colombia, Ecuador, Mexico, Japan, the Democratic Republic of Congo, Cameron, the Seychelles, Gulf Union Council, Libya and MERCOSUR) are in progress.Furthermore, Turkey also started initiatives of STA negotiations before 10 countries/country groups (USA, Canada, Thailand, India, Indonesia, Vietnam, Central America Commonwealth, Africa Caribbean Pacific Countries, Algeria and the Republic of South Africa).In May 2015, the first step to update Customs Union agreement that had been in effect since January 1st 1996 was taken in Brussel with singing of memorandum of understanding. With this update, it is aimed to include agriculture, services and public purchases sectors into the agreement, ensure Turkey automatically is a party of Free Trade Agreements that UN signed and will signed with third countries and involve Turkey in decision making mechanisms.
Ratio of Total Supports of Export to Export is still Low There are various support programs being applied by Ministry of Economy in order to support export. Furthermore, there are export refunds made in agriculture export. These two items constitute total export supports. Total export supports are evaluated by means of financial year budget commencement allowances data allocated to Ministry of Economy. Accordingly, export
supports are seen 922,2 million TL in 2013, 1.198,8 million TL in 2014 and 1.185,4 million TL in 2015.Total export supports are calculated in dollars as 482,8 million dollars in 2013, 550,3 million dollars in 2014 and 435,8 million dollars in 2015.While ratio of total export supports to export in 2013 was 0,32, this rate rose to 0,35 in 2014 and went down to 0,30 again in 2015. While ratio of total export supports to export declines, it also continues to remain low.
VI 5. SUPPORTS AND EFFECTS OF FOREIGN TRADE
2013 2014 2015
TOTAL EXPORT SUPPORTS MILLION DOLLARS 482.8 550.3 435.8
TOTAL EXPORT MILLION DOLLARS 151.803 157.620 143.935
SHARE OF EXPORT SUPPORTS % 0.32 0,35 0,30
TABLE.6 SHARE OF EXPORT SUPPORTS IN EXPORT
SOURCE: TURKISH STATISTICAL INSTITUTION
FIGURE.4 SHARE OF EXPORT SUPPORTS IN EXPORT
600
500
400
300
200
100
0
0,36
0,34
0,32
0,3
0,28
2,062013
EXPORT SUPPORT MILLION DOLLARS
RATIO OF SUPPORT TO EXPORT %
0,32
0,35
0,30
2014 2015
EXPORT SUPPORTS AND THEIR RATIO TO EXPORT
FOREIGN TRADE POLICY OF TURKEY

7EVALUATION FOR LONG TERM EXPORT GOALS

7EVALUATION FOR LONG TERM EXPORT GOALS
136
› SECTION VII. EVALUATION FOR LONG TERM EXPORT GOALS
Within Turkey’s strategy document for 2023, the primary target is to obtain %1,5 of World merchandise trade for 2023. The goal is set as 500 billion dollars in value basis.
2023 goals are evaluated in this section within the frame of propensities in global economy and trade and Turkey’s export operations in last three years.
There are 5 Propensities Effective in Shaping the Future in the Long RunOperations and predictions regarding Turkey’s 2023 goals are affected from global tendencies.Within this scope, current global macro tendencies complicate reaching long-term ambitious targets. Macro tendencies
that shape the future can be gathered under 5 topics. These are global economy, natural resources, innovation and technology, demography and consumer behaviors.Tendencies under these topics complicate Turkey’s reaching its ambitious targets but involve significant opportunities as well.
There are three obstacles arising with their own conditions before Turkey’s reaching its 2023 goals within these global tendencies. These are the gap in the area of innovation and technology, restriction of competition by in-country production competencies and regional political and economic instabilities. In addition to current global tendencies, a newly-generating
tendency that will be determinant in reaching 2023 goals is Industrial Revolution 4.0. Industrial Revolution 4.0 is expected to be shaped in line with individualized requirements and to re-organize value chain. It will be of utmost importance to follow and understand developments and trends regarding Industrial Revolution 4.0 for increase of export with high added value.
Performances of UN Countries and Energy and Commodity Exporter Countries are on the DeclineAfter tendencies and conditions that arose in global economy and trade caused a slow-down in growth of global merchandise trade in the last three years, a sharp decline took place in 2015. All of the countries were negatively affected from this sharp decline. However, when 2008-2015 period is evaluated on a medium-term
perspective, it is seen that there are different export performances among countries.Within this frame, it is necessary to evaluate export performances of the first 30 big exporter companies between years of 2008-2015 and the share they took from World export in 2008 and 2015. While these countries displayed different export performances between 2008-2015, they are affected from global conditions on different scales and felt determinant
FIGURE.1 LONG TERM GLOBAL MACRO TENDENCIES
SOURCE: AT KEARNEY
VII.1 GLOBAL PROPENSITIES AND THEIR EFFECTS ON TURKEY
VII.2 EXPORT PERFORMANCES OF COUNTRIES IN GLOBAL SCALE
GLOBAL ECONOMY NATURAL RESOURCES INNOVATION AND TECHNOLOGY DEMOGRAPHY CONSUMER BEHAVIOR
Concerns for Permanent and
Balanced Growth
Increasing environmental
problems and concerns
New paradigms in product design
and manufactureGlobal increase of population Increasing consumer variety
Inequality of income distribution Commitments of Paris Climate
Agreement
Progress towards high production
flexibility
Aging population of developed
countries
New models for costumer
dependency
Facilitation of access to informa-
tion
Unstable Commodity Markets Constant research for new
technologies
Global tendency of urbanization New customer segments
Globalization’s getting more
inclusive
Decrease of countries’ energy
density
Increasing importance of huge
data and cyber security
Changes in the structure of labor New period where profitability
declines

ECONOMY AND FOREIGN TRADE REPORT 2016 137
TABLE.1 EXPORT SHARE AND CHANGEOF THE FIRST 30 EXPORTER BETWEEN 2008-2015
TABLE.2 SHARE INCREASE PERCENTAGE POINTS OF THE FIRST 30 EXPORTER BETWEEN 2008-2015
SOURCE: WORLD TRADE ORGANIZATION
SOURCE: WORLD TRADE ORGANIZATION
PLACE COUNTRY 2008 SHARE (%) 2015 SHARE (%) Share Change
2015-2008
1 CHINA 9,09 13,70 4,61
2 USA 8,19 9,07 0,88
3 GERMANY 9,30 8,01 -1,29
4 JAPAN 4,98 3,77 -1,21
5 HOLLAND 4,03 3,42 -0,61
6 SOUTH KOREA 2,69 3,17 0,48
7 HONG KONG 2,35 3,08 0,73
8 FRANCE 3,85 3,05 -0,80
9 ENGLAND 2,92 2,77 -0,15
10 ITALY 3,42 2,77 -0,65
11 CANADA 2,91 2,46 -0,45
12 BELGIUM 3,03 2,40 -0,63
13 MEXICO 1,86 2,30 0,44
14 SIGNAPORE 2,15 2,09 -0,06
15 RUSSIA 3 2,05 -0,95
16 UAE 1,48 1,77 0,29
17 SWITZERLAND 1,27 1,75 0,48
18 TAIWAN 1,63 1,72 0,09
19 SPAIN 1,71 1,70 -0,01
20 S. ARABIA 1,99 1,67 -0,32
21 INDIA 1,13 1,61 0,48
22 THAILAND 1,13 1,29 0,16
23 MALESIA 1,27 1,20 -0,07
24 POLAND 1,07 1,19 0,12
25 BRAZIL 1,26 1,15 -0,11
26 AUSTRALIA 1,19 1,13 -0,06
27 VIETNAM 0,45 0,98 0,53
28 CZECH REP. 0,93 0,95 0,02
29 AUSTRIA 1,15 0,92 -0,23
30 INDONESIA 0,88 0,90 0,02
31 TURKEY 0,83 0,87 0,04
PLACE COUNTRY PERCENTAGE
1 CHINA 4,61
2 USA 0,88
3 HONG KONG 0,73
4 VIETNAM 0,53
5 SOUTH KOREA 0,48
6 SWITZERLAND 0,48
7 INDIA 0,48
8 MEXICO 0,44
9 UAE 0,29
10 THAILAND 0,16
11 POLAND 0,12
12 TAIWAN 0,09
13 TURKEY 0,04
14 CZECH REPUBLIC 0,02
15 INDONEZIA 0,02
16 SPAIN -0,01
17 SIGNAPORE -0,06
18 AUSTRALIA -0,06
19 MALEZIA -0,07
20 BRAZIL -0,11
21 ENGLAND -0,15
22 AUSTRIA -0,23
23 S. ARABIA -0,32
24 CANADA -0,45
25 HOLLAND -0,61
26 BELGIUM -0,63
27 ITALY -0,65
28 FRANCE -0,8
29 RUSSIA -0,95
30 JAPAN -1,21
31 GERMANY -1,29
effects of their own conditions.Export performances of countries especially dependent on energy and commodity export were negatively affected by significant drops in price. Export performance of European Union countries declined both due to prolonged economic recession and decrease of Euro against Dollar.
Turkey Became one of 15 Countries Who Increased Their Share between 200-2015 among the First 30 ExportersWhile export share of 15 countries out of the first 30 big exporters increased between 2008-2015, export share of 15 countries decreased. Turkey became to be among one of 15 countries to

138
›
7EVALUATION FOR LONG TERM EXPORT GOALS
FIGURE.2 COUNTRIES TO INCREASE THEIR EXPORT SHARE THE MOST BETWEEN 2008-2015
FIGURE.3 COUNTRIES WHOSE EXPORT SHARE DECREASED BETWEEN 2008-2015
TABLE.3 TURKEY’S EXPORT GOALS AND REALIZATIONS 2010-2015
SOURCE: TURKISH STATISTICAL INSTITUTION, T.R. MINISTRY OF DEVELOPMENT MEDIUM TERM PROGRAMS
Declining in 2015, Export is Below the Goal With its 2023 export strategy, Turkey determined its annual export goals until 2023. In parallel with this, annual export goals are presented in three-year long medium-term programs announced by the Government.Turkey’s export reached export goals in 2023 export strategy and medium-term program in 2010, 2011 and 2012. However, there was a temporary contribution of
irregular high export of gold in 2012. Realizations in export in 2013 and 2014 were below export goals. A significant decline occurred in export in 2015. This decline was not specific to Turkey and took place with the significant shrinkage in global trade.While the export goal is 207,5 billion dollars in export strategy document and 173 billion dollars in medium-term program for 2015, export occurred as 143,9 billion dollars.
VII 3. TURKEY’S 2023 EXPORT GOALS AND REALIZATIONS
YEARS2023 EXPORT STRATEGY GOAL (BILLION
DOLLARS)MTP EXPORT GOAL (BILLION DOLLARS) EXPORT REALIZATION (BILLION DOLLARS)
2010 115 107,5 113,9
2011 135 127 134,9
2012 152,5 148,5 152,5
2013 165,7 158 151,8
2014 187,7 166,5 157,6
2015 207,5 173 143,9
54,5
43,5
32,5
21,51,
0,50
0-0,2-0,4-0,6-0,8-1,0-1,2-1,4
increase export share even at the least.China became the country that increased its export share the most by %4,61 in 2008-2015 period. After its 5-years export strategy it put into practice after global crisis, USA increased its export share by %0,88.
Vietnam, South Korea, Switzerland, India and Mexico are other countries to have a relative increase in their export shares. Hong Kong and UAE obtained increase in their export share with rising re-export sales.
4,61-0,01-0,06 -0,06 -0,07-0,11 -0,15
-0,23 -0,32-0,45
-0,61 -0,63 -0,65-0,8
-0,95
-1,21
Chin
a
Spai
n
USA
Sing
apor
e
Hong
Kon
g
Aust
ria
Viet
nam
Mal
esia
Sout
h Ko
rea
Braz
il
Switz
erla
nd
Engl
and
Indi
a
Aust
ralia
Mex
ico
Serb
ia
UAE
Cana
da
Thai
land
Holla
nd
Pola
nd
Belg
ium
Taiw
an Italy
Turk
ey
Fran
ce
Czec
h Re
p.
Russ
ia
Indo
nesia
Germ
any
0,88 0,73 0,53 0,48 0,48 0,48 0,440,29 0,16 0,12 0,09 0,03 0,02 0,02 -1,29

ECONOMY AND FOREIGN TRADE REPORT 2016 139
EXPORT GOALS AND REALIZATIONS
(PERCENTAGE OF SHARE IN WORLD EXPORT)
TABLE.4 TURKEY’S GOALS FOR PLACE OF ITS EXPORT IN WORLD COMMERCE AND REALIZATIONS 2010-2015
FIGURE.5 GOAL OF SHARE IN WORLD EXPORT AND REALIZATIONS
FIGURE.4 EXPORT GOALS AND REALIZATIONS BILLION DOLLARS
SOURCE: TURKEY STATISTICAL INSTITUTION, WORLD TRADE ORGANIZATION
Turkey was 0,23 Points Below 2015 Share Goal in World Commerce Along with absolute export sizes, the share to be taken from World merchandize trade was also determined as a goal in Turkey’s 2023 export strategy.According to this, while Turkey’s share in World merchandize trade in 2008 was %0,83, this number went down to %0,75 in 2010. With the improvement in following years, this rate became %0,87 in 2015.Furthermore, Turkey has been below the goal of share to be taken from World merchandize trade in terms of years. In spite of the goal of %1,10 for 2015, with the realization of 0,87, Turkey was 0,23 points below the goal.
2011 2012 2013 2014 2015
135127
134,9
152.5 148.5 152.5
165.7158
151.8
187.7166.5 157.6
207.5
173
143.9
2023 EXPORT STRATEGY GOAL MTP GOAL ACTUAL EXPORT
YEARS2023 EXPORT STRATEGY DOCUMENT
GOAL PERCENTAGEEXPORT REALIZATION GOAL
2010 0,88 0,75
2011 0,96 0,75
2012 1,02 0,85
2013 1,03 0,83
2014 1,06 0,85
2015 1,10 0,87
2023 EXPORT STRATEGY DOCUMENT GOAL PERCENTAGE ACTUAL REALIZATION PERCENTAGE
0,88
0,96
0,75
0,850,83 0,85
0.87
1,02 1,031,06 1.10
0,75
2010 2011 2012 2013 2014 2015
Share of our Export within the First 30 Big Exporters Increased from %0,54 to %0,67 A reason to stay below the absolute magnitude presented in Turkey’s 2023 export strategy and goals of share in World merchandize trade is that the export aimed at big markets and the obtained share are limited.Turkey’s export to the first 30 countries that actualize
roughly %85 of world import in 2014 was 84,2 billion dollars but declined to 80,7 billion dollars in 2015. However, Turkey’s share in import of the first 30 markets was rather limited, %,0,54, it rose to %0,67 in 2015. The important reason to this significant is that in spite of the big decrease in total import of importer countries, import in Turkey decreased at a limited extent.

140
›
7EVALUATION FOR LONG TERM EXPORT GOALS
Sector’s Rate of Realizing their Export Goals in 2015 is %64,4 Another determinant factor in export performance is sectors’ export developments. While total export goal of 26 sub-sectors in 2023 Export Strategy for 2015 was set as 207,5 billion dollars, but realized export was 133,6 billion dollars.
There was also a difference between 133,6 billion dollars of sectoral export and 143,9 billion dollars of 2015 total export, which also includes gold export.Realization ratio of 207,5 billion dollars export goal for 2015, which was set excluding the gold, was %64,4. While 6 sub-sectors reached or exceeded their export goal in 2014, there
PLACE COUNTRY COUNTRIES’ IMPORT (BILLION DOLLARS) TURKEY’S EXPORT (BILLION DOLLARS)
2014 2015 2014 2015
TABLE.5 THE BIGGEST 30 IMPORTER AND TURKEY’S EXPORT
SOURCE: WORLD TRADE ORGANIZATION, TURKISH STATISTICAL INSTITTUTION
1 USA 2.409 2.308 6,3 6,4
2 CHINA 1.960 1.682 2,9 2,4
3 GERMANY 1.217 1.050 15,2 13,4
4 JAPAN 822 649 0,4 0,3
5 ENGLAND 683 626 9,9 10,6
6 FRANCE 679 572 6,5 5,8
7 HONG KONG 601 559 0,4 0,3
8 THE NETHERLANDS 587 506 3,5 3,2
9 SOUTH KOREA 526 436 0,5 0,6
10 CANADA 475 419 1 0,7
11 ITALY 472 409 7,1 6,9
12 MEXICO 412 405 0,3 0,3
13 INDIA 460 392 0,6 0,7
14 BELGIUM 451 375 2,9 2,6
15 SPAIN 356 309 4,8 4,7
16 SINGAPORE 366 297 0,4 0,4
17 SWITZERLAND 203 252 3,2 5,7
18 TAIWAN 274 238 0,1 0,1
19 UAE 262 219 4,7 4,7
20 THAILAND 228 203 0,2 0,2
21 AUSTRALIA 238 200 0,5 0,5
22 RUSSIA 308 194 5,9 3,6
23 POLAND 218 193 2,4 2,3
24 BRAZIL 239 179 0,8 0,5
25 MALEZIA 209 176 0,3 0,4
26 VIETNAM 149 166 0,2 0,2
27 AUSTRIA 182 155 1,1 1
28 INDONESIA 178 143 0,2 0,2
29 CZECH REPUBLIC 152 140 0,8 0,8
30 SWEDEN 163 138 1,1 1,2
TOTAL 15.479 13.590 84,2 80,7
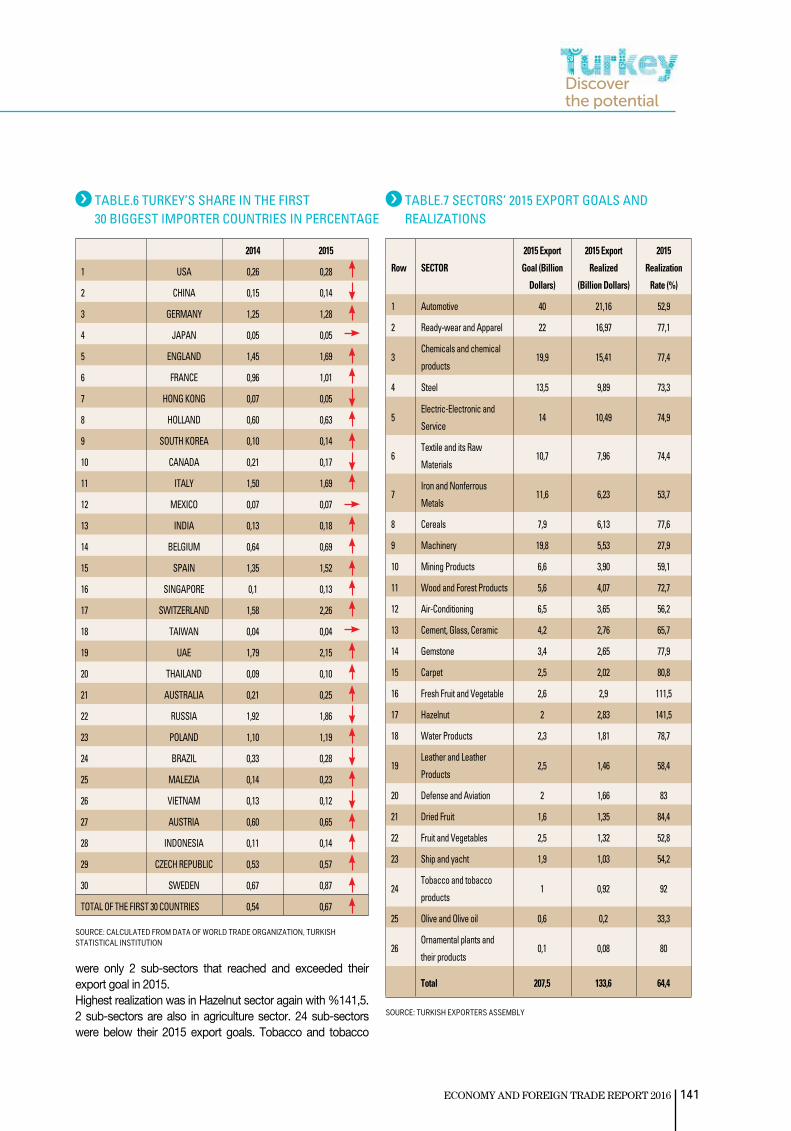
141ECONOMY AND FOREIGN TRADE REPORT 2016
TABLE.6 TURKEY’S SHARE IN THE FIRST 30 BIGGEST IMPORTER COUNTRIES IN PERCENTAGE
SOURCE: CALCULATED FROM DATA OF WORLD TRADE ORGANIZATION, TURKISH STATISTICAL INSTITUTION
2014 2015
1 USA 0,26 0,28
2 CHINA 0,15 0,14
3 GERMANY 1,25 1,28
4 JAPAN 0,05 0,05
5 ENGLAND 1,45 1,69
6 FRANCE 0,96 1,01
7 HONG KONG 0,07 0,05
8 HOLLAND 0,60 0,63
9 SOUTH KOREA 0,10 0,14
10 CANADA 0,21 0,17
11 ITALY 1,50 1,69
12 MEXICO 0,07 0,07
13 INDIA 0,13 0,18
14 BELGIUM 0,64 0,69
15 SPAIN 1,35 1,52
16 SINGAPORE 0,1 0,13
17 SWITZERLAND 1,58 2,26
18 TAIWAN 0,04 0,04
19 UAE 1,79 2,15
20 THAILAND 0,09 0,10
21 AUSTRALIA 0,21 0,25
22 RUSSIA 1,92 1,86
23 POLAND 1,10 1,19
24 BRAZIL 0,33 0,28
25 MALEZIA 0,14 0,23
26 VIETNAM 0,13 0,12
27 AUSTRIA 0,60 0,65
28 INDONESIA 0,11 0,14
29 CZECH REPUBLIC 0,53 0,57
30 SWEDEN 0,67 0,87
TOTAL OF THE FIRST 30 COUNTRIES 0,54 0,67
TABLE.7 SECTORS’ 2015 EXPORT GOALS AND REALIZATIONS
Row SECTOR
2015 Export
Goal (Billion
Dollars)
2015 Export
Realized
(Billion Dollars)
2015
Realization
Rate (%)
1 Automotive 40 21,16 52,9
2 Ready-wear and Apparel 22 16,97 77,1
3Chemicals and chemical
products19,9 15,41 77,4
4 Steel 13,5 9,89 73,3
5Electric-Electronic and
Service14 10,49 74,9
6Textile and its Raw
Materials10,7 7,96 74,4
7Iron and Nonferrous
Metals11,6 6,23 53,7
8 Cereals 7,9 6,13 77,6
9 Machinery 19,8 5,53 27,9
10 Mining Products 6,6 3,90 59,1
11 Wood and Forest Products 5,6 4,07 72,7
12 Air-Conditioning 6,5 3,65 56,2
13 Cement, Glass, Ceramic 4,2 2,76 65,7
14 Gemstone 3,4 2,65 77,9
15 Carpet 2,5 2,02 80,8
16 Fresh Fruit and Vegetable 2,6 2,9 111,5
17 Hazelnut 2 2,83 141,5
18 Water Products 2,3 1,81 78,7
19Leather and Leather
Products2,5 1,46 58,4
20 Defense and Aviation 2 1,66 83
21 Dried Fruit 1,6 1,35 84,4
22 Fruit and Vegetables 2,5 1,32 52,8
23 Ship and yacht 1,9 1,03 54,2
24Tobacco and tobacco
products1 0,92 92
25 Olive and Olive oil 0,6 0,2 33,3
26Ornamental plants and
their products0,1 0,08 80
Total 207,5 133,6 64,4were only 2 sub-sectors that reached and exceeded their export goal in 2015.Highest realization was in Hazelnut sector again with %141,5. 2 sub-sectors are also in agriculture sector. 24 sub-sectors were below their 2015 export goals. Tobacco and tobacco
SOURCE: TURKISH EXPORTERS ASSEMBLY

142
›
7EVALUATION FOR LONG TERM EXPORT GOALS
Raw SECTOR 2015 Export Billion Dollars 2023 Export Goal Billion Dollars 2016/2023 Required Annual Speed of Growth (%)
1 Automotive 21,16 75 17
2 Ready-wear and Apparel 16,97 60 17
3 Chemicals and chemical products 15,41 50 16
4 Steel 9,89 55 24
5 Electric-Electronic and Service 10,49 45 20
6 Textile and its Raw Materials 7,96 20 12
7 Iron and Nonferrous Metals 6,23 25 18,5
8 Cereals 6,13 19,2 15,5
9 Machinery 5,53 75 38,5
10 Mining Products 3,90 15 19
11 Wood and Forest Products 4,07 16 20
12 Air-Conditioning 3,65 25 27
13 Cement, Glass, Ceramic 2,76 7,3 12,5
14 Gemstone 2,65 12 21
15 Carpet 2,02 5,5 13
16 Fresh Fruit and Vegetable 2,9 5,6 8,5
17 Hazelnut 2,83 3,5 2,7
18 Water Products 1,81 5 13,5
19 Leather and Leather Products 1,46 5 17,5
20 Defense and Aviation 1,66 25 40,5
21 Dried Fruit 1,35 3 10,5
22 Fruit and Vegetables 1,32 4 15
23 Ship and yacht 1,03 10 33
24 Tobacco and tobacco products 0,92 1,2 3,6
25 Olive and Olive oil 0,2 3,8 44,5
26 Ornamental plants and their products 0,08 0,5 26
Total 143,9 500* 16,5
TABLE.8 SECTORS’ REQUIRED GROWTH RATE TO ACHIEVE 2023 EXPORT TARGETS
FIGURE.6 SECTORS’ REQUIRED AVERAGE ANNUAL GROWTH RATES TO ACHIEVE
2023 GOALS
products and dried fruit merchandize were two sectors to come close their 2015 goals the most respectively by %92 and %84,4.
Export should Increase Annually %16,5 on Average so that Sectors Reach 2023 GoalWhen export magnitudes reached in 2015 are compared to 2023 goals, Turkey should increase its export annually %16,5 on average. With its percentage of %44,5 live and olive oil is the sector that needs the highest increase of annual export on average. 19 sub-sectors need annually two-digit increase on average until 2023.In sectors with high export goals, if machine industry obtains annual growth of %38,5 on average, automotive sector %27, steel sector %24, electric-electronic sector %20, ready-wear and apparel sector %17 and chemical substances and products %16, 2023 goals can be reached.
Olive and Olive OilDefense and Aviation
MachineryShip and Yacht
Air-ConditioningOrnamental Plants and their Products
SteelGemstone
Electric-Electronic and ServiceWood and Forest Products
Mining ProductsIron and Nonferrous Metals
Leather and Leather ProductsAutomotive
Ready-Wear and Apparel
ChemicalsCereals
Fruit and VegetablesWater Products
CarpetCement, Glass, Ceramic
Textile and its Raw MaterialsDried Fruit Products
Fresh fruit and vegetableTobacco and Tobacco products
Hazelnut
44.540.5
38.533
2726
2421
2020
1918.5
17.51717
1615.5
15
10.5
13.513
12.512
8.53.6
2.7
AVERAGE ANNUAL GROWTH RATE
*2023 EXPORT GOAL
Total Export 16.5

8STRATEGIC EVALUATION ANDRECOMMENDATIONS

8STRATEGIC EVALUATION AND RECOMMENDATIONS
144
› 1. World merchandize trade declined because of the decreases in prices of commodity. Export of countries that are commodity export-ers suffered high losses. Turkey’s export declined at a more limited extent than World merchandize trade thanks to its manufacture indus-try-based export structure. Turkey has an advantage among develop-ing countries by bringing its feature of being a producer basing on manufacture industry.2. World merchandize trade suffered a significant decline. Slow growth in world economy and the decline in merchandize trade restricts Tur-key’s export-based growth and reaching its 2023 export goals.3. There are important decreases in prices of commodity and input and production costs are on the decline. Turkey should take advan-tage of the decline of costs in its manufacture industry-based export structure. 4. While the transformation and idle capacities in China’s economy will create a pressure on developing countries in the short run, unequal competitive conditions that China use for its own advantage will be eliminated in the medium and long run. Turkey will have more equal conditions of competition in the medium term especially in manufac-ture industry and therefore it should protect its existing capacities.5. Money policies and negative interest applications of Central Banks of developed countries create global fluctuations and it also negatively affects developing countries including Turkey. Turkey should adapt to new conditions well and increase its predictability.6. In that four years, Turkey has been applying balancing policies in the economy and trying to form a balance between domestic and foreign demand. Nevertheless, contribution of net export to growth was nega-tive in two years out of four. It is necessary to increase added value in export for faster growths based on net export.7. Turkish Lira suffered a significant loss of value in 2015. Nonethe-less, export declined, import increased in amounts and decreased due to the decline in prices of products that are imported more. The factor supporting the export is not weak Turkish Lira but predictable Turkish Lira.8. While the export declined in parallel with global conditions in 2015, export to numerous close and contiguous countries fell much more due to the problems with these countries. Turkey should chose the path of normalization in its foreign policy and improve its mutual rela-tions with close and contiguous countries.9. Economy of Turkey and many close and contiguous export mar-ket countries are dependent on energy income. Energy prices are predicted to stay low for a couple of years more. Therefore, perfor-mances of these markets of us will be weak. Turkey should be able to find alternative markets to export markets that are dependent on energy income. For this aim, it should participate in supply chain of countries that perform industrial production.10. Share of high-technology products is continuing to stay low in the export. However, the most limited decline in the export occurred in industries concentrated on high-technology. Investment and pro-duction should be supported more comprehensively basing on the export in high-technology industries.11. While the import declined in values in 2015, it increased in amounts. The decline in investment and consumption goods imports
is highly limited. Effects of the measures taken for limiting the import in economy on domestic demand should be re-evaluated.12. Share of high-technology products in Turkey’s import are increas-ing. Share of low technology products also is on the increase. Turkey is obliged to import the products that it cannot produce and the products it loses the advantage of price. Producers of both categories should be supported more effectively with special programs.13. Turkey is net exporter against 10 countries out of 25 it makes mutual foreign trade the most. In order to be net exporter to these countries, it is necessary to be net exporter in many sections that are the subject of mutual trade. Turkey should be net exporter to a higher number of counties and focus on less number of sections by increas-ing added value to this end.14. Turkey is net exporter in 10 sections of products out of 28 it makes foreign trade the most, and is net importer in 18 of them. The sec-tions where Turkey is net importer is high technology sections, mineral, metal and chemistry based products. The sections where Turkey is net exporter are generally low technology sections. Turkey should improve its current structure among sections trade and move to position of net exporter in medium high and high technology products.15. Economic growth in European Union and Customs Union’s effect of increasing the foreign trade are on the progress. Share of the trade of regional establishments has been on the decline in the last four years. Share of foreign trade with countries of STA is not adequate yet. Turkey should renew its foreign trade policies and diplomacy accord-ing to regional and global new conditions. The steps taken to improve and develop Customs Union with UN are significant.16. Ratio of the support given to export to total export within export support programs in 2015 was substantially low by %0,30. This rate should be increased to %1 in the short run.17. New global tendencies and conditions and also geopolitical de-velopments in Turkey’s region are creating new risks and complicates reaching 2023 export goals. Turkey should follow constructive policies against geopolitical risks and should focus on big markets such as USA and China.18. Within 2023 export goals, the rate of realizing 2015 export goal was %64,4. Turkey was 0,23 points below the goal of share to be taken from world merchandize trade, its share was %0,87. Supports and applications and environmental conditions aimed at them should be developed in investment, production and ex-port stages in order to reach the goals in following years.19. Turkey’s share in 2015 in import of the first 30 biggest mar-kets that realized %90 of world import went up to %0,67. In-crease of share in these markets is positive for Turkey’s 2023 export goals. Turkey should increase its share even more in big markets, particularly USA. Simultaneous participation of Turkey in T-TIP agreement has utmost importance within this frame.20. 2 sectors out of 25 reached their 2015 export goals within the scope of 2023 export strategy goals. These sectors are mainly agriculture-food sectors. Sectors have to increase their exports annually %20 on average in order to reach their 2023 goals. In order to reach sectoral goals, it is time to aim at special supports to sectors.
SECTION VIII. STRATEGIC EVALUATION AND RECOMMENDATIONS