Turkey’s Customs Union with the European Union: A ... · to apparent consumption (domestic...
21
Munich Personal RePEc Archive Turkey’s Customs Union with the European Union: A Framework for Evaluating the Impact of Economic Integration Erzan, Refik and Filiztekin, Alpay and Zenginobuz, Unal 4 October 2002 Online at https://mpra.ub.uni-muenchen.de/382/ MPRA Paper No. 382, posted 11 Oct 2006 UTC
Transcript of Turkey’s Customs Union with the European Union: A ... · to apparent consumption (domestic...

Munich Personal RePEc Archive
Turkey’s Customs Union with the
European Union: A Framework for
Evaluating the Impact of Economic
Integration
Erzan, Refik and Filiztekin, Alpay and Zenginobuz, Unal
4 October 2002
Online at https://mpra.ub.uni-muenchen.de/382/
MPRA Paper No. 382, posted 11 Oct 2006 UTC

SUBMISSION
FOR
ERF’S NINTH ANNUAL CONFERENCE
(October 26-28 2002)
Research Area: Globalization, Trade, Integration and FDI
Turkey’s Customs Union with the European Union:
A Framework for Evaluating the Impact of Economic Integration
Refik Erzan Alpay Filiztekin Unal Zenginobuz
Bogazici University Sabanci University Bogazici University
Bebek, Istanbul Orhanli, Tuzla, Istanbul Bebek, Istanbul TURKEY 80815 TURKEY 81474 TURKEY 80815
[email protected] [email protected] [email protected]
October 4, 2002
Abstract
Turkey’s customs union with the European Union in 1996 increased considerably
import penetration in manufacturing while not significantly affecting the share of EU
in Turkey’s trade. The study analyzes whether this impetus had a marked impact on
the productive and industrial structure of manufacturing in Turkey, and on its
competitive behavior.

2
1. Introduction
Various forms of economic integration with the European Union (EU) are on the top
of the agenda for the Southern and Eastern Mediterranean countries. By enacting a
customs union (CU) with the EU in 1996, Turkey took a major step in that direction.
Evaluating the impact of this CU for Turkey - and its policy implications - are
therefore important both for Turkey and for the other Mediterranean countries that
have various types of economic association with the EU.
Since the CU largely excludes agriculture, this study analyzes the impact of the CU
on Turkish manufacturing industry - at the sectoral level. Only six years have elapsed
since the CU (1996-2001), and the latest definitive data on the manufacturing industry
pertain to 1999. The intention of the study is to set up a framework with which the
anaysis can be updated periodically enabling a more accurate evaluation of the CU.
1.1 Trade liberalization and the Customs Union
Trade regime stood at the core of the reform process the Turkish economy has been
undergoing since 1980. Vigorously followed export promotion policies, as well as
more gradually introduced import liberalization policies, had a profound impact on
the manufacturing industry. The State Institute of Statistics data reveal that the share
of manufacturing in exports has gone up from 36% in 1980 to 79.1% in 1987 and
stood at 91.4% in 2000.
Import penetration ratios in Turkish manufacturing, calculated as the ratio of imports
to apparent consumption (domestic production plus imports minus exports), increased
considerably since the 1980s. This has accelerated with the Customs Union (CU) with
the EU. In addition to import penetration ratios, nominal protection rates are also
important in judging the competitive pressures that industries face.
In the 1970 Additional Protocol to the Association Treaty of 1963, Turkish imports
from the European Community were divided into two lists. There was a 12-year list
for industrial products that Turkey was likely to reach international competitiveness
relatively faster, and the rest of the manufactured goods were placed on a 22-year list.
With the CU that went into effect in 1996 Turkey has reduced the nominal protection
rates in trade with EU for all of the commodities in the 12- and 22- year lists. For
commodities that were not included in the 12- and 22-year lists but covered under the
European Coal and Steel Community agreement, a separate Free Trade Agreement
3
was signed in 1995 between Turkey and EU, which stipulated that trade of
commodities covered under the agreement would be gradually liberalized over a
period of three years. Thus, by 1999 the nominal protection rates for all industrial
products when traded with EU have been reduced to zero. It has been calculated that
while the average nominal protection rates with EU had been calculated as 10.22% as
of 1994, they have fallen on average to 1.34% by 1999 (see, Togan 1997). Moreover,
the EU-Turkey customs union agreement requires Turkey to adopt the Customs Union
Tariff of EU against third country imports by January 1, 1996, and all of the
preferential agreements EU has concluded with third countries by the year 2001.
Also, the enactment of Competition Law and the establishment of the Competition
Authority have largely been due to Turkey's obligation under the Association
Agreement. The Association Agreement required that the parties should apply the
provisions of Rome Treaty for the harmonization of their laws, tax rules, and
competition policies.
1.2 Trade Pattern and Ratios
Table 1. gives the export-output and import penetration (imports/apparent
consumption) ratios in manufacturing for the relevant sub-periods following the trade
liberalization of 1980. The share of imports from and exports to the EU in,
respectively, total imports and exports are also depicted.
The only striking change in the trade pattern following the CU was the major increase
in overall import penetration ratios. This ratio increased from 14% in the early 1990s
to nearly 20% in the post-CU period. Remarkably, the share of EU imports in imports
from all sources slightly declined from 54% to 51% in the two periods compared.
Given the relatively low level of the common external tariffs, and the large size of the
EU, this observation is consistent with the intuitive prediction that trade creation
would dominate trade diversion. Put differently, for Turkey, the multilateral
liberalization aspect of the CU dominated over its preferential impact.
Following the CU, import penetration ratios doubled or nearly doubled in many
sectors of manufacturing. It can be expected that such an impetus would have an
important impact on the productive and industrial structure of manufacturing in
Turkey, and on its competitive behavior.
INSERT TABLE 1

4
1.3 Previous Studies
Systematic empirical studies on the impact or probable impact of the CU on Turkish
manufacturing industry are very sparse. Harrison, Rutherford and Tarr, using a
computable general equilibrium (CGS) model, addressed the issue in 1996, analyzing
the potential overall impact of the CU on welfare. CGE estimations and simulations of
Bayar et al. (2000) provided some indication of the direction and magnitude of
changes in major sectors of the economy. Kucukahmetoglu (2000) conducted a study
based on changes in revealed comparative (RCA) advantage indices. Erzan and
Filiztekin (1997) analysed the probable impact of the CU on the structure of
manufacturing industry in terms of small, medium and large firms, using panel data
techniques.
The CU has both liberalization (trade creation) and trade diversion aspects. There are
earlier studies on the impact of trade liberalization. Krueger and Tuncer (1982)
reported that productivity growth was faster during the periods of liberalization.
Similarly, Nishimizu and Robinson (1984) find that for most industries, productivity
growth was increasing with export expansion. Both of these studies cover the1963-
1976 highly protectionist period. The paper by Levinsohn (1993) was the first one that
exploited the reforms in 1980. However, the major concern of Levinsohn was to test
imports as a market discipline hypothesis. His results showed that for majority of
industries, removing barriers to import decreases market power. Foroutan (1996) as a
part of a World Bank funded project, examined total factor productivity between
years 1976-1985. She concluded that industries that were classified as exportables
grew faster after 1980. She also reported that there was small but significant
disciplining effect of trade on market power.
Filiztekin (2000) explored the impact of trade reforms on the growth performance of
Turkish manufacturing industry in the 1970-1996 period. He also addressed whether
the observed growth in value added was due to accumulation of factors of production
or rather improvement in productivity, whether the growth phenomenon was uniform
across industries and whether there were certain industries that led the rest. The
relation between trade and productivity growth, especially the effects of export
growth and changes in imports on productivity were also tested.

5
1.4 Data
The data are obtained from the Annual Surveys of Manufacturing Industry conducted
by the State Institute of Statistics (SIS). The surveys defined 20 industries until 1973,
and since then, the classification system has changed to identify 29 industries.
Throughout the paper, we used a dual approach with respect to data. Where possible,
we used the 28-industry classification (the food and beverage industry is collapsed in
many other statistics, thus we had to consider these two industries as one) and the
(consistently constructed) 20-industry classification otherwise. This was specifically
the case in constructing the capital stock data.
The surveys cover establishments with ten or more persons engaged. The data
differentiate public enterprises from private ones. The study pertains to private
manufacturing industry because of the arbitrary decision making in the public
enterprises. This differntiation reduced our number of sectors to 27 because of the
mainly publicly owned oil refining industry.
The variables used in the rest of the report are defined as follows. Real value added
and real gross output are calculated by dividing the nominal value added and nominal
gross output by sectoral price deflators, respectively. Sectoral price deflators exist for
the 1982-1997 period at a monthly frequency starting with 1981. For each industry,
the sectoral deflator is extrapolated for the early years using the relation between each
deflator and consumer price index, oil prices and a set of time related variables after
1982.
Labor input is total number of persons engaged. Man-hour data are available only
after 1980 and they are not reported for some small establishments in several
industries in particular years. None of the results related to post 1980 do change
qualitatively if man-hour data are used instead of persons engaged. Furthermore,
when wages are calculated, we used total number of workers instead of persons
engaged, because they include owners or other family workers that re not paid any
wages and salaries.
The surveys report current value investment figures for each industry. The finer
distinction for newly purchased goods are not available. The nominal investment
figures are deflated by an aggregate investment deflator. The deflator values for post
1980 period was taken from Treasury Department. Data on earlier years are from

6
OECD National Accounts. Treasury deflator was extrapolated using OECD data for
years prior to 1980.
Given the series of real investment, the capital stock is a function of past investment
flows. The choice of function is somewhat arbitrary, since information about asset
types, asset lives and depreciation patterns across industries are not available. Two
different functions are entertained in this paper, both yielding very close estimates.
The first one is the perpetual inventory method. The initial level of capital stock is
approximated by taking the ratio of investment value added in 1950 to the sum of
investment value added ratio in the next ten years. Given positive depreciation rates
and long investment series prior to the initial date, the perpetual inventory approach is
fairly robust to the choice of capital stock estimate for the first year. Then
investments are added to the capital stock by adjusting for depreciation in the existing
stock.
The second approach is to construct the capital stock as a delayed linear scrapping
rule. This method adds newly purchased capital good to the capital stock and after a
period of s years. A constant proportion, 1/(m+1), is scrapped every year.
⎥⎦⎤
⎢⎣⎡
+−
−+= ∑∑+
+=−
=−
1m
sn1IIK
ms
1sn
nit
s
1n
nitit
where Kit is the capital stock of industry i at time t, I is real investment. This is the
formula used by the OECD in it’s Intersectoral Database for international
comparisons (OECD,1996). Following Harrigan (1999) s is chosen as 3 years and m
as 7 years and the capital stock is calculated from 1960 onwards. The capital stock
estimates reported in this paper use the delayed scrapping approach.
To analyze market structure, we use two different approaches. First we use three
standard measures of concentration. The first two are four-firm and eight-firm
concentration ratios and the third one is a Herfindahl index, ∑=
=N
1n
2it,nit sH , where N is
total number of establishments in industry i at time t, and s is the output share of nth
firm in that industry. These measures are taken from Gunes (1995).
Trade data are taken from the World Bank Trade and Production Database. The
database contains imports and export data at the industry level by blocs of countries
over the period 1980-1999. We were able to identify Turkey’s imports and exports to
European Union, United States of America and to the rest of the world.

7
2. Growth and Productivity
2.1 Growth
1980 was a decisive year in which the economy changed its orientation. Post 1980
period is divided into three sub-periods. The first one starts in 1981 and ends in 1988.
The 1989-1995 period corresponds to two major changes in the economy. As a result
of free elections after a period of political oppression, and the strong pressures by
trade unions, real wages increased drastically in 1989, catching up their pre-1980
level. 1989 was also the year when the capital account was fully liberalized. The
final sub-period, 1995-1999, captures the CU with the EU.
The first column in Table 2 provides annual average growth rate of value added in
aggregate manufacturing. The growth rate during the last decade of import
substituting industrialization, 1970-1980, was a mere 1.3% (as industry was paralyzed
by 1977), which jumped to 10% as the economy was opened to trade.
The second column provides annual growth rates of employment. The annual
employment growth was 4.5% during the 1970s. This should be viewed against the
background of very high population growth rates (2.6% per annum) and mass
migration from rural areas to urban centers (1.3% per annum). In the 1980s, with
suppressed real wages, opening up of the economy increased annual employment
growth to 4.9%. However, from 1989 onwards, as real wages were restored and the
capital account opened, the average employment growth fell rapidly to 1.8%. In the
post-CU era, annual employment growth recovered to 3.4%.
Table 2. Growth Performance of Manufacturing, 1970-1999 (%)
Value Added Employment
Capital Stock
1970-1980 1.32 4.48 13.84
1981-1988 9.69 4.91 2.86
1989-1995 10.32 1.80 6.90
1996-1999 10.20 3.43 10.75
1981-1999 10.03 3.45 6.01

8
The third column is growth in capital stock. In the 1970s, despite severe balance of
payments crises, capital accumulation had a remarkable 13.8% average. Following
the trade liberalization of 1980, capital accumulation slowed down considerably.
After the wage hike and opening up of the capital account in1989, it picked up to
6.9%. With the CU, annual growth rate of capital accumulation reached 10.8%.
2.2 Productivity
Two measures of productivity are analyzed. The first one is labor productivity,
simply the ratio of real value added to labor input. While it is a very simple and non-
parametric measure of productivity, it measures the contribution of only one factor
input, and hence cannot differentiate whether high productivity is a result of technical
efficiency or due to increase in other inputs, particularly capital. The second measure
of productivity is total factor productivity (TFP), defined as the residual after the
contribution of accumulation of all factors is removed from output growth. More
formally, suppose the value added is produced by using two inputs, labor and capital,
and technology, A:
Y = F(A,K,L) (1)
Differentiating this function will yield:
A
dA
Y
AF
L
dL
Y
LF
K
dK
Y
KF
Y
dY ALK ++= (2)
where FJ is partial derivative of production function, F, with respect to input J.
Assuming that the elasticity of technology is unity (or simply assuming that
technology is Hicks-neutral), with some manipulation one obtains:
A
dA
K
dK1
K
dK
L
dLs1
K
dK
L
dLs
K
dK
Y
dYLL +−+⎟
⎠⎞
⎜⎝⎛ −−+⎟
⎠⎞
⎜⎝⎛ −=− )()( γµ (3)
where sJ is the share of Jth input total revenue, µ is the markup and γ is the returns to
scale parameter.
Under the assumption of perfect competition and constant returns to scale, that is
when µ = γ = 1 = sK + sL, Equation (3) reduces to
L
dLs
K
dKs
Y
dY
A
dALK
SR
−−=⎟⎠⎞
⎜⎝⎛
(4)

9
The term (dA/A)SR is simply the residual growth of value added after the contribution
of inputs are removed and is called the Solow residual. This is used as a measure of
“total factor productivity” (TFP).
Table 3. Labor Productivity and Total Factor Productivity Growth, 1970-1999 (%)
Labor Productivity TFP
1970-1980 -3.16 -9.38
1981-1988 4.77 6.18
1989-1995 8.52 4.49
1996-1999 6.78 0.88
1981-1999 6.57 4.44
There was a significant gain in labor productivity after the economy opened to trade
in 1980. A further improvement in labor productivity was observed after 1988 when
real wages increased drastically. However, in the period following the CU with the
EU in 1996, the annual average growth of labor productivity fell from 8.5% to 6.8%.
It was observed that TFP growth recovered after 1980, reaching the level as high as
6.2% per annum in the first phase of liberalization and dropping to 4.5% thereafter.
The decline in the growth rate of TFP in the second sub-period was a consequence of
the 1994 crisis. In fact, restricting the sample period to 1988-1993, the TFP growth
was even faster, reaching 9.2% per year. The drastic increase in real wages forced
firms to substitute capital for labor and increase efficiency and productivity of
existing inputs.
A major decline was observed for years following the CU with the EU. In fact, the
decline started in 1994 and persisted until 1996. A strong recovery in 1997 was then
offset by a strong decline in 1998. In the last year of the sample there was another
recovery of the TFP. Nevertheless, the average TPF growth in the post-CU years of
the sample was only 0.9%. The boom-bust performance of the economy in the recent
years may have dominated the erratic behavior of TFP rather than the impact of the
CU.

10
2.3 Growth Accounting
Growth accounting is a decomposition of value added growth into its components
obtained by re-arranging Equation (4). The purpose of the growth accounting exercise
is to determine whether the source of growth is due to factor accumulation or
technological improvement, represented by TFP growth. The results are reported in
Table 4.
INSERT TABLE 4
Average annual value added growth in manufacturing was about 10% during the
whole period under study. The increased labor input accounted for 12% of that in the
first sub-period, 1981-1988, and considerably lower in the following sub-periods. The
bulk of growth came from capital accumulation and technological improvement.
However, the shares of the two factors changed drastically. The contribution of TFP
declined first from 64% to 44%, then to 9% in the post-CU era. In this latter period,
capital accumulation alone accounted for 86% of value added growth. Individually, in
most sectors, TFP contribution was significantly negative, only compensated by
capital accumulation.
3. The Impact of Trade on Industry Structure an Performance
Table 5 below presents the evolution of various market concentration indicators in
Turkish manufacturing industries over the 1980-1998 period.
INSERT TABLE 5
Table 6 below shows the results of the regression relating foreign trade variables to
market concentration. With a one-year lag, import penetration (IMPPEN)
significantly affects market concentration as measured by CR4. The higher the
import penetration in a manufacturing industry in a given year, the lower is the market
concentration in the following year. Export/Output ratio (X/O), on the other hand,
does not affect market concentration. Given that market concentration will typically
mean more competition and, hence, lower prices, this result supports the imports-as-
market-discipline hypothesis.

11
Table 6. Impact of Foreign Trade Variables on Market Concentration (CR4)
Regression with robust standard errors No. of obs = 405 F( 46, 358) = 341.97 Prob > F = 0.0000 R-squared = 0.9185 Root MSE = 0.05713
Coef. Robust
Std.
Err.
t P > ⏐t ⏐
(X/O)-1 - 0.061 0.054 -1.11 0.267
(X/0)-2 - 0.274 0.051 -0.53 0.594
(X/O)-3 - 0.213 0.044 -0.48 0.632
IMPPEN-1 - 0.309*** 0.090 -3.43 0.001
IMPPEN-2 - 0.026 0.110 -0.24 0.809
IMPPEN-3 - 0.009 0.093 -0.10 0.917
Note: *, **, and *** indicate significance at 90%, 95%, and 99% confidence levels, respectively.
Table 7 below shows that including the share of EU in Turkish exports and imports
does not alter the previous result that, among independent variables considered,
import penetration with one year lag is the only significant determinant of market
concentration in the manufacturing industry. Again, import penetration significantly
reduces market concentration in the following year. (MEU denotes the share of EU in
total imports in Turkish manufacturing industries, and XEU denotes share of exports
to EU in total exports of Turkish manufacturing industries.)

12
Table 7. Impact of Trade With EU on Market Concentration (CR4)
Regression with robust standard errors No. of obs = 405 F( 52, 352) = 320.98 Prob > F = 0.0000 R-squared = 0.9205 Root MSE = 0.05691
Coef.
Robust
Std.
Err.
t P > ⏐t ⏐
(X/O)-1 - 0.066 0.054 - 1.23 0.219
(X/0)-2 - 0.031 0.051 - 0.61 0.540
(X/O)-3 - 0.021 0.046 - 0.46 0.643
IMPPEN-1 - 0.329*** 0.092 - 3.56 0.000
IMPPEN-2 - 0.041 0.108 - 0.38 0.701
IMPPEN-3 0.014 0.093 0.16 0.876
MEU-1 - 0.028 0.037 - 0.77 0.441
MEU-2 - 0.021 0.041 - 0.53 0.594
MEU-3 0.004 0.028 0.15 0.883
XEU-1 0.038 0.032 1.18 0.240
XEU-2 0.034 0.034 1.02 0.309
XEU-3 - 0.036 0.030 -1.21 0.227
Note: *, **, and *** indicate significance at 90%, 95%, and 99% confidence levels, respectively.
Table 8 below presents the results of the regression that tests how market
concentration affects the share of exports in output. The results indicate that an
increase in market concentration leads to a decrease in exports with a one year lag.
Presumably, a high market concentration is correlated with high markups and high
profitability in the domestic market, which will reduce incentives for searching
markets abroad. On the other hand, a decrease in market concentration will be
expected to lower profitability and force firms to search for opportunities abroad.
This result also indicates that large firms that are able to exercise market power do not
search for export markets vigorously.
13
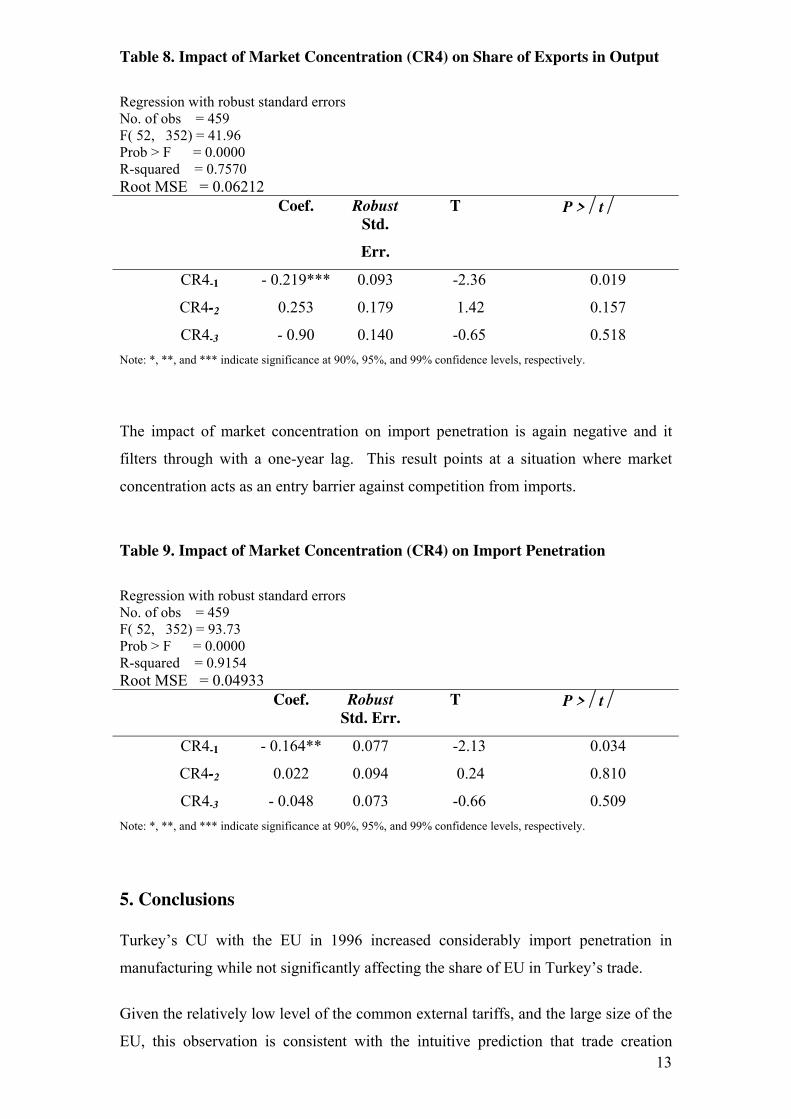
Table 8. Impact of Market Concentration (CR4) on Share of Exports in Output
Regression with robust standard errors No. of obs = 459 F( 52, 352) = 41.96 Prob > F = 0.0000 R-squared = 0.7570 Root MSE = 0.06212
Coef. Robust
Std.
Err.
T P > ⏐t ⏐
CR4-1 - 0.219*** 0.093 -2.36 0.019
CR4-2 0.253 0.179 1.42 0.157
CR4-3 - 0.90 0.140 -0.65 0.518
Note: *, **, and *** indicate significance at 90%, 95%, and 99% confidence levels, respectively.
The impact of market concentration on import penetration is again negative and it
filters through with a one-year lag. This result points at a situation where market
concentration acts as an entry barrier against competition from imports.
Table 9. Impact of Market Concentration (CR4) on Import Penetration
Regression with robust standard errors No. of obs = 459 F( 52, 352) = 93.73 Prob > F = 0.0000 R-squared = 0.9154 Root MSE = 0.04933
Coef. Robust
Std. Err.
T P > ⏐t ⏐
CR4-1 - 0.164** 0.077 -2.13 0.034
CR4-2 0.022 0.094 0.24 0.810
CR4-3 - 0.048 0.073 -0.66 0.509
Note: *, **, and *** indicate significance at 90%, 95%, and 99% confidence levels, respectively.
5. Conclusions
Turkey’s CU with the EU in 1996 increased considerably import penetration in
manufacturing while not significantly affecting the share of EU in Turkey’s trade.
Given the relatively low level of the common external tariffs, and the large size of the
EU, this observation is consistent with the intuitive prediction that trade creation

14
would dominate trade diversion. Put differently, for Turkey, the multilateral
liberalization aspect of the CU dominated over its preferential impact.
Following the CU, import penetration ratios doubled or nearly doubled in many
sectors of manufacturing. It can be expected that such an impetus would have an
important impact on the productive and industrial structure of manufacturing in
Turkey, and on its competitive behavior.
We first analyzed growth in value added, employment and capital accumulation.
Annual average growth in manufacturing value added was about 10% throughout the
whole period since 1980. Employment growth and capital accumulation, on the other
hand, picked up considerably in the post-CU era from the depressed levels of 1989-
1995. These improvements, however, were not reflected in productivity growth.
Labor productivity somewhat declined, but most remarkably, annual average
productivity growth that was attributable to technological improvement declined to a
record level of below 1%. The source of growth in manufacturing industry was
essentially due to capital accumulation in the post-CU era.
One probable explanation to this phenomenon is preemptive capacity building in
anticipation of tougher competition and/or the incentive to exploit potential export
opportunities. Another explanation is the structural disarray due to the impact of
considerably higher levels of import penetration.
There was a two-way relation between industry concentration and import penetration.
Higher concentration significantly reduced import penetration. However, once
imports managed to penetrate, they significantly reduced industry concentration.
High industry concentration was not only resisting import penetration. High
concentration was also hampering export growth. There was a significant negative
relation between high concentration and export/output ratios in the following years.
The results indicate that imports work as market discipline, but have to be
complemented with competition policy.
It should also be noted that the trade shares of the EU did not affect industry
concentrations. It was import penetration from all sources that mattered. Hence, as a

15
result of the CU, imports did have a disciplining effect on Turkish manufacturing, but
not the EU.
References Arellano, M. and S. Bond (1991), “Some Tests of Specification for Panel Data: Monte Carlo Evidence and an Application to Employment Equations,” Review of Economic Studies, Vol. 58, pp.277-297. Bayar, A., H. Nuray and S. Reçberoğlu (2000), “The Effects of the Customs Union on the Turkish Economy: An Econometric Analysis of the Four Years’ Implementation,” Economic Development Foundation, No. 160, Istanbul. Bernard, A. and C. Jones (1996), “Productivity and Convergence Across US States and Industries,” Empirical Economics, Vol. 21, pp.113-135. Cameron, G., J. Proudman and S. Redding (1998), “Deconstructing Growth in UK Manufacturing” in (eds. Proudman and Redding) Openness and Growth, Bank of England. Connelly, M. (1998), “The Dual Nature of Trade: Measuring its Impact on Imitation and Growth,” Duke University Department of Economics Working Paper,
No: 97/34.
Dollar, D. (1992), “Outward-Oriented Developing Economies Really Do Grow More Rapidly: Evidence from 95 LDCs,” Economic Development and Cultural
Change, Vol. 40, pp. 523-44. Edwards, S. (1998), “Opennes, Productivity and Growth: What Do We Really Know?” Economic Journal, Vol. 108, July, pp 383-98. Erzan, R., A. Filiztekin (1997), “Competitiveness of Turkish SMSEs in the Customs Union,” European Economic Review, Vol. 41, pp. 881-892. Feeney, J. (1999), “International Risk Sharing, Learning by Doing, and Growth,” Journal of Development Economics,. Vol. 58, pp 297-318. Filiztekin, A. (2000), “Openness and Productivity Growth in Turkish Manufacturing,”
mimeo. Foroutan, F. (1996), “Turkey 1976-85: Foreign Trade, Industrial Productivity and Competition,” in Industrial Evolution in Developing Countries, eds. M. J. Roberts and J. R. Tybout, A World Bank Book, Washington. Grossman, G. and E. Helpman (1991), Innovation and Growth in the Global
Economy, MIT Press. Harrigan J. (1999), “Estimation of Cross-Country Differences in Industry Production Functions,” Journal of International Economics, Vol. 47 pp. 267-93. Harrison G. W., T .F. Rutherford and D. G. Tarr (1996), “Economic Implications for Turkey of a Customs Union with the European Union,” Policy Research Working
Paper, No. 1599, World Bank.

16
Holtz-Eakin, D, W. Newey and H. Rosen (1988), “Estimating Vector Autoregressions With Panel Data,” Econometrica, Vol. 56 pp. 1371-95. Hsieh, C (1997), “Measuring Technological Change,” University of California,
Berkeley, Working Paper. Katırcıoğlu, E., N. Engin and C. Akçay. (1995), ‘‘The Impact of Trade Liberalization on the Turkish Manufacturing Industry: An Empirical Assessment’’ in R. Erzan (ed.), Policies for Competition and Competitiveness. Pp. 33-51. Vienna: UNIDO. Kim, E. (2000), “Trade Liberalization and Productivity Growth in Korean Manufacturing Industries: Price Protection, Market Power and Scale Efficiency,” Journal of Development Economics, Vol. 62 pp. 55-83. Krueger, A. and B. Tuncer (1982), “Growth of Factor Productivity in Turkish Mnufacturing Industry,” Journal of Development Economics, Vol. 11 pp. 307-25. Krugman, P. (1994), “The Myth of Asia's Miracle,” Foreign Affairs, 73/6 December pp. 62-77. Küçükahmetoğlu, O., (2000), “Türkiye-AB Gümrük Birliği’nin İktisadi Etkileri,” Iktisat Dergisi, No. 408. Levinsohn, J. (1993), “Testing the Imports-as-Market-Discipline Hypothesis,” Journal of International Economics, Vol. 35 pp. 1-22. Nelson, R. and H. Pack (1999), “The Asian Miracle and Modern Growth Theory,” Economic Journal, Vol. 109, July, pp. 416-36. Nishimizu, M and S. Robinson (1984), “Trade Policies and Productivity Change in Semi-industrialized Countries,” Journal of Development Economics, Vol. 16 pp. 177-206. Metin-Ozcan, K, E. Voyvoda and E. Yeldan (1999), “Dynamics of Macroeconomic Adjustment in a Globalized Developing Economy: Growth, Accumulation and Distribution, Turkey 1969-1998”, Bilkent University Discussion Papers, No. 99-5 Metin-Özcan K., E. Voyvoda and E. Yeldan. (2000), “On the Patterns of Trade
liberalization, Oligopolistic Concentration and Profitability: Reflections from post-
1980 Turkish Manufacturing”, Department of Economics Discussion Paper No: 00-
12, Bilkent University, Ankara.
Öz, G. (1999), ''Competition Law and Practice in Turkey.'' European Competition
Law Review, Vol. 20-3: 149-158. Rodrigues, F. and D. Rodrik (1999), “Trade Policy and Economic Growth: A Skeptic’s Guide to the Cross-national Evidence,” NBER Working Paper No.: 7081.

17
Rodrik, D. (1995), “Trade and Industrial Policy Reform,” in Handbook of
Development Economics, eds. J. Behrman and T.N. Srinivasan, North Holland, Amsterdam. Senses, F. (1994), Recent industrialization experience of Turkey in a global context. Contributions in Economics and Economic History, no. 155. Westport, Conn. and London: Greenwood Press, 1994. Togan, S. (1994), Foreign Trade Regime and Trade Liberalisation in Turkey during
1980's. London: Avebury Press. Togan, S. (undated), 1980’li Yillarda Turk Dis Ticaret Rejimi ve Dis Ticartein
Liberlizasyonu. Turk Eximbank Arastima Dizisi 1. Togan, S. and Balasubramanyam (1996), The Economy of Turkey Since
Liberalization. New York: St. Martin's Press; London: Macmillan Press. Weinhold, D. and J. Rauch (1997), “Openness, Specialization, and Productivity Growth in Less Developed Countries,” NBER Working Paper, No. 1997. Yalçın, Cahit (2000), ‘‘Price-Cost Margins and Trade Liberalization in Turkish
Manufacturing Industry: A Panel Data Analysis’’, Research Department Discussion
Paper No. 37, Central Bank of the Republic of Turkey, Ankara.
Young A. (1998a), “Alternative Estimates of Productivity Growth in the NICs: A Comment on the Findings of Chang-Tai Hsieh,” NBER Working Paper No.: 6657. Young A. (1998b), “Paasche vs. Laspeyres: The Elasticity of Substitution and Bias in Measures of TFP Growth,” NBER Working Paper No.: 6663. 37

Table 1. Trade Ratios and Trade Shares, 1981-1999 (%) Export-Output Ratio Import Penetration Sh. Of Imp. from EU in Tot Imp Sh. Of Exp. to EU in Tot Exp
1981-1988 1989-1995 1996-1999 1981-1988 1989-1995 1996-1999 1981-1988 1989-1995 1996-1999 1981-1988 1989-1995 1996-1999
311Food 10,48 11,31 11,95 4,22 5,91 6,62 56,32 31,94 35,65 37,78 51,49 48,28
313Beverage 1,04 1,51 1,96 0,57 0,46 0,69 58,69 86,97 60,32 19,82 27,09 28,47
314Tobacco 13,09 1,29 2,84 3,68 7,20 7,89 15,79 4,83 6,32 18,04 13,51 20,58
321Textiles 19,15 20,09 25,61 2,80 6,42 11,65 46,09 31,84 42,25 70,01 69,77 60,52
322Clothing 59,31 42,39 45,89 0,52 0,51 3,62 61,22 73,30 71,89 81,67 76,93 66,81
323Leather 4,28 10,77 11,37 7,07 25,47 24,87 81,32 68,76 66,40 60,93 65,34 45,85
324Footwear 7,00 15,98 17,76 1,85 7,24 14,20 67,26 30,51 70,39 36,22 25,01 16,32
331Wood 7,18 4,23 5,83 2,81 3,42 8,67 59,61 53,17 48,39 18,79 27,07 22,84
332Furniture 17,07 6,31 8,21 3,91 6,20 12,40 83,77 87,15 83,65 10,20 30,52 43,96
341Paper 2,91 2,87 6,09 8,30 15,10 28,43 45,59 59,22 61,95 2,67 16,96 15,25
342Printing 1,28 0,58 1,09 2,01 3,12 3,16 79,56 81,27 80,73 48,84 45,44 30,44
351Chemicals 9,75 11,86 11,72 31,02 35,31 50,45 52,81 55,02 57,59 24,07 42,34 39,20
352Other Chemicals 2,74 4,37 6,51 9,48 12,02 18,18 61,90 72,04 72,60 31,55 18,22 12,06
354Misc. Products of Petroleum 0,26 0,26 0,45 1,16 2,01 4,66 61,84 64,03 47,88 39,51 59,41 28,45
355Rubber 4,62 13,01 17,69 4,43 8,64 14,43 59,21 63,81 67,15 24,89 35,51 59,02
356Plastics 3,73 3,23 6,68 2,35 6,99 10,90 71,93 77,86 70,38 11,03 27,04 19,41
361Pottery 3,42 3,53 10,02 1,11 2,08 5,31 62,61 59,17 66,22 55,27 78,23 75,30
362Glass and Products 14,76 15,40 18,81 3,03 6,35 11,50 73,24 70,84 68,92 38,94 52,73 45,05
369Other non-metallic 1,91 5,24 7,72 3,63 3,52 3,46 73,72 79,61 81,81 24,91 47,39 40,42
371Iron & steel 9,64 14,82 15,83 13,21 14,05 16,13 61,34 48,85 43,94 20,12 12,43 25,11
372Non-ferr. Metals 5,43 8,81 13,53 14,92 18,49 29,29 57,42 40,27 34,60 13,34 41,89 43,67
381Fabricated Metal 7,03 6,66 10,71 18,51 26,28 27,79 43,38 62,72 60,80 20,39 42,70 41,60
382Machinery 8,55 4,36 10,35 40,60 39,26 51,98 60,29 68,64 67,04 36,98 42,15 43,60
383Electrical Machinery 4,69 9,65 17,64 25,15 24,41 35,54 40,17 58,75 69,14 23,31 64,26 64,03
384Motor Vehicles 3,07 4,28 11,27 22,58 20,52 29,95 69,94 53,20 63,29 32,44 45,44 45,28
385Prof&scientific equip. 20,81 6,47 7,47 77,53 57,26 56,21 57,98 58,93 58,06 51,08 38,59 46,19
390Others 13,58 19,94 40,94 13,04 31,93 45,76 62,42 53,69 49,88 24,37 52,97 30,30
Total 9,16 10,34 13,50 12,22 14,20 19,94 55,25 55,49 59,61 49,78 54,12 50,75

19
Table 4. Growth Accounting, 1981-1999 (%)
1981-1988 1989-1995 1996-1999
Value
Added Labor Capital TFP
Value
Added Labor Capital TFP
Value
Added Labor Capital TFP
Food 7.90 12.62 53.61 33.83 8.25 -0.04 60.03 40.06 3.61 14.16 280.81 -196.06
Beverage 7.18 9.45 152.08 -61.42 9.67 -4.38 -15.21 119.54 -5.18 1.70 296.26 -397.74
Tobacco 13.68 2.33 112.26 -14.60 24.88 0.71 106.80 -7.30 -8.39 -12.26 139.15 -227.56
Textiles 6.57 13.10 44.82 42.06 8.23 1.26 34.77 63.88 11.30 14.24 107.83 -22.19
Clothing incl. Footwear 27.96 17.64 24.70 57.59 10.17 12.40 161.84 -73.94 -6.00 -10.41 165.47 -255.33
Leather 7.12 20.84 -20.56 99.73 13.14 1.48 13.85 84.66 -10.42 -6.17 322.54 -416.80
Wood 4.01 9.49 -90.49 181.00 15.63 -1.80 72.92 28.64 1.59 51.14 765.52 -714.85
Furniture 18.43 10.76 14.00 75.25 5.78 16.53 137.64 -54.20 17.61 14.33 114.97 -29.29
Paper 13.56 10.27 46.60 43.14 9.62 6.40 12.27 81.23 20.89 -1.22 57.66 43.72
Printing 10.54 15.51 -2.37 86.83 -4.04 -6.10 344.34 -438.47 -1.69 17.05 305.55 -420.59
Chemicals 12.45 6.15 30.84 62.97 5.53 22.89 16.82 61.28 12.31 -19.88 59.11 60.07
Misc. Products of Petroleum 5.40 7.00 -84.18 177.18 2.85 -2.99 472.07 -369.66 -2.53 35.91 367.20 -503.50
Rubber 11.67 8.14 51.52 40.21 7.34 -13.93 132.85 -18.87 -4.63 8.38 98.44 -206.04
Pottery, Glass & Minerals 7.19 13.78 10.39 75.68 9.90 -4.45 91.54 13.22 2.49 39.62 257.63 -198.75
Iron & steel and Non-ferr. Metals 12.28 8.50 0.09 91.39 9.64 -3.94 24.91 79.08 9.15 3.08 63.57 33.53
Fabricated Metal 8.78 11.09 -4.28 92.98 10.76 -2.61 118.98 -16.25 18.72 8.63 5.87 85.52
Machinery 9.99 9.28 -48.16 138.92 9.57 -3.95 28.73 75.24 10.69 5.65 89.73 4.49
Electrical Machinery 11.25 9.52 44.76 45.54 18.51 -0.30 21.76 78.57 19.99 10.08 27.22 62.74
Motor Vehicles 13.57 11.06 48.34 40.65 13.77 5.70 49.56 44.69 -1.76 17.51 334.25 -451.25
Plastics nec., Instruments and Others 7.45 18.01 39.01 43.25 18.07 3.24 62.00 34.77 27.14 4.90 58.72 36.45
Total 9.69 11.93 24.22 63.82 10.32 2.30 54.27 43.48 10.20 5.23 86.08 8.58

20
Table 5. Industry Concentration in Manufacturing, 1980-1998 CR4 (%) CR8 (%) Herfindahl Index
1980-1998 1980-1988 1989-1995 1996-1998 1980-1998 1980-1988 1989-1995 1996-1998 1980-1998 1980-1988 1989-1995 1996-1998
Food 12,26 11,40 13,44 12,09 18,72 17,95 19,93 18,17 0,85 0,78 0,94 0,82
Other Food 20,91 23,18 18,68 19,30 29,49 31,20 27,63 28,67 2,01 2,42 1,59 1,74
Beverage 40,38 46,71 33,06 38,48 57,43 63,34 50,36 56,23 6,90 8,62 4,98 6,20
Tobacco 61,43 62,41 61,53 58,22 77,98 77,94 78,34 77,28 12,43 13,06 11,90 11,80
Textiles 8,48 9,45 8,20 6,22 14,49 15,86 14,31 10,82 0,63 0,73 0,61 0,41
Clothing 12,34 19,40 5,65 6,77 18,09 26,62 9,93 11,55 1,21 2,11 0,38 0,45
Leather 21,88 18,66 26,69 20,36 34,05 29,47 40,50 32,70 2,37 1,95 3,00 2,17
Footwear 43,28 50,69 37,25 35,16 59,06 65,39 53,96 51,95 7,90 10,55 5,91 4,57
Wood 22,01 17,32 23,13 33,48 34,24 28,94 35,38 47,47 2,49 1,85 2,52 4,32
Furniture 44,82 46,14 43,83 43,20 58,50 58,60 59,34 56,24 7,87 9,24 6,38 7,21
Paper 30,39 38,13 24,91 19,96 46,33 54,62 41,64 32,43 4,16 5,59 3,17 2,18
Printing 46,13 38,11 53,24 53,62 58,64 53,11 62,82 65,51 7,66 5,12 9,31 11,43
Chemicals 47,41 41,83 52,74 51,74 64,90 61,18 68,69 67,24 8,59 6,85 10,45 9,49
Other Chemicals 21,82 22,37 22,33 18,99 35,17 36,01 35,83 31,09 2,44 2,45 2,57 2,12
Refineries 98,67 99,27 98,23 97,89 100,00 100,00 100,00 99,99 32,82 36,20 30,02 29,19
Misc. Products of Petroleum 68,98 67,09 73,68 63,68 86,60 87,25 88,65 79,87 18,11 15,95 22,56 14,21
Rubber 71,83 70,72 72,37 73,90 80,98 81,62 80,58 79,99 15,53 14,55 16,05 17,26
Plastics 20,42 21,40 20,40 17,52 31,24 31,94 30,84 30,07 1,92 2,01 1,89 1,72
Pottery 62,08 63,87 58,90 64,09 82,73 83,45 81,42 83,65 13,72 15,31 11,45 14,25
Glass and Products 56,53 62,19 53,40 46,83 78,76 83,03 77,66 68,49 10,57 12,38 9,56 7,48
Other non-metallic 18,68 18,33 19,62 17,56 31,38 30,17 33,69 29,64 2,00 1,99 2,11 1,81
Iron & steel 39,08 44,79 34,00 33,79 52,58 57,19 48,67 47,85 5,72 7,17 4,46 4,33
Non-ferr. Metals 46,48 48,79 46,01 40,66 62,78 66,43 61,54 54,72 7,21 7,78 7,09 5,79
Fabricated Metal 15,94 14,96 18,23 13,49 23,46 22,68 25,30 21,51 1,33 1,25 1,56 1,06
Machinery 40,00 37,57 44,42 37,01 53,58 49,92 58,70 52,61 5,62 4,62 7,33 4,63
Electrical Machinery 26,05 23,80 28,10 28,04 39,98 36,18 43,81 42,46 2,96 2,58 3,38 3,16
Motor Vehicles 39,88 35,64 46,58 36,92 56,82 53,90 60,16 57,79 5,73 4,72 7,33 5,03
Prof&scientific equip. 42,74 34,28 48,31 55,13 57,84 50,79 63,65 65,43 8,20 5,11 9,55 14,34
Others 32,90 38,34 29,61 24,25 45,80 49,02 43,97 40,38 5,06 6,82 3,69 3,01
Average 38,41 38,86 38,50 36,84 51,43 51,85 51,63 49,72 7,03 7,23 6,96 6,63


![Set operators (UNION, UNION ALL, MINUS, INTERSECT) [SQL]](https://static.fdocuments.us/doc/165x107/56649cfa5503460f949cbcb4/set-operators-union-union-all-minus-intersect-sql.jpg)