TTC 2017 Annual Report · to submit the 2017 Annual Report for the Toronto Transit Commission. It...
72
2017 Annual Report Toronto Transit Commission
Transcript of TTC 2017 Annual Report · to submit the 2017 Annual Report for the Toronto Transit Commission. It...

2017Annual Report
Toronto Transit Commission


ContentsChair’s Letter 3
The TTC Board 7
CEO’s Statement 9
Executive Team 13
Line 1 Extension opens to the public 15
Corporate Plan Achievements 2017 18
Consolidated Financial Statements of Toronto Transit Commission 21 Year ended December 31, 2017
Notes to the Consolidated Financial Statements 29 for the Year ended December 31, 2017
Supplementary Schedules Year ended December 31, 2017 61
Management Directory – December 31, 2017 67

TTC’s Line 1 Extension to York Region opened to the public on December 17, 2017.
2 | Toronto Transit Commission – Annual Report 2017

Chair’s Letter
To: Mayor John Tory and Councillors of the City of Toronto
As Chair of North America’s Transit System of the Year, it is my privilege to submit the 2017 Annual Report for the Toronto Transit Commission.
It was a great honour for the TTC, Commissioners and all staff to accept the American Public Transportation Association’s award for Outstanding Public Transit System for 2017. The entire organization was proud to be recognized by our industry peers who selected the TTC for the monumental work that was achieved over the past five years to modernize the network on all fronts: Safety; Customer; People; Assets; Reputation; Financial Sustainability; and Growth. We improved all aspects of TTC service to achieve our vision of a transit system that makes Toronto proud.
A year of significant accomplishments was capped off on December 15, 2017 as the TTC stood with our federal, provincial and municipal funding partners to celebrate the much-anticipated and long-awaited official opening of the Line 1 subway extension into Vaughan, in York Region. The 8.6-kilometre extension from Sheppard West to Vaughan Metropolitan Centre opened to the public two days later.
It was truly a milestone for rapid transit in Toronto and neighbouring York Region. The Toronto-York Spadina Subway Extension is the first subway to cross the Toronto municipal boundary. It is also the first subway expansion to open in 15 years. Along with our funding partners, we are determined to see more major transit projects get built sooner in our great city.
In 2017, we saw continued improvements in the planning and scheduling of TTC services. More than 250 schedule adjustments were made to the network last year. Many of these adjustments were aimed at improving overall performance and resulted in less overcrowding and more reliable service for customers. Subway riders were served by nine more accessible stations – St Clair, Woodbine, Coxwell and the six on the new extension. Our streetcar network saw nearly 60 new accessible cars in service and the bus network was reinvigorated by hundreds of new clean diesel buses. Over the next few years, we’re set to receive more than a thousand low-emission and zero-emission buses as the TTC accelerates its green bus procurement program.
Subway riders were served by nine more accessible stations – St Clair, Woodbine, Coxwell and the six on the new extension.
| 3

This is what the new TTC looks like: modern, accessible and connected. These improvements are all part of creating a better, more reliable public transit service for Toronto, which already carries well over half a billion people each year.
I would like to thank Mayor Tory and Toronto City Council for their continued support for the TTC and public transit in Toronto. I would also like to thank my fellow Commissioners who served with me in 2017: Vice-Chair Alan Heisey Q.C., John Campbell (Ward 4 Etobicoke Centre), Mary Fragedakis (Ward 29 Toronto-Danforth), Vincent Crisanti (Ward 1 Etobicoke North), Deputy Mayor-East Glenn De Baeremaeker (Ward 38 Scarborough Centre), Joe Mihevc (Ward 21 St. Paul’s), Deputy Mayor-North Denzil Minnan-Wong (Ward 34 Don Valley East), and Rick Byers, Ron Lalonde and Joanne De Laurentiis. Lastly, thank you to the thousands of women and men at the TTC who work every day to keep our city moving.
Sincerely,
Josh Colle TTC Chair April 2018
4 | Toronto Transit Commission – Annual Report 2017

The Line 1 Extension has six accessible stations and is 8.6 kilometres in length.
| 5

From Sheppard West (formerly Downsview) Station, the Line 1 Extension runs northwest through York University and north into York Region.
6 | Toronto Transit Commission – Annual Report 2017

The TTC BoardAs at December 2017
Josh Colle Chair
Alan Heisey Q.C. Vice-Chair
Commissioners
Joanne De Laurentiis
Rick Byers John Campbell Mary Fragedakis Vincent Crisanti
Glenn De Baeremaeker
Ron Lalonde Joe Mihevc Denzil Minnan-Wong
| 7

The Line 1 Extension is the first subway expansion crossing the municipal boundary of Toronto.
8 | Toronto Transit Commission – Annual Report 2017

CEO’s Statement
2017 will be remembered for the grand opening of the Line 1 subway extension to Vaughan.
To: TTC Chair and Commissioners, Mayor John Tory and Councillors of the City of Toronto
In 2017 we saw truly a transformative year for the TTC. We can all look back with pride at the results of our hard work and the unparalleled transit service that we delivered to the people of Toronto and beyond. I give tremendous credit to our dedicated and hard-working employees who build, maintain and operate a world-class and award-winning public transit network. Our first goal is to always provide great service to our customers – and that is what we achieved.
As a result we can call ourselves North America’s Outstanding Public Transit System for 2017. We have accomplished a great deal to keep Toronto moving forward. From reversing service cuts and increasing service to making incredible strides on accessibility across the system, I’m proud of the efforts that we have made over the last five years. And our peers at the American Public Transportation Association have acknowledged it with Transit System of the Year honours.
2017 will be remembered for the grand opening of the Line 1 subway extension to Vaughan. It was an awesome event that saw the launch of the newest stretch of track to our subway network since Line 4 Sheppard opened in 2002. And for the first time the TTC subway reached across to serve our riders beyond Toronto’s border.
The extension is an incredible, state-of-the-art subway. Six beautiful and accessible stations feature a modern fare collection system, an abundance of unique public art, bike facilities and commuter parking. The line enables numerous new transit connections to help move commuters more seamlessly across the Greater Toronto Area with links to GO rail service, TTC, York Region Transit, Viva and Brampton bus services, and future connections to the Highway 407 Transitway and Finch West LRT.
Even more impressive, the extension features state-of-the-art, communications-based train control, also known as Automatic Train Control, the modern signalling system that will enable the TTC to run trains closer together safely when it is fully fitted throughout Line 1 in the near future.
| 9

It was a personal thrill to witness on the first day of service the first northbound and southbound trains deliver our funding partners to Pioneer Village Station for a celebratory Toronto-York greeting. It was an unprecedented moment in our history.
I cannot thank enough our incredible workforce, including former Chief Executive Officer Andy Byford, for inspiring us to build a transit system that makes Toronto proud. He paved the way forward with the TTC’s inaugural Five-Year Corporate Plan, which was successfully capped off with the TTC receiving APTA’s coveted top award and the opening of the Toronto-to-York subway.
The latter proved to be the perfect launching pad to the TTC’s next five-year plan, which will take Toronto’s transit system to the next level. The TTC has a great deal of exciting projects to deliver over the next five-year period to keep Toronto moving in the right direction.
Sincerely,
Richard J. Leary Chief Executive Officer (Acting) April 2018
10 | Toronto Transit Commission – Annual Report 2017

The Line 1 Extension was jointly funded by the Government of Canada, the Province of Ontario, the City of Toronto and The Regional Municipality of York.
| 11

The Line 1 Extension is the first subway expansion since Line 4 Sheppard opened in 2002.
12 | Toronto Transit Commission – Annual Report 2017

Executive Team
Rick Leary Chief Executive Officer (Acting)
Kirsten Watson Deputy Chief Executive Officer (Acting)/Chief Customer Officer
Susan Reed Tanaka Chief Capital Officer
Dan Wright Chief Financial Officer
Collie Greenwood Chief Service Officer (Acting)
John O’Grady Chief Safety Officer
Gemma Piemontese Chief People Officer
Brad Ross Executive Director of Corporate and Customer Communications
Joan Taylor Chief of Staff
Jim Ross Chief Operating Officer (Acting)
Megan MacRae Executive Director of Human Resources
Jim Fraser Deputy Chief Operating Officer (Acting)
| 13

Prime Minister Justin Trudeau joined TTC Chair Josh Colle, Ontario Premier Kathleen Wynne and Toronto Mayor John Tory to officially open the Line 1 Extension on December 15, 2017.14 | Toronto Transit Commission – Annual Report 2017

Line 1 Extension opens to the public
The TTC’s Line 1 Extension to York Region opened to the public on December 17, 2017. In a historic moment, the first trains simultaneously departed Sheppard West and Vaughan Metropolitan Centre at 8 a.m., marking the start of revenue service to and from York Region.
The official ribbon-cutting ceremony on the Toronto-York Spadina Subway Extension project was held on December 15 at Vaughan Metropolitan Centre terminal station by Prime Minister Justin Trudeau, Premier Wynne, Mayor Tory and Wayne Emmerson, Regional Chairman and CEO of York Region. Dignitaries took the ceremonial first ride to York University – home station to more than 50,000 students, staff and faculty.
The Line 1 Extension project is a six-station, 8.6-km extension of the Line 1 Yonge-University Subway from the current Sheppard West Station, northwest through York University, and north into York Region. It represents the TTC’s first subway expansion crossing the municipal boundary of Toronto into the 905 region. The project was jointly funded by the Government of Canada, the Province of Ontario, the City of Toronto and The Regional Municipality of York.
The Line 1 Extension is expected to add an estimated 36 million transit trips and eliminate 30 million car trips per year, helping to ease traffic congestion, improve air quality and fight climate change.
| 15

Vaughan Metropolitan Centre Station is Line 1’s new terminal station.
16 | Toronto Transit Commission – Annual Report 2017

Here are the six stations:
Vaughan Metropolitan Centre: is located north of Highway 7 to the west side of the relocated Millway Avenue. The terminal station is a multi-modal transportation hub with on-street passenger pick up and drop off (on New Park Place and Millway Avenue) , and connections to YRT SmartREIT Bus Terminal and to the Viva BRT, which will run in the centre of Highway 7. Includes: four elevators and six escalators.
Highway 407: is located west of Jane Street and south of Highway 407, west of Black Creek. Includes: 18-bay GO/YRT/Viva bus terminal, 560-space commuter lot, one passenger-pick-up-and-drop-off (30spaces), connection to future Highway 407 Transitway. Includes: twoelevators and seven escalators.
Pioneer Village: is located diagonally below Steeles Avenue West. Includes: 12-bay TTC and 5-bay YRT bus terminal, 1,950-space commuter lot, one passenger-pick-up-and-drop-off (11 spaces). Includes: four elevators and 10 escalators.
York University: is located at York University, crossing underneath Ian Macdonald Boulevard in the heart of the Keele Campus at the east end of the Harry W. Arthurs Common. Includes: two elevators and six escalators.
Finch West: is located under Keele Street, north of Finch Avenue West. Includes: Five-bay TTC bus terminal, 358-space commuter lot, one passenger-pick-up-and-drop-off (10 spaces), future connection to Finch West LRT. Includes: three elevators and eight escalators.
Downsview Park: is located at Downsview Park on the south side of Sheppard Avenue West, centred under GO Transit’s Barrie Commuter Rail line. Includes: connection to Barrie GO rail service. Includes: three elevators and six escalators.
| 17
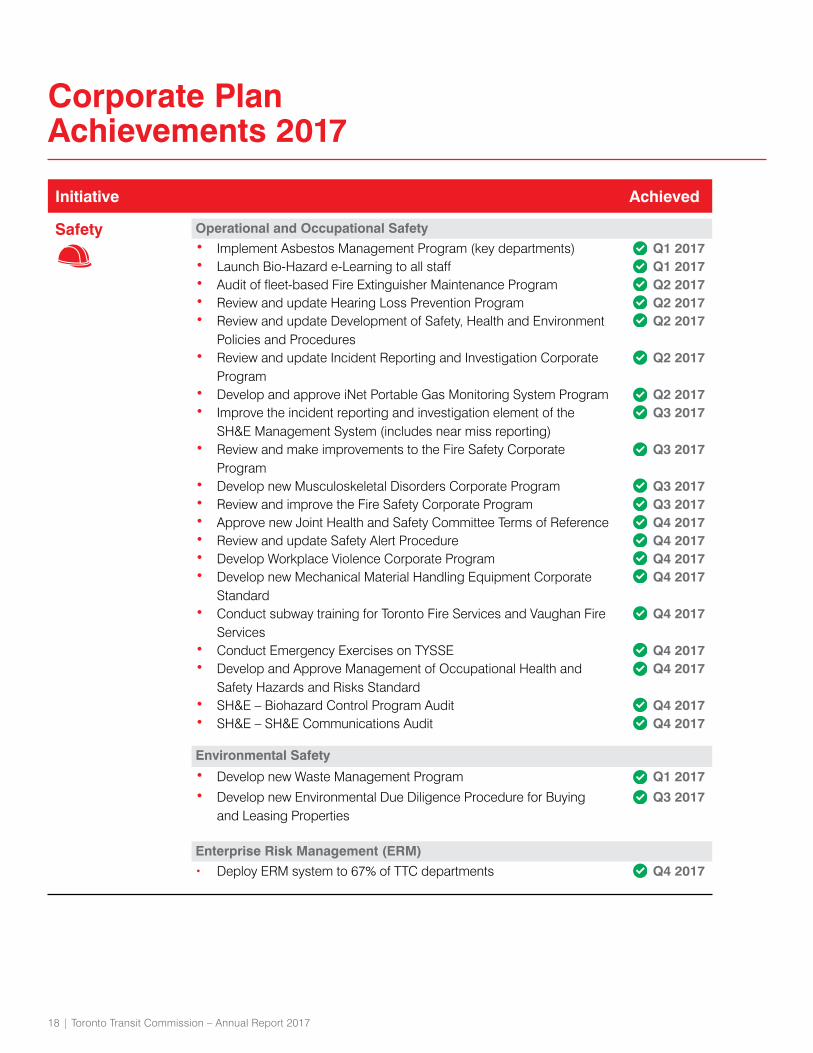
Corporate PlanAchievements 2017
Initiative Achieved
Safety Operational and Occupational Safety• Implement Asbestos Management Program (key departments) Q1 2017• Launch Bio-Hazard e-Learning to all staff Q1 2017• Audit of fleet-based Fire Extinguisher Maintenance Program Q2 2017• Review and update Hearing Loss Prevention Program Q2 2017• Review and update Development of Safety, Health and Environment Q2 2017
Policies and Procedures• Review and update Incident Reporting and Investigation Corporate Q2 2017
Program• Develop and approve iNet Portable Gas Monitoring System Program Q2 2017• Improve the incident reporting and investigation element of the Q3 2017
SH&E Management System (includes near miss reporting)• Review and make improvements to the Fire Safety Corporate Q3 2017
Program• Develop new Musculoskeletal Disorders Corporate Program Q3 2017• Review and improve the Fire Safety Corporate Program Q3 2017• Approve new Joint Health and Safety Committee Terms of Reference Q4 2017• Review and update Safety Alert Procedure Q4 2017• Develop Workplace Violence Corporate Program Q4 2017• Develop new Mechanical Material Handling Equipment Corporate Q4 2017
Standard• Conduct subway training for Toronto Fire Services and Vaughan Fire Q4 2017
Services• Conduct Emergency Exercises on TYSSE Q4 2017• Develop and Approve Management of Occupational Health and Q4 2017
Safety Hazards and Risks Standard• SH&E – Biohazard Control Program Audit Q4 2017• SH&E – SH&E Communications Audit Q4 2017
Environmental Safety• Develop new Waste Management Program Q1 2017• Develop new Environmental Due Diligence Procedure for Buying Q3 2017
and Leasing Properties
Enterprise Risk Management (ERM)• Deploy ERM system to 67% of TTC departments Q4 2017
18 | Toronto Transit Commission – Annual Report 2017

Initiative Achieved
Customer Customer Information Strategy• Install LED Signage Group 2 (25 Shelters) Q1 2017• Install LED Signage Group 3 (25 Shelters) Q1 2017
Customer Charter• Pilot subway musician stages Q1 2017• Install 200 passenger information displays in shelters Q2 2017• PRESTO-enabled fare gates at 43 subway stations Q2 2017• Launch an anti-harassment campaign Q3 2017• Launch a safety and security app Q3 2017• Keep customers informed by adopting consistent, customer friendly Q3 2017
language for communicating service status information.• Work with Bike Share Toronto to incorporate docking stations at a Q3 2017
minimum of five TTC stations• Test new technology to improve route management and real time Q3 2017
information for buses and streetcars• Open a new second exit/entrance at Woodbine Station Q3 2017• Two elevators in service at Woodbine Station Q3 2017• Enable Wi-Fi at 100% of stations Q4 2017• Revise schedules on 10 bus routes Q4 2017
Primary Revenue Strategy• Confirm legacy concession fare decommissioning strategy Q2 2017• Complete installation of fare gates at 15 secondary entrances Q2 2017• Commence fare gate installations at initial 26 PRESTO-enabled Q3 2017
stations
People Performance Management Framework• Implement Discipline Process Program Q2 2017• Draft Rewards & Recognition policy Q2 2017Staff Engagement Strategy• Create Management Essentials Employee Engagement Survey Q2 2017
training moduleManagement Development and Succession Planning• Launch Mental Wellness campaign Q1 2017• Launch Graduate Development Leadership Program Q1 2017• Commence Leadership Fundamentals cohort 3&4 Q1 2017• Launch Leadership Advantage Program Q2 2017• Launch Emerging Leaders Program Q2 2017• Develop internal mentorship pilot for Internal LEAD Program Q2 2017
| 19

Initiative Achieved
Assets Capacity Management • Receive last 2 cars of trainset #82 Q2 2017Second Exit and Easier Access Programs• New accessible streetcars on 514 Cherry route Q2 2017
Growth Toronto-York Spadina Subway Extension• Downsview Park Station-Substantial Performance Q1 2017• York University Station-Substantial Performance Q1 2017• Traction Power on Q1 2017• Vaughan Metropolitan Centre Station-Substantial Performance Q1 2017• TYSSE opens Q4 2017
Financial Sustainability
Wheel-Trans• Roll out new Wheel- Trans eligibility processes and expanded Q1 2017
eligibility criteria• Complete public consultations Q2 2017• Introduce Wheel-Trans Family of Services pilot Q2 2017• Introduce new Wheel- Trans No-Show and Late Cancellation policies Q3 2017
that are more flexible, including allowing for same-day cancellations
Reputation Positive Contribution• Complete Customer Perceptions of the TTC Retail Environment Q1 2017• Complete TTC Customer Segmentation Study Q1 2017• Complete training for Managers/Supervisors on Human Rights, Q1 2017
Diversity & Inclusion Lens• Results available TTC Origin-Destination Study Q2 2017• Complete Federal Tax Credit for Transit Passes Survey Q2 2017
20 | Toronto Transit Commission – Annual Report 2017

Consolidated Financial Statements of Toronto Transit Commission
Year ended December 31, 2017
| 21

June 13, 2018
Independent Auditor’s Report
To the Members of the Board of
the Toronto Transit Commission
We have audited the accompanying consolidated financial statements of the Toronto Transit Commission,
which comprise the consolidated statement of financial position as at December 31, 2017 and the
consolidated statements of operations and accumulated surplus, remeasurement gains and losses, net debt
and cash flows for the year then ended, and the related notes, which comprise a summary of significant
accounting policies and other explanatory information.
Management’s responsibility for the consolidated financial statements
Management is responsible for the preparation and fair presentation of these consolidated financial
statements in accordance with Canadian public sector accounting standards, and for such internal control
as management determines is necessary to enable the preparation of consolidated financial statements
that are free from material misstatement, whether due to fraud or error.
Auditor’s responsibility
Our responsibility is to express an opinion on these consolidated financial statements based on our audit.
We conducted our audit in accordance with Canadian generally accepted auditing standards. Those
standards require that we comply with ethical requirements and plan and perform the audit to obtain
reasonable assurance about whether the consolidated financial statements are free from material
misstatement.
An audit involves performing procedures to obtain audit evidence about the amounts and disclosures in
the consolidated financial statements. The procedures selected depend on the auditor’s judgment,
including the assessment of the risks of material misstatement of the consolidated financial statements,
whether due to fraud or error. In making those risk assessments, the auditor considers internal control
relevant to the entity’s preparation and fair presentation of the consolidated financial statements in order
to design audit procedures that are appropriate in the circumstances, but not for the purpose of expressing
an opinion on the effectiveness of the entity’s internal control. An audit also includes evaluating the
appropriateness of accounting policies used and the reasonableness of accounting estimates made by
management, as well as evaluating the overall presentation of the consolidated financial statements.
We believe that the audit evidence we have obtained in our audit is sufficient and appropriate to provide a
basis for our audit opinion.
PricewaterhouseCoopers LLP
PwC Tower, 18 York Street, Suite 2600, Toronto, Ontario, Canada M5J 0B2
T: +1 416 863 1133, F: +1 416 365 8215
“PwC” refers to PricewaterhouseCoopers LLP, an Ontario limited liability partnership.
22 | Toronto Transit Commission – Annual Report 2017

|
Opinion
In our opinion, the consolidated financial statements present fairly, in all material respects, the financial
position of the Toronto Transit Commission as at December 31, 2017 and the results of its operations,
remeasurement gains and losses, change in net debt and cash flows for the year then ended in accordance
with Canadian public sector accounting standards.
Other matter
The accompanying consolidated financial statements schedule as at and for the year ended December 31,
2017 is presented as supplementary information only and is not a required part of the basic consolidated
financial statements. The information in this schedule has been subject to audit procedures only to the
extent necessary to express an opinion on the consolidated financial statements of the Toronto Transit
Commission.
Chartered Professional Accountants, Licensed Public Accountants
23

Consolidated Statement of Financial Position As at December 31
$000s 2017 2016Financial assets Cash and cash equivalents (note 4) 227,853 130,190Subsidies receivable (note 5) 1,107,850 1,122,922Accounts receivable 103,068 81,298Portfolio investments (note 6) 2,268 2,264Derivatives (note 7) 9,838 3,094
Total financial assets 1,450,877 1,339,768
Liabilities Accounts payable and accrued liabilities 770,670 681,151Deferred passenger revenue 75,392 84,380Unsettled accident claims (note 8) 156,633 192,253Employee future benefits (note 9) 687,171 633,403Environmental liabilities (note 10) 8,125 5,332Total liabilities 1,697,991 1,596,519
Net debt (247,114) (256,751)
Non‐financial assets Tangible capital assets (note 11) 10,886,858 9,983,559Spare parts and supplies inventory 138,755 139,116Prepaid expense 8,949 7,006Total non‐financial assets 11,034,562 10,129,681
Accumulated surplus 10,787,448 9,872,930
Accumulated surplus is comprised of: Accumulated operating surplus (note 12) 10,777,610 9,869,836Accumulated remeasurement gains 9,838
10,787,448 9,872,930
3,094
See accompanying notes to the consolidated financial stat
Approved:Commissioner Commissioner
ements
24 | Toronto Transit Commission – Annual Report 2017

Consolidated Statement of Operations and Accumulated Surplus For the year ended December 31
$000s 2017 Budget 2017 2016(note 16)
Operating revenue Passenger services 1,176,852 1,171,623 1,133,572Advertising 28,291 28,322 28,005Outside city services 15,598 15,383 16,940Property rental 24,691 22,690 21,529Miscellaneous 1,732 5,184 4,359Total operating revenues 1,247,164 1,243,202 1,204,405
Subsidy revenue Operating subsidies (note 13) 751,749 588,304 637,193Capital subsidies (note 14) 1,934,062 1,385,195 1,094,240Total subsidy revenues 2,685,811 1,973,499 1,731,433
Total revenues 3,932,975 3,216,701 2,935,838
Expenses Conventional transit service 2,306,327 2,166,742 2,056,868Wheel‐Trans 160,389 141,478 138,296Other functions 562 707 700Total expenses (note 15) 2,467,278 2,308,927 2,195,864
Surplus for the year 1,465,697 907,774 739,974
Accumulated surplus, beginning of the year 9,869,836 9,129,862Accumulated surplus, end of the year 10,777,610 9,869,836
See accompanying notes to the consolidated financial statements
| 25

Consolidated Statement of Remeasurement Gains and Losses For the year ended December 31
$000s 2017 2016
Accumulated remeasurement gains / (losses), beginning of the year
3,094 (18,410)
Unrealized gains in the current year (note 7) 6,270 7,162Amounts reclassified to Statement of Operations 474 14,342Accumulated remeasurement gains, end of the year 9,838 3,094
See accompanying notes to the consolidated financial statements
26 | Toronto Transit Commission – Annual Report 2017

Consolidated Statement of Net Debt For the year ended December 31
$000s 2017 Budget 2017 2016 (note 16)
Surplus for the year 1,465,697 907,774 739,974
Change in tangible capital assets Acquisitions (1,956,185) (1,402,031) (1,124,014)Amortization 498,409 494,859 379,101Disposals ‐ ‐ ‐Write‐downs ‐ 3,873 251Total change in capital assets (1,457,776) (903,299) (744,662)
Change in spare parts and supplies ‐ 361 (821)
Change in prepaid expenses ‐ (1,943) (4,044)
Change in remeasurement gains for the year
‐ 6,744 21,504
Change in net debt 7,921 9,637 11,951
Net debt, beginning of the year (256,751) (268,702)
Net debt, end of the year (247,114) (256,751)
See accompanying notes to the consolidated financial statements
| 27

Consolidated Statement of Cash Flows For the year ended December 31
$000s 2017 2016
Operating activities Surplus of the year 907,774 739,974
Add (deduct) items not involving cash:Amortization of tangible capital assets 494,859 379,101Loss on disposal of tangible capital assets 3,231 44Recognition of revenue from capital subsidies (1,385,195) (1,094,240)Change in employee future benefits 53,768 52,077
Changes in non‐cash assets and liabilities related to operations:(Increase) decrease in operating subsidy receivable 3,560 (32,567)(Increase) decrease in accounts receivable (21,544) 11,443(Increase) decrease in portfolio investments (4) (5)(Increase) decrease in spare parts and supplies inventory 361 (821)(Increase) decrease in prepaid expense (1,943) (4,044)(Decrease) increase in operating accounts payable and accrued liabilities
112,463 26,033
(Decrease) increase in deferred passenger revenue (8,988) (5,390)(Decrease) increase in unsettled accident claims (35,620) (5,770)(Decrease) increase in environmental liabilities 2,793 (371)
Cash provided by operating activities 125,515 65,464
Capital activities
Capital asset acquisitions (1,424,975) (1,212,855) Capital asset disposal proceeds 642 117
Cash used in capital activities (1,424,333) (1,212,738)
Financing activities Capital subsidies received 1,396,481 1,184,443
Cash provided by financing activities 1,396,481 1,184,443
Increase/ (decrease) in cash and cash equivalents, during the year 97,663 37,169Cash and cash equivalents, beginning of the year 130,190 93,021
Cash and cash equivalents, end of the year 227,853 130,190
See accompanying notes to the consolidated financial statements
28 | Toronto Transit Commission – Annual Report 2017

| 29
Notes to the Consolidated Financial Statements for the Year ended December 31, 2017

1. NATURE OF OPERATIONS
The Toronto Transit Commission (the “TTC”) was established on January 1, 1954 to consolidate andco‐ordinate all forms of local transportation within the City of Toronto (the “City”), except railwaysand taxis. As outlined in the City of Toronto Act (2006), the TTC has exclusive authority to establish,operate or maintain a local passenger transportation system within the City. From a fundingperspective, the TTC functions as one of the boards of the City and is dependent upon the City forboth operating and capital subsidies (notes 13 and 14). The TTC also operates Wheel‐Trans, aparatransit service for people with disabilities (which is also subsidized by the City), the TorontoCoach Terminal Inc. and its subsidiary, the TTC Insurance Company Limited. The TTC controls theTTC Sick Benefit Association which was incorporated to adjudicate and pay benefit claims to eligibleMembers of Association unable to work due to illness or disability. The TTC, which is not subject toincome and capital taxes, receives an 11.24% rebate for the Harmonized Sales Tax and receivesexemption from certain property taxes.
2. SIGNIFICANT ACCOUNTING POLICIES
a. Basis of presentation
The consolidated financial statements are prepared by the TTC in accordance with Canadianpublic sector accounting standards recommended by the Public Sector Accounting Board of theChartered Professional Accountants of Canada (CPA Canada).
b. Basis of consolidation
The consolidated financial statements include the operations of Wheel‐Trans and the financialresults of the TTC’s subsidiaries, the Toronto Coach Terminal Inc. (“TCTI”) and TCTI’s subsidiary,TTC Insurance Company Limited (the “Insurance Co.”). The results of the TTC Sick BenefitAssociation (“SBA”), which is controlled by the TTC, have also been consolidated. In 2016, TTC’ssubsidiary, the Toronto Transit Infrastructure Limited was dissolved.
c. Measurement uncertainty
The preparation of the consolidated financial statements in conformity with public sectoraccounting standards requires management to make estimates and assumptions that affect thereported amounts of assets and liabilities and disclosures of contingent assets and liabilities atthe date of the consolidated financial statements and the reported amounts of revenue andexpenses during the reporting period. Specifically, employee future benefits are subject to theassumptions described in note 9 and other contingencies are described in note 18a. Also,management makes their best estimate on the fair value of certain pension investmentsdescribed in note 9 as the final audited fair values are not available at the time of preparation ofthe financial statements. Amortization expense is based on the asset lives described in note 2h.Accident claims liabilities are subject to assumptions on discount rates and amounts reservedfor incurred, but not reported claims as described in note 8. Deferred revenue is based on
30 | Toronto Transit Commission – Annual Report 2017

|
estimated value of fare media sold, but not yet used before year end. Actual results could differ from the amounts estimated.
d. Subsidy revenue
Operating subsidies are authorized by the City after the TTC’s operating budget has beenapproved. Operating subsidy revenue is recognized by the TTC in the period to the extent thatnet operating costs are incurred. Capital subsidies are recognized in revenue when the Cityauthorizes the capital subsidy and the cost is incurred. The eligibility criteria and relatedstipulations must also have been met except when and to the extent that the transfer gives riseto an obligation that meets the definition of a liability, which can be influenced by a number offactors, including stipulations of the transfer.
e. Operating revenue and deferred passenger revenue
Operating revenue from passenger services is recognized when cash, tickets, tokens and Prestocards are used by the passenger to secure a ride. Revenue from passes is recognized in theperiod in which they are valid. An estimate of tickets and tokens sold which will be used afterthe year end and an estimate of passes sold but only valid after year end are included indeferred passenger revenue. All other revenue is recognized when the services have beenprovided.
f. Cash and cash equivalents
Cash and cash equivalents consist of cash on hand and funds on deposit with a major financialinstitution.
g. Spare parts and supplies inventory
Spare parts are valued at weighted‐average cost, net of allowance for obsolete and excess parts.
h. Tangible capital assets and amortization
Tangible capital assets are recorded at cost less accumulated amortization. In addition to directcosts attributable to capital projects, the TTC capitalizes certain internal costs, which are directlyrelated to the acquisition, construction, betterment, or development of those related capitalassets. Amortization is calculated using the straight‐line method, based on the estimated usefullives of major assets, as follows:
31

Asset Years
Subways 20‐65
Buildings & structures 20‐40
Rolling stock 6‐30
Buses 3‐13
Trackwork 15‐30
Other equipment 5‐26
Traction power distribution system 24‐25
Capital assets are amortized from the date that they enter service. One‐half year of the amortization expense is recorded in the year of acquisition and assets under construction are not depreciated until the asset is substantially complete and available for productive use. Land purchased directly by the City, for the TTC’s use, is accounted for in the City’s records.
i. Portfolio investments
Portfolio investments consist of bonds that are recorded at cost. Discounts or premiums oninvestments are amortized on an effective interest rate method until maturity of the investmentto which this item is related. Investment income is reported as revenue in the period earned.
j. Unsettled accident claims
The TTC has a self‐insurance program for automobile and general liability claims. Estimatedcosts to settle automobile and general liability claims are actuarially determined, based onavailable loss information and projections of the present value of estimated future expendituresdeveloped from the TTC’s historical experience. The provision for estimated future expendituresincludes expected internal and external adjustment expenses, an estimate of claims incurred,but not reported and a provision for adverse deviations.
k. Employee future benefit plans
The TTC’s employee benefits plans include post‐employment plans (workplace safety andinsurance benefit plan and long term disability benefit plan), post‐retirement plans (medical anddental benefits) and pension plans.
The costs of the post‐employment benefit plans are recognized when the event that obligatesthe TTC occurs. Costs include projected future income replacement payments, health carecontinuation costs, taxes and fees paid to independent administrators, calculated on a presentvalue basis.
32 | Toronto Transit Commission – Annual Report 2017
|
The costs and obligations of the post‐retirement benefit plans and pension plans are calculated using the projected benefits prorated on service method and management’s best estimates of retirement ages of employees, future salary levels, expected health care cost escalations, and plan investment performance.
The net asset or liability related to each employee future benefit plan reflects the year‐end difference between the value of the accrued benefit obligation and the value of the plan assets (if funded), net of unamortized gains and losses and the valuation allowance. Plan assets are valued using year‐end fair market values.
Accrued benefit obligations and costs are determined using discount rates that are consistent with the City’s long‐term borrowing rates for the post‐employment and post‐retirement plans. For the TTC’s funded pension plans, the discount rate is the plan’s expected rate of return on plan assets.
Actuarial gains and losses arise from changes in actuarial assumptions or when actual experience differs from what was assumed. For post‐employment benefit plans, the net actuarial gain or loss is deferred and amortized on a straight‐line basis over the average expected period during which benefits will be paid unless there is a related plan amendment or curtailment. For workplace safety insurance benefits, the amortization period is 11.1 years (December 31, 2016 – 10 years) and for long‐term disability benefits, the amortization period is 7.4 years (December 31, 2016 – 12.1 years). The amortization of the gain/loss begins in the year after the actuarial gain/loss arises.
A post‐retirement benefit plan actuarial gain or loss is deferred and amortized over the expected average remaining service life of the employees unless there is a plan amendment or curtailment.
The amortization period for the pension plan is 13.7 years (December 31, 2016 – 13.5 years), for the post‐retirement medical and post‐retirement dental plans the amortization period is 14.2 years (December 31, 2016 – 13.8 years) and for the supplemental funded pension plan, the amortization period is 6.9 years (December 31, 2016 – 6.5 years). The amortization of the actuarial gain or loss begins in the year after the gain or loss arises for all post‐retirement plans except the TTC pension plan. Amortization begins in the year of the actuarial gain or loss for the TTC pension plan. This policy is expected to reduce the long term expense volatility that results from the accounting requirement to defer and amortize actuarial losses.
Past service costs arising from a plan amendment or plan initiation are recognized in the period of a plan amendment. Prior service costs or gains are offset by net actuarial gains or losses, if any, as of the end of the calendar year in which the prior service costs or gains arise. Unamortized amounts that remain after offsetting with prior period service costs or gains continue to be amortized in their original amount. Also, unamortized actuarial gains or losses related to settled or curtailed plans are recognized in the period of the plan settlement or curtailment.
33

l. Environmental liabilities
An environmental liability is recognized when a site has been identified as being non‐compliantwith environmental legislation, the TTC accepts responsibility, it is expected that futureeconomic benefits will be given up and a reasonable estimate of costs can be determined. Theestimated amounts of future costs are reviewed regularly, based on available information andgoverning legislation.
m. Financial instruments
The TTC has designated its financial instruments as follows:i) Cash and cash equivalents (note 4)ii) Subsidies receivable from the City of Toronto (note 5)iii) Accounts receivableiv) Portfolio investments, in bonds (note 6)v) Accounts payable and certain accrued liabilitiesvi) Financial derivatives (note 7)
Cash and cash equivalents are recorded at cost which approximates fair market value. Financial derivatives are recorded at fair value. All other financial instruments are recorded at amortized cost. The fair values of the accounts receivable, operating and capital portions of the subsidies receivable and accounts payable and accrued liabilities approximate their carrying values due to the relatively short time period to maturity of these instruments. The fair value of the other recoverable amounts within subsidies receivable from the City of Toronto cannot be determined since there are no fixed terms of repayment. The fair value of Portfolio Investments is described in note 6.
PS3450, Financial instruments, requires disclosure of a three‐level hierarchy for fair value measurement based on the transparency of inputs to the valuation of a financial asset or financial liability as at the financial statement date. The three levels are defined as follows:
Level 1 – fair value is based on quoted market prices in markets for identical financial assets or financial liabilities. Level 1 financial assets generally include equity investments traded in an active market.
Level 2 – fair value is based on observable inputs, either directly or indirectly, other than quoted prices included within Level 1.
Level 3 – fair value is based on non‐observable market data inputs.
TTC’s financial derivatives are the only financial instruments recorded at fair value and they are classified as Level 2.
34 | Toronto Transit Commission – Annual Report 2017

|
3. FINANCIAL RISK MANAGEMENT
Credit risk
Credit risk is the risk of loss due to a counterparty’s inability to meet its obligations. As at December31, 2017, TTC’s credit risk exposure consists mainly of the carrying amounts of cash and cashequivalents, portfolio investments, accounts receivable and subsidies receivable.
Cash and cash equivalents and portfolio investments are invested with the City of Toronto or amajor financial institution and are therefore assessed as low risk.
Of TTC’s total accounts receivable, $10.1 million is past due (December 31, 2016 – $19.5 million).
Although past due, the $10.1 million is deemed collectible and has the following aging:
1–30 days past due: $1.3 million (December 31, 2016 – $0.1 million)
31–60 days past due: $0.2 million (December 31, 2016 – $2.2 million)
61–90 days past due: $1.7 million (December 31, 2016 – $0.5 million)
90+ days past due: $6.9 million (December 31, 2016 – $16.7 million)
Approximately 78% of TTC’s accounts receivable is due from the City of Toronto, other municipal,provincial and federal governments and organizations controlled by them (December 31, 2016 –77%). 100% of subsidies receivable are due from the City of Toronto (December 31, 2016 – 100%).Impairment risk on receivables from these governments and government organizations is low.
Credit risk is further lowered as TTC’s best practice is to obtain an advance deposit or letter of creditwhen entering a significant agreement with a non‐government entity. Furthermore, past duereceivables are routinely monitored and subject to collection action.
To assess and manage its exposure to credit risk, TTC reviews and reports impairment balancesannually. TTC believes that its credit risk is low and there are no notable concentrations of risk.
Currency risk
Currency risk is the risk that the fair value of future cash flows of a financial instrument will fluctuatebecause of changes in currency or foreign exchange rates. The TTC has limited foreign currency riskwith respect to its financial instruments as substantially all of TTC’s financial assets and financialliabilities are denominated in Canadian dollars. The TTC is exposed to some foreign currency risk assome contracts for the future purchase of supplies and capital assets are denominated in U.S.dollars. As of the balance sheet date, TTC has $2.6 million in U.S. dollar financial liabilities(December 31, 2016 – $1.8 million), which is offset by TTC’s U.S. dollar cash balance of $2.8 million(December 31, 2016 – $4.2 million). Therefore, TTC’s currency risk is low and there are no notableconcentrations of risk.
35

Liquidity risk
Liquidity risk is the risk that the TTC will encounter difficulty in meeting obligations associated with its financial liabilities and other contractual obligations. TTC’s accounts payables and accrued liabilities amount to $770.7 million (December 31, 2016 – $681.2 million) and, excluding non‐financial liabilities, $324.4 million is due within one year or less (December 31, 2016 – $212.4 million). The TTC has a combination of cash on hand and receivables from governments and government organizations, including the City of Toronto, as described above within the statement of credit risk, which will be sufficient to satisfy these liabilities. Construction holdbacks of $51.4 million (December 31, 2016 – $95.6 million) are also excluded from the $324.4 million (December 31, 2016 – $212.4 million) due within a year; however, they are fully recoverable from the City of Toronto asreferred to in note 5. Therefore TTC’s liquidity risk is low and there are no notable concentrations ofrisk.
Interest rate risk
Interest rate risk is the risk that the fair value or future cash flows of a financial instrument will fluctuate because of changes in market interest rates. TTC’s interest rate risk is low as the TTC does not hold debt and all portfolio investments have fixed interest rates (note 6) and will be held to maturity.
Other price risk
The TTC is exposed to fuel price risk arising from fluctuations in fuel costs. To manage its exposure to fuel prices, TTC enters into fuel swap contracts with financial institutions (note 7).
4. CASH AND CASH EQUIVALENTS
In connection with the City guarantee referred to in note 8, the TTC Insurance Company Limited, isrequired to maintain cash or securities available for payment of accident claims liabilities equal toone month’s claims and operating expenses (all self‐insured retention payments are processedthrough the TTC). The cash and cash equivalents amount restricted for this purpose is approximately$1.9 million as at December 31, 2017 (December 31, 2016 – $3.1 million).
5. SUBSIDIES RECEIVABLE
Subsidies from the City of Toronto consist of operating subsidies as described in note 13 and capitalsubsidies as described in note 14. Subsidies receivable as at December 31 comprise the followingamounts, all of which are due from the City of Toronto:
36 | Toronto Transit Commission – Annual Report 2017

|
$000s 2017 2016
Subsidies to be collected within one yearCapital subsidy receivable 389,575 376,042Operating subsidy receivable 72,286 85,310
Total subsidies to be collected within one year 461,861 461,352
Other recoverable amountsEmployee benefits 366,213 323,882Accident claims expenses 44,798 80,418Construction related 229,576 254,621Future environmental costs (note 10) 5,402 2,649
Total other recoverable amounts 645,989 661,570
Total subsidies receivable 1,107,850 1,122,922
The TTC expects to collect the capital and operating subsidy receivable within one year.
The amount related to non‐cash employee benefits and accident claim expenses represents the delayed payment of operating subsidy for the non‐cash portion of these expenses.
Subsidy receivable related to construction will be collected in the year the vendors are paid. Subsidy receivable for future environmental costs will be collected in the year in which the related work is performed.
6. PORTFOLIO INVESTMENTS
Portfolio investments as at December 31 consist of the following:
$000s 2017 2016
Municipality of Metropolitan Toronto Bond (2.45%; February 6, 2025 maturity) 2,268 2,264Total portfolio investments 2,268 2,264
At December 31, 2017, the fair value of the bonds is $2.3 million (December 31, 2016 – $2.3 million).
37

7. FINANCIAL DERIVATIVES
TTC’s financial derivatives consist of heating fuel swaps with financial institutions which helpmanage TTC’s exposure to fluctuating fuel prices by setting a fixed price for a future purchase of afixed quantity of fuel. Heating fuel swaps are used because they are an openly traded commoditythat most closely relates to the diesel fuel consumed by TTC. The TTC does not purchase or hold anyderivative financial instrument for speculative purposes. Several derivative agreements were inplace and used throughout the year and continue to exist as of December 31, 2017. Derivativeinstruments are required to be measured at fair value on initial recognition and changes in the fairvalue of the derivative instruments are recognized in the statement of remeasurement gains andlosses. As of December 31, 2017 the accumulated remeasurement gains from these fuel swaps are$9.8 million (December 31, 2016 – accumulated remeasurement gains $3.1 million). The derivativecontracts are included in the statement of financial position on a present value basis. The fair valueof these contract are primarily derived using the quoted price of heating oil on the New YorkMercantile Exchange (NYMEX) as of December 31, 2017. As of December 31, 2017, approximately84.2% of 2018’s diesel fuel requirement has been hedged using the fuel swap agreements (December 31,2016 – 59.5%).
8. UNSETTLED ACCIDENT CLAIMS
The Insurance Co. was established in 1994 in order to provide insurance coverage for compulsoryautomobile personal injury and accident benefit claims for the TTC. At December 31, 2017,$141.4 million (December 31, 2016 – $174.5 million) of the unsettled accident claims liability isrelated to the Insurance Co.’s payable for all automobile claims incurred. This portion of the TTC’saccident claim liability is guaranteed by the City. The TTC has purchased insurance from third‐partyinsurers to cover tort claims in excess of $5.0 million on any one accident. The remainder of theunsettled accident claims liability, $15.2 million (December 31, 2016 – $17.7 million), relates togeneral liability claims of $18.5 million (December 31, 2016 – $21.5 million), less $3.3 million(December 31, 2016 – $3.8 million) of expected HST rebates.
The ultimate cost of these liabilities will vary from the best estimate made by management for avariety of reasons including additional information with respect to the facts and circumstances ofthe claims incurred. The liability includes a reserve established for each file as well as an incurredbut not reported (“IBNR”) provision to account for the fact that full information on case files maynot be available at the valuation date, or losses have been incurred but are not yet reported.Therefore, the TTC relies upon historical information and statistical models to estimate the IBNRliability. The TTC also uses reported claims trends, claims severity, exposure growth and otherfactors in estimating its IBNR reserve. The time required to learn of and settle claims is an importantconsideration in establishing the TTC’s reserves. The TTC revises these reserves as additionalinformation becomes available.
This provision is discounted to take into account the time value of money and a provision foradverse deviation (“PFAD”) is added as recommended by standard actuarial practice. Assumptions
38 | Toronto Transit Commission – Annual Report 2017

|
regarding the anticipated timing of future payments and an appropriate discount rate are made by management. As uncertainty exists with respect to the determination of these discounted estimates, an explicit PFAD is made for potential claims development. A PFAD is selected based on guidance developed by the Canadian Institute of Actuaries.
The following table summarizes the effects of the time value of money and PFAD on the liability for unpaid claims and claims adjustment costs.
Unpaid claims and claims adjustment costs:
Undiscounted Time Value of Money
Discounted (before PFAD)
PFAD Discounted
$000s
As at December 31, 2017 150,046 (6,439) 143,607 13,026 156,633
As at December 31, 2016 180,180 (5,234) 174,946 17,307 192,253
As at December 31, 2017, the interest rate used to determine the time value of money was 1.75% and reflected the market yield (December 31, 2016 – 1.0%).
9. EMPLOYEE FUTURE BENEFITS
Description of benefit plans
The TTC has a number of benefit plans which provide employees with post‐employment, post‐retirement and pension benefits.
Post‐employment benefit plans
Post‐employment benefits are available to active employees in the form of long‐term disability(“LTD”) and workplace safety insurance (“WSI”) plans. The long‐term disability plan is self‐insured bythe TTC and is administered by an independent insurance carrier. As a Schedule 2 employer underthe Ontario Workplace Safety and Insurance Act, the TTC fully finances its WSI costs.
For the post‐employment benefit plans, the effective date of the most recent actuarial valuationwas September 30, 2017 for the WSI plan and November 30, 2017 for the LTD plan. These valuationswere used to project the accrued benefit obligations and costs for the current year end. The nextactuarial valuation for the post‐employment benefit plans is expected to be performed as atSeptember 30, 2018 for the WSI plan and November 30, 2018 for the LTD plan.
Post‐retirement, non‐pension benefit plans
Post‐retirement benefits, consisting of basic health care and dental coverage, are available toemployees retiring from the TTC with at least ten years of service and with a pension from the TTCPension plan. Dental benefits are limited to employees retiring on or after January 1, 2003.
For the post‐retirement benefit plans, the effective date of the most recent actuarial valuation wasJanuary 1, 2015. This valuation was used to project the accrued benefit obligations and costs for the
39

current year end. The next actuarial valuation for the post‐retirement benefit plans is expected to be performed as at January 1, 2018.
Supplemental pension plans
The TTC and plan members may participate in supplemental pension plans. These plans provide pension benefits which the TTC pension plan cannot provide because of the limits imposed by the Income Tax Act. These pension benefits automatically reflect changes that are made to the TTC Pension plan.
The funded supplemental pension plan has been accounted for as a defined benefit plan and the TTC has recognized 100% of the plan’s pension expense, assets and obligation. The funded supplemental pension plan’s assets consist of 58% (December 31, 2016 – 56%) cash and equity index pooled funds which are carried at market and 42% (December 31, 2016 – 44%) deposit in a Canada Revenue Agency non‐interest bearing refundable tax account. The effective date of the most recent actuarial valuation for funding purposes was January 1, 2017. The next actuarial valuation for funding purposes is expected to be performed as at January 1, 2018. The effective date of the most recent valuation for accounting purposes was December 31, 2017.
TTC Pension Fund
The TTC participates in a defined benefit pension plan (“TTC Pension Fund”). The TTC Pension Fund is administered by the Toronto Transit Commission Pension Fund Society (the “Society”), a separate legal entity. The Board of Directors of the Society consists of 10 voting members, five of whom are appointed from the Toronto Transit Commission and five are appointed from the Amalgamated Transit Union Local 113 (ATU). Pursuant to the Sponsors Agreement between ATU and the TTC, the TTC Pension Fund was registered as a Jointly Sponsored Pension Plan (JSPP) effective January 1, 2011.
The plan is accounted for as a joint defined benefit plan as the TTC and its employees jointly share the risks in the plan and share control of decisions related to the plan administration and to the level of benefits and contributions on an ongoing basis. The TTC is required to account for its portion of the plan (i.e. 50%) and has therefore, recognized 50% of the pension expense incurred during the year and 50% of the plan’s assets and obligation.
The plan covers substantially all employees of the TTC who have completed six months of continuous service. Under the Plan, contributions are made by the Plan members and matched by the TTC. The contribution rates are set by the Board, subject to the funding requirements determined in the actuarial report and subject to the limitations in the Sponsors Agreements between the TTC and the ATU.
The plan provides pensions to members, based on a formula that factors in the length of credited service and best four years of pensionable earnings up to a base year. The Board of Directors of the Society make decisions with respect to affordable pension formula updates, pension indexing and
40 | Toronto Transit Commission – Annual Report 2017

|
plan improvements based on the results of the most recent funding valuation and the priorities set out in the plan’s by‐laws and funding policy.
Effective January 1, 2017, the base year for the TTC pension plan and the funded supplemental pension plans was updated to December 31, 2016 from December 31, 2015. In addition, an ad hoc increase of up to 1.35% (December 31, 2016 – 1.28%) was granted to all pensioners. The TTC’s share of the prior service cost of these plan amendments have been reflected in the consolidated Statement of Operations and Accumulated Surplus.
The effective date of the most recent actuarial valuation for funding purposes for the TTC Pension Fund was January 1, 2017. The next required actuarial valuation for funding purposes will be performed as at January 1, 2020. The effective date of the most recent valuation for accounting purposes was December 31, 2017.
The continuity of the change in the employee benefit liabilities/(asset) including expenses recognized in 2017 is as follows:
$000s Post‐Employment
Plans
Post‐Retirement
Non‐Pension Plans
Supplemental Pension Plans
Total employee
benefit liabilities
TTC Pension
Fund
Accrued benefit liability (asset)
balance, beginning of the year
229,359 404,454 (410) 633,403 ‐
Current service cost 28,318 26,302 91 54,711 87,252
Interest cost 5,215 17,875 92 23,182 (18,739)
Amortization of actuarial
(gains)/losses: (3,732) 14,877 277 11,422 (57,429)1
Plan amendments ‐ ‐ 796 796 37,880
Change in valuation ‐ ‐ ‐ ‐ 68,070
allowance
Total expenses 29,801 59,054 1,256 90,111 117,034Benefits paid (25,074) (9,832) (186) (35,092) ‐
Employer contributions ‐ ‐ (1,251) (1,251) (117,034)
Accrued benefit liability (asset) balance, end of the year
234,086 453,676 (591) 687,171 ‐
1 Includes recognition of an unamortized gain of $56,470 applied against the cost of the plan amendments.
41

The continuity of the change in the employee benefit liabilities/(asset) including expenses recognized in 2016 is as follows:
$000s Post‐Employment
Plans
Post‐Retirement
Non‐Pension Plans
Supplemental Pension Plans
Total employee
benefit liabilities
TTC Pension
Fund
Accrued benefit liability (asset)
balance, beginning of the year
225,911 355,835 (420) 581,326 ‐
Current service cost 27,562 26,053 50 53,665 84,077
Interest cost 4,751 16,669 72 21,492 (17,813)
Amortization of actuarial
(gains)/losses: (3,496) 15,680 280 12,464 (22,282)1
Plan amendments ‐ ‐ 847 847 40,916
Change in valuation ‐ ‐ ‐ ‐ 27,505
allowance
Total expenses 28,817 58,402 1,249 88,468 112,403Benefits paid (25,369) (9,783) (190) (35,342) ‐
Employer contributions ‐ ‐ (1,049) (1,049) (112,403)
Accrued benefit liability (asset)balance, end of the year
229,359 404,454 (410) 633,403 ‐
1 Includes recognition of an unamortized gain of $22,282 applied against the cost of the plan amendments.
The following table summarizes the employee future benefit costs included in the Consolidated Statement of Operations and Accumulated Surplus:
$000s 2017 2016
Cost of TTC Pension Fund contributions 117,034 112,403 Net cost of TTC Pension Fund 117,034 112,403Cost of other benefit plans 90,111 88,468Total cost of plans 207,145 200,871Less: costs allocated to capital assets (26,893) (26,064)Total employee future benefit costs includes wages, salaries andbenefits in note 15 and in the Consolidated Statement of Operations and Accumulated Surplus
180,252 174,807
The TTC’s portion of the assets in the TTC Pension Fund is carried at market value. As the TTC cannotwithdraw the surplus to reduce its contributions, the expected benefit of a surplus is nil andtherefore, a valuation allowance of $474.4 million (December 31, 2016 – $407.3 million) is requiredto reduce the accrued benefit asset to either the value of the net unamortized actuarial losses (ifany) or to the value of the fund surplus less net unamortized gains.
Reconciliation of funded status to the employee benefit liabilities and asset as at December 31, 2017is as follows:
$000s Post‐Employment
Plans
Post‐Retirement
Non‐PensionPlans
SupplementalPension Plans
Totalemployee
benefitliabilities
TTC PensionFund
Fair value of plan assets ‐ ‐ 14,852 14,852 3,323,139
Accrued benefit obligations 188,110 579,557 15,061 782,728 2,637,360
Funded status–(deficit)/ surplus (188,110) (579,557) (209) (767,876) 685,779
Unamortized (gains)/losses (45,976) 125,881 800 80,705 (210,399)
Accrued benefit (liability)/ asset (234,086) (453,676) 591 (687,171) 475,380
Valuation allowance ‐ ‐ ‐ ‐ (475,380)
Employee benefit (liability) (234,086) (453,676) 591 (687,171) ‐
Reconciliation of funded status to the employee benefit liabilities and asset as at December 31, 2016is as follows:
$000s Post‐Employment
Plans
Post‐Retirement
Non‐PensionPlans
SupplementalPension Plans
Totalemployee
benefitliabilities
TTC PensionFund
Fair value of plan assets ‐ ‐ 13,266 13,266 3,067,899
Accrued benefit obligations 196,245 517,022 13,800 727,067 2,660,589
Funded status–(deficit)/ surplus (196,245) (517,022) (534) (713,801) 407,310
Unamortized (gains)/losses (33,114) 112,568 944 80,398 ‐
Accrued benefit (liability)/ asset (229,359) (404,454) 410 (633,403) 407,310
Valuation allowance ‐ ‐ ‐ ‐ (407,310)
Employee benefit (liability) (229,359) (404,454) 410 (633,403) ‐
42 | Toronto Transit Commission – Annual Report 2017

|
The TTC’s portion of the assets in the TTC Pension Fund is carried at market value. As the TTC cannot withdraw the surplus to reduce its contributions, the expected benefit of a surplus is nil and therefore, a valuation allowance of $474.4 million (December 31, 2016 – $407.3 million) is required to reduce the accrued benefit asset to either the value of the net unamortized actuarial losses (if any) or to the value of the fund surplus less net unamortized gains.
Reconciliation of funded status to the employee benefit liabilities and asset as at December 31, 2017 is as follows:
$000s Post‐Employment
Plans
Post‐Retirement
Non‐Pension Plans
Supplemental Pension Plans
Total employee
benefit liabilities
TTC Pension Fund
Fair value of plan assets ‐ ‐ 14,852 14,852 3,323,139
Accrued benefit obligations 188,110 579,557 15,061 782,728 2,637,360
Funded status–(deficit)/ surplus (188,110) (579,557) (209) (767,876) 685,779
Unamortized (gains)/losses (45,976) 125,881 800 80,705 (210,399)
Accrued benefit (liability)/ asset (234,086) (453,676) 591 (687,171) 475,380
Valuation allowance ‐ ‐ ‐ ‐ (475,380)
Employee benefit (liability) (234,086) (453,676) 591 (687,171) ‐
Reconciliation of funded status to the employee benefit liabilities and asset as at December 31, 2016 is as follows:
$000s Post‐Employment
Plans
Post‐Retirement
Non‐Pension Plans
Supplemental Pension Plans
Total employee
benefit liabilities
TTC Pension Fund
Fair value of plan assets ‐ ‐ 13,266 13,266 3,067,899
Accrued benefit obligations 196,245 517,022 13,800 727,067 2,660,589
Funded status–(deficit)/ surplus (196,245) (517,022) (534) (713,801) 407,310
Unamortized (gains)/losses (33,114) 112,568 944 80,398 ‐
Accrued benefit (liability)/ asset (229,359) (404,454) 410 (633,403) 407,310
Valuation allowance ‐ ‐ ‐ ‐ (407,310)
Employee benefit (liability) (229,359) (404,454) 410 (633,403) ‐
43

The continuity of the change in the accrued benefit obligation including costs recognized in 2017 is as follows:
$000s Post‐Employment
Plans
Post‐Retirement
Non‐Pension Plans
Supplemental Pension Plans
Total employee
benefit liabilities
TTC Pension Fund
Balance, beginning of the year 196,245 517,022 13,800 727,067 2,660,589
Current service cost 28,318 26,302 91 54,711 87,252
Interest cost 5,215 17,875 577 23,667 149,216
Loss/(gain) on the obligation (16,594) 28,190 544 12,140 (152,183)
Employee contributions ‐ ‐ 125 125 ‐
Benefits paid (25,074) (9,832) (872) (35,778) (145,394)
Plan amendments ‐ ‐ 796 796 37,880
Balance, end of the year 188,110 579,557 15,061 782,728 2,637,360
The continuity of the change in the accrued benefit obligation including costs recognized in 2016 is as follows:
$000s Post‐Employment
Plans
Post‐Retirement
Non‐Pension Plans
Supplemental Pension Plans
Total employee
benefit liabilities
TTC Pension Fund
Balance, beginning of the year 197,945 486,073 12,808 696,826 2,512,295
Current service cost 27,562 26,053 50 53,665 84,077
Interest cost 4,751 16,669 512 21,932 141,490
Loss/(gain) on the obligation (8,644) (1,990) 132 (10,502) 11,297
Employee contributions ‐ ‐ 115 115 ‐
Benefits paid (25,369) (9,783) (664) (35,816) (129,486)
Plan amendments ‐ ‐ 847 847 40,916
Balance, end of the year 196,245 517,022 13,800 727,067 2,660,589
44 | Toronto Transit Commission – Annual Report 2017

|
The continuity of the plan assets for the funded pension plans in 2017 is as follows:
$000s Supplemental Pension Plan
TTC Pension Fund
Balance, beginning of the year 13,266 3,067,899
Employee contributions 125 ‐
Employer contributions 1,251 117,034
Expected return on plan assets 485 167,955
Excess (shortfall) on return on plan assets 411 115,645
Benefits paid (686) (145,394)
Balance, end of the year 14,852 3,323,139
The continuity of the plan assets for the funded pension plans in 2016 is as follows:
$000s Supplemental Pension Plan
TTC Pension Fund
Balance, beginning of the year 11,984 2,904,957
Employee contributions 115 ‐
Employer contributions 1,049 112,403
Expected return on plan assets 440 159,303
Excess (shortfall) on return on plan assets 152 20,722
Benefits paid (474) (129,486)
Balance, end of the year 13,266 3,067,899
45

46 | Toronto Transit Commission – Annual Report 2017
Significant assumptions used in accounting for employee benefits are as follows:
2017 2016 Accrued benefit obligations as at December 31:
Discount rate for post‐employment plans 2.8% to 3.0% 2.7% to 3.1%
Discount rate for post‐retirement, non‐pension plans 3.2% 3.5%
Discount rate for supplemental pension plans 2.9% to 3.75% 3.10% to 3.75%
Discount rate for TTC Pension Fund 5.5% 5.5%
Rate of increase in earnings 3.21% to 3.25% 2.25% to 3.25%
Benefit costs for the years ended December 31:
Discount rate for post‐employment plans 2.7% to 3.1% 2.5% to 2.9%
Discount rate for post‐retirement, non‐pension plans 3.5% 3.4%
Discount rate for supplemental pension plans 3.1% to 3.75% 2.95% to 3.75%
Discount rate for TTC Pension Fund 5.5% 5.5%
Rate of increase in earnings 2.25% to 3.25% 1.18% to 3.25%
Expected rate of return on assets, supplemental pension plan 3.75% 3.75%
Actual rate of return on assets, supplemental pension plan 6.6% 4.8%
Expected rate of return on assets, TTC Pension Fund 5.5% 5.5%
Actual rate of return on assets, TTC Pension Fund 8.9% 6.2%
The TTC’s annual rate of growth for post‐retirement drug costs was estimated at 13.6% for males and 11.4% for females. These rates consist of a drug trend rate of 6.7% per annum grading down to 4.5% per annum in 2030 and an aging factor of 6.9% for males and 4.7% for females (up to age 65). The annual rate of growth for post‐retirement dental costs was estimated at 4.0% per annum.
Total financial status of the TTC Pension Fund as at December 31 is as follows:
$000s 2017 2016 Fair value of plan assets 6,646,278 6,135,797
Accrued benefit obligations 5,274,719 5,321,178
Funded status – surplus 1,371,559 814,619

|
10. ENVIRONMENTAL LIABILITIES
As an operator of diesel buses that are refuelled on property and an enterprise that repairs andrebuilds buses and other rolling stock, the TTC and its subsidiaries are subject to various federal,provincial and municipal laws and regulations related to the environment. The TTC is also subject tohealth and safety legislation, including maintenance of facilities where asbestos has been applied.Environmental advisors and specialists are retained to support the TTC’s investigative and remedialefforts.
The amount accrued represents the estimated costs of remediating, monitoring and containingknown contamination, including airborne contamination on sites for which the TTC is responsible.The estimate of environmental liabilities is based on a number of factors, such as the site conditions,type of contaminants and the anticipated results of monitoring and therefore the actual costs mayvary. The estimated amounts of future costs are reviewed regularly, based on available informationand governing legislation.
11. TANGIBLE CAPITAL ASSETS
The cost of tangible capital assets is as follows:
$000s Cost December 31, 2017
Beginning Additions, net of
transfers
Disposals Write‐downs Ending
Subways 2,767,977 921,967 ‐ ‐ 3,689,944
Buildings & structures 2,052,586 1,437,474 ‐ ‐ 3,490,060
Rolling stock 2,575,672 238,710 (6,994) ‐ 2,807,388
Buses 1,775,523 243,354 (103,599) ‐ 1,915,278
Trackwork 1,866,992 155,426 ‐ ‐ 2,022,418
Other equipment 926,636 146,836 (2,735) ‐ 1,070,737
Traction power distribution 514,384 94,348 ‐ ‐ 608,732
Land 12,854 ‐ ‐ ‐ 12,854
Construction in progress 3,888,842 (1,836,084) ‐ (312) 2,052,446
Total 16,381,466 1,402,031 (113,328) (312) 17,669,857
47

$000s Cost December 31, 2016
Beginning Additions, net of
transfers
Disposals Write‐downs Ending
Subways 2,690,944 77,033 ‐ ‐ 2,767,977
Buildings & structures 1,768,407 284,179 ‐ ‐ 2,052,586
Rolling stock 2,295,669 280,003 ‐ ‐ 2,575,672
Buses 1,667,107 124,987 (16,571) ‐ 1,775,523
Trackwork 1,792,592 74,400 ‐ ‐ 1,866,992
Other equipment 858,902 68,199 (465) ‐ 926,636
Traction power distribution 474,649 39,735 ‐ ‐ 514,384
Land 12,854 ‐ ‐ ‐ 12,854
Construction in progress 3,713,551 175,478 ‐ (187) 3,888,842
Total 15,274,675 1,124,014 (17,036) (187) 16,381,466
The accumulated amortization for tangible capital assets is:
$000s Accumulated amortization December 31, 2017 Beginning Amortization Disposals Ending
Subways 1,311,751 52,852 ‐ 1,364,603
Buildings & structures 618,002 79,548 ‐ 697,550
Rolling stock 1,098,033 103,542 (6,994) 1,194,581
Buses 1,077,640 142,869 (100,038) 1,120,471
Trackwork 1,325,538 53,485 ‐ 1,379,023
Other equipment 673,335 48,590 (2,735) 719,190
Traction power distribution 293,608 13,973 ‐ 307,581
Total 6,397,907 494,859 (109,767) 6,782,999
48 | Toronto Transit Commission – Annual Report 2017

|
$000s Accumulated amortization December 31, 2016 Beginning Amortization Disposals Ending
Subways 1,268,802 42,949 ‐ 1,311,751
Buildings & structures 564,107 53,895 ‐ 618,002
Rolling stock 1,002,623 95,410 ‐ 1,098,033
Buses 1,006,847 87,300 (16,507) 1,077,640
Trackwork 1,276,998 48,540 ‐ 1,325,538
Other equipment 634,004 39,796 (465) 673,335
Traction power distribution 282,397 11,211 ‐ 293,608
Total 6,035,778 379,101 (16,972) 6,397,907
Based on above, net book value as at December 31 is:
$000s Net book value 2017 Net book value 2016Subways 2,325,341 1,456,226
Buildings & structures 2,792,510 1,434,584
Rolling stock 1,612,807 1,477,639
Buses 794,807 697,883
Trackwork 643,395 541,454
Other equipment 351,547 253,301
Traction power distribution 301,151 220,776
Land 12,854 12,854
Construction in progress 2,052,446 3,888,842
Total 10,886,858 9,983,559
These costs include the capitalization of certain internal costs as described in note 2h.
12. ACCUMULATED OPERATING SURPLUS
Accumulated operating surplus as at December 31 consists of:
$000s 2017 2016Invested in tangible capital assets 10,765,607 9,858,319
Accumulated surplus (deficit) from TTC subsidiaries (2,138) (2,624)
Accumulated surplus generated through operating budget 14,141 14,141
Total 10,777,610 9,869,836
49

The amount reported in the table regarding tangible capital assets represents the net book value of capital assets, that have been funded through past capital subsidy and contributions to capital from operating sources. The variance between this amount and the amount reported in note 11, $121.2 million (2016 – $125.2 million) represents the net book value of capital assets that have been funded by the TTC. Of this, $119.1 million (2016 – $122.5 million) will be recovered through future operating subsidies. The remaining $2.1 million (2016 – $2.7 million) represents the net book value of capital assets used for the operation of the Toronto Coach Terminal Inc.
13. OPERATING SUBSIDIES
The sources of operating subsidies for the year ended December 31 are as follows:
$000s 2017 2016Conventional Wheel‐Trans Total Total
‐ Provincial Gas Tax (note 14b) 91,600 ‐ 91,600 91,600
‐ City of Toronto 370,173 126,531 496,704 545,593
Total operating subsidies 461,773 126,531 588,304 637,193
The total City operating subsidy amount is established as part of the City’s annual budget process. The City allocated $91.6 million (2016 – $91.6 million) to the TTC’s operating budget from the provincial gas tax (see note 14b).
City of Toronto subsidy
$000s 2017 2016Conventional Wheel‐Trans Total Total
Operating subsidy from the City ( )of Toronto see above 370,173 126,531 496,704 545,593
City special costs 4,747 ‐ 4,747 3,688
Future recoverable amounts Accident claims Employee benefits
34,826(40,362)
794 (1,969)
35,620 (42,331)
5,770(42,299)
369,384 125,356 494,740 512,752
Net contributions to/(draws from):
Long Term Liability Reserve Fund 14,194 294 14,488 ‐Total City of Toronto operating subsidies (in accounts of the City of Toronto )
383,578 125,650 509,228 512,752
50 | Toronto Transit Commission – Annual Report 2017

|
City special costs represent subsidies reflected in the City’s budget that are not included in the TTC’s operating subsidy but relate to the TTC. They include rents and taxes on commuter parking lots and costs associated with certain subsidized passengers.
The future recoverable amounts reflect the delayed payment of operating subsidy for the non‐cash portion of certain employee future benefits and accident claims (note 5).
For details related to the TTC Long Term Liability Reserve Fund, see note 17 City of Toronto Reserves and Reserve Funds.
14. CAPITAL SUBSIDIES
Capital subsidies for the year ended December 31 are as follows:
$000s 2017 2016 Source of capital subsidies:
‐ City of Toronto 900,196 759,753
‐ Province of Ontario 101,661 89,399
‐ Federal Government of Canada 381,565 243,445
‐ Other 1,773 1,643
Total capital subsidies 1,385,195 1,094,240
a. City of Toronto
The City is responsible for ensuring full funding of the TTC’s capital program. In accordance withthe Municipal Act, any funding for the TTC’s capital program from other governments flowsthrough the City. As such, the TTC has claimed from the City a total 2017 capital subsidy of$1,383.4 million (2016 – $1,092.6 million). Amounts claimed from the City do not include a $7.0million expenditure (2016 – $6.8 million) for property purchased and owned by the City, but forthe jurisdictional use of the TTC.
The following disclosures regarding subsidy claims from the Provincial and Federal governmentsare based on the City’s and the TTC’s understanding of the various agreements andcommitments.
Toronto York Spadina Extension Project
The City acts as the bank for the Toronto‐York Spadina Subway Extension (“TYSSE”) project,under a joint funding relationship with the Province through the Move Ontario Trust (“MOT”),the Federal Government under the Building Canada Funding program and the municipalities ofthe City of Toronto and the Region of York. In 2017, $375.4 million (2016 – $364.2 million) wasrecognized as subsidy with respect to this project and the amount is presented in the abovetable as a City of Toronto subsidy. The City will recover these funds from the project’s fundingpartners.
51

The Province approved funding of $870 million (March 2006 and January 2008) for the TYSSE into York Region with a project cost of $2.6 billion and this funding was deposited in the MOT. On March 6, 2007, the Federal Government announced that it would contribute funding for the TYSSE into York Region with the amount capped at $697 million for the project.
The TTC incurs project expenditures and then submits a capital billing for the full project cost to the City. Each month the Executive Task Force, which is the joint Toronto/York governing body, submits a funding request to each of the MOT and the municipalities (City of Toronto and Region of York) to claim for each party’s appropriate share of project funding. The MOT is also billed for a working capital draw to ensure that sufficient funds are available to cover ongoing project cash flows. Funding claims are prepared each month to the Federal Government and payments flow to the City, upon submission and approval of appropriate contracts and claims prepared by the TTC.
b. Province of Ontario
Capital subsidies claimed under the various provincial programs for the year ended December31 are as follows:
$000s 2017 2016Source of capital subsidies:
‐ Metrolinx Quick Wins 920 ‐
‐ Provincial Gas Tax 75,224 75,224
‐ LRV Car Project 25,517 14,175
Total provincial capital subsidies 101,661 89,399
Metrolinx (Quick Wins)
In its March 2008 budget, the Province confirmed the Quick Wins funding package of projects as previously approved by Metrolinx in November 2007. Provincial payments totalling $452.5 million were received by the City in March 2008 and placed in a City reserve to be applied against the approved Quick Wins projects. Funding of $415.9 million has been recognized by the TTC for the eligible expenditures to date, including $0.9 million applied to capital projects in 2017 (2016 – $nil), with the remaining funds attributable to the subway capacity projects.
Metrolinx (Transit Expansion)
On April 1, 2009, the Province of Ontario announced funding for the following Transit Expansion lines: SRT ($1.4 billion), Finch West LRT ($1.2 billion), and Eglinton Crosstown LRT ($4.6 billion). Subsequently, on May 15, 2009, the Province of Ontario and the Government of Canada announced $950 million in funding for the Sheppard East LRT. It was intended that the City would not be required to contribute toward the cost of these lines. Discussions with Metrolinx had resulted in consensus at the staff level in mid‐2010 with respect to the development of a
52 | Toronto Transit Commission – Annual Report 2017

| 53
series of agreements required to confirm the timing, scope, magnitude, and governance issues associated with each of these lines and to set out the TTC’s responsibilities for program and project management. Under this arrangement, TTC initially incurs the costs relating to the construction of the asset on behalf of Metrolinx, and full recovery of costs from Metrolinx occurs through the City of Toronto. Project funding of $18.2 million has been drawn through the City for 2017 expenditures (2016 – $12.1 million) for costs incurred by the TTC in 2017 and the eligible expenditures to date are $306.9 million on the approved lines. Since Metrolinx will retain ownership of the assets, these amounts along with any associated capital assets, have not been recognized on the consolidated financial statements.
Provincial Gas Tax
In October 2004, the Province introduced gas tax funding to municipalities for public transit. Commencing at 1¢/litre, the funding is based on a province‐wide 70% ridership and 30% population allocation base, updated annually. The funding rate increased to 1.5¢/litre, effective October 2005, and then to 2¢/litre, effective October 2006. Of the anticipated $179.1 million (2016 – $170.4 million) in Provincial Gas Tax funding available in 2017, the City has directed $91.6 million (2016 – $91.6 million) toward the TTC’s operating needs (note 13) with the remainder of $75.2 million (2016 – $75.2 million) applied to capital needs. The balance of reserve funds of $12.3 million (2016 – $3.6 million) will be applied to future needs.
LRV Car Project
On June 19, 2009 the Province of Ontario confirmed that it would provide one‐third funding for the 204 LRV Car Project (up to $417 million) and this funding is expected to flow on the basis of contract milestone payments. A Transfer Payment Agreement between the Province, City of Toronto and TTC was signed in January 2013. Funding of $206.1 million (2016 – $180.6 million) has been recognized against the project to date including $25.5 million for 2017 (2016 – $14.2 million).
c. Federal Government of Canada
Capital subsidies claimed under the various federal programs for the year ended December 31are as follows:
$000s 2017 2016 Source of capital subsidies:
‐ Federal Gas Tax 159,811 159,811
‐ Canada Strategic Infrastructure Fund (CSIF) ‐ 627
‐ Public Transit Infrastructure Fund (PTIF) 221,754 83,007
Total federal capital subsidies 381,565 243,445

Federal Gas Tax
In June 2005, a joint announcement by the Federal, Provincial, and City of Toronto governments and the Association of Municipalities of Ontario was made in connection with the signing of two federal gas tax funding agreements under the “New Deal for Cities and Communities”. The gas tax funding is allocated on a per capita basis for environmentally sustainable municipal infrastructure, growing from 2.5¢/litre in 2008 to 5¢/litre in 2009. In 2008 the Federal Government announced that gas tax funding had been made a permanent measure and in 2009 an extended framework agreement was signed for the 4‐year period 2010–2013 (based on updated 2006 Census population). In 2014, a new and permanent agreement for the 10‐year period 2014–2023 was signed and 2014–2018 allocations are based on the updated 2011 Census population. Allocations from 2019–2023 will be updated to reflect the 2016 Census data. Ontario’s allocation of this funding to municipalities is based on population and the City received $159.8 million in 2017 (2016 – $159.8 million) under this program. This amount was allocated to the TTC.
Canada Strategic Infrastructure Fund (CSIF)
On March 30, 2004, the Federal and Provincial governments and the City of Toronto jointly announced funding of $1.05 billion ($350 million each including $46.7 million for the GTA Farecard Project) under CSIF, to fund strategic capital project requirements during the period March 2004 to 2012. This has since been extended to March 31, 2016. In 2012, Metrolinx assumed ownership of the GTA Farecard project and therefore $46.5 million of the original $350 million was allocated to Metrolinx. In March 2015 a request to extend the CSIF program was submitted to the Minister for consideration. In March 2016, the federal government formally approved the request for an extension and the amendment to the Agreement was signed. Federal funding for the eligible expenditures incurred amounts to $303.5 million, of which $nil has been accrued in 2017 (2016 – $0.6 million).
Public Transit Infrastructure Fund (PTIF)
In March 2016, the federal government announced an investment of $11.9 billion in transit infrastructure across Canada over five years to upgrade and improve public transit systems. Phase One of the PTIF, spanning 3 years, commits approximately $3.4 billion across Canada to be distributed based on a nation‐wide 70% ridership and 30% population allocation base. The total Phase One Federal PTIF allocation announced for the City of Toronto is in the order of $1.712 billion of which funding will be split equally (50%/50%) between the Federal government and City of Toronto. The Toronto Transit Commission was allocated $1.363 billion ($681 million federal PTIF share). To date, federal funding for the eligible expenditures incurred amounts to $304.8 million, of which $221.8 million has been accrued in 2017 (2016 – $83 million).
d. Other
Other funding of $1.8 million (2016 – $1.6 million) includes specific purpose third‐partyagreements with organizations such as Waterfront Toronto.
54 | Toronto Transit Commission – Annual Report 2017

|
15. EXPENSES BY OBJECT
Expenses by object for the year ended December 31 comprise the following:
$000s 2017 2016Wages, salaries and benefits 1,355,873 1,326,274
Materials, services and supplies 255,386 245,162
Vehicle fuel 80,871 83,088
Wheel‐Trans contract services 59,362 54,450
Electric traction power 50,490 53,103
Utilities 26,351 26,138
Accident claims (14,265) 28,548
Amortization (operating budget) 26,006 28,660
Amortization (assets funded through capital subsidy) 468,853 350,441
Total expenses 2,308,927 2,195,864
16. BUDGET DATA
Budget data presented in these consolidated financial statements is based upon the 2017 operatingand capital budgets approved by the TTC Board and the Board of the Toronto Coach Terminal Inc.Adjustments are required to provide comparative budget values for the year‐end actual resultsbased on an accrual basis of accounting. The chart below reconciles the approved budget with thebudget figures as presented in these consolidated financial statements.
$000s Conventional Wheel‐Trans Other Total
Total expenses, per approved current year budget 1,794,635 151,169 532 1,946,336
Other recoverable expenses 50,170 1,919 ‐ 52,089
Amortization of previously subsidized assets 461,552 7,301 ‐ 468,853
Total budgeted expenses per consolidated financial statements
2,306,357 160,389 532 2,467,278
Other recoverable expenses are certain non‐cash employee benefits and accident claim expenses that will be funded in the future (see note 5).
55

17. CITY OF TORONTO RESERVES AND RESERVE FUNDS
In its accounts, the City maintains interest bearing Reserve Funds, and non‐interest bearing Reservescomprised of funds set aside by City Council for specific purposes. Included in these Reserves andReserve Funds are amounts which the City has received from the Province of Ontario which areearmarked for TTC projects. Contributions to and draws from these Reserves and Reserve Funds aremade by the TTC, or the City, upon approval by City Council. As a result, contributions to and drawsfrom the Reserves and Reserve Funds do not necessarily correspond to the year in which the relatedexpenditure was incurred by the TTC. In order for the TTC to draw on these Reserves and ReserveFunds, they are required to incur the related expenditures. In 2017, the average interest rateapplicable to Reserve Funds was approximately 0.5% (2016 – 0.5%).
In order to facilitate the reconciliation to the City’s balances, only those contributions andwithdrawals that had been approved by City Council as of the date of the consolidated financialstatements are reported in the table.
The balances and transactions related to the Reserves and Reserve Funds are presented in thefollowing two tables.
Reserves and Reserve Funds originating from TTC operating surpluses or operating subsidies
$000s StabilizationReserve
LandAcquisition
Long Term Liability
2017Total
2016Total
Balance, beginning of the year 15,391 662 10,938 26,991 26,946
Contributions ‐ ‐ 34,050 34,050 ‐
Draws ‐ ‐ (19,561) (19,561) (12)
Interest earned ‐ 3 52 55 57
Balance, end of the year 15,391 665 25,479 41,535 26,991
Stabilization Reserve
The Stabilization Reserve was created to stabilize the funding of TTC’s operating expenditures over time. Any operating deficits, to the limit of the reserve balance and after approval from City Council, may be covered by a draw from this reserve. In 2017 and 2016, no draws were made.
Land Acquisition Reserve Fund
The Land Acquisition Reserve Fund was created to fund future land acquisitions by the City for TTC’s use. No draws were made in 2017. In 2016, $0.012 million was drawn and used for Kipling station improvements.
56 | Toronto Transit Commission – Annual Report 2017

|
Long Term Liability Reserve Fund
The Long Term Liability Reserve Fund was created in 2014 to ensure funding for the TTC’s long‐term liability for unsettled accident claims.
In 2017, City Council authorized a contribution up to $34.1 million to the Long Term Liability Reserve Fund, to support actual accident claim payments at the time of the settlement. The amount contributed, net of the amounts required for payments was $14.5 million.
Reserve Funds for transit capital funding originating through the Province of Ontario
$000s 2017Total
2016TotalPGT CSIF Quickwins
Balance, beginning of the year 3,582 15,633 57,660 76,875 72,900
Provincial contributions 179,133 ‐ ‐ 179,133 170,406
Draws (166,824) ‐ (920) (167,744) (166,824)
Interest earned ‐ 75 277 352 393
Balance, end of the year 15,891 15,708 57,017 88,616 76,875
Provincial Gas Tax (PGT)
Of $179.1 million (2016 – $170.4 million) in Provincial Gas Tax available, the City has directed $91.6 million for 2017 (2016 – $91.6 million) toward the TTC’s operating needs (note 13) and $75.2 million (2016 – $75.2 million) applied to capital needs (note 14). The balance of the reserve of $15.9 million (2016 – $3.6 million) will be applied to future needs.
Canada Strategic Infrastructure Reserve Fund (CSIF)
A provincial commitment of $303.3 million was received for the CSIF program to fund TTC strategic capital projects. Of the total payment received in 2007, $210.1 million was allocated to the CSIF reserve fund. Over the life of the program, of the total payment received plus accumulated interest of $16.0 million, $304.4 million has been applied to accumulated funding recognized by the TTC to date, of which $nil was drawn from the reserve fund in 2017 and 2016.
MoveOntario 2020 (Quickwins) Reserve Fund
Provincial payments totalling $452.5 million were received in March 2008 in support of the Metrolinx approved Quick Wins projects. Of the total payment received, plus accumulated interest of $21.6 million, $415.9 million has been applied to accumulated funding recognized by the TTC to date for capital expenditures, including $0.9 million drawn from the reserve fund in 2017 (2016 ‐ $nil). The amount of $57.0 million remaining in the reserve fund includes $57.0 million in Capital Reserve funding which was received for 2009 capital expenditures but, based on direction from the City, is planned to be applied against the cost of capital debt in 2018 and therefore remains unapplied at the end of 2017.
57

18. COMMITMENTS AND CONTINGENCIES
a. In the normal course of its operations, labour relations, and completion of capital projects, theTTC and its subsidiaries are subject to various arbitrations, litigations, and claims. Where thepotential liability is determinable, management believes that the ultimate disposition of thematters will not materially exceed the amounts recorded in the accounts. In other cases, theultimate outcome of the claims cannot be determined at this time. Any additional losses relatedto claims will be recorded in the period during which the liability is determinable.
b. In August 2006, the Board approved purchasing 234 subway cars or 39 trainsets fromBombardier Transportation Canada Inc. In September 2006, City Council approved proceedingwith this procurement and the contract was awarded on December 21, 2006. In May 2010, theBoard approved purchasing an additional 10 subway trainsets for the Toronto‐York SpadinaSubway line extension and an additional 21 trainsets to replace H6 trainsets. In March 2014, theBoard approved a further purchase of 10 trainsets for future ridership growth, bringing thedelivery requirement to 80 trainsets. In June 2015, an amendment to the contract wasauthorized by the Board for the modification of four 6‐car trainsets into six 4‐car trainsets forservice on Line 4 to support the conversion to ATC‐equipped trainsets. The additional 2 trainsetsrealized from the conversion will be used to meet ridership growth on Line 2 and brings the totaldelivery requirement to 82 trainsets. At December 31, 2017, the contract value is in total,$1,510.8 million with 82 trainsets delivered to TTC at a cost of $1,452.5 million and theoutstanding commitment is $58.3 million.
c. On April 27, 2009, the Board approved the design and supply of 204 Light Rail Vehicles (LRV). InJune 2009, the contract was awarded to Bombardier Transportation Canada Inc. As of December31, 2017, the total cost of the contract is $1,011.3 million with 62 LRV’s delivered to TTC. Thebalance of deliveries will continue in 2018 with all 204 cars scheduled for delivery by 2019. AtDecember 31, 2017, the TTC had incurred costs of $652.8 million, and the outstandingcommitment is $358.5 million.
d. On January 17, 2012, the City approved funding for the purchase of 27 60‐foot articulated lowfloor clean diesel buses. In July 2012, the Board approved proceeding with this procurement andthe contract was awarded to Nova, a Division of Volvo Group Canada. In March 2013, the Boardapproved an amendment to the contract authorizing the purchase of an additional 126 60‐footarticulated low floor clean diesel buses. On April 30, 2014, a subsequent contract was awardedto Nova for 55 40‐foot low floor clean diesel buses. In February 2015, the Board approved afurther purchase of 50 40‐foot low floor clean diesel buses and 108 40‐foot low floor cleandiesel buses in July 2015. In May 2016, the Board authorized the purchase of an additional 9740‐foot low floor clean diesel buses and 285 40‐foot low floor clean diesel buses in November2016 for delivery in 2017 and 2018.
On September 11, 2017, a subsequent contract was awarded to Nova for 325 40‐foot low floorclean diesel buses for delivery in 2019. At December 31, 2017, the contract values for Nova are
58 | Toronto Transit Commission – Annual Report 2017

|
in total $730.7 million with 707 buses delivered at a cost of $473.7 million. The outstanding commitment is $257.0 million or 366 buses.
e. On March 16, 2017, Creative Carriage Ltd. was awarded a contract for the purchase of 20 lowfloor Wheel‐Trans mini buses. The procurement of the new low floor Wheel‐Trans mini buseswill be partially funded through the Federal Government Public Transit Infrastructure Fund(PTIF). On September 5, 2017, the Board authorized the procurement of an additional 60 lowfloor Wheel‐Trans mini buses for delivery in 2018, and the contract was awarded to CreativeCarriage. As of December 31, 2017, the contract values for Creative Carriage are in total $14.8million with 11 buses delivered to TTC at a cost of $2.1 million and the outstanding commitmentis $12.7 million
f. The TTC has contracts for the construction and implementation of various capital projects. AtDecember 31, 2017, these contractual commitments are approximately $643.2 million (2016 –$593.9 million). Of this amount, $172.7 million (2016 – $130.5 million) was established as multi‐component shared projects for Toronto Waterfront, Toronto‐York Spadina Subway Extensionproject (TYSSE) and TTC; $42.0 million (2016 – $119.8 million) relate to the TYSSE project and$428.5 million (2016 – $343.6 million) relate to various TTC construction projects.
g. The TTC could be exposed to significant or material contractual cancellation penalties if any ofits commenced capital projects do not continue as planned.
h. The TTC leases certain premises under operating lease agreements. The approximate futureminimum annual lease payments are as follows:
19. COMPARATIVE AMOUNTS
The comparative consolidated financial statements have been regrouped from statements previously presented to conform with the presentation adopted in 2017.
$000s
2018 16,969
2019 14,327
2020 12,993
2021 10,237
2022 10,116
Thereafter 20,987
Total 85,629
59

This page left intentionally blank.
60 | Toronto Transit Commission – Annual Report 2017

|
Supplementary Schedules Year ended December 31, 2017
61

CONSOLIDATED FINANCIAL STATEMENTS – As at and for the Year ended December 31, 2017 TORONTO
TRANSIT COMMISSION
(TTC)
TORONTO COACH TERMINAL INC.
CONSOLIDATED (TCTI)
TTC SICK TOTAL CONSOLIDATED$000s BENEFIT BEFORE INTERCOMPANY FINANCIAL
WHEEL-TRANS (WT)
ASSOCIATION INTERCOMPANY ELIMINATIONS STATEMENTS(SBA) ELIMINATIONS
STATEMENT OF OPERATIONS
REVENUE 1,163,977 Passenger services 7,646 - - 1,171,623 - 1,171,623
Advertising 28,322 - - - 28,322 - 28,322Outside City Services 15,383 - - - 15,383 - 15,383Property rental 21,429 - 1,261 - 22,690 - 22,690Miscellaneous 5,359 - 50 144 5,553 (369) 5,184 Total Operating Revenue 1,234,470 7,646 1,311 144 1,243,571 (369) 1,243,202
SUBSIDIES Operating Subsidy 461,773 126,531 - - 588,304 - 588,304Capital Subsidy 1,385,195 - - - 1,385,195 - 1,385,195 Total Subsidy Revenue 1,846,968 126,531 - - 1,973,499 - 1,973,499
EXPENSES Wages, salaries and benefits 1,297,353 58,659 5 Materials, services and supplies 241,935 13,308 262 Vehicle fuel 78,245 2,626 -
- 1,356,017 (144) 1,355,873144 255,649 (263) 255,386
- 80,871 - 80,871Accident Claims (14,057) (246) - - (14,403) 38 (14,265)Electric traction power 50,490 - - - 50,490 - 50,490Wheel-Trans contract services - 59,362 - - 59,362 - 59,362Utilities 25,883 468 - - 26,351 - 26,351Depreciation (Operating budget) 25,448 - 558 - 26,006 - 26,006Depreciation (Subsidized assets) 1 468,853 - - - 468,853 - 468,853 Total Expenses 2,174,150 134,177 825 144 2,309,296 (369) 2,308,927
Surplus (deficit) for the year 907,288 - 486 - 907,773 - 907,774Accumulated surplus (deficit), beginning of the year 9,872,459 - (2,715) 92 9,869,836 - 9,869,836Accumulated Surplus (deficit), end of the Year 10,779,747 - (2,229) 92 10,777,609 - 10,777,610
Not on TTC Financial Statements Operating subsidies from the City (as above) 461,773 126,531 - - 588,304 - -Operating subsidy - long-term payable for accident claims 34,826 794 - - 35,620 - -Operating subsidy - long-term payable for employee benefits
(40,362) (1,969) - - (42,331) - -City special costs 4,747 - - - 4,747(Draw from or contribution) to the City's TTC Stabilization Reserve Fund or Long Term Liability Fund 14,194 295 - - 14,489 - -
Total City Operating Subsidy - Current 475,178 125,651 - - 600,829 - -
Statement of Financial Position Financial Assets Cash and cash equivalents 224,353 - 3,432 68 227,853 - 227,853Subsidies Receivable 1,107,850 - - - 1,107,850 - 1,107,850Accounts Receivable 103,082 - 7 3,046 106,135 (3,067) 103,068Portfolio Investments 2,268 - - - 2,268 - 2,268Advances to and investment in subsidiary 7,571 - - - 7,751 (7,571) -Indemnity receivable from the TTC - - 141,416 - 141,416 (141,416) -Derivative Investments 9,838 - - - 9,838 - 9,838 Total Financial Assets 1,454,962 - 144,855 3,114 1,602,931 (152,054) 1,450,877
Liabilities Accounts payable and accrued liabilities 770,446 - 269 3,022 773,737 (3,067) 770,670Deferred passenger revenue 75,392 - - - 75,392 - 75,392Future Employee Benefit Liabilities 687,171 - - - 687,171 - 687,171Unsettled accident claims 156,633 - 141,416 - 298,049 (141,416) 156,633Environmental Liabilities 8,125 - - - 8,125 - 8,125Due to parent - - 6,571 - 6,571 (6,571) - Total Liabilities 1,697,767 - 148,256 3,022 1,849,045 (151,054) 1,697,991
Net Debt (242,805) - (3,401) 92 (246,114) (1,000) (247,114)Non-Financial Assets Tangible Capital Assets 10,884,687 - 2,171 - 10,886,858 - 10,886,858Spare parts and supplies inventory 138,755 - - - 138,755 - 138,755Prepaid Expenses 8,949 - - - 8,949 - 8,949Accrued Pension Benefit Asset - - - - - - - Total Non-Financial Assets 11,032,391 - 2,171 - 11,034,562 - 11,034,562
Capital Stock - - 1,000 - 1,000 (1,000) -Accumulated Surplus (deficit) 10,789,586 - (2,230) 92 10,787,448 - 10,787,448
1 For the Consolidated Statement of Financial Position presentation, $7,300 of the total depreciation on subsidized assets was allocated to Wheel-Trans.
62 | Toronto Transit Commission – Annual Report 2017

|
CONSOLIDATED FINANCIAL STATEMENTS – As at and for the Year ended December 31, 2017 TORONTO TORONTO COACH TTC SICK TOTAL CONSOLIDATED
$000s TRANSIT TERMINAL INC. BENEFIT BEFORE INTERCOMPANY FINANCIAL COMMISSION WHEEL-TRANS CONSOLIDATED ASSOCIATION INTERCOMPANY ELIMINATIONS STATEMENTS
(TTC) (WT) (TCTI) (SBA) ELIMINATIONS STATEMENT OF OPERATIONS REVENUE Passenger services 1,163,977 7,646 - - 1,171,623 - 1,171,623 Advertising 28,322 - - - 28,322 - 28,322 Outside City Services 15,383 - - - 15,383 - 15,383 Property rental 21,429 - 1,261 - 22,690 - 22,690 Miscellaneous 5,359 - 50 144 5,553 (369) 5,184 Total Operating Revenue 1,234,470 7,646 1,311 144 1,243,571 (369) 1,243,202 SUBSIDIES Operating Subsidy 461,773 126,531 - - 588,304 - 588,304 Capital Subsidy 1,385,195 - - - 1,385,195 - 1,385,195 Total Subsidy Revenue 1,846,968 126,531 - - 1,973,499 - 1,973,499 EXPENSES Wages, salaries and benefits 1,297,353 58,659 5 - 1,356,017 (144) 1,355,873 Materials, services and supplies 241,935 13,308 262 144 255,649 (263) 255,386 Vehicle fuel 78,245 2,626 - - 80,871 - 80,871 Accident Claims (14,057) (246) - - (14,403) 38 (14,265) Electric traction power 50,490 - - - 50,490 - 50,490 Wheel-Trans contract services - 59,362 - - 59,362 - 59,362 Utilities 25,883 468 - - 26,351 - 26,351 Depreciation (Operating budget) 25,448 - 558 - 26,006 - 26,006 Depreciation (Subsidized assets) 1 468,853 - - - 468,853 - 468,853 Total Expenses 2,174,150 134,177 825 144 2,309,296 (369) 2,308,927 Surplus (deficit) for the year 907,288 - 486 - 907,774 - 907,774 Accumulated surplus (deficit), beginning of the year 9,872,459 - (2,715) 92 9,869,836 - 9,869,836 Accumulated Surplus (deficit), end of the Year 10,779,747 - (2,229) 92 10,777,610 - 10,777,610 Not on TTC Financial Statements Operating subsidies from the City (as above) 461,773 126,531 - - 588,304 - - Operating subsidy - long-term payable for accident claims 34,826 794 - - 35,620 - - Operating subsidy - long-term payable for employee benefits
(40,362) (1,969) - - (42,331) - - City special costs
4,747 - - - 4,747 (Draw from or contribution) to the City's TTC Stabilization Reserve Fund or Long Term Liability Fund
14,194 295 - - 14,489 - -
Total City Operating Subsidy - Current 475,178 125,651 - - 600,829 - - Statement of Financial Position Financial Assets Cash and cash equivalents 224,353 - 3,432 68 227,853 - 227,853 Subsidies Receivable 1,107,850 - - - 1,107,850 - 1,107,850 Accounts Receivable 103,082 - 7 3,046 106,135 (3,067) 103,068 Portfolio Investments 2,268 - - - 2,268 - 2,268 Advances to and investment in subsidiary 7,571 - - - 7,751 (7,571) - Indemnity receivable from the TTC - - 141,416 - 141,416 (141,416) - Derivative Investments 9,838 - - - 9,838 - 9,838 Total Financial Assets 1,454,962 - 144,855 3,114 1,602,931 (152,054) 1,450,877 Liabilities Accounts payable and accrued liabilities 770,446 - 269 3,022 773,737 (3,067) 770,670 Deferred passenger revenue 75,392 - - - 75,392 - 75,392 Future Employee Benefit Liabilities 687,171 - - - 687,171 - 687,171 Unsettled accident claims 156,633 - 141,416 - 298,049 (141,416) 156,633 Environmental Liabilities 8,125 - - - 8,125 - 8,125 Due to parent - - 6,571 - 6,571 (6,571) - Total Liabilities 1,697,767 - 148,256 3,022 1,849,045 (151,054) 1,697,991 Net Debt (242,805) - (3,401) 92 (246,114) (1,000) (247,114) Non-Financial Assets Tangible Capital Assets 10,884,687 - 2,171 - 10,886,858 - 10,886,858 Spare parts and supplies inventory 138,755 - - - 138,755 - 138,755 Prepaid Expenses 8,949 - - - 8,949 - 8,949 Accrued Pension Benefit Asset - - - - - - - Total Non-Financial Assets 11,032,391 - 2,171 - 11,034,562 - 11,034,562 Capital Stock - - 1,000 - 1,000 (1,000) - Accumulated Surplus (deficit) 10,789,586 - (2,230) 92 10,787,448 - 10,787,448
1 For the Consolidated Statement of Financial Position presentation, $7,300 of the total depreciation on subsidized assets was allocated to Wheel-Trans.
CONSOLIDATED FINANCIAL STATEMENTS – As at and for the Year ended December 31, 2017 TORONTO TORONTO COACH TTC SICK
BENEFIT ASSOCIATION
(SBA)
TOTAL BEFORE
INTERCOMPANY ELIMINATIONS
INTERCOMPANY
ELIMINATIONS
CONSOLIDATED FINANCIAL
STATEMENTS $000s TRANSIT TERMINAL INC.
COMMISSION WHEEL-TRANS CONSOLIDATED (TTC) (WT) (TCTI)
STATEMENT OF OPERATIONS REVENUE Passenger services 1,163,977 7,646 - - 1,171,623 - 1,171,623 Advertising 28,322 - - - 28,322 - 28,322 Outside City Services 15,383 - - - 15,383 - 15,383 Property rental 21,429 - 1,261 - 22,690 - 22,690 Miscellaneous 5,359 - 50 144 5,553 (369) 5,184 Total Operating Revenue 1,234,470 7,646 1,311 144 1,243,571 (369) 1,243,202 SUBSIDIES Operating Subsidy 461,773 126,531 - - 588,304 - 588,304 Capital Subsidy 1,385,195 - - - 1,385,195 - 1,385,195 Total Subsidy Revenue 1,846,968 126,531 - - 1,973,499 - 1,973,499 EXPENSES Wages, salaries and benefits 1,297,353 58,659 5 - 1,356,017 (144) 1,355,873 Materials, services and supplies 241,935 13,308 262 144 255,649 (263) 255,386 Vehicle fuel 78,245 2,626 - - 80,871 - 80,871 Accident Claims (14,057) (246) - - (14,403) 38 (14,265) Electric traction power 50,490 - - - 50,490 - 50,490 Wheel-Trans contract services - 59,362 - - 59,362 - 59,362 Utilities 25,883 468 - - 26,351 - 26,351 Depreciation (Operating budget) 25,448 - 558 - 26,006 - 26,006 Depreciation (Subsidized assets) 1 468,853 - - - 468,853 - 468,853 Total Expenses 2,174,150 134,177 825 144 2,309,296 (369) 2,308,927 Surplus (deficit) for the year 907,288 - 486 - 907,774 - 907,774 Accumulated surplus (deficit), beginning of the year 9,872,459 - (2,715) 92 9,869,836 - 9,869,836 Accumulated Surplus (deficit), end of the Year 10,779,747 - (2,229) 92 10,777,610 - 10,777,610 Not on TTC Financial Statements Operating subsidies from the City (as above) 461,773 126,531 - - 588,304 - - Operating subsidy - long-term payable for accident claims 34,826 794 - - 35,620 - - Operating subsidy - long-term payable for employee benefits
(40,362) (1,969) - - (42,331) - - City special costs
4,747 - - - 4,747 (Draw from or contribution) to the City's TTC Stabilization Reserve Fund or Long Term Liability Fund
14,194 295 - - 14,489 - -
Total City Operating Subsidy - Current 475,178 125,651 - - 600,829 - - Statement of Financial Position Financial Assets Cash and cash equivalents 224,353 - 3,432 68 227,853 - 227,853 Subsidies Receivable 1,107,850 - - - 1,107,850 - 1,107,850 Accounts Receivable 103,082 - 7 3,046 106,135 (3,067) 103,068 Portfolio Investments 2,268 - - - 2,268 - 2,268 Advances to and investment in subsidiary 7,571 - - - 7,751 (7,571) - Indemnity receivable from the TTC - - 141,416 - 141,416 (141,416) - Derivative Investments 9,838 - - - 9,838 - 9,838 Total Financial Assets 1,454,962 - 144,855 3,114 1,602,931 (152,054) 1,450,877 Liabilities Accounts payable and accrued liabilities 770,446 - 269 3,022 773,737 (3,067) 770,670 Deferred passenger revenue 75,392 - - - 75,392 - 75,392 Future Employee Benefit Liabilities 687,171 - - - 687,171 - 687,171 Unsettled accident claims 156,633 - 141,416 - 298,049 (141,416) 156,633 Environmental Liabilities 8,125 - - - 8,125 - 8,125 Due to parent - - 6,571 - 6,571 (6,571) - Total Liabilities 1,697,767 - 148,256 3,022 1,849,045 (151,054) 1,697,991 Net Debt (242,805) - (3,401) 92 (246,114) (1,000) (247,114) Non-Financial Assets Tangible Capital Assets 10,884,687 - 2,171 - 10,886,858 - 10,886,858 Spare parts and supplies inventory 138,755 - - - 138,755 - 138,755 Prepaid Expenses 8,949 - - - 8,949 - 8,949 Accrued Pension Benefit Asset - - - - - - - Total Non-Financial Assets 11,032,391 - 2,171 - 11,034,562 - 11,034,562 Capital Stock - - 1,000 - 1,000 (1,000) - Accumulated Surplus (deficit) 10,789,586 - (2,230) 92 10,787,448 - 10,787,448
1 For the Consolidated Statement of Financial Position presentation, $7,300 of the total depreciation on subsidized assets was allocated to Wheel-Trans.
63

CONVENTIONAL SYSTEM – 10 YEAR NON‐CONSOLIDATED FINANCIAL & OPERATING STATISTICS (UNAUDITED)
OPERATING STATISTICS (regular service inside the City)2017 2016 2015 2014 2013 2012 2011 2010 2009 2008
Passenger Trips (Millions) 533.2 538.1 537.6 534.8 525.2 514.0 500.2 477.4 471.2 466.7Basic Adult Token Fare (at December 31) ($) 3.00 2.90 2.80 2.70 2.65 2.60 2.50 2.50 2.25 2.25Average Number of Employees (including Toronto Coach Terminal Inc.) 14,389 14,095 13,651 13,209 12,920 12,739 12,674 12,553 12,324 11,679Hourly Base Wage Rate & Benefits per Operator ($) 51.68 50.81 50.33 49.01 47.94 47.35 46.0712 44.7412 43.27 41.46Kilometres Operated (Millions) Bus 142.0 138.6 131.6 131.3 129.6 125.0 123.6 124.0 123.7 114.2 Subway 82.9 83.0 82.2 80.8 79.3 78.6 76.1 75.7 75.5 74.9 Streetcar 11.5 13.1 13.9 12.8 12.5 12.6 13.1 12.7 12.3 12.1 Scarborough RT 3.4 3.5 3.4 3.5 3.5 3.1 3.3 3.3 3.3 3.3 Total Kilometres Operated 239.8 238.2 231.1 228.4 224.9 219.3 216.1 215.7 214.8 204.5
OPERATING REVENUE STATISTICSOperating Revenue – including property rental, etc. ($ Millions) 1,234.5 1,196.3 1,179.1 1,157.5 1,120.2 1,087.3 1,026.4 987.5 886.4 891.8Operating Revenue per Passenger Trip ($) 2.32 2.22 2.19 2.16 2.13 2.11 2.05 2.07 1.88 1.91Operating Revenue per Kilometre ($) 5.15 5.02 5.10 5.07 4.98 4.96 4.75 4.58 4.13 4.36
OPERATING EXPENSE STATISTICS 1
Operating Expenses ($ Millions) 1,696.2 1,712.6 1,695.7 1,589.5 1,491.7 1,472.4 1,460.0 1,385.9 1,328.7 1,208.7Operating Expense per Passenger Trip ($) 3.18 3.18 3.15 2.97 2.84 2.86 2.92 2.90 2.82 2.59Operating Expense per Kilometre ($) 7.07 7.19 7.34 6.96 6.63 6.71 6.76 6.43 6.19 5.91
OPERATING SUBSIDY STATISTICSOperating Subsidy ($ Millions) 461.811 516.310 516.69 432.08 371.57 385.16 433.65 398.44 442.33 316.92
Operating Subsidy per Passenger Trip ($) 0.86 0.96 0.96 0.81 0.71 0.75 0.87 0.83 0.94 0.68Operating Subsidy per Kilometre ($) 1.92 2.17 2.24 1.89 1.65 1.76 2.01 1.85 2.06 1.55
REVENUE/COST RATIO 72.8% 69.9% 69.5% 72.8% 75.1% 73.8% 70.3% 71.3% 66.7% 73.8%
PASSENGER VEHICLE FLEET(Conventional & Wheel‐Trans, owned or leased and in service at December 31) Buses 1,920 1,926 1,861 1,869 1,851 1,857 1,819 1,811 1,782 1,737 Subway 848 840 796 724 704 708 712 676 678 678 Streetcars (CLRV & ALRV) 184 219 235 247 247 247 247 247 248 248 Streetcars (LFLRV) 57 30 13 3 0 0 0 0 0 0 Scarborough RT Cars 28 28 28 28 28 28 28 28 28 28 Wheel‐Trans Buses 212 199 205 221 221 246 217 227 188 147 Total Vehicle Fleet 3,249 3,242 3,138 3,092 3,051 3,086 3,023 2,989 2,924 2,838
See accompanying notes for conventional system – 10 Year Non-Consolidated Financial & Operating Statistics (Unaudited)
64 | Toronto Transit Commission – Annual Report 2017

|
CONVENTIONAL SYSTEM – 10 YEAR NON‐CONSOLIDATED FINANCIAL & OPERATING STATISTICS (UNAUDITED)
See accompanying notes for conventional system – 10 Year Non-Consolidated Financial & Operating Statistics (Unaudited)
2017 2016 2015 2014 2013 2012 2011 2010 2009 2008OPERATING STATISTICS (regular service inside the City)Passenger Trips (Millions) 533.2 538.1 537.6 534.8 525.2 514.0 500.2 477.4 471.2 466.7Basic Adult Token Fare (at December 31) ($) 3.00 2.90 2.80 2.70 2.65 2.60 2.50 2.50 2.25 2.25Average Number of Employees (including Toronto Coach Terminal Inc.) 14,389 14,095 13,651 13,209 12,920 12,739 12,674 12,553 12,324 11,679Hourly Base Wage Rate & Benefits per Operator ($) 51.68 50.81 50.33 49.01 47.94 47.35 46.0712 44.7412 43.27 41.46Kilometres Operated (Millions)Bus 142.0 138.6 131.6 131.3 129.6 125.0 123.6 124.0 123.7 114.2Subway 82.9 83.0 82.2 80.8 79.3 78.6 76.1 75.7 75.5 74.9Streetcar 11.5 13.1 13.9 12.8 12.5 12.6 13.1 12.7 12.3 12.1Scarborough RT 3.4 3.5 3.4 3.5 3.5 3.1 3.3 3.3 3.3 3.3Total Kilometres Operated 239.8 238.2 231.1 228.4 224.9 219.3 216.1 215.7 214.8 204.5
OPERATING REVENUE STATISTICSOperating Revenue – including property rental, etc. ($ Millions) 1,234.5 1,196.3 1,179.1 1,157.5 1,120.2 1,087.3 1,026.4 987.5 886.4 891.8Operating Revenue per Passenger Trip ($) 2.32 2.22 2.19 2.16 2.13 2.11 2.05 2.07 1.88 1.91Operating Revenue per Kilometre ($) 5.15 5.02 5.10 5.07 4.98 4.96 4.75 4.58 4.13 4.36
OPERATING EXPENSE STATISTICS 1
Operating Expenses ($ Millions) 1,696.2 1,712.6 1,695.7 1,589.5 1,491.7 1,472.4 1,460.0 1,385.9 1,328.7 1,208.7Operating Expense per Passenger Trip ($) 3.18 3.18 3.15 2.97 2.84 2.86 2.92 2.90 2.82 2.59Operating Expense per Kilometre ($) 7.07 7.19 7.34 6.96 6.63 6.71 6.76 6.43 6.19 5.91
OPERATING SUBSIDY STATISTICSOperating Subsidy ($ Millions) 461.811 516.310 516.69 432.08 371.57 385.16 433.65 398.44 442.33 316.92
Operating Subsidy per Passenger Trip ($) 0.86 0.96 0.96 0.81 0.71 0.75 0.87 0.83 0.94 0.68Operating Subsidy per Kilometre ($) 1.92 2.17 2.24 1.89 1.65 1.76 2.01 1.85 2.06 1.55
REVENUE/COST RATIO 72.8% 69.9% 69.5% 72.8% 75.1% 73.8% 70.3% 71.3% 66.7% 73.8%
PASSENGER VEHICLE FLEET(Conventional & Wheel‐Trans, owned or leased and in service at December 31)Buses 1,920 1,926 1,861 1,869 1,851 1,857 1,819 1,811 1,782 1,737Subway 848 840 796 724 704 708 712 676 678 678Streetcars (CLRV & ALRV) 184 219 235 247 247 247 247 247 248 248Streetcars (LFLRV) 57 30 13 3 0 0 0 0 0 0Scarborough RT Cars 28 28 28 28 28 28 28 28 28 28Wheel‐Trans Buses 212 199 205 221 221 246 217 227 188 147Total Vehicle Fleet 3,249 3,242 3,138 3,092 3,051 3,086 3,023 2,989 2,924 2,838
CONVENTIONAL SYSTEM – 10 YEAR NON‐CONSOLIDATED FINANCIAL & OPERATING STATISTICS (UNAUDITED)
See accompanying notes for conventional system – 10 Year Non-Consolidated Financial & Operating Statistics (Unaudited)
2017 2016 2015 2014 2013 2012 2011 2010 2009 2008OPERATING STATISTICS (regular service inside the City)Passenger Trips (Millions) 533.2 538.1 537.6 534.8 525.2 514.0 500.2 477.4 471.2 466.7Basic Adult Token Fare (at December 31) ($) 3.00 2.90 2.80 2.70 2.65 2.60 2.50 2.50 2.25 2.25Average Number of Employees (including Toronto Coach Terminal Inc.) 14,389 14,095 13,651 13,209 12,920 12,739 12,674 12,553 12,324 11,679Hourly Base Wage Rate & Benefits per Operator ($) 51.68 50.81 50.33 49.01 47.94 47.35 46.0712 44.7412 43.27 41.46Kilometres Operated (Millions)Bus 142.0 138.6 131.6 131.3 129.6 125.0 123.6 124.0 123.7 114.2Subway 82.9 83.0 82.2 80.8 79.3 78.6 76.1 75.7 75.5 74.9Streetcar 11.5 13.1 13.9 12.8 12.5 12.6 13.1 12.7 12.3 12.1Scarborough RT 3.4 3.5 3.4 3.5 3.5 3.1 3.3 3.3 3.3 3.3Total Kilometres Operated 239.8 238.2 231.1 228.4 224.9 219.3 216.1 215.7 214.8 204.5
OPERATING REVENUE STATISTICSOperating Revenue – including property rental, etc. ($ Millions) 1,234.5 1,196.3 1,179.1 1,157.5 1,120.2 1,087.3 1,026.4 987.5 886.4 891.8Operating Revenue per Passenger Trip ($) 2.32 2.22 2.19 2.16 2.13 2.11 2.05 2.07 1.88 1.91Operating Revenue per Kilometre ($) 5.15 5.02 5.10 5.07 4.98 4.96 4.75 4.58 4.13 4.36
OPERATING EXPENSE STATISTICS 1
Operating Expenses ($ Millions) 1,696.2 1,712.6 1,695.7 1,589.5 1,491.7 1,472.4 1,460.0 1,385.9 1,328.7 1,208.7Operating Expense per Passenger Trip ($) 3.18 3.18 3.15 2.97 2.84 2.86 2.92 2.90 2.82 2.59Operating Expense per Kilometre ($) 7.07 7.19 7.34 6.96 6.63 6.71 6.76 6.43 6.19 5.91
OPERATING SUBSIDY STATISTICSOperating Subsidy ($ Millions) 461.811 516.310 516.69 432.08 371.57 385.16 433.65 398.44 442.3 3 316.92 Operating Subsidy per Passenger Trip ($) 0.86 0.96 0.96 0.81 0.71 0.75 0.87 0.83 0.94 0.68Operating Subsidy per Kilometre ($) 1.92 2.17 2.24 1.89 1.65 1.76 2.01 1.85 2.06 1.55
REVENUE/COST RATIO 72.8% 69.9% 69.5% 72.8% 75.1% 73.8% 70.3% 71.3% 66.7% 73.8%
PASSENGER VEHICLE FLEET(Conventional & Wheel‐Trans, owned or leased and in service at December 31)Buses 1,920 1,926 1,861 1,869 1,851 1,857 1,819 1,811 1,782 1,737Subway 848 840 796 724 704 708 712 676 678 678Streetcars (CLRV & ALRV) 184 219 235 247 247 247 247 247 248 248Streetcars (LFLRV) 57 30 13 3 0 0 0 0 0 0Scarborough RT Cars 28 28 28 28 28 28 28 28 28 28Wheel‐Trans Buses 212 199 205 221 221 246 217 227 188 147Total Vehicle Fleet 3,249 3,242 3,138 3,092 3,051 3,086 3,023 2,989 2,924 2,838
65

NOTES for CONVENTIONAL SYSTEM – 10 Year Non‐Consolidated Financial & Operating Statistics (Unaudited)
1. In 2011, the TTC adopted Public Sector Accounting Standards (PSAS) for its financial reporting. Prior to the adoption of PSAS, depreciationexpense on subsidized assets was completely offset by the related capital subsidy and the accounting expense for the TTC Pension Fund wasequal to the TTC’s cash contributions. To maintain consistency with both the pre‐2011 presentation in this schedule and the TTC’s operatingbudget, beginning in 2011 the operating expenses exclude depreciation on subsidized assets, the TTC Pension Fund expense or income thatis in excess of the TTC’s cash contributions, and capital project write downs and environmental expenses that are funded through capitalsubsidy.
2. In 2008, the total subsidy paid by the City was $131.4 million, consisting of $145.1 million for the operating subsidy, $2.8 million for the Cityspecial costs, less a $16.5 million long‐term payable for employee benefits. The City allocated $171.8 million of Provincial subsidy to theoperating budget.
3. In 2009, the total subsidy paid by the City was $302.7 million, consisting of $350.7 million for the operating subsidy, $3.0 million for the Cityspecial costs, less a $30.4 million long‐term payable for accident claims and a $20.6 million long‐term payable for employee benefits. TheCity allocated $91.6 million of Provincial subsidy to the operating budget.
4. In 2010, the total subsidy paid by the City was $278.2 million, consisting of $306.8 million for the operating subsidy, $3.0 million for the Cityspecial costs, less a $17.3 million long‐term payable for accident claims and a $14.3 million long‐term payable for employee benefits. TheCity allocated $91.6 million of Provincial subsidy to the operating budget.
5. In 2011, the total subsidy paid by the City was $317.7 million, consisting of $342.0 million for the operating subsidy, $3.4 million for the Cityspecial costs, less a $14.6 million long‐term payable for accident claims and a $13.1 million long‐term payable for employee benefits. TheCity allocated $91.6 million of Provincial subsidy to the operating budget.
6. In 2012, the total subsidy paid by the City was $278.4 million, consisting of $293.5 million for the operating subsidy, $3.5 million for the Cityspecial costs, less $18.6 million long‐term payable (employee benefits of $23.3 million less accident claims of $4.7 million). The Cityallocated $91.6 million of Provincial subsidy to the operating budget.
7. In 2013, the total subsidy paid by the City was $273.4 million, consisting of $279.9 million for the operating subsidy, $3.6 million for the Cityspecial costs, $13.1 million for accident claims and less a $23.2 million long‐term payable for employee benefits. The City allocated $91.6million of Provincial subsidy to the operating budget.
8. In 2014, the total subsidy paid by the City was $301.4 million, consisting of $340.4 million for the operating subsidy, $3.6 million for the Cityspecial costs, less $42.6 million long‐term payable (employee benefits of $29.8 million plus accident claims of $12.8 million). The Cityallocated $91.6 million of Provincial subsidy to the operating budget.
9. In 2015, the total subsidy paid by the City was $373.8 million, consisting of $427.0 million for the operating subsidy, $19.2 million for capitalfrom current, $3.6 million for the City special costs, less $26.6 million long‐term payable for accident claims and $40.1 million long‐termpayable for employee benefits, less $9.0 million draw from the TTC Stabilization Reserve Fund and $0.3 million draw from the City Tax RateStabilization Reserve. The $427.0 million for operating subsidy includes $2.0 million in funding for the Wheel‐Trans deficit. The Cityallocated $91.6 million of Provincial subsidy to the operating budget.
10. In 2016, the total subsidy paid by the City was $396.0 million, consisting of $426.4 million for the operating subsidy, $3.7 million for the Cityspecial costs, $6.3 million long‐term payable for accident claims and less a $40.4 million long‐term payable for employee benefits. The$426.4 million for operating subsidy includes $1.7 million in funding for the Wheel‐Trans deficit. The City allocated $91.6 million of Provincialsubsidy to the operating budget.
11. In 2017, the total subsidy paid by the City was $383.5 million, consisting of $370.2 million for the operating subsidy, $14.2 million forcontributions to Long‐Term Liability Reserve, $4.7 million for the City special costs, $34.8 million long‐term payable for accident claims andless a $40.4 million long‐term payable for employee benefits. The City allocated $91.6 million of Provincial subsidy to the operating budget.
12. The 2011 and 2010 average hourly wages & benefits per operator amounts previously reported (2011 — $45.05 and 2010 — $44.50) havebeen updated to reflect negotiated improvements that were applied retroactively.
66 | Toronto Transit Commission – Annual Report 2017

|
Management DirectoryDecember 31, 2017Executive Team
Richard J. LearyChief Executive Officer (Acting)
Collie GreenwoodChief Service Officer (Acting)
John O’GradyChief Safety Officer
Mike Palmer Chief Operating Officer
Gemma PiemonteseChief People Officer
Susan Reed TanakaChief Capital Officer
Tara BalChief Financial Officer (Acting)
Brad RossExecutive Director of Corporate Communications
James Ross Deputy Chief Operating Officer
Joan TaylorChief of Staff
Kirsten Watson Chief Customer Officer and Deputy Chief Executive Officer (Acting)
Megan MacRae Executive Director of Human Resources
Senior Management and Department Heads
Valerie AlbaneseHead of Diversity and Human Rights
Teresa Bassett-SpiersDirector of Policy Development
Tim BaubieHead of Stations
Arthur BorkwoodHead of Customer Development
Glen BuchbergerHead of Plant Maintenance
Bem CaseHead of Vehicle Programs
Sam CastiglioneHead of Operations Financial Control
Stephen ConfortiHead of Finance and Treasurer
Jacqueline Darwood Head of Strategy and Service Planning
Gary DownieChief Project Manager Scarborough Subway Extension
Jim FraserHead of Capital Programming
Dan GunaHead of Information Technology Services and Chief Information Officer
Craig HarperHead of Subway Infrastructure
Sean HewittChief Executive Officer of Pension Fund Society
Bob HughesHead of Farecard Team
Raewyn JacksonHead of Subway Transportation
Mike Killingsworth Head of Transit Enforcement
Orest KobylanskyHead of Transit Information Systems
Pamela KraftHead of Property, Planning and Development
Pierre LaurinHead of Engineering
Christine LeachHead of Internal Audit (Acting)
Brian LeckHead of Legal and General Counsel
Kevin LeeHead of Commission Services
Paul MagliettaHead of Training and Development
Paul ManherzStaff Sergeant of Investigative Services – Criminal Investigations
Sue MotahedinHead of Customer Service Centre
Jane MurrayChief Project Manager Construction
Harpreeti NagiHead of Rail Cars and Shops
Albert OliverHead of Streetcar Transportation
Allan Pritchard Head of Bus Maintenance and Shops
Mark RussellStaff Sergeant of Investigative Services – Special Operations
Chris SalvadorHead of Revenue Operations
Anja SchiralliDirector of Employee Service Centre
Susan SelfeHead of Service Delivery Control
Keith SibleyChief Project ManagerSpadina Subway Extension
Robert SmithHead of Bus Transportation (Acting)
Cheryn ThounHead of Customer Communications
Pete TomlinSenior Project ManagerAutomatic Train Control
Eve Wiggins Head of Wheel-Trans
Rich WongHead of Streetcar Maintenance and Infrastructure
Ted ZlotnikHead of Materials and Procurement
For further information, please contact: Toronto Transit Commission1900 Yonge Street, Toronto, Ontario, M4S 1Z2Telephone: (416) 393-4000Fax: (416) 485-9394Website: www.ttc.ca
67


![[TTC Rules below Quy Định TTC kéo xuống dưới] · [TTC Rules below – Quy Định TTC kéo xuống dưới] Thus, gossiping or backbiting about other person, staff or students](https://static.fdocuments.us/doc/165x107/5f09d2e47e708231d428a927/ttc-rules-below-quy-nh-ttc-ko-xung-di-ttc-rules-below-a-quy.jpg)