TRUCK TRIP DATA COLLECTION METHODS - Oregon
111
TRUCK TRIP DATA COLLECTION METHODS Final Report SPR 343 by Eric Jessup, Ph.D. and Kenneth L. Casavant, Ph.D. Washington State University Department of Agricultural and Resource Economics Pullman, WA 99164-6210 and Catherine T. Lawson, Ph.D. Department of Geography and Planning University at Albany -- State University of New York Albany, NY 12222 for Oregon Department of Transportation Research Unit 200 Hawthorne Ave. SE -- Suite B-240 Salem, OR 97301-5192 and Federal Highway Administration 400 Seventh Street SW Washington, DC 20590 February 2004
Transcript of TRUCK TRIP DATA COLLECTION METHODS - Oregon

TRUCK TRIP DATA COLLECTION METHODS
Final Report
SPR 343
by
Eric Jessup, Ph.D. and Kenneth L. Casavant, Ph.D. Washington State University
Department of Agricultural and Resource Economics Pullman, WA 99164-6210
and
Catherine T. Lawson, Ph.D.
Department of Geography and Planning University at Albany -- State University of New York
Albany, NY 12222
for
Oregon Department of Transportation Research Unit
200 Hawthorne Ave. SE -- Suite B-240 Salem, OR 97301-5192
and
Federal Highway Administration
400 Seventh Street SW Washington, DC 20590
February 2004


Technical Report Documentation Page 1. Report No.
FHWA-OR-RD-04-10 2. Government Accession No.
3. Recipient’s Catalog No.
5. Report Date February 2004
4. Title and Subtitle TRUCK TRIP DATA COLLECTION METHODS 6. Performing Organization Code
7. Author(s) Eric Jessup, Ph.D. and Kenneth L. Casavant, Ph.D. Washington State University Department of Agricultural and Resource Economics Pullman, WA 99164-6210 and Catherine T. Lawson, Ph.D. Department of Geography and Planning University at Albany -- State University of New York Albany, NY 12222
8. Performing Organization Report No.
10. Work Unit No. (TRAIS)
9. Performing Organization Name and Address Oregon Department of Transportation Research Group 200 Hawthorne SE, Suite B-240 Salem, Oregon 97301-5192
11. Contract or Grant No. SPR 343
13. Type of Report and Period Covered Final Report
12. Sponsoring Agency Name and Address Oregon Department of Transportation Research Unit and Federal Highway Administration 200 Hawthorne SE, Suite B-240 400 Seventh Street SW Salem, Oregon 97301-5192 Washington, DC 20590
14. Sponsoring Agency Code
15. Supplementary Notes
16. Abstract A considerable body of research exists for addressing the data needs for passenger transportation models and statewide freight truck movements. The number of studies which focus on methods for capturing the necessary data on urban freight movements is less abundant. This study addresses this problem by identifying those freight data attributes necessary for both urban region truck modeling and freight planning efforts and evaluates alternative data collection methodologies for providing these necessary data attributes. Data attributes such as origin-destination detail, route identification, land-use at stops, commodity, weight, vehicle configuration, time of day, volume of shipments and location of trip generators were identified as necessary for modeling and planning needs. Two pilot studies were conducted in the Portland, OR metropolitan area, to test truck trip data collection methodologies. One pilot study tested a roadside intercept survey method at three different locations, including an interstate highway weigh station, a Port of Portland marine terminal, and a private freight warehouse/distribution center. The other pilot study tested a combination of mail and fax survey methods used with two different sample types. The survey methods tested included straight mail, phone-mail, phone-mail-phone, straight fax, phone-fax, phone-fax-phone, sent to a “Known” and “Unknown” mail population. The results from the different freight data collection methodologies are presented and evaluated.
17. Key Words freight flow, truck trip data, origin and destination, commodity data, urban traffic flow, traffic modeling, freight planning
18. Distribution Statement Copies available from NTIS, and online at http://www.odot.state.or.us/tddresearch
19. Security Classification (of this report) Unclassified
20. Security Classification (of this page) Unclassified
21. No. of Pages 86 + appendices
22. Price
Technical Report Form DOT F 1700.7 (8-72) Reproduction of completed page authorized A Printed on recycled paper
i

ii
SI* (MODERN METRIC) CONVERSION FACTORS APPROXIMATE CONVERSIONS TO SI UNITS APPROXIMATE CONVERSIONS FROM SI UNITS
Symbol When You Know Multiply By To Find Symbol Symbol When You Know Multiply By To Find Symbol
LENGTH LENGTH
In inches 25.4 Millimeters mm mm millimeters 0.039 inches in Ft feet 0.305 Meters m m meters 3.28 feet ft Yd yards 0.914 Meters m m meters 1.09 yards yd Mi miles 1.61 Kilometers km km kilometers 0.621 miles mi
AREA AREA In2 square inches 645.2 Millimeters squared mm2 mm2 millimeters squared 0.0016 square inches in2
ft2 square feet 0.093 Meters squared m2 m2 meters squared 10.764 square feet ft2
Yd2 square yards 0.836 Meters squared m2 ha hectares 2.47 acres ac Ac acres 0.405 Hectares ha km2 kilometers squared 0.386 square miles mi2
Mi2 square miles 2.59 Kilometers squared km2 VOLUMEVOLUME mL milliliters 0.034 fluid ounces fl oz
fl oz fluid ounces 29.57 Milliliters mL L liters 0.264 gallons gal Gal gallons 3.785 Liters L m3 meters cubed 35.315 cubic feet ft3
ft3 cubic feet 0.028 Meters cubed m3 m3 meters cubed 1.308 cubic yards yd3
Yd3 cubic yards 0.765 Meters cubed m3 MASSNOTE: Volumes greater than 1000 L shall be shown in m3. g grams 0.035 ounces oz
MASS kg kilograms 2.205 pounds lb Oz ounces 28.35 Grams g Mg megagrams 1.102 short tons (2000 lb) T Lb pounds 0.454 Kilograms kg TEMPERATURE (exact) T short tons (2000 lb) 0.907 Megagrams Mg °C Celsius temperature 1.8C + 32 Fahrenheit °F
TEMPERATURE (exact)
°F Fahrenheit temperature
5(F-32)/9 Celsius temperature °C
* SI is the symbol for the International System of Measurement (4-7-94 jbp)

ACKNOWLEDGEMENTS The authors would like to thank the members of the ODOT Research Unit and Technical Advisory Committee members for their sage advice and assistance in the preparation of this report:
•
• •
• • •
•
•
• •
•
Sam Ayash, ODOT Transportation Planning Analysis Unit Scott Drumm, Port of Portland Nick Fortey, Federal Highway Administration Barnie Jones, ODOT Research Unit Robin Katz, Port of Portland Alan Kirk, ODOT Research Unit
Becky Knudson, ODOT Transportation Planning Analysis Unit Robin Marshburn, ODOT Planning Section John Merriss, ODOT Finance Services Jo Anne Schiffner, ODOT Motor Carrier Transportation Division Dick Walker, Metro Regional Planning
Special thanks to Alan Kirk for his project coordination and many helpful comments and edits that have dramatically improved the quality of this research effort.
The authors wish to recognize the cooperation and support of the following organizations in the conduct of this research: • The ODOT Motor Carrier Transportation Division and Motor Carrier Enforcement Office • The Port of Portland • The freight firm in Portland that volunteered its warehouse site for a pilot survey • The Battle Ground, Washington Lions Club for providing survey personnel at each of the
three roadside interview locations. The authors would also like to acknowledge the following people at Washington State University for their valuable contributions to the success of this project: • Michael Clark, Department of Agricultural and Resource Economics • Research assistants Quinton Pike, Shushanik Makaryan and Markesha Jones for conducting
mail/phone/fax surveys and data input.
iii

DISCLAIMER This document is disseminated under the sponsorship of the Oregon Department of Transportation and the United States Department of Transportation in the interest of information exchange. The State of Oregon and the United States Government assume no liability of its contents or use thereof.
The contents of this report reflect the views of the author(s) who are solely responsible for the facts and accuracy of the data presented herein. The contents do not necessarily reflect the official policies of the Oregon Department of Transportation or the United States Department of Transportation.
The State of Oregon and the United States Government do not endorse products of manufacturers. Trademarks or manufacturers’ names appear herein only because they are considered essential to the object of this document.
This report does not constitute a standard, specification, or regulation.
iv

TRUCK TRIP DATA COLLECTION METHOD STUDY
TABLE OF CONTENTS
1.0 INTRODUCTION..................................................................................................................1 1.1 BACKGROUND AND NEED FOR THE RESEARCH ....................................................1 1.2 STUDY OBJECTIVES........................................................................................................2 1.3 STRUCTURE OF REPORT................................................................................................2
2.0 LITERATURE REVIEW AND CRITIQUE.......................................................................3 2.1 REVIEW OF EARLY URBAN TRUCK TRAVEL STUDIES..........................................3
2.1.1 Chicago Area Transportation Study, 1970 and 1986 ..................................................4 2.1.2 Phoenix, Arizona, 1991 ...............................................................................................4 2.1.3 New York and New Jersey, 1974 - 1991.....................................................................5 2.1.4 El Paso, Texas, 1994 ...................................................................................................5 2.1.5 Houston and Galveston, Texas, 1994 ..........................................................................6 2.1.6 Ontario, Canada, 1978, 1983 and 1988 .......................................................................6 2.1.7 Alameda County-San Francisco, California, 1991......................................................6 2.1.8 Summary of early urban truck travel studies...............................................................7
2.2 NCHRP REPORT 298.......................................................................................................11 2.3 RECENT STUDIES...........................................................................................................18
2.3.1 Strategic Freight Transportation Analysis (SFTA) ...................................................18 2.3.2 Studies incorporating emerging ITS technologies ....................................................20
2.4 AVAILABLE SUPPLEMENTARY AND COMPOSITION DATA ...............................21 2.4.1 Public data sources ....................................................................................................21
2.4.1.1 Commodity Flow Survey (CFS) .............................................................................21 2.4.1.2 Vehicle Inventory and Use Survey (VIUS).............................................................22 2.4.1.3 Highway Performance Monitoring System (HPMS)..............................................22
2.4.2 Private data sources ...................................................................................................23 2.4.2.1 Transearch freight flow database ..........................................................................23
2.5 SUMMARY.......................................................................................................................23
3.0 DATA REQUIREMENTS AND STRUCTURE ...............................................................25 3.1 INTRODUCTION .............................................................................................................25 3.2 PAST DATA COLLECTION AND ATTRIBUTES ........................................................25 3.3 ODOT DATA NEEDS ......................................................................................................26
3.3.1 Modeling efforts ........................................................................................................26 3.3.2 Planning efforts .........................................................................................................27
3.4 RELATIVE FINANCIAL COSTS OF DATA DETAIL ..................................................28
4.0 ALTERNATIVE DATA COLLECTION METHODOLOGIES ....................................29 4.1 INTRODUCTION .............................................................................................................29 4.2 MAIL SURVEY ................................................................................................................29 4.3 TELEPHONE SURVEY ...................................................................................................30
v

4.4 COMBINED MAIL AND TELEPHONE SURVEY ........................................................31 4.5 ROADSIDE INTERVIEW ................................................................................................32 4.6 VIDEO SURVEILLANCE................................................................................................33 4.7 GLOBAL POSITIONING SYSTEM (GPS) RECEIVER.................................................34 4.8 RECOMMENDED DATA COLLECTION METHODOLOGY......................................35
4.8.1 Inter-regional movements..........................................................................................35 4.8.2 Intra-regional movements..........................................................................................36 4.8.3 Pilot study strategy ....................................................................................................36
5.0 PILOT STUDIES .................................................................................................................37 5.1 INTRODUCTION .............................................................................................................37 5.2 PILOT STUDY I – ROADSIDE INTERVIEWS..............................................................37
5.2.1 Interstate highway weigh station ...............................................................................37 5.2.2 Port facility ................................................................................................................38 5.2.3 Warehouse/distribution center...................................................................................39 5.2.4 Sample differences ....................................................................................................39
5.3 PILOT STUDY II – MAIL AND FAX SURVEYS ..........................................................39 5.3.1 Mail survey................................................................................................................41 5.3.2 Fax survey .................................................................................................................42
5.4 DATA INPUT....................................................................................................................43
6.0 PILOT STUDY RESULTS .................................................................................................45
6.1 PILOT STUDY I – ROADSIDE INTERVIEW RESULTS..............................................45 6.1.1 Interstate highway weigh station survey ...................................................................45 6.1.2 Port facilities survey ..................................................................................................48 6.1.3 Warehouse/distribution center survey .......................................................................50 6.1.4 Summary observations of roadside interviews..........................................................52
6.2 PILOT STUDY II – MAIL AND FAX SURVEY RESULTS..........................................53 6.2.1 Mail survey results ....................................................................................................54 6.2.2 Fax survey results ......................................................................................................60 6.2.3 Use of the findings for statistical purposes................................................................65 6.2.4 Summary observations for mail and fax surveys ......................................................65
7.0 CONCLUSIONS AND RECOMMENDATIONS.............................................................67 7.1 ORIGIN-DESTINATION DETAIL ..................................................................................67 7.2 ROUTE IDENTIFICATION .............................................................................................67 7.3 LAND USE AT STOPS.....................................................................................................68 7.4 COMMODITY, WEIGHT, VEHICLE TYPE/CONFIGURATION.................................68 7.5 LOCATION OF STOPS, LOCATION OF TRIP GENERATORS, TIME OF DAY.......69 7.6 VOLUME OF SHIPMENTS .............................................................................................69 7.7 RECOMMENDATIONS...................................................................................................70
8.0 REFERENCES.....................................................................................................................73
APPENDICES APPENDIX A: ADDITIONAL SELECTED BIBLIOGRAPHY APPENDIX B: ROADSIDE INTERCEPT TRUCK SURVEY FORM
vi

APPENDIX C: WAREHOUSE/DISTRIBUTION CENTER MAIL/FAX SURVEY FORM APPENDIX D: REASONS GIVEN FOR NOT COMPLETING MAIL/FAX SURVEY
List of Tables
Table 2.1: Summary of truck travel surveys in urban areas ...................................................................................8 Table 2.2: Advantages and disadvantages of truck travel surveys in urban areas ................................................9 Table 2.3: Summary of data collected from truck travel surveys in urban areas................................................10 Table 2.4: Truck trip data collection approaches and implementation techniques.............................................13 Table 2.5: Commonly applied data collection methods (N=30) .............................................................................14 Table 2.6: Types of data collected by state/metropolitan agencies (N=24) ...........................................................14 Table 2.7: Summary characteristics of studies with commodity-based models (NCHRP 2001) .........................16 Table 4.1: Comparison of mail survey advantages and disadvantages.................................................................30 Table 4.2: Comparison of telephone survey advantages and disadvantages ........................................................31 Table 4.3: Comparison of telephone-mail survey advantages and disadvantages ...............................................32 Table 4.4: Comparison of roadside interview advantages and disadvantages .....................................................33 Table 4.5: Comparison of video surveillance advantages and disadvantages ......................................................34 Table 4.6: Comparison of GPS receiver advantages and disadvantages ..............................................................35 Table 5.1: Mail survey test cell sample size .............................................................................................................42 Table 5.2: Fax survey test cell sample size...............................................................................................................43 Table 6.1: Roadside survey test cell sample size and capture rate ........................................................................45 Table 6.2: Roadside survey item response percentage to LTL origin and destination questions .......................52 Table 6.3: Sample sizes for the mail and fax surveys .............................................................................................54 Table 6.4: Mail survey sample size and response rate, by method and list type ..................................................56 Table 6.5: Mail response rate to routes and address information for inbound/outbound shipments ................60 Table 6.6: Fax survey sample size and response rate, by method and list type....................................................61 Table 6.7: Fax response rate to routes and address information for inbound/outbound shipments..................62 Table 7.1: Performance of data collection methods in satisfying planning/modeling data needs.......................69
List of Figures Figure 6.1: Roadside interview item response – interstate highway weigh station (N=249).......................................47 Figure 6.2: Roadside interview item response – port facility (N=92).........................................................................49 Figure 6.3: Roadside interview item response – warehouse/distribution center (N=56) .............................................51 Figure 6.4: Known List mail survey item response (N=20) ........................................................................................58 Figure 6.5: Unknown List mail survey item response (N=14) ....................................................................................59 Figure 6.6: Known List fax survey item response (N=10) ..........................................................................................63 Figure 6.7: Unknown List fax survey item response (N=13) ......................................................................................64
vii

viii

1.0 INTRODUCTION
Freight movement is a significant transportation issue throughout Oregon and the U.S. Much of what the Oregon Department of Transportation (ODOT) knows about truck movements within the state and specifically in urban/metropolitan areas comes from observational data via traffic counts. While traffic count information is important, it is inadequate for understanding truck freight movements sufficiently and in significant detail for transportation modeling and freight planning.
ODOT has limited information on truck trips, their origins and destinations, routes traveled and commodities carried. Moreover, there is very little known about truck trip chaining (multiple pick-ups and/or drop-offs of loads) and the use of distribution centers (inter-modal facilities, reload facilities, warehouses). While distribution centers have increased dramatically with the advent of supply-chain logistics (third party management of goods movement), almost nothing is known about the extent or frequency of their use, or their role in urban congestion. Such knowledge would aid transportation planners as they seek to address problems with traffic flows and choke-points of critical commodities on urban highways.
1.1 BACKGROUND AND NEED FOR THE RESEARCH
A principal reason for the lack of data on truck movements is that reliable methodologies have not been developed to obtain the level of detail needed for modeling efforts and planning. Aggregate data has been used and partial studies have been undertaken, both in ODOT efforts and regional/state studies, but these efforts have not yielded the needed level of detail. Research is needed to develop and test truck trip data collection methods, which can produce data capable of better characterizing freight flows at the metropolitan level for transportation models and freight planning processes. Development of such a data generation methodology would put ODOT in a leadership position among state departments of transportation (DOTs), federal entities and academic researchers, because such a data generation methodology has yet to be found in the literature or known studies.
The need for accurate and detailed freight movement data for modeling and freight planning is not a new phenomenon. Reliance on traffic counts has been endemic throughout most DOTs as they seek information for such modeling and planning efforts. Recent changes in supply chain distribution methodology, such as Just-In-Time or Off-The-Shelf, and the advent of significant trip chaining in intra-urban movements, create an intensified need for data that reflect actual modal movements, rather than portraying the trips as simple origin-destination pairs. Such new levels of data specificity will allow real time and real location analysis to be undertaken.
Aggregate data on commodity flows are available (e.g., the Oregon Freight Truck Commodity Flow Study (Oregon Department of Transportation 1998) and federal commodity flow studies for 1993, 1997 and 2002 (U.S. Department of Transportation 2003)), but the need is for reliable
1

truck movement data at the metropolitan and sub-state level with more specific detail on individual movements. A productive truck trip data collection methodology, focused on movements at generators, entry points/gateways and activity centers, would provide a significant advancement toward achieving the overall goal of improved freight modeling and planning.
1.2 STUDY OBJECTIVES
The overall goal of this study was to identify a reliable data collection method capable of generating the information at a level of detail useful to ODOT’s modeling and freight planning needs for data on truck movements at the metropolitan level. Such a method would then be available to other planning agencies in other states and the nation.
Specific objectives of this research effort were to:
1. Identify and evaluate alternative methods of collecting truck travel data (origin and destinations, routes traveled, record of stops, commodity type and quantity, and vehicle classification), defining the advantages and disadvantages of each, and assessing the utility of the methods for transportation modeling work in Oregon.
2. Recommend a data collection method that will provide the necessary data to ODOT, in detail, on truck movements for transportation modeling and freight planning needs. The selected method will address the role of trip chaining and the use of distribution centers in truck movements.
3. Select one or more data collection methods for field testing. Field test the effectiveness of the chosen method(s) in pilot areas determined in conjunction with ODOT. The field test(s) will also address issues related to the sampling frame necessary to achieve statistical reliability of data inputs to modeling or planning.
4. Analyze field test results, identifying constraints, data detail and statistical reliability achieved using the recommended methodology(ies). Suggest any needed modifications and applications for the methodology(ies).
1.3 STRUCTURE OF REPORT
Chapter 2 presents a thorough literature review and critique of various studies at the regional and national level, focusing primarily on efforts to produce truck trip data and the different methodologies employed. This review evaluates the different types of data detail captured and the challenges and limitations from each approach. The specific data needs of ODOT’s modeling and freight planning programs are then outlined in Chapter 3, followed by an analysis and recommendation of the applicable methodologies for ODOT’s needs in Chapter 4. Chapter 5 describes the pilot study methods for testing the selected data collection methodologies. Chapter 6 presents the pilot study results, and the conclusions and recommendations are presented in Chapter 7.
2

2.0 LITERATURE REVIEW AND CRITIQUE
Historically, there has been considerable research aimed at addressing the data needs for passenger transportation within urban centers as it relates to congestion and capacity, and to a lesser extent regional or statewide freight truck movements. However, the number of studies investigating truck travel demand and forecasting needs in urban or inner-city environments is less abundant. The need for such information and forecasting capabilities has long been understood, beginning as early as 1970 with the Urban Commodity Flow Conference, which brought several transportation researchers and specialists together to discuss and define problems and issues related to movement of urban goods, different types of data collection possibilities, and evaluation of different technological, economic and institutional changes that could affect freight movements in urban areas (Hedges 1971).
The Intermodal Surface Transportation Efficiency Act of 1991 provided renewed interest in freight transportation research and planning, as DOTs and individual Metropolitan Planning Organizations (MPOs) were required to incorporate freight planning and analysis into transportation plans. However, no standard methodology or “cookbook” was available for implementing truck trip data gathering or modeling, especially as it applies to intra-urban movements, thus resulting in a wide variety of study approaches. This literature review provides a summary of prior studies that have implemented different data collection methodologies, in order to provide a better understanding of the strengths and weaknesses of each methodological approach and the lessons learned from past studies, especially as they relate to metropolitan or urban truck movements.
In the past decade, there have been multiple studies of different magnitude at the state and metropolitan level, seeking to collect truck trip information for either modeling or policy planning purposes. The following sections describe two relatively recent synthesis studies, which provide a summary of many of these individual research efforts. Following this discussion is a review of additional studies that fall outside of these two synthesis studies, especially those which are very recent and locally applicable. Appendix A contains an additional selected bibliography of sources related to freight data collection.
2.1 REVIEW OF EARLY URBAN TRUCK TRAVEL STUDIES
The first of these syntheses was conducted by Samuel W. Lau for the Metropolitan Transportation Commission, titled “Truck Travel Surveys: A Review of the Literature and State-of-the-Art” (Lau 1995). This study was commissioned to help evaluate the need for truck freight planning and forecasting tools and to report the different survey experiences by MPOs, and by state and regional planning agencies in the U.S. and Canada.
The primary focus is on eight major urban truck travel studies and their experiences collecting data and/or developing truck traffic forecasting models. These studies include the following:
3

1) Chicago Area Transportation Study (CATS), 1970 and 1986; 2) Ontario, Canada, 1978, 1983 and 1988; 3) Phoenix, 1991; 4) Alameda County, California, 1991; 5) New York-New Jersey, 1974-1994; 6) El Paso, Texas, 1994; 7) Houston-Galveston, Texas. 1994; and 8) Vancouver, B.C., 1988. Each of these studies is briefly summarized below, with the exception of Vancouver, due to limited information. Also, some discussion is provided regarding the attributes of data collected from each survey approach.
2.1.1 Chicago Area Transportation Study, 1970 and 1986
The 1986 CATS Commercial Vehicle Survey was designed to provide truck trip information for both modeling and policy planning purposes in the northeastern Illinois (metropolitan) area, building upon an earlier 1970 study with similar goals (Rawling, et al. 1987). The survey was used for truck model calibration for both present and future forecasting scenarios, including trip information over 24-hour periods, by three commercial vehicle types (light, medium, heavy). Data was collected on trip frequency, distance, purpose and land use type. Land use categories included:
• Residential • Retail • Manufacturing • Terminal/Warehouse • Public/Government • Office/Service
• Construction • In Transition • Landfill • Agricultural • Other/Missing
All trip beginning/end points included specific addresses that were geo-coded to the section/township/range level (one square mile), representing 1,542 zones in the CATS model system.
The data collection method employed was a mailout-mailback survey of registered commercial vehicles in the six northeast Illinois counties. As sample of 17,834 owners/operators was randomly selected and surveyed from the total population of 359,383 registered vehicles. Twenty-five percent of those surveyed provided completed responses. Vehicles not captured in the mail survey included state, local or municipal fleet vehicles, federal and military vehicles, taxis, commuter vans and dealership vehicles, ambulances and tow trucks, and any commercial vehicle registered outside the six-county region.
2.1.2 Phoenix, Arizona, 1991
Cambridge Systematics, Inc. conducted a commercial vehicle truck survey within the Phoenix, Arizona metropolitan area in 1991, a study sponsored and funded by the Arizona Department of Transportation and closely modeled and patterned after the 1986 Chicago CATS survey (Ruiter 1992). The primary purpose of the study was to generate data and information concerning commercial vehicle trip generation, trip distribution, and internal (within metro area) truck traffic assignment modeling. A random sample was drawn from the database of registered vehicles in the Department of Motor Vehicles (DMV), and mailing addresses were obtained from the U.S. Postal Service. Vehicle owners were mailed a survey questionnaire which included a one-day
4

trip diary. The response rate for completed surveys was slightly higher than the Chicago study, at 30 percent.
Information obtained from the mailed questionnaires and trip diary included:
• Starting and ending addresses for all trips on the survey day • Vehicle type based on number of axles and body style • Estimated Gross Weight • Vehicle usage for home-based work and work related trips • Total number of one-way trips on the survey day • Start and stop times • Odometer readings • Name and address of each stop • Driver and vehicle activity of each stop • Land use at each stop • Vehicle type and number of axles for each trip segment
2.1.3 New York and New Jersey, 1974 - 1991
The Port Authority of New York and New Jersey conducted roadside truck commodity surveys at six toll facilities across New York and New Jersey between 1974 and 1991 to evaluate freight commodity movements over time and to evaluate specific highway corridor projects (The Port Authority of New York and New Jersey 1992). The data collection methodology consisted of roadside surveys at toll facilities and the collected data was not used for truck modeling purposes. Rather, the information was utilized to understand commodity movements throughout the six interstate toll locations and to help develop strategies for mitigating peak congestion problems.
Data attributes collected from the 1991 truck commodity surveys included:
• Facility • Number of axles • Trailer type • Load type • Origin
• Destination • Last stop • Trailer width and length • Commodity
2.1.4 El Paso, Texas, 1994
The city of El Paso, Texas Metropolitan Planning Organization, in association with the Texas Department of Transportation, developed a six-component Travel Survey for the El Paso metropolitan area in 1994 (Barton-Aschman Associates, Inc. 1994). One aspect of this Travel Survey, the Commercial Truck Survey, dealt with collecting freight data and information for travel demand and air quality modeling. Data was collected via telephone surveys to truck owners with vehicles registered in El Paso County. The list of registered commercial vehicle owners was obtained from Texas Vehicle Information and Computer Services, Inc. Survey participants provided truck travel information, origin and destinations, land use, trip purpose,
5

truck weight and size, odometer readings, fuel type, business types, facility and route information for each trip segment. Roughly 43 percent of those surveyed responded.
2.1.5 Houston and Galveston, Texas, 1994
Wilbur Smith Associates conducted a commercial vehicle survey for the Houston-Galveston Area Council in November 1994, to collect truck travel data to be incorporated into the regional travel demand model. The random sample of commercial vehicles from the Department of Motor Vehicle registration list included some passenger for-hire vehicles such as taxis, vans and limousines. The estimated response rate for participants responding to the commercial vehicle survey was between 35 and 40 percent, which consisted of both telephone contact and mailout-mailback surveys. The commercial vehicle survey collected travel attributes such as truck type, origin-destinations, odometer, commodity and land-use type. (Wilbur Smith Associates 1995).
2.1.6 Ontario, Canada, 1978, 1983 and 1988
The Ontario Ministry of Transportation has conducted roadside vehicle surveys every five years (beginning in 1978) to develop truck travel and commodity flow information on intercity movements across the Province, through time (Gorys 1991). The study was not designed for capturing input-data for travel demand modeling purposes, but rather for corridor analysis and policy planning for intercity movements. The data was collected at 57 locations along principal highways at inspection stations, rest stops and border crossings. The type of data collected included carrier information, origin-destination of trip segment, number of axles, vehicle type, commodity, and vehicle weight, in addition to driver-specific questions such as age, sex, years of experience, training, carrier type, union affiliation and method of remuneration (payment type to driver). The 1988 commercial vehicle roadside survey was administered over a 23 week period, collecting 19,225 completed surveys.
2.1.7 Alameda County-San Francisco, California, 1991
Barton Aschman Associates, Inc. conducted a study in 1991 for the Alameda County-San Francisco Bay Area Caltrans District 4, to obtain information that would aid in the development of a truck travel demand model of the San Francisco Bay area (Barton Aschman Associates Inc. 1991). Three different types of truck travel patterns were estimated for three truck categories (two axle, three axle and four or more axles), including:
• External-External Trips - Trips originating or ending outside the Bay area. • Internal-External Trips - trips that have either an external origin or destination. • Internal-Internal Trips - trips that originate and end in bay area. There were two sub-
categories of these trips: 1) garage-based and 2) linked trips.
Information for these different truck travel patterns was obtained through a series of four different types of surveys, aimed at collecting different components of truck movements in Alameda County. The four survey types included:
• Truck classification counts • Truck intercept surveys
6

• Employer surveys • Surveys and interviews at the Port of Oakland While specific detailed commodities and weights were not collected for truck trips, freight shipments were classified into ten different commodity categories that corresponded with different land uses for trip origin and destination. The truck classification counts were conducted at eleven interstate highway locations. Roadside interviews occurred at nine weigh stations and four toll bridge crossings. The employer survey – a combined telephone and mailout-mailback survey of truck owners – achieved a 79 percent response rate.
2.1.8 Summary of early urban truck travel studies
A summary of these seven urban truck travel studies is provided in Tables 2.1, 2.2 and 2.3. There were generally three types of data collection methodologies employed in these early studies, with roadside interviews and the combined telephone-mailout-mailback approach being the most common, followed by mailout-mailback surveys and telephone surveys. Response rates for each of these approaches varied widely; the mailout-mailback survey had the lowest response rate and the roadside survey and the combined telephone-mailout-mailback approaches had higher response rates. Most of the mail or telephone related surveys utilized the state department of motor vehicle’s registration file for selecting a random sample of commercial vehicle owners to survey. Roadside interviews were generally conducted at available weigh stations on interstate highways and freeways, or at toll and bridge crossings.
There are advantages and disadvantages to each data collection approach, as highlighted in Table 2.2. Telephone interviews can improve response rates but can be difficult to implement due to limited availability of phone respondents and the limitation of calling during regular business hours. Mailout-mailback surveys are probably the least expensive to implement, but also provide the lowest response rate and may result in biased responses, since there is limited control over who actually completes the survey and their knowledge of individual truck trips. Roadside interviews have very high response rates, good sampling control and very complete information but are only representative of traffic passing through interview locations, and they may be difficult to implement due to traffic disruption, especially in urban areas.
The most common types of information solicited from each data collection approach were origin-destination, truck type, number of axles, odometer reading, commodity category and land use, as depicted in Table 2.3. Only one study collected information concerning routes, and one collected specific information about the driver. Three of the eight urban studies collected weight information and four of the eight studies utilized the information for truck travel model development.
7

Table 2.1: Summary of truck travel surveys in urban areas Survey
Location Survey Year Survey Method Approx. No.
Completed SurveysResponse
Rate Data Applications Total Survey Cost
$ / Survey
Chicago 1986 Mailout-Mailback 3,506 25.3% • Truck Travel Model Development • Corridor/Route Analysis • Effects of toll on trucks • Truck Speed simulation model • Truck activity mapping
$200,000 $57
Ontario 1988 Roadside Interview 19,225 96.5% • Time series comparison • Evaluate & design road geometrics • Pavement management planning • Truck accident analysis • Dangerous goods regulation and enforcement analysis • Driver education program
NA NA
Phoenix 1991 Combined Telephone-Mailout-Mailback
720 30.0% • Truck travel model development $90,0001 $125
N.Y. & N.J. 1991 Roadside Interview 4,500 NA • Evaluate dedicated route/corridor proposal • Traffic management for highway reconstruction • Time-series freight analysis • Freight-economic analysis
NA NA
Alameda County, CA
1991 Combined Telephone-Mailout-Mailback & Roadside Interview
2,200
over 8,000
79.0%
NA
• I-880 corridor analysis • Create truck travel submodel for corridor analysis • Generate 24-hour & PM peak volumes by axle
$285,0002 NA
N.Y. & N.J. 1992-94 Roadside Interview 14,671 37.8%3 NA $312,0004 $21El Paso 1994 Telephone Interview 188 42.6% • Truck travel model development
• Part of regional travel study • Truck emissions analysis
$65,0005 $3456
Houston-Galveston
1994 Combined Telephone-Mailout-Mailback
900 35%-40% • Truck travel model development $150,00 $167
Source: Lau, Samuel W. “Truck Travel Surveys: A review of the Literature and State-of-the-Art.” Metropolitan Transportation Commission, 1995.
1 Cost include data collection, data coding, and model development. 2 The cost included sample design, survey design, data collection, coding, data reporting, and model development. Approximately, $5,000 was also included in the total cost for conduction vehicle classification counts at 11 locations along I-80 and I-880. 3 This was a sampling rate. No response rate was given. 4 This was a multi-agency effort, with partnership from the New Jersey Department of Transportation (NJDOT), the New York Metropolitan Transportation Council (NYMTC), and the Port Authority of New York and New Jersey. The survey was conducted at 18 locations with 3 interviewers per toll plaza for 24 hours. 5 Cost included sample design, survey design, data collection, coding, reporting, survey analysis, and model development. 6 The higher cost was due to a high number of incomplete surveys.
8

Table 2.2: Advantages and disadvantages of truck travel surveys in urban areas
Survey Methods Place Of Survey
Typical Completed Surveys
(% of Total Population)
Typical Response
Rate Advantages Disadvantages
Telephone Interview
N.Y (1964) Calgary (1971) El Paso (1994)
4%-15% 40%-50% • High response rate • Easy to follow-up
• Can only occur during business hours • “Phone-tagging” problem • Limited time on phone if respondent is busy• Requires access to vehicle registration file
Mailout-Mailback
Chicago (1986) 1%-5% 10%-45%7 • Less costly • Good response rate with certified mail • Only follow-up of non-responses is
necessary
• Low overall & item response rate • Possible bias due to better response from
some drivers/owners • Low response from small truck owners • Need to follow-up on non-responses • Difficult to ensure that the driver will fill out
the form, instead of the owner or fleet manager who receives the survey forms
• Requires access to vehicle registration file Combined Telephone
& Mailout-Mailback
Phoenix (1991) Houston (1994)
Alameda, CA (1991)
3%-10% 30%-80%8 • Improved response rate over mailout-mailback alone
• Early identification of owners who agree to participate & potential non-responses through phone contact
• Phone contact may help adjust sample size for mailout-mailback
• Same disadvantages as telephone survey method above
• High cost of telephone follow-ups • Need phone reminders for trip diary • More costly than above methods
Roadside Intercept/ Interview
Calgary (1971) Ontario (1978, 1983,
1988) N.Y. & N.J. (1974, 1982, 1985, 1991-
1994) Alameda, CA (1991)
8%-35%9 95%-100% • Complete information • High response rate • Better sampling control • Good representative sample of trucks
entering or leaving cordon line • Easy comparison with mainstream
traffic through field counts at survey location
• Potential disruption to traffic • Quality and conduct of survey affected by
weather, lighting • Hazardous to survey crew • Time constraint • No follow-up possible • Enforcement problems • Drivers avoiding the survey station • Only represent trucks traveling on road
along survey station, not entire region Source: Lau, Samuel W. “Truck Travel Surveys: A review of the Literature and State-of-the-Art.” Metropolitan Transportation Commission, 1995 7 The higher response rate was due to better survey participation from large truck fleet operators. 8 The higher response rate was due to an employer survey conducted in California (1991 Caltrans-Alameda County Survey). 9 The higher percentage is from the 1988 Ontario survey which surveyed 57 location over a 1,855-hour period throughout the Ontario Province.
9

Table 2.3: Summary of data collected from truck travel surveys in urban areas
Survey Location
Survey Year
Survey Method
Sample Source Weight Axle Truck
Type O-D Odometer Reading Commodity Land
Use Driver
Info Route Info
Chicago 1986 Mailout-Mailback
DMV
Ontario 1988 RoadsideInterview
Roadside Interview10
Phoenix
1991 CombinedTelephone-
Mailout-Mailback
DMV
N.Y. & N.J. 1991 Roadside Interview
Toll Plaza
Alameda County, CA
1991 CombinedTelephone-
Mailout-Mailback
& Roadside Interview
DMV, Port of Oakland
Roadside Interview
N.Y. & N.J. 1992-94 Roadside Interview
Roadside Interview
El Paso 1994 Telephone Interview
TVICs11
Houston-Galveston
1994
CombinedTelephone-
Mailout-Mailback
DMV
10 Sample taken at roadside intercept surveys. 11 Sample drawn from the Texas Vehicle Information and Computer Services, Inc. (TVICS) database.
10

2.2 NCHRP REPORT 298
The American Association of State Highway and Transportation Officials (AASHTO), through the National Cooperative Highway Research Program (NCHRP), has commissioned a series of synthesis reports for compiling useful transportation information on the current state of practice in various subject areas of concern. One of these reports – NCHRP Report 298, titled “Truck Trip Generation Data: A Synthesis of Highway Practice” – focuses on the growing need for analytical tools for state highway planners and traffic engineers, related to truck trip data (Fischer, et al. 2001). This section summarizes certain aspects of this report, since it provides a very recent and thorough review of truck trip generation studies throughout the U.S., a review of available studies and techniques for data collection, and the current state of the practice. The latter component is derived from a survey of practitioners, including DOTs and state agencies, MPOs and regional transportation agencies, port authorities, consultants, academic researchers and transportation professionals.
Truck trip generation data is generally used for either engineering applications or statewide, regional and sub-regional planning applications (Fischer, et al. 2001). Engineering applications include the traditional design and impact analysis performed by highway engineers (street and highway design, operations, etc.), requiring a very high degree of accuracy and data detail. Statewide and regional planning applications apply truck trip generation data in the development of transportation demand models, corridor analyses, infrastructure investment and improvement analyses and intermodal access studies. Depending on the utilization and application of truck trip generation data, they may be organized in several different classification schemes, including by:
• Land Use • Truck Size • Goods Movement versus Non-Goods Movement • Production/Attraction Rates • Time of Day • Linked versus “Garage-based” trips • Activity Type
Travel demand models, whether vehicle-based or commodity based, are then estimated by relating some measure of the data classification schemes above with the number of truck trips recorded for that particular classification measure (Fischer, et al. 2001). This relationship may be described in a rate (e.g. total truck trips generated divided by acreage of a given land use), a linear regression equation, or in commodity flow models. Common independent variables include square feet of office or warehouse space for a certain business type, acreage of land, number of employees, economic output, etc. The accessibility and availability of data often dictates the modeling estimation procedure.
Truck trip generation data is usually collected from some combination of three different approaches, with different techniques for implementing each approach. These three approaches consist of vehicle classification counts, roadside intercept surveys, and travel diary surveys, as illustrated in Table 2.4 (Fischer, et al. 2001).
11

Vehicle classification counts may be obtained from manual counts (individuals visually identifying and recording trucks into different size/configuration categories), automated traffic counters (Weigh-In-Motion or loop detectors), or video surveillance. The advantages and disadvantages of each method are also presented in Table 2.4.
In the roadside intercept survey individuals interview truck operators at designated weigh stations, border crossings, toll gates, or bridge crossings. This method often provides excellent information related to origin-destinations, routes, commodities hauled, trip purpose and vehicle configuration but is constrained to only capturing the truck traffic passing through the interview locations.
Travel diary surveys are usually implemented by first obtaining a list of registered vehicle owners; then (via mail, phone, personal interview, etc.) they are asked to provide a 24-hour travel diary which records origin-destination information, trip mileage, routes, land use, and commodities hauled. However, this approach often yields very low response rates.
12

Table 2.4: Truck trip data collection approaches and implementation techniques Survey
Approach Implementation
Technique Advantages Disadvantages
Manual Counts (direct observation)
• May be more accurate than automated counters. • No traffic disruption. • Low risk to individual observers.
• High personnel requirement • Potential for human error. • No information regarding O-D, trip purpose, route, commodity, etc.
Automated or Electronic Data
Collection (WIM, Loop Detectors, etc.)
• No traffic disruption. • Able to collect traffic counts at many sites,
efficiently with low labor requirement.
• Potential for equipment failure. • No information regarding O-D, trip purpose, route, commodity, etc. • Limited to location and availability of electronic transponders.
Vehicle Classification
Counts
Video Surveillance
• No traffic disruption. • Better information on type of commodity hauled
compared with automated counters.
• High equipment cost requirement. • Potential for equipment failure or recording during adverse weather. • No information regarding O-D, trip purpose, route, specific
commodity, etc.
Roadside Intercept Surveys
Roadside Interview
• Complete information, especially related to O-D, route, trip purpose, specific commodity, etc.
• High response rate • Good sampling control • Ability to expand to total truck traffic population.
• High labor requirement. • Significant risk to survey personnel. • Potential disruption of traffic. • Limited locations where survey may be implemented. • Only captures truck traffic that passes through interview sites.
Phone Survey • Higher response rate when compared to mail
surveys. • Quick turnaround.
• Difficulty obtaining appropriate and correct phone numbers. • Can only call during regular business hours. • Under-representation of out-of-state trucks in sampling frame.
Mailout-Mailback Survey (owners,
operators, or receivers)
• Inexpensive
• Low response. • Difficulty ensuring appropriate individual complete survey. • Requires access to vehicle registration list file (DMV or third party
list) • Under-representation of out-of-state trucks in sampling frame.
Combination Phone-Mailout-Mailback
Survey
• Improved response rate over mail only survey. • Better identification of appropriate survey
respondent.
• Relatively low response. • Follow-up calls may be time-consuming and costly. • Requires access to vehicle registration list file (DMV or third party
list). • Under-representation of out-of-state trucks in sampling frame.
Travel Diary
Personal Interview • Complete information • High labor requirement. • Expensive.
Source: Fischer, Michael J. and Han Myong. “Truck Trip Generation Data: A Synthesis of Highway Practice.” NCHRP Synthesis 298, Transportation Research Board, National Research Council, Washington, D.C., 2001.
13

To illustrate the different truck trip data collection methods employed in practice, Fischer, et al. (2001), conducted a survey of DOTs and state agencies, MPOs and regional transportation agencies, port authorities, consultants, academic researchers and transportation professionals to determine specific information regarding truck trip data collection methods and classification techniques. Table 2.5 shows how frequently each method was used.
Table 2.5: Commonly applied data collection methods (N=30)
Classification Percent Of Studies Trip Diaries 33.3 Classification counts 23.3 Published commodity flow data 33.3 Collected commodity flow data 16.7 Shipper/carrier/special generator surveys 3.3 Intercept surveys 26.7 Published rates 3.3 Source: Fischer, Michael J. and Han Myong. “Truck Trip Generation Data: A Synthesis of Highway Practice.” NCHRP Synthesis 298, Transportation Research Board, National Research Council, Washington, D.C., 2001.
Trip diaries and utilization of published commodity flow data were the most common data collection approaches employed in practice, followed by roadside intercept surveys and classification counts. The least used truck trip data collection methods were shipper/carrier/special generator surveys and utilization of published rates from other studies, both representing 3.3 percent of studies.
The survey of state and metropolitan practitioners also asked about the individual types of truck trip data collected, thereby revealing important data needs from current and previous research studies. These data types are shown in Table 2.6, along with the percent of studies which utilized each data type. The most commonly collected type of data was time of day, represented in 50 percent of the studies, followed by axle configuration and commodity carried at 45.8 percent. Land use, business and body type were collected in roughly 30 percent of the studies, followed by weight class (25.5 percent) and cargo weight (20.8 percent). Wait time and duration of stay were the least common data types, each accounting for 12.5 percent of studies.
Table 2.6: Types of data collected by state/metropolitan agencies (N=24)
Classification Percent Of Studies Weight class 25.5 Axle configuration 45.8 Body type 29.2 Land use 29.2 Business 29.2 Time of day 50.0 Duration of stay 12.5 Wait time 12.5 Commodity carried 45.8 Cargo weight 20.8 Source: Fischer, Michael J. and Han Myong. “Truck Trip Generation Data: A Synthesis of Highway Practice.” NCHRP Synthesis 298, Transportation Research Board, National Research Council, Washington, D.C., 2001.
14

A summary review of fourteen studies focusing on the development of commodity-based truck travel demand models is shown in Table 2.7 (Fischer, et al. 2001). Each of these studies has developed truck trip generation models for urban/metro areas, utilizing a variety of commodity flow data and procedures for converting commodity tonnage into truck trips and allocating these trips to different zones. Comparison of different modeling techniques is not the focus of this study. However, the data attributes, sources and methods employed are useful information when deciding upon truck trip data collection methodologies.
One of these studies, “Analysis of Freight Movements in the Puget Sound Region,” conducted by Transmode Consultants, Inc. in 1994, utilized a variety of information sources in an effort to obtain the data needed for effective freight planning in the Puget Sound area (Transmode 1995). Freight traffic was divided into four categories, including the following:
• Long haul traffic • Short haul traffic • Local distribution traffic • Through traffic
Data sources utilized included in this study included the following:
1. County business patterns 2. Dun & Bradstreet market locator 3. ICC Rail Carload Waybill Survey (1992) 4. Truckload Movement Sample (1986/1987) 5. Truck interview data supported by WSDOT 6. Truck traffic counts as reported by the GIS maintained by PSRC 7. Maritime flows as reported by the ports of Seattle and Tacoma
The variety of information sources created some data incompatibility problems and did not provide the level of data detail sought with this study. However, given the volume and diversity of information, a fairly complete picture of overall freight movements throughout the region was achieved.
15

Table 2.7: Summary characteristics of studies with commodity-based models (NCHRP 2001)
Source/ Study Location Method of Converting
Tonnage to Truck Trips Method of Allocating Truck Trips to Zones
Source of Commodity Flow
Data Comments
“Skagit Countywide Air, Rail, Water and Port Transportation System Study” (Sorensen et al. 1996)
Skagit County, WA
Survey of 100 businesses conducted to estimate average truck payloads. Payload factors used to convert commodity tons to truck trips.
County-to-county flows allocated to zonal level based on employment shares.
Local economic data and surveys.
Commodity flows aggregated to industrial, trade, and agriculture categories for disaggregating to zonal.
“Highway Freight Flow Assignment in Massachusetts Using Geographic Information Systems” (Krishnan and Hancock 1998)
Massachusetts Tonnage flows converted to truck trips by truck category using locally collected data on commodity density, average payloads and average percent empty by truck type (from HPMS).
Statewide flows allocated to five-digit zip code level using employment shares.
1993 Commodity Flow Survey
Commodities aggregated to a single category when estimating total truck tonnage flows.
“Development of a Statewide Truck Trip Forecasting Model Based on Commodity Flows and Input-Output Coefficients” (Sorratini and Smith 2000)
Wisconsin Average truck payload data from Reebie Transearch.
Commodity flows allocated to counties using employment share by producing economic sectors.
Commodity Flow Survey Reebie Transearch Data
Truck Trips calculated for both trip productions and attractions. Attractions based on consumption calculated from input-output data.
“Assessment of Market Demand for Cross-Harbor Rail Freight Service in the New York Metropolitan Region” (Cutler et al. 2000)
New York Metropolitan Area
Payload factors developed from TIUS.
Reebie Transearch Payloads, and average percent empty by truck type (from HPMS).
“External Urban Truck Trips Based on Commodity Flows: A Model” (Fischer et al. 2000)
Los Angeles Metropolitan Area
Truck payload data by commodity developed from local roadside intercept surveys.
Employment shares by producing and consuming sectors (input-output models used to define industry consumption shares by commodity).
Reebie/DRI McGraw Hill
Annual trip rates converted to daily trips based on day of the week distributions of truck traffic from weigh-in-motion data. Trip generation by three truck weight classes. Allocations of truck commodity tonnage by truck weight classes using TIUS.
Transport Flows in the State of Indiana: Commodity Database Development and Traffic Assignment: Phase 2 (Black 1997)
Indiana 1977 CommodityTransportation Survey 1993 Commodity Flow Survey
Commodity flow data and input-output models used to develop production and attraction trip generation regression models using employment in the appropriate industry sector as the independent variable. Payloads and average percent empty by truck type (from HPMS).
16
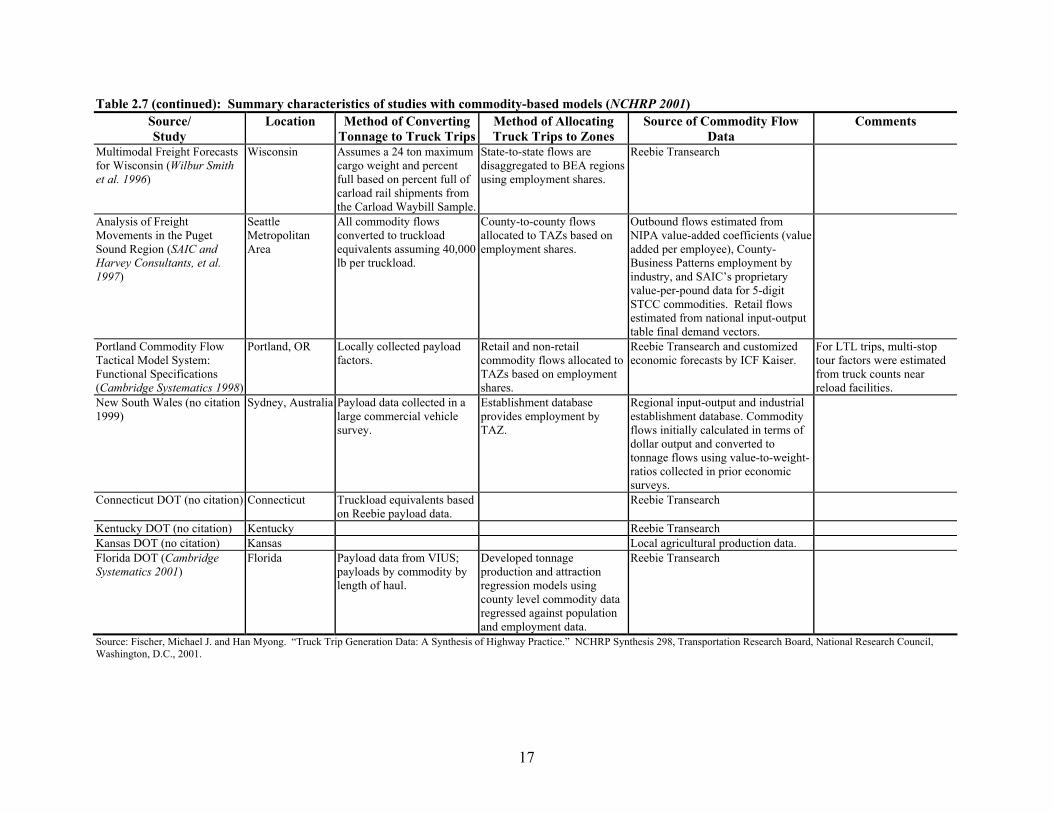
Table 2.7 (continued): Summary characteristics of studies with commodity-based models (NCHRP 2001) Source/ Study
Location Method of Converting Tonnage to Truck Trips
Method of Allocating Truck Trips to Zones
Source of Commodity Flow Data
Comments
Multimodal Freight Forecasts for Wisconsin (Wilbur Smith et al. 1996)
Wisconsin Assumes a 24 ton maximum cargo weight and percent full based on percent full of carload rail shipments from the Carload Waybill Sample.
State-to-state flows are disaggregated to BEA regions using employment shares.
Reebie Transearch
Analysis of Freight Movements in the Puget Sound Region (SAIC and Harvey Consultants, et al. 1997)
Seattle Metropolitan Area
All commodity flows converted to truckload equivalents assuming 40,000 lb per truckload.
County-to-county flows allocated to TAZs based on employment shares.
Outbound flows estimated from NIPA value-added coefficients (value added per employee), County-Business Patterns employment by industry, and SAIC’s proprietary value-per-pound data for 5-digit STCC commodities. Retail flows estimated from national input-output table final demand vectors.
Portland Commodity Flow Tactical Model System: Functional Specifications (Cambridge Systematics 1998)
Portland, OR Locally collected payload factors.
Retail and non-retail commodity flows allocated to TAZs based on employment shares.
Reebie Transearch and customized economic forecasts by ICF Kaiser.
For LTL trips, multi-stop tour factors were estimated from truck counts near reload facilities.
New South Wales (no citation 1999)
Sydney, Australia Payload data collected in a large commercial vehicle survey.
Establishment database provides employment by TAZ.
Regional input-output and industrial establishment database. Commodity flows initially calculated in terms of dollar output and converted to tonnage flows using value-to-weight-ratios collected in prior economic surveys.
Connecticut DOT (no citation) Connecticut Truckload equivalents basedon Reebie payload data.
Reebie Transearch
Kentucky DOT (no citation) Kentucky Reebie Transearch Kansas DOT (no citation) Kansas Local agricultural production data. Florida DOT (Cambridge Systematics 2001)
Florida Payload data from VIUS; payloads by commodity by length of haul.
Developed tonnage production and attraction regression models using county level commodity data regressed against population and employment data.
Reebie Transearch
Source: Fischer, Michael J. and Han Myong. “Truck Trip Generation Data: A Synthesis of Highway Practice.” NCHRP Synthesis 298, Transportation Research Board, National Research Council, Washington, D.C., 2001.
17

2.3 RECENT STUDIES
2.3.1 Strategic Freight Transportation Analysis (SFTA)
The Strategic Freight Transportation Analysis (SFTA) was sponsored by the Washington State Department of Transportation (WSDOT). This study is the most current study and methodology reviewed for this report, completed in spring of 2003 (Casavant and Jessup 2002).
SFTA follows and builds upon an earlier freight transportation research project known as the Eastern Washington Intermodal Transportation Study (EWITS) that produced a statewide origin-destination (O-D) freight truck survey, which collected valuable freight data through direct personal interviews of truck drivers in 1993-94 (Gillis and Casavant 1994). This statewide study involved over 300 interviewers at 27 separate locations. A total of 28,000 truck drivers were interviewed, providing Washington with an extensive database on statewide freight and goods movements.
The identified criteria used to design the statewide studies, in both SFTA and EWITS, were as follows:
• Data collected should provide statistically reliable information on truck characteristics and commodity flows for all major Washington highways.
• The sample size should be large enough to provide useful freight and goods movement information for major transportation planning sub-regions as well as the state as a whole.
• Information, where available, should be developed over a continuous 24-hour period in each of the four seasons of the year.
Among the various data collection methodologies available, including mail or telephone surveys, roadside interviews of truck drivers were judged to be the most effective means of generating truck freight information addressing these three criteria. Following the successful data collection efforts from roadside interviews of the earlier EWITS study, the SFTA research effort also utilized roadside interviews to maintain data consistency and comparisons through time.
The goals of this study included capturing the effects of seasonal differences in those areas where predominant commodities, such as agricultural products, were moved for one or more seasons throughout the year. Hence, data were collected during a four-week period in each season of the year.
Scheduling the 27 interview sites was done systematically to avoid interviewing the same flow of trucks at multiple sites. For example, the interviews at northbound sites on I-5 were not conducted on the same date. Given these requirements, it was determined that four weeks were needed to collect data at the 27 individual sites.
The questionnaire sought information on origin, destination, commodity, hazardous material, loaded weight, empty weight, owner of truck, type of destination facility and type of origin
18

facility, specific route, and several other characteristics. Maps were used to pinpoint the exact route.
The sampling frame differed by survey location and was constrained by the weight station configuration, available parking and the number of interview personnel on-site. The earlier EWITS study outlined a goal of stopping one out of ten trucks on the I-5 corridor, one out of five trucks on other major corridors and one out of two trucks at the sites with the lowest truck traffic volumes. However, the SFTA goal was to maximize the number of vehicles surveyed at each site; therefore, trucks were stopped and interviewed if there was a) space available to safely park them and b) there was an interview person available to immediately interview the driver. At the lower volume sites, this approach enabled interviews to be completed for 60-80% of the trucks passing through the station during its open hours. The sites with a higher volume saw between 5% and 20% of the total trucks being surveyed. The lowest percentages of trucks interviewed were at those sites where there was a high volume of truck traffic at the weight station, and additional trucks were utilizing WSDOT’s Commercial Vehicle Information System Network (CVISN) bypass program.
It was important to maintain effective management of data during collection, entry into a database, and during the subsequent analyses in this study. There were three possible sources of error that were of concern in the on-site data collection process:
• Systemic problems could arise from poorly worded questions, incorrect interview procedures and/or problems stemming from sub-optimal site selection.
• Data problems could come from drivers who provided inaccurate information in response to the survey questions.
• Interview personnel could fill out the survey incorrectly, providing inaccurate data regarding vehicle information or driver responses.
Errors stemming from improper data collection techniques were minimized through a constant monitoring of the survey and data entry personnel. On-site monitoring allowed specific problems to be immediately addressed with the interviewer. Problems identified during data entry were addressed during each of the subsequent survey seasons.
In order to accurately assign statistical weights to the survey data, traffic counts from the WSDOT Traffic Data Office (TDO) were used. WSDOT and the Federal Highway Administration utilize a 15-category vehicle classification system to identify vehicles; however not all traffic recorders are able to provide that level of data. Instead, a 4-category system, based upon vehicle length, was used in the SFTA analysis.
In order to present the survey data in a meaningful manner, the first step in this study was to calculate a site-specific seasonal weight factor based upon the total number of trucks passing each survey site in the 24 hours surrounding the survey date. Those sites that operated 24 hours were able to provide a total truck count for the day of the survey. For those sites where surveys were taken for less than 24 hours, WSDOT provided truck counts collected from their data recorders located closest to the survey sites.
19

To calculate the seasonal weight factor for each site/season, the total number of trucks in a 24-hour period was divided by the total number of surveys collected at each site. The seasonal weight factor was used to expand the collected data characteristics to represent the entire population of trucks at each survey location. This expanded information was a representation based upon the total number of daily truck trips.
Finally, documenting the geographic movement of freight truck shipments between individual cities and regions within the state of Washington was a key component of SFTA. Geographic coordinates (geo-codes) were developed for each Washington origin and destination identified by truck drivers participating in the origin-destination study. The process was performed within the Geographic Information System (GIS) software, ArcInfo. Utilizing an Arc Macro Language program, a list of five potential routes was developed for each origin-destination pair. The route that most closely matched the highway usage provided by the survey respondent was selected and assigned to each respective survey observation. The assignment of the truck origin-destination data to geographic coordinates allowed for very detailed and accurate analysis between any attributes from the survey data (truck configuration, commodity, weight, base of operation, origin-destination, facility type, etc.) to anything that has a geographical property (highway, land, people, socioeconomic data, etc.).
2.3.2 Studies incorporating emerging ITS technologies
Recent technological advancements have created data collection tools that could supplement freight planning and modeling needs. Combined with conventional truck trip data collection techniques, these technologies may fill data gaps and address valuable freight movement information needs. Included among these high-tech possibilities is video streaming (along with vehicle recognition software) throughout a metropolitan area to capture and record traffic volumes and corridor utilization by truck configuration type and carrier. This type of visual information could provide enhanced time of day truck traffic profiles, truck configuration types and directional movements for the areas monitored. Unfortunately, the software that translates a video image of a vehicle into an accurate and complete database record is still in the early stages of development and testing, with many challenges yet to overcome (recording multiple trucks simultaneously, weather impacts, and visibility issues). As a result, freight data collection studies have yet to incorporate this type of data capture technology.
One technology that has attracted research attention, especially as it relates to capturing freight shipment activity data, is the application of Global Positioning Systems (GPS). An automated GPS data collection device was tested in a recent study sponsored by the Planning and Technical Support Division of the California Air Resources Board (CARB) and jointly supported by the Federal Highway Administration (FHWA). This study, conducted by Battelle Transportation Research Division, sought to capture truck travel patterns in urban and rural areas by attaching GPS receivers to a sample of freight trucks throughout the state of California (Battelle 1999).
The goal of the CARB study was to develop more accurate data related to truck travel activity than was currently available from traditional methods such as roadside surveys, telephone interviews, or travel diaries. These self-reported data collection approaches tend to average or round necessary attributes such as travel times and start and stop times and omit useful route information for short trips (Battelle 1999).
20

To provide statewide coverage across different truck weight classes, the state of California was divided into four geographic regions, and five truck weight classes were chosen to provide a sample stratification of 20. The truck weight categories included:
• 8,500 – 10,000 lbs. • 10,000 – 14,000 lbs. • 14,000 – 33,000 lbs. • 33,000 – 60,000 lbs. • > 60,000 lbs.
Private trucking fleets operating within each geographical region were then contacted and recruited (on a voluntary basis) to participate in the study by allowing GPS receivers to be placed on their trucks. A total of 167 freight vehicles was recruited and equipped with GPS receivers, although only 140 of these provided usable data (a result of equipment malfunction). Each GPS receiver contained a memory card which recorded all trip attributes for later data downloading for analysis. Data recorded by the GPS receiver included the following:
• Location of travel, by highway and truck weight class • Travel time • Trip distance • Travel by functional highway class • Speed profiles by weight class and region • Start, stop and idle time periods • Routes utilized from the collection of GPS points
Overall, the study produced reasonably accurate information for the above data types. However, there was significant difficulty recruiting a large enough sample of participating trucks to equip with GPS receivers. Also, significant problems associated with hardware, cabling and memory card failures limited data accuracy. No information was provided regarding equipment or data collection costs (Battelle 1999).
2.4 AVAILABLE SUPPLEMENTARY AND COMPOSITION DATA
A limited number of secondary data sources is available to aid in freight planning and modeling, mostly as it relates to statewide movements of freight. However, utilization of this data may provide useful boundaries or at least narrow the scope of data collection strategies targeted at metropolitan and urban areas. This section provides a summary of these public and private data sources.
2.4.1 Public data sources
2.4.1.1 Commodity Flow Survey (CFS)
The U.S. Census Bureau, in association with the Bureau of Transportation Statistics, Federal Highway Administration, Department of Commerce and the U.S. Department of Transportation, conducts a survey every five years to a sample (100,000 for 1997) of
21

roughly 800,000 business establishments to collect information on the flow of goods by mode. The different business types surveyed include mining, wholesale, manufacturing and some limited retail and service type establishments. Data for shipment types are categorized into Standardized Classification of Transportation Goods (SCTG) codes and include attributes such as shipment weight, value, mode of transport, origin and destination (by zip code) and whether the shipment was containerized.
The Commodity Flow Survey is quite useful for determining statewide and national commodity movements, by mode, weight and value. However, given the broad summary format of the data, it is very difficult to obtain specific data attributes regarding freight shipments within a given urban or metropolitan area. Furthermore, the CFS breaks metropolitan areas along state lines, thus making it impossible to distinguish intra-regional flows from inter-regional, in a metropolitan area such as Portland, Oregon. The CFS does not provide information on vehicle configuration or type and also excludes freight shipments from most retail and service establishments, governments, farms and shipments from oil and gas extraction. Individual shipment route information and specific highway utilization is not available. Perhaps the most useful application of CFS data for purposes of this study, is validation and verification of data collected from other sources, especially as it relates to in-state to out-of-state shipments and vice versa.
2.4.1.2 Vehicle Inventory and Use Survey (VIUS)
One other national survey is conducted by the U.S. Census Bureau as part of the Census of Transportation, Communications and Utilities. This survey, known as the Vehicle Inventory and Use Survey (VIUS), is designed to measure the physical and operational characteristics of the nearly 60 million registered trucks in the U.S. A stratified random sample of roughly 150,000 registered truck owners is surveyed every five years from all 50 states and the District of Columbia. Data collected from VIUS provides very detailed truck and vehicle descriptions and operating characteristics, including vehicle type, base of operation, empty and gross weight, times of operation, mileage by different trip length categories, commodities reported at the two-digit Standard Transportation Commodity Code (STCC) level and the percentage of mileage by commodity type. However, VIUS does not provide information concerning specific highway use or information regarding truck operations within a given geographical (urban or metropolitan) area, which is the focus of this study.
VIUS data still may enhance or at least provide information that will increase the effectiveness of a successful urban data collection methodology. Valuable information regarding the physical and operating characteristics of vehicles registered and operating within an urban area may focus or narrow data collection approaches, especially as they relate to commodities hauled, trip characteristics and percentage of miles by commodity type.
2.4.1.3 Highway Performance Monitoring System (HPMS)
Historical classification data for traffic on highways are available from the Federal Highway Administration’s HPMS, which collects and compiles data from individual
22

states to aid in pavement monitoring and management systems. The data is generally collected from portable loop traffic counters or permanent Automatic Traffic Recorder installations on highways and provides Annual Average Daily Traffic (AADT) counts for each functional class of highway and by FHWA’s thirteen vehicle classifications (including passenger automobiles).
As with any system which captures vehicle frequencies at a specific geographic location, the data collected are useful for analyzing traffic frequencies by vehicle type for that specific location, but it is difficult to draw inferences from highway segments that do not have traffic counters. No information concerning origin, destination, type of commodity or shipment route is available from the HPMS data. However, if traffic counters collect information on a large proportion of highways within a geographical area, the information is useful for identifying truck corridors and frequency of use by vehicle type. This information may be extremely beneficial in identifying and prioritizing potential roadside interview locations.
2.4.2 Private data sources
2.4.2.1 Transearch freight flow database
One private data source for U.S. freight truck shipments is the Transearch freight flow database compiled by Reebie Associates. This data set provides aggregate information on commodity shipments between selected major cities, but limited information on shipments into smaller cities, towns and communities within state boundaries. This data source provides a broad picture of major truck flows between regions. However, this information, as with the aforementioned public data sources, is not designed to provide specific and detailed information on freight truck movements for individual highways in sub-state regions outside major cities or local transportation corridors.
2.5 SUMMARY
The need for data on specific freight movements has increased in recent years, as highway congestion and capacity concerns begin to impact freight transportation efficiency and ultimately regional economic health and prosperity. Earlier research efforts have been focused on capturing information and data to aid in the design and development of transportation models for passenger automobiles. Research and analysis for freight truck movements were often performed by utilizing passenger car models and relating the freight truck activity to variables commonly utilized for generating passenger car trips such as square feet of office space and number of employees. As modeling efforts have become more specialized for truck characteristics, the data needs of freight modeling and policy planning purposes likewise have become more specific.
Studies that have focused on collection of freight data and information are more recent and less abundant, primarily applied to regional or statewide truck movements (Casavant and Jessup 2002). A very limited number of studies have concentrated on different data collection methodologies that may be implemented within urban centers that provide the necessary level of data detail for successful freight policy planning and modeling requirements.
23

Some combination of each data collection methodology may be applicable when attempting to obtain accurate and complete truck information over large geographical urban areas and freight movement types. Also, utilization of secondary data sources such as the Commodity Flow Survey, Vehicle Inventory and Use Survey, or Highway Performance Monitoring System can be very useful for both designing data collection approaches and narrowing the scope of data collection methodologies.
24

3.0 DATA REQUIREMENTS AND STRUCTURE
3.1 INTRODUCTION
This section reports on the level, form and detail of data needed by ODOT and regional planners, including the data demands and requirements of the Oregon Transportation and Land Use Model Integration Program (TLUMIP) and the specific attributes that will enhance and improve model forecasting. The information was developed from the extensive review of literature and various interviews, in person and via teleconference, with the modeling and planning community associated with the project.
The section below first identifies the population of movement data collected and analyzed in previous studies, then identifies those data attributes that appear most critical and useful to ODOT’s modeling and planning efforts.
3.2 PAST DATA COLLECTION AND ATTRIBUTES
The past literature contains studies at local, regional and state levels. The total population of data attributes reviewed in the literature for this study included many different combinations of data and in different dimensions. These data attributes included the following:
Time dimension attributes • 24-hour coverage, or in some cases coverage only during peak hours • travel time • truck flow by time of day • traffic composition: trucks as a percentage of total traffic flow over time • trip frequency: the method of identification varied depending on what methodology of data
collection was used • vehicle usage: by hours per day, per week or per month • total number of one-way trips on the survey day • speed profiles: by route and segment, time of day Trip attributes • route: sometimes not collected in real time but inferred by transportation model options • distance: data varied by total trip, specific origin or destination, or distance for each
individual segment • purpose of the trip • origin and destination: usually by street location or common known name, on the survey day
or traditional • start and stop times for trips: by total and segments, with some studies collecting time spent
idling as well
25
• odometer readings: used as a surrogate for actual trip or segment distance • name and address of each stop on a trip chain or pick up and delivery tours • land use or facility at each stop • location and magnitude of trip generators • route information and facility type for every segment • types of truck patterns for a study region: external to external, external to internal or vice
versa, and internal to internal • business type: corporate, private, etc. Vehicle attributes • commercial vehicle types (light, medium and heavy): other studies identified the specific
configuration of each vehicle, usually by number of axles and body style • land use type: often this was collected by facility type or in a specific land use category • configuration: especially identifying container type and size • weight: gross and tare weight, with load weight either inferred or captured by bill of lading • trailer width and length • fuel type of vehicle • driver characteristics: such as age, sex, years of experience, training, union affiliation and
method of enumeration (payment type to driver) • driver and vehicle activity at each stop
3.3 ODOT DATA NEEDS
Previous studies and the researchers on this study effort have defined the “structure” of the data as the outcome or use of the individual data elements. The “details” of the data are the specific information items collected. For example, the data detail “commodity carried” could result in a data structure of commodity flow through a state, region, sub-region, etc. This section will review the results of discussions and interviews with ODOT and Technical Advisory Committee (TAC) members and summarize the data detail which is needed and useful.
There is substantial agreement between the planners and modelers about needed data detail, but some differences arise, mainly in the structure of the data, i.e., how it is utilized. Planning is often concerned with the state or regional commodity flows and the truck density that results, while modelers require the ability to analyze terminals and other gateways as trip generators into and through a region. Often, specific reload and intra-region information is useful. Structure may, depending on the focus of each individual study, involve distribution patterns and flows, allocation of traffic to gateways and terminals, truck densities and infrastructure issues, congestion/capacity and corridor analysis.
3.3.1 Modeling efforts
The greatest data need is for precise location detail on the origin and destination of a trip. Route, while useful to modeling activities, is not essential because most of the existing models have the capability to assign routes to the highway and road system at the detail needed. However, it is a very useful data attribute in the planning activities.
26

The second detail, land use, is also very productive in the models and therefore is needed in specific form to provide information on the economic activity being served by the transportation movement. The land use detail varies in level of information needed and the construct of the detail, e.g., in-transit versus terminal versus factory, etc.
A third data attribute that is needed and is very common to most methodologies is the commodity carried, where an empty load is also treated as a commodity. This attribute forms an integral part of the planning applications and is often used in model parameters. Allocation of commodity flow tonnage is not as important since other data sources can be used to achieve the allocation. A similar data detail of interest to both planners and modelers is the weight of the commodity being carried. Depending on use of the data, the net payload, the empty weight of the vehicle and the loaded weight are all weight data details that can be used. An associated information item is the truck type and configuration. Information on number of axles is useful in categorizing the vehicle and also of use in pavement impact studies in planning work.
Three final data details that are critical are the location of stops and the land-use at those stops, as well as the time of day for all movements and trip chains. These attributes were desired by both planners and modelers, at least to some degree.
In sum, origin and destination, commodity carried, and land-use were identified as the most needed. Close behind were route and time of day, followed by number and characteristics of stops. The number of stops reflects the issue of intra-regional movements and their characteristics, a research issue that varies in degree of need, from planners at the state level/MPO level to modelers dealing with inner city flows. It has been estimated that up to 70% of movements do not deal with intra-regional re-loaders such as LTL terminals, freight forwarders, or freight consolidators/de-consolidators, yet the remaining 30% are solidly in the traffic density of the inner city or intra-region flows.
3.3.2 Planning efforts
Freight planning requires detailed data but often at a more aggregate level, depending on the type of analysis being done. The needs vary depending on whether a statewide analysis is considered or whether a region/sub-region-city or MPO is the focus. Statewide information and flows are often needed with specific information on trip-generators and the relationship to specific highway segments. Of interest is the percentage of trucks in the total traffic stream, the resultant congestion/capacity concerns, and the commodity or generators associated with that activity. Specific data detail for planning needs identified in our discussions were similar to the modeling efforts but had different degrees of priority. Commodity flows and routes/roads are quite critical, including volumes of movements and the associated origins and destinations of these movements. Related information that was similar to the modeling needs included percent of trucks, time of day, and types/configuration of trucks. Many of the other data elements mentioned in the literature were felt to be potentially useful but not critical to this data development effort. If it did not impinge on the data collection sampling and success, some additional data might be collected in a pilot study.
27
3.4 RELATIVE FINANCIAL COSTS OF DATA DETAIL
The long list of desired data details has differing financial implications, but generally can be summarized in two statements:
1) Additional detail in a questionnaire, once a vehicle is stopped or once a mail questionnaire is being answered, does not add much marginal cost.
2) The data costs are quite different depending on whether flow data is being collected at an interregional or major gateway level versus at the level of intra-regional flows documenting reshipment, consolidation, retail versus wholesale, including route, time, stops, etc.
Generally, therefore, the overall flow data of commodity, origin/destination, route, time, weight, etc. can be captured at lower costs. The dense movements of intra-regional traffic may dictate a sampling density and detail that becomes more expensive.
The review of literature and the experience of the authors suggest that intercept/interview techniques can generate the detail needed for either level of study, with good response rates; however, the coverage of the entire relevant population via this method may require finances greater than those needed for other techniques.
Mail questionnaires appear to offer the lowest cost possibilities. This method is dependent on a known population, accurate mailing information and often still has the lowest response rate. In this method, once a respondent starts to fill in a questionnaire, any extra data details may incur a low marginal cost, unless the respondent gets frustrated by the length of the questionnaire and the entire response is lost. Combining telephone calls with a mail questionnaire has been shown to increase the response rate and the accuracy of the data. The impact of additional data detail requests would not be affected, however.
Telephone surveys, by themselves, do get a good response rate, and they can handle detail in the questionnaire with more involved questions, but the accuracy of the information may become a problem. Thus the final fully accurate and completed information may be expensive.
In sum, the cost of the data detail is more related to the method used and the degree of coverage desired. Full estimates of total survey costs, and the marginal costs of additional detail can only be developed once the coverage and the chosen method are determined.
28

4.0 ALTERNATIVE DATA COLLECTION METHODOLOGIES
4.1 INTRODUCTION
This chapter builds upon the earlier literature review and data requirements/structure by comparing and contrasting the alternative truck and freight data collection methodologies previously mentioned. While some of the comparisons have already been discussed, particular attention will be focused on 1) the implementation challenges, 2) investment and maintenance requirements, 3) statistical reliability, 4) data attributes and 5) geographic coverage concerns for each methodology. The data collection methods previously summarized from the literature include: • Mail Survey • Telephone Survey • Roadside Interview Survey • Combined Telephone and Mail Survey • Video Surveillance • GPS Receiver Attached to Sample of Trucks
4.2 MAIL SURVEY
The most common data collection method has been mail surveys of some type to either shippers or licensed truck owners. Implementation is very easy and there is no disruption of the traffic flow on highways or urban streets where available parking may be limited or non-existent. The investment and maintenance costs are also very low for mail surveys. This type of data collection also requires minimal personnel to implement and generally provides good data and information for those respondents providing completed responses.
Unfortunately, this approach typically experiences very low response rates, especially for follow-up surveys, which may bias the information that is collected. The survey coverage may also be quite low, due to the fact that freight movements by vehicles licensed outside the geographical area are not included in the mail survey. Also, this approach limits the ability to clarify specific questions, which may additionally compromise the data integrity. However, given the economical cost of implementation, this approach may be useful for capturing freight movements not accessible via other means. The advantages and disadvantages of utilizing mail surveys are summarized in Table 3.1.
29
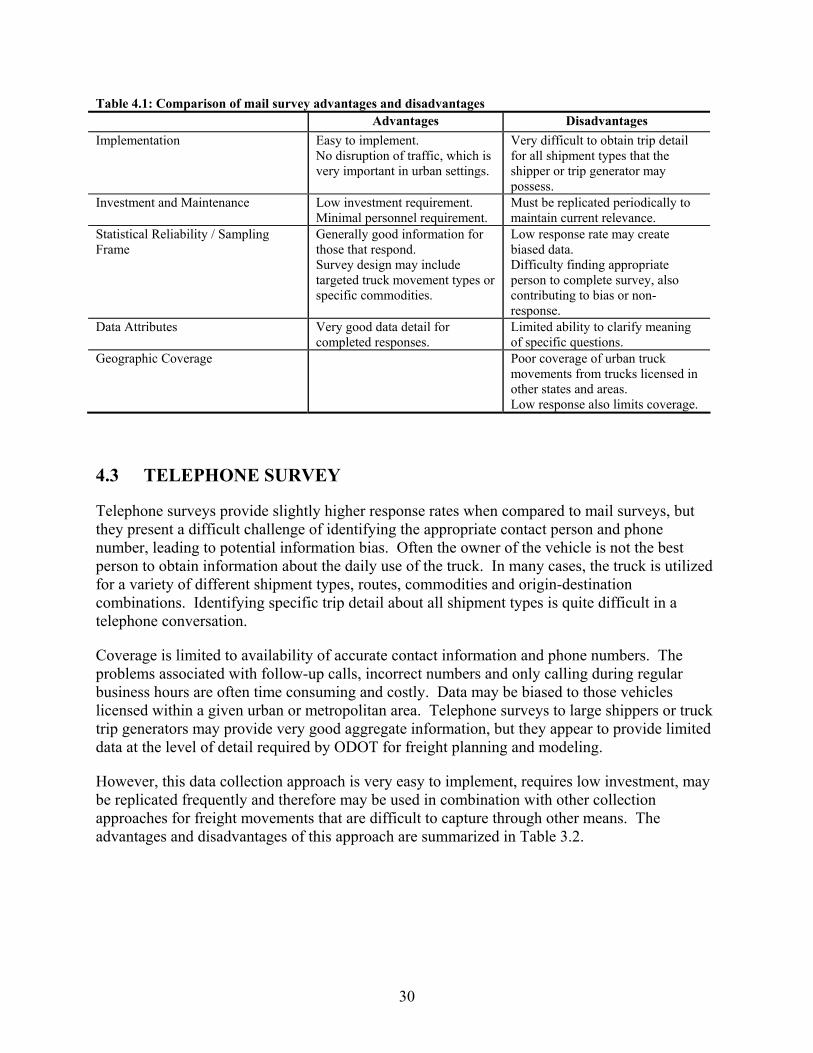
Table 4.1: Comparison of mail survey advantages and disadvantages Advantages Disadvantages Implementation Easy to implement.
No disruption of traffic, which is very important in urban settings.
Very difficult to obtain trip detail for all shipment types that the shipper or trip generator may possess.
Investment and Maintenance Low investment requirement. Minimal personnel requirement.
Must be replicated periodically to maintain current relevance.
Statistical Reliability / Sampling Frame
Generally good information for those that respond. Survey design may include targeted truck movement types or specific commodities.
Low response rate may create biased data. Difficulty finding appropriate person to complete survey, also contributing to bias or non-response.
Data Attributes Very good data detail for completed responses.
Limited ability to clarify meaning of specific questions.
Geographic Coverage Poor coverage of urban truck movements from trucks licensed in other states and areas. Low response also limits coverage.
4.3 TELEPHONE SURVEY
Telephone surveys provide slightly higher response rates when compared to mail surveys, but they present a difficult challenge of identifying the appropriate contact person and phone number, leading to potential information bias. Often the owner of the vehicle is not the best person to obtain information about the daily use of the truck. In many cases, the truck is utilized for a variety of different shipment types, routes, commodities and origin-destination combinations. Identifying specific trip detail about all shipment types is quite difficult in a telephone conversation.
Coverage is limited to availability of accurate contact information and phone numbers. The problems associated with follow-up calls, incorrect numbers and only calling during regular business hours are often time consuming and costly. Data may be biased to those vehicles licensed within a given urban or metropolitan area. Telephone surveys to large shippers or truck trip generators may provide very good aggregate information, but they appear to provide limited data at the level of detail required by ODOT for freight planning and modeling.
However, this data collection approach is very easy to implement, requires low investment, may be replicated frequently and therefore may be used in combination with other collection approaches for freight movements that are difficult to capture through other means. The advantages and disadvantages of this approach are summarized in Table 3.2.
30

Table 4.2: Comparison of telephone survey advantages and disadvantages Advantages Disadvantages Implementation Easy to implement.
No disruption of traffic, which is very important in urban settings. Quicker turnaround than mail.
Difficulty finding appropriate and correct phone numbers. Can only call during business hours. 20 to 30 minutes in length.
Investment and Maintenance Low investment requirement. Must be replicated periodically to maintain current relevance. Higher personnel requirement when compared to mail.
Statistical Reliability / Sampling Frame
Generally good information for those that respond. Survey design may include targeted truck movement types or specific commodities.
Low response rate may create biased data. Difficulty finding appropriate person to complete survey, also contributing to bias or non-response.
Data Attributes Very good data detail for completed responses.
None.
Geographic Coverage Generally coverage is limited to those vehicles licensed within the area.
Poor coverage of urban truck movements from trucks licensed in other states and areas.
4.4 COMBINED MAIL AND TELEPHONE SURVEY
Response rates are improved significantly when mail surveys are combined with telephone contact. However, the cost of implementation increases significantly with this approach. Both mail and phone surveys rely upon a list of registered vehicles or firms from the urban area under study and fail to capture truck movements by vehicles registered outside the metropolitan area. The telephone contact prior to the mail survey, and as a follow-up, provides the opportunity to increase the response rate and enhance qualitative information about freight movements. Information about other relevant trip generators may also be available. However, the main data gathering technique is the mailed questionnaire, with both the positive and negative attributes detailed earlier. The advantages and disadvantages of the combined mail and telephone survey are shown in Table 3.3.
31
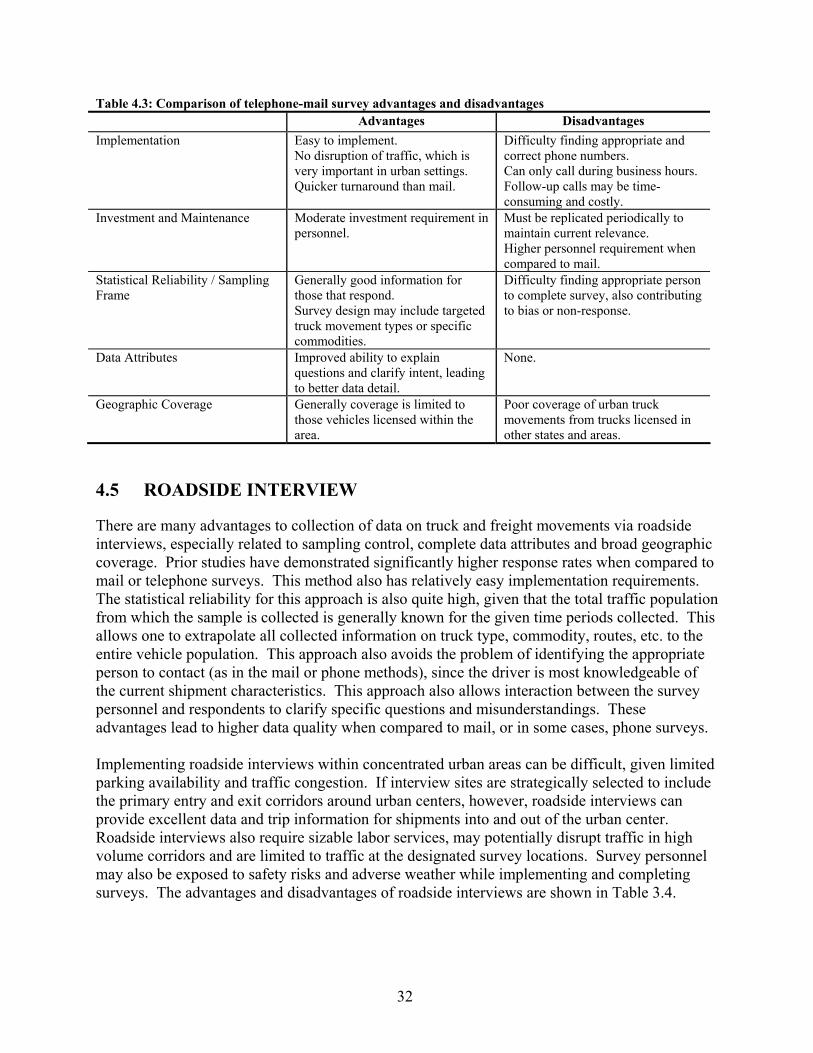
Table 4.3: Comparison of telephone-mail survey advantages and disadvantages Advantages Disadvantages Implementation Easy to implement.
No disruption of traffic, which is very important in urban settings. Quicker turnaround than mail.
Difficulty finding appropriate and correct phone numbers. Can only call during business hours. Follow-up calls may be time-consuming and costly.
Investment and Maintenance Moderate investment requirement in personnel.
Must be replicated periodically to maintain current relevance. Higher personnel requirement when compared to mail.
Statistical Reliability / Sampling Frame
Generally good information for those that respond. Survey design may include targeted truck movement types or specific commodities.
Difficulty finding appropriate person to complete survey, also contributing to bias or non-response.
Data Attributes Improved ability to explain questions and clarify intent, leading to better data detail.
None.
Geographic Coverage Generally coverage is limited to those vehicles licensed within the area.
Poor coverage of urban truck movements from trucks licensed in other states and areas.
4.5 ROADSIDE INTERVIEW
There are many advantages to collection of data on truck and freight movements via roadside interviews, especially related to sampling control, complete data attributes and broad geographic coverage. Prior studies have demonstrated significantly higher response rates when compared to mail or telephone surveys. This method also has relatively easy implementation requirements. The statistical reliability for this approach is also quite high, given that the total traffic population from which the sample is collected is generally known for the given time periods collected. This allows one to extrapolate all collected information on truck type, commodity, routes, etc. to the entire vehicle population. This approach also avoids the problem of identifying the appropriate person to contact (as in the mail or phone methods), since the driver is most knowledgeable of the current shipment characteristics. This approach also allows interaction between the survey personnel and respondents to clarify specific questions and misunderstandings. These advantages lead to higher data quality when compared to mail, or in some cases, phone surveys. Implementing roadside interviews within concentrated urban areas can be difficult, given limited parking availability and traffic congestion. If interview sites are strategically selected to include the primary entry and exit corridors around urban centers, however, roadside interviews can provide excellent data and trip information for shipments into and out of the urban center. Roadside interviews also require sizable labor services, may potentially disrupt traffic in high volume corridors and are limited to traffic at the designated survey locations. Survey personnel may also be exposed to safety risks and adverse weather while implementing and completing surveys. The advantages and disadvantages of roadside interviews are shown in Table 3.4.
32
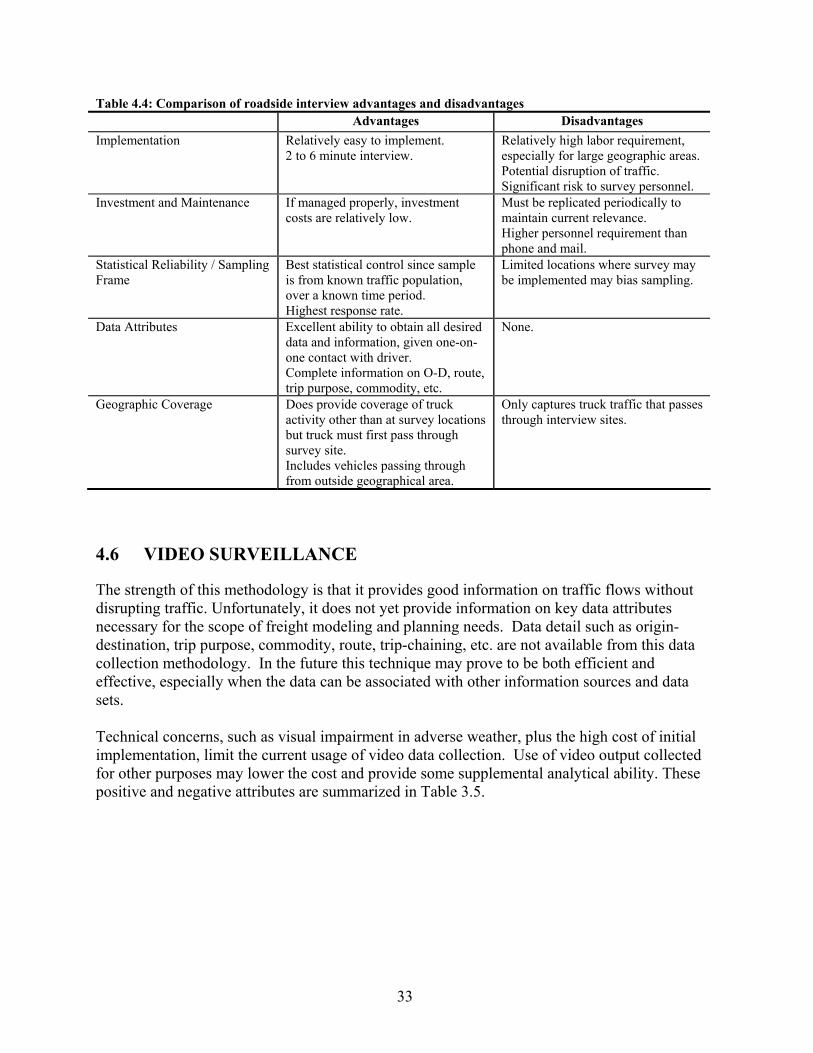
Table 4.4: Comparison of roadside interview advantages and disadvantages Advantages Disadvantages Implementation Relatively easy to implement.
2 to 6 minute interview. Relatively high labor requirement, especially for large geographic areas. Potential disruption of traffic. Significant risk to survey personnel.
Investment and Maintenance If managed properly, investment costs are relatively low.
Must be replicated periodically to maintain current relevance. Higher personnel requirement than phone and mail.
Statistical Reliability / Sampling Frame
Best statistical control since sample is from known traffic population, over a known time period. Highest response rate.
Limited locations where survey may be implemented may bias sampling.
Data Attributes Excellent ability to obtain all desired data and information, given one-on-one contact with driver. Complete information on O-D, route, trip purpose, commodity, etc.
None.
Geographic Coverage Does provide coverage of truck activity other than at survey locations but truck must first pass through survey site. Includes vehicles passing through from outside geographical area.
Only captures truck traffic that passes through interview sites.
4.6 VIDEO SURVEILLANCE
The strength of this methodology is that it provides good information on traffic flows without disrupting traffic. Unfortunately, it does not yet provide information on key data attributes necessary for the scope of freight modeling and planning needs. Data detail such as origin-destination, trip purpose, commodity, route, trip-chaining, etc. are not available from this data collection methodology. In the future this technique may prove to be both efficient and effective, especially when the data can be associated with other information sources and data sets. Technical concerns, such as visual impairment in adverse weather, plus the high cost of initial implementation, limit the current usage of video data collection. Use of video output collected for other purposes may lower the cost and provide some supplemental analytical ability. These positive and negative attributes are summarized in Table 3.5.
33

Table 4.5: Comparison of video surveillance advantages and disadvantages Advantages Disadvantages Implementation No disruption of traffic. Potential for equipment failure or
technical difficulties. Weather and time of day/night impact visibility and data collection.
Investment and Maintenance High equipment cost and requirements. Relatively high maintenance and replacement cost for video equipment.
Statistical Reliability / Sampling Frame
Captures all trucks passing a video site, during all (visible) time periods.
Provides limited information.
Data Attributes Provides general descriptive information on traffic flows.
No information regarding O-D, trip purpose, freight/goods type carried, route, etc.
Geographic Coverage Limited to locations with video capability within and around urban area.
4.7 GLOBAL POSITIONING SYSTEM (GPS) RECEIVER
Utilization of global positioning systems do provide additional information regarding individual truck travel activity and truck type frequencies on given corridors and may offer future data collection possibilities. High equipment costs and frequent equipment malfunctions, however, currently prevent widespread implementation. Also, utilizing GPS receivers for recording truck travel activity only provide a very limited amount of information. Critical information such as weight, trip purpose and commodity hauled is not captured.
The above concerns can be minimized by increasing the density of vehicle numbers with GPS receivers or by narrowing the focus of each individual study, e.g. to a specific corridor or trip generator of interest. However, widespread utilization of GPS receivers for data collection on freight movements is currently cost prohibitive relative to the value of information obtained, especially for large urban areas with a large variety of freight movements. The advantages and disadvantages of GPS are summarized in Table 3.6.
34
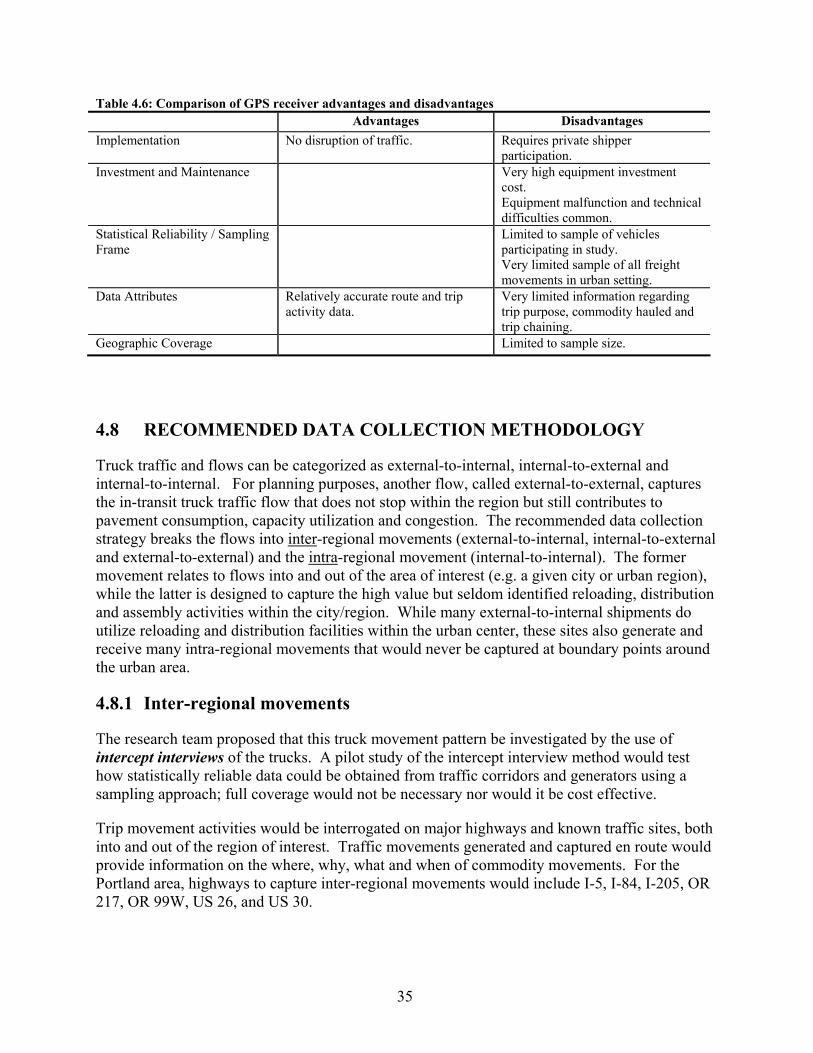
Table 4.6: Comparison of GPS receiver advantages and disadvantages Advantages Disadvantages Implementation No disruption of traffic. Requires private shipper
participation. Investment and Maintenance Very high equipment investment
cost. Equipment malfunction and technical difficulties common.
Statistical Reliability / Sampling Frame
Limited to sample of vehicles participating in study. Very limited sample of all freight movements in urban setting.
Data Attributes Relatively accurate route and trip activity data.
Very limited information regarding trip purpose, commodity hauled and trip chaining.
Geographic Coverage Limited to sample size.
4.8 RECOMMENDED DATA COLLECTION METHODOLOGY
Truck traffic and flows can be categorized as external-to-internal, internal-to-external and internal-to-internal. For planning purposes, another flow, called external-to-external, captures the in-transit truck traffic flow that does not stop within the region but still contributes to pavement consumption, capacity utilization and congestion. The recommended data collection strategy breaks the flows into inter-regional movements (external-to-internal, internal-to-external and external-to-external) and the intra-regional movement (internal-to-internal). The former movement relates to flows into and out of the area of interest (e.g. a given city or urban region), while the latter is designed to capture the high value but seldom identified reloading, distribution and assembly activities within the city/region. While many external-to-internal shipments do utilize reloading and distribution facilities within the urban center, these sites also generate and receive many intra-regional movements that would never be captured at boundary points around the urban area.
4.8.1 Inter-regional movements
The research team proposed that this truck movement pattern be investigated by the use of intercept interviews of the trucks. A pilot study of the intercept interview method would test how statistically reliable data could be obtained from traffic corridors and generators using a sampling approach; full coverage would not be necessary nor would it be cost effective.
Trip movement activities would be interrogated on major highways and known traffic sites, both into and out of the region of interest. Traffic movements generated and captured en route would provide information on the where, why, what and when of commodity movements. For the Portland area, highways to capture inter-regional movements would include I-5, I-84, I-205, OR 217, OR 99W, US 26, and US 30.
35

Ports, rail loading facilities, and known distribution centers would provide intimate detail on the trip generation site activities.
4.8.2 Intra-regional movements
The research team proposed that data on this segment of truck traffic flows be captured by a mail survey of warehouse/distribution centers in the Portland urban area. A pilot study of this method would focus on freight facility characteristics, truck movement characteristics and the volume of those movements.
It was proposed that a portion of the pilot study include a fax survey to test against the mail approach. In addition, a combination of telephone and mail/fax technique was proposed, which is more expensive but could yield better completion of questionnaires, versus a straight mail/fax survey. This approach would provide the opportunity for a costing and effectiveness comparison of the strategies, which could yield recommendations at the conclusion of this research effort.
4.8.3 Pilot study strategy
The above strategy for the pilot study was intended to test of the technical feasibility of the techniques. An assessment of the quality of information, statistical reliability, coverage and cost findings would provide useful information for refinement of the technique or even wholesale changes in the data collection approach. Questions of coverage of truck traffic through the year, and the availability of hourly, daily, and monthly flow information, could also be answered by the findings of the overall pilot study.
Conducting the pilot study in the Portland metropolitan area was judged to be the most complex and challenging of the survey sites. The lessons learned from applications of the trial data collection strategy should provide useful information to modify and reformulate the method to address other urban survey locations in Oregon. If the data collection technique applied in the pilot study could generate statistically defensible data with enough specificity for model calibration, then that technique could be reasonably expected to apply to planning needs as well.
36

5.0 PILOT STUDIES
5.1 INTRODUCTION
Two data collection approaches were chosen as the most promising means of providing needed information regarding inter-regional and intra-regional freight movements:
1. The roadside interview approach was selected for collecting data on inter-regional freight movements; and
2. The mail/fax survey approach was selected for collecting data on intra-regional freight movements.
This chapter describes the implementation of two pilot studies in the Portland, Oregon metropolitan area to test the efficacy and adequacy of these data collection approaches.
5.2 PILOT STUDY I – ROADSIDE INTERVIEWS
Three separate roadside interviews were conducted at different locations and facility types in the Portland metropolitan area – an interstate highway weigh station, a port location and a warehouse/distribution facility. Each roadside interview was conducted by trained service club members (Lions) from the Vancouver, Washington area. These service club members had previous experience conducting similar roadside interviews in Washington with the Strategic Freight Transportation Analysis (SFTA) project and were therefore quite knowledgeable and experienced. Regardless, all interview personnel received thorough training and explanation of all questions on the survey, site set-up, safety and use of survey equipment prior to conducting the roadside interviews.12
5.2.1 Interstate highway weigh station
The interstate highway weigh station selected for the pilot study was the Cascade Locks weigh-station at milepost 44.93 on eastbound I-84. Consultation with officials at the ODOT Motor Carrier Transportation Division indicated that this particular site represented one of the heaviest traffic volumes for the Portland/Metro area and could thus offer more challenges in conducting a roadside survey when compared to lower volume sites. The traffic is especially heavy for eastbound traffic on Tuesdays, as freight operators have made deliveries and freight drops within the Portland area on Monday and are headed back east with new freight loads on Tuesday. This
12 For a complete description of survey personnel training, survey site planning, layout, traffic flow and interview processes, see “Freight Truck Origin-Destination Study: Methods, Procedures and Data Dictionary,” SFTA Research Report #2 at www.sfta.wsu.edu. (Clark, et al. 2002)
37
roadside survey was conducted on June 17, 2003 during the regularly scheduled hours of operation (7 a.m. – 2 a.m., a total of 19 hours).
A copy of the interview form is included in Appendix B. Each interview was designed to be completed in about 2 minutes. The survey posed questions on the following topics:
• Carrier name • Carrier address • Vehicle and trailer configuration • Number of axles • Origin address of shipment • Destination address of shipment • Commodity • Detailed trip route • Address of LTL pickups and deliveries • Time of day • Hazardous material placard code
As indicated above, the survey methodology was patterned after that used in the Strategic Freight Transportation Analysis (SFTA) conducted by Washington State University for the Washington State Department of Transportation in 2002. The interviews were conducted by a local service club (Lions Club), which provided teams of four to seven individuals to conduct surveys throughout the 19-hour survey period. A quality/support manager from Washington State University trained and supervised the interview teams. The survey operation had the full support of the Oregon Department of Transportation Motor Carrier Enforcement Office.
5.2.2 Port facility
The roadside interview method was also tested at the Port of Portland’s Rivergate Industrial Park, Terminal 6. This site was chosen over other port facilities primarily due to the large volume of container and automobile traffic passing through this facility relative to other port locations, and the multi-modal characteristics of this site. This site also presented significant administrative and security issues for implementing on-site freight surveys, thus providing a better test of the data collection process.
Surveys at this location were conducted on July 9, 2003 during the regular hours of operation at the Terminal 6 port facilities (8 a.m. – 5 p.m., a total of nine hours). This day was selected over other days of the week due to the heavy volume of inbound and outbound container traffic occurring on this date. Between five and eight local service club (Lions) members conducted the surveys at the port facility.
The interview form for the port facility was modified slightly from the weigh station questionnaire to accommodate data collection on two separate freight movements (the ending of one trip and the beginning of another) for those freight operators who delivered a shipment to the port facility and immediately picked-up another shipment to be delivered somewhere else. This situation did not occur for weigh station interviews, since the information was captured during the trip segment and not at the intersection of potentially two trip segments.
38

5.2.3 Warehouse/distribution center
The roadside interview method was also tested at a trucking company, which had voluntarily agreed to participate in the pilot study. Interviews were conducted at a primary warehouse/distribution center, northwest of downtown Portland, with the support and cooperation of the transportation company. This facility handles several different inbound and outbound shipment types and represented the heaviest volume facility owned by the transportation firm.
Interviews were conducted on July 16, 2003, over a twenty-four hour period beginning at 7 a.m. Between four and six service club members interviewed truck drivers as they delivered or picked up loads at the warehouse. As with the port facility, the interview form for the warehouse/distribution center was modified slightly from the weigh station questionnaire to accommodate data collection on two separate freight movements (the ending of one trip and the beginning of another) for those freight operators who delivered a shipment to the facility and immediately picked up another shipment to be delivered somewhere else.
5.2.4 Sample differences
By the nature of the different traffic characteristics at each roadside interview site, slight differences may have existed in the samples collected as they relate to truck size. The roadside interviews conducted at the weigh station included all commercial vehicles weighing at least 16,000 lbs. However, those interstate freight companies that participate in the Commercial Vehicle Information Systems and Networks (CVISN) program (known as “Green Light” in Oregon) may by-pass certain weigh stations throughout the state, thus not being captured as part of this sample. Compared to those that enter the weigh station, those vehicles not captured as parts of this sample are more likely to be from common carrier firms specializing in long-distance. Vehicles sampled at the port and warehouse/distribution facility may include vehicles smaller than 16,000 lbs and also those participating in Green Light. Thus, while some differences may have existed between the three pilot study samples, the differences were expected to be relatively small.
5.3 PILOT STUDY II – MAIL AND FAX SURVEYS
This pilot study was comprised of two components – a mail survey method and a fax survey method. The fax survey component was included because many freight firms rely on fax for important communications, and a fax survey might be more likely than mail to yield a response. The survey questionnaire was virtually identical for both components. A sample is included in Appendix C. The questionnaire was designed to be completed in about 20 minutes. The types of information collected by this survey included the following:
• Warehouse/distribution center information related to size of operation (square footage of buildings, number of loading bays and number of employees)
• Daily time distribution of inbound and outbound shipments • Seasonal time distribution (6 time periods) of inbound and outbound shipments for the year • Vehicle and trailer configuration
39

• Commodity description for inbound and outbound shipments • Inbound and outbound shipment information such as number of truckloads, average payload
weight, number of stops per trip and average length of route • Addresses of shipment origins and destinations • Routes utilized for inbound and outbound shipments
The overall approach of the survey methodology used in this study reflected a modified Total Design Methodology (TDM) developed by Dr. Don Dillman of Washington State University (Dillman 1978). Dillman characterizes the TDM as “as much a theory of response behavior as it is a method shown to produce good results.” His methodology was developed as an alternative to face-to-face interviews, using telephone and mail questionnaires as the survey instrument. That methodology, and the research it was based on, focused on collecting attitudes and opinions, rather than the hard quantitative numbers of operations/capacity and traffic flow desired in this investigation.
The essence of the TDM was used but was modified by the needs of ODOT and the complexity of the multiple simultaneous tests being conducted. Experience suggests that multiple contacts with the survey population can be expected to slightly increase the response rate overall.13.
Those response rates achieved by using the proven Dillman method are typically from surveys designed to capture opinions and issues close to the survey population, thereby offering an additional incentive to survey respondents to have their opinions be heard. Capturing objective information related to freight shipments and warehouse/distribution center characteristics does not inherently provide the prospective respondent with the same degree of motivation to be heard on a particular issue and thus may result in lower response rates.
The following steps were utilized in this investigation, some simultaneously. Most were drawn from the TDM, but with some additions by this research team.
• Develop intimate knowledge of the desired survey population, its general characteristics and operations
• Identify planning and modeling data needs • Develop initial mail and fax questionnaires • Review the questionnaires with the Technical Advisory Committee (TAC) • Redesign the questionnaires, using TDM, based on the needs, not desires, of the TAC • Develop cover letters, using the concepts promulgated by TDM • Finalize the questionnaires, with compromises between data needs of modelers and
planners versus impact on response rates, according to TDM • Develop script for telephone interaction, both pre- and post-mailings/faxes • Test scripts for flow and intent • Develop mailing and fax sample frames • Research and supplement contact information (telephone and address) on the web and in
directories
13 Dillman’s review of research projects in his textbook indicated a 3 to 9 percent increase was possible if all elements of the full TDM were used. Subsequent research suggests this to be a minimum, with an increase in response rate of up to 15 percent (Newkirk, et al. 1995).
40

• Phone for pre-contact for mailing and fax tests • Mail questionnaires and fax to appropriate samples • Phone for post-contact after fax and mailing questionnaires • Input response data from multiple tests • Evaluate response rates, including returned, not applicable or denials for each test • Evaluate questionnaire item response by multiple tests • Evaluate implications of response rates and item response for planning and modeling
efforts 5.3.1 Mail survey
Three different mail survey methods were tested across two different mailing lists to allow testing and comparison between different mail methods and list quality. The mail methods included the following:
1. Straight Mail – a single contact via mailed questionnaire
2. Phone/Mail – a telephone contact soliciting an agreement to participate, followed by a mailed questionnaire
3. Phone/Mail/Phone – a telephone contact soliciting an agreement to participate, followed by a mailed questionnaire and a follow-up reminder by phone to return the questionnaire
Each mail survey method represented different costs of obtaining freight information relative to the response rate achieved via each approach. The test among different methods was designed to determine the relative value, in terms of lift in response rate, of increasing the interaction between survey personnel and targeted freight respondents.
The main modifications of the Dillman TDM were 1) increasing the contact intensity via phone and mail combinations and evaluating any change in response or item response as a result of the increased contact; and 2) avoiding multiple mailings/postcards/letters suggested in the full TDM method but using the contact intensity as an alternative.
Two different mailing lists were obtained for use as a sampling frame: 1) the Port of Portland’s freight facility database, and 2) a list of freight industry firms from the Oregon Employment Department ES-202 employment database. These lists were categorized as the “Known” and “Unknown” lists, respectively; their use allowed for testing the value of having a prior working relationship with freight companies when obtaining information on freight movement and characteristics versus contacting firms for such information, with no prior contact.
The sample size for each of the mail methods and from each sampling frame list is shown in Table 5.1. Both the known and unknown lists were validated and authenticated for accurate information on name of business, address, and phone number using various online services including Dun & Bradstreet, Department of Commerce and Switchboard.com.
41

Table 5.1: Mail survey test cell sample size Port of Portland
Freight Facility List (Known)
202 Employment Data List (Unknown)
Survey Method Mail Volume Mail Volume
Total
Mail 45 45 90 Phone/Mail 47 47 94 Phone/Mail/Phone 51 51 102
Total 143 143 286
The mail survey was conducted from July 3rd through August 15th, 2003. All mailed questionnaires were sent with a stamped return envelope and a cover letter explaining the purpose of the survey and contact information for further clarification. The Phone/Mail method involved first contacting the company to describe over the phone the purpose of the mail survey and to identify the name of a specific individual to whom the mail questionnaire should be addressed. The Phone/Mail/Phone method included first contacting the company via phone, then mailing the cover letter and questionnaire, and then following up with a phone call to those who had not returned the questionnaire after one week following receipt of the questionnaire.
5.3.2 Fax survey
Similar to the mail surveys, three different methods were tested between two different sampling frame lists for the fax surveys. Using the fax mode of contact allowed for comparison between mail and fax surveys for each method tested. The methods tested for the fax survey included the following:
1. Straight Fax – a single contact via faxed questionnaire
2. Phone/Fax – a telephone contact soliciting an agreement to participate, followed by a faxed questionnaire
3. Phone/Fax/Phone – a telephone contact soliciting an agreement to participate, followed by a faxed questionnaire and a follow-up reminder to return the questionnaire
A similar quality control process was undertaken to validate the accuracy of the fax list as that of the mail list, prior to conducting the surveys. Those companies that could not be verified or fax number obtained were replaced with other members of the list population. The sample sizes for the fax surveys are provided in Table 5.2.
42

Table 5.2: Fax survey test cell sample size Port of Portland
Freight Facility List (Known)
202 Employment Data List (Unknown)
Survey Method Fax Volume Fax Volume
Total
Fax 45 45 90 Phone/Fax 46 46 92 Phone/Fax/Phone 51 51 102
Total 142 142 284
The fax survey was conducted from July 7th through August 15th, 2003. All faxed questionnaires were sent with a cover letter explaining the purpose of the survey and contact information for further clarification. The Phone/Fax method involved first contacting the company to describe over the phone the purpose of the survey and to identify the name of a specific individual to whom the fax questionnaire should be addressed. The Phone/Fax/Phone method included first contacting the company via phone, then faxing the cover letter and questionnaire, and then following up with a phone call for to those who had not returned the questionnaire after one week following receipt of the questionnaire.
5.4 DATA INPUT
All completed roadside interview questionnaires and returned mail and fax survey questionnaires were entered into a Microsoft Access relational database and commodities classified into Standard Transportation Commodity Classification (STCC) codes at the four-digit level. Some commodities presented difficulty assigning to specific codes, given the closeness of many STCC codes, differing primarily with respect to degree of processing. However, significant care was taken to maintain consistency in commodity code classification for all data input.
43

44

6.0 PILOT STUDY RESULTS
6.1 PILOT STUDY I – ROADSIDE INTERVIEW RESULTS
6.1.1 Interstate highway weigh station survey
Roadside interviews were conducted at a weigh station on eastbound Interstate 84 at Cascade Locks on June 17, 2003 during the regularly scheduled hours of operation, from 7 a.m. to 2 a.m. A total of 249 questionnaires were completed out of a total truck traffic population of 2,524, as presented in Table 6.1. The capture rate of 9.8% at this roadside survey site is somewhat misleading and is not indicative of the response rate for this survey technique. The response rate for those truck operators invited to participate in the roadside interview and questionnaire was 95%, as truck drivers were very cooperative and willingly provided information.
The capture rate for a given site is constrained by the amount of available parking, the number of survey personnel available, and their capabilities to complete interviews with the volume of truck traffic passing through the weigh station.14 A limited number of vehicles can be interviewed at a given time without creating traffic disruptions and safety risks to survey personnel. The proportion of truck traffic captured will therefore undoubtedly vary by roadside interview site.
Table 6.1: Roadside survey test cell sample size and capture rate
Roadside Interview Site Truck Population
Sample Size
Number of Responses
Response Rate
Capture Rate
Highway I-84 2,524 262 249 95% 9.8% Port of Portland, Terminal 6 641 99 (est.)15 92 93% 14.4% Warehouse/Distribution Center 134 56 56 100% 42.0%
The amount of information and level of detail captured from these roadside interview questionnaires was relatively complete overall, as truck drivers provided answers to most of the survey questions. However, not all questions were answered with identical frequency, which is evident in the frequency of responses by specific question in Figure 6.1. The low frequency of
14 The truck traffic sampled at the I-84 weigh station included commercial vehicles above 16,000 lbs. but did not include those vehicles by-passing the site as part of the Commercial Vehicle Information System and Networks (CVISN), known in Oregon as the “Green Light” program. 15 The logistics for maintaining a record of all vehicles invited to participate in the survey was more challenging at the port facilities, since various personnel contacted each driver initially as opposed to one person making the initial request to participate, as was the case at the weigh station site.
45

responses to some questions points to the types of information that truck drivers were either unable or unwilling to provide in the survey.
Vehicle type information (truck configuration, number of axles and hazardous material placard) from the I-84 weigh station interviews was very complete. This is not surprising, however, given that this information was captured through visual inspection of the vehicle by survey personnel prior to addressing the truck driver. A low response on vehicle information questions would have indicated survey personnel errors and omissions. There were slightly fewer responses for trailer style at 96%, mostly due to the occasional occurrence of odd trailer styles that did not fit previously identified categories on the survey questionnaire or could not be easily described in the “other” category.
There were very high responses to questions relating to carrier information, with at least 99% response to carrier name, city and state. Somewhat fewer responses were provided for the specific carrier street address (80%) and carrier zip code (67%). In many cases, some of this information was available from the truck decal advertising the name and address of the truck carrier. However, truck drivers were less likely to know the specific street address and zip code of the carrier.
Questions concerning payload information also received very high responses. All 249 respondents indicated whether the vehicle was loaded or empty; 96% provided the empty weight of the vehicle; 97% indicated the payload weight; 96% supplied the maximum licensed weight; and 88% provided a response for commodity description. The slightly lower response for commodity description was primarily due to container traffic where often the driver did not know the contents of the container.
The two topic areas on the I-84 weigh station interview questionnaire that presented the greatest difficulty to truck operators, as compared to the port facility and the warehouse/distribution center, were trip origin and destination detail. For both the origin and destination, a high proportion of responses were provided for city (99% and 96% respectively), state (99% and 96% respectively) and facility type (95% and 90% respectively). However, considerably fewer responses were provided for the origin name (25%), origin street address (39%), origin zip code (12%), destination name (17%), destination street address (28%) and destination zip code (6%).
Those vehicles which did have the exact street address and zip code of the trip origin and destination were generally long-haul vehicles that had printed delivery and driving instructions with this information available. Local and regional delivery drivers on routine schedules or those carrying bulk agricultural and natural resource products rarely knew the specific street address or zip code of the trip origin and destination. In addition, drivers at the interstate location were less likely to dig through their paperwork to find specific origin and destination detail, whereas drivers were less hurried at the port and warehouse facilities. Trip route information did, however, generate a large proportion of responses at 99%.
Further analysis of the I-84 roadside intercept surveys revealed that respondents that originated from Oregon provided better origin data detail as compared to those respondents with out-of-state origin points. Fourteen percent of respondents originating within Oregon provided origin zip code information as compared to six percent of respondents originating from out-of-state.
46

Truck Configuration 100%
Trailer Style 96%Vehicle Information
Number of Axles 100%
Hazardous Material 100%
Carrier Name 99%
Carrier Street Address 80%
Carrier City Address 99%Carrier Information
Carrier State 100%
Carrier Zip 67%
Loaded/Empty 100%
Unloaded Weight 96%
Payload Weight 97%Payload
Max. Weight Information 96%
Commodity 88%
Origin Name 25%
Origin Street 39%
Origin City 99%Trip Origin
Origin State 99%
Origin Zip 12%
Origin Facility Type 95%
17% Destination Name
Destination Street 28% Trip Destination
Destination City 96%
Destination State 96%
6% Destination Zip
Destination Facility Type 90%
Routes Trip Route 99%
0% 25% 50% 75% 100%
Figure 6.1: Roadside interview item response – interstate highway weigh station (N=249)
47

6.1.2 Port facilities survey
The second roadside interview tested under Pilot Study I was at the Port of Portland’s T-6 marine terminal. Both inbound and outbound freight traffic occurs at this large container facility. Interviews were conducted by local service club members on July 9, 2003 between 8 a.m. and 5 p.m. Ninety-two questionnaires were completed out of a total of 641 freight vehicles entering and exiting through the port facilities, as shown in Table 6.1. This represents a capture rate of 14.4%, slightly more than the weigh station interviews on I-84.
The response rate (percentage of all truck operators who agreed when asked to participate) for this site was slightly lower, primarily due to the differences in where and how the survey was initiated between the two sites. Drivers who were asked to park at the highway weigh station were generally relieved to find out that it did not involve an enforcement action and cooperated wholeheartedly. Drivers passing through the port facilities, while still very cooperative, had slightly different expectations when asked by service club members to participate in a survey and occasionally did not wish to take the time.
Evaluation of the frequency of responses by individual survey question (Figure 6.2) reveals several similarities in certain informational areas and also a few differences when compared to responses from the highway interviews. A few minor changes were made to the questionnaire used at the port facilities to allow capture of two separate truck trips (inbound and outbound). Other than this difference, both questionnaires sought to capture the same types of freight information. As with the highway interviews, the survey conducted at the port facilities collected data on vehicle information from most of the sample. Over 89% of completed questionnaires provided data for truck configuration, trailer style, number of axles and hazardous material. This response rate was only slightly lower than in the highway interviews.
The response rate for questions about carrier information was slightly higher for interviews conducted at the port facilities, especially for carrier street name and zip code, whereas questions dealing with the payload information generated much fewer responses overall. Those specific questions which generated the greatest difficulty at the port facilities were outbound unloaded weight (57%), inbound commodity description (40%) and outbound commodity description (35%). These lower response rates are likely due to the preponderance of container traffic at the port facility relative to the highway weigh station site and the difficulty of the driver to know the container’s contents or weight.
Responses to questions dealing with trip origins and destinations were relatively high at the port facility for all questions except origin and destination zip code (11% and 20% respectively).16 The response rates for firm name, street address, city, and state for both trip origin and destination were proportionately stronger at the port facility than at the weigh station survey. This difference could be explained by the relatively fewer types and number of origins and destinations for port facility traffic, as compared to the traffic on an interstate highway. Drivers of vehicles that are on designated routes between warehouses in the Portland area and the port facility may be more likely to know the specific address detail of origins and destinations.
16 The origin zip code was asked of incoming trucks, and the destination zip code was asked of outgoing trucks. The zip code of the other end of each trip was of course known, as it was the zip code of the survey location.
48

Truck Configuration - In 91%
Truck Configuration - Out 99%Vehicle InformationTrailer Style - In 90%
Trailer Style - Out 89%
Number of Axles 100%
Hazardous Material 100%
Carrier Name 99%
Carrier Street Address 99%Carrier InformationCarrier City Address 100%
Carrier State 100%
Carrier Zip 84%
Loaded/Empty 100%
Unloaded Weight - In 85%
Unloaded Weight - Out 57%
Payload Payload Weight - In 95%Information
Payload Weight - Out 83%
Max. Weight 97%
Commodity - In 40%
Commodity - Out 35%
Origin Name 85%
Trip Origin Origin Street 79%
Origin City 85%
Origin State 85%
Origin Zip 11% Origin Facility Type 86%
Destination Name 86%
Trip DestinationDestination Street 76%
Destination City 79%
Destination State 80%
Destination Zip 20% Destination Facility Type 79%
Routes Trip Route 85%
0% 25% 50% 75% 100%
Figure 6.2: Roadside interview item response – port facility (N=92)
49
6.1.3 Warehouse/distribution center survey
The final roadside interview tested under Pilot Study I was administered at the warehouse/distribution center of a private freight trucking company within the Portland metropolitan area. The selection of the individual warehouse to participate in this roadside survey occurred through a process of contacting transportation and logistics firms from a list of customers provided by the Port of Portland. Several calls and contacts were made to different firms before reaching a company that was receptive to allowing this survey to be conducted at one of their warehouse facilities. In most all cases, those who declined to participate were concerned with safety, liability and interference with daily freight operations without any immediate gain from allowing the survey team to conduct the roadside survey. This reluctance to participate may pose a significant challenge when broadening the scope of data collection to the full metropolitan area and identifying enough firms to participate.
From a purely logistical and safety point of view, this roadside interview site was the easiest to manage and implement due to the lower volume of traffic at this site (134 trucks) and how drivers were interviewed relative to the other two roadside interview sites. Since considerably less truck traffic passed through this site as compared to the other two sites, truck drivers were less hurried and more apt to participate in the survey, given their availability of time between drops and pickups. As shown in Table 6.1, this roadside interview generated the largest response rate (100%) and the greatest capture rate (42%), when compared to the other two survey sites. A total of 56 questionnaires was completed from a total vehicle volume of 134.
Questionnaires administered at the warehouse/distribution center generated a large proportion of responses for individual questions, similar to that of the port facility and highway sites. As shown in Figure 6.3, questions related to vehicle information generated a high percentage of responses, especially for outbound truck configuration (95%), number of axles (100%) and hazardous material (100%). But the response rate to questions relating to vehicle information were slightly lower at the warehouse/distribution center when compared to the other two sites.
Responses to carrier information questions were also high for the warehouse/distribution center survey. The interviews captured 100% of responses for carrier name, carrier city address and carrier state.
Questions dealing with payload information were completed over 95% of the time at the warehouse/distribution center, the highest among all roadside interviews. This phenomenon is likely the result of fewer types and subsets of commodities that were handled at the warehouse/distribution center, as compared to the freight traffic at the port facility and interstate highway, and the lack of container traffic at this site.
50

Truck Configuration - In 88%
Truck Configuration - Out 95%Vehicle InformationTrailer Style - In 79%
Trailer Style - Out 93%
Number of Axles 100%
Hazardous Material 100%
Carrier Name 100%
Carrier Street Address 89%Carrier InformationCarrier City Address 100%
Carrier State 100%
Carrier Zip 89%
Loaded/Empty 100%
Unloaded Weight - In 98%
Unloaded Weight - Out 100%
Payload Payload Weight - In 100%Information
Payload Weight - Out 95%
Max. Weight 100%
Commodity - In 100%
Commodity - Out 100%
Origin Name 86%
Trip Origin Origin Street 61%
Origin City 93%
Origin State 93%
Origin Zip 48%
Origin Facility Type 91%
Destination Name 82%
Trip DestinationDestination Street 71%
Destination City 82%
Destination State 84%
Destination Zip 55%
Destination Facility Type 86%
Routes Trip Route 96%
0% 25% 50% 75% 100%
Figure 6.3: Roadside interview item response – warehouse/distribution center (N=56)
51

Data and information describing trip origin and destination were less complete for the warehouse/distribution center as compared to other types of questions on the survey. Less than 62 percent of respondents provided answers to trip origin street address and only 48% provided a response to origin zip code. However, this represents the largest proportion of responses to origin zip code when compared to the port facility (11%) and interstate highway (12%). Responses to destination zip code were slightly higher at 55%, also the largest proportion of responses to destination zip code as compared to port facility (20%) and interstate highway (6%).17 Trip route information was very complete for roadside interviews administered at the warehouse/distribution center, with over 96% of respondents providing a detailed trip route.
Information related to multiple stops of less-than-truck-loads (LTL), shown in Table 6.2, was also captured with all three roadside interviews. Generally, these questions generated the least response across all three locations for all survey questions. For those respondents which were LTL vehicles, none had specific zip code and very few had street information of the multiple stops; but the highway interview yielded a relatively better response rate on city and state information for multiple stops. Less than 4% of all questionnaires from all three roadside interview locations provided information related to facility name of shipment origin. Respondents provided better detail for the city and state of shipment origins (13% highway I-84, 4% port facility, 2% warehouse) but very little information related to the address of shipment destination. This level of detail provided by respondents follows the pattern of responses among non-LTL trucks.
Table 6.2: Roadside survey item response percentage to LTL origin and destination questions
Origin
Destination Roadside Interview Site
Facility Name
Street Address City State Facility
Name Street
Address City State
Highway I-84 2% 2% 13% 13% 1% 2% 10% 10% Port of Portland, Terminal 6 4% - 4% 4% - - - - Warehouse/Distribution Center 1% - 2% 2% - - - -
6.1.4 Summary observations of roadside interviews
Overall, the roadside surveys were completely successful in all facets of implementation and collecting freight data. The support and cooperation of the ODOT Motor Carrier Transportation Division, the Port of Portland and the private warehouse/distribution center’s management and operations personnel all contributed to a safe and successful data collection effort.
The recruitment and training of service club volunteers to conduct the roadside surveys was simplified, given that a previous relationship already existed between the club and the research team from prior research activities through the Strategic Freight Transportation Analysis (SFTA)
17 The origin zip code was asked of incoming trucks, and the destination zip code was asked of outgoing trucks. The zip code of the other end of each trip was of course known, as it was the zip code of the survey location.
52

project in Washington. Most club members had already participated in four previous roadside interviews and were well experienced. This lessened the need for close supervision and monitoring by quality control personnel during the survey. It is expected that significant resources and energy would be required for recruitment, training, supervision and performance monitoring of service club volunteers without prior freight survey experience. A full description of training, recruitment and performance monitoring requirements are provided in SFTA Research Report Number 2 (Clark, et al. 2002).
The general capture rate for other highway sites, port sites and warehouse/distribution locations within the Portland metropolitan area can be expected to be as good or higher overall than those specific sites tested in this pilot study. Each of the pilot study sites were selected because they represented the most difficult locations, primarily due to vehicle volume at each site.
Primary findings from the roadside interviews of Pilot Study I are as follows:
• The capture rate (number of vehicles sampled out of the total volume) is dependent upon available parking and survey personnel relative to the total truck traffic volume and undoubtedly will vary by roadside interview site.
• All three types of roadside interviews produced high response rates related to:
o Vehicle and Trailer Information o Carrier Information o Trip Route Information o Facility Type
• Roadside interviews at the warehouse/distribution center and interstate highway weigh station provided high response rates related to commodity type, while the preponderance of container traffic at the port facility limited responses on payload information.
• Obtaining specific street addresses and zip codes for trip origin and destination is very difficult for all types of roadside interviews, but the best responses were from warehouse/distribution centers.
• Finding a large number of private transportation firms to participate in warehouse/ distribution center roadside surveys may prove challenging.
6.2 PILOT STUDY II – MAIL AND FAX SURVEY RESULTS
The second data collection pilot study focused on testing mail and fax contact methods and sampling frames to obtain truck trip data for state transportation modeling and planning needs. The data collected from Pilot Study II were intended to help overcome informational deficiencies or at least supplement existing information for intra-regional freight movements. These data were focused less on specific trip information (as compared to the roadside interview questionnaires) and more directed toward freight characteristics of individual warehouses and distribution centers.
53

As described in the Chapter 5, two different mailing lists were utilized as sampling frames for both the mail and fax surveys to identify the relative gain or lift in response rate between the two different list databases. The first list – termed “Known” – originated from the Port of Portland’s database of freight facilities within the Portland metropolitan area, and with whom the port had established some prior working relationship. It was hypothesized that responses by these firms to a freight survey may be positively influenced by the previous contact with the Port. The other list – termed “Unknown” – came from the Oregon Employment Department, which maintains records for all operating businesses that are required to pay employment taxes. This database (known as the ES-202 database) was queried by NAICS codes to create a sampling frame consisting of those businesses that matched a similar freight and industry distribution as that of the Known database.
The initial sample sizes for the mail and fax surveys were determined by the number of firms in the Known list. These firms were distributed among the two contact channels (mail and fax) and the three survey methods tested within each channel, as shown in Table 6.3. To maintain consistency, identical sample sizes were selected for the Unknown list.
Table 6.3: Sample sizes for the mail and fax surveys
Contact Channel Method Known
List N Unknown
List N Straight mail 45 45 Phone/mail 47 47 Mail
Phone/mail/phone 51 51 Straight fax 45 45 Phone/fax 46 46 Fax
Phone/fax/phone 51 51
Efforts were made to verify and validate the address, phone number, and fax number of firms selected from the Known database via online directories and services. However, the limited size of the Known database prevented replacement of incorrect and invalid listings.
6.2.1 Mail survey results
Three different mail methods were tested, including:
1. Straight Mail 2. Phone/Mail 3. Phone/Mail/Phone
Each of these methods represented a different level of contact and interaction with the prospective survey participants, thus providing a measure of relative gain from added interaction and follow-up. The level contact for each of these methods was limited, since the primary information that was sought was the relative differences in response rate. The overall response rate for all methods could be expected to improve significantly with multiple follow-ups after the surveys were mailed, as is the common practice in survey research (Dillman 1978).
54

The amount of incorrect, outdated and invalid information contained in the two different mailing lists was relatively large and consistent, as shown in Table 6.4. Except for the straight mail test cells in both the Known and Unknown lists, the percentage of incorrect data was between 23 and 37 percent of the sample size. This level of invalid firms likely occurred for the straight mail test cells as well, but since no prior phone contact was made, there is no way to know if the address information was incorrect.
Surprisingly, there does not appear to be any improvement of the Known mailing list over the Unknown list. Since the database used for the Known list was current to 2002, it is not clear why the percent of incorrect or invalid information was so high. Additional analysis of the nature of the errors might help to characterize the liabilities of this approach.
Response rates, while generally low, did improve substantially with increased contact. This applies to both the Known and Unknown lists, as the total response rate moves from 27 percent with straight mail to 39 percent with phone/mail/phone in the Known sample and from 18 percent with straight mail to 41 percent with phone/mail/phone in the Unknown sample. This total response rate, however, includes those responses that indicated that they were not interested in participating in the survey or did not handle freight and likewise did not provide freight information. Thus it would appear that additional contact was associated with a higher refusal rate.
When comparing the response rates for those individuals who completed the questionnaires, the overall Known list response rate was 14 percent, compared to 10 percent with the Unknown list. No apparent gain in response rate among these completed questionnaires occurs as contact increases from straight mail to phone/mail/phone.
The proportion of survey respondents that did not respond at all was relatively high for both the Known mailing list (46 percent) and Unknown list (45 percent). Of those, about half indicated that the survey did not apply to them because they did not receive or distribute freight. In some cases, this was due to the fact that the survey had been received at the corporate headquarters and the wording on the questionnaire asked about shipments received or distributed “at this facility.” While attempts were made to have the survey forwarded to the appropriate contact at the facility which did receive or distribute freight, most declined due to time constraints.
A smaller segment of the non-respondents specifically refused to participate in the survey.18 While a few indicated that the information sought was private and confidential, this was not a common concern. This population of non-respondents represents the most fertile ground for improving response rates overall through the use of subsequent follow-up contacts through both mail and phone. A much less fertile area for increasing response rates is the group of respondents who indicated they were not interested in completing the questionnaire or did not handle freight.
18 A complete list of different reasons offered for not completing the mail and fax questionnaires is provided in Appendix D.
55

Table 6.4: Mail survey sample size and response rate, by method and list type Response Type19 Incorrect /Invalid
Information No Response Yes - responded No - declined
Total Response List Type Survey Method Initial
Sample Size
# % # % # % # % # %Straight Mail 45 3 7% 30 67% 7 16% 5 11% 12 27%Phone/Mail 47 14 30% 19 40% 4 9% 10 21% 14 30%Phone/Mail/Phone 51 14 27% 17 33% 9 18% 11 22% 20 39%
Known
Sub Total 143 31 22% 66 46% 20 14% 26 18% 46 32%
Straight Mail 45 0 0% 37 82% 6 13% 2 4% 8 18%Phone/Mail 47 11 23% 16 34% 2 4% 18 38% 20 43%Phone/Mail/Phone 51 19 37% 11 22% 6 12% 15 29% 21 41%
Unknown
Sub Total 143 30 21% 64 45% 14 10% 35 24% 49 34%
Total 286 61 21% 130 45% 34 12% 61 21% 95 33%
19 A response type of “Yes” indicates that the respondent handled freight and provided information by completing (at least partially) the questionnaire. “No” indicates that the respondent either did not handle freight or simply was not interested in completing the survey when contacted.
56

A distribution of responses to each type of survey question further reveals the depth of data obtained from that segment of respondents who completed the questionnaires. Examination of these responses may illuminate deficiencies in the data or questions which were difficult to answer. Figures 6.4 and 6.5 contain the survey item response frequencies for the Known and Unknown mail survey respondents, respectively. The total number of potential responses for each question (N) is equal to the total number of “Yes” responses in Table 6.3 (20 for Known, 14 Unknown).
Generally, those individuals who agreed to complete the questionnaire and returned it did provide answers to most of the specific questions, for both the Known and Unknown mailing lists. This finding may indicate that for those who answered the survey, the type of information requested was not so difficult as to result in a large number of skipped questions. On the other hand, the high percentage of respondents who indicated they did not have time to complete the survey may indicate that too much information was sought.
The high proportion of “No” response to both mail and fax surveys is significantly inflated due to the sizeable presence of respondents who said they did not handle freight. This type of response reveals the poor quality of the list in accurately identifying prospective respondents who handled freight and also suggests a considerably higher response rate overall, had the list been free of those firms that did not handle freight.
The pattern of responses by question type seems very consistent between the Known group (Figure 6.4) and Unknown group (Figure 6.5). Questions dealing with the nature of the warehouse facility such as total square footage, number of employees and number of loading bays received the highest percentage of responses. The questions that appeared to be most difficult to answer from the Known mailing list were number of stops for inbound shipments, specific address and route length of inbound and outbound shipments, and route information. Route information was also difficult for the Unknown list to answer, as well as trailer style of outbound shipments and the number of truckloads.
The quality and percentage of responses to routes and addresses of inbound and outbound shipments were quite low for mail surveys, as shown in Table 6.5. Respondents generally did not know the specific street address and facility name, as indicated by the low percentage of responses. Responses to city and state were considerably higher for inbound shipments of the Known sample (55% and 70% respectively) but slightly lower for outbound shipments of the Known sample (45% and 60% respectively). A wide variety of answers was provided to these address questions including “northeast United States,” “all over the United States,” and “too many to list.”
Answering the questions dealing with the route of inbound and outbound shipments likewise proved difficult, with responses like “various streets in Portland” or “not sure.” Those that did provide highway names usually responded with “I-5” or “I-84.” It is not surprising to find that survey respondents had difficulty with questions specific to the trip detail such as routes, addresses of origin and destinations, route length and number of stops. This type of information is more specific and familiar to the truck operators rather than warehouse and distribution center managers who may only have general information on trip detail.
57

Square Footage 90%
Warehouse/Facility# of Employees 100%Information
# of Loading Bays 100%
Time of Day 100%
Time of Year 95%
Commodity Description 100%
# of Truckloads 95%
Payload Weight 90%Inbound Shipment
# of Stops Information 70%
Route Length 75%
Truck Configuration 100%
Trailer Style 90%
Origin Address 70%
Route 75%
Time of Day 100%
Time of Year 95%
Commodity Description 90%
# of Truckloads 90%
Payload Weight 90%Outbound Shipment
# of Stops Information 70%
Route Length 70%
Truck Configuration 90%
Trailer Style 75%
Destination Address 65%
Route 70%
0% 25% 50% 75% 100%
Figure 6.4: Known List mail survey item response (N=20)
58

Square Footage 93%
Warehouse/Facility# of Employees 93%Information
# of Loading Bays 100%
Time of Day 93%
Time of Year 93%
Commodity Description 93%
# of Truckloads 79%
Payload Weight 93%
Inbound Shipment# of Stops 93%Information
Route Length 86%
86%Truck Configuration
Trailer Style 86%
86%Origin Address
Route 64%
Time of Day 93%
Time of Year 93%
Commodity Description 93%
# of Truckloads 71%
Payload Weight Outbound Shipment93%
Information # of Stops 79%
Route Length 86%
Truck Configuration 79%
Trailer Style 64%
Destination Address 79%
Route 64%
0% 25% 50% 75% 100%
Figure 6.5: Unknown List mail survey item response (N=14)
59

Questions related to the time of day and time of year distributions for inbound and outbound freight shipments did receive good responses. Each of these question types received over 90 percent completion rate for both the Known and Unknown mailing lists.
Table 6.5: Mail response rate to routes and address information for inbound/outbound shipments
Inbound Shipments Outbound Shipments Facility
Name Street
Address City State Route Facility Name
Street Address City State Route
Known 30% 10% 55% 70% 75% 20% 15% 45% 60% 70%
Unknown 29% 36% 64% 79% 64% 29% 14% 57% 71% 64%
6.2.2 Fax survey results
Pilot Study II also examined the use of fax questionnaires in obtaining freight data, comparable to that obtained through the mail surveys. The structure of the test cells and selection of sample size from each of the mailing lists was identical to that of the mail survey. The response rates are shown in Table 6.6.
The percentage of incorrect or invalid information for the fax survey was very similar to that of the mail survey, generally around 22 percent of sample size, and not significantly different between the Known and Unknown lists. This finding may imply that subsequent data collection efforts utilizing mail or fax surveys should first begin with a better quality list of firms engaged in freight activity with accurate and up-to-date information related to address and phone number. These results suggest that list quality alone could improve response rates by up to 20 percent.
The total response to the fax questionnaires also improved substantially with increased respondent contact through pre- and post- phone calls. The Known fax list increased from 11 to 39 percent between straight fax and phone/fax/phone whereas the Unknown list increased from 9 to 55 percent. Unfortunately, while the total response rate improved with increased contact, the percentage of “yes” or completed surveys did not improve with the Known fax list. The Unknown fax list did experience improvements from 4 to 14 percent between straight fax and phone/fax/phone for “yes” respondents. Overall, the Unknown fax list produced better responses, producing a total response rate of 34 percent compared to 27 percent with the Known fax list. As with the mail survey, increased contact appeared to be associated with an increased refusal rate.
The low response rate for completed questionnaires is likely attributable to list quality (proportion of businesses in the list that did not handle freight) and the volume of information requested (time it took to complete the questionnaire). The percentage of non-respondents was also quite high for the fax surveys, between 47 and 50 percent of sample size overall.
60

Table 6.6: Fax survey sample size and response rate, by method and list type Response Type20 Incorrect /Invalid
Information No Response Yes - responded No - declined
Total Response List Type Survey Method
Initial Sample
Size # % # % # % # % # %
Straight Fax 45 7 16% 33 73% 4 9% 1 2% 5 11%Phone/Fax 46 12 26% 21 46% 3 7% 10 22% 13 28%Phone/Fax/Phone 51 13 25% 18 35% 3 6% 17 33% 20 39%
Known
Sub Total 142 32 22% 72 50% 10 7% 28 20% 38 27%
Straight Fax 45 4 9% 37 82% 2 4% 2 4% 4 9%Phone/Fax 46 16 35% 13 28% 4 9% 13 28% 17 37%Phone/Fax/Phone 51 10 20% 13 25% 7 14% 21 41% 28 55%
Unknown
Sub Total 142 30 21% 63 44% 13 9% 36 25% 49 34%
Total 62 22% 135 47% 23 8% 64 22% 87 30%
284
20 A response type of “Yes” indicates that the respondent handled freight and provided information by completing (at least partially) the questionnaire. “No” indicates that the respondent either did not handle freight or simply was not interested in completing the survey when contacted.
61

The completeness of answered fax questionnaires was comparable to that of the mail surveys, as illustrated in Figures 6.6 and 6.7. Generally, respondents had no difficulty completing the questions related to the warehouse or distribution facility but had significant challenges at providing specific trip detail for inbound and outbound shipments. It does appear that the Known fax list provided a higher proportion of completed answers for all questions as compared to the Unknown.
Individual fax question responses to route and address information for inbound and outbound shipments were mixed. Relative to item response rates for warehouse facility and shipment payload information (Figures 6.6 and 6.7), those for specific address of origin and destinations are generally lower, as shown in Table 6.7. For outbound shipments, only 20% of the Known sample and none of the Unknown sample provided the facility name. Thirty-one percent or less provided specific street addresses for either inbound or outbound shipments. Between 20 and 70 percent provided city and state detail for inbound or outbound shipments. The Known sample provided a greater percentage of responses to the routes utilized (60% for inbound, 80% for outbound) compared to the Unknown sample (54% for inbound, 46% for outbound).
Table 6.7: Fax response rate to routes and address information for inbound/outbound shipments
Inbound Shipments Outbound Shipments Facility
Name Street
Address City State Route Facility Name
Street Address City State Route
Known 40% 20% 50% 70% 60% 20% 20% 20% 70% 80%
Unknown 8% 31% 46% 54% 54% 0% 23% 46% 54% 46%
62

Square Footage 80%
# of Employees Warehouse/Facility100%
Information # of Loading Bays 100%
Time of Day 90%
Time of Year 90%
Commodity Description 100%
# of Truckloads 90%
Payload Weight Inbound Shipment70%
Information # of Stops 60%
Route Length 70%
Truck Configuration 90%
Trailer Style 80%
Origin Address 70%
Route 60%
Time of Day 90%
Time of Year 100%
Commodity Description 90%
# of Truckloads 80%
Payload Weight 80%Outbound ShipmentInformation # of Stops 80%
Route Length 90%
Truck Configuration 80%
Trailer Style 80%
Destination Address 70%
Route 80%
0% 25% 50% 75% 100%
Figure 6.6: Known List fax survey item response (N=10)
63

100%Square Footage
Warehouse/Facility100%# of Employees
Information 77%# of Loading Bays
92%Time of Day
92%Time of Year
77%Commodity Description
62%# of Truckloads
62%Payload WeightInbound ShipmentInformation 46%# of Stops
46%Route Length
62%Truck Configuration
54%Trailer Style
54%Origin Address
54%Route
Time of Day 92%
Time of Year 92%
Commodity Description 62%
# of Truckloads 54%
Payload Weight 46%Outbound ShipmentInformation # of Stops 38%
Route Length 54%
Truck Configuration 46%
Trailer Style 38%
Destination Address 54%
Route 46%
0% 25% 50% 75% 100%
Figure 6.7: Unknown List fax survey item response (N=13)
64

6.2.3 Use of the findings for statistical purposes
Given the relatively low response rates to both mail and especially fax surveys, one may question the statistical significance or confidence of these findings, thus warranting some discussion relating to appropriate sample size and degree of confidence between the sample tests and the populations. The importance of the response rate varies, depending on the size of the population and the variance within the population across different attributes. On smaller populations, larger sample and response percentages are needed to increase the degree of certainty about the relationship of the sample response to the population. In larger populations, a smaller response rate can still be associated with a given level of confidence.
In this project the multiple tests that were simultaneously conducted meant that the population had to be broken into six samples. In an actual survey a single method would be used and a 20% response rate could include, for the Known list of 285 firms for example, about 60 firms.
The strength of the conclusions that can be drawn from these test results is based on the power of the test. In order to make any statements regarding the statistical significance of the sample observations relative to the population, knowledge of the variance around the specific questions within the questionnaire, or some economically relevant variable, is necessary in order to determine the sample confidence or that responses received do indeed reflect the population.
Unfortunately, it is difficult to make comparisons between the sample and the population without knowing the degree of variability between each of these groups (Known and Unknown) for each type of question. In a full study for the desired truck traffic analysis, it would be useful to use an additional mailing of a survey (often done in Dillman’s Total Design Method), thus allowing comparison of the first responses to what were essentially the non-responses to the first mailing. The differences can then be weighted item by item to increase the power of the information generated.
6.2.4 Summary observations for mail and fax surveys
The mail and fax surveys, while producing valuable information and results, presented more challenges in obtaining truck trip information than the roadside interviews in Pilot Study I. The primary findings from the mail and fax surveys are as follows:
• There was no measurable gain in response rate or information quality between the Known and Unknown mailing lists. Both mailing lists contained a very high percentage of incorrect and invalid information.
• Increasing contact through phone calls before and after the mail or fax contacts improved response rates overall, but not response rates of completed questionnaires. Thus increased contact was associated with increased refusal rates.
• The non-respondents accounted for 46 and 45 percent of the Known and Unknown samples, respectively, and thus represent the area where improved follow-up contact might improve response rates.
65

• Respondents who were not interested in completing the survey indicated several reasons, including the following:
o Did not handle freight; o Information was private; o Respondent too busy; and o Did not have appropriate individual to complete the questionnaire, as contact information
often was at the business headquarters and not the warehouse/distribution center.
• Those who did complete surveys provided responses for most of the questions in the survey.
• Information related to trip detail for inbound and outbound shipments was the most difficult to obtain through the mail survey.
66

7.0 CONCLUSIONS AND RECOMMENDATIONS
The results of these pilot studies offer valuable information and direction for future freight data collection efforts designed to serve the modeling and planning needs of the Oregon Department of Transportation. Below is a brief summary of these findings as they relate to the ten data attributes and characteristics defined and prioritized for state modeling and planning needs. These findings are then summarized in Table 7.1.
7.1 ORIGIN-DESTINATION DETAIL
The amount of information obtained and detail provided on trip origin and destination varied by data collection methodology employed. Roadside interviews generally provided the most complete origin-destination information, but they differed on the type of detail provided for intra- and inter- regional freight shipments. The interstate highway intercept survey, which comprised a larger proportion of inter-regional shipments relative to the warehouse and port surveys, produced excellent city and state information on shipment origins and destinations but incomplete information on street address and zip code. Roadside surveys conducted at the warehouse/distribution center and port facility provided much more complete street address and zip code information. Freight traffic at these types of facilities likely possessed a greater proportion of intra-regional movements, thereby providing modelers and planners with needed address detail for shipment origins and destinations within the metropolitan area.
Data from mail and fax questionnaires related to shipment origin and destination was less complete, especially taking into account the lower response rates. For those that did respond, most provided the city and state of shipment origins or destinations but few provided street level and zip code information.
• Roadside interviews at warehouse/distribution centers and port facilities offered the most complete detail related to street address and zip code of shipment origins and destinations.
• Roadside interviews at interstate highway locations provided excellent trip origin-destination data for city and state detail, but less complete information for street address and zip code.
• Both mail and fax questionnaires offered less complete data related to trip origin and destination, especially for street address and zip code data detail.
7.2 ROUTE IDENTIFICATION
Identification of trip routes used by inter- and intra-regional shipments was best obtained through the roadside surveys. All three roadside locations provided excellent detail on specific routes utilized for each shipment type. Roadside survey questionnaires incorporated both state and city
67

maps for highlighting the entire trip route on different streets and highways, thus capturing both inter- and intra-regional shipment types.
Mail and fax questionnaires provided less complete route detail, given that no map was provided with the questionnaire and route information consisted of a listing of highway and street names. Also, questions related to trip detail obtained relatively low responses from mail and fax questionnaires, as the individual completing the questionnaire often did not know the specific route used for inbound and outbound shipments.
• Roadside interviews provided excellent detail on trip routes for intra- and inter-regional shipments.
• Mail and fax surveys may supplement route detail, but generally provided much lower level of detail and information.
7.3 LAND USE AT STOPS
Information and data characteristics related to the facility or land use at specific freight stops was generally more complete via mail and fax surveys for the firms that participated in the survey. A significant proportion of the questionnaire focused on specific facility and land-use information (square footage, mix of inbound and outbound commodities, number of loading bays, etc.). While overall response rates were low for mail and fax surveys, questions specific to the warehouse or facility were answered in large measure. Overall response rates from the mail and fax questionnaires would likely improve with less requested information related to inbound and outbound trip detail. The amount of information provided from roadside surveys, while complete and valuable, was limited to the facility type (truck terminal, rail terminal, warehouse, etc.). Information from LTL vehicles and those making multiple stops was not obtained from either roadside surveys or mail/fax questionnaires.
7.4 COMMODITY, WEIGHT, VEHICLE TYPE/CONFIGURATION
Roadside interviews provided the greatest detail and data for description of commodity, payload weight and vehicle configuration. This was true for all roadside locations and shipment types with the exception of container shipments, for which the contents are typically unknown. Roadside interviews generally provided better detail for these data attributes. The specific questions were unique to the current shipment in progress, and recording the information from the vehicle operator yielded more accurate trip specific information compared to the survey responses from warehouse/distribution center managers, who attempted to characterize all inbound and outbound shipments in summary form. The separation of inter- and intra-regional shipment information for commodity, weight and vehicle configuration may be achieved by segmentation analysis, since each roadside interview site contained different proportions of inter- and intra-regional shipment types.
68

7.5 LOCATION OF STOPS, LOCATION OF TRIP GENERATORS, TIME OF DAY
The location of stops and trip generator data were not easily obtained from any of the tested data collection methods. Each approach presented limited data and information. Roadside interviews, while providing the most information on LTL stops was still considered incomplete, given the low item response. Information from mail and fax surveys may supplement roadside interview information, especially through the development and maintenance of a warehouse/distribution center contact/mail list. Identification of the majority of freight warehouse facilities would help inform modelers and planners of freight trip generation points and location of stops. Both roadside interviews and mail/fax surveys provided adequate time of day information for shipments. However, roadside interviews provided greater coverage of shipments, given the lower response rates associated with mail/fax surveys.
7.6 VOLUME OF SHIPMENTS
The information related to volume of shipments into and out of warehouses and distribution centers was best obtained from either mail/fax surveys or via roadside surveys at the warehouse/distribution center location. Generally, completed mail and fax surveys provided excellent information on inbound and outbound shipment volume information. While response rates ranged between 4 and 18 percent, when applied to the population of warehouses in the metropolitan area this data could provide additional modeling direction and planning focus. Also, as previously mentioned, mail and fax response rates would likely improve significantly if only information pertaining to warehouse operations were requested on future surveys. However, roadside surveys at warehouse facilities also provided excellent data for inbound and outbound shipment volumes.
Table 7.1: Performance of data collection methods in satisfying planning/modeling data needs
Roadside Interviews Mail/Fax Surveys Planning/Modeling Data Attributes Interstate Port Warehouse/Distribution
Center Mail Fax
O & D Detail Acceptable Very Good Very Good Incomplete Incomplete
Route Identification Excellent Excellent Excellent Incomplete Incomplete
Land Use at Stops Limited Limited Limited Acceptable Acceptable
Commodity, Weight, Vehicle Type/Config. Very Good Very Good Very Good Acceptable Acceptable
Location of Stops, Location of Trip Generators, Time of Day
Limited Limited Limited Incomplete Incomplete
Volume of Shipments Excellent Excellent Excellent Excellent Excellent
69
7.7 RECOMMENDATIONS
Based on the findings and conclusions drawn from the pilot studies, the investigators offer the following recommendations:
• Due to the problems associated with the existing freight facility database, additional analysis of the problems encountered would be advisable, given that the database was relatively current. A better understanding of the volatility of the information would help future researchers decide on the usability of such a list for survey purposes. If the problems encountered can be remedied, it would be a good investment for transportation agencies to create a list of freight handling firms and contact information, updated periodically and maintained, thus establishing a relationship with the major freight shippers in the metropolitan area. Establishment of a freight contact list would produce several benefits:
o Improved response rates and information from future mail/fax surveys; o Increased participation of firms to allow roadside interviews to be conducted at
warehouse facilities; and o Identification and location of trip generators and freight handling facilities.
• Data captured via the roadside interview method provide excellent trip detail for inter-regional movements (state and interstate highway locations) and also very good trip detail for intra- regional freight movements (warehouse/distribution center locations).
• Given the data requirements and needs for both modeling and planning interests for inter- and intra-regional freight movements, the primary data collection effort should be roadside interviews on highways (state and interstate), port facilities and warehouse/distribution centers. This will require the following:
o Identification of sites geographically dispersed; o Development of personal/professional relationship with commercial vehicle enforcement
officers; o Establishment of a contractual/personal relationship with area public service
organizations (e.g., Lions); and o Public notification and publicity regarding the goals and purposes of the data collection
effort.
• The selection and identification of roadside interview sites should include those that are geographically dispersed throughout the metropolitan area and provide complete inter- and intra-regional coverage of the access points within and around the Portland metropolitan area.
• Information related to specific intra-regional freight activity and warehouse operations at specific sites should be supplemented via mail/fax surveys to a pre-selected/screened list of freight handling firms.
• Any mail/fax surveys to private warehouse/distribution centers should supplement roadside interview information on intra-regional movements with an emphasis on information related
70

to freight activity at the warehouse location and not on trip detail for shipments prior to arriving or after leaving the firm’s facilities.
• Future mail/fax survey response rates may improve once the Total Design Method of the Dillman approach is implemented. When the goal is response rate maximization, rather than comparison of survey methods (as was the case in this study), all possible follow-ups should be utilized, subject to budget constraints.
• Survey questionnaires for both roadside and mail surveys should be re-structured to target that information that this study indicates is most readily available from the respective methods.
71

72

8.0 REFERENCES
Barton Aschman Associates, Inc. Truck Intercept Survey Procedures Manual. Prepared for Caltrans Alameda County. Barton Aschman Associates, Inc. March 1991.
Barton-Aschman Associates, Inc. El Paso Urban Area Travel Study, Commercial Truck Travel Survey, Draft Report. Prepared for the City of El Paso Metropolitan Planning Organization and the Texas Department of Transportation. October 1994.
Battelle, Inc. Heavy-Duty Truck Activity Data Collection and Analysis Using Global Positioning Systems. Final Report. Columbus, Ohio. 1999.
Black, W.R. Transport Flows in the State of Indiana: Commodity Database Development and Traffic Assignment: Phase 2. Transportation Research Center and Department of Geography, Indiana University. Bloomington, Indiana. 1997.
Cambridge Systematics. Portland Commodity Flow Tactical Model System: Functional Specifications. Prepared for Portland Metro, Cambridge, MA. 1998.
Casavant, Ken and Eric Jessup. Strategic Freight Transportation Analysis Full Scope of Work: SFTA Research Report #1. Department of Agricultural and Resource Economics, Washington State University. December 2002.
CATS Research News. “Chicago Area Transportation Study.” Volume 26, Number 1. February 1987.
Clark, Michael L., Eric Jessup and Ken Casavant. Strategic Freight Transportation Analysis Freight Truck Origin and Destination Study: Methods, Procedures and Data Dictionary. SFTA Research Report #2. December 2002.
Cutler, M. et al. “Assessment of Market Demand for Cross-Harbor Rail Freight Service in the New York Metropolitan Region.” Transportation Research Record, No. 1719, pp. 17-26. Transportation Research Board, National Research Council. Washington, DC. 2000.
Dillman Don A. Mail and Telephone Surveys: The Total Design Method. John Wiley & Sons, Inc. 1978.
Fischer, M., J. Ang-Olson, and A. La. “External Urban Truck Trips Based on Commodity Flows: A Model.” Transportation Research Record, No. 1707, pp. 73-80. Transportation Research Board, National Research Council. Washington, DC. 2000.
Fischer, Michael J. and Han Myong. Truck Trip Generation Data: A Synthesis of Highway Practice. NCHRP Synthesis 298. Transportation Research Board, National Research Council. Washington, DC. 2001.
73

Gillis, Bill and Ken Casavant. Washington State Freight Truck Origin and Destination Study: Methods Procedures and Data Dictionary. EWITS Research Report #3. December 1994.
Gorys, Julius. “1988 Ontario Commercial Vehicle Survey.” Transportation Research Record. No. 1313. Transportation Research Board, National Research Council. Washington, DC. 1991.
Hedges, CA. Demand forecasting and Development of a Framework for Evaluation of Urban Commodity flow: Statement of the Problem. Special Report 120: Urban Commodity Flow. Highway Research Board. Washington DC. 1971.
Krishnan, V. and K. Hancock. “Highway Freight Flow Assignment in Massachusetts Using Geographic Information Systems.” Transportation Research Record No. 1625, pp. 156-164. Transportation Research Board, National Research Council. Washington, DC. 1998.
Lau, Samuel. Truck Travel Surveys: A Review of the Literature and State-of-the-Art. Metropolitan Planning Commission, Planning Section. January 1995.
Newkirk, Jon, Ken Ericksen, and Ken Casavant. Transportation Characteristics of Wheat and Barley Shipments on Haul Roads to and from Elevators in Eastern Washington. EWITS Research Report Number 5. March 1995.
Oregon Department of Transportation. Oregon Freight Truck Commodity Flows, Analysis and Summary. Planning Section, Transportation Planning Analysis Unit. April 1998.
Rawling, Gerald F. and John P. Reilly. “CATS Commercial Vehicle Survey of 1986: A Discussion of Project Management Issues.” CATS Research News. Chicago Area Transportation Study. February 1987.
Ruiter, Earl. Development of an Urban Truck Travel Model for the Phoenix Metropolitan Area, Final Report. Arizona Department of Transportation. Prepared by Cambridge Systematics, Inc. February 1992.
SAIC and Harvey Consultants. Analysis of Freight Movements in the Puget Sound Region. Prepared for the Puget Sound Regional Council. San Diego, CA. September 1997.
Sorensen, P.C., E. Irelan, B. Winningham, and T.A. Noyes. “Skagit Countywide Air, Rail, Water, and Port Transportation System Study.” Transportation Research Record No. 1602, pp. 4-13. Transportation Research Board, National Research Council. Washington, DC. 1996.
The Port Authority of New York and New Jersey. 1991 Interstate Truck Commodity Survey. Volume 2. 1992.
Transmode Consultants, Inc. Planning for Freight Movements in the Puget Sound Region. Puget Sound Regional Council. January 1995.
U.S. Department of Transportation. 2002 Commodity Flow Survey. 2002 Economic Census. Transportation. Bureau of Transportation Statistics. Publication EC02TCF-US(P). December 2003.
74

Wilbur Smith Associates. Commercial Vehicle Survey: Final Report. Prepared for the Houston-Galveston Area Council. 1995.
Wilbur Smith Associates in Association with Reebie Associates. Multimodal Freight Forecasts for Wisconsin. 1996.
75

76

APPENDIX A: ADDITIONAL SELECTED BIBLOIGRAPHY


Additional Selected Bibliography
Blower, Daniel and Leslie C. Pettis. National Truck Trip Information Survey: UMTRI Truck Study. University of Michigan, Transportation Research Institute. Ann Arbor, MI. March 1988.
Brogan, J.D. and K.W. Heathington. An Analysis of Truck Travel Demand Forecasting Techniques and Data Requirements. University of Tennessee. Knoxville, TN. 1977.
Brogan, James D. “Development of Truck Trip-Generation Rates by Generalized Land-Use Categories.” Transportation Research Record, No. 716. pp. 38-43. Transportation Research Board, National Research Council. Washington, DC. 1979.
Brogan, James D. “Improving Truck Trip-Generation Techniques Through Trip-End Stratification.” Transportation Research Record, No. 771. Transportation Research Board, National Research Council. Washington, DC. 1980.
California Department of Transportation. San Francisco - Oakland Bay Bridge Truck Travel Study. California Department of Transportation. 1986.
California Department of Transportation. Urban Freeway Gridlock Study: Technical Report. Prepared by Cambridge Systematics, Inc. California Department of Transportation. 1988.
Chatterjee, Wegmann, Brogan, Phiu-Nual. “Estimating Truck Traffic for Analyzing UGM Problems and Opportunities.” ITE Journal. May 1979.
Christiansen, D.L. Urban Transportation Planning for Goods and Services: A Reference Guide. Federal Highway Administration, Washington, DC. 1979, 71 pp.
City of Calgary Transportation Department. Home, Truck, Taxi and External Cordon Interview Survey Procedures: Calts Update, Data Collection. City of Calgary Transportation Department. 1973-1975.
City of Portland, Office of Transportation. Columbia Corridor Transportation Study. Technical Report 2: Truck Routing Model. April 1994.
Delaware Valley Regional Planning Commission (DVRPC). “Truck Trip Generation at Intermodal Facilities in the Delaware Valley Region, DVRPC.” Philadelphia, Pa., 2000.
Federal Highway Administration. Urban Origin and Destination Surveys. U.S. Department of Transportation, Federal Highway Administration. Washington, DC. revised 1975.
Gilchrist, Kevin. “Truck Related Travel Demand Forecasting Information.” Letter to COMSIS on The MPO - Des Moines Area Metropolitan Planning Organization. June 1, 1995.
Guha, T. and C.M. Walton. “Intermodal Container Ports: Application of Automatic Vehicle Classification System for Collecting Trip Generation Data.” Transportation Research Record
A-1

No. 1383, pp. 17-23. Transportation Research Board, National Research Council. Washington, DC. 1993.
Institute of Transportation Engineers, ITE Technical Council Committee 6A-46. Truck Trip Generation Rates. A Summary Report. Institute of Transportation Engineers. Washington, DC. July 1992.
Institute of Transportation Engineers (ITE), Technical Council Committee 6A-46. Truck Terminal Trip Generation. Institute of Transportation Engineers. Washington, DC. 1995.
Institute of Transportation Engineers (ITE). Trip Generation. 6th ed., Institute of Transportation Engineers. Washington, DC. 1997.
Institute of Transportation Engineers (ITE). Trip Generation Handbook. Institute of Transportation Engineers. Washington, DC. 1998.
Jack Faucett Associates. Greater Buffalo-Niagara Regional Transportation Council Goods Movement Study. Prepared for the Greater Buffalo-Niagara Regional Transportation Council. Buffalo, NY. 1999.
List, George F. and Mark A. Turnquist. Goods Movement: Regional Analysis and Database. Region II, University Transportation Research Center, New York. 1993.
List, George F. and Mark A. Turnquist. “Estimating Multi-Class Truck Flow Matrices in Urban Areas.” Paper presented at the Transportation Research Board Annual Meeting. January 1994.
List George F. and Mark A. Turnquist. “Estimating Truck Travel Patterns In Urban Areas.” Transportation Research Record, No. 1430. Transportation Research Board, National Research Council. Washington, DC. 1994.
List, Turnquist, Mbwana, Wolpert. Analysis of a Dedicated Commercial Transportation Corridor in the New York Metropolitan Area. Rensselaer Polytechnic Institute. January 1995.
Memmott and Boekenbroeger. “Practical Methodology for Freight Forecasting.” Transportation Research Record, No. 889, pp. 1-7. Transportation Research Board, National Research Council. Washington, DC. 1982.
Middendorf, Jelavich & Ellis. “Development and Application of Statewide, Multimodal Freight Forecasting Procedures for Florida.” Transportation Research Record, No. 889. Transportation Research Board, National Research Council. Washington, DC. 1982.
Nixon, Tom. Truck Trip Generation Rates by Land Use in the Central Artery/Tunnel Project Study Area. Central Transportation Planning. Boston, MA. September 1993.
Oak Ridge National Laboratory. 1990 Nationwide Truck Activity and Commodity Survey Summary Report. Prepared for the Federal Highway Administration, U.S. Department of Transportation, by Statistics and Data Analysis Group, Center for Transportation Analysis, Energy Division, Oak Ridge National Laboratory. Oak Ridge Tennessee. 1993.
A-2

Ogden, K.W. Urban Goods Movement: A Guide to Policy and Planning. Ashgate Publishing Co. Brookfield, VT. 1992. 417 pp.
Park, M.-B. and R.L. Smith, Jr. “Development of a Statewide Truck-Travel Demand Model with Limited Origin-Destination Survey Data.” Transportation Research Record No. 1602, pp. 14-21. Transportation Research Board, National Research Council. Washington, DC. 1996.
Parsons Brinckerhoff Quade & Douglas, Inc. The Second Generation Michigan Statewide Truck Travel Demand Forecasting Model. Draft for Review. Prepared for the Travel Demand Analysis Section of the Michigan Department of Transportation. Lansing, Mich. September 21, 1998.
Ramakrishna and Balbach. “Truck Trip Generation Characteristics of Nonresidential Land Uses.” ITE Journal. July 1994.
Rawling, Gerald F. and Eugene Ryan. “The Role of a Commercial Vehicle Survey in Transportation Planning for Northeast Illinois.” CATS Research News. Chicago Area Transportation Study. February 1987.
Rawling, Gerald F. “Urban Goods, Movement Planning in the Chicago Region.” Paper presented at the 67th annual meeting of the Transportation Research Board. Washington DC. January 1988.
Rawling, Gerald F. “Information Needs for Policy, Planning and Design.” Goods Transportation in Urban Areas. Proceedings of the Fifth Conference sponsored by the Engineering Foundation. Santa Barbara, California. March 1988.
Rawling, Gerald F. and Robert DuBoe. “Application of Discrete Commercial Vehicle Data to CATS' Planning and Modeling Procedures.” CATS Research News. Vol #28.1. Chicago Area Transportation Study. Spring 1991.
Schlappi, Marshall, and Itamura. “Truck Travel in the San Francisco Bay Area.” Transportation Research Board 72nd Annual Meeting. Paper No. 930477. January 1993.
Sorratini, J.A. and R.L. Smith, Jr. “Development of a Statewide Truck Trip Forecasting Model Based on Commodity Flows and Input-Output Coefficients.” Transportation Research Record No, 1707, pp. 49-55. Transportation Research Board, National Research Council. Washington, DC. 2000.
Sosslau, Hassam, Carter, and Wickstrom. Quick-Response Urban Travel Estimation Techniques and Transferable Parameters User's Guide. National Cooperative Highway Research Program Report 187. Transportation Research Board, National Research Council. Washington, DC. 1978.
Southern California Association of Governments. Urban Goods Movement Study – Working Paper VI: For-Hire Truck Freight Bill Survey. SCAG and the California Department of Transportation. 1979.
A-3

Southeast Michigan Council of Governments. “Recommended Truck Travel Survey Method.” Memorandum to Survey Team Members from Bob Newhouser. Southeast Michigan Council of Governments. January 1993.
State of North Carolina Department of Transportation. Triad Regional Study, Draft Report on Commercial Vehicle Survey. Commercial Vehicle Pretest Results. January 1995.
Tadi, R.R. and P. Balbach. “Truck Trip Generation Characteristics of Nonresidential Land Uses.” ITE Journal, Vol. 64, No. 7, 1994, pp. 43-47.
Thornton, M., et al. “Development of Urban Commercial Vehicle Travel Model and Heavy-Duty Vehicle Emissions Model for Atlanta Region.” Presented at the 77th Annual Meeting of the Transportation Research Board. Washington, DC. January 1998.
Transportation Consulting Group. External Origin and Destination Survey. Kentuckiana Regional Planning and Development Agency. February 1995.
University of Illinois. Motor Freight Planning for the Chicago Region. Transportation Planning Group, Department of Civil Engineering, University of Illinois, Champaign-Urbana. 1983.
Watson, Peter L. Urban goods movement: a disaggregate approach. Lexington Books. Lexington, MA. 1975.
Wegmann, F.J., A. Chatterjee, and M.E. Lipinski. Characteristics of Urban Freight Systems (CUFS). Preliminary Review Draft. Transportation Center, University of Tennessee. November 1994.
Wegmann, F.J., A. Chatterjee, M.E. Lipinski, B.E. Jennings, and R.E. McGinnis. Characteristics of Urban Freight Systems. Federal Highway Administration. Washington, DC. 1995, 410 pp.
Wilbur Smith Associates. “I-235 Alternatives Analysis and EIS.” Iowa DOT, Technical Memorandum Number 1. 1991.
Zavattero, David and Sidney Weseman. “Commercial Vehicle Trip Generation in the Chicago Region.” Transportation Research Record, No. 1407. October 1993.
A-4

APPENDIX B: ROADSIDE INTERCEPT TRUCK SURVEY FORM


NOTE: Original interview form was printed on larger paper. Record #:
[for data entry use] CONFIDENTIAL
Oregon Department of Transportation Roadside / Intercept Truck Survey
Survey Date: June 16, 2003 (Month/Day/Year)
1) Survey Location: Cascade Locks 2) Name of Interviewer:
AM PM 3) Time of Interview:
4) Truck Configuration [Please Check Only One]
5) Trailer Style [If Appropriate, Check More Than One]
1. □ Straight Truck 1. □ Van (Without Temperature Control)
2. □ Straight Truck and Trailer 2. □ Van (With Temperature Control)
3. □ Tractor Only 3. □ Flatbed
4. □ Tractor and Trailer 4. □ Car Carrier
5. □ Tractor with two Trailers 5. □ Hopper
6. □ Tractor with three Trailers 6. □ Stake and Rack
7. □ Other: 7. □ Concrete Mixer
8. □ Tanker
9. □ Float
10. □ Dump
11. □ Container
12. □ Chip
13. □ Animal Carrier
14. □ Logging
15. □ Other:
# of Axles on
Truck or Tractor
# of Axles on1st Trailer
# of Axles on2nd Trailer
# of Axles on 3rd Trailer
6) Number of Axles on the Ground:
7) Is a Hazardous Material Placard Displayed? □ No □ Yes If Yes,
ID #:
8) Carrier Name:
Street:
City: 9) Carrier Home Base Address:
State: Zip Code:
B-1

LOADED EMPTY
10) Is this vehicle LOADED or EMPTY? □ □
11) What is the Unloaded Weight of this Vehicle?
Lbs
. [OR] Kgs.
12) What is Your Estimated Payload Weight? [Weight of cargo only, Please enter 0 if the rig is EMPTY]
Lbs. [OR] Kgs.
13) What is the Registered Maximum Weight of this Vehicle?
Lbs. [OR] Kgs.
14) What is the Major Commodity on Board? [Please fill out the following section COMPLETELY]
Where Did THIS TRIP Begin? Where Will THIS TRIP End? Address:
Address:
City:
City:
15)
State/Province:
18)
State/Province:
16) Facility / Land Use Type: 19) Facility / Land Use Type: 1. □ Truck Terminal 1. □ Truck Terminal 2. □ Rail Terminal 2. □ Rail Terminal 3. □ Marine Terminal 3. □ Marine Terminal 4. □ Air Terminal 4. □ Air Terminal 5. □ Factory 5. □ Factory 6. □ Warehouse/Distribution Center 6. □ Warehouse/Distribution Center 7. □ Farm 7. □ Farm 8. □ Point of Sale/Consumption/Retail Locations 8. □ Point of Sale/Consumption/Retail Locations 9. □ Other: 9. □ Other:
17) If LTL, List Destination Address Cities, States/Provinces:
20) If LTL, List Destination Address Cities, States/Provinces:
Address:
Address:
City:
City:
State/Province:
State/Province:
#1
#1
Address: Address:
City: City:
State/Province: State/Province:
#2
#2
Address: Address:
City: City:
State/Province: State/Province:
#3
#3
[Please Go to Question #18] [Please Go to Question #21]
21) Please Identify the Oregon Highways and Portland Area Roadways Used to Travel from the Listed Origin to Destination on the Attached Maps.
B-2

NOTE: Original map was printed on larger paper.
B-3


APPENDIX C: WAREHOUSE/DISTRIBUTION CENTER
MAIL/FAX SURVEY FORM


Warehouse / Distribution Center Freight Truck Survey
The Oregon Department of Transportation (ODOT) is seeking improved methods to address freight transportation needs and has contracted with Washington State University to obtain information on freight movements for businesses handling freight in the Portland metropolitan/urban area. This information will help ODOT to better understand the needs of the freight industry and plan for improvements that will benefit the freight transportation system. We will treat your responses as strictly confidential. The data you have provided will NOT be identified with your firm. It will be averaged with other survey responses to help provide ODOT with a more accurate picture of freight movements in the Portland area. Please provide the information requested below and return this questionnaire in the postage-paid envelope provided. To obtain a mailed copy of the survey results, please check here.
Principal Investigators:
Ken Casavant and Eric Jessup 103 Hulbert Hall
Pullman, WA 99163 509-335-1608 / 509-335-5558
July 2003
C-1

Warehouse / Distribution Center Freight Truck Survey
1) Company Name:
«Company_Name»
2) Address
Street:«Address»
City:«City» State: «City» Zip:«Zip» 3)
Name of Person Completing the Survey: «Contact» Phone # «Phone»
Please answer the following questions regarding typical freight activity at this location:
4) Is freight received/distributed at this facility? Yes No (If no, return in enclosed envelope.)
5) What is the approximate square footage of this facility? Sq. ft.
6) How many loading bays does your facility have? Bays
7) How many employees work at this facility? Employees
8)
In the tables below, please indicate the percentage of INBOUND and OUTBOUND shipments received throughout the day. Please make sure the percentages sum to 100% for each table.
INBOUND SHIPMENTS
Arrival Time 6 AM – 9 AM 9 AM – 3 PM 3 PM – 6 PM 6 PM – 10 PM 10 PM – 6 AM Total
Percentage 100%
OUTBOUND SHIPMENTS
Departure Time 6 AM – 9 AM 9 AM – 3 PM 3 PM – 6 PM 6 PM – 10 PM 10 PM – 6 AM Total
Percentage 100%
C-2

9) In the tables below, please indicate the percentage of INBOUND and
OUTBOUND shipments received throughout the year. Please make sure the percentages sum to 100% for each table.
INBOUND SHIPMENTS
Season Jan-Feb Mar-Apr May-Jun Jul-Aug Sept-Oct Nov-Dec Total
Percentage 100%
OUTBOUND SHIPMENTS
Season Jan-Feb Mar-Apr May Jun Jul-Aug Sept-Oct Nov-Dec Total
Percentage 100%
For the following pages, please refer to the code table below.
Truck
Configuration Code
Truck ConfigurationDescription
TrailerStyleCode
Trailer Style Description
1. Straight Truck 1. Van (No Temperature Control)
2. Straight Truck and Trailer 2. Van (With Temperature Control)
3. Tractor Only 3. Flatbed
4. Tractor and Trailer 4. Car Carrier
5. Tractor with two Trailers 5. Hopper
6. Tractor with three Trailers 6. Stake and Rack
7. Other (please describe): 7. Concrete Mixer
8. Tanker
9. Float
10. Dump
11. Container
12. Chip
13. Animal Carrier
14. Logging
15. Other (Please Describe):
C-3

10) Please provide information regarding the Origins of your most common
commodities. Identify the typical truck configuration and trailer style using the corresponding number from the table on page 3.
Inbound Shipments Shipment Information
Commodity Description
Number of Truckloads per Week
Avg. Payload Wt.
per Load (lbs)
Average Number of Stops per
Trip
Average Length of
Route (miles)
C-4

Note: You may list a commodity more than once, with different origins, if you receive from multiple locations.
Truck Information Origin
Typical Truck
Configuration (Codes)
Typical Trailer Style
(Codes)
Origin Street Address / Location
Typical Routes /
Highways Used
C-5

11) Please provide information regarding the Destinations of your most common
commodities. Identify the typical truck configuration and trailer style using the corresponding number from the table on page 3.
Outbound Shipments Shipment Information
Commodity Description Number of Truckloads per Week
Avg. Payload Wt.
per Load (lbs)
Average Number of Stops per
Trip
Average Length
of Route (miles)
C-6

Note: You may list a commodity more than once, with different destinations, if you ship to multiple locations.
Truck Information Destination
Typical Truck
Configuration (Codes)
Typical Trailer Style
(Codes)
Destination Street Address / Location
Typical Routes /
Highways Used
C-7

End of Survey
Thank you for participating in this survey.
C-8

APPENDIX D: REASONS GIVEN FOR NOT COMPLETING
MAIL/FAX SURVEY


Reasons provided by non-respondents for not completing mail/fax surveys
• Did not handle freight, and therefore questionnaire not applicable.
• Fax machine cut off a portion of the questionnaire.
• Respondents had difficulty understanding how the information would be utilized and how that would improve their business.
• No time to complete the survey.
• The name of the company printed on the questionnaire was the name of the company previously located at that address and therefore did not apply to them.
• Information deemed private and confidential.
• Respondent did not utilize I-5 or I-84 for inbound and outbound shipments and therefore did not believe his business was part of the area of interest.
• One respondent refused due to the fact that WSU was doing the research for an Oregon project. He indicated research should have been conducted at an Oregon school.
• A few respondents indicated that they had just completed a survey for ODOT and the Port of Portland.
• Several respondents believed that they were being contacted by telemarketers and would simply hang-up the phone.
• A few air and rail companies indicated that the majority of their movements do not even utilize the highways and are therefore not relevant.
D-1