Tropical Storm Cristobal - National Hurricane Center
51
NATIONAL HURRICANE CENTER TROPICAL CYCLONE REPORT TROPICAL STORM CRISTOBAL (AL032020) 1–9 June 2020 Robbie Berg National Hurricane Center 13 January 2021 PHOTO OF TROPICAL STORM CRISTOBAL TAKEN FROM THE INTERNATIONAL SPACE STATION ON JUNE 8, 2020 (IMAGE COURTESY OF NASA AND ASTRONAUT CHRIS CASSIDY [@ASTRO_SEAL]) Tropical Storm Cristobal, in conjunction with a larger weather system over Central America and Tropical Storm Amanda over the eastern Pacific Ocean, produced significant rainfall and flooding over portions of Central America and southeastern Mexico. Cristobal then went on to affect portions of the central U.S. Gulf coast with tropical-storm-force winds, significant storm surge, and heavy rainfall. Cristobal took the lives of six people in the United States and Mexico.
Transcript of Tropical Storm Cristobal - National Hurricane Center

NATIONAL HURRICANE CENTER TROPICAL CYCLONE REPORT
TROPICAL STORM CRISTOBAL (AL032020) 1–9 June 2020
Robbie Berg National Hurricane Center
13 January 2021
PHOTO OF TROPICAL STORM CRISTOBAL TAKEN FROM THE INTERNATIONAL SPACE STATION ON JUNE 8, 2020 (IMAGE
COURTESY OF NASA AND ASTRONAUT CHRIS CASSIDY [@ASTRO_SEAL])
Tropical Storm Cristobal, in conjunction with a larger weather system over Central
America and Tropical Storm Amanda over the eastern Pacific Ocean, produced significant rainfall and flooding over portions of Central America and southeastern Mexico. Cristobal then went on to affect portions of the central U.S. Gulf coast with tropical-storm-force winds, significant storm surge, and heavy rainfall. Cristobal took the lives of six people in the United States and Mexico.

Tropical Storm Cristobal 2
Tropical Storm Cristobal 1–9 JUNE 2020
SYNOPTIC HISTORY In late May, a Central American gyre1 developed and became centered near the Mexico/Guatemala border, while Tropical Storm Amanda concurrently formed over the far eastern North Pacific off the coasts of Guatemala and El Salvador. Amanda moved northeastward within the gyre and made landfall on the Pacific coast of Guatemala on 31 May, with its center dissipating over the mountainous terrain of that country late in the day. The remnant low pressure area continued to rotate northward and then northwestward across northern Guatemala and southeastern Mexico within the Central American gyre, emerging over the Bay of Campeche south of the city of Campeche, Mexico, around midday on 1 June. The low acquired a well-defined center and sufficiently organized deep convection soon after moving over water, marking the regeneration2 of a tropical depression at 1800 UTC 1 June about 35 n mi southwest of Campeche. The depression moved generally westward over the Bay of Campeche and strengthened to a tropical storm by 1200 UTC 2 June while centered about 65 n mi northwest of Ciudad del Carmen, Mexico. The “best track” chart of the tropical cyclone’s path is given in Fig. 1, with the wind and pressure histories shown in Figs. 2 and 3, respectively. The best track positions and intensities are listed in Table 13.
Because Tropical Storm Cristobal was still embedded within the Central American gyre, it proceeded to make a slow counterclockwise loop over the Bay of Campeche and southeastern Mexico over the next several days, initially moving slowly southward and then southeastward on 2 and 3 June after becoming a tropical storm. Cristobal gradually strengthened during that period while over the warm waters of the Bay of Campeche, and it reached an estimated peak intensity of 50 kt by 0600 UTC 3 June. The storm maintained that intensity through landfall, which occurred around 1300 UTC near the town of Atasta, Mexico, just to the west of Ciudad del Carmen. Cristobal gradually weakened while it moved southeastward across the states of Campeche and Tabasco, and it became a tropical depression by 1200 UTC 4 June just before reaching the Guatemala border. The center continued on its counterclockwise track, moving eastward and then northeastward across far northern Guatemala and back over Mexico late on 4 June and early on 5 June.
1 A Central American gyre (CAG) is a broad lower-tropospheric cyclonic circulation occurring near Central America. For more information, please refer to Papin, P., L. F. Bosart, R. D. Torn, 2017: A Climatology of Central American Gyres. Mon. Wea. Rev., 145, 1983–2000. http://journals.ametsoc.org/doi/pdf/10.1175/MWR-D-16-0411.1 2 Protocol dictates that if the remnants of a former tropical cyclone regenerate in a new basin, the regenerated tropical cyclone is given a new designation. Since Amanda dissipated over Central America, the regenerated tropical cyclone was designated with the next name on the Atlantic list, Cristobal. (National Hurricane Operations Plan, Office of the Federal Coordinator for Meteorological Services and Supporting Research (OFCM)). 3 A digital record of the complete best track, including wind radii, can be found on line at ftp://ftp.nhc.noaa.gov/atcf. Data for the current year’s storms are located in the btk directory, while previous years’ data are located in the archive directory.

Tropical Storm Cristobal 3
On the morning of 5 June, winds increased to tropical storm force in the eastern part of Cristobal’s circulation along the eastern coast of the Yucatan Peninsula, and it is estimated that the system restrengthened to a tropical storm at 0600 UTC, even though its center was still over land about 80 n mi south-southeast of Campeche. Cristobal then turned northward, and its center remained over land for another 12 to 15 h before re-emerging over the southern Gulf of Mexico near Progreso, Mexico, late on 5 June. Cristobal’s maximum winds continued to increase in a convective band over the waters north of the Yucatan Peninsula even before the center re-emerged over the Gulf of Mexico, and the storm reached another estimated peak intensity of 50 kt at 0000 UTC 6 June while centered about 45 n mi north-northwest of Progreso.
Cristobal’s maximum winds decreased slightly to 45 kt by 1200 UTC 6 June while the storm moved northward across the central Gulf of Mexico through a break in the subtropical ridge. Even though deep-layer shear over the Gulf of Mexico was relatively low and sea surface temperatures were between 27°C and 28°C, Cristobal’s broad structure, and possibly some dry air in the middle levels of the atmosphere, did not favor re-intensification. Consequently, the cyclone’s intensity held steady at 45 kt until landfall in Plaquemines Parish, Louisiana, just east of Grand Isle, around 2200 UTC 7 June. A blocking high caused Cristobal to slow down and turn northwestward while its center moved across the New Orleans metropolitan area, and the cyclone weakened to a tropical depression by 1200 UTC 8 June when it was centered near the Louisiana/Mississippi border about 10 n mi west-northwest of Natchez, Mississippi.
An advancing deep-layer trough over the Rocky Mountains pushed the blocking high eastward, and Cristobal subsequently moved northward and north-northeastward across Arkansas, Missouri, and southeastern Iowa on 8 and 9 June. Cristobal was absorbed within the trough and became an extratropical low by 0000 UTC 10 June while centered about 15 n mi north-northwest of Dubuque, Iowa, just before crossing the border into Wisconsin. During 10 June, the extratropical low turned northeastward across Wisconsin, the Upper Peninsula of Michigan, and eventually Ontario, Canada, producing gale-force winds across portions of Lake Superior and Lake Michigan. The low then slowed down and meandered when it reached southern Hudson Bay on 11 June, and it dissipated soon after 0600 UTC 12 June about 30 n mi south-southwest of Wemindji, Quebec.
METEOROLOGICAL STATISTICS Observations in Cristobal (Figs. 2 and 3) include subjective satellite-based Dvorak technique intensity estimates from the Tropical Analysis and Forecast Branch (TAFB), and objective Advanced Dvorak Technique (ADT) estimates and Satellite Consensus (SATCON) estimates from the Cooperative Institute for Meteorological Satellite Studies/University of Wisconsin-Madison. Observations also include flight-level, stepped frequency microwave radiometer (SFMR), and dropwindsonde observations from seven flights of the 53rd Weather Reconnaissance Squadron of the U.S. Air Force Reserve Command and two flights of the NOAA Aircraft Operations Center (AOC) WP-3D aircraft. Data and imagery from NOAA polar-orbiting satellites including the Advanced Microwave Sounding Unit (AMSU), the NASA Global Precipitation Mission (GPM), the European Space Agency’s Advanced Scatterometer (ASCAT),

Tropical Storm Cristobal 4
and Defense Meteorological Satellite Program (DMSP) satellites, among others, were also useful in constructing the best track of Cristobal.
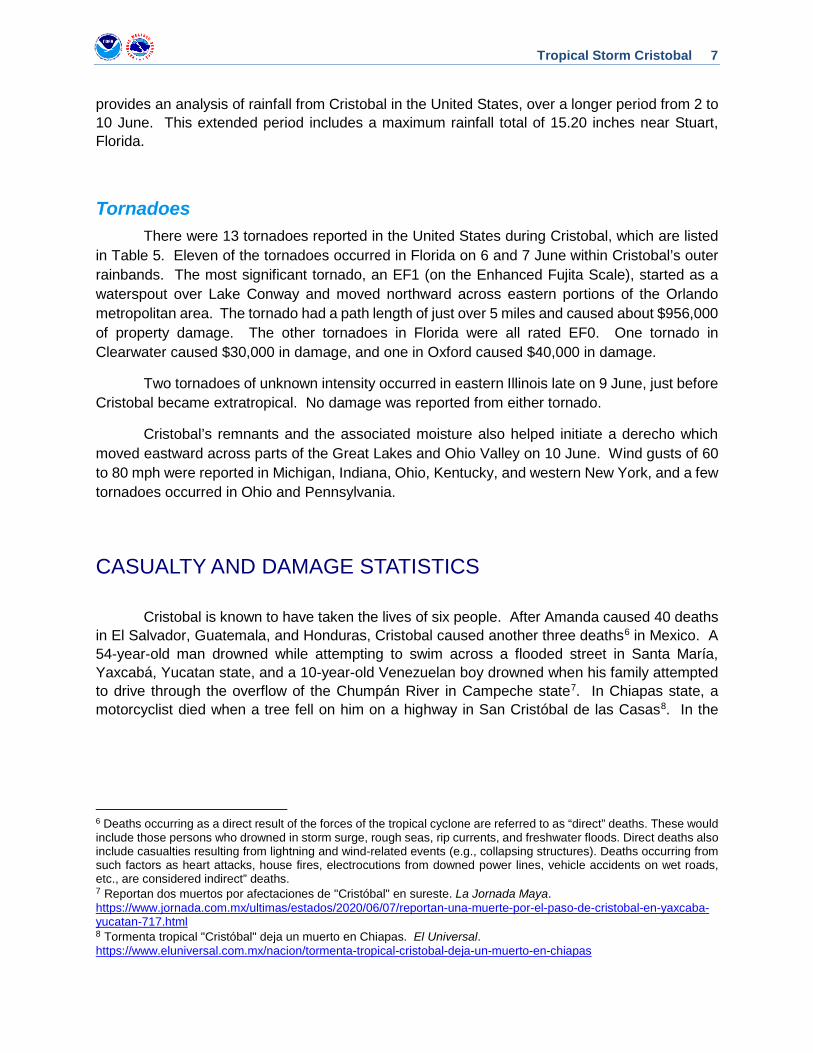
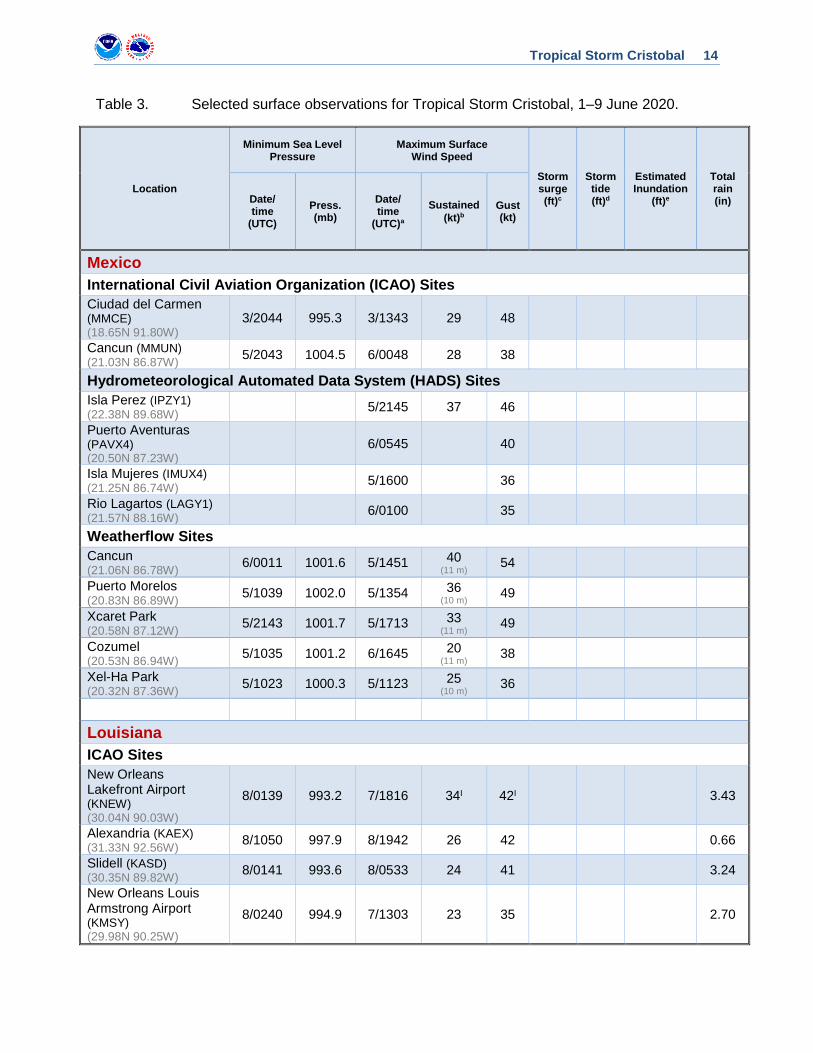
Ship reports of winds of tropical storm force associated with Cristobal are given in Table 2, and selected surface observations from land stations and data buoys are given in Table 3. Rainfall totals from southeastern Mexico and Central America are provided in Table 4.
Winds and Pressure Cristobal’s first estimated peak intensity of 50 kt from 0600 UTC until landfall at 1300 UTC 3 June along the coast of Mexico is based on a blend of a peak 850-mb flight-level wind of 55 kt (which adjusts to about 45 kt at the surface) and SFMR-measured winds of 52 kt. Height-adjusted winds of 45 to 50 kt were measured at a couple of Mexican oil rigs early on 3 June and also support Cristobal’s estimated peak intensity of 50 kt.
Surface observations and scatterometer data indicate that Cristobal regained tropical storm status while its center was still over southeastern Mexico, with tropical-storm-force winds occurring along the eastern coast of the Yucatan Peninsula on the morning of 5 June. A Weatherflow station at Cancun measured a sustained wind of 40 kt at 1451 UTC, while an ASCAT pass around the same time showed surface winds as high as 38 kt.
Cristobal’s second estimated peak intensity of 50 kt north of the Yucatan Peninsula is based on a peak 850-mb flight-level wind of 68 kt (which adjusts to about 54 kt at the surface) and an SFMR wind of 52 kt, which were measured in a convective band by an Air Force Reserve aircraft as it began heading back to base at the end of its mission early on 6 June. These data allow for the possibility that the peak intensity was even a little higher than 50 kt, but the aircraft’s sampling within the convective environment well away from the center of circulation argues that higher measurements may not be as representative of the cyclone’s intensity.
Cristobal’s estimated intensity of 45 kt at its landfall on the Louisiana coast at 2200 UTC 7 June is based on aircraft reconnaissance data from earlier that morning, surface observations from southeastern Louisiana and southern Mississippi, and NWS Doppler radar velocity data. During the Air Force Reserve Hurricane Hunter mission that morning, the plane measured a peak 1000-ft flight-level wind of 62 kt (which adjusts to about 47 kt at the surface) and a surface wind of 41 kt from the SFMR. Later that day, an observing site on Ship Island, Mississippi, measured a peak sustained wind of 42 kt at a height of 12 m at 2107 UTC. Adjusted WSR-88D velocity data from Slidell, Louisiana, suggested that peak surface winds were likely between 40 and 50 kt, but some of the strongest winds aloft may not have been mixed to the surface due to a lack of strong convection. The combination of these data supports an estimated intensity of 45 kt at landfall.
Due to Cristobal’s broad nature as it moved to the north, its minimum central pressure did not occur coincidently with its maximum winds. The storm’s central pressure fell to 990 mb just before landfall along the coast of Louisiana, with an observing station at Bayou Bienvenue reporting a pressure of 990.4 mb at 0043 UTC 8 June. Cristobal’s central pressure rose slightly after landfall but began to fall again at the beginning of extratropical transition and reached 988 mb just before the transition was complete.

Tropical Storm Cristobal 5
Tropical-storm-force winds likely occurred over portions of the Mexican states of Campeche, Tabasco, and possibly northern Chiapas. However, sustained tropical-storm-force winds were not reported at any observing sites in those states. A gust to 48 kt occurred at Ciudad del Carmen the morning of 3 June soon after Cristobal made landfall. Sustained tropical-storm-force winds were reported along the east coast of the state of Quintana Roo, with Weatherflow sites at Cancun and Puerto Morelos reporting sustained winds of 40 kt and 36 kt, respectively, on the morning of 5 June. The Cancun station also reported a wind gust of 54 kt. A sustained wind of 37 kt was reported on Isla Perez, a small island off the north coast of the Yucatan Peninsula, later that day.
In the United States, Cristobal produced sustained tropical-storm-force winds across portions of southeastern Louisiana, southern Mississippi, southern Alabama, and the far western Florida Panhandle late on 7 June and early on 8 June (Fig. 4). The highest sustained winds reported in each state at a standard (or near-standard) 10-m height were 34 kt at New Orleans Lakefront Airport and Shell Beach, Louisiana; 42 kt at Ship Island, Mississippi; 41 kt at Middle Bay Lighthouse, Alabama; and 35 kt at Panama City Beach, Florida. A wind gust to 56 kt was measured at the Ship Island station.
Storm Surge4 Even though Cristobal made landfall in Louisiana as a 45-kt tropical storm, it produced significant storm surge flooding along portions of the northern Gulf coast due to its large size and that area’s vulnerability to storm surge as a result of a shallow nearshore bathymetry. The highest measured storm surge from Cristobal was 6.16 ft above normal tide levels at a NOAA National Ocean Service (NOS) gauge at Shell Beach, Louisiana.
The combination of the surge and tides produced inundation levels of 3 to 6 ft above ground level along the coasts of southeastern Louisiana, Mississippi, and Alabama. Figure 5 shows maximum water levels measured from NOS tide gauges referenced as feet above Mean Higher High Water (MHHW), which is used as a proxy for inundation on normally dry ground along the immediate coastline. The Shell Beach gauge on Lake Borgne in Louisiana measured a peak water level of 6.2 ft MHHW. Storm surge was also pushed into Lake Pontchartrain, with the NOS gauge at the Interstate-10 Bonnet Carre Floodway measuring a peak water level of 4.6 ft MHHW. Along the Mississippi coast, a peak water level of 5.7 ft MHHW was measured by an NOS gauge at the Bay Waveland Yacht Club, and a maximum of 3.8 ft MHHW was measured along the Alabama coast by an NOS gauge at Coast Guard Sector Mobile.
4 Several terms are used to describe water levels due to a storm. Storm surge is defined as the abnormal rise of water generated by a storm, over and above the predicted astronomical tide, and is expressed in terms of height above normal tide levels. Because storm surge represents the deviation from normal water levels, it is not referenced to a vertical datum. Storm tide is defined as the water level due to the combination of storm surge and the astronomical tide, and is expressed in terms of height above a vertical datum, i.e. the North American Vertical Datum of 1988 (NAVD88) or Mean Lower Low Water (MLLW). Inundation is the total water level that occurs on normally dry ground as a result of the storm tide, and is expressed in terms of height above ground level. At the coast, normally dry land is roughly defined as areas higher than the normal high tide line, or Mean Higher High Water (MHHW).

Tropical Storm Cristobal 6
Minor coastal flooding of 1 to 3 ft above ground level also occurred along the Louisiana coast west of the mouth of the Mississippi River and along portions of the Florida Panhandle coast. A peak water level of 3.0 ft MHHW was measured by the NOS gauge at Berwick on the Atchafalaya River in Louisiana, and in Florida, an NOS gauge at Pensacola measured a peak water level of 2.6 ft MHHW.
Rainfall and Flooding Significant heavy rainfall occurred over portions of Central America and southeastern
Mexico over a nine-day period (29 May–7 June) due to Tropical Storm Cristobal, eastern Pacific Tropical Storm Amanda, and the Central American gyre that both cyclones were embedded in. Table 4 provides selected rainfall totals for the entire event, while Figure 6 provides an analysis of the total rainfall over southeastern Mexico and Central America.
In Mexico, the most significant rainfall occurred in the states of Yucatan, Campeche, Tabasco, and Chiapas. During the period of Cristobal (1–6 June), the maximum rainfall totals recorded in each state were 24.54 inches (623.3 mm) at Valladolid, Yucatan; 24.09 inches (611.9 mm) at Ocotepec, Chiapas; 22.32 inches (566.9 mm) at Hopelchén, Campeche; and 16.02 inches (406.9 mm) at Boca del Cerro, Tabasco. A maximum of 11.01 inches (279.7 mm) was also measured in the state of Veracruz near the city of Coatzacoalcos. For the entire combined event, covering the period from 28 May to 6 June, maximum rainfall accumulations of 34.80 inches (883.9 mm) and 30.89 inches (784.6 mm) were recorded at Ocotepec and Sayula, respectively, in the state of Chiapas. Amounts greater than 25 inches (650 mm) were also recorded at several sites in the states of Campeche and Yucatan.
High rainfall totals occurred over parts of Central America as well, particularly in El Salvador, Guatemala, Honduras, and Belize. In El Salvador, 20.10 inches (510.54 mm) of rain fell at Volcán Conchagua during the period of Cristobal, and that location ended up with a combined total of 42.80 inches (1087.1 mm) for the entire event. Guatemala had a peak rainfall amount of 14.68 inches (372.9 mm) registered at Jutiapa, with an event-total amount of 26.48 inches (672.6 mm). Cristobal produced a maximum of 11.02 inches (279.9 mm) in Honduras at Sabana Grande, which also recorded a total of 13.73 inches (348.7 mm) for the entire event. Lastly, in Belize, the highest rainfall measured during Cristobal was 10.19 inches (258.8 mm) at Yo Chen, and that site had an event-total accumulation of 13.89 inches (352.8 mm). Additional information on the rains that occurred in Central America can be found in the NHC Tropical Cyclone Report for Tropical Storm Amanda5.
High rainfall totals occurred over portions of the southeastern United States, particularly to the east of the path of Cristobal’s center. More than a foot of rain was measured at sites in southeastern Louisiana, southern Mississippi, and northern Florida, and just under a foot was measured in southern Alabama and southern Georgia. For the period from 7 to 9 June, the maximum rainfall totals recorded during Cristobal were 13.65 inches near Caesar, Mississippi; 13.55 inches near Madison, Florida; and 13.38 inches near Pearl River, Louisiana. Figure 7
5 The Tropical Cyclone Report for Tropical Storm Amanda can be found at https://www.nhc.noaa.gov/data/tcr/EP022020_Amanda.pdf
Tropical Storm Cristobal 7
provides an analysis of rainfall from Cristobal in the United States, over a longer period from 2 to 10 June. This extended period includes a maximum rainfall total of 15.20 inches near Stuart, Florida.
Tornadoes There were 13 tornadoes reported in the United States during Cristobal, which are listed in Table 5. Eleven of the tornadoes occurred in Florida on 6 and 7 June within Cristobal’s outer rainbands. The most significant tornado, an EF1 (on the Enhanced Fujita Scale), started as a waterspout over Lake Conway and moved northward across eastern portions of the Orlando metropolitan area. The tornado had a path length of just over 5 miles and caused about $956,000 of property damage. The other tornadoes in Florida were all rated EF0. One tornado in Clearwater caused $30,000 in damage, and one in Oxford caused $40,000 in damage.
Two tornadoes of unknown intensity occurred in eastern Illinois late on 9 June, just before Cristobal became extratropical. No damage was reported from either tornado.
Cristobal’s remnants and the associated moisture also helped initiate a derecho which moved eastward across parts of the Great Lakes and Ohio Valley on 10 June. Wind gusts of 60 to 80 mph were reported in Michigan, Indiana, Ohio, Kentucky, and western New York, and a few tornadoes occurred in Ohio and Pennsylvania.
CASUALTY AND DAMAGE STATISTICS Cristobal is known to have taken the lives of six people. After Amanda caused 40 deaths in El Salvador, Guatemala, and Honduras, Cristobal caused another three deaths6 in Mexico. A 54-year-old man drowned while attempting to swim across a flooded street in Santa María, Yaxcabá, Yucatan state, and a 10-year-old Venezuelan boy drowned when his family attempted to drive through the overflow of the Chumpán River in Campeche state7. In Chiapas state, a motorcyclist died when a tree fell on him on a highway in San Cristóbal de las Casas8. In the
6 Deaths occurring as a direct result of the forces of the tropical cyclone are referred to as “direct” deaths. These would include those persons who drowned in storm surge, rough seas, rip currents, and freshwater floods. Direct deaths also include casualties resulting from lightning and wind-related events (e.g., collapsing structures). Deaths occurring from such factors as heart attacks, house fires, electrocutions from downed power lines, vehicle accidents on wet roads, etc., are considered indirect” deaths. 7 Reportan dos muertos por afectaciones de "Cristóbal" en sureste. La Jornada Maya. https://www.jornada.com.mx/ultimas/estados/2020/06/07/reportan-una-muerte-por-el-paso-de-cristobal-en-yaxcaba-yucatan-717.html 8 Tormenta tropical "Cristóbal" deja un muerto en Chiapas. El Universal. https://www.eluniversal.com.mx/nacion/tormenta-tropical-cristobal-deja-un-muerto-en-chiapas

Tropical Storm Cristobal 8
United States, two brothers, ages 8 and 10, drowned in a rip current at a beach in Grand Isle, Louisiana9. A 17-year-old boy also drowned in rough surf at Crystal Beach, Texas10.
Mexico’s Comisión Nacional del Agua (CONAGUA) indicates that 112 municipalities across the states of Tabasco, Campeche, Yucatan, Quintana Roo, and Chiapas were affected by severe flash and river flooding. At least 619 people, of which 508 were in Campeche, were evacuated, with more than 200 houses and 3 hospitals damaged in these states. Several landslides were reported, particularly in the state of Chiapas11.
The NOAA National Centers for Environmental Information (NCEI) estimates that damage from Cristobal totaled about $310 million in the United States. Storm surge flooding inundated roadways along the coasts of southeastern Louisiana, Mississippi, Alabama, and the Florida Panhandle. Wave action caused beach erosion and damaged many piers, and some homes in the area were damaged from flooding and downed trees. In Grand Isle, Louisiana, Cristobal eroded sand and damaged about 2,000 feet of the protective levee on the west side of the island, and rural levees were overtopped or breached in some parts of Louisiana, including a breach in a levee in Delacroix in St. Bernard Parish. Ten people were rescued and another 19 were evacuated from Fontainebleau State Park on the north side of Lake Pontchartrain after storm surge surrounded the cabins. The Mississippi Emergency Management Agency (MEMA) reported that 23 homes, 30 businesses, 23 roads, and 13 public buildings sustained damage in Hancock, Harrison, and Jackson Counties, amounting to a total of $5.7 million of damage in the state.
FORECAST AND WARNING CRITIQUE
The genesis of Cristobal was not forecast with much lead time. Table 6 provides the number of hours in advance of formation with the first NHC Tropical Weather Outlook (TWO) forecast in each likelihood category. A low (<40%) chance of genesis in the southwestern Gulf of Mexico during the next 5 days was first indicated in a Special TWO 42 h before Cristobal formed. At the time, Tropical Depression Two-E (soon-to-be Amanda) had formed over the far eastern Pacific Ocean off the coasts of Guatemala and El Salvador and was forecast to move inland and dissipate over Guatemala, with its remnants expected to rotate within a larger gyre located over Central America. However, due to potential land interaction and the influence of the gyre, it was unclear if the remnants would regenerate into a tropical cyclone over the Gulf of Mexico. The 2- and 5-day chances of genesis were raised to the medium (40–60%) category 30 h before genesis, and to the high (>60%) category only 6 and 12 h, respectively, before genesis.
9 Tropical Storm Cristobal spawns damaging tornado in Orlando; Louisiana brothers, 8 and 10, killed in rip current. Fox News. https://www.foxnews.com/us/tropical-storm-cristobal-tornado-orland-florida-outer-band-rip-current-louisiana-brothers-killed 10 Teen drowns at Crystal Beach after grandmother lost sight of him. ABC13. https://abc13.com/ewn-galveston-county-grandmother-grandson-drowns/6236817/ 11 Mexico - Tropical Storm CRISTOBAL update (GDACS, NOAA, SMN, CNPC, media) (ECHO Daily Flash of 04 June 2020). ReliefWeb. https://reliefweb.int/report/mexico/mexico-tropical-storm-cristobal-update-gdacs-noaa-smn-cnpc-media-echo-daily-flash-04

Tropical Storm Cristobal 9
A verification of NHC official track forecasts for Cristobal is given in Table 7a. Official forecast track errors were between 10 and 26% lower than the mean official errors for the previous 5-yr period at all forecast times. The OCD5 errors were a little higher than their respective 5-year means from 12 through 60 h, indicating that the short-term forecasts of Cristobal’s track were a little more difficult than usual. A homogeneous comparison of the official track errors with selected guidance models is given in Table 7b. Overall, the NHC official track forecasts performed better than the individual deterministic models, with the exception of the GFS, which had lower errors between 36 and 96 h. The official forecasts were unable to beat the simple and corrected consensus models, most of which had lower errors than the official forecasts at nearly every forecast time.
A verification of NHC official intensity forecasts for Cristobal is given in Table 8a. Official forecast intensity errors were significantly lower than the mean official errors for the previous 5-yr period at all forecast times (as much as 58% lower at 60 h). However, OCD5 errors were lower than their respective 5-yr means by a similar margin, suggesting that Cristobal’s intensity was easier to forecast than for a typical Atlantic tropical cyclone. A homogeneous comparison of the official intensity errors with selected guidance models is given in Table 8b. The short-term NHC intensity forecasts were quite skillful and bested the individual dynamical and statistical-dynamical models from 12 through 60 h. However, these models generally had lower errors than the official forecasts from 72 to 120 h. Of the consensus aids, the variable intensity consensus (IVCN) and the HFIP Corrected Consensus aid (HCCA) had lower errors than the official forecasts at every forecast time.
Coastal wind watches and warnings associated with Cristobal are given in Table 9a. In the United States, a Tropical Storm Watch was first issued for the northern Gulf coast from Intracoastal City, Louisiana, eastward to the Alabama/Florida border at 1500 UTC 5 June. Later that day at 2100 UTC, a Tropical Storm Warning was issued from Morgan City, Louisiana, eastward to the Okaloosa/Walton County Line, Florida. Sustained tropical-storm-force winds are estimated to have first reached the coast within the warning area around 0300 UTC 7 June, indicating that the Tropical Storm Watch provided a lead time of 36 h and the Tropical Storm Warning provided a lead time of 30 h. These lead times were 12 and 6 h less than the respective typical lead times for coastal watches and warnings due to Cristobal moving a little faster and its wind field growing a little more than forecast.
Storm surge watches and warnings associated with Cristobal area given in Table 9b. A Storm Surge Watch was first issued for two separate segments of the northern Gulf coast at 1500 UTC 5 June: from Grand Isle, Louisiana, to Ocean Springs, Mississippi (including Lake Borgne) and from Indian Pass, Florida, to Arepika, Florida. A portion of the western segment, from the mouth of the Mississippi River to Ocean Springs (including Lake Borgne), was upgraded to a Storm Surge Warning later that day at 2100 UTC. Storm surge inundation of 3 feet or greater above normally dry ground (which NHC uses as a first-cut threshold for the storm surge watch/warning) occurred within the Storm Surge Warning area (Fig. 8). Inundation levels a little higher than 3 feet occurred outside of the warning area in the regions around Mobile Bay and Lake Pontchartrain. The eastern segment of the Storm Surge Watch from Indian Pass to Arepika was not upgraded to a warning, and tide stations along that portion of the coast did not register inundation levels higher than 3 feet.

Tropical Storm Cristobal 10
IMPACT-BASED DECISION SUPPORT SERVICES (IDSS) AND PUBLIC COMMUNICATION
NHC provided impact-based decision support services (IDSS) for Cristobal to emergency managers from 3 June through 8 June, including calls, briefings, and federal video teleconferences with FEMA Headquarters, FEMA Region 4, FEMA Region 6, and impacted states. These IDSS briefings were coordinated through the FEMA Hurricane Liaison Team, embedded at the NHC.
After coordination with several countries in Central America for eastern Pacific Tropical Storm Amanda, NHC continued its international coordination with the meteorological service of Mexico for Cristobal for the issuance of tropical storm watches and warnings for portions of southeastern Mexico.
The Tropical Analysis and Forecast Branch of NHC provided nine live briefings to the U.S. Coast Guard Districts 7 and 8 between 2 and 7 June in support of their life-saving mission.
NHC provided 10 live interviews via Skype on 7 June to local media affiliates and national cable weather outlets. Two Facebook Live broadcasts were also conducted via the NHC Facebook page.
NHC provided key messages on Cristobal in its Tropical Cyclone Discussions and in graphical format on the NHC webpage and through social media posts from 1 through 8 June.
ACKNOWLEDGMENTS
Data in Table 3 were compiled from Post Tropical Cyclone Reports and Public Information Statements issued by NWS Forecast Offices (WFOs) and reports from the Weather Prediction Center, National Data Buoy Center, NOS Center for Operational Oceanographic Products and Services, and international meteorological services in Mexico, Belize, Guatemala, El Salvador, and Honduras.

Tropical Storm Cristobal 11
Table 1. Best track for Tropical Storm Cristobal, 1–9 June 2020.
Date/Time (UTC)
Latitude (°N)
Longitude (°W)
Pressure (mb)
Wind Speed (kt) Stage
01 / 1800 19.4 90.9 1006 25 tropical depression
02 / 0000 19.6 91.6 1005 25 "
02 / 0600 19.6 92.1 1005 30 "
02 / 1200 19.5 92.5 1004 35 tropical storm
02 / 1800 19.2 92.6 1001 40 "
03 / 0000 19.0 92.5 996 45 "
03 / 0600 18.9 92.3 994 50 "
03 / 1200 18.8 92.2 993 50 "
03 / 1300 18.7 92.1 993 50 "
03 / 1800 18.5 91.9 994 45 "
04 / 0000 18.2 91.7 995 40 "
04 / 0600 17.9 91.5 997 35 "
04 / 1200 17.7 91.2 999 30 tropical depression
04 / 1800 17.6 90.8 999 30 "
05 / 0000 17.9 90.4 999 30 "
05 / 0600 18.6 90.1 998 35 tropical storm
05 / 1200 19.6 89.9 997 40 "
05 / 1800 20.8 89.9 997 45 "
06 / 0000 22.0 90.0 996 50 "
06 / 0600 23.0 90.1 994 50 "
06 / 1200 23.9 90.2 992 45 "
06 / 1800 24.8 90.2 992 45 "
07 / 0000 25.8 90.1 992 45 "
07 / 0600 26.9 90.0 992 45 "
07 / 1200 28.0 89.9 991 45 "
07 / 1800 29.0 89.8 990 45 "
07 / 2200 29.3 89.8 990 45 "
08 / 0000 29.8 89.9 990 45 "
08 / 0600 30.6 90.6 991 35 "
08 / 1200 31.7 91.5 993 30 tropical depression
08 / 1800 32.9 92.0 994 30 "
09 / 0000 34.2 92.1 994 25 "

Tropical Storm Cristobal 12
Date/Time (UTC)
Latitude (°N)
Longitude (°W)
Pressure (mb)
Wind Speed (kt) Stage
09 / 0600 35.8 92.2 993 25 "
09 / 1200 38.0 92.1 991 25 "
09 / 1800 40.3 91.7 988 30 "
10 / 0000 42.6 90.8 986 30 extratropical
10 / 0600 45.0 89.3 983 35 "
10 / 1200 47.5 87.4 982 35 "
10 / 1800 49.8 85.1 982 35 "
11 / 0000 51.7 82.6 983 30 "
11 / 0600 52.7 81.2 985 30 "
11 / 1200 53.2 80.4 987 35 "
11 / 1800 53.4 79.8 989 35 "
12 / 0000 53.3 79.4 992 35 "
12 / 0600 52.5 79.1 998 35 "
12 / 1200 dissipated
03 / 0600 18.9 92.3 994 50 maximum winds
09 / 1800 40.3 91.7 988 30 minimum pressure
03 / 1300 18.7 92.1 993 50 landfall at Atasta, Campeche, Mexico
07 / 2200 29.3 89.8 990 45
landfall in Plaquemines Parish,
Louisiana (about 10 n mi east of
Grand Isle)

Tropical Storm Cristobal 13
Table 2. Selected ship reports with winds of at least 34 kt for Tropical Storm Cristobal, 1–9 June 2020.
Date/Time (UTC)
Ship call sign
Latitude (°N)
Longitude (°W)
Wind dir/speed (kt)
Pressure (mb)
02 / 1500 9V9134 19.4 95.4 260 / 44 1013.0
03 / 0600 C6CL6 17.3 86.3 120 / 40 1008.0
03 / 0900 C6CL6 17.6 86.0 130 / 36 1007.2
06 / 0900 A8ZU9 27.5 87.6 100 / 36 1009.8
06 / 1100 9V6408 28.1 88.4 120 / 35 1010.4
07 / 0000 9V6408 26.9 86.8 140 / 35 1004.4
07 / 0100 9V6408 26.9 86.7 140 / 35 1004.4
07 / 0600 9V6408 26.4 86.0 140 / 36 1007.4
07 / 0800 9V6408 26.2 85.8 140 / 45 1007.4
07 / 0900 9V6408 26.1 85.7 140 / 45 1006.4
07 / 1000 9V6408 26.0 85.5 180 / 40 1009.4
07 / 1100 9V6408 25.4 85.4 170 / 38 1009.4
07 / 1200 9V6408 25.8 85.3 170 / 35 1009.4
07 / 1700 VRQO6 26.5 87.5 190 / 35 1006.0
07 / 1800 9V6408 24.9 84.9 140 / 35 1009.4
Tropical Storm Cristobal 14
Table 3. Selected surface observations for Tropical Storm Cristobal, 1–9 June 2020.
Location
Minimum Sea Level Pressure
Maximum Surface Wind Speed
Storm surge (ft)c
Storm tide (ft)d
Estimated Inundation
(ft)e
Total rain (in) Date/
time (UTC)
Press. (mb)
Date/ time
(UTC)a Sustained
(kt)b Gust (kt)
Mexico International Civil Aviation Organization (ICAO) Sites Ciudad del Carmen (MMCE) (18.65N 91.80W)
3/2044 995.3 3/1343 29 48
Cancun (MMUN) (21.03N 86.87W) 5/2043 1004.5 6/0048 28 38
Hydrometeorological Automated Data System (HADS) Sites Isla Perez (IPZY1) (22.38N 89.68W) 5/2145 37 46
Puerto Aventuras (PAVX4) (20.50N 87.23W)
6/0545 40
Isla Mujeres (IMUX4) (21.25N 86.74W) 5/1600 36
Rio Lagartos (LAGY1) (21.57N 88.16W) 6/0100 35
Weatherflow Sites Cancun (21.06N 86.78W) 6/0011 1001.6 5/1451 40
(11 m) 54
Puerto Morelos (20.83N 86.89W) 5/1039 1002.0 5/1354 36
(10 m) 49
Xcaret Park (20.58N 87.12W) 5/2143 1001.7 5/1713 33
(11 m) 49
Cozumel (20.53N 86.94W) 5/1035 1001.2 6/1645 20
(11 m) 38
Xel-Ha Park (20.32N 87.36W) 5/1023 1000.3 5/1123 25
(10 m) 36
Louisiana ICAO Sites New Orleans Lakefront Airport (KNEW) (30.04N 90.03W)
8/0139 993.2 7/1816 34I 42I 3.43
Alexandria (KAEX) (31.33N 92.56W) 8/1050 997.9 8/1942 26 42 0.66
Slidell (KASD) (30.35N 89.82W) 8/0141 993.6 8/0533 24 41 3.24
New Orleans Louis Armstrong Airport (KMSY) (29.98N 90.25W)
8/0240 994.9 7/1303 23 35 2.70

Tropical Storm Cristobal 15
Location
Minimum Sea Level Pressure
Maximum Surface Wind Speed
Storm surge (ft)c
Storm tide (ft)d
Estimated Inundation
(ft)e
Total rain (in) Date/
time (UTC)
Press. (mb)
Date/ time
(UTC)a Sustained
(kt)b Gust (kt)
Patterson Memorial Airport (KPTN) (29.71N 91.34W)
7/2256 997.2 6/2105 28 35 3.64
Coastal-Marine Automated Network (C-MAN) Sites Southwest Pass (BURL1) (28.91N 89.43W)
7/1100 37 (38 m) 44
National Ocean Service (NOS) Sites Shell Beach (SHBL1) (29.87N 89.67W) 7/2342 993.4 7/1130 34
(16 m) 41 6.16 6.91 6.2
I-10 Bonnet Carre Floodway (BCFL1) (30.07N 90.39W)
4.58 5.07 4.6
New Canal Station (NWCL1) (30.03N 90.11W)
8/0118 993.1 7/1218 33 (10 m) 41 3.96 4.27 4.0
Pilot’s Station East (PSTL1) (28.93N 89.41W)
7/2042 991.5 7/1030 41 (24 m) 55 2.67 3.2
Berwick, Atchafalaya River (TESL1) (29.67N 91.24W)
7/2230 996.4 7/0130 22 (13 m) 30 2.18 5.17 3.0
Pilottown (PILL1) (29.18N 89.26W) 7/2130 992.6 8/0800 28
(12 m) 34 2.44 2.8
Grand Isle (GISL1) (29.26N 89.96W) 7/0054 25
(9 m) 34 2.14 2.5
LAWMA, Amerada Pass (AMRL1) (29.45N 91.34W)
7/2318 996.6 6/1836 16 (11 m) 25 2.31 3.16 2.3
Eugene Island (EINL1) (29.37N 91.38W) 7/2330 996.3 8/1654 32
(10 m) 40 2.05 2.1
Port Fourchon (PTFL1) (29.11N 90.20W) 2.28 2.1
Freshwater Canal Locks (FRWL1) (29.55N 92.31W)
8/0154 999.9 8/1906 22 (20 m) 31 1.84 2.88 2.0
Frenier Landing (FREL1) (30.11N 90.42W)
8/0054 993.7 7/2018 30 (10 m) 37
Weatherflow Sites Bayou Bienvenue (XBYU) (30.00N 89.90W) 8/0043 990.4 7/1743 38
(27 m) 50
New Orleans Lakefront (XLKF) (30.04N 90.02W)
8/0107 991.7 7/1813 32 (10 m) 41

Tropical Storm Cristobal 16
Location
Minimum Sea Level Pressure
Maximum Surface Wind Speed
Storm surge (ft)c
Storm tide (ft)d
Estimated Inundation
(ft)e
Total rain (in) Date/
time (UTC)
Press. (mb)
Date/ time
(UTC)a Sustained
(kt)b Gust (kt)
Pontchartrain Causeway - Midlake (XPTN) (30.20N 90.12W)
8/0119 992.2 7/1934 28 (13 m) 36
Mandeville (XMVL) (30.36N 90.09W) 8/0145 991.9 8/0755 27
(10 m) 34
Other Sites Port Fourchon Heliport (KXPY) (29.12N 90.20W) 7/0620 25
(30 m) 36
United States Geological Survey (USGS) Sites Gulf Intracoastal Waterway near Michoud (SBEL1) (30.01N 89.90W)
7.27
Bayou Dupre near Violet (BDML1) (29.94N 89.84W)
7.20
Breton Sound at Black Bay near Snake Island (PSIL1) (29.63N 89.56W)
6.59
Mississippi Sound at Grand Pass (GRPL1) (30.12N 89.25W)
6.13
Pearl River above Slidell (PRBL1) (30.30N 89.70W)
6.07
Breton Sound Basin at Crooked Bayou near Delacroix (CBDL1) (29.71N 89.72W)
5.43
Barataria Bay and Waterway at 13 NNE Grand Isle (NGIL1) (29.42N 89.95W)
4.22
United States Army Corps of Engineer (USACE) Sites Lake Borgne at Chef Menteur Pass (CMPL1) (30.07N 89.80W)
5.79
Lake Pontchartrain at Lakefront Airport (PLAL1) (30.04N 90.02W)
4.63
Lake Pontchartrain near Mandeville (LPML1) (30.37N 90.09W)
4.63

Tropical Storm Cristobal 17
Location
Minimum Sea Level Pressure
Maximum Surface Wind Speed
Storm surge (ft)c
Storm tide (ft)d
Estimated Inundation
(ft)e
Total rain (in) Date/
time (UTC)
Press. (mb)
Date/ time
(UTC)a Sustained
(kt)b Gust (kt)
Breton Sound Basin at Caernarvon Sector Gate (CGWL1) (29.86N 89.91W)
4.57
Lake Pontchartrain at Pass Manchac near Ponchatoula (PMPL1) (30.28N 90.40W)
3.84
Hydrometeorological Automated Data System (HADS) Sites Pearl River (PERL1) (30.39N 89.74W) 13.38
Camp Covington (CGSL1) (30.60N 90.15W)
12.83
Folsom 4 SW (FLSL1) (30.62N 90.25W) 12.23
Bogalusa (BXAL1) (30.80N 89.82W) 11.74
Hammond 5 E (ROBL1) (30.51N 90.36W)
11.68
Hammond 5 W (NRBL1) (30.50N 90.55W)
11.58
Franklinton (FRNL1) (30.84N 90.16W) 11.25
Holden (HOLL1) (30.50N 90.68W) 10.73
Montpelier (MONL1) (30.69N 90.54W) 9.97
Amite (AMIL1) (30.73N 90.48W) 7.01
Community Collaborative Rain, Hail and Snow Network (CoCoRaHS) Sites Mandeville 0.8 WNW (LA-ST-25) (30.37N 90.09W)
9.17
Mississippi ICAO Sites Gulfport (KGPT) (30.40N 89.07W) 8/0154 995.6 7/2022 33 43 7.56
Meridian (KMEI) (32.34N 88.75W) 9/1858 42 2.59
Biloxi – Keesler AFB (KBIX) (30.42N 88.92W)
8/0130 996.2 8/1336 30 41 8.52

Tropical Storm Cristobal 18
Location
Minimum Sea Level Pressure
Maximum Surface Wind Speed
Storm surge (ft)c
Storm tide (ft)d
Estimated Inundation
(ft)e
Total rain (in) Date/
time (UTC)
Press. (mb)
Date/ time
(UTC)a Sustained
(kt)b Gust (kt)
Pascagoula (KPQL) (30.46N 88.53W) 8/0153 998.3 8/0203 26 39 9.02
Jackson (KJAN) (32.31N 90.08W) 8/2047 39 3.19
Stennis (KHSA) (30.37N 89.45W) 7/1949 21 38
Greenwood (KGWO) (33.49N 90.09W) 8/1131 36 1.11
Hattiesburg/Laurel (KPIB) (31.47N 89.34W)
8/0420 34 4.93
Hattiesburg (KHBG) (31.26N 89.25W) 8/0315 34 1.96
NOS Sites Bay Waveland Yacht Club (WYCM6) (30.33N 89.33W)
8/0030 995.0 7/2024 36 (10 m) 44 5.92 6.77 5.7
Pascagoula NOAA Lab (PNLM6) (30.37N 88.56W)
4.19 4.50 3.6
Petit Bois Island, Port of Pascagoula (PTBM6) (30.21N 88.51W)
8/0048 997.7 7/2112 36 (5 m) 50
Weatherflow Sites Ship Island (XSHI) (30.23N 88.98W) 8/0052 994.0 7/2107 42
(12 m) 56
Gulfport (XGPT) (30.36N 89.11W) 8/0137 994.3 7/2117 40
(10 m) 52
Biloxi (XBIL) (30.44N 88.98W) 8/0118 993.3 8/0728 18
(15 m) 35
USGS Sites Tchoutacabouffa River near D’Iberville (DIBM6) (30.48N 88.89W)
7.18
Pearl River near Claiborne (EPCM6) (30.19N 89.53W)
6.75
Pascagoula River at Old Fort Bayou at Ocean Springs (OFBM6) (30.42N 88.83W)
5.23

Tropical Storm Cristobal 19
Location
Minimum Sea Level Pressure
Maximum Surface Wind Speed
Storm surge (ft)c
Storm tide (ft)d
Estimated Inundation
(ft)e
Total rain (in) Date/
time (UTC)
Press. (mb)
Date/ time
(UTC)a Sustained
(kt)b Gust (kt)
HADS Sites Caesar 3 WSW (CREM6) (30.57N 89.59W)
13.65
McNeill 3 W (MNLM6) (30.66N 89.69W) 12.97
Gulfport 6 WNW (GLFM6) (30.40N 89.20W)
12.76
Lyman 4 E (LYMM6) (30.48N 89.03W) 12.52
D’Iberville 4 N (DIBM6) (30.48N 88.90W) 11.48
Monticello (MTCM6) (31.55N 90.08W) 10.35
Tylertown 9 NW (TYTM6) (31.18N 90.28W)
10.25
Runnelstown 3 S (RNTM6) (31.33N 89.11W)
9.91
Kiln 2 S (KLNM6) (30.39N 89.44W) 9.90
Pascagoula River at Graham Ferry (PGFM6) (30.61N 88.64W)
9.82
Gautier 6 NNW (PSHCM6) (30.45N 88.66W)
9.79
Osyka (OSYM6) (31.01N 90.46W) 9.79
Orange Grove 3 NNE (ORAM6) (30.46N 88.45W)
9.38
Merrill (MRRM6) (30.98N 88.73W) 8.79
Rockport 1 E (ROCM6) (31.78N 90.15W) 8.43
Gulfport (TCGM6) (30.42N 89.08W) 8.28
Waynesboro 3 WNW (WYNM6) (31.68N 88.68W)
7.93
Leakesville (LEKM6) (31.15N 88.56W) 7.91
Rosetta (RSAM6) (31.33N 91.10W) 7.74

Tropical Storm Cristobal 20
Location
Minimum Sea Level Pressure
Maximum Surface Wind Speed
Storm surge (ft)c
Storm tide (ft)d
Estimated Inundation
(ft)e
Total rain (in) Date/
time (UTC)
Press. (mb)
Date/ time
(UTC)a Sustained
(kt)b Gust (kt)
Biloxi (BLXM6) (30.38N 88.98W) 7.17
Shubuta (SHBM6) (31.87N 88.70W) 7.16
Jackson 1 SSE (JACM6) (32.28N 90.18W)
7.09
CoCoRaHS Sites Ocean Springs 3.6 ESE (MS-JC-12) (30.38N 88.75W)
10.08
Gautier 4.9N (MS-JC-22) (30.46N 88.65W)
9.96
Ocean Springs 1.2 WNW (MS-JC-24) (30.41N 88.82W)
9.94
Ocean Springs 3.2 SE (MS-JC-8) (30.37N 88.77W)
9.92
Lucedale 13 SE (MS-GG-2) (30.79N 88.43W)
9.56
Biloxi 13.1 NNW (MS-HR-34) (30.57N 89.05W)
9.44
Ocean Springs 3.3 E (MS-JC-2) (30.41N 88.75W)
9.27
Pass Christian 5 N (MS-HR-19) (30.39N 89.25W)
9.08
Gulfport 5.3 NW (MS-HR-39) (30.44N 89.13W)
8.25
Pass Christian 9.8 NNW (MS-HR-37) (30.46N 89.28W)
7.77
Waveland 1.0 NW (MS-HC-18) (30.30N 89.40W)
7.70
Saucier 1.7 NNE (MS-HR-22) (30.66N 89.13W)
7.16
Kiln 3.3 N (MS-HC-9) (30.46N 89.43W) 6.93

Tropical Storm Cristobal 21
Location
Minimum Sea Level Pressure
Maximum Surface Wind Speed
Storm surge (ft)c
Storm tide (ft)d
Estimated Inundation
(ft)e
Total rain (in) Date/
time (UTC)
Press. (mb)
Date/ time
(UTC)a Sustained
(kt)b Gust (kt)
NWS Cooperative Observer (COOP) Sites Gulfport (GLFM6) (30.39N 89.21W) 6.94
Alabama ICAO Sites Mobile Downtown (KBFM) (30.64N 88.07W)
7/2353 1001.1 8/0247 33 49 0.24
Gulf Shores (KJKA) (30.29N 87.67W) 8/0055 1002.4 7/2315 29 40
Mobile / Bates Field (KMOB) (30.68N 88.25W)
8/0156 1000.5 8/0156 27 40 7.00
C-MAN Sites Dauphin Island (DPIA1) (30.25N 88.08W) 8/0100 999.8 7/1750 38
(14 m) 49
NOS Sites Coast Guard Sector Mobile (MCGA1) (30.65N 88.06W)
8/0200 1001.2 7/2354 30 (9 m) 38 5.27 4.92 3.8
Chickasaw Creek (CIKA1) (30.78N 88.07W)
4.99 5.02 3.7
Mobile State Docks (OBLA1) (30.71N 88.04W)
8/0000 1001.0 4.64 4.75 3.6
Dog River Bridge (BYSA1) (30.57N 88.09W)
4.69 3.3
Bayou La Batre Bridge (BLBA1) (30.41N 88.25W)
4.33 4.11 3.2
West Fowl River Bridge (WFRA1) (30.38N 88.16W)
4.16 4.01 3.1
East Fowl River Bridge (EFRA1) (30.44N 88.11W)
4.16 3.93 3.1
Weeks Bay, Mobile Bay (WBYA1) (30.42N 87.83W)
3.56 3.0
Dauphin Island (DILA1) (30.25N 88.08W) 8/0118 999.4 7/1724 39
(11 m) 49 3.20 3.47 2.8
Fort Morgan (FMOA1) (30.23N 88.03W) 7/2242 999.5 7/2230 44
(38 m) 54

Tropical Storm Cristobal 22
Location
Minimum Sea Level Pressure
Maximum Surface Wind Speed
Storm surge (ft)c
Storm tide (ft)d
Estimated Inundation
(ft)e
Total rain (in) Date/
time (UTC)
Press. (mb)
Date/ time
(UTC)a Sustained
(kt)b Gust (kt)
Weatherflow Sites Buccaneer Yacht Club (XBUC) (30.58N 88.07W)
8/0247 35 (10 m) 45
Gulf Shores - Foley (XGLF) (30.36N 87.65W) 8/1555 23
(10 m) 43
Dauphin Island Sea Lab Sites Middle Bay Lighthouse (MBLA1) (30.44N 88.01W)
7/2300 41 (14 m) 45
Katrina Cut (KATA1) (30.26N 88.21W) 7/1800 38
(16 m) 46
CoCoRaHS Sites Mobile 10 W (AL-MB-71) (30.67N 88.26W)
8.29
Mobile 1.2 WSW (AL-MB-49) (30.67N 88.11W)
8.22
Fairhope 2 NW (AL-BW-1) (30.54N 87.89W)
8.20
Mobile 5.5 SSW (AL-MB-85) (30.60N 88.11W)
7.82
Tillmans Corner 8.7 WNW (AL-MB-63) (30.61N 88.33W)
7.71
Wimer 7.9 SE (AL-MB-24) (30.74N 88.27W)
7.61
Mobile 2.6 WNW (AL-MB-4) (30.69N 88.13W)
7.39
Summerdale 2.7 WNW (AL-BW-85) (30.50N 87.74W)
7.35
Foley 0.5 ESE (AL-BW-9) (30.40N 87.68W)
7.34
Mobile 3.3 WNW (AL-MB-79) (30.70N 88.14W)
7.28
Mobile 5.8 SW (AL-MB-91) (30.62N 88.16W)
7.19

Tropical Storm Cristobal 23
Location
Minimum Sea Level Pressure
Maximum Surface Wind Speed
Storm surge (ft)c
Storm tide (ft)d
Estimated Inundation
(ft)e
Total rain (in) Date/
time (UTC)
Press. (mb)
Date/ time
(UTC)a Sustained
(kt)b Gust (kt)
Mobile 11.2 WSW (AL-MB-72) (30.64N 88.27W)
7.09
Mobile 11.2 WSW (AL-MB-90) (30.62N 88.27W)
7.08
Loxley 0.4 SSW (AL-BW-26) (30.62N 87.76W)
6.94
Tillmans Corner 4.3 WNW (AL-MB-1) (30.61N 88.26W)
6.81
HADS Sites Chattahoochee River at Helen (HDCG1) (34.70N 83.73W)
9.77
Titus (TUSG1) (34.95N 83.62W) 6.16
NWS COOP Sites Big Creek Lake (30.72N 88.30W) 8.60
Personal Weather Stations West Mobile (KALMOBIL163) (30.64N 88.24W)
10.33
Dauphin Island (KALDAUPH12) (30.24N 88.10W)
6.31
Florida ICAO Sites Pensacola NAS (KNPA) (30.35N 87.32W) 7/2356 1003.6 7/1856 30 40
Pensacola (KPNS) (30.47N 87.20W) 8/0053 1004.5 8/0153 29 39 4.06
Destin / Ft. Walton Beach (KDTS) (30.40N 86.47W)
8/0353 1007.4 8/0410 29 38 4.66
Mary Esther – Hurlburt Field (KHRT) (30.43N 86.68W)
8/0926 1007.2 8/0756 22 37
Eglin AFB (KEGI) (30.65N 86.52W) 8/0446 1007.0 8/0446 21 34
Milton – NAS Whiting Field North (KNSE) (30.72N 87.02W)
8/0056 1003.9 8/0142 23 35

Tropical Storm Cristobal 24
Location
Minimum Sea Level Pressure
Maximum Surface Wind Speed
Storm surge (ft)c
Storm tide (ft)d
Estimated Inundation
(ft)e
Total rain (in) Date/
time (UTC)
Press. (mb)
Date/ time
(UTC)a Sustained
(kt)b Gust (kt)
Hernando County Airport (KBKV) (28.47N 82.45W)
5.89
C-MAN Sites Tyndall AFB Tower C (SGOF1) (29.41N 84.86W)
7/1200 1008.9 6/1551 30 (35 m, 10 min) 35
NOS Sites Pensacola (PCLF1) (30.40N 87.21W) 8/0006 1003.8 8/0518 23
(10 m) 30 3.18 3.53 2.6
Panama City Beach (PCBF1) (30.21N 85.88W)
7/2048 1008.3 8/0406 35 (17 m) 42 2.34 3.36 2.4
Apalachicola (APCF1) (29.73N 84.98W) 7/1124 1009.8 6/1606 20
(9 m) 25 2.03 3.23 2.4
Cedar Key (CKYF1) (29.13N 83.03W) 7/0812 1010.5 7/1330 29
(12 m) 33 2.44 3.78 2.2
Panama City (PACF1) (30.15N 85.67W) 7/2042 22
(10 m) 30 1.99 2.88 2.1
Clearwater Beach (CWBF1) (27.98N 82.83W)
7/0754 1011.3 6/2154 27 (8 m) 32 1.85 2.90 2.0
Weatherflow Sites Okaloosa Fishing Pier (XOPF) (30.39N 86.59W)
8/0206 34 (14 m) 43
Fair Point Light (Pensacola Bay) (XFPL) (30.37N 87.21W)
8/0136 1003.5 8/0141 31 (5 m) 42
Ft. Walton Beach (West Choctawhatchee Bay) (XFWB) (30.40N 86.56W)
7/2024 1003.2 8/0329 29 (7 m) 37
Gulf Breeze (XGBZ) (30.36N 87.16W) 8/0024 24
(15 m) 40
Crystal Beach (XCBS) (30.39N 87.41W) 8/0421 23
(15 m) 35
HADS Sites Madison 8 S (HOPF1) (30.36N 83.44W)
13.54
Jasper 5 W (ALAF1) (30.53N 83.05W) 12.73
Ocala 8 SSE (OCAF1) (29.08N 82.08W) 9.57
Tropical Storm Cristobal 25
Location
Minimum Sea Level Pressure
Maximum Surface Wind Speed
Storm surge (ft)c
Storm tide (ft)d
Estimated Inundation
(ft)e
Total rain (in) Date/
time (UTC)
Press. (mb)
Date/ time
(UTC)a Sustained
(kt)b Gust (kt)
Lake City 22 N (BTNF1) (30.51N 82.67W)
9.21
Jasper (JASF1) (30.52N 82.94W) 9.10
Monticello 1 NNE (MTCF1) (30.56N 83.86W)
8.71
Monticello 14 ENE (ASHF1) (30.62N 83.65W)
7.70
White Springs 7 N (WSGF1) (30.44N 82.78W)
7.70
Wacissa 2 E (WACF1) (30.37N 83.97W) 7.13
CoCoRaHS Sites Live Oak 6.6 NNE (FL-SW-14) (30.38N 82.94W)
11.68
Lakewood Ranch 3.5 E (FL-MA-29) (27.41N 82.37W)
10.89
Jacksonville 7.3 SW (FL-DV-26) (30.26N 81.74W)
10.36
White Springs 1.0 SSE (FL-CB-14) (30.32N 82.75W)
10.06
Parrish 5.5 SE (FL-MA-30) (27.52N 82.37W)
10.03
Live Oak 5.1 SSE (FL-SW-11) (30.23N 82.94W)
10.00
White Springs 1.0 SSE (FL-CB-10) (30.32N 82.75W)
9.79
Moore Haven 10.4 N (FL-GL-13) (26.98N 81.10W)
9.57
Silver Springs Shores 6.9 NNE (FL-MR-33) (29.19N 81.95W)
9.35
The Meadows 6.2 NE (FL-MA-32) (27.43N 82.40W)
8.98
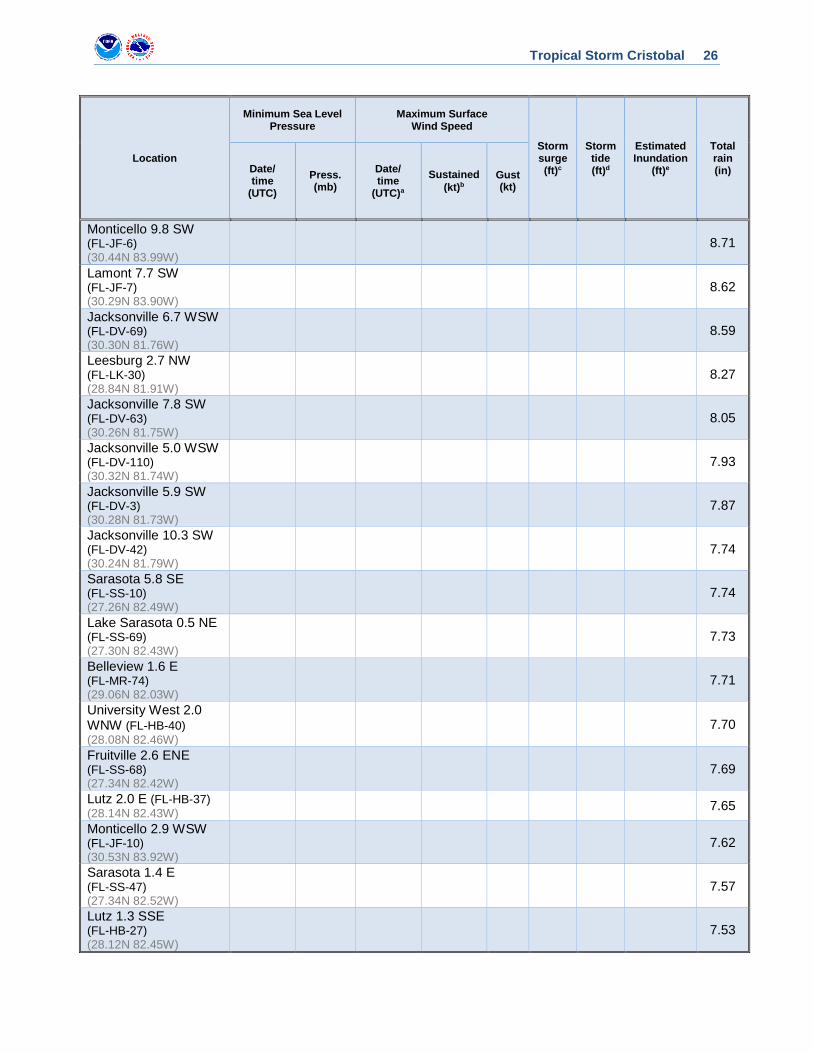
Tropical Storm Cristobal 26
Location
Minimum Sea Level Pressure
Maximum Surface Wind Speed
Storm surge (ft)c
Storm tide (ft)d
Estimated Inundation
(ft)e
Total rain (in) Date/
time (UTC)
Press. (mb)
Date/ time
(UTC)a Sustained
(kt)b Gust (kt)
Monticello 9.8 SW (FL-JF-6) (30.44N 83.99W)
8.71
Lamont 7.7 SW (FL-JF-7) (30.29N 83.90W)
8.62
Jacksonville 6.7 WSW (FL-DV-69) (30.30N 81.76W)
8.59
Leesburg 2.7 NW (FL-LK-30) (28.84N 81.91W)
8.27
Jacksonville 7.8 SW (FL-DV-63) (30.26N 81.75W)
8.05
Jacksonville 5.0 WSW (FL-DV-110) (30.32N 81.74W)
7.93
Jacksonville 5.9 SW (FL-DV-3) (30.28N 81.73W)
7.87
Jacksonville 10.3 SW (FL-DV-42) (30.24N 81.79W)
7.74
Sarasota 5.8 SE (FL-SS-10) (27.26N 82.49W)
7.74
Lake Sarasota 0.5 NE (FL-SS-69) (27.30N 82.43W)
7.73
Belleview 1.6 E (FL-MR-74) (29.06N 82.03W)
7.71
University West 2.0 WNW (FL-HB-40) (28.08N 82.46W)
7.70
Fruitville 2.6 ENE (FL-SS-68) (27.34N 82.42W)
7.69
Lutz 2.0 E (FL-HB-37) (28.14N 82.43W) 7.65
Monticello 2.9 WSW (FL-JF-10) (30.53N 83.92W)
7.62
Sarasota 1.4 E (FL-SS-47) (27.34N 82.52W)
7.57
Lutz 1.3 SSE (FL-HB-27) (28.12N 82.45W)
7.53

Tropical Storm Cristobal 27
Location
Minimum Sea Level Pressure
Maximum Surface Wind Speed
Storm surge (ft)c
Storm tide (ft)d
Estimated Inundation
(ft)e
Total rain (in) Date/
time (UTC)
Press. (mb)
Date/ time
(UTC)a Sustained
(kt)b Gust (kt)
Monticello 4.3 ENE (FL-JF-9) (30.56N 83.80W)
7.52
Archer 5.5 E (FL-AL-2) (29.53N 82.43W) 7.52
Sarasota 4.8 ENE (FL-SS-63) (27.36N 82.47W)
7.42
Interlachen 8.8 S (FL-MR-46) (29.49N 81.90W)
7.13
Jacksonville 4.1 SW (FL-DV-94) (30.30N 81.71W)
7.13
Jacksonville 8.8 E (FL-DV-21) (30.36N 81.51W)
7.06
Georgia HADS Sites Fargo (FGOG1) (30.68N 82.56W) 11.81
Statenville (STNG1) (30.70N 83.03W) 8.23
Clayton (CLAG1) (34.88N 83.40W) 7.55
CoCoRaHS Sites Lake Park 2.8 W (GA-LW-4) (30.68N 83.24W)
9.19
Arkansas ICAO Sites Corning (K4M9) (36.40N 90.65W) 9/0235 39
West Memphis (KAWM) (35.13N 90.23W)
9/0800 36 0.72
Pine Bluff (KPBF) (34.17N 91.93W) 8/1750 35 2.42
HADS Sites Imboden (IMBA4) (36.20N 91.17W) 7.68

Tropical Storm Cristobal 28
Location
Minimum Sea Level Pressure
Maximum Surface Wind Speed
Storm surge (ft)c
Storm tide (ft)d
Estimated Inundation
(ft)e
Total rain (in) Date/
time (UTC)
Press. (mb)
Date/ time
(UTC)a Sustained
(kt)b Gust (kt)
Ravenden Springs (RVSA4) (36.35N 91.12W)
7.57
Newport – White River (NPTA4) (35.59N 91.28W)
7.13
Tennessee ICAO Sites Memphis (KMEM) (35.04N 89.98W) 8/2307 34 0.49
Missouri ICAO Sites Cape Girardeau (KCGI) (37.23N 89.57W)
9/1253 38 0.44
Malden (KMAW) (36.60N 89.99W) 9/1415 37 0.28
Poplar Bluff (KPOF) (36.77N 90.32W) 9/1238 35 1.06
St. Charles (KSET) (38.93N 90.43W) 9/1751 34 0.06
Missouri DOT (MODOT) Sites I-70 Wentzville (MO018) (38.80N 90.90W)
9/1800 41
I-44 Waynesville (MO010) (37.85N 92.08W)
9/1335 39
I-44 St. Louis (MO009) (38.60N 90.31W) 9/1905 36
Illinois
ICAO Sites Chicago – O’Hare (KORD) (41.98N 87.90W)
9/2023 52 0.56
University of Illinois - Willard (KCMI) (40.03N 88.28W)
9/1625 46 0.22
Chicago / Wheeling (KPWK) (42.12N 87.90W)
10/0135 46 0.36

Tropical Storm Cristobal 29
Location
Minimum Sea Level Pressure
Maximum Surface Wind Speed
Storm surge (ft)c
Storm tide (ft)d
Estimated Inundation
(ft)e
Total rain (in) Date/
time (UTC)
Press. (mb)
Date/ time
(UTC)a Sustained
(kt)b Gust (kt)
Rantoul (KTIP) (40.29N 88.15W) 9/1715 44
Aurora (KARR) (41.77N 88.48W) 9/2014 44 0.97
Rockford (KRFD) (42.19N 89.09W) 9/2003 43 1.18
West Chicago (KDPA) (41.90N 88.25W) 10/0037 43
Mattoon / Charleston (KMTO) (39.48N 88.28W)
9/1753 41
Decatur (KDEC) (39.83N 88.87W) 9/1454 41 0.53
Peru / LaSalle (KVYS) (41.353N 89.15W) 9/1955 41
Rochelle (KRPJ) (41.89N 89.08W) 10/0055 41
Springfield (KSPI) (39.85N 89.68W) 9/2052 40 0.11
Bloomington (KBMI) (40.48N 88.92W) 9/1840 40 0.40
Chicago - Midway (KMDW) (41.78N 87.76W)
9/2153 40 0.45
Indiana ICAO Sites South Bend (KSBN) (41.71N 86.32W) 9/2143 43 0.41
Kokomo (KOKK) (40.53N 86.07W) 9/1956 43
Terre Haute (KHUF) (39.44N 87.32W) 9/1653 42 0.30
Angola (KANQ) (41.64N 85.09W) 9/2115 42
Valparaiso (KVPZ) (41.45N 87.00W) 9/1820 40 0.10
NWS Citizen Weather Observing Program (CWOP) Sites Hebron (DW5677) (41.32N 87.20W) 9/1945 43
Wisconsin ICAO Sites Fond Du Lac (KFLD) (43.77N 88.49W) 10/0553 42 0.37
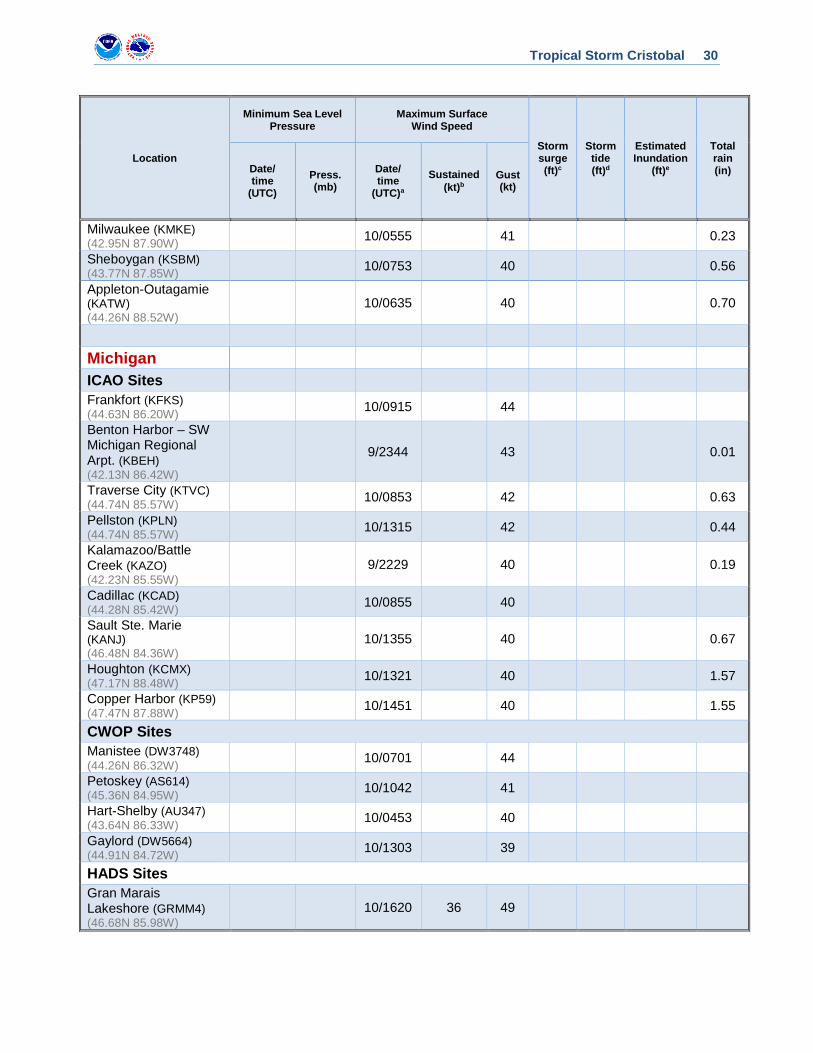
Tropical Storm Cristobal 30
Location
Minimum Sea Level Pressure
Maximum Surface Wind Speed
Storm surge (ft)c
Storm tide (ft)d
Estimated Inundation
(ft)e
Total rain (in) Date/
time (UTC)
Press. (mb)
Date/ time
(UTC)a Sustained
(kt)b Gust (kt)
Milwaukee (KMKE) (42.95N 87.90W) 10/0555 41 0.23
Sheboygan (KSBM) (43.77N 87.85W) 10/0753 40 0.56
Appleton-Outagamie (KATW) (44.26N 88.52W)
10/0635 40 0.70
Michigan ICAO Sites Frankfort (KFKS) (44.63N 86.20W) 10/0915 44
Benton Harbor – SW Michigan Regional Arpt. (KBEH) (42.13N 86.42W)
9/2344 43 0.01
Traverse City (KTVC) (44.74N 85.57W) 10/0853 42 0.63
Pellston (KPLN) (44.74N 85.57W) 10/1315 42 0.44
Kalamazoo/Battle Creek (KAZO) (42.23N 85.55W)
9/2229 40 0.19
Cadillac (KCAD) (44.28N 85.42W) 10/0855 40
Sault Ste. Marie (KANJ) (46.48N 84.36W)
10/1355 40 0.67
Houghton (KCMX) (47.17N 88.48W) 10/1321 40 1.57
Copper Harbor (KP59) (47.47N 87.88W) 10/1451 40 1.55
CWOP Sites Manistee (DW3748) (44.26N 86.32W) 10/0701 44
Petoskey (AS614) (45.36N 84.95W) 10/1042 41
Hart-Shelby (AU347) (43.64N 86.33W) 10/0453 40
Gaylord (DW5664) (44.91N 84.72W) 10/1303 39
HADS Sites Gran Marais Lakeshore (GRMM4) (46.68N 85.98W)
10/1620 36 49

Tropical Storm Cristobal 31
Location
Minimum Sea Level Pressure
Maximum Surface Wind Speed
Storm surge (ft)c
Storm tide (ft)d
Estimated Inundation
(ft)e
Total rain (in) Date/
time (UTC)
Press. (mb)
Date/ time
(UTC)a Sustained
(kt)b Gust (kt)
Grand Traverse Light near Northport (GTLM4) (45.21N 85.55W)
10/1110 42
Fairport (FPTM4) (45.62N 86.66W) 10/0820 42
Naubinway (NABM4) (46.09N 85.44W) 10/1150 41
RAWS Sites Raco (RACM4) (46.36N 84.80W) 10/1304 40
NOS Sites Mackinaw City (MACM4) (45.78N 84.73W)
10/1412 41
C-MAN Sites Stannard Rock (STDM4) (47.18N 87.22W)
10/1500 36 (35 m) 41
Limno Tech Buoys Holland (45029) (42.90N 86.27W) 10/0450 47
Ontario ICAO Sites Kapuskasing (CYYU) (49.42N 82.47W) 10/2000 40
Quebec ICAO Sites Umiujaq (CYMU) (56.53N 76.52W) 11/1400 46 57
Offshore NOAA Buoys Mid Gulf (42001) (25.94N 89.66W) 6/2320 993.5 6/0950 37
(4 m, 1 min) 43
East Gulf (42003) (25.93N 85.62W) 6/2220 1007.0 7/0544 34
(4 m, 1 min) 39
Orange Beach (42012) (30.06N 87.55W) 7/2250 1001.7 7/2307 43
(4 m, 1 min) 49

Tropical Storm Cristobal 32
Location
Minimum Sea Level Pressure
Maximum Surface Wind Speed
Storm surge (ft)c
Storm tide (ft)d
Estimated Inundation
(ft)e
Total rain (in) Date/
time (UTC)
Press. (mb)
Date/ time
(UTC)a Sustained
(kt)b Gust (kt)
Luke Offshore Test Platform (42040) (29.21N 88.23W)
7/2100 998.2 7/1452 39 (4 m, 1 min) 45
Pensacola (42039) (28.79N 86.01W) 7/0950 1006.3 7/0258 31
(4 m, 1 min) 36
Yucatan Basin (42056) (19.82N 84.95W) 5/1840 1007.7 5/1510 29
(4 m, 1 min) 39
Oil Platforms Viosca Knoll 786 / Petronius (Chevron) (KVOA) (29.23N 87.78W)
7/2035 999.7 7/1515 50 (160 m, 2 min) 56
MP 140B AWOS (Apache Corp) (KMIS) (29.30N 88.84W)
8/0815 39 (85 m, 2 min) 48
Green Canyon 787 / Atlantis (BP) (KATP) (27.20N 90.03W)
7/0740 993.2 6/1620 39 (230 m, 2 min) 43
Main Pass 289C (Apache Corp) (KVKY) (29.25N 88.44W)
8/0255 38 (115 m, 2 min) 46
Mississippi Canyon (KDSF) (28.35N 88.27W)
7/1315 996.9 6/1715 37 (130 m, 2 min) 42
Louisiana Offshore Oil Port (LOPL1) (28.89N 90.03W)
7/1117 995.1 7/0732 36 (58 m, 2 min) 42
Shell Alcyone Buoy (42395) (26.40N 90.79W)
7/0840 996.1 6/1400 36 (3 m) 52
Eugene Island 215 (McMoRan Oil & Gas) (KEIR) (28.63N 91.49W)
7/1035 999.0 7/1455 34 (25 m) 40
a Date/time is for sustained wind when both sustained and gust are listed. b Except as noted, sustained wind averaging periods for C-MAN and land-based reports are 2 min; buoy averaging
periods are 8 min. c Storm surge is water height above normal astronomical tide level. d For most locations, storm tide is water height above the North American Vertical Datum of 1988 (NAVD88). e Estimated inundation is the maximum height of water above ground. For NOS tide gauges, the height of the water
above Mean Higher High Water (MHHW) is used as a proxy for inundation. I Incomplete

Tropical Storm Cristobal 33
Table 4. Select rainfall totals in Central America and southeastern Mexico over a multi-day period from Tropical Storm Amanda, Atlantic Tropical Storm Cristobal, and a Central American gyre.
Location Amanda Rainfall
(in) (on or before 31
May)
Cristobal Rainfall (in)
(on or after 1 June) Total Rainfall
(in)
Mexicoa Ocotepec, Chiapas (OCOCP) (17.22N 93.15W) 10.71 24.09 34.80
Sayula, Chiapas (SAYCP) (17.43N 93.38W) 14.38 16.51 30.89
Xpujil, Campeche (XPJCA) (18.50N 89.40W) 13.11 16.81 29.92
Oxkutzcab, Yucatan (OXKYC) (20.29N 89.39W) 4.27 23.17 27.44
Tantaquin, Yucatan (TANYC) (20.03N 89.05W) 4.92 21.92 26.84
Bolonchén, Campeche (BOLCA) (20.00N 89.74W) 5.53 21.08 26.61
Emiliano Zapata, Yucatan (EZAYC) (20.98N 89.58W) 6.49 19.18 25.67
Observatorio de Valladolid, Yucatan (VALYC) (20.69N 88.20W)
0.75 24.54 25.29
Juan de Grijalva, Chiapas (JDGCP) (17.36N 93.38W) 13.36 11.91 25.27
Becanchén, Yucatan (BECYC) (19.88N 89.22W) 7.60 17.52 25.12
Sierra Morena CFE, Chiapas (SMORENACFE) (16.15N 93.59W) 1.77 23.21 24.98
Ticul, Yucatan (TICYC) (20.40N 89.56W) 2.94 21.54 24.48
Hopelchén, Campeche (HPOCA) (19.75N 89.85W) 2.13 22.32 24.45
Mocochá, Yucatan (MOCYC) (21.11N 89.44W) 2.46 21.72 24.18
Tapachula Malpaso, Chiapas (TAMCP) (14.99N 92.24W) 9.65 14.39 24.04
Boca del Cerro, Tabasco (BDCTB) (17.43N 91.48W) 7.90 16.02 23.92
Finca la Paz, Chiapas (FPZCP) (15.35N 92.48W) 3.07 19.98 23.05
Observatorio de Mérida, Yucatan (MEOYC) (20.95N 89.65W)
4.44 18.48 22.92
Escárcega, Campeche (ESCCA) (18.60N 90.74W) 1.69 21.17 22.86
San Joaquin, Chiapas (SJOCP) (17.56N 93.09W) 15.68 7.01 22.69

Tropical Storm Cristobal 34
Location Amanda Rainfall
(in) (on or before 31
May)
Cristobal Rainfall (in)
(on or after 1 June) Total Rainfall
(in)
Observatorio de Progreso, Yucatan (PROYC) (21.28N 89.65W)
6.06 16.56 22.62
Organismo de Cuenca Peninsula de Yucatan, Yucatan (GARYC) (20.98N 89.66W)
3.98 18.23 22.21
Muná, Yucatan (MUNYC) (20.49N 89.71W) 3.66 18.15 21.81
Puyacatengo, Tabasco (PUYTB) (17.57N 92.94W) 12.58 9.04 21.62
El Refugio, Chiapas (REFUGIOCP) (17.41N 93.03W) 9.79 11.78 21.57
Motul, Yucatan (MTOYC) (21.09N 89.29W) 3.10 18.45 21.55
Finca Hamburgo, Chiapas (FHACP) (15.17N 92.33W) 2.07 19.41 21.48
El Carmen, Campeche (CARCA) (18.65N 91.76W) 1.76 19.28 21.04
Tizimín, Yucatan (TIZYC) (21.16N 88.17W) 0.72 19.97 20.69
San José del Carmen, Veracruz (JOCVC) (17.87N 94.09W) 10.25 10.35 20.60
Cantamayec, Yucatan (CANYC) (20.46N 89.08W) 1.48 19.00 20.48
Abalá, Yucatan (ABAYC) (20.65N 89.68W) 2.22 18.10 20.32
Pueblo Nuevo, Tabasco (PNVTB) (17.85N 92.88W) 10.65 9.54 20.19
Planta de Bombeo 3 de La Cangrejera, Veracruz (PB3VC) (18.10N 94.38W)
9.06 11.01 20.07
Escuintla, Chiapas (ESCCP) (15.32N 92.67W) 5.18 14.82 20.00
El Salvadorb Volcán Conchagua 22.70 20.10 42.80 Volcán de San Miguel 20.43 18.14 38.57 Panchimalco 19.12 13.83 32.95 Nuevo Cuscatlán 18.13 13.93 32.06 Aeropuerto de Ilopango 19.60 11.77 31.37 Finca Los Andes 18.65 12.30 30.95 Izalco 16.09 14.22 30.31 Acajutla 12.05 17.76 29.81
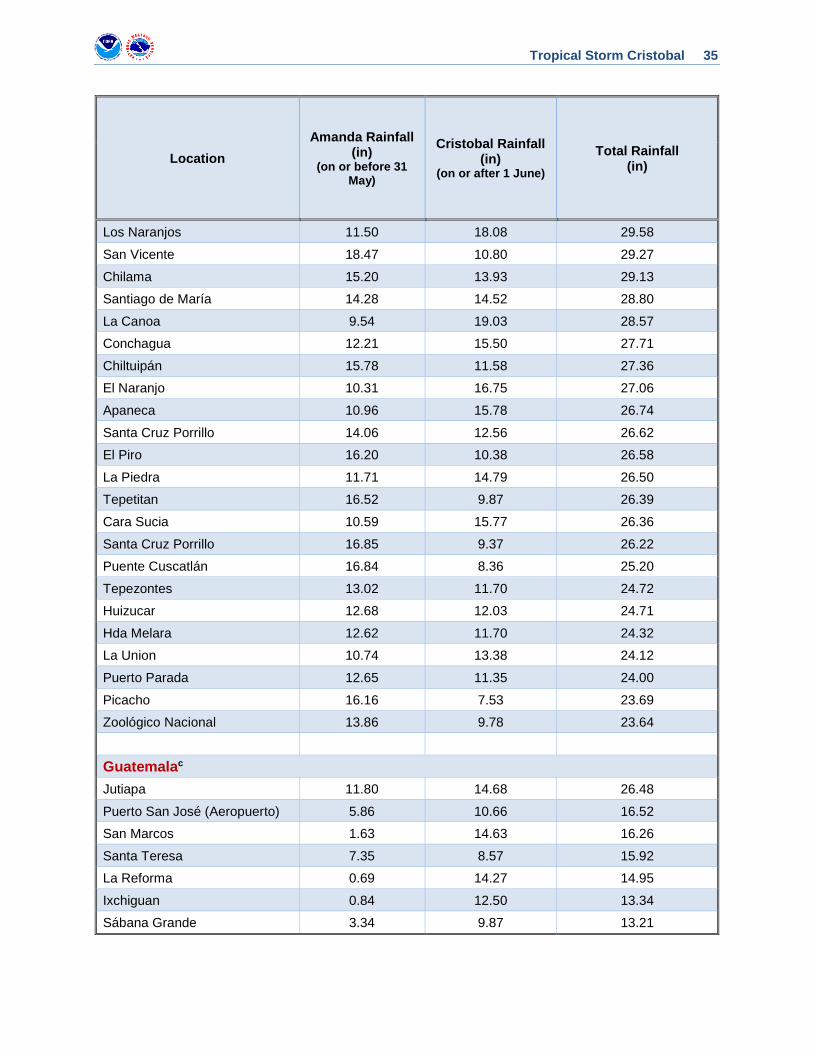
Tropical Storm Cristobal 35
Location Amanda Rainfall
(in) (on or before 31
May)
Cristobal Rainfall (in)
(on or after 1 June) Total Rainfall
(in)
Los Naranjos 11.50 18.08 29.58 San Vicente 18.47 10.80 29.27 Chilama 15.20 13.93 29.13 Santiago de María 14.28 14.52 28.80 La Canoa 9.54 19.03 28.57 Conchagua 12.21 15.50 27.71 Chiltuipán 15.78 11.58 27.36 El Naranjo 10.31 16.75 27.06 Apaneca 10.96 15.78 26.74 Santa Cruz Porrillo 14.06 12.56 26.62 El Piro 16.20 10.38 26.58 La Piedra 11.71 14.79 26.50 Tepetitan 16.52 9.87 26.39 Cara Sucia 10.59 15.77 26.36 Santa Cruz Porrillo 16.85 9.37 26.22 Puente Cuscatlán 16.84 8.36 25.20 Tepezontes 13.02 11.70 24.72 Huizucar 12.68 12.03 24.71 Hda Melara 12.62 11.70 24.32 La Union 10.74 13.38 24.12 Puerto Parada 12.65 11.35 24.00 Picacho 16.16 7.53 23.69 Zoológico Nacional 13.86 9.78 23.64
Guatemalac Jutiapa 11.80 14.68 26.48 Puerto San José (Aeropuerto) 5.86 10.66 16.52 San Marcos 1.63 14.63 16.26 Santa Teresa 7.35 8.57 15.92 La Reforma 0.69 14.27 14.95 Ixchiguan 0.84 12.50 13.34 Sábana Grande 3.34 9.87 13.21
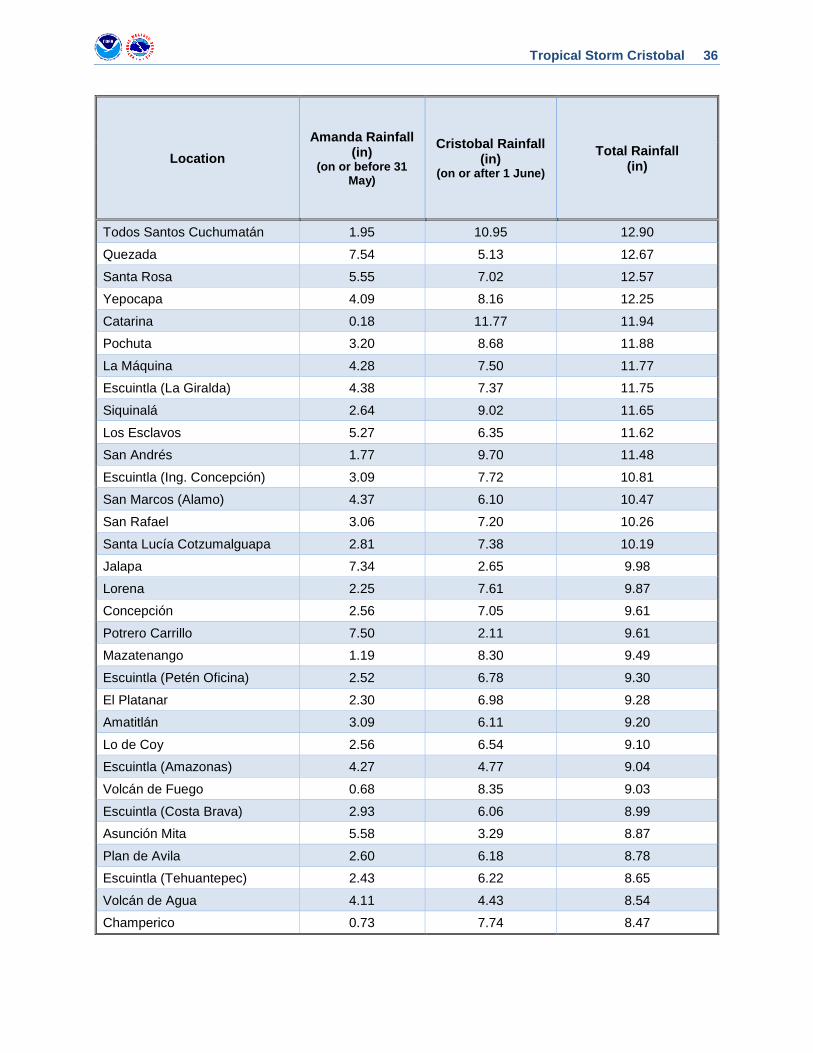
Tropical Storm Cristobal 36
Location Amanda Rainfall
(in) (on or before 31
May)
Cristobal Rainfall (in)
(on or after 1 June) Total Rainfall
(in)
Todos Santos Cuchumatán 1.95 10.95 12.90 Quezada 7.54 5.13 12.67 Santa Rosa 5.55 7.02 12.57 Yepocapa 4.09 8.16 12.25 Catarina 0.18 11.77 11.94 Pochuta 3.20 8.68 11.88 La Máquina 4.28 7.50 11.77 Escuintla (La Giralda) 4.38 7.37 11.75 Siquinalá 2.64 9.02 11.65 Los Esclavos 5.27 6.35 11.62 San Andrés 1.77 9.70 11.48 Escuintla (Ing. Concepción) 3.09 7.72 10.81 San Marcos (Alamo) 4.37 6.10 10.47 San Rafael 3.06 7.20 10.26 Santa Lucía Cotzumalguapa 2.81 7.38 10.19 Jalapa 7.34 2.65 9.98 Lorena 2.25 7.61 9.87 Concepción 2.56 7.05 9.61 Potrero Carrillo 7.50 2.11 9.61 Mazatenango 1.19 8.30 9.49 Escuintla (Petén Oficina) 2.52 6.78 9.30 El Platanar 2.30 6.98 9.28 Amatitlán 3.09 6.11 9.20 Lo de Coy 2.56 6.54 9.10 Escuintla (Amazonas) 4.27 4.77 9.04 Volcán de Fuego 0.68 8.35 9.03 Escuintla (Costa Brava) 2.93 6.06 8.99 Asunción Mita 5.58 3.29 8.87 Plan de Avila 2.60 6.18 8.78 Escuintla (Tehuantepec) 2.43 6.22 8.65 Volcán de Agua 4.11 4.43 8.54 Champerico 0.73 7.74 8.47

Tropical Storm Cristobal 37
Location Amanda Rainfall
(in) (on or before 31
May)
Cristobal Rainfall (in)
(on or after 1 June) Total Rainfall
(in)
Chiquirines 0.27 8.00 8.27 Retalhuleu (Xoluta) 1.70 6.52 8.22 El Porvenir 2.75 5.46 8.21 Escuintla (Cengicaña) 1.79 6.27 8.06
Hondurasb Sabana Grande 2.71 11.02 13.73 Caridad 2.95 9.79 12.74 Erandique 4.06 8.65 12.72 El Carrizo 3.93 6.82 10.74 Nacaome 0.59 9.83 10.43 Maraita 0.60 6.97 7.57 La Esperanza 1.23 5.77 7.00
Belizeb Yo Chen 3.70 10.19 13.89 Hershey 11.78 1.14 12.92 Yo Creek 5.83 7.04 12.87 Belmopan 11.82 0.88 12.70 August Pine 7.85 4.37 12.22 Middlesex 10.03 2.06 12.09 Libertad 2.56 8.59 11.15 Douglas 3.72 6.75 10.47 Tower Hill 4.14 6.20 10.34 Ranchito 2.19 7.53 9.72 San Estevan 2.87 6.74 9.61 Little Belize 2.16 7.29 9.45 Shipyard 6.01 3.20 9.21 Chunox 1.62 6.75 8.37 Blue Creek 8.15 0.00 8.15
a Rainfall totals in Mexico cover the period from 28 May to 6 June 2020. b Rainfall totals in El Salvador, Honduras, and Belize cover the period from 29 May to 7 June 2020. c Rainfall totals in Guatemala cover the period from 30 May to 5 June 2020.

Tropical Storm Cristobal 38
Table 5. Tornadoes documented during Tropical Storm Cristobal, 1–9 June 2020.
County Begin Location
End Location EF Scale Begin
Date/Time Length (miles)
Width (yards) Deaths Injuries Damage
Florida
Sumter 1 E Linden 1 E Linden 0 6/2153 0.25 75 0 0 0
Pinellas 1 W Clearwater
1 NW Clearwater 0 6/2159 0.91 75 0 0 30K
Orange 3 SE Orlovista
3 SE Orlovista 0 6/2207 0.01 10 0 0 0
Sumter 3 W Oxford 3 W Oxford 0 6/2220 0.51 75 0 0 40K
Orange 2 WNW Sky Lake
2 WNW Sky Lake 0 6/2240 0.01 20 0 0 0
Orange Belle Isle 1 SE Orlando 1 6/2320 5.12 500 0 0 956K
Volusia 1 SSE Lake Monroe
1 ESE Enterprise 0 7/0027 2.0 200 0 0 0
Columbia 2 ESE Bass 2 E Bass 0 7/1930 1.43 100 0 0 0
Lake 3 NW
Orange Bend
3 NW Orange Bend 0 7/1940 0.01 25 0 0 0
Union 2 SSE Duke 2 SSE Duke 0 7/2005 0.01 25 0 0 0
Lake 1 ESE Tavares 1 E Tavares 0 7/2241 0.5 20 0 0 0
Illinois
Ford 4 SSE Piper City
4 SE Piper City Unknown 9/2324 1.7 75 0 0 0
Iroquois 3 W Ridgeville
2 NNW Ridgeville Unknown 9/2326 2.66 75 0 0 0

Tropical Storm Cristobal 39
Table 6. Number of hours in advance of formation associated with the first NHC Tropical Weather Outlook forecast in the indicated likelihood category. Note that the timings for the “Low” category do not include forecasts of a 0% chance of genesis.
Hours Before Genesis
48-Hour Outlook 120-Hour Outlook
Low (<40%) 36 42
Medium (40%-60%) 30 30
High (>60%) 6 12
Table 7a. NHC official (OFCL) and climatology-persistence skill baseline (OCD5) track forecast errors (n mi) for Tropical Storm Cristobal, 1–9 June 2020. Mean errors for the previous 5-yr period are shown for comparison. Official errors that are smaller than the 5-yr means are shown in boldface type.
Forecast Period (h)
12 24 36 48 60 72 96 120
OFCL 19.5 30.7 44.7 57.4 65.6 70.9 102.0 145.2
OCD5 48.4 113.3 181.1 234.0 282.0 325.5 372.6 387.1
Forecasts 28 28 27 25 23 21 17 13
OFCL (2015-19) 24.1 36.9 49.6 65.1 80.7 96.3 133.2 171.6
OCD5 (2015-19) 44.7 96.1 156.3 217.4 273.9 330.3 431.5 511.9

Tropical Storm Cristobal 40
Table 7b. Homogeneous comparison of selected track forecast guidance models (in n mi) for Tropical Storm Cristobal, 1–9 June 2020. Errors smaller than the NHC official forecast are shown in boldface type. The number of official forecasts shown here will generally be smaller than that shown in Table 7a due to the homogeneity requirement.
Model ID Forecast Period (h)
12 24 36 48 60 72 96 120
OFCL 19.8 33.1 44.5 53.4 55.5 58.0 85.7 151.8
OCD5 46.8 104.8 167.5 209.5 248.8 291.4 387.2 439.6
GFSI 22.7 37.8 43.4 42.9 47.3 42.3 76.9 164.7
EMXI 27.3 44.4 62.6 76.3 81.6 88.3 106.7 155.0
CMCI 32.4 44.2 47.8 53.2 59.5 81.4 90.8 164.9
NVGI 25.9 41.5 54.3 68.0 88.2 125.0 218.4 332.9
HWFI 24.5 47.7 65.8 83.9 108.1 127.0 160.2 143.2
HMNI 23.1 42.8 54.9 70.9 87.7 103.5 120.4 149.9
HCCA 19.0 28.8 37.8 47.7 57.0 58.7 53.7 98.3
FSSE 21.6 34.2 47.9 56.6 54.6 56.5 63.9 67.5
AEMI 20.8 37.2 46.2 59.6 73.0 90.2 135.2 214.9
GFEX 19.4 30.5 39.8 46.2 53.5 55.0 83.4 157.5
TVCA 19.3 30.2 41.4 50.6 55.2 58.4 74.4 127.0
TVCX 19.4 30.3 42.3 50.8 55.1 57.5 72.3 127.6
TVDG 18.8 28.8 38.1 45.0 49.9 52.0 74.1 133.8
TABS 50.8 91.7 119.5 144.0 174.8 200.1 192.3 165.0
TABM 40.6 73.8 107.2 137.6 165.4 179.9 151.4 155.1
TABD 36.1 60.0 87.3 112.2 139.3 163.8 196.4 221.1
Forecasts 23 23 23 21 19 17 11 7

Tropical Storm Cristobal 41
Table 8a. NHC official (OFCL) and climatology-persistence skill baseline (OCD5) intensity forecast errors (kt) for Tropical Storm Cristobal, 1–9 June 2020. Mean errors for the previous 5-yr period are shown for comparison. Official errors that are smaller than the 5-yr means are shown in boldface type.
Forecast Period (h)
12 24 36 48 60 72 96 120
OFCL 4.5 5.5 4.8 4.6 5.0 6.7 5.6 8.8
OCD5 5.7 8.6 10.4 10.6 8.9 7.3 9.5 13.9
Forecasts 28 28 27 25 23 21 17 13
OFCL (2015-19) 5.2 7.7 9.4 10.7 11.9 13.0 14.4 15.5
OCD5 (2015-19) 6.8 10.8 14.1 17.0 18.8 20.6 22.5 24.6
Table 8b. Homogeneous comparison of selected intensity forecast guidance models (in kt) for Tropical Storm Cristobal, 1–9 June 2020. Errors smaller than the NHC official forecast are shown in boldface type. The number of official forecasts shown here will generally be smaller than that shown in Table 8a due to the homogeneity requirement.
Model ID Forecast Period (h)
12 24 36 48 60 72 96 120
OFCL 4.3 5.2 4.6 4.0 3.4 5.6 6.7 8.1 OCD5 5.7 8.2 10.2 10.7 9.5 8.6 7.2 11.0
HWFI 4.6 4.7 5.5 6.0 6.9 6.0 3.8 6.0
HMNI 5.3 5.5 4.1 4.3 4.1 4.2 2.9 6.0
DSHP 5.3 6.6 6.3 5.7 4.9 4.7 5.5 4.0
LGEM 5.5 6.7 7.8 6.9 5.4 5.0 5.4 5.1
ICON 4.6 5.1 5.2 4.2 3.5 3.1 3.2 4.5
IVCN 4.1 4.4 4.1 3.0 2.6 2.2 3.2 4.4
HCCA 4.1 4.3 4.0 3.4 3.0 2.4 4.6 6.9
FSSE 3.7 4.7 6.4 5.7 5.1 6.6 12.2 14.5
GFSI 4.6 4.8 4.5 3.9 4.7 5.6 7.3 9.6 EMXI 5.7 5.6 5.7 4.5 4.3 3.9 3.9 3.2
Forecasts 23 23 23 21 19 17 12 8

Tropical Storm Cristobal 42
Table 9a. Tropical cyclone wind watch and warning summary for Tropical Storm Cristobal, 1–9 June 2020.
Date/Time (UTC) Action Location
1 / 2100 Tropical Storm Warning issued Campeche to Puerto de Veracruz
3 / 1500 Tropical Storm Warning modified to Campeche to Coatzacoalcos
4 / 1500 Tropical Storm Warning discontinued All
5 / 1200 Tropical Storm Watch issued Punta Herrero to Rio Lagartos
5 / 1500 Tropical Storm Watch issued Intracoastal City LA to AL/FL Border
5 / 1800 Tropical Storm Watch changed to Tropical Storm Warning Punta Herrero to Rio Lagartos
5 / 2100 Tropical Storm Watch modified to Intracoastal City LA to Morgan City LA
5 / 2100 Tropical Storm Warning issued Morgan City LA to Okaloosa/Walton County FL Line
6 / 0300 Tropical Storm Warning discontinued Punta Herrero to Rio Lagartos
6 / 1500 Tropical Storm Warning modified to Intracoastal City LA to Okaloosa/Walton County FL Line
8 / 0000 Tropical Storm Warning modified to Morgan City LA to Okaloosa/Walton County FL Line
8 / 0900 Tropical Storm Warning discontinued All

Tropical Storm Cristobal 43
Table 9b. Storm surge watch and warning summary for Tropical Storm Cristobal, 1–9 June 2020.
Date/Time (UTC) Action Location
5 / 1500 Storm Surge Watch issued Grand Isle LA to Ocean Springs MS, including Lake Borgne
5 / 1500 Storm Surge Watch issued Indian Pass FL to Arepika FL
5 / 2100 Storm Surge Warning issued Mouth of the Mississippi River LA to Ocean Springs MS, including Lake Borgne
5 / 2100 Storm Surge Watch modified East of Morgan City LA to the Mouth of the Mississippi River LA
6 / 1500 Storm Surge Watch discontinued Indian Pass FL to Arepika FL
8 / 0000 Storm Surge Watch discontinued East of Morgan City LA to the Mouth of the Mississippi River LA
8 / 1200 Storm Surge Warning discontinued All

Tropical Storm Cristobal 44
Figure 1. Best track positions for Tropical Storm Cristobal, 1–9 June 2020. The track over the United States and Canada is partially based on analyses from the NOAA Weather Prediction Center.

Tropical Storm Cristobal 45
Figure 2. Selected wind observations and best track maximum sustained surface wind speed curve for Tropical Storm Cristobal, 1–9 June 2020. Aircraft observations have been adjusted for elevation using 80% and 75% adjustment factors for observations from 850 mb and 1500 ft, respectively. Advanced Dvorak Technique estimates represent the Current Intensity at the nominal observation time. SATCON intensity estimates are from the Cooperative Institute for Meteorological Satellite Studies. Dashed vertical lines correspond to 0000 UTC, and solid vertical lines correspond to landfalls.
Tropical Storm Cristobal 46
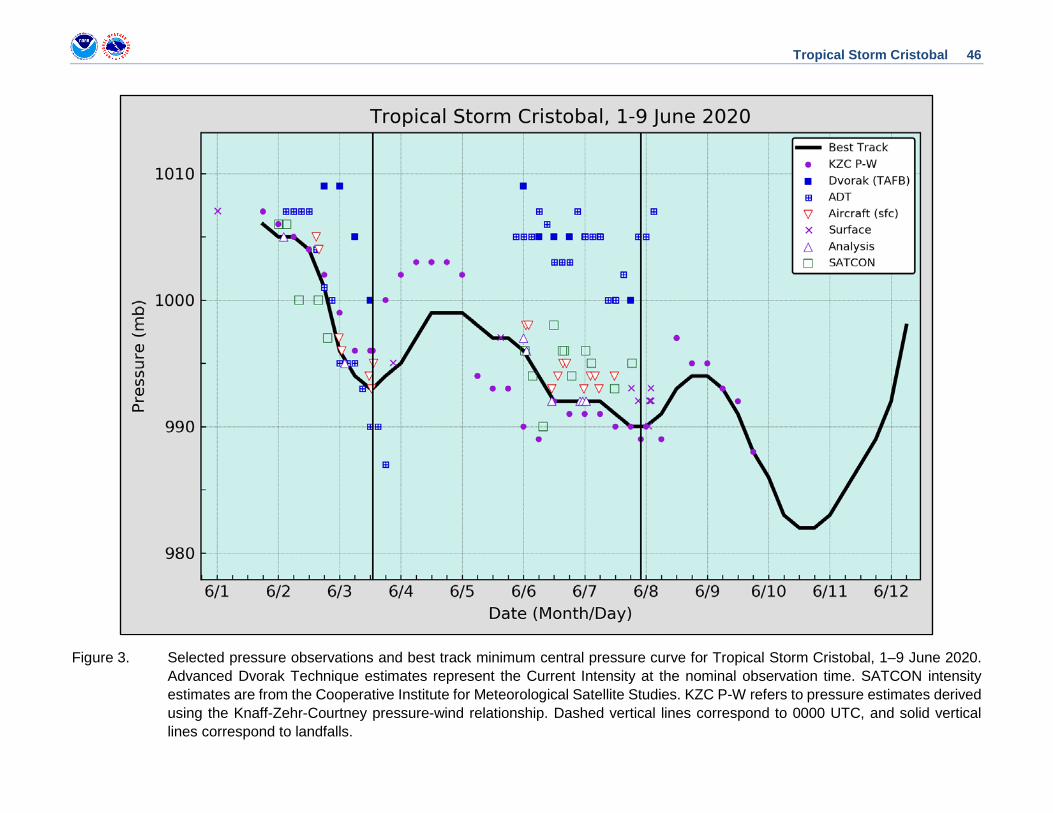
Figure 3. Selected pressure observations and best track minimum central pressure curve for Tropical Storm Cristobal, 1–9 June 2020. Advanced Dvorak Technique estimates represent the Current Intensity at the nominal observation time. SATCON intensity estimates are from the Cooperative Institute for Meteorological Satellite Studies. KZC P-W refers to pressure estimates derived using the Knaff-Zehr-Courtney pressure-wind relationship. Dashed vertical lines correspond to 0000 UTC, and solid vertical lines correspond to landfalls.

Tropical Storm Cristobal 47
Figure 4. Selected peak sustained winds (kt) reported during Tropical Storm Cristobal. An asterisk denotes observations that were elevated more than 20 m above the surface.

Tropical Storm Cristobal 48
Figure 5. Maximum water levels measured from tide gauges during Tropical Storm Cristobal. Water levels are referenced as feet above Mean Higher High Water (MHHW), which is used as a proxy for inundation (above ground level) on normally dry ground along the immediate coastline.

Tropical Storm Cristobal 49
Figure 6. Nine-day rainfall accumulations (mm) in Central America and southeastern Mexico from 29 May to 7 June 2020, covering the period that the region was affected by Tropical Storm Amanda, Tropical Storm Cristobal, and a Central American gyre (CAG). Analysis and image courtesy of the NOAA Weather Prediction Center International Desk and the national meteorological services of the region.

Tropical Storm Cristobal 50
Figure 7. Rainfall accumulations (inches) from Tropical Storm Cristobal. Image courtesy of David Roth at the NOAA Weather Prediction Center.

Tropical Storm Cristobal 51
Figure 8. Maximum water levels measured from tide gauges (circles) during Tropical Storm Cristobal and areas covered by storm surge watches (lavender) and warnings (magenta). Water levels are referenced as feet above Mean Higher High Water (MHHW), which is used as a proxy for inundation (above ground level) on normally dry ground along the immediate coastline. Black markers denote water levels less than 3 ft above ground level, and white markers denote water levels 3 ft or higher above ground level.


![[The Hurricane] Grant Kenney, Jelani P.. Hurricane A Hurricane is a tropical storm that has consistently had speeds over 74mph. The eye of the storm is.](https://static.fdocuments.us/doc/165x107/56649ce35503460f949aff8f/the-hurricane-grant-kenney-jelani-p-hurricane-a-hurricane-is-a-tropical.jpg)