Trends in International Migration - OECD.org · Other 2.3 1.6 2.0 2.5 7.1 ... Trends in...
150
SOPEMI Trends in International Migration Continuous Reporting System on Migration ANNUAL REPORT 2001 EDITION ORGANISATION FOR ECONOMIC CO-OPERATION AND DEVELOPMENT
Transcript of Trends in International Migration - OECD.org · Other 2.3 1.6 2.0 2.5 7.1 ... Trends in...

SOPEMI
Trendsin International
Migration
Continuous Reporting System on Migration
ANNUAL REPORT
2001 EDITION
ORGANISATION FOR ECONOMIC CO-OPERATION AND DEVELOPMENT

119
© OECD 2001
Part III
RECENT CHANGES IN MIGRATION MOVEMENTS AND POLICIES (COUNTRY NOTES)
This Section is comprised of detailed notes on the trends in migration flows and policies in each of thecountries studied. The characteristics of each country are presented as follows:
1. Trends in migration movements.
2. Structure and changes in the foreign population.
3. Migration and the labour market.
4. Policy developments.
Australia
Introduction
Australia’s economic growth averaged over 4% during the second half of the 1990s. Although the rate ofgrowth has been decelerating since 1998, with a pronounced slowdown taking place in the second half of 2000,unemployment has continued to decline; at the end of 2000 it was just over 6.5%. Against a background of con-tinued structural improvement in productivity performance, employment growth is likely to remain robust.
The policy initiatives implemented in 1999-2000 have been motivated by four key aims: to improve thealignment between the needs of Australia’s economy and the entry requirements imposed on immigrants; toensure that the Australian public continues to have confidence in the way that border controls are managed;to maintain the integrity and effectiveness of the country’s humanitarian programme; and, to develop sociallyand culturally appropriate settlement policies in such a way as to enhance the multicultural nature of Austra-lian society.
1. Trends in migration movements
Inflows and outflows of foreign-born persons
Permanent and long-term migration
Net migration during 1999/2000 was estimated at 107 300: both permanent entries and definitive depar-tures rose by 10 and 17% respectively, to 92 300 and 41 100 respectively; the latter being the highest recordedin the series since 1973/1974. Long-term entries (12 months or more) rose by 13% to 212 900 and long-termdepartures rose by 12% to 156 800.
AUSTRALIA

Trends in International Migration
120
© OECD 2001
As in the previous year and reflecting the relative economic conditions in the two countries, the increasein the number of permanent entries was mainly due to the increase in the number of permanent entries fromNew Zealand; in 1999/2000 the rate of increase did decelerate however, from 27 to 17%. Permanent departures,though much lower than entries, have been following a rising trend; the proportion of Australian residentsamong these departures, having risen over the previous few years was unchanged at 51% in 1999/2000.
In 1999/2000, net long-term movements (12 months or more) totalled 56 100, a rise of 18% on the previousyear (see Chart III.1). (A period of strong economic growth in Australia is generally accompanied by a rise inthe number of long-term entries.) In 1999/2000 ten countries (the United Kingdom, the United States, NewZealand, Indonesia, Japan, Singapore, Malaysia, China, India and Korea) each accounted for between 3 and18% of long-term entrants. For the fourth consecutive year, United Kingdom nationals formed the largestgroup, with nearly 23 400 entries.
Chart III.1. Flows of permanent and long-term residents, AustraliaFiscal years 1982/1983-1999/2000
Thousands
160
140
120
100
80
60
40
20
01983 85 87 89 91 93 95 9997 1983 85 87 89 91 93 95 9997
160
140
120
100
80
60
40
20
0
1983 85 87 89 91 93 95 9997
%100
80
60
40
20
02000
20002000
Permanent and long-term flowsLong-term flowsPermanent flows
FamilyHumanitarian1
Skill1
Total2
New ZealandOtherAsia3United Kingdom
C. Inflows of permanent residentsby country or region of origin
A. Net migration B. Inflows of permanent residents by entry class
160
140
120
100
80
60
40
20
01983 85 87 89 91 93 95 9997 1983 85 87 89 91 93 95 9997
160
140
120
100
80
60
40
20
0
1983 85 87 89 91 93 95 9997
%100
80
60
40
20
02000
20002000
Permanent and long-term flowsLong-term flowsPermanent flows
FamilyHumanitarian1
Skill1
Total2
New ZealandOtherAsia3United Kingdom
C. Inflows of permanent residentsby country or region of origin
A. Net migration B. Inflows of permanent residents by entry class
Note: The classification into permanent, long and short term is based onthe purpose of travel as stated by the traveller on arrival to or depar-ture from Australia. Permanent movement consists of persons arriv-ing with the stated intention to settle permanently in Australia and ofAustralian residents departing with the stated intention to resideabroad permanently. Long-term movement consists of the arrivaland the departure of persons with the stated intention to stay (inAustralia or abroad, respectively) for 12 months or more. The neteffect of persons whose travel intentions change (category jumping)is not included.
1. Including accompanying dependents.2. Including non-visaed entry class (mainly New Zealand citizens).3. China, Chinese Taipei, Hong Kong (China), India, Philippines, Malaysia
and Sri Lanka.Source: Department of Immigration, Local Government and Ethnic Affairs.
Australia
121
© OECD 2001
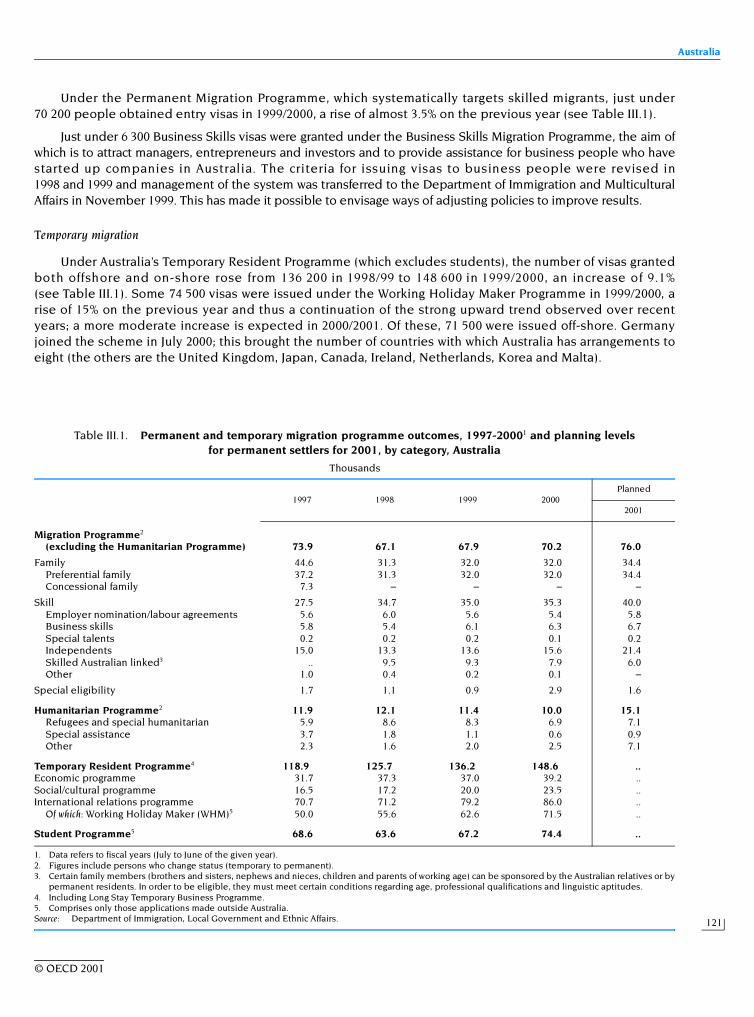
Under the Permanent Migration Programme, which systematically targets skilled migrants, just under70 200 people obtained entry visas in 1999/2000, a rise of almost 3.5% on the previous year (see Table III.1).
Just under 6 300 Business Skills visas were granted under the Business Skills Migration Programme, the aim ofwhich is to attract managers, entrepreneurs and investors and to provide assistance for business people who havestarted up companies in Australia. The criteria for issuing visas to business people were revised in1998 and 1999 and management of the system was transferred to the Department of Immigration and MulticulturalAffairs in November 1999. This has made it possible to envisage ways of adjusting policies to improve results.
Temporary migration
Under Australia’s Temporary Resident Programme (which excludes students), the number of visas grantedboth offshore and on-shore rose from 136 200 in 1998/99 to 148 600 in 1999/2000, an increase of 9.1%(see Table III.1). Some 74 500 visas were issued under the Working Holiday Maker Programme in 1999/2000, arise of 15% on the previous year and thus a continuation of the strong upward trend observed over recentyears; a more moderate increase is expected in 2000/2001. Of these, 71 500 were issued off-shore. Germanyjoined the scheme in July 2000; this brought the number of countries with which Australia has arrangements toeight (the others are the United Kingdom, Japan, Canada, Ireland, Netherlands, Korea and Malta).
Table III.1. Permanent and temporary migration programme outcomes, 1997-20001 and planning levels for permanent settlers for 2001, by category, Australia
Thousands
1. Data refers to fiscal years (July to June of the given year).2. Figures include persons who change status (temporary to permanent).3. Certain family members (brothers and sisters, nephews and nieces, children and parents of working age) can be sponsored by the Australian relatives or by
permanent residents. In order to be eligible, they must meet certain conditions regarding age, professional qualifications and linguistic aptitudes.4. Including Long Stay Temporary Business Programme.5. Comprises only those applications made outside Australia.Source: Department of Immigration, Local Government and Ethnic Affairs.
1997 1998 1999 2000Planned
2001
Migration Programme2
(excluding the Humanitarian Programme) 73.9 67.1 67.9 70.2 76.0
Family 44.6 31.3 32.0 32.0 34.4Preferential family 37.2 31.3 32.0 32.0 34.4Concessional family 7.3 – – – –
Skill 27.5 34.7 35.0 35.3 40.0Employer nomination/labour agreements 5.6 6.0 5.6 5.4 5.8Business skills 5.8 5.4 6.1 6.3 6.7Special talents 0.2 0.2 0.2 0.1 0.2Independents 15.0 13.3 13.6 15.6 21.4Skilled Australian linked3 .. 9.5 9.3 7.9 6.0Other 1.0 0.4 0.2 0.1 –
Special eligibility 1.7 1.1 0.9 2.9 1.6
Humanitarian Programme2 11.9 12.1 11.4 10.0 15.1Refugees and special humanitarian 5.9 8.6 8.3 6.9 7.1Special assistance 3.7 1.8 1.1 0.6 0.9Other 2.3 1.6 2.0 2.5 7.1
Temporary Resident Programme4 118.9 125.7 136.2 148.6 ..Economic programme 31.7 37.3 37.0 39.2 ..Social/cultural programme 16.5 17.2 20.0 23.5 ..International relations programme 70.7 71.2 79.2 86.0 ..
Of which: Working Holiday Maker (WHM)5 50.0 55.6 62.6 71.5 ..
Student Programme5 68.6 63.6 67.2 74.4 ..

Trends in International Migration
122
© OECD 2001
The Skilled Temporary Resident Programme covers entries of business people (holders of Temporary Busi-ness Entry Long-Stay visas), people in the medical profession and academics. Having fallen by 1% in 1998/1999,the number of Temporary Business Entry Long-Stay visas rose by 5% in 1999/2000 to slightly under 35 000(including dependants). One quarter were IT workers. A total of 236 100 Business Visitor visas were issuedin 1999/2000, an increase of 12% on the previous year; almost 55 000 of these were issued to United States citi-zens, 36 100 to Chinese nationals, over 19 000 to United Kingdom nationals and 17 300 to citizens of Japan.
The number of visas issued to students off-shore rose by almost 11% in 1999/2000 to just over 74 400. As inprevious years, the principal source countries were, in descending order of importance, the United States,China, Malaysia, Indonesia, Hong Kong (China), Singapore, Japan, India, Thailand and Korea.
Visitors
Some 3.3 million visitor visas were granted in 1999/2000, 7% more than in 1998/99. The most significant above-general-trend increase was that of Koreans, the number of whom rose by some 68% to 131 300, having declinedfrom 217 000 in 1996/97 to 78 200 in 1998/99 as a result, it can reasonably be assumed of the effects of the financialcrisis. Although the number of short-term entrants from Japan continues to decline, in 1999/2000 it fell by over 5%, at650 000 it remains the most important source of visitors to Australia, accounting for 20% of the total.
Illegal immigration
Because of the “universal” visa system and the fact that Australia has no land borders, it is assumed thatvery few people enter the country without proper documentation. There does exist a problem, however, ofpeople who enter the country legally and then remain there beyond the visa’s expiry date (“overstayers”).Their number was estimated at over 58 750 on 30 June 2000 (i.e. 10.5% more than in June 1999). Four fifths ofthem had entered on visitor visas. Just under 30% of the total have overstayed their visa by less than one year;slightly more than 40% have done so by more than four years.
The number of people refused entry because they lacked proper documentation increased steadily dur-ing the period 1994/95-1998/99 reaching 2 100 before falling back to just under 1 700 in 1999/2000. The numberof persons detected whilst attempting to illegally enter the country by boat has risen sharply over recentyears: excepting 1994/95, the number did not exceed 600 between 1989/90 and 1997/98; in 1998/1999 just over900 were detected and in 1999/2000 almost 4 200.
Refugees and asylum seekers
In 1999/2000, a notional 12 000 places were set aside for the Humanitarian Programme. Of these12 000 places, a notional 10 000 were allocated to the offshore component of the programme and a notional2 000 to the onshore component. The actual out-turn was a total of 9 960 of which 7 500 were granted offshore.Of these visas granted offshore, 45% were granted to Europeans, the overwhelming majority of whom werefrom the former Yugoslavia; nationals of Middle Eastern countries, predominantly Iran, Iraq and Afghanistanaccounted for a further 30% and Africans almost 25%.
Over 12 700 asylum applications were lodged in 1999/2000, an increase of 54% on 1998/99. Marking a pro-nounced shift from 1998/99, when Indonesian, Chinese and Sri Lanka nationals together accounted for approxi-mately 40% of applications, Iraq and Afghanistan together accounted for one third of the applications withChina accounting for a further 8%. The most significant increases were from Iraq (from 420 to 2 390) and Afghanistanfrom 120 to 1 770; the majority of those from both these countries entered the country illegally by boat(see above and the section on “Policy Developments” below).
2. Structure and changes in the foreign-born population
Numerical trends
Of Australia’s total population of 19 million in December 1999, an estimated 23.6% had been born overseas.The 1996 census provided quite a detailed account of this overseas-born population (see Table III.2). With theexception of the United Kingdom, no single country of origin stood out from the rest. This is due to the fact that

Australia
123
© OECD 2001
since the post-war period there have been waves of immigration from a wide range of countries. The provisionalfigures for the composition of the resident population in 1999 suggest that since 1996 there have taken place sig-nificant above-general-trend increases in the number of persons originating from New Zealand, South-East Asia(Indonesians in particular) and mainland China (whereas the number of those from the Special AdministrativeRegions of Hong Kong and Macao are believed to have fallen by approximately one quarter).
Naturalisations
Having declined by almost one third in 1998/99, the number of people acquiring Australian citizenship fellby a further 7% in 1999/2000. Persons holding British passports (including that for British nationals overseas)
Table III.2. Socio-demographic characteristics of the native and foreign-born population, Australia, 1996 Census
Source: 1996 Census, Australian Bureau of Statistics.
Born in Australia Foreign-born
Thousands Per cent Thousands Per cent
Total 14 614.4 100.0 3 908.3 100.0
Country of birthUnited Kingdom 1 072.5 27.4New Zealand 291.4 7.5Italy 238.2 6.1Former Yugoslavia 175.5 4.5Vietnam 151.1 3.9
Age0-14 3 452.7 26.1 226.1 5.815-24 2 097.9 15.9 385.8 9.925-49 4 718.4 35.7 1 824.9 46.750-64 1 540.0 11.6 850.6 21.865+ 1 418.9 10.7 620.9 15.9
Males per 100 females 97.4 99.7
Nature of occupancyOwner/purchaser 9 107.0 72.0 2 579.9 69.5Tenant 3 426.3 27.1 1 100.1 29.6Other 113.9 0.9 31.1 0.8
Highest qualificationDegree/Diploma 1 579.2 16.2 705.6 19.2Skilled/Basic vocational 1 382.4 14.1 481.5 13.1
English proficiencyUses English only 12 309.5 94.1 2 027.1 52.5Speaks English very well/well 638.7 5.2 1 401.2 36.3Speaks English not well/at all 94.2 0.7 435.2 11.3
Main language spoken at home1. English 94.3 51.92. Italian 1.2 5.53. Greek 1.0 4.2
Labour force statusEmployed 5 691.0 91.4 1 870.4 89.3Unemployed 535.7 8.6 225.1 10.7Not in labour force 3 466.6 35.8 1 545.7 42.5
Occupation (skill level)Managers/Admin/Prof 1 507.0 27.2 499.7 27.5Technician/Assoc Prof 639.0 11.5 215.5 11.9High Skill-Trade Clerical 994.5 17.9 318.7 17.5Intermediate Skill 1 408.1 25.4 456.3 25.1Low Skill-Clerk Labourer 1 001.1 18.0 326.0 18.0
Individual incomeLess than $300 per week 4 659.8 49.8 1 861.5 52.8$800 per week or more 1 020.8 10.9 379.8 10.8

Trends in International Migration
124
© OECD 2001
accounted for just over 20% of the total followed by Chinese nationals (11%) and New Zealanders (9%); noother country accounted for more than 5% of the total.
3. Migration and the labour market
Migration for employment and work permits
In August 2000, overseas-born workers accounted for slightly less than 20% of the total labour force. Ofthese, 57.5% came from non-English-speaking countries. The participation rate of those born overseas is 58%(54% for nationals of non-English-speaking countries and 64% for those of English-speaking countries) as com-pared with 67% for persons born in Australia.
For a wide variety of reasons, such as knowledge of English, age, skills, type of migration and length ofresidence in Australia, unemployment tends to be higher overall among foreigners than among Australiannationals, though lower for those born overseas in English-speaking countries. In August 2000, the average rateof unemployment was 6.2%: 6.1% for people born in Australia and 6.5% for those born overseas. Unemploy-ment among nationals of English-speaking countries was 5.3% as compared with 7.4% among those from othercountries.
4. Policy developments
The policy initiatives implemented in 1999-2000 have been motivated by four key objectives: to improvethe alignment between the needs of Australia’s economy and the entry requirements imposed on immigrants;to ensure that the Australian public continues to have confidence in the way that border controls are man-aged; to maintain the integrity and effectiveness of the country’s humanitarian programme; and, to developsocially and culturally appropriate settlement policies in such as way as to enhance the multicultural nature ofAustralian society.
Business skills migration
A review of the terms under which businesspeople may enter the country was undertaken by the Busi-ness Advisory Panel to the Minister for Immigration and Multicultural Affairs in November 1999. The reviewexamined the scope for adjusting current policy settings to achieve better outcomes. All of the Panel’s recom-mendations were accepted in principle by the Minister; the most important of those to have been imple-mented by October 2000 were the lowering of the net asset requirement and the removal of the employee
Box III.1. Longitudinal survey of immigrants to Australia
The findings of the Survey of Immigrants to Australia, launched in March 1994 using information collectedfrom 5 000 new settlers and their families 6, 18 or 42 months after their arrival in the country show that unemploy-ment among foreigners varies substantially across visa classes (ranging from 84% in the “humanitarian” class aftersix months in the country to 26% in the “independent” class) but also that, on average, unemployment falls from37% after six months in the country to 14% after 42 months. The average labour-market participation rate after thesame periods of time rises from 58% to 69%.
A further survey, commissioned by the Department of Immigration and Multicultural Affairs (DIMA), willbe conducted among some 3 000 migrants and their families who entered the country between1 September 1999 and 31 August 2000. The main aim of the survey is to provide the Commonwealth and otherinstitutions with reliable data to enhance immigration and settlement policies, but also to analyse policy changesmade since 1996.

Austria
125
© OECD 2001
requirement in the applications points test. In addition, the Established Business in Australia and RegionalEstablished Business in Australia categories are being reformed to achieve a better dispersal of migrantsthroughout Australia, greater integrity of the visa subclasses and a greater proportion of successful businesses.The remaining recommendations are undergoing further research and development.
Sponsored visitors
A new sponsored visitor visa class for family and business visitors which leaves open for the decisionmaker the option of requesting a security bond in respect of the visitor commenced on 1 July 2000. It is hopedthat the introduction of this new class of visa will permit more visitors to enter the country (previously, mar-ginal cases would have been rejected outright) whilst safeguarding the integrity of the immigration system. If asponsored visitor does not abide by the conditions of their visa, their sponsor will be prevented from lodgingfurther sponsorships under this class of visa for five years and will forfeit any bond that has been lodged.
Temporary protection visas
In response to this phenomenon of asylum seekers entering the country illegally by boat, the governmentintroduced in October 1999 a new Temporary Protection Visa (TPV) to be granted to those unauthorised arriv-als found to be owed protection obligations. The TPV provides protection for three years in the first instanceand permits the holder to take up employment and grants them access to health care and basic social securitybenefits (though not to the more generous benefits accorded to refugees i.e., English language training, settle-ment support services and access to full social security benefits nor does it provide access to family reunionor a right of re-entry to Australia after departure). After three years, TPV holders who are still owed protectionobligations and meet other visa criteria are eligible to apply for grant of a permanent protection visa and ifgranted, to receive the associated benefits.
A new agenda for multicultural Australia
Australia’s policy of multiculturalism had its origin in the early 1970s. This policy was restated, developedand refocused in December 1999 when A New Agenda for Multicultural Australia was published. It effectivelybecame the government’s policy statement on multiculturalism. The agenda “Emphasises that multiculturalpolicies and programmes should be built on the foundation of Australia’s democratic system, using the follow-ing core principles, to ensure that multicultural Australia continues to flourish for the good of all Australians:civic duty, which obliges all Australians to support those basic structures and principles of Australian societywhich guarantee us our freedom and equality and enable diversity in our society to flourish; cultural respect,which, subject to the law, gives all Australians the right to express their own culture and beliefs and obligesthem to accept the right of others to do the same; social equity, which entitles all Australians to equality of treat-ment and opportunity so that they are able to contribute to the social, political and economic life of Australia,free from discrimination, including on the grounds of race, culture, religion, language, location, gender or placeof birth; and productive diversity, which maximises for all Australians the significant cultural, social and economicdividends arising from the diversity of our population”.
Austria
Introduction
Economic growth in Austria slowed down during 1999, as a result of the weak economic activity in Centraland Eastern Europe and the economic crisis in Asia, but accelerated to 3.2% in 2000. However, a slowdown to2.3%, mainly due to a sluggish US economy is expected for 2001. Unemployment, as a percentage of thedependent employment, has decreased for the first time during the economic upswing to 5.7% in 1998 and5.3% in 1999. The unemployment rate decreased further to 4.6% in 2000 and stabilised at that level in the first
AUSTRIA

Trends in International Migration
126
© OECD 2001
quarter of 2001. Foreign employment has increased in 1999 for the first time since 1996 and is expected toincrease further in 2000. There is a clear trend of decreasing numbers of employed foreigners with temporarywork permits; the number of workers with permanent permits has increased at the same time. This might indi-cate a growing preference for Austria as a settlement country.
Of the 8 092 300 people residing in Austria in 1999, 748 200 were foreigners (9%). Due to ageing, the work-ing age population (15-59 year olds) is expected to shrink further in 2001 and the participation of older work-ers in the labour force will decrease. These developments are expected to lead to an increase in theemployment of people from outside the EU.
1. Trends in migration movements
Emigration
Net migration of Austrians has been negative since the eighties (see Chart III.2). However, a tendency toincreased net emigration of Austrians can be observed from the mid-nineties onwards (–9 600 in 1999,see Table III.3). The principal destinations are Switzerland and Germany. These countries provide reliable dataon the stock of Austrian workers: the number of Austrians in Germany has shown a decline since 1993. In 1999,70 179 Austrians were employed in Germany and 11 198 in Switzerland. In 2000, the figures for Switzerland hadshowed a slight increase. The Austrian Statistical Office cannot explain the continued decline of the number ofAustrian wage and salary earners in Germany since Austrian data show significant net outflows to that country.An explanation could be a sharp increase in non-traditional employment in the high-technology sectors of thenew economy that do not appear from the statistics on wage and salaried employment.
Chart III.2. Components of population change, 1983-1999, AustriaThousands
Source: Austrian Central Statistical Office.
100
80
60
40
20
0
-201983 85 87 89 91 93 95 97 99
30
25
20
15
10
0
-10
-5
5
1983 87 89 91 93 95 97 9985
Net migration(Austrians)
Net migration(Foreigners)
Total change(Austrians)
Total change(Foreigners)
Natural increase(Austrians)
Acquisition of Austriannationality
Natural increase(Foreigners)
A. Net migration and total change in population B. Natural increase and naturalisations

Austria
127
© O
EC
D 2001
Table III.3. Current figures on the components of total population change, on flows and stocks of foreign population and labour force in Austria
All figures in thousands unless otherwise indicated
1. Calculations are based on the 1991 census. The naturalisations refer to persons residing in Austria.2. Annual average. Employment of foreigners based on social security data records.3. Data given as an annual average. The data exclude the unemployed and self-employed and citizens of the European Economic Area (EEA).
Several types of permits are issued:– Short term permits: granted to an enterprise for a maximum duration of one year (renewable) and for a specific activity. Data include persons entering the labour market for the first time, seasonal work-
ers, those who are changing jobs or taking up activity after a period of unemployment of at least six months and holders of provisional permits (when the application process takes more than fourweeks). Extensions of permits are also included.
– Work entitlements: granted for a maximum duration of two years (renewable). May be obtained after one year of work in Austria.– Permanent permits: granted after five years of work and valid for five years (renewable).
4. Data are based on the unemployment register.5. Data as of June for Germany, August for Switzerland.Sources: Central Alien Register; Central Statistical Office; Ministry of the Interior; Ministry of Labour, Health and Social Affairs; Social Security database on labour force.
1996 1997 1998 1999 1996 1997 1998 1999
Components of population change1 Stocks of foreign workers, by nationality2 300.4 298.8 298.6 306.4Total population Former Yugoslavia (%) 49.3 49.3 49.7 49.5
Population (annual average) 8 059.4 8 072.2 8 078.4 8 092.3 Turkey (%) 17.8 17.7 18.2 18.2Population increase 13.0 7.6 7.4 19.7 EU (%) 7.8 8.3 9.0 9.7of which: Other (%) 25.0 24.6 23.0 22.6
Natural increase 8.0 4.6 2.9 –0.1 Share of foreign employment in total employment (%) 9.9 9.8 9.7 9.9Net migration 5.0 3.0 4.5 19.8
Total of employed workers, by category of permit3 257.2 247.3 240.5 239.1Austrians Short-term work permits 43.7 36.6 28.9 23.3
Population (annual average) 7 331.2 7 339.5 7 341.2 7 344.1 Work entitlements 92.3 67.3 45.5 29.5Population increase 8.4 4.1 1.9 6.0 Permanent permits 121.2 143.4 166.1 186.3of which:
Natural increase –2.2 –4.7 –6.1 –9.0 Work permits issued to foreigners, by category 127.5 119.5 110.3 98.5Net migration –5.0 –7.0 –9.8 –9.6 Initial permits issued 51.9 52.7 47.7 45.7Naturalisations 15.6 15.8 17.8 24.7 Extensions issued 35.8 24.3 20.9 22.6
Permanent permits issued 39.8 42.5 41.7 30.2Foreigners
Population (annual average) 728.2 732.7 737.3 748.2 Unemployment rate, total4 7.0 7.1 7.2 6.7Population increase 4.6 3.5 5.5 13.7 Unemployment rate, foreigners 8.4 8.4 8.7 8.2of which:
Natural increase 10.2 9.3 9.0 9.0 Employment of Austrians abroad5
Net migration 10.0 10.0 14.3 29.4 Austrian employees in Federal Republic of Germany 79.4 74.8 72.2 70.2Naturalisations –15.6 –15.8 –17.8 –24.7 Austrian employees in Switzerland 13.7 12.8 11.5 11.2
Asylum seekers and refugees Legal measures taken against foreignersAsylum seekers 7.0 6.7 13.8 20.1 Total rejections at border 134.0 80.7 25.5 24.7Outflows of refugees 1.3 1.3 1.7 5.0 Removals to home country 3.5 4.8 6.6 10.0
Refusals of residence 12.9 13.3 12.0 10.2Expulsions from Austria 22.0 18.9 15.5 9.2Total 172.4 117.7 59.6 54.1
Trends in International Migration
128
© OECD 2001
Inflows and outflows of foreigners
The Austrian government registers inflows of foreigners in categories: foreign workers (45 690 in 1999);family members (approximately 6 100 in first half of 2000); students and refugees (20 100 in 1999). Inflows offoreign workers are further broken down by type of work permit, which is compulsory for all foreign citizens(except EEA nationals) entering the labour market for the first time (Erstantrag) or re-entering after at leastsix months unemployment or a change in the place of work (Neuantrag). The procedure begins with an initialpermit issued to the employer. Regional labour market services may issue new employment permits to for-eigners only if qualified unemployment beneficiaries cannot be found. (This requirement restricts theemployment possibilities of foreigners). After one year, the permit is transferred to the foreign worker (workentitlements) who, five years later, is entitled to permanent status giving full labour-mobility anywhere inAustria.
The number of initial work permits has been declining since 1997 (from 52 739 to 45 690 in 1999). This onlypartly indicates the inflow from abroad, owing to foreign workers’ family members who are also included in thestatistic on initial work permits. Since 19941 the number of issued entry permits declined but has picked upagain, if only slightly, in 1998. The number of extensions into work entitlements has declined continuouslysince 1994; they totalled 22 560 in 1999, less than half the 1994 value. Numbers started to increase again astemporary workers who did not qualify for a more permanent permit continued to be employed.
The proportion from Central and Eastern European countries in the total of issued short-term permits isincreasing and amounted to 27% in 1999. Immigrants from former Yugoslavia form the biggest group.
Refugees and asylum seekers
From 1997 to 1998 the number of asylum applications more than doubled to 13 800 and took a furthersteep rise to 20 100 by the end of 1999. The largest groups came from Asia (43%) and from the former Yugoslavia(35%); less than 2% originated from Africa. In 2002, 18 300 asylum applications were registered.
Family reunion
In the first half of 2000, family reunion accounted for 83% of all settler inflows from third country origin(7 400). There are large and growing waiting lists for family reunion because the provincial quotas are small.The average waiting time is one year. The entry of family members in the labour market is being made easieras labour shortages emerge on the Austrian market. This also increased the number of extensions (see above).
2. Structure and changes in the foreign population
Numerical trends
The total foreign population was 748 200 in 1999, 1.5% more than a year before (see Table III.3). Seventy-nine per cent of Austria’s population growth in 1999 is due to an increase in the number of foreigners. The netmigration of foreigners was substantially higher than in the previous 4 years (29 400 versus a 4-year average of11 000). The natural foreign population growth (the balance of foreign births and deaths) added a further9 000 to the foreign population, but the increase in the number of naturalisations (24 700) put a break on thegrowth of the foreign population.
Mixed marriages
The number of marriages has remained stable over time. There has been a decline in the share of mar-riages between Austrian nationals (1999: 80.6% of the total) and a corresponding rise in marriages betweenforeigners (4.3%) and mixed marriages (15.1%).
Naturalisations
The naturalisation procedure varies in length depending on where the application is filed. In Vienna awork permit valid for 4 or 5 years was once sufficient to meet the requirements for naturalisation, whereas

Austria
129
© OECD 2001
other parts of the country required almost 10 years’ residence. Since 1993, Vienna has toughened its stance oncitizenship. Yet the number of naturalisations is higher than in 1991, reflecting the growing difficulty for for-eigners (particularly non-EEA nationals) to obtain work permits. Instead they prefer to apply for Austrian citi-zenship. More than 18 000 were accepted in 1998 and 25 000 in 1999. Turks and nationals of the formerYugoslavia head the list, followed by Romanians.
3. Migration and the labour market
Migration for employment and work permits
The number of initial work permits (Erstantrag, see Section 1) can indicate the number of entries of for-eigners for work (see Chart III.3). The initial work permit is issued to the firm for a particular job and not to theperson. It does not allow free access to the Austrian labour market. The share of foreign workers in total wageand salaried employment is subject to a national quota (9% ceiling in 1999 and 2000). But the ratio of foreign tonational employment was 11.2% in 1999. Until 1990, the number of initial work permits indicated a high corre-lation with foreign employment. Work entitlements (see Section 1) and permanent permits that do allowaccess to the labour market anywhere in Austria, were introduced in the early nineties, as foreigners beganapplying for Austrian citizenship, reflect restrictions on the employment of foreign labour. The number of per-manent licences increased from 166 052 in 1998 to 186 312 in 1999, an increase of 12.2% (see Table III.3).
Labour market integration
According to social security data, there were 306 400 foreign workers in employment in 1999, a 2.6%increase on 1998 (see Table III.3), showing a proportion of 9.9% of foreigners in total employment and includesabout 30 000 EU/EEA citizens. A more significant increase is expected in 2000; two-thirds of the total rise in
Chart III.3. Stocks of foreigners holding a work permit, 1980-1999, AustriaThousands
Note: Data on work permits are given as an annual average (except for short-term permits which relate to the number of permits issued in the given year).Figures exclude the self-employed and from 1994 on, citizens of the European Economic Area.
1. Figures are given as an annual average and are based on Social Security records.Sources: Ministry of Labour; Social Security Department; Labour Market Service.
1980 82 84 86 88 90 92 94 98 1980 84 86 88 90 92 94 988296 96
350
300
250
200
150
50
0
100
200
180
160
140
120
100
0
80
60
40
20
Initial permits issued Extensions issuedPermanent permits Work entitlements
Total foreign employment1
1980 82 84 86 88 90 92 94 98 1980 84 86 88 90 92 94 988296 96
350
300
250
200
150
50
0
100
200
180
160
140
120
100
0
80
60
40
20
Initial permits issued Extensions issuedPermanent permits Work entitlements
Total foreign employment1
1980 82 84 86 88 90 92 94 98 1980 84 86 88 90 92 94 988296 96
350
300
250
200
150
50
0
100
200
180
160
140
120
100
0
80
60
40
20
Initial permits issued Extensions issuedPermanent permits Work entitlements
Total foreign employment1

Trends in International Migration
130
© OECD 2001
employment up to mid 2000 was due to foreign workers. In the first half of 2000, foreign employment rose with12 900 (a 4% increase on mid-year 1999) to 10.3% of total employment (332 400).
According to the work-permit statistics of the Ministry of Labour, which refers to citizens outside the EEA-area, foreign employment increased with about 2 300 (or 0.9% compared with July 1999). The discrepancy withsocial security data either reflects the rising share of EU/EEA citizens, the growing number of naturalisations orboth. According to these data, less foreigners, i.e., from outside the EEA-area, were employed in the publicsector and in manufacturing whilst the tourist industry, agriculture/forestry and business services were themajor employers of foreign workers. Including EU/EEA citizens, i.e., according to social security data, the pri-mary sector (26.3%), textiles-clothing-leather industries (25.4%) and restaurants and hotels (26%) have thehighest density of foreign workers in the year 2000.
The structure of foreign workers by nationality is changing slowly. The share of EU citizens has increasedto 9.7% in 1999 (mainly Germans). The share of people from the former Yugoslavia has declined further butremains the largest group of foreign workers (40.1%). Since Bosnians receive preferential treatment on humani-tarian grounds when they apply for work permits, their share has increased considerably and now accounts foras high a share of total foreign employment as the Germans (6%). The share of Turkish workers, the second big-gest group of foreign workers, after a decade of decline, rose to 18.2% as result of the association agreement ofTurkey with the EU.
Foreign workers accounted for 12.3% of total unemployment. In 1999, the unemployment rate of foreignmen amounted to 8.5% of dependent employment, and the one of women, to 7.5%. This compares with a 6.5%national average for men and 6.9% for women. Turkish workers have the highest unemployment rate of any for-eign worker group although their unemployment rate dropped to an all-time low of 9.9% in 1999 (after 10.8%in 1998). Foreign unemployment is concentrated in agriculture and forestry (11.7%), construction (11.2%) andtourism (10.9%) and is higher than for Austrian nationals in agriculture, clothing, trade, and tourism (sectorswith a large share of precarious jobs).
4. Policy developments
Admission and residence (including integration measures)
In August 1997, a new legislation came into effect to better regulate the residence and employment rightsof immigrants from outside the EU. The prime objective is to facilitate the labour-market integration of familymembers of foreign workers who have resided in Austria for some time. The first notable effects were regis-tered in 1999 and 2000 as a significant foreign inflow into employment could be observed. The number ofemployment permits to Turkish immigrants has increased since 1998, mainly as a result of the implementationof the association agreement of Turkey with the EU.
Naturalisation
Increasing numbers of foreigners apply for Austrian citizenship. This trend is not due to Austria’s promot-ing naturalisation but rather to increasing difficulties for foreigners to access the Austrian labour market.Before a firm is granted a permit to employ a foreigner it has to have turned down at least four unemployedAustrians with suitable professional profiles (see Section 2).
Measures to combat the illegal employment of foreign workers
Since Austria’s inclusion in the Schengen agreement took effect, the number of illegal entrants rejected atAustrian borders had halved in 1997 and declined further in 1998 (8 675 in the first half of 2000 compared with9 754 during the same period one year earlier). The most common reasons for refusal of residence and/orexpulsion from Austria were due to illegal residence, criminal cases and insufficient means of subsistence.Trafficking of humans has lost much of its magnitude during 1999, as concerted action to prosecute the smug-glers has become effective.
The Baltic States
131
© OECD 2001
The Baltic States
Introduction
The available migration statistics presented and analysed below are solely of reported long-term (orpermanent) movements. Although both Estonia and Latvia conducted censuses in the spring of 2000 andLithuania did so in April 2001, data from them are not yet available. Whilst the scale of recorded populationmovements in the Baltic States has been declining over recent years, it is understood that clandestine entriesinto these countries as well as unreported exits and the overstaying of visas by nationals of the Baltic States,in particular in European Union countries, are very high. Judicious estimates of their extent are, however,unavailable.
1. Trends in migration movements
Immigration flows, having begun to decline in the late 1980s fell sharply in the early 1990s since whichtime they have been broadly stable at a low level. In 1999, the numbers of new immigrants registering inEstonia and Lithuania were almost unchanged at just under 1 400 and almost 2 700 respectively(see Table III.4); in the case of Latvia the inflow figure, which had until 1999 been following a similar trend tothe other two, declined by 40% to slightly over 1 800. Emigration flows peaked in 1992. The downward trendcontinues in Estonia and Lithuania: in the case of the former, having fallen by one quarter in 1998 the numberdeclined markedly once more, by one fifth to just over 2 000; in the latter, the almost 15% fall recordedin 1998 was followed by a one third decline to 1 370 in 1999. The number leaving Latvia, having declined bytwo thirds in 1998, fell by a further 40% in 1999 to just under 3 700; this would indicate that the outflow isbeginning to stabilise. Net migration, after more than 30 years of being positive, became negative for all threecountries the first time in 1990 (see Chart III.4). It was increasingly so in Estonia and Lithuania until 1993 and inLatvia until 1994. Although net migration remains negative in Latvia (–1 850) and in Estonia (–600) the trend isclearly towards balance; Lithuania’s net migration gain continues to increase; in 1999 it was slightly more than1 300 which was over twice the figure recorded in 1998.
Emigration
The return migration of the so called “Russian speaking population” – Russians, Belarussians, Ukrainians –though diminishing, remains the dominant component of emigration flows from the Baltic States. In the case ofLatvia, having declined from 80 to 70% during 1998 the proportion fell to 67% in 1999; in the case of Lithuaniathe corresponding figures were 60, 55 and 48%. Detailed data on the ethnic composition of Estonia’s emigra-tion flows were not made available in 1997 or in 1999; in 1998 those leaving for either Russia, Belarus orUkraine accounted for approximately 60% of the total.
Of the officially recorded emigration flows, those to the West, although not increasing in absolute terms, areincreasing as a proportion of the total. In 1990, they accounted for 11% of the total from Estonia, 14% from Latviaand 12% from Lithuania. The most recent available figures are 44% (1998), 42% (1999) and 44% (1999) respectively.With the exception of Poland, which used to be a major destination for emigrants from Lithuania butin 1999 attracted only 24 persons, the principal destination countries for those who officially register their resi-dence remain unchanged: Finland, Germany and the United States for Estonia; the United States, Germany andIsrael for Latvia and Lithuania. However, the overstaying of visas by nationals of the Baltic States is understood tobe very high, particularly in the European Union, and hence the actual distribution could be very different. Forexample, whereas between 1991 and 1999 fewer than 30 Lithuanians were recorded as having settled their resi-dence in the United Kingdom, during the first ten months of 2000 over 1 100 were deported.
Inflows and outflows of foreigners
Whereas the visa requirements for the temporary stay of nationals of countries other than the Common-wealth of Independent States have become less strict, all three countries retain restrictive policies with regard
THE BALTIC STATES

Trends in International Migration
132
© OECD 2001
to entry for permanent settlement. Such entry is essentially limited to three categories of person: returningnationals (i.e. those of Estonian, Latvian or Lithuanian ethnic affiliation), family reunion and business-linkedmigration (which is still not numerous). This policy, which to a considerable extent promotes or blocks thearrival of certain categories of migrants, has the effect of shaping the ethnic structure of migration flows. Hence,in the case of Latvia 19% of the immigration flow in 1999 was comprised of persons whose ethnic affiliation was to
Table III.4. Components of total population change in the Baltic States, 1996-1999
Source: Demographic Yearbooks.
1996 1997 1998 1999
LithuaniaPopulation (annual average) 3 709.5 3 705.6 3 702.4 3 699.7Population increase (per 1 000 inhabitants) –1.2 –0.9 –0.9 –0.5of which:
Natural increase (per 1 000 inhabitants) –1.0 –0.9 –1.0 –0.9Net migration (per 1 000 inhabitants) –0.2 – 0.1 0.4
Immigration (Thousands) 3.0 2.5 2.7 2.7Russians 1.1 0.9 0.9 0.9Lithuanians 1.0 0.9 0.9 0.8Belarussians 0.2 0.1 0.2 0.1Other 0.7 0.6 0.7 0.9Emigration (Thousands) 3.9 2.5 2.1 1.4Russians 1.8 1.1 0.8 0.5Lithuanians 0.3 0.3 0.3 0.2Belarussians 0.3 0.2 0.2 0.1Other 1.5 0.9 0.8 0.6
EstoniaPopulation (annual average) 1 469.2 1 458.0 1 449.7 1 442Population increase (per 1 000 inhabitants) –7.8 –5.9 –5.9 –4.5of which:
Natural increase (per 1 000 population) –3.9 –4.0 –4.9 –4.1Net migration (per 1 000 inhabitants) –3.9 –1.9 –1.0 –0.4
Immigration (Thousands) 1.5 1.6 1.4 1.4Russians 0.8 .. .. ..Estonians 0.4 .. .. ..Ukrainians 0.1 .. .. ..Other 0.2 .. .. ..Emigration (Thousands) 7.2 4.5 2.5 2.0Russians 4.8 .. .. ..Estonians 0.6 .. .. ..Ukrainians 0.6 .. .. ..Belarussians 0.3 .. .. ..Other 0.9 .. .. ..
LatviaPopulation (annual average) 2 490.8 2 469.1 2 448.9 2 431.8Population increase (per 1 000 inhabitants) –8.8 –8.7 –7.8 –6.3of which:
Natural increase (per 1 000 inhabitants) –5.9 –6.0 –6.5 –5.5Net migration (per 1 000 inhabitants) –2.9 –2.7 –1.3 –0.8
Immigration (Thousands) 2.8 2.9 3.1 1.8Russians 1.2 1.3 1.3 0.8Latvians 0.9 0.8 0.9 0.3Ukrainians 0.2 0.2 0.2 0.2Belarussians 0.1 0.2 0.2 0.1Other 0.4 0.4 0.5 0.4Emigration (Thousands) 10.0 9.7 6.3 3.7Russians 6.3 5.6 3.4 1.9Latvians 0.5 0.6 0.5 0.4Ukrainians 0.9 1.1 0.5 0.3Belarussians 0.7 0.9 0.5 0.2Other 1.6 1.5 1.4 0.8

The Baltic States
133
© OECD 2001
that country and a further 60% were Russian, Belarussian or Ukrainian (the large majority of whom, it isbelieved, have relatives who have resided in the country since the Soviet period); the corresponding figuresfor Lithuania were 30 and 45% respectively. (Data on the ethnic origin of Estonia’s immigrants have not beenmade available since 1996 when the corresponding figures were 24% and 59%.) It is noteworthy that whereas inthe case of Lithuania the proportion of those with an ethnic affiliation to the country has remained broadlyconstant since 1994, fluctuating around 30%, the corresponding proportion in the inflow to Latvia has beendeclining steadily, having been 41% in 1994. Migrants from Western countries, the majority of whom come fromGermany, the United States and, in the case of Estonia, Finland, are still few in number.
Illegal immigration
The emergence of illegal (transit) migration and migrant trafficking in the Baltic States and its gradualincrease can be understood only in the context of its development in a broader area, mainly the former SovietUnion. During the Soviet period any kind of illegal foreign migration (immigration, emigration, transit migra-tion) within the Baltic States as well as all over the former Soviet Union was practically impossible. With sol-diers as border guards, and pursuing a closed door immigration/emigration policy, the Soviet Union (and theBaltic States as part of it) was neither an easily accessible nor attractive country for migrants. Such a migrationpolicy had, of course, many negative consequences, but it also resulted in practically non-existent illegalmigration. Following the collapse of the Soviet Union the situation changed.
The phenomenon of illegal migration and illegal transit migration in the Baltic States first manifesteditself in Estonia. However, due in large part to the strong support from the Nordic countries this illegal flowwas reduced to a very low level by the mid-1990s. Since this time the phenomenon has mainly concernedLithuania which is the only one of the Baltic States sharing an overland border with the West (Germany viaPoland). This country has in turn, with the support of the international community, improved its border con-trols and implemented additional measures to combat traffickers. That the number of illegal immigrantsdetected in Lithuania has fallen from 1 500 in 1997 to 550 in 1998 and to 350 in 1999 would indicate that theincreased efforts are enjoying some success. Just over one third of those apprehended in 1999 were Afghans;the proportion from the Indian sub-continent, which had reached nearly 90% in 1994, was less than 20%. It isthe view, however, of the border police of both Lithuania and Belarus (through which the majority of illegalmigrants enter Lithuania) that the decrease in illegal migration through the Baltic States is due mainly to the
Chart III.4. Migration flows1 to the Baltic States, 1989-1999Thousands
1. Data on immigration refer to the flows of migrants who hold a residence permit and who had been registered during the year. Emigrants are counted if theydeclare their departure to a country where they wish to settle.
Sources: Demographic Yearbooks of Estonia, Latvia and Lithuania, 1999.
5040302010
0-10-20-30-40-50
50403020100-10-20-30-40-50
1989 90 91 92 93 94 95 96 97 98 99 1989 90 91 92 93 94 95 96 97 98 99 1989 90 91 92 93 94 95 96 97 98 99
Net migration Inflows
Estonia LithuaniaLatvia5040302010
0-10-20-30-40-50
50403020100-10-20-30-40-50
1989 90 91 92 93 94 95 96 97 98 99 1989 90 91 92 93 94 95 96 97 98 99 1989 90 91 92 93 94 95 96 97 98 99
Net migration Inflows
Estonia LithuaniaLatvia5040302010
0-10-20-30-40-50
50403020100-10-20-30-40-50
1989 90 91 92 93 94 95 96 97 98 99 1989 90 91 92 93 94 95 96 97 98 99 1989 90 91 92 93 94 95 96 97 98 99
Net migration Inflows
Estonia LithuaniaLatvia

Trends in International Migration
134
© OECD 2001
illegal migrants and traffickers having altered their routes; any diminution in the efforts made to combat theseflows is likely to be met by an increase in the phenomenon.
Surveys of those apprehended in 1996 and in 2000 would suggest that Lithuania is increasingly becominga country of final destination: one third of those asked stated that they had been seeking to stay in the countryas compared to less than 3% in 1996.
Though they have signed readmission agreements with the countries of Western Europe they have, withthe exception of that with Ukraine, been unable to secure agreements with the principal source countries. Thereluctance of Belarus and Russia in this regard is a particular source of concern. Given that it has been esti-mated that there are about 200 000 illegal migrants in Belarus and approximately 500 000 in Russia, it is con-sidered unlikely that such agreements will be concluded in the near future without Belarus and Russia firstconcluding similar agreements with their eastern and southern neighbours.
Refugees and asylum seekers
By the middle of 1997 all three Baltic States had passed special laws on refugees and asylum seekers andhad ratified the relevant Geneva Convention and Protocol. Nevertheless, real implementation of these laws,i.e. consideration of claims for refugee status could start no earlier than the establishment of refugee receptioncentres and the introduction of a computerised system for data collection, processing and transmission.Therefore, until mid-1998 only that part of these laws which is related to the creation of the infrastructure foraccepting refugees was in force. With very limited support from the governments of the three Baltic States, thiswork is mainly dependent on outside financial contributions (from the UNHCR, the IOM and the Nordic coun-tries).
Applications remain few in number and are mostly made by Afghans, Iraqis, Pakistanis, Somalis andVietnamese. These applications typically follow apprehension as an illegal immigrant: by applying for asylumthe person can remain in the Baltic States under better conditions than those for illegal migrants. For all threecountries combined, the total numbers of applications were 217 in 1998 and 182 in 1999, of which, mirroring itsposition as the country the most affected by illegal immigration, three quarters were made in Lithuania.
2. Structure and changes in the foreign population
During the Soviet period, the proportion of Russians, Belarussians and Ukrainians steadily increased in allthree Baltic States; following the reversal in migration flows in early 1990s it has been diminishing.
Foreigners (including stateless persons) accounted for less than 19% of Lithuania’s total adult populationin 1997, the most recent year for which figures are available. By contrast, in 1999 almost 45% of Latvia’s perma-nent residents did not possess that country’s nationality; the corresponding figure for Estonia, in 1997, was35%. This difference will in all likelihood persist in the future since, according to various sociological surveys,over 50% of Russian “non-citizens” do not intend to apply for local citizenship. Quantitative differences in thesizes of the foreign populations have led to certain qualitative differences in the manner in which their resi-dence status has been resolved. Whilst Lithuania could afford to use traditional methods (i.e. the way thoseproblems are solved in most European countries), Estonia and Latvia had to seek a new solution. Therefore,special laws specifically governing the rights, obligations and legal status of aliens (former USSR citizens) wereadopted. These were outlined in the 1999 edition of this report.
3. Policy developments
In all three Baltic States, the general approach towards migration related policy was established in theearly 1990s. The various changes in migration policy introduced since then have for the most part been madein conformity with the established approach or, as has been the case most recently, with the primary aim ofbringing their laws and regulations into line with those prevailing in the European Union.

The Baltic States
135
© OECD 2001
Combating illegal immigration
Aware that actions taken to combat irregular migration should be taken on the basis of national and inter-national laws and should not violate international conventions providing for basic and fundamental humanrights (which rules out a previous practice of detaining illegal immigrants on the sole basis of Ministerialinstructions, for example), the Baltic States modified their relevant pieces of legislation in 1998 and 1999 inorder to bring them into line with the requirements of the European Union.
In Estonia, the Obligation to Leave and Entry Ban Act passed in October 1998, which set out the legalbasis and rules concerning the detention of illegal migrants and their return or deportation, came into force inApril 1999 at the same time as the amendments passed in February 1999 to the Alien’s Act which set out thesanctions which may be imposed on aliens staying in Estonia unlawfully. On the basis of this latter Act, per-sons who facilitate illegal immigration through providing employment or accommodation are also liable topunishment. In September 2000, in order to combat the passage of illegal immigrants towards the EuropeanUnion, Estonia unilaterally introduced a full-visa regime at the Russian-Estonian border, ending the previoussimplified regime for those living near the border.
The Lithuanian Ministry of Internal Affairs started implementing active measures against illegal migrationin January 1997 with the establishment of the Foreigners’ Registration Centre in Pabrade which accommodatesall apprehended illegal foreign nationals. At the beginning of 1998, the Regulations for the Return of Foreign-ers were passed. At the same time, the administration of the Border Police was reorganised and the personnelredistributed in order to tighten the control of the border with Belarus. Moreover, in view of the extensiveinvolvement of traffickers in the illegal migration process, the Criminal Code was amended to increase themaximum punishment for migrant traffickers to 15 years’ imprisonment along with the forfeiture of their prop-erty (the most severe punishment for trafficking in Europe). This legislative change has been accompanied byincreased efforts on the part of the police to apprehend them.
Refuges and asylum seekers
A new Refugee Act came into force in Lithuania in September 2000. This new act has been primarilydesigned to bring Lithuanian legislation on refugee matters into conformity with the European Union acquiscommunautaire. First of all, the new Refugee Law introduces completely new refugee status determination pro-cedure with new asylum related concepts, such as safe third country, safe country of origin, manifestlyunfounded applications and the right to family reunion. It also introduces a new procedure whereby an asylumseekers’ admissibility into Lithuanian territory is determined at the Lithuanian border. Under this procedure,an asylum seeker may be refused entry at the border for reasons which include, most notably, having passedthrough a safe third country or submitting an application which is considered to be manifestly unfounded.Asylum seekers may appeal to the Court against such a refusal.
Amendments to the Estonian Refugees Act passed in February 1999 came into force in September of thesame year. Responsibility for decisions on asylum applications was thereby transferred to the Citizenship andMigration Department, an initial reception centre closer to the capital was created and a state register for asy-lum seekers and refugees was established. An amendment to the Aliens Act passed in February 1999 andwhich came into force in October of the same year rendered persons who have been refused refugee statusbut who cannot be sent back to their countries of origin eligible to apply for a Estonian residence permit.

Trends in International Migration
136
© OECD 2001
Belgium
Introduction
Economic activity in Belgium expanded in 1999 and 2000, fuelled by growth in GDP of 2.7% and 4%respectively. OECD forecasts predict lower rates of growth in 2001 and 2002, however, with average growth of2.8%. The containment of wage costs coupled with the recovery in the economy have led to an increase in thevolume of employment. In 2000, for example, the Federal Ministry of Employment and Labour estimates thenet increase in employment to have amounted to 50 500 jobs, primarily in the private sector. The standard-ised employment rate has declined since 1998, falling from 9.5% to 8.8% in 1999 and 7% in 2000.
1. Trends in migration movements
Emigration and the return of nationals
Net migration of nationals was negative (–9 088, see Table III.5). In all, slightly fewer than 20 000 Belgiansleft the country, including immigrants returning to their country of origin and consisting primarily of French,Dutch and United States nationals.
Inflows and outflows of foreigners
The 1990s were characterised by substantial net migrat ion gains, which averaged a lmost20 000 between 1989 and 1999. The influx of foreign nationals was largely due to the arrival of EU nationals.The size of this flow reflects the central role played by Brussels as a host to European institutions. On thewhole, French and Dutch nationals accounted for the largest share of total inflows, followed by Moroccans. TheTurkish community also accounted for a significant share (10% of net migration flows).
Refugees and asylum seekers
The number of asylum applications in Belgian increased between 1988 and 1993, peaking at just over26 400 at the end of this period. While the annual average over the next four years was significantly lower(12 500) applications, the number subsequently started to rise again with just over 22 000 applications in 1998,35 778 in 1999 and over 38 000 in 2000. For refugees to be admitted, their application must first be ruledadmissible by the Office for Foreign Nationals, after which their case is examined closely in accordance withthe Geneva Convention. Since 1995, nationals of the Republics of the former Yugoslavia have constituted thelargest group of applicants (11% in 2000). Nationals of the Russian Federation are the next largest (8%), fol-lowed by Albania and Iran. About 97% of applications were filed inside Belgium.
2. Structure and changes in the foreign population
Numerical trends
As of 31 December 1999, Belgium had a population of just over 10 million inhabitants, of which slightlyunder 900 000 foreigners, i.e. 8.8% of the total population, a figure that has remained stable since 1990(see Table III.5). Between 1985 and 1999, twelve nationalities accounted for more than 85% of the foreign pop-ulation resident in Belgium. Some 60% of that population consisted of EU nationals, primarily from Italy,France, the Netherlands and Germany. The largest non-EU communities consisted of Moroccans (122 000) andTurks (70 000).
In 1999, some 48% of the foreign resident population consisted of women, a figure four percentage pointslower than the share of women in the Belgian population. The average rate of growth in the total populationover the past ten years amounts to 0.2%. The foreign population contributes to growth in the total populationboth through the natural increase in foreigners, which accounts for 36% of the total natural increase, andthrough net positive migration.
BELGIUM

Belgiu
m
137
© O
EC
D 2001
Table III.5. Current figures on the components of total population change, on flows and stocks of foreign population and labour force in Belgium
All figures in thousands unless otherwise indicated
Note: Figures on European Union include the 15 members of the Union.1. Work permits are issued either for unlimited periods (A permits) or for limited periods (B permits). EU citizens do not need a work permit.2. Data refer to the population on the 30 June of the years indicated.Sources: Institut national de la Statistique and Registre national de la population; ministère de l'Emploi et du Travail; Office national de l'Emploi, Commissariat général aux réfugiés et apatrides; Institut
national d'assurances sociales pour travailleurs indépendants (INASTI).
1996 1997 1998 1999 1996 1997 1998 1999
Components of population change Total work permits issued (Initial and renewed) by nationality1
Total population United States 1.3 1.2 1.7 1.6Population (on 31 December) 10 170.2 10 192.3 10 213.8 10 239.1 Dem. Rep. of Congo 0.5 0.4 0.7 1.1Population increase from beginning to end of year 27.2 22.1 21.5 25.3 Japan 1.0 0.9 0.9 1.0of which: Former Yugoslavia 0.3 0.3 1.2 0.9
Natural increase 11.1 12.1 9.7 8.6 Morocco 0.7 0.7 0.8 0.9Net migration 12.7 6.0 6.7 12.3 Other 4.9 5.4 6.6 7.6Statistical adjustment 3.4 4.0 5.1 4.5 Total 8.7 9.0 11.8 13.2
of which: Initial work permits 4.6 5.2 7.3 8.7Nationals
Population (on 31 December) 9 258.3 9 289.1 9 321.8 9 342.1 Migration flows of cross-border workers by country of origin/destinationPopulation increase from beginning to end of year 25.0 30.8 32.6 20.3 Inflows by country of origin 17.6 18.6 20.5 ..of which: of which:
Natural increase 7.2 8.1 6.4 5.4 France 12.0 12.7 14.1 ..Net migration –6.7 –8.6 –7.7 –9.1 Netherlands 4.8 5.2 5.5 ..Acquisitions of nationality 24.6 31.6 33.9 24.1 Outflows by country of destination 46.7 48.5 51.6 ..Statistical adjustment – –0.2 –0.3 –0.2 of which:
Luxembourg 18.3 19.4 21.0 ..Foreigners Netherlands 13.5 14.2 15.1 ..
Population (on 31 December) 911.9 903.1 892.0 897.0 France 5.9 5.8 5.9 ..Population increase from beginning to end of year 2.2 –8.8 –11.1 5.0of which: Labour force by group of nationality2
Natural increase 3.9 4.0 3.3 3.1 NationalsNet migration 19.5 14.7 14.4 21.3 Employed 3 433.5 3 453.1 3 498.8 ..Acquisitions of nationality –24.6 –31.6 –33.9 –24.1 Unemployed 451.4 445.7 413.9 387.2Statistical adjustment 3.4 4.1 5.3 4.7 Participation rate (%) 51.2 51.2 51.2 ..
Unemployment rate (%) 11.6 11.4 10.6 ..Inflows of foreigners by group of nationality 51.9 49.2 50.7 57.8
EU 28.7 27.6 27.4 28.0 ForeignersOther European countries 3.4 5.2 6.4 .. Employed 276.2 285.3 289.6 ..Africa 7.7 7.1 7.8 .. Unemployed 93.5 94.9 91.4 87.9America 4.9 5.0 4.7 .. Participation rate (%) 48.8 49.9 50.4 ..Asia 6.7 4.0 4.1 .. Unemployment rate (%) 25.3 25.0 24.0 ..Oceania 0.2 0.3 0.2 ..Region not specified 0.3 0.1 0.1 .. Total (nationals and foreigners)
Employed 3 709.7 3 738.4 3 788.5 ..Asylum seekers 12.4 11.8 22.1 35.8 Unemployed 544.9 540.6 505.3 475.1
Participation rate (%) 51.0 51.1 51.2 ..Mixed marriages 6.2 6.0 6.4 6.8 Unemployment rate (%) 12.8 12.6 11.8 ..
% of total marriages 12.3 12.5 14.4 15.4Marriages with an EU citizen 3.3 3.0 3.1 2.9

Trends in International Migration
138
© OECD 2001
Naturalisations
In 1999, ten nationalities accounted for almost three quarters of the total number of naturalisations. Of theforeigners naturalised since 1995, over a third were nationals of Morocco (38%), Turkey (18%) or Italy (5%).There has been significant growth in the number of successful applications from nationals of the Republics ofthe former Yugoslavia, which rose from 499 in 1998 to 756 in 1999.
Regularisations
Legislation to regularise the status of certain categories of illegal immigrants resident in Belgium enteredinto force on 10 January 2000. A total of 32 662 cases concerning 50 600 individuals, of whom 23 000 children,were submitted for review. The initial aim of the government was to process all cases and issue a final rulingby June 2001 at the latest. As of January 2001, only 2 226 cases have been examined and 2 032 positive rulingshanded down.
3. Migration and the labour market
Migration for employment and work permits
Belgium issues two categories of work permit: A permits of unlimited duration and valid for all paid occu-pations; and B permits, which are valid for a maximum of 12 months and which are limited to a singleemployer. Over the past five years the proportion of B permits has been rising and currently accounts for over80% of the total number of permits granted to foreign workers.
The number of new entrants to the labour market, measured in terms of the number of initial work per-mits issued, amounted to 8 670 in 1999 (see Table III.5). These permits were granted to nationals of the Demo-cratic Republic of Congo (10%), the United States (9.6%) and the Republics of the former Yugoslavia (8.6%).
As of June 1999, the total labour force was estimated to amount to slightly under 4 300 000 workers ofwhom 381 000 were foreigners, i.e. 9% of the total. Between 1989 and 1998, the Belgian labour force increasedby 3.5%, compared with a 28.9% increase in the foreign labour force. The overall participation rate in 1998 wasapproximately 50%. Over two thirds of foreign workers were EU nationals, the largest groups being Italian (27%)and French (15%). Among non-EU nationals, Moroccan workers were the largest group (12%). The disaggrega-tion by nationality of those in salaried employment closely mirrored these proportions. In 1998, there weremore than 2 800 000 Belgian wage-earners and 236 000 foreign wage-earners (62% of the foreign labour force).In contrast, the breakdown for self-employment was different: the Italians, Dutch and French were the maingroups of self-employed workers. Moroccans, who were the largest non-EU community, ranked only seventhamong non-EU self-employed workers.
Of the slightly more than 439 000 unemployed workers at 30 June 2000, almost 81% were Belgian nationals.The proportion of unemployed foreign workers has risen by two percentage points over the past ten years.The nationalities with the highest number of unemployed were Italian (20 196 unemployed in 2000), Moroccan(17 534) and Turkish (10 667).
4. Policy developments
An Act amending a number of the rules relating to Belgian nationality was passed on 1 March 2000. ThisAct simplifies and streamlines the procedures for acquiring Belgian nationality, notably by relaxing the agerequirements and by abolishing verification of the applicant’s “desire to integrate”.
In January 2000, in response to a proposal by Mrs. Onkelinckx, the Employment Minister, the Belgian gov-ernment approved draft regulations under which the beneficiaries of the legislation designed to regularise thestatus of certain categories of immigrants (Act of 22 December 1999) would be granted access to the labourmarket.
The beginning of the year also saw the opening of new asylum centres (Ekeren, Wommelgem, Jodoigne,Wingene) and the renovation and refurbishing of older existing centres. These centres can now accommodateup to around a 1 000 asylum seekers.
Bulgaria
139
© OECD 2001
On 25 October 2000, the government announced new measures regarding benefits for asylum seekers. Assoon as applications are judged to be admissible, social aid will now be provided in the asylum centres thathave been set up. During this period, public benefit agencies will no longer be obliged to pay social benefits.This represents a shift from financial aid to material aid. This new procedure will require an increase of10 000 in the number of asylum seekers who can be accommodated in centres. Efforts will be made to securenew partners in the private sector. The aim of this new system is to reduce the attractiveness of the financialaid previously granted to asylum seekers. This change in the legislation should also help combat the exploita-tion by immigrant smugglers of asylum seekers hoping to receive financial benefits as soon as their applica-tions have been filed.
Bulgaria
Introduction
Due in large part to the macroeconomic stabilization achieved through the introduction of a currencyboard in 1997, the Bulgarian economy has entered a phase of moderately paced growth. As a result, however,of earlier economic mismanagement combined with external shocks, GDP is still below 70% of the level imme-diately following the collapse of the communist regime. Of the East European applicants for European Unionmembership, only Romania has a lower GDP per capita. In the face of continued economic restructuring anddespite the fact that wage costs are relatively low in comparison to other countries in the region, registeredunemployment reached almost 20% in 2000 before falling back slightly towards the end of the year.
Migration flows continue to be of only a small scale. The main focus of migration policy has been on bring-ing the existing legislation regarding foreigners into line with European Union norms, combating illegal immi-gration both to and through Bulgaria and creating an effective system for the administration of asylumapplications and the integration of recognised refugees.
1. Trends in migration movements
Emigration
It is not possible to gauge even approximatively the magnitude of permanent emigration flows. Bulgari-ans leaving the country must register their departure, no matter how long their absence from the country, andare requested to state the purpose of their visit, but the published data are highly aggregated: they aregrouped under tourism, personal reasons, business and employment.
However, available data show a slight decrease of emigration flows. Registration of departures at the bor-der point out that in 1999, about 42 500 people migrated officially abroad in order to work. The number ofpeople concerned by bilateral agreements on work has gradually decreased to fewer than 1 500 in 1999, ascompared with more than 2 700 in 1996. However, there are still many Bulgarian citizens concerned by migra-tion to the United States through the Green Cards procedure who are mostly highly skilled.
Since the peak of 4 400 000 in 1994, the number of foreign trips by Bulgarian residents has steadily fallento just under 2 400 000 in 1999. Taking into account that tourism is traditionally the most significant feature(nearly 60% of such travel in 1999), this is possibly due to the real decrease of incomes of population. Tradi-tionally the main outflow of migration uses to be directed to Turkey and former Yugoslavia and Macedonia.Since 1995 the flow of passengers to Turkey decreases so that in 1999 it is about half the travels in 1994 and10.5% less than in 1998. The decrease is even more significant in the case of former Yugoslavia and Macedoniabecause of the Kosovo crisis (1994: 1 745 500; 1999: 540 800).
While in 1998 there was substantial decrease of travels to Greece, in 1999 their number was restored to254 117 but still below the record in 1995-97. Short-term migration to that country continues to grow. The trips
BULGARIA
Trends in International Migration
140
© OECD 2001
to Central Europe slightly increased compared with 1998. The travels to Poland reached 21 200, to Hungary22 900 while the visits to Czech Republic decreased with 12%. Besides, the number of applications for asylumfilled by Bulgarians abroad has dropped sharply, to fewer than 1 500 in 1998, as compared with the hundredsof thousands of people applying for asylum at the beginning of the decade.
There is a growing political concern about the number of Bulgarians living abroad. According to a nation-wide survey conducted in June 1999, approximately 10% of the population receive financial support from rela-tives living abroad. The most recent estimate put the total annual inflow at USD 200 million (or 6.1% of theannual export). A very active policy for encouraging Bulgarians abroad to return, invest and support thereforms was promoted: each year at the “Bulgarian Easter” meeting, over 400 Bulgarian highly skilled workers,managers, and graduate students living abroad meet with leading politicians.
Illegal immigration
The number of foreigners living in Bulgaria illegally (which some estimates put at 10 000) is believed tobe relatively low compared with the situation in other European countries. Most illegal immigrants overstay avisa, cross the border illegally, hold false papers or residence permits or attempt to stay in Bulgaria ratherthan board a connecting flight. It is the intention of most illegal immigrants to enter other central European orEuropean union countries (Greece, Austria, Germany) from Bulgaria.
Refugees and asylum seekers
Despite political turbulence in the Balkans, and the recent Kosovo crisis, applications for asylum continueto rise slightly and concern 1 300 people in 1999. Citizens of the former Yugoslavia accounted for 30% of them,Afghans 19% and Iraqis 13%. Of the 624 decisions made in 1999, 28% were to grant Convention status and 40%humanitarian status (in 1998, this latter figure was 2%). Of the 1 750 decisions made between 1995 and 1999,just under 600 resulted in the granting of Convention status and 290 humanitarian status.
Bulgaria needs assistance and funds from donor organisations to provide refugees with adequate accom-modation services. The Red Cross, the UNHCR and the German DAFI contribute to the medical insurance,financial support for students and food and sanitation programmes of those of the refugees who are the mostvulnerable.
2. Structure and changes in the foreign population
Numerical trends
Apart from censuses (the latest data available being from 1992), the National Statistics Institute doesnot collect data on Bulgaria’s foreign population. Immigration flows are therefore estimated on the basis ofthe number of residence and work permits issued, and the number of people obtaining refugee status orapplying for asylum. In addition, the National Statistics Institute publishes data on visits to Bulgaria by for-eign residents.
Since 1998, data have been made available on Bulgaria’s foreign population broken down into two cate-gories: those possessing permanent residence status and those holding a so-called “long-term residencepermit”. The first group refers to foreigners married to Bulgarian citizens (proportionately the most impor-tant), persons of Bulgarian ethnicity, the children or parents of Bulgarian citizens, foreigners who havelegally stayed in the country for more than 5 years or who have legally invested over USD 250 000. The sec-ond residence permit, which is valid for one year and renewable, is generally granted for employment pur-poses though persons who have sufficient funds to stay in the country without imposing a financial burdenon the State are also eligible.
Having increased continually since 1991 to 1998, the number of permanent residents declined by 6% to38 700 in 1999. This decline is primarily attributable to a 9% fall in the number of persons originating from theCommonwealth of Independent States (CIS) who comprise over two thirds of those with this residence status.Indeed, excepting the very slight decline in the number of Central Europeans and Asians, all the other signifi-cant regional groups recorded increases (see Table III.6).

Bulgaria
141
© OECD 2001
By contrast, the number of long-term permit holders (of whom there were 22 000 in 1991) rose by almostone quarter in 1999 to 63 600. All the significant regions recorded increases, most notably East and SoutheastEurope and the CIS group. Whereas European Union nationals comprise less than 6% of the total stock ofpermanent residents they account for almost one fourth of long-term residents, a majority of whom are Greek.Citizens of CIS countries in this category are less than half as numerous.
Naturalisations
The introduction in 1999 of a new Nationality Act, more transparent though also more rigorous than thatof 1968 which it replaced, did not lead to a significant change in the total number of naturalisations granted inthat year (see Table III.6). The eligible applicants are mainly those who reside in the country for more than5 years as well as spouses of foreign origin. Though the total number, at just under 2 200, was 5% fewer than thepreceding year it should be borne in mind that that figure was more than twice that of 1997. One third of thosegranted citizenship in 1999 had previously held it; numbering just over 720, they were slightly outnumberedby persons cancelling their Bulgarian citizenship, for having acquired foreign citizenship abroad.
3. Migration and the labour market
Statistics on the employment of foreigners in Bulgaria cover only those in possession of a work permitwhich only those in salaried employment are obliged to obtain; the number of foreign self-employed personsand small-scale entrepreneurs, who constitute the largest group of people obtaining long-term residence per-mits, is not monitored. The latter are attracted to Bulgaria by the relative dynamism of the services and SMEsector and the lack of complicated administrative formalities.
Table III.6. Current figures on the stocks of foreign population, Bulgaria
Thousands
1. Number of applications. Some dependents accompanying the applicant are not counted.Sources: National Employment Service, National Statistical Institute and UNHCR.
1996 1997 1998 1999
Stock of foreign citizens
A. Permanent residentsCIS 27.2 28.8 28.9 26.4Central Europe 2.4 2.4 2.5 2.3EU 1.6 1.8 1.9 2.2Other European countries 1.8 1.9 2.0 2.1Middle East 1.6 1.4 1.7 1.8Africa 0.2 0.2 0.3 0.5America 0.4 0.4 0.4 0.5Asia 0.3 0.3 0.3 0.5Stateless 1.9 1.9 1.8 1.7Other 1.5 1.4 1.3 0.7Total 38.8 40.6 41.1 38.7
B. Long-term residentsEU 10.4 11.9 13.6 16.2Central Europe – 0.1 0.1 0.3Other European countries 4.3 5.5 6.5 8.6Middle East 8.3 8.8 6.4 8.5CIS 3.3 4.7 6.2 8.8Africa 4.8 5.0 5.1 5.5Asia 3.0 3.4 4.1 5.7America 2.3 2.4 2.6 3.0Other 3.4 3.8 7.0 7.0Total 40.0 45.4 51.7 63.5
Asylum seekers1 0.3 0.4 0.8 1.0
Naturalisations 3.0 1.1 2.3 2.2

Trends in International Migration
142
© OECD 2001
The majority of the work permits issued by the national employment authorities have been for managersworking for multinational enterprises. In 1999, just over 100 new permits were issued and a similar number ofextensions were granted; both figures were in line with those of the previous two years. Most of the workerscome from European Union countries or the United States.
4. Policy developments
Combating illegal immigration
Motivated by the strong political will to join the EU, the main focus of migration policy has been on bring-ing the existing legislation regarding foreigners into conformity with the acquis communautaire, combating illegalimmigration both to and through Bulgaria and creating an effective system for the administration of asylumapplications and the integration of recognised refugees. In addition, with a view to promoting the country’seconomic and political development, an active policy to encourage dialogue with and the return of expatriateBulgarians has recently been implemented.
Following the approval by parliament at the beginning of 1999 of the Law on Identification Documents(ID), the government introduced in April of the same year regulations concerning the change of ID, the mainpurpose of which was to provide for a change in the format of the country’s passports and driving licenses,both of which were easily forged. The deadline for changing these documents was set for the end of 2000,which is very ambitious given the extent of the administrative burden and the financial cost, but generally, thismeasure has succeeded.
Admission and residence (including integration measures)
Regulations concerning the implementation of the Foreigners Act (in force since January 2000) wereissued in May 2000. The regulations establish clear mechanisms for the implementation of the law with regardto entry, residence and exit of the country by foreigners. They also set out the responsibilities of the authori-ties in this regard. Foreigners residing in the country have to declare the purpose of their visit, provide anaddress and must complete an “information card”, which is stored by the respective authorities until the for-eigner leaves the country. Any change of address has to be reported within 7 days to the administration deal-ing with foreign residents. Services for administrative control of foreigners monitor the flow of foreignersaccording to the new regulatory frameworks. Prolongation of visas is subject to very strict criteria and proce-dures. Permission can only be granted by the head of the policy office of the respective region. The new regu-lations also limit further the possibility for the use of “engagement in entrepreneurial activities” as a validjustification for immigration: this had been abused under the previous legislation. In addition to registeringthe company as a commercial entity, foreigners are now also required to obtain approval from the tax authori-ties and the social security department; they must also register with the National Statistical Institute and pro-vide evidence of satisfactory’ revenues.
Refugees and asylum
The former National Bureau for Territorial Asylum and Refugees (NBTAR) has been upgraded to the statusof an Agency. The Agency for Refugees has responsibility for all issues related to asylum seekers and refugees,including decisions, the issuance of ID, the provision of accommodation and the arrangement of languagecourses and vocational training, as well as programmes for the Bulgarian population to inform them on refugeeissues. As a means increasing the financial resources devoted to refugees and asylum seekers, a fund hasbeen established which collects contributions from both Bulgarian and foreign donors. In view of the impor-tance of education for refugees’ successful integration, a Regulation for the free access of refugees to Bulgarian schoolshas been introduced. The refugees are now being helped to select the most appropriate form of education bya special Commission comprised of representatives of local offices of the Ministry of Education and theAgency for Refugees.

Canada
143
© OECD 2001
Nationals abroad
One of the main elements of the Government’s migration policy is to further develop the institutions thatdeal with expatriate Bulgarians and to draw on their experience in order to promote the country’s economicand political development. The funding and organisation of the State Agency for Bulgarians Abroad have beenimproved. Its role is to collect information about Bulgarians abroad and to provide them with reliable informa-tion regarding the recent political, economic and cultural developments in Bulgaria as well as the investmentopportunities there. In addition, it is hoped that the independent assessments of Bulgarians working in majorfinancial institutions, banks and corporations abroad will be of benefit to the conduct of economic policy.
Canada
Introduction
After two years of nearly 5% growth, the Canadian economy showed signs of slowing in the fourth quarterof 2000, influenced by cyclical trends in the US economy. The unemployment rate fell again in 2000, from 7.6%to 6.8%, but could reach 7.2% in 2001. The number of immigrants increased significantly in 1999 after thedecline observed in 1998, but did not reach the target set in the Annual Immigration Plan. Nevertheless, Canadais expected to take in a growing number of immigrants in 2000 and 2001.
A new Immigration and Refugee Protection Act was introduced in Parliament in February, 2001. The pro-posed legislative changes reaffirm a commitment to strengthening enforcement practices to better manageaccess to Canada while reinforcing efforts to attract skilled workers and entrepreneurs, strengthening theintegrity of the refugee determination system and expanding family class.
1. Trends in migration movements
Inflows and outflows of foreign-born persons
In 1999, approximately 189 800 permanent resident permits were issued. This figure, an increase of 9.1%on 1998, is nevertheless below the range anticipated by Citizenship and Immigration Canada (CIC), which hadexpected to attract between 200 000 and 225 000 immigrants. However, the upward trend continuedin 2000 and on the basis of estimates for the first six months of 2001, it is expected that the figure could reach225 000 by the end of 2001.
A little under a third of permanent immigrants entered on the basis of family reunion (55 200 people,compared with an anticipated 53 500 to 58 300). Approximately 56% of them were in the skilled worker andbusiness classes (105 400 people, compared with the expected minimum of 117 900, i.e. a shortfall of 10.6%)and 13% in the refugee class (24 370 people, compared with an anticipated 22 100 to 29 300) (see Chart III.5and Table III.7). The targets for 2000 are the same as for the previous year.
Between 1998 and 1999, immigration of skilled workers and business persons rose by approximately 11%,while immigration for family reunion grew by 8.5% and the number of refugees grew at a slightly lower rate, inthe region of 7.3%.
Analysis of flows by sending country reveals the increasing concentration of sources of immigration(see Chart III.6). In 1999, some 50.8% of immigrants were from the Asia-Pacific area (48.3% in 1998) and 20.5%were from Europe (22.12% in 1998). It is mainly immigration from Hong Kong that has declined (1997: 22 200;1998: 8 000; 1999: 3 700). It is now only the thirteenth largest source of immigration to Canada, after ranking firstin 1996 and 1997. For the past two years the Chinese (29 000) and Indians (17 400) have been the two largestgroups of immigrants (see Table III.8). The number of nationals from the People’s Republic of China has risenby 47%, while the number of Indians has increased by 13%. Pakistanis (9 300) and Filipinos (9 200) constitutethe third and fourth largest groups, which have been relatively stable for the past two years.
CANADA
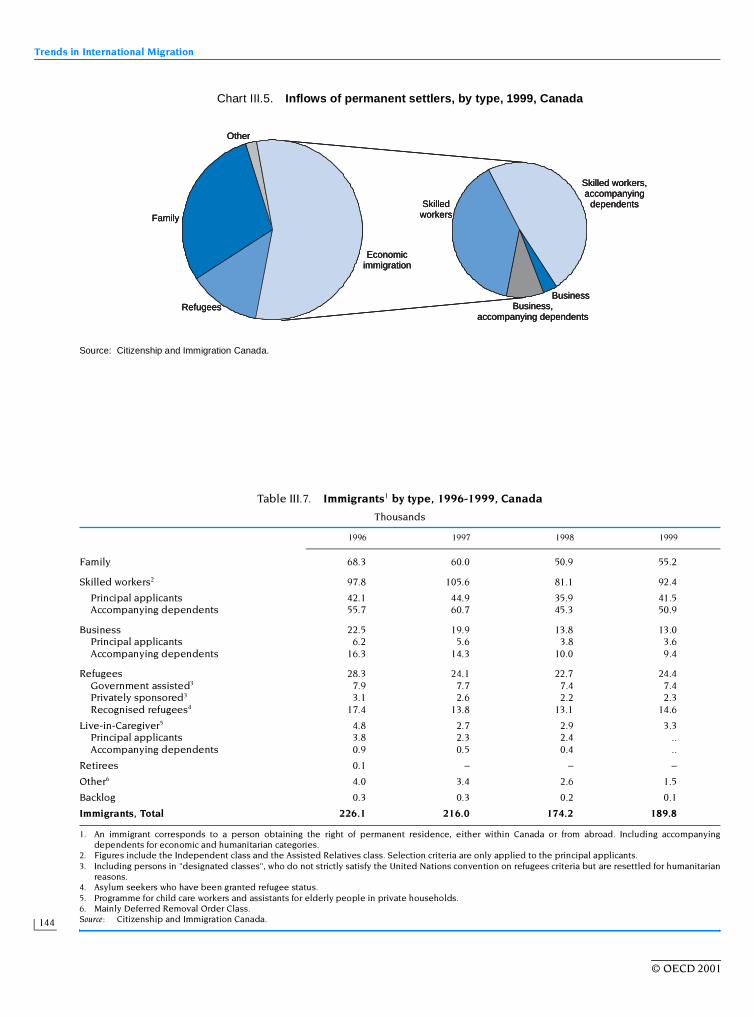
Trends in International Migration
144
© OECD 2001
Chart III.5. Inflows of permanent settlers, by type, 1999, Canada
Source: Citizenship and Immigration Canada.
Skilled workers,accompanying
dependents
Business
Skilledworkers
Economicimmigration
Other
Family
Business,accompanying dependents
Refugees
Skilled workers,accompanying
dependents
Business
Skilledworkers
Economicimmigration
Other
Family
Business,accompanying dependents
Refugees
Skilled workers,accompanying
dependents
Business
Skilledworkers
Economicimmigration
Other
Family
Business,accompanying dependents
Refugees
Table III.7. Immigrants1 by type, 1996-1999, Canada
Thousands
1. An immigrant corresponds to a person obtaining the right of permanent residence, either within Canada or from abroad. Including accompanyingdependents for economic and humanitarian categories.
2. Figures include the Independent class and the Assisted Relatives class. Selection criteria are only applied to the principal applicants.3. Including persons in "designated classes", who do not strictly satisfy the United Nations convention on refugees criteria but are resettled for humanitarian
reasons.4. Asylum seekers who have been granted refugee status.5. Programme for child care workers and assistants for elderly people in private households.6. Mainly Deferred Removal Order Class.Source: Citizenship and Immigration Canada.
1996 1997 1998 1999
Family 68.3 60.0 50.9 55.2
Skilled workers2 97.8 105.6 81.1 92.4
Principal applicants 42.1 44.9 35.9 41.5Accompanying dependents 55.7 60.7 45.3 50.9
Business 22.5 19.9 13.8 13.0Principal applicants 6.2 5.6 3.8 3.6Accompanying dependents 16.3 14.3 10.0 9.4
Refugees 28.3 24.1 22.7 24.4Government assisted3 7.9 7.7 7.4 7.4Privately sponsored3 3.1 2.6 2.2 2.3Recognised refugees4 17.4 13.8 13.1 14.6
Live-in-Caregiver5 4.8 2.7 2.9 3.3Principal applicants 3.8 2.3 2.4 ..Accompanying dependents 0.9 0.5 0.4 ..
Retirees 0.1 – – –
Other6 4.0 3.4 2.6 1.5
Backlog 0.3 0.3 0.2 0.1
Immigrants, Total 226.1 216.0 174.2 189.8

Canada
145
© OECD 2001
With regard to immigration from OECD countries, there was a marked increase in immigration from Korea,which rose by 47% on 1998 (1999: 7 200), making it the fifth-ranking country. Immigration from Germany alsorose sharply (+40%), while that from the United States (+16%) and the United Kingdom (+15%) increased at alower rate and the number of French nationals levelled off after the sharp increase of the previous year(3 900 in 1999).
Immigrants also tend to be concentrated in certain Canadian regions and cities. As in the past, the major-ity of residence permits issued in 1999 were for the province of Ontario (54.8%), followed by British Columbia(19%) and then Quebec (15.4%). In these three provinces, respectively, the cities of Toronto (44%), Vancouver(14.6%) and Montreal (12%) attract the largest number of immigrants. Quebec’s share continued to increase lastyear, albeit more slowly.
The demographic characteristics of immigration are relatively stable: 75% of those entering Canada wereaged between 15 and 64, with 104 women per 100 men in 1999. Due to the selection criteria, immigrants haverelatively high levels of education, with 57% having reached the post-secondary level.
Economic immigration
Immigration of skilled workers and business persons and their dependants increased in 1999 after fallingin previous years (1995-97: +25%; 1997-98: -24.4%; 1998-99: +11%). The slowdown in 1997 could be attributed inpart to the stricter eligibility criteria for foreign investors, while the trend reversal in 1998 could be due to theeconomic crisis in Asia.
With regard to immigration by skilled workers, the most significant change since 1997 is the 86% fall inimmigration from Hong Kong (1999: 730). But with the exception of China (+40%) and India (+60%), immigrationof skilled workers from Asia systematically and significantly declined: –51.5% for Chinese Taipei, –49.3% for thePhilippines, –38% for Pakistan and –19.4% for Iran. Among the movements showing increases, the main featurewas the inflow of workers from France (+55% since 1997). Quebec was the province to benefit most from thistrend, since in 1999 it took in 14% of skilled foreign workers, as compared to just 8.8% in 1997.
Chart III.6. Inflows of permanent settlers by entry class and region of origin, 1980-1999, CanadaThousands
Note: Except for the family class, counts include both principal applicants and their accompanying dependents, if any. Figures also include backlog clearance.1. Immigrants sponsored by Canadian residents (spouses, dependent children, parents and persons in their charge).Source: Citizenship and Immigration Canada.
1980 84 86 88 90 92 96 9882
140
120
100
80
60
20
0
40
140
120
100
60
40
20
0
80
941980 82 84 86 88 90 92 94 9896
Family1
A. Main entry classes B. Main regions of origin
Economic
Humanitarian Asia and the Pacific
Africa and the Middle East
Europe
America
1980 84 86 88 90 92 96 9882
140
120
100
80
60
20
0
40
140
120
100
60
40
20
0
80
941980 82 84 86 88 90 92 94 9896
Family1
A. Main entry classes B. Main regions of origin
Economic
Humanitarian Asia and the Pacific
Africa and the Middle East
Europe
America
1980 84 86 88 90 92 96 9882
140
120
100
80
60
20
0
40
140
120
100
60
40
20
0
80
941980 82 84 86 88 90 92 94 9896
Family1
A. Main entry classes B. Main regions of origin
Economic
Humanitarian Asia and the Pacific
Africa and the Middle East
Europe
America
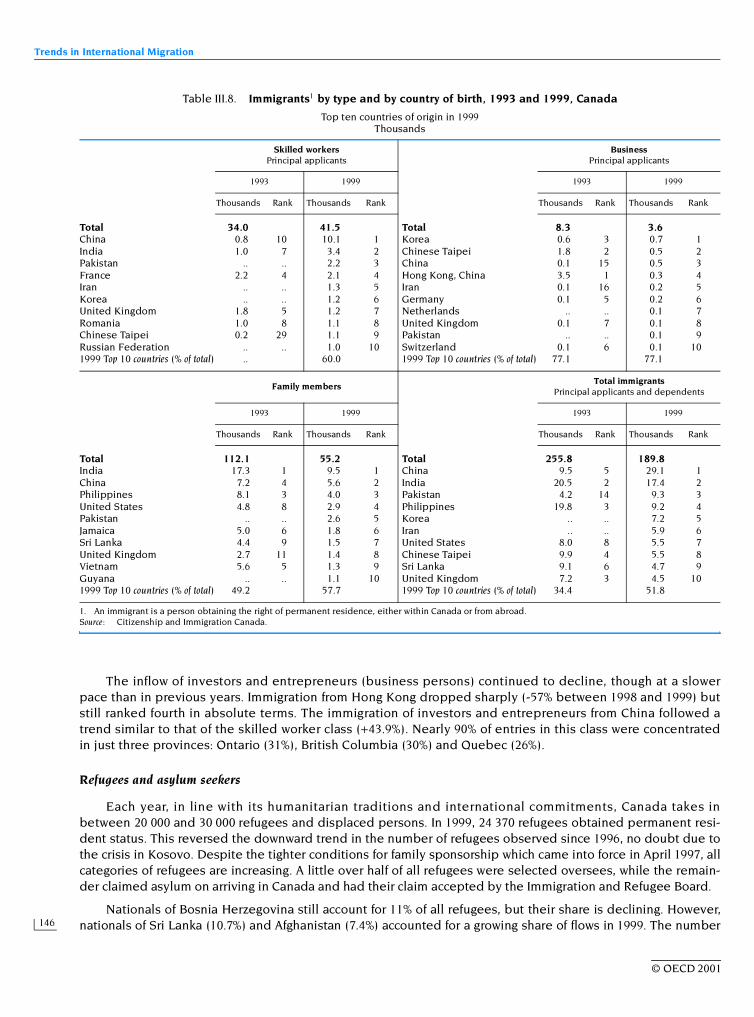
Trends in International Migration
146
© OECD 2001
The inflow of investors and entrepreneurs (business persons) continued to decline, though at a slowerpace than in previous years. Immigration from Hong Kong dropped sharply (-57% between 1998 and 1999) butstill ranked fourth in absolute terms. The immigration of investors and entrepreneurs from China followed atrend similar to that of the skilled worker class (+43.9%). Nearly 90% of entries in this class were concentratedin just three provinces: Ontario (31%), British Columbia (30%) and Quebec (26%).
Refugees and asylum seekers
Each year, in line with its humanitarian traditions and international commitments, Canada takes inbetween 20 000 and 30 000 refugees and displaced persons. In 1999, 24 370 refugees obtained permanent resi-dent status. This reversed the downward trend in the number of refugees observed since 1996, no doubt due tothe crisis in Kosovo. Despite the tighter conditions for family sponsorship which came into force in April 1997, allcategories of refugees are increasing. A little over half of all refugees were selected oversees, while the remain-der claimed asylum on arriving in Canada and had their claim accepted by the Immigration and Refugee Board.
Nationals of Bosnia Herzegovina still account for 11% of all refugees, but their share is declining. However,nationals of Sri Lanka (10.7%) and Afghanistan (7.4%) accounted for a growing share of flows in 1999. The number
Table III.8. Immigrants1 by type and by country of birth, 1993 and 1999, Canada
Top ten countries of origin in 1999Thousands
1. An immigrant is a person obtaining the right of permanent residence, either within Canada or from abroad.Source: Citizenship and Immigration Canada.
Skilled workersPrincipal applicants
BusinessPrincipal applicants
1993 1999 1993 1999
Thousands Rank Thousands Rank Thousands Rank Thousands Rank
Total 34.0 41.5 Total 8.3 3.6China 0.8 10 10.1 1 Korea 0.6 3 0.7 1India 1.0 7 3.4 2 Chinese Taipei 1.8 2 0.5 2Pakistan .. .. 2.2 3 China 0.1 15 0.5 3France 2.2 4 2.1 4 Hong Kong, China 3.5 1 0.3 4Iran .. .. 1.3 5 Iran 0.1 16 0.2 5Korea .. .. 1.2 6 Germany 0.1 5 0.2 6United Kingdom 1.8 5 1.2 7 Netherlands .. .. 0.1 7Romania 1.0 8 1.1 8 United Kingdom 0.1 7 0.1 8Chinese Taipei 0.2 29 1.1 9 Pakistan .. .. 0.1 9Russian Federation .. .. 1.0 10 Switzerland 0.1 6 0.1 101999 Top 10 countries (% of total) .. 60.0 1999 Top 10 countries (% of total) 77.1 77.1
Family membersTotal immigrants
Principal applicants and dependents
1993 1999 1993 1999
Thousands Rank Thousands Rank Thousands Rank Thousands Rank
Total 112.1 55.2 Total 255.8 189.8India 17.3 1 9.5 1 China 9.5 5 29.1 1China 7.2 4 5.6 2 India 20.5 2 17.4 2Philippines 8.1 3 4.0 3 Pakistan 4.2 14 9.3 3United States 4.8 8 2.9 4 Philippines 19.8 3 9.2 4Pakistan .. .. 2.6 5 Korea .. .. 7.2 5Jamaica 5.0 6 1.8 6 Iran .. .. 5.9 6Sri Lanka 4.4 9 1.5 7 United States 8.0 8 5.5 7United Kingdom 2.7 11 1.4 8 Chinese Taipei 9.9 4 5.5 8Vietnam 5.6 5 1.3 9 Sri Lanka 9.1 6 4.7 9Guyana .. .. 1.1 10 United Kingdom 7.2 3 4.5 101999 Top 10 countries (% of total) 49.2 57.7 1999 Top 10 countries (% of total) 34.4 51.8

Canada
147
© OECD 2001
of refugees from Somalia and Croatia remained stable (1 400 and 1 100 respectively) and it should be noted thatthe vast majority of Somalis, Sri Lankans, Algerians and Iranians obtained refugee status as asylum seekers.
In 1999, approximately 5 400 people who had not received refugee status had to leave Canada, account-ing for 65% of all removals, 6% up on 1998.
In spring 1999, in close conjunction with the UNHCR, the IOM, the International Red Cross and Europeancountries, Canada took in a substantial number of Kosovar refugees: a total of 8 000 people including specialneeds and family reunion cases. At the same time approximately 2 100 people returned voluntarily to Kosovo.
Family reunion
Immigration under family reunion arrangements is the second largest category. In 1999 an estimated55 260 people obtained permanent residence permits via this channel (+8.5 on 1998), accounting for 29% oftotal entries.
While this component of immigration has been falling steadily since 1993, it rose in 1999, though less rap-idly than total immigration flows. Accordingly, family reunion’s share of total immigration levelled offbetween 1998 and 1999.
India continues to be the leading source of family reunion immigrants (17.3%, see Table III.8). In 1999, theonly significant increases in flows were from Pakistan (+61%), the Philippines (+23.5%) and Sri Lanka (130%).
2. Structure and changes in the foreign-born population
The 1996 census put Canada’s total population at 28.5 million. The number of immigrants (i.e. personsborn abroad who have been granted permanent resident status) was 5 million, 17.4% of the total, and roseby 27% between the 1986 and 1996 censuses. Immigrants from Europe were still the largest group(2.3 million) in 1996, but for the first time this century they accounted for less than half of all immigrants.Although the numbers of immigrants from other parts of the world increased strongly over those ten years,only immigrants from Asia formed particularly significant groups in 1996 (Asia: 1 562 800; Africa: 229 300;Central and South America: 553 700).
In 1996 new immigrants, i.e. those who had arrived since 1991, had a higher level of education than thenative-born population. Slightly more than 21% of new immigrants above the age of 15 held a universitydegree, compared with 12.2% of the Canadian-born. Within the total immigrant population, 77.7% spokeEnglish only, against 64.8% of the non-immigrant population.
3. Migration and the labour market
Data from the 1996 census show that immigrants account for approximately 19% of Canada’s labour force.In aggregate terms, their labour market participation, as illustrated by employment and unemployment rates,is very similar to that of native-born Canadians: the employment rate is slightly lower (60.7% against 66.9%), butunemployment rates are virtually the same (10.5% against 9.9% in 1996). But, probably as a result of the recessionthat Canada faced in the early 90’s, the statistics for new immigrants are markedly less satisfactory. According tothe 1996 census, the employment rate of new immigrants is 59.1% and 18.6% of them are seeking employment.
By law, no person other than a Canadian citizen or resident is permitted to be employed in Canada withouta specific authorisation. The Canadian authorities do issue temporary work permits to asylum seekers whoseapplications have provisionally been determined to be acceptable, and to people with special skills lacking onthe labour market, as well as to United States, Mexican and Chilean citizens eligible under free trade agreements(NAFTA, the North American Free Trade Agreement and the Canada-Chile Free Trade Agreement).
In 1999, over 71 800 people held temporary work permits (asylum seekers not included). Their numberhas been rising for several years (1997-98: +4.5%; 1998-1999: +7%) but the breakdown by country of origin hasremained relatively stable. The bulk of temporary work permits are issued to nationals of OECD countries:United States 24 000, Mexico 8 000, United Kingdom 6 100, Japan 5 100, France 4 600, Australia 3 600, andGermany 2 200. In all these cases, temporary immigration is on a larger scale than the permanent inflows. Thereverse is generally true for other countries.

Trends in International Migration
148
© OECD 2001
4. Policy developments
Admission and residence (including integration measures)
The reforms being made in Canadian immigration policy legislation are part of an ongoing revision pro-cess initiated in December 1996. The Legislative Advisory Group responsible for preparing the revised legis-lation governing immigration and refugees submitted its findings to the Ministry on 31 December 1997 in thereport entitled Not Just Numbers: A Canadian Framework for Future Immigration. The report covers all aspects ofimmigration in Canada and proposes substantial changes in virtually every area. The objectives of thesereforms were discussed further in the government document A Strong Foundation for the 21st Century publishedin 1999, which addresses in particular the immigration of skilled workers.
Management of immigrant flows
In February 2001, the Minister of Citizenship and Immigration tabled new legislation in the House of Com-mons. The legislative changes proposed in the new Immigration and Refugee Protection Act reintroducessevere penalties for people smugglers and traffickers, speeds up family reunification and maintains Canada’shumanitarian tradition of providing safe haven to people in need of protection.
Another act prepared by the CIC, the Department of Finance, Human Resources and Development Canada,the Department of Justice and Treasury Board of Canada Secretariat, recognising the rights and duties ofcohabiting couples, was enacted in 2000. It establishes the right of residence for a foreign national who is thepartner of a Canadian national.
The Department also studied the possibility of creating a system for selecting skilled workers, focusing onthe ability of immigrants to work in an information economy. This system should be more flexible than the cur-rent one and would stress education, job experience and foreign language ability. A programme designed toattract investors (the Immigrant Investor Program) has existed since 1999, and nine business immigration cen-tres located abroad have been operating since 1998 (in Beijing, Berlin, Buffalo, Damascus, Hong Kong (China),London, Paris, Singapore and Seoul).
The stay and integration of foreigners
Immigration policy is managed at all levels of the administration. The CIC manages immigration issues atthe federal level, its role being to set standards for immigration programmes in Canada and define the broadguidelines for immigration policy. The CIC also concludes agreements on the settlement of immigrants withCanada’s provinces. There are also services abroad (Canadian Orientation Abroad) to enable future immi-grants to adjust when they arrive in Canada.
At the federal level, Citizenship and Immigration Canada has a number of programmes aimed at facilitat-ing the integration of immigrants into Canadian society, such as the Immigrant Settlement and Adaptation Pro-gramme (ISAP), which funds orientation and counselling, translation and job search assistance for foreigners.The Host Programme matches Canadian volunteers with arriving immigrants to facilitate their integration andsettlement. There is also a programme aimed at providing arriving immigrants with instruction in the officiallanguages of Canada (Language Instruction for Newcomers in Canada, LINC).
Citizenship and Immigration Canada (CIC) has recently signed agreements with provincial governments regard-ing immigration. The agreements on nominees, for instance, enable the provinces to introduce active recruitmentpolicies: agreements of this kind were concluded in February 1999 with New Brunswick and in September 1999 withNewfoundland and Labrador. Settlement Services Agreements, designed to simplify the administrative proceduresrelating to settlement, were concluded with Manitoba in June 1998 and with British Colombia in May of that year. Fol-lowing an earlier special agreement, Quebec now has sole responsibility for the selection of independent immi-grants and refugees from abroad and administers federally funded integration services.
The CIC is currently conducting a longitudinal study on immigrants in co-operation with Statistics Canada.This study is examining the economic and social aspects of integration, and in particular newcomers’ needs inthis regard and how public services are meeting them. Integration-net, the object of which is informationexchange among agencies involved in settlement, including federal and provincial government, service pro-viders and the immigrants themselves, has been operational since January 2000.

Canada
149
© OECD 2001
Refugees and asylum
Refugee status is granted to Geneva Convention refugees and to eligible persons who apply for it forhumanitarian reasons.
In June 2000 Citizenship and Immigration Canada revised the list of countries for which asylum seeker sta-tus may be granted on humanitarian grounds. This list includes Bosnia Herzegovina, Colombia, Croatia, the
Box III.2. An overview of the structure and approach of Canada’s immigration programme
There are two main mechanisms through which foreigners may legally enter Canada for periods longer thanallowed under short-term tourist and business-travel arrangements: i) with permanent residence status through thepermanent immigration programme, and ii) on a temporary basis as students, refugee claimants or for temporaryemployment. Because it is possible to transfer from temporary to permanent resident status, total issues of permanentresidence (often referred to as “landed immigrants”) include many who have been in the country for some length oftime as temporary residents. About 15% of applications for permanent residence are processed in Canada; the remain-der are processed overseas.
Permanent immigration
Acquisition of permanent residence status is possible under three main classes of entry: i) the “family class”who enter on the basis of having close relatives in Canada; ii) those entering for employment and business rea-sons, the “skilled worker and business classes”; iii) those entering as refugees. The system works through a highlydeveloped set of rules for each class of entry. There are no numerical limits, or other mechanisms for capping thenumber of permanent immigrants, the source of control being solely through the rules of entry. As a result, thereis no mechanism for effecting immediate and precise determination of the numbers granted permanent resi-dence status (in contrast to the system used in Australia). By November 1st of each year, the Minister responsiblefor Citizenship and Immigration Canada issues a statement on the “planned” migration intake for the followingyear, which is based on an assessment of the numbers who are likely to enter under the existing set of regula-tions. Note that the Canadian authorities often refer to issues of permanent residence as immigrant landings.
Entry under the skilled worker class is based on a selection test consisting of criteria against which points areawarded to determine whether persons can become successfully established in Canada. The mix of specificselection criteria and their weighting pattern are designed to reflect what is needed to succeed in Canada’slabour market. Only the principal applicant is assessed.
Entry under the family class is based on sponsorship by a Canadian citizen or permanent resident. Theremust be evidence of the sponsor having a bone fide relationship with the applicant. In addition, the sponsor mustdemonstrate an ability to provide financial support for those sponsored.
Entry under the business class is based on a requirement to make a minimum investment in a Canadian business(or business investment fund) or a requirement to establish, purchase or invest in a designated business that will cre-ate employment opportunities for others. The business class comprises investors, entrepreneurs and self-employed.
Refugee status is granted both to Geneva Convention refugees and those who do not quite satisfy the con-ventional refugee requirements but are nonetheless admitted for humanitarian reasons. There are three majorsub-groups of refugees: government-assisted refugees selected abroad; privately sponsored refugees selectedabroad; and asylum seekers who come to Canada and claim refugee status and who subsequently receive a posi-tive determination on their claim. Asylum seekers are issued an employment authorisation for a period of ninemonths once certain requirements are met (such as a credible basis for their claim and a medical examination).
Temporary immigration
Temporary immigration to Canada is tracked through data on employment authorisations (by law, no personsother than a Canadian citizen or permanent resident is permitted to be employed in Canada without an employ-ment authorisation). The motivation for issuing temporary employment authorisations is both humanitarian andeconomic. Some authorisations have to be “validated”, i.e. Human Resources Development Canada ensures thatthere is no Canadian citizen or permanent resident available to fill the position. However, the majority of authori-sations are exempt from validation. Those exempt include a wide variety of applicants such as persons awaitingresults of an application for permanent residence from within Canada and applicants for refugee status.
The North American Free Trade Agreement (NAFTA) allows for temporary entry to Canada by citizens of theUnited States or Mexico under four categories of employment: “trader and investor”, “business visitor”, “profes-sional” and “inter-company transferee”. Most of the entries under NAFTA are in the “professional” category whereentry is based on an agreed list of specific professions.

Trends in International Migration
150
© OECD 2001
Democratic Republic of Congo, El Salvador, Guatemala and Sudan. The abolition of the tax levied on arrival inCanada was announced in February 2000.
Czech Republic
Introduction
Economic growth in the Czech Republic has been accelerating modestly from an expected 1.5% in 1999 to1.9% in 2000. Unemployment started to decrease in the beginning of 2000, when registered unemployment (asa percentage of the labour force) stood nearly at 9%, to stabilise in the first quarter of 2001 at 8.5%. There hasbeen little change in legal migration flows compared with last year’s figures but the number of asylum applica-tions rose further. However, the abuse of asylum procedures by people wishing to cross the Western border(i.e., German) continued to rise steeply. The number of illegal border crossings decreased at the same time,owing to the falling numbers of people who flee from Kosovo.
1. Trends in migration movements
Emigration
After a one-time peak in 1993 when the Czech borders opened, emigration has increased fairly steadilybut the Czech Statistical Office recorded a slight decrease to 1 136 in 1999 from 1 241 one year earlier. How-ever, inspection of the immigration statistics of neighbouring countries shows that only a very small portion ofemigration is captured by the official statistics. Germany, for instance, recorded 8 448 immigrants from theCzech Republic in 1998 whilst the Czech authorities had counted only 345 emigrants for Germany. Immigrationstatistics are assumed to be much more reliable.
Inflows and outflows of foreigners
Inflows from the Slovak Republic increased from 2 900 in 1998 to 3 200 in 1999, the first increase in 6 years.However, the total influx of foreigners decreased to 9 900 in 1999 (see Table III.9) from 10 700 one year earlier,owing to a decrease in arrivals from other countries than the Slovak Republic. At the same time, as in manyother countries, inflows from Asia have increased considerably. In 1998, over 18% of all immigrants came fromAsia compared with 2% in 1990. Stark increases can also be seen in immigration from the former USSR (from 1%of all immigrants in 1990 to 26% in 1998), other non-European post-communist countries (1990: 1%; 1998:12%),European post-communist countries (1990:3.1%; 1998:6%) and the former Yugoslav region (1990:1%; 1998:6%).Immigrants from other origins accounted for less than 8% of immigration in 1998. The leading source countriesin 1998 were the Slovak Republic (27%), Ukraine (15%) and Vietnam (11%).
Although the educational level of immigrants has dropped significantly, they are on average better edu-cated than the native population. In 1998, one-fifth of all immigrants was in possession of a university degree,compared with one-fourth in 1997; 25% had completed secondary education as compared with 32% in 1997.There is a large variation among immigrants: more than 35% of all Russian and Yugoslav immigrants had a uni-versity degree in 1998, compared to only 5% of Vietnamese and 2% of Romanian immigrants. However, thedata do not suggest that the fall in educational attainments of immigrants be related to the growing inflowsfrom Asia.
Illegal immigration
For an increasing number of migrants, the Czech Republic is a country of transit. The number of peopleabusing refugee procedures skyrocketed over the last few years. By the end of 1997, 749 refugees wilfully left
CZECH REPUBLIC

Czech R
epub
lic
151
© O
EC
D 2001
Table III.9. Current figures on flows and stocks of migrants, Czech Republic
Thousands
1. Population on the 31 December of the given year.2. Permanent residents who had their change of address registered.3. Czech and foreign citizens leaving the Czech Republic permanently are supposed to report their departure to the authorities. Figures represent the total number of registered departures.4. The data are issued by the Slovak Statistical Office and refer to the registrations of permanent residence in the Slovak Republic.5. Up to 1 January 1993, Czechoslovak permanent residents were registered in the National Population Register. Since the split of the Czech and Slovak Republics, Slovak citizens residing in the Czech Republic
are subject to the same rules as any other foreign resident and they are therefore registered in the Central Register of Foreigners.6. A foreigner can be employed only as the holder of a residence permit and work permit. A written offer by the employer is needed to apply for a work permit. These rules do not apply to Slovak citizens.7. Under the Treaty on Mutual Employment of Citizens signed by the Czech Republic and the Slovak Republic in October 1992, nationals of the two Republics have free access to both labour markets. The
estimates of the number of Slovak citizens are made by the local labour offices.Sources: Statistical Yearbook of the Czech Republic (Czech Statistical Office); Ministry of the Interior; Ministry of Labour and Social Affairs.
1996 1997 1998 1999 1996 1997 1998 1999
Total population1 10 309 10 299 10 290 10 278 Registered foreign workers by nationality6
Total population change from beginning to end of year –10 –9 –10 –12 Ukraine 42.1 25.2 19.3 16.7Natural increase –22 –21 –19 –20 Poland 12.8 13.7 9.9 6.9Net migration 12 12 9 9 Bulgaria 2.8 3.3 2.7 1.7
Germany 1.5 1.5 1.6 1.5Inflows2 10.9 12.9 10.7 9.9 Moldavia .. 2.0 2.0 1.4
Arrivals (excluding those from Slovak Republic) 7.4 9.8 7.8 6.7 United States 1.6 1.5 1.4 1.4Arrivals from Slovak Republic 3.5 3.1 2.9 3.2 Belarus 0.9 2.5 2.0 1.3
Other 9.3 11.3 11.0 9.4Outflows 1.5 1.4 1.3 1.1 Total 71.0 61.0 49.9 40.3
Departures (excluding those to Slovak Republic)3 0.5 0.5 0.9 0.8Departures to Slovak Republic4 1.0 0.9 0.4 0.3 Slovak workers7 72.2 69.7 61.3 53.1
Inflows of asylum seekers 2.2 2.1 4.1 7.2 Holders of a business authorisation by nationalityUkraine 2.7 8.7 9.9 19.5
Stocks of foreign residents by type of permits and nationality Vietnam 17.0 24.7 15.5 18.9Holders of a permanent residence permit Slovak Republic 5.9 7.6 6.2 6.6Slovak Republic5 9.9 12.7 14.1 13.0 Germany 1.2 1.5 0.9 0.9Poland 12.1 11.9 12.0 11.6 Other 18.7 21.0 12.5 12.5Vietnam 2.5 5.1 6.8 8.0 Total 45.5 63.5 45.0 58.4Ukraine 2.8 4.6 6.2 7.8Russian Federation 2.0 2.5 2.9 3.5 Czech workers employed in GermanyBulgaria 1.8 2.4 2.3 2.3 Contract workers 2.3 1.4 1.1 1.4Other 14.7 17.1 19.6 20.6 Seasonal workers 3.4 2.3 1.8 1.9Total 45.8 56.3 63.9 66.8
Illegal migrants caught at the border 23.7 29.3 44.7 32.3Holders of a long-term residence permitUkraine 43.5 38.8 46.4 58.1Slovak Republic 40.3 39.5 35.5 27.3Vietnam 15.1 15.8 16.1 16.9Russian Federation 4.7 6.5 7.2 13.4Poland 12.4 13.1 10.1 6.7China 4.7 4.4 4.1 4.2Bulgaria 2.5 4.2 3.6 2.7Other 29.6 31.2 32.8 32.8Total 152.8 153.5 155.8 162.1

Trends in International Migration
152
© OECD 2001
the refugee camps before the end of their procedure; in 1998 there were 1 900 such cases and in 1999 7 786. Ofthese, in 1999, 3 204 persons were caught when they tried to cross the country-border illegally.
A total of 32 325 persons were caught in 1999, whilst they were trying to cross the Czech borders illegally;of these 30 377 were of foreign origin. This compares with 44 672 illegal border crossings in 1998. The steepdecline on last year is mainly because of the calming of the situation in Kosovo.
Refugees and asylum seekers
The number of asylum seekers rose to unprecedented heights in 1999. With the 7 219 applicants in 1999,the total number of asylum seekers for the 1990-1999 period is 25 105. In 1999, applicants for refugee statusoriginated from 65 countries; more than three-quarters came from Asia, 19% from within Europe and 4% fromAfrica. The leading countries were Afghanistan (2 312), Sri Lanka (900) and India (887), the former FederalRepublic of Yugoslavia (622) and Iraq (346).
In 1999, refugee status had been granted to 80 cases; half of these were children and teenagers under18 years of age. Most successful applicants came from Afghanistan and Belarus. The total number of legal refu-gees on Czech territory was 1 227 in December 1999.
2. Structure and changes in the foreign population
Numerical trends
In 1999, three categories of residence were distinguished in the Czech Republic. Short-term permitsallowed foreigners free movement about the territory of the Czech Republic for up to 180 days for purposes oftourism and subject to visa regulations. Long-term residence permits were not to exceed one year but couldbe prolonged. They were granted for study, medical treatment and for professional and business purposes.Visa legislation has been changed since to harmonise with Schengen practices (see Section 4). Permanent res-idence permits were and still are granted for the purpose of family reunification to family members of holdersof permanent residence permits or occasionally for humanitarian reasons. After ten years of uninterrupted staythe foreigner may be entitled to a permanent residence permit.
In the course of 1999, 92 836 residence permits were granted, of which 8 191 were for permanent resi-dence. In 35% of the cases, residence permits were granted for business activities. The number of foreigners inthe Czech Republic has increased continuously since the beginning of the nineties. The largest increasescould be seen in the stock of foreigners with a long-term residence permit, mainly Ukrainians (1998: 46 444 ;1999: 58 063) and Russians (1998: 7 155 ; 1999: 13 420, see Table III.9). The number of long-term residence per-mit holders from the Slovak Republic has decreased. Well over two-thirds of the stock of foreign residents(1999: 288 862) were foreigners with a long-term residence permit (162 108). The largest foreign populationsin 1999 were from Ukraine (29%), Slovak (18%), Vietnam (11%), Poland (7%) and Russia (7%). These numbers areconfirmed by the statistics for 2000.
A population census is planned in 2001; it will then be possible to give a more precise picture of the totalsize and composition of the foreign migration.
Naturalisations
A total of 1 031 applicants were granted Czech citizenship, most of these Ukrainians (mainly from theTchernobyl region). A further 116 refugees, mostly Armenian, were naturalised. The foreign populationamounts to 228 862, which implies a naturalisation rate of 0.5%.
3. Migration and the labour market
The Czech administration keeps a register on entries for business purposes in addition to a register onforeign workers. The total of foreigners on the Czech labour market increased until 1996 and has since thencontinuously decreased, owing to the economic crisis, to 152 000 in 1999. The decline can be explained by adrop in the group of foreign workers (1998: 111 247; 1999: 93 466). The strongest decline can be seen in the

Czech Republic
153
© OECD 2001
most strongly represented groups: workers of Slovak, Ukrainian and Polish origin (see Table III.9). However,the statistics for 2000 indicate an increase (103 650 foreign workers and 61 350 holders of a business licence).However, these increases hide an overall decreasing number of workers and an increasing number of tradelicences.
The number of business immigrants has increased with 30% in 1999 after a significant drop one year ear-lier. By the end of the year, there were 1.7 million of business immigrants, of which 58 400 or nearly 3.5% for-eigners. Well over one-third of all business immigrants are registered in or around Prague. Of all businessimmigrants, about a third are Ukrainian; their number almost doubled to 19 500 (21 400 by the end 2000) inone year and for the first year outstripped the Vietnamese (19 300). The increase parallels the increase in thelong-term residence permits that are granted to Ukrainians; whereas in previous years Ukrainians applied forwork permits they have become more entrepreneurial; their business activities mainly concern construction,forestry and other industries on the basis of Trade Certificates (See Section 4).
The persistent high unemployment level has led the government to introduce measures that restrict thepossibilities to employ foreigners (see Section 4).
4. Policy developments
Admission and residence (including integration measures)
The persistent high unemployment has led the government to adopt two new laws in an attempt to con-trol migration flows. The National Employment Plan of May 1995 and the October 1999 amendment tothe 1991 Employment Law make it tougher for employers to attract foreigners for vacant positions and relatethe quota of labour migration to the labour market situation. Permission to work is further restricted to a spe-cific region, job and employer and does not give access to the Czech labour market. The amendment imposesa maximum of three years to foreign employment; the immigrant can file a new visa application after a one-year interruption.
On July 7, 1999, the Czech government adopted Resolution 689, which creates a frame of reference for for-eigners’ human rights and equal rights. The resolution is linked to a draft strategy that aims to clarify the roleof different ministries and institutions with respect to the integration of foreigners into the Czech society. Itsoverall objective is to improve the chances of integration of foreigners. The preparatory phase was planned forthe period 1999-2000 and the strategy will be implemented during 2001. Assessment will take place in 2002.
In January 2000, a New Law on Stay of Foreigners came into force, as well as a Law on Asylum. These lawsgive new definitions of temporary and permanent residence. Temporary residence is possible for protectionof foreigners in distress without a visa – an exceptional right to be granted by the government –, on a shortterm visa for non-professional visits under 90 days and on a long-term visa for any stay over 90 days. Thesereplace the earlier concepts of long-term and short-term stay. To align with the Schengen countries, the CzechRepublic has introduced the Airport visa, which entitles foreigners to the right of access to international air-port areas within the Republic.
The Czech government aims to harmonise visa regulations with those prevailing in the European Union.To this end visa obligations were installed for visitors from the former Soviet Union and Cuba. In March 2000,an amendment to the Business Act came into force: an alien may be granted a business certificate only on thebasis of previously obtained long-term visa for the purpose of business activity. The applicant must also dem-onstrate sufficient financial resources. The aim of this amendment is to restrict uncontrolled business activityof foreigners.
Measures to combat the illegal employment of foreign workers
The New Law on the Stay of Foreigners (January 2000) aims to combat illegal employment by regulatingthe amount of information foreign workers should provide to the Czech administration. Furthermore, the lawtightens visa obligations for nationalities that dominate Czech immigration, in particular Ukrainians.

Trends in International Migration
154
© OECD 2001
Denmark
Introduction
The level of unemployment in Denmark has decreased to 4.7% of the total labour force in 2000 after hav-ing stabilised since 1998 at 5.2% as economic GDP continued at 2.9% in 2000. The good economic conditionsfavoured immigrants whose unemployment rates have fallen but still remain well above the national average(14% compared to a national average of 5%). The imbalance between labour market participation and unem-ployment rates between immigrants and native Danish citizens has among other motives brought forth thenew Act on Immigration (1 January 1999) to facilitate immigrants’ labour market integration.
1. Trends in migration movements
Total net migration was 11 407 in 1998. Immigrants will be registered as foreign residents only after oneyear of uninterrupted residence in Denmark, in line with UN recommendations. Hence the one-year time lagin Danish immigration statistics on long-term migration. Moreover, refugees and asylum seekers do not enterthe migration statistics before they obtain a permanent residence permit.
Emigration
Emigration has increased, with 57% in the period between 1984 and 1998 and amounted to 21 964 in 1998(see Table III.10). Distinct phases in emigration can be distinguished but the main drivers behind emigrationare Danes going abroad for work and studies. They account for 14 256 or 65% of total emigration. Danishnationals account for 36% of total immigration and consist mainly of return migration, aside from a small per-centage of Greenlanders and people from the Faeroe Islands (1998: 12 094); net migration of nationals hasbeen negative since 1996.
Inflows and outflows of foreigners
Net migration of foreigners amounted to 13 569 in 1998. Immigration into Denmark has increased by 138%in the period between 1984 and 1998 (1998: 21 277 or 64% of total immigration). In the early eighties immigra-tion consisted mainly of people who came to Denmark to work, but over the last 15 years refugees and theirfamilies have become the dominant factor in immigration. Since the beginning of the 1990s, net migration hasremained between 10 000 and 14 000, not regarding the incidental peak of Yugoslav inflows in 1995-96.
The most important group of source countries in 1998 were Asian countries which accounted for 29%of total immigration, but by far the most important was Iraq (2 278). Other important source countries wereSomalia (1 207), Turkey (1 154), Germany (1 163), Norway (1 086), Sweden (1 002) and the United Kingdom (957).
Emigration flows do not mimic immigration, which might suggest something about the immigrationmotives. People from Nordic and EU countries immigrate to Denmark mainly for work or education and leaveafter some time. People from Asia and outside Europe seek residence in Denmark for family reasons or as ref-ugees and do so on a permanent basis.
Refugees and asylum seekers
Asylum seekers can apply for refugee status in Denmark or at the Danish country representation abroad.Asylum seekers who come to Denmark fill the vast majority of applications. Their number has risen to6 467 in 1999, a 13% increase on 1998. The growing number of applicants from European countries, viz. theformer Yugoslavia and the Slovak Republic, explains last year’s increase in large part. Still, by far the largestgroup of asylum seekers comes from Iraq. The number of applicants from Somalia has declined further (SeeTable III.10).
DENMARK

Den
mark
155
© O
EC
D 2001
Table III.10. Current figures on flows and stocks of foreign population and labour force, Denmark
Figures in thousands unless otherwise indicated
1. A long-term immigrant/emigrant is defined as a person who has lived in/out of the country for over one year.2. Data include figures from Finland, Iceland, Norway and Sweden.3. All foreigners (except Nordic countries citizens) who want to reside for more than 3 months in Denmark need a residence permit. The duration of the permit depends on the reasons for granting it but it
generally does not exceed two years.4. An immigrant is defined as a person born abroad by parents who have either foreign citizenship or are also born abroad. A descendant is a person born in Denmark with parents who are either immigrants
or descendants of immigrants.Source: Danmarks Statistik.
1996 1997 1998 1999 1996 1997 1998 1999
Long-term immigration by group of nationality1 37.1 32.6 33.4 .. Acquisition of Danish nationality, by region of origin 7.3 5.5 10.3 12.4Denmark 12.4 12.2 12.1 .. Nordic countries2 0.3 0.3 0.4 0.3Other Nordic countries2 3.3 3.2 3.0 .. Other European countries 0.3 0.3 2.8 4.7Other European countries 11.7 8.4 8.2 .. Asia 3.1 2.0 4.5 4.8Asia 4.5 4.6 6.1 .. Africa 0.5 0.3 0.7 0.9Africa 3.6 2.8 2.3 .. America 2.1 1.7 0.2 0.2Other 1.6 1.4 1.7 .. Other 1.0 0.9 1.6 1.5
Long-term emigration by group of nationality1 19.8 20.7 22.0 .. Stock of foreigners 237.7 249.6 256.3 259.4Denmark 13.8 14.0 14.3 .. Nordic countries2 28.7 29.9 30.6 31.3Other Nordic countries2 1.6 1.9 2.2 .. Other European countries 118.8 123.9 127.2 146.0Other European countries 2.4 2.9 3.3 .. Asia 50.5 53.2 54.8 56.1Asia 0.9 0.8 0.8 .. Africa 19.2 22.1 23.9 25.4Africa 0.4 0.4 0.7 .. America 9.3 9.6 9.8 10.2Other 0.8 0.7 0.8 .. Oceania 1.1 1.1 1.1 1.2
Other 10.2 9.9 8.7 7.7Grants of residence permits, by category3 32.3 29.5 31.0 29.3
Family reunification 8.7 7.7 9.7 9.5 Immigrants by region of origin4 265.8 276.8 287.7 296.9EU provisions 5.9 5.9 6.1 5.7 Nordic countries2 33.0 33.8 34.2 34.5Refugee 8.7 5.9 4.8 4.5 Other European countries 125.1 129.3 133.0 127.6Employment 2.8 3.1 3.3 3.1 Asia 72.0 75.3 80.1 84.5Others 6.3 6.9 7.2 6.5 Africa 21.5 23.8 25.5 26.8
America 11.9 12.2 12.6 13.0Asylum seekers by region of origin 5.9 5.1 5.7 6.5 Oceania 1.1 1.1 1.2 1.3
Europe 1.3 1.3 1.4 2.5 Other 1.1 1.1 1.2 9.3of which: Fed. Rep. of Yugoslavia 0.4 0.4 0.4 0.9Asia 1.9 1.8 3.0 3.0 Descendants by region of origin4 64.5 70.3 75.7 81.2of which: Iraq 0.7 0.8 1.9 1.8 Nordic countries2 4.6 4.6 4.7 4.7Africa 1.7 1.5 0.9 0.7 Other European countries 29.4 31.5 33.5 35.3of which: Somalia 1.4 1.2 0.6 0.5 Asia 23.0 25.4 27.8 30.2Other regions 1.0 0.5 0.4 0.2 Africa 5.8 6.9 7.9 9.1
America 1.2 1.5 1.5 1.5Oceania 0.1 0.1 0.1 0.1Other 0.5 0.2 0.2 0.3
Labour force and unemployment rates among immigrants and their descendantsImmigrants
Participation rate .. .. 55 56Unemployment rate .. .. 17 14
DescendantsParticipation rate .. .. 68 69Unemployment rate .. 10 8 7
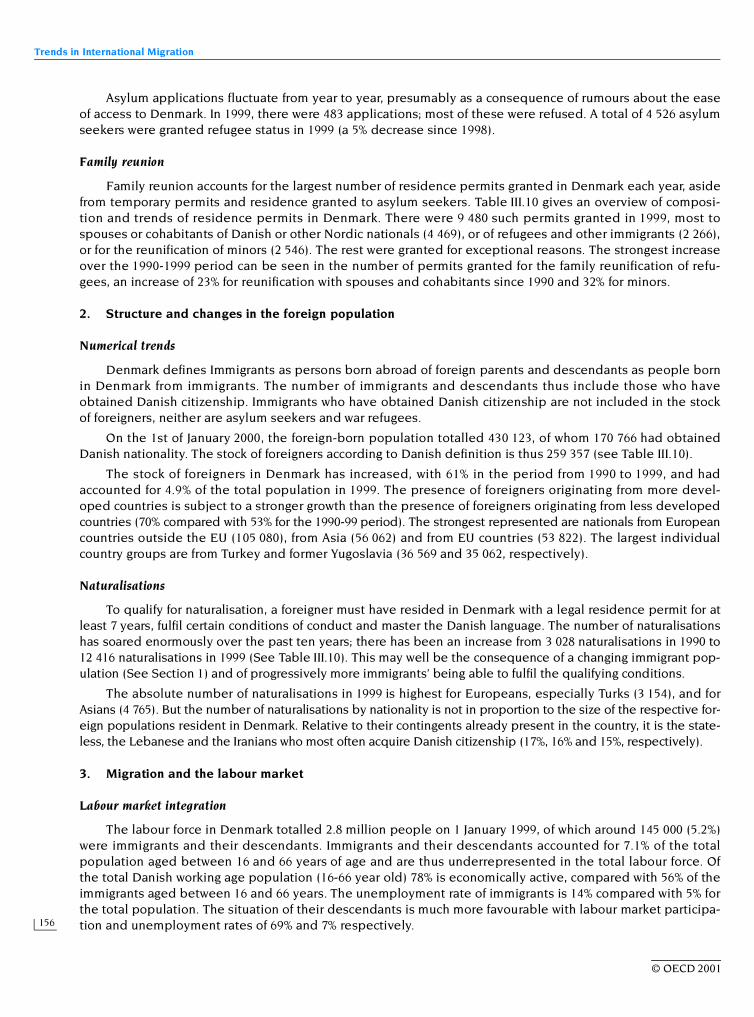
Trends in International Migration
156
© OECD 2001
Asylum applications fluctuate from year to year, presumably as a consequence of rumours about the easeof access to Denmark. In 1999, there were 483 applications; most of these were refused. A total of 4 526 asylumseekers were granted refugee status in 1999 (a 5% decrease since 1998).
Family reunion
Family reunion accounts for the largest number of residence permits granted in Denmark each year, asidefrom temporary permits and residence granted to asylum seekers. Table III.10 gives an overview of composi-tion and trends of residence permits in Denmark. There were 9 480 such permits granted in 1999, most tospouses or cohabitants of Danish or other Nordic nationals (4 469), or of refugees and other immigrants (2 266),or for the reunification of minors (2 546). The rest were granted for exceptional reasons. The strongest increaseover the 1990-1999 period can be seen in the number of permits granted for the family reunification of refu-gees, an increase of 23% for reunification with spouses and cohabitants since 1990 and 32% for minors.
2. Structure and changes in the foreign population
Numerical trends
Denmark defines Immigrants as persons born abroad of foreign parents and descendants as people bornin Denmark from immigrants. The number of immigrants and descendants thus include those who haveobtained Danish citizenship. Immigrants who have obtained Danish citizenship are not included in the stockof foreigners, neither are asylum seekers and war refugees.
On the 1st of January 2000, the foreign-born population totalled 430 123, of whom 170 766 had obtainedDanish nationality. The stock of foreigners according to Danish definition is thus 259 357 (see Table III.10).
The stock of foreigners in Denmark has increased, with 61% in the period from 1990 to 1999, and hadaccounted for 4.9% of the total population in 1999. The presence of foreigners originating from more devel-oped countries is subject to a stronger growth than the presence of foreigners originating from less developedcountries (70% compared with 53% for the 1990-99 period). The strongest represented are nationals from Europeancountries outside the EU (105 080), from Asia (56 062) and from EU countries (53 822). The largest individualcountry groups are from Turkey and former Yugoslavia (36 569 and 35 062, respectively).
Naturalisations
To qualify for naturalisation, a foreigner must have resided in Denmark with a legal residence permit for atleast 7 years, fulfil certain conditions of conduct and master the Danish language. The number of naturalisationshas soared enormously over the past ten years; there has been an increase from 3 028 naturalisations in 1990 to12 416 naturalisations in 1999 (See Table III.10). This may well be the consequence of a changing immigrant pop-ulation (See Section 1) and of progressively more immigrants’ being able to fulfil the qualifying conditions.
The absolute number of naturalisations in 1999 is highest for Europeans, especially Turks (3 154), and forAsians (4 765). But the number of naturalisations by nationality is not in proportion to the size of the respective for-eign populations resident in Denmark. Relative to their contingents already present in the country, it is the state-less, the Lebanese and the Iranians who most often acquire Danish citizenship (17%, 16% and 15%, respectively).
3. Migration and the labour market
Labour market integration
The labour force in Denmark totalled 2.8 million people on 1 January 1999, of which around 145 000 (5.2%)were immigrants and their descendants. Immigrants and their descendants accounted for 7.1% of the totalpopulation aged between 16 and 66 years of age and are thus underrepresented in the total labour force. Ofthe total Danish working age population (16-66 year old) 78% is economically active, compared with 56% of theimmigrants aged between 16 and 66 years. The unemployment rate of immigrants is 14% compared with 5% forthe total population. The situation of their descendants is much more favourable with labour market participa-tion and unemployment rates of 69% and 7% respectively.

Denmark
157
© OECD 2001
There is a large variation in labour market participation and unemployment between gender andbetween groups. Immigrants from African and Asian countries have much lower participation rates (43.5% and49.4% respectively) than people originating from EU-countries, North America and Oceania (66.9, 56.7 and 60.1,respectively). Especially people from Somalia, Iraq and Lebanon have very low participation rates (18.6%,26.3% and 34%, respectively). The situation for descendants is less dramatic; participation rates for descen-dants of immigrants from developed countries2 are 76.1% and 64.8% from less developed countries.
The unemployment patterns, too, vary greatly between groups and gender. In general, groups with lowlabour-force participation rates also have high unemployment rates. Somalia, Iraqi and Lebanese immigrantshave the highest unemployment rates (43%, 31% and 32%, respectively).
A recent report by Statistics Denmark (Education by immigrants, Sept. 2000) found considerable variation ineducational attainments of immigrants of different source countries. The report shows a positive correlationbetween educational attainment of immigrants and their labour force participation rate. The report also offersan explanation of the gender gap in unemployment and labour force participation rates: some immigrantscome from cultures where women traditionally do not participate in the labour market. Male immigrants fromSomalia, Iraq and Lebanon, for instance, have much higher participation rates than women. Their descendantshowever, enjoy higher participation rates and smaller gender differences.
4. Policy developments
Admission and residence (including integration measures)
A new Immigration Act came into force on 1 January 1999, to promote the integration of immigrants andrefugees in society and in the labour market. It consists mainly in intensive language training, education
Box III.3. The educational attainment of immigrants
A study on the educational attainment of newly arriving immigrants carried out by Statistics Denmarkin 2000 aims to shed some light on the immigrants’ contribution to the Danish economy. The study reveals a gen-eral good educational level of immigrants. Of the group as a total, less than 7% has no education and 55.4% has atleast vocational training, of which 7.3% possesses a Bachelor’s degree or higher. Immigrants from EU countries,North America and Oceania are on average better educated than native Danes. Immigrants from Africa and Asiahave much poorer educational attainments than those from EU-countries and North America.
An institution has been created to evaluate foreign educational qualifications with their Danish equivalence(see Table III.11).
Table III.11. Immigrants by region of origin and educational attainment, 2000, Denmark
Percentage with at least vocational education
Note: Persons aged 18 to 59.Source: Danmarks Statistic, 2000.
Region of origin % with at least vocational education
Born in Denmark 60.6
All immigrants 55.4EU countries 75.4Other European countries 53.2North America 80.1Oceania 79Africa 47.7Asia 44.2
Trends in International Migration
158
© OECD 2001
(including of Danish values) and specific help to access employment in a three-year programme. The Act alsoaffects on the legislation concerning the housing of refugees so as to prevent geographic concentrations of for-eigners. (22% of all foreigners are concentrated in Copenhagen.)
In addition, the action plan for Better Integration was agreed to in February 2000 to further improve educa-tion and integration of refugees and immigrants. Moreover, various initiatives aim at improving ethnic equality inthe workplace, guidelines on recruitment and personnel policy for the government sector, and at influencingrecruitment policies in the private sector. Companies receive a subsidy to hire personnel of foreign origin.
Finland
Introduction
Since 1993, Finland’s economy has continued to grow at a very brisk pace, with GDP rising by some 3.5%in 1999 and over 5.75% in 2000 (the seventh consecutive year of strong growth). Employment has naturallybenefited from the healthy economic conditions and unemployment has fallen by about 1 point per yearsince 1998, although it was still over 9.8% in 2000, i.e. comparable to the levels in Germany and France.
Trends in migration over the two-year period showed increases in both immigration and emigration. Thelatter rose as markedly in 1999 as in 1998 and the net migration gain fell slightly between 1998 (3 370)and 1999 (2 770). Since 1989, the foreign population in Finland has risen fourfold.
1. Trends in migration movements
Emigration and the return of nationals
Emigration had a significant impact on migration trends in 1999, with some 11 970 people leaving Finland,i.e. 10.8% more than the previous year (9 970 Finns and 2 000 foreigners).
Although the number of Finns returning increased (1998: 5 850; 1999: 6 800), there is still a net migrationloss in this group (see Table III.12).
During the 1990s, Finns moved chiefly to Sweden (over 2 500 a year, or between 30 and 50% of depar-tures). In 1999, over 3 000 emigrated to Sweden (+12% between 1998 and 1999), 1 320 to Norway (+3.4%between 1998 and 1999), 600 to Spain (1998: 660; 1997: 527) and 812 to the United Kingdom (+23%between 1998 and 1999). Other destinations include Germany, the United States, Denmark and Belgium. Over75% of Finnish emigrants went to EU countries (50% to Nordic countries), but they are increasingly emigratingto non-European countries.
Emigration to Belgium may reflect the mobility of managers following Finland’s EU accession, while move-ments to Spain appear largely to concern retired people. Movements to the United Kingdom may be due tothat country’s attractiveness to students.
Inflows and outflows of foreigners
The growth in inflows slowed between 1997 and 1998 and in 1999 immigration declined, with entries total-ling 7 940, a drop of 4.8% between 1998 and 1999 (see Table III.12). Although outflows of foreigner have been rela-tively stable since the beginning of the 1990s (averaging around 1 500), they rose sharply in 1996 (3 010) and, to alesser extent, in 1999 (2 000). Consequently, there was a migration gain for the foreign population (+5 940), but itwas lower between 1998 and 1999 (–10.7%) than between 1997 and 1998, when it grew slightly (+1.2%).
As was the case in the previous four years, the largest inflows were from Russia (1999: 2 200), followed bySweden and Estonia. These three groups alone represented 43.6% of total immigration (47.5% in 1998). Around25% of foreigners who officially left Finland in 1998 were Swedes, reflecting the recent upturn in the Swedisheconomy. In 1999, outflows of Russian and Estonian nationals fell appreciably, while inflows of US and UKnationals rose.
FINLAND

Finland
159
© OECD 2001
Refugees and asylum seekers
The number of asylum applications in Finland has fluctuated substantially over the last ten years. Priorto 1990, there were at most a few dozen requests each year. Between 1990 and 1993, some 2 000 applications ayear were filed, the number then falling back to under 1 000. In 1998, asylum applications rose again, to 1 270,and in 1999 grew further to 3 100. This sharp increase was mainly due to the influx of Slovak (1 520) and Polish(320) asylum seekers (mostly Romani). This trend continued in 2000, with 2 600 asylum seekers registeredthrough September, half of whom were from Poland (1 200) and Slovakia (340).
Although in 1998 the largest number of applications were from nationals of the former Yugoslavia, fol-lowed by Somalis, applications from both these groups fell sharply in 1999. The number of asylum seekersfrom Turkey and Iraq was relatively stable at around 100 people.
The Ministry of the Interior issued rulings on 2 725 asylum applications – which was three times as manyas in previous years –, of which 49% were rejected. The proportion of refusals thus rose by nearly 22% over theprevious year.
Every year the Finnish Parliament establishes a quota for the attribution of refugee status. It was set at650 in 1999 and 700 in 2000. However, only 132 people were admitted to Finland on these grounds in 1999 and155 additional refugees were accepted on family reunion grounds. In all, 1 200 people obtained refugee sta-tus. These figures are in line with the average observed since 1994. In 1999, most refugees came from the MiddleEast, while the number of refugees from African countries was unusually low. The geographical breakdownshows that refugees are mainly from the Middle East (540), Africa (130) and Eastern Europe (440).
Table III.12. Current figures on flows and stocks of total population, Finland
Figures in thousands unless otherwise indicated
1. A large proportion of Russians and Estonians have Finnish origin.2. Data are from population registers and refer to the population on 30 September of the years indicated.Source: Statistics Finland.
1996 1997 1998 1999
Inflows by main nationality 13.3 13.6 14.2 14.7Nationals 5.8 5.4 5.9 6.8Foreigners 7.5 8.1 8.3 7.9of which:
Former USSR1 2.0 2.4 2.5 2.2Sweden 0.6 0.7 0.8 0.7Estonia1 0.7 0.6 0.7 0.6
Net migration by main nationality 2.7 3.7 3.4 2.8Nationals –1.8 –2.9 –3.3 –3.2Foreigners 4.5 6.6 6.7 5.9of which:
Former USSR1 1.6 2.3 2.4 2.1Estonia1 0.3 0.5 0.5 0.4Sweden 0.3 0.3 0.4 0.3
Asylum seekers 0.7 1.0 1.3 3.1
Foreign population by main nationality2 73.8 80.6 85.1 87.7of which:
Former USSR1 17.0 19.0 20.5 22.6Estonia1 9.0 9.7 10.3 10.7Sweden 7.3 7.5 7.8 7.9Somalia 4.6 5.2 5.4 4.4
Acquisition of nationality by former nationality (number of persons) 981 1 439 4 000 4 730Somalia – 10 476 1 208Former USSR 198 254 800 935Estonia 17 62 143 379Other countries 766 1 113 2 581 2 208
Mixed marriages 2.4 2.4 2.6 2.9

Trends in International Migration
160
© OECD 2001
2. Structure and changes in the foreign population
Numerical trends
At 31 December 1999, some 87 700 foreigners were resident in Finland (see Table III.12), an increase ofnearly 3%, or 2 600 people, over the previous year. The proportion of foreigners in the total population is stillextremely small, however, at just 1.7%.
The main figures on changes in the foreign population between 1998 and 1999 are as follows: 7 940 newimmigrants, 2 000 emigrants, 1 300 children born to parents of foreign origin, some 300 deaths and, lastly,4 700 naturalisations.
The largest group of foreigners in 1999 was certainly the Russians (21 550), followed by the Estonian(10 650) and Swedish (7 809) communities. These three nationalities represent 46% of the total foreign popula-tion (almost the same as their proportion of total immigration in 1999). Many of these immigrants from Estoniaand Russia are Ingrians, and are treated by the authorities as being of ethnic Finnish origin. The number ofEuropean Union nationals settling in Finland increased by 4% in 1999. After the Swedes, the largest groups arenationals of the United Kingdom (2 200), Germany (2 200) and France (825).
It should be pointed out that most foreigners are concentrated in Finland’s major cities and in the Southof the country, as there are major disparities between these areas and the rest of the country. Thus, 66% of for-eigners live in the regions of Uusimaa, Varsinais-Suomi and Pirkanmaa, and 65.5% of foreigners live in one ofthe thirteen largest cities.
Naturalisations
In 1999, slightly more than 4 700 people obtained Finnish citizenship (up 17% on 1998, see Table III.12).Apparently, the upsurge in immigration observed at the beginning of the 1990s is starting to have an impact onthe number of naturalisations. An important trend is the decreasing share of nationals of European countriesin total naturalisations (1995: 50%; 1998: 31%). The number of nationals of the former Soviet Union obtainingFinnish nationality remains large (20%), but in 1999 there were significantly more Somalis (25.5%).
3. Migration and the labour market
Migration for employment and work permits
Foreigners migrate to Finland as refugees and asylum seekers rather than to find work. This explains tosome extent the high rate of unemployment among foreigners from countries other than the United States,Canada or European Union members.
At the end of 1999, people of working age accounted for 74% of the foreign population, compared with 67%for nationals. The most recent data on labour force participation rates date back to 1998, when the participa-tion rate for foreigners was 58%, compared with 71% for nationals. Given that the post-war baby-boom genera-tion will soon be retiring, it is estimated that Finland will need to admit some 20 000 foreigners per year tomeet the likely demand for labour.
In December 1999, 14 000 foreigners were seeking jobs, which represented a very high unemploymentrate (37%), although this rate was falling (1997: 42.1%; 1998: 40%;). At the same time, around 9% of Finns werewithout work. The breakdown by nationality underscores the scale of the problem for some ethnic groups,such as Iraqis, Vietnamese, nationals of Bosnia Herzegovina, Somalis and Iranians.
Over 65% of the members of these communities were unemployed at the end of 1999. The situation has infact worsened markedly since 1996 for Iraqis, who are virtually all unemployed (88%). But the largest numbersof unemployed are among Russians and Estonians, 5 000 and 1 530 respectively in 1999. The number of unem-ployed rose for Russians (+8.6%) and fell for Estonians (–9%).
The particularly stark picture just drawn of foreign employment in Finland needs to be qualified, however.There is a requirement for refugees to register as job-seekers in order to receive training and certain benefits.However, since they do not speak Finnish, they are generally not capable of holding down a job in Finland.

France
161
© OECD 2001
There are no reliable statistics on foreigners in temporary employment in Finland, with the exception oftrainees. In practice there are few temporary workers, and most of them are employed by foreign firms estab-lished in Finland. Estonians and Russians are, however, employed to harvest the strawberry crop, on a sea-sonal basis. Unemployment in Finland is still too high, in any case, to warrant intensive recourse to outsidelabour and there are few industrial sectors in Finland that could employ temporary workers. Recent trends inthe high-tech sector also reduce the need to recruit skilled labour on a short-term basis.
4. Policy developments
The Finnish Government approved a programme relating to its policy on immigration and refugees inOctober 1997. Immigration policy is based on the so-called “two-pillar” model, with the Ministry of the Interiorresponsible for immigration controls and security, and also issuing residence permits, while the Ministry ofLabour, in co-operation with the Ministry of Education, has responsibility for preventing all forms of racismand ethnic discrimination.
Admission and residence (including integration movements)
New legislation on integration and asylum came into effect in May 1999. The aim is to assist the integra-tion of immigrants and to promote equal opportunity and freedom of choice through the acquisition of knowl-edge and skills. The Act further guarantees minimum support and access to health care.
The asylum procedure has not been significantly amended, however. The most significant change con-cerns the regulatory procedure, which is now defined by law rather than by government order.
Development, monitoring and co-ordination of immigrant integration is now to be overseen by the Minis-try of Labour. At regional level, the employment and economic development centres are responsible for inte-grating immigrants into society and the labour market. At local level, municipal authorities have to draw upindividualised integration programmes in conjunction with the relevant government bodies. Immigrants areresponsible for establishing an integration contract with the municipality and employment services, and arerequired to undergo occupational training and learn Finnish. All immigrants resident in Finland must be cov-ered by an integration programme.
To qualify for an integration programme, immigrants must be looking for work or receiving benefit. Eligi-bility runs for three years from the start of residence in the area.
During the integration programme, immigrants receive a subsistence allowance, which may be cut by 20%if individuals refuse to take part in activities under the programme. In the event of persistent refusal, 40% ofthe allowance may be withheld.
A reform of the Aliens Act was implemented in July 2000, the objective being to make it possible to pro-cess patently unjustified asylum applications more rapidly. The main reason for this change seems to be thegrowing number of Romani immigrants from Poland and the Slovak Republic.
France
Introduction
Activity remained buoyant in France in 1999 and 2000, growing at a yearly rate of 3.2%, which was abovethe Euro area average. The unemployment rate fell to under 9%, its lowest level for ten years. This trendencouraged immigration, which continued to rise in 1999, although it could slow with the decline in activityforecast for 2001.
A fuller assessment of migration trends can now be made using the statistics that became availablein 1999, in particular on the results of the 1997 regularisation programme and the latest census. Where flowsand naturalisations are concerned, it is now possible to trace the effects over an entire year of the legislative
FRANCE

Trends in International Migration
162
© OECD 2001
measures enacted in 1998, which changed the conditions governing the entry of foreigners into France andaccess to nationality. With regard to the foreign population, the exhaustive results of the 1999 population cen-sus provide a snapshot of the foreign and immigrant population in France and make inter-censual compari-sons possible.
1. Trends in migration movements
Inflows and outflows of foreigners
Permanent immigration
In France, entry statistics include real entries, regularisations and temporary entries. All immigrantsissued with residence permits for one year or longer are defined as permanent entries (except for students,who are considered as temporary residents even though they may stay for longer than a year).
In 1999, total permanent entries stood at 104 500, which was somewhat much less low than in 1998 due tothe drop in the number of regularisations (see Table III.13). All told, total real entries (not including entriesunder the regularisation procedure) were therefore up in 1999 on 1998. Some 20% of permanent flows camefrom the 18 States of the European Economic Area (EEA) and approximately 80% from other countries. Theincrease in the share of EEA nationals in 1999 was simply due to the fact that the number of entries under theregularisation procedure fell sharply in comparison with 1998. The breakdown of the flows from non-EEA coun-tries was as follows: 58% from Africa, 21% from Asia, 10% from Europe (non-EEA, including the former USSR)and 11% from the Americas.
The main reason for permanent immigration remains family reunion, which was cited in 64% of cases,while work was only given as the chief reason in 10.4% of cases. However, these statistics give an imperfect pic-ture of the impact of immigration on the labour market, since residence permits obtained for family reasonsentitle recipients to hold a job. Lastly, the share of women in permanent inflows of workers continues to drop,the proportion of women in 1999 being 29%, as compared to one-third in 1997.
Temporary immigration and seasonal immigration
Temporary immigration mainly consists of people who have been granted a temporary work permit, whichnow includes scientists, trainees, “artists and authors”, students and asylum seekers. A total of 62 600 non-EEAforeigners entered France in 1999 under these different categories of temporary immigration, a 28% increaseon 1998. More than two-thirds of them were students and asylum seekers (see Table III.13).
In 1999, some 5 800 temporary work permits were issued, up 35% on 1998. This increase could partly beattributed to the fact that scientists are now included and that more foreign managers and computer engineerswere recruited in 1999.
Students accounted for more than a third of temporary inflows, with 25 100 entries in 1999 (40%). Theupward trend in inflows of foreign students in recent years continued in 1999 (up 6.7% on 1998). The share ofAfrican students in the above total grew, rising from 35% in 1998 to 41% in 1999. Asian students accounted forjust over a fourth of these inflows and 20% of students were from the Americas, which was lower than the previ-ous year. Over 50% of students were women.
Seasonal immigration followed the reverse trend, falling from 13 600 entries in 1992 to 7 600 in 1999. Twonationalities alone accounted for nearly 90% of inflows: Moroccans (55%) and Poles (34%). Seasonal workerswere mainly employed in agricultural activities (grape harvest, harvesting fruits and vegetables, etc.) and,increasingly, in tourism and catering.
Departures of foreigners and assisted departures
Spontaneous departures of foreigners are not recorded in the French statistical system and there are nodata available that would make it possible to assess overall departures and make comparisons over time.Only departures prompted by administrative action are counted, i.e. forced departures and assisted

Fran
ce
163
© O
EC
D 2001
Table III.13. Current figures on flows and stocks of foreign population and labour force, France
All figures in thousands unless otherwise indicated
1. Estimates made by the Ministry of the Interior on the basis of residence permits issued.2. Provisional work permits (APT) are granted for a 9 month period and are renewable.3. Re-admissions undertaken within the framework of international agreements.4. In the absence of a population register, the only available data on the departures of foreigners are those which are due to administrative decisions and judicial orders concerning expulsions, removals of
illegal immigrants to the border and voluntary departures assisted by the State.5. The others are accompanying dependents of workers involved in an assisted departure procedure.6. People born in France to foreign parents who declared their intention to become French in accordance with the legislation of 22 July 1993.7. In March of the year indicated.Sources: Office des migrations internationales (OMI); Office français de protection des réfugiés et apatrides (OFPRA); Ministry of the Interior; Labour Force Survey.
1996 1997 1998 1999 1996 1997 1998 1999
Permanent immigration Re-admissions3 .. 3.7 12.5 ..
Registered flows by category Registered outflows of foreigners4
Family reunification (broadly defined) 30.4 31.1 38.3 38.0 Expulsions 1.2 0.9 0.7 0.6Family members of French nationals 15.6 14.4 15.6 15.3 Actual removals to the borders 11.6 9.2 7.2 7.4Family members of foreigners 13.9 15.5 21.7 21.8 Assisted departures 1.6 1.0 1.7 1.0Family members of refugees 0.9 1.1 1.0 0.9
Workers 11.9 11.7 11.6 11.8 Foreigners involved in an assisted departure procedure Wage earners 11.5 11.0 10.3 10.9 (number of persons) 311 286 192 125Self-employed 0.5 0.7 1.3 1.0 (Cumulated figures since 1984) (73 718)
Visitors 8.9 15.1 16.9 8.5 of which: Workers5 205 183 133 97Refugees 4.3 4.1 4.3 4.7 (Cumulated figures since 1984) (32 959)Regularisation of foreigners in an irregular situation – 18.9 45.8 3.3Residence permit holder: "private life and family" .. .. .. 19.6 Acquisition of French nationalityOther .. .. .. 0.2 Legal procedures 58.1 60.5 58.1 67.6Total 55.6 62.0 116.9 86.3 of which: Naturalisation 34.7 35.7 34.7 39.8of which: EEA 7.2 6.4 6.2 6.5 Declarations 21.9 23.2 23.8 68.9
of which: Decision following a wedding 19.1 20.8 22.1 24.1Estimated flows by main category1 Declaration of becoming French6 29.8 32.5 25.5 –
Visitors 7.5 7.8 8.2 7.5 Other – – 14.8 9.0Family members of foreigners 6.5 8.5 8.0 6.5 Total 109.8 116.2 122.3 145.4Other 4.4 5.2 5.0 4.1Total 18.4 21.5 21.2 18.1 Mixed marriages 24.0 24.7 26.7 ..of which: EEA 15.4 17.9 18.4 16.1 % of total marriages 9.6 8.7 9.6 ..
Total registered and estimated flows 74.0 83.5 138.1 104.4 Stocks of foreigners aged 15 and over according to work status7
Total foreign population 2 836 2 818 2 875 2 843Temporary immigration by category Labour force 1 605 1 570 1 587 1 578
Asylum seekers 17.4 21.4 22.4 30.9 of which: employment 1 217 1 205 1 211 1 249Students 16.0 19.2 23.5 25.1 Participation rate (%) 56.6 55.7 55.2 55.5Holders of a provisional work permit2 4.8 4.7 4.3 5.8 Unemployment rate (%) 24.2 23.2 23.7 20.8Trainees 0.5 0.6 0.5 0.7Total 38.7 45.8 50.7 62.5

Trends in International Migration
164
© OECD 2001
departures. It can be estimated that there are some 22 000 forced departures, to which can be added some1 000 assisted returns involving financial aid.
Three types of procedures are used in forced departures: expulsion, removal to the frontier and readmis-sion into an EU country (Dublin Agreement). In 1999, the number of expulsions fell by 6% to some 600 people.The number of removals ordered by the courts also dropped by 10% between 1998 and 1999 (40 000 in 1999),but the number actually enforced rose (7 400 in 1999). In contrast, the number of readmission orders rose by20% (15 000 in 1999), and nearly all of them were enforced.
Assisted departures concern foreigners who receive financial aid to help them resettle in their country oforigin. Foreign workers and job-seekers and foreigners who have been instructed to leave the country whoapply within one month after receiving the order to leave France may qualify for resettlement aid. Of the onethousand people who applied for aid in 1999, only one hundred were workers. Since 1991, some8 400 requests for aid have been granted (out of 9 800 applications), 45% to Europeans, 23% to Africans and20% to Asians.
Lastly, on an exceptional basis, Kosovars who entered France in 1999 also returned to their country. Some2 540 persons returned permanently after the end of the conflict, and 813 went back temporarily to assess thesituation, although nearly all of the latter in fact subsequently returned to France.
Refugees and asylum seekers
After falling sharply since the late 1980s (over 60 000 entries requesting asylum seeker status wererecorded in 1989), the number of asylum seekers entering France has now been rising yearly since 1996. Thisupward trend continued in 1999 with 30 900 applications recorded, up 38% on 1998. This figure represents thenumber of adults who applied for asylum with OFPRA (Office français de protection des réfugiés et apatrides), but doesnot take into account other adults and minors accompanying the applicant, which means that real flows areunderestimated. Since the Act of 11 May 1998 was passed, to asylum seekers must be added the holders ofthe “private and family life” card issued to immigrants granted “territorial” asylum status, who numbered292 in 1999.
In 1999, the largest number of asylum applications were filed by Chinese nationals (17%), nationals of theFederal Republic of Yugoslavia (8%), the former Zaire (7.5%), Turkey and Sri Lanka. Applications by Romaniansand Bulgarians fell, but rose for Kosovars and nationals of the former Soviet Union (Moldavia). For Asia, therise was mainly due to Chinese applicants, but also Turks and Indians. With regard to Africa, the increase canbe attributed to the rise in the number of applicants from Mali, Congo, the former Zaire and Algeria. In all, 43%of applications were filed by Asians, 34% by Africans and 20% by Europeans, whose share is steadily declining.
The “automatic” refusal rate after the initial examination was over 80%, virtually identical to 1998. How-ever, the actual refusal rate is not this high, since there are appeal and review procedures, and some unsuc-cessful applicants were ultimately regularised in the regularisation programme launched in June 1997.
As for statutory refugees, who as such are included in the permanent entry statistics, the rise in numbersthat began in 1998 continued in 1999, 4 659 people being granted refugee status, up 7% on 1998. Half of themwere of Asian origin, with 14.5% from Cambodia, Laos and Vietnam, and 14% from Sri Lanka. More than a fourthare of European origin (approximately 13% from the Federal Republic of Yugoslavia and 8% from Turkey).Fewer than 7% of statutory refugees came from Africa (in particular from the former Zaire and Rwanda). In all,some 108 000 statutory refugees were resident in France at the end of 1999. Three-quarters of them wereAsian, just under 14% Africans and 10% Europeans.
Family reunion
Family reunification comprises three types of inflow: family reunion in the strict sense, immigration ofmembers of a French family and entry of family members of refugees and stateless persons. In all, there weresome 38 000 entries in 1999. These flows consisted mainly of women (over 80%), except in the case of Frenchfamily members (51% women). Immigrants in first two categories came mainly from Africa (especially theMaghreb) and in the third category from Asia.

France
165
© OECD 2001
There were 21 800 entries for the purpose of family reunion in the strict sense, which was roughly thesame as the previous year, with 65% coming from Africa and 22% from Asia (up on 1998). Some 15 300 peoplewere admitted as members of French families (including 12 500 spouses and 2 800 parents of French children).Some 68% came from Africa, in particular Algeria, and 15% from Asia. Lastly, some 1 100 people per year enteras family members of refugees and stateless persons.
In 1999, it was necessary to add to these numbers some 20 000 immigrants granted the “private and familylife” card introduced by the Act of 11 May 1998. Holders of this one-year renewable card may apply for a resi-dence card after five years’ uninterrupted residence in France. Some 54% of these card holders are spouses ofFrench nationals, 17% are foreigners who have proved that they have personal and family ties with Frenchnationals and 8% are parents of French minors residing in France. The rest are mostly foreigners who haveresided in France for 10 years (12%) or foreign minors who have lived in France since the age of 10 (8%). Morethan half of the card holders are women (53%). The origin of the card holders is much the same as for the familyreunion entrants mentioned above.
2. Structure and changes in the foreign population
Numerical trends
According to the 1999 census, there are 3.26 million foreign residents in France. This means that the for-eign population has fallen since the previous census, mainly due to naturalisations (see Table III.14). This gen-eral decline affected all groups of nationalities, except for non-EU Europeans, and as a result the breakdownof foreigners by continent of origin is much the same as in 1990. In 1999, some 43.5% of foreigners residing inFrance were from Africa, 41.5% from Europe, 12.5% from Asia and 2.5% from the Americas. The breakdown forAfrican nationals shifted somewhat, the share of sub-Saharan Africans rising (from 10% to 15%) while the shareof Maghreb nationals fell, although the latter still constitute the largest African community in France. The larg-est group is the Portuguese community (17%), followed by Moroccans (15.5%) and Algerians (14.6%), and thenTurks, Italians and the nationals of all the sub-Saharan African countries (roughly 6% respectively for each ofthese three groups).
The proportion of women in the foreign population in France continued to grow between the two cen-suses. In 1982, 42.9% of foreign residents were women, then 44.9% in 1990 and 46.9% in 1999. More womenhave obtained French nationality by acquisition than men (54%). But this over-representation of men amongforeigners and of women who have obtained French nationality by acquisition is gradually diminishingbecause of the changing composition of inflows and the magnitude of family reunion over the past twodecades.
Table III.14. Total population by nationality and place of birth, France (mainland)
1999 Census, thousands and percentages
1. Sum of naturalised French citizens born abroad and foreigners born abroad.Source: March 1999 Census, INSEE (National Institute of Statistics and Economic Studies).
Place of birth
Born in France
Born abroad
Total% of persons born:
in France abroad
Stock of the population
Nat
ion
alit
y French citizens French at birth 51 342.5 1 559.7 52 902.2 97.1 2.9
Naturalised French citizens 800.4 1 554.9 2 355.3 34.0 66.0
Total 52 142.8 3 114.7 55 257.5 94.4 5.6
Foreigners, total 509.6 2 753.6 3 263.2 15.6 84.4
Immigrants, total1 – 4 308.5 4 308.5 – 100.0
Total 52 652.4 5 868.2 58 520.7 90.0 10.0
{

Trends in International Migration
166
© OECD 2001
Mixed marriages
In 1998, the total number of marriages increased in France, to 280 000, but the share of mixed marriagesalso grew, rising from 8.7% in 1997 to 9.6% in 1998 (see Table III.13). Marriages in which both the man andwoman were foreign only accounted for just over 2% of mixed marriages. Of the remaining mixed marriages,some 45% were between a foreign woman and a French man and 55% between a French woman and a foreignman. The breakdown of mixed marriages by nationality reflects the trends of migration flows, the first-rankingnationality being Algerians, followed by Moroccans, Portuguese, Africans other than from North Africa,Tunisians and Spaniards.
Foreign births
In 1998, 768 600 births were recorded in France. Some 32 100 of these were to mixed couples and42 800 to foreign parents, which means that for roughly 17% of legitimate births at least one parent was foreign.The contribution of foreigners to total births can be calculated by adding the number of births in which bothparents were foreign to half of the births in which one parent was foreign. This shows that the foreign contribu-tion to the legitimate birth rate was approximately 13%.
Naturalisations
The number of foreigners who acquire French nationality has been rising steadily since the beginning ofthe 1990s. There were some 600 000 during the inter-censual period between 1990 and 1999. If a comparison ismade with the 1990 census, total annual acquisitions rose from 90 000 in 1990 to some 145 000 in 1999(see Table III.13). These figures include naturalisations by decree, acquisitions by declaration (marriage to aFrench spouse, minors between the ages of 13 and 18 born in France of foreign parents) and acquisitionsgranted automatically to anyone born in France when they attain their majority, if they have resided there forat least 5 years since the age of 11.
In 1999, 136 400 acquisitions of French nationality were approved, 67 600 of which were by decree and68 900 by declaration. Acquisitions granted automatically to French-born foreign children when they reachtheir majority are not recorded and are estimated at between 9 000 and 11 000. This means that total acquisi-tions were 20% up on 1998.
Slightly over 18% of acquisitions recorded (not including the estimated automatic acquisitions that are notrecorded) were granted to Europeans, 19% to Asians and nearly 60% to Africans (49% from the Maghreb). Theshare of Europeans is declining and that of African nationals rising. Ultimately, five nationalities account fortwo-thirds of acquisitions of nationality by decree or declaration: Moroccans (28%), Algerians (11.5%), Tunisians(9%), Portuguese (10%) and Turks (8%).
Schooling of migrants’ children
Enrolments of foreign children in primary and secondary schools have been falling since the early 1990s.At the beginning of the 1999-2000 academic year, 650 000 foreign children were enrolled, compared with690 000 in 1998-99, accounting respectively for 5.5% and 5.8% of total primary and secondary enrolments inFrance. Some 60% of these foreign pupils are from North Africa and sub-Saharan Africa and 11% are Turkish.Slightly more than half of these foreign pupils were enrolled in primary school, and the rest in secondaryschool.
In nursery schools, the children of foreigners are over-represented in priority education zones (ZEPs),accounting on average for 7% of nursery school enrolments, but 21% of enrolments in schools that are classifiedas ZEPs and only 5% in schools that are not. This over-representation can be explained by a mechanical effectstemming from the fact that one of the criteria used to classify schools as ZEPs is the share of foreign childrenenrolled.
At the secondary level, foreign children are under-represented in general and technical education and over-represented in vocational education. However, this may be due to an effect of selection linked to the parents’ socialcategory. Sociological studies show that the academic performance of foreign children is no different from that of

France
167
© OECD 2001
French pupils from the same social background. Foreign pupils are also over-represented in special education(where they account for more than 10% of enrolments), but this share has been diminishing since the early 1990s.
3. Migration and the labour market
Migration for employment and work permits
The foreigners who enter the labour market each year do so both directly (immigrants who enteredFrance with a work permit) and indirectly (i.e. immigrants who entered France with “economically inactive” sta-tus and later joined the labour force). The number of work permits issued only measures the first flow. How-ever, the latter is obviously the larger of the two, and it is estimated that three-quarters of foreigners enteringthe labour market do so indirectly.
In 1999, some 5 600 foreigners from EEA countries entered France with a work permit. Some 30% of themwere Portuguese, 15% Italian and 15% UK nationals. Two-thirds of these workers, who were generally skilled,worked in the tertiary sector, 20% in construction and public works and 10% in industry. In this respect, the Por-tuguese are atypical among EEA nationals as they account for 56% of unskilled workers, some 60% of domesticservice workers and 80% of those working in construction and public works and agriculture.
The remaining work permits (10 900) were issued to nationals of other countries, including 4 660 peoplewho had obtained refugee status. The other permits were granted to 5 330 wage-earners and 960 self-employed workers. Most of these people were employed in the tertiary sector (80%), only 16% in industry and2% in construction and public works. The average level of qualifications of these workers is rising, in particularbecause of the recruitment of managers and computer engineers.
Labour market integration
Foreign labour force
According to the March 2000 Labour Force Survey (INSEE), out of 2.84 million foreigners above the age of15, 1.58 million were economically active, which corresponds to an overall participation rate of 55% for foreign-ers (see Table III.13). Some 1.25 million of these economically active foreigners hold a job and 1.13 million arewage-earners. Thus, foreigners account for 6% of the labour force in France and 5.3% of the employed labourforce. Some 330 000 foreigners are job-seekers, which corresponds to an unemployment rate of 21%. Nearly90% of foreigners are wage-earners. The foreign labour force has benefited somewhat from the improved eco-nomic and labour market situation, and between March 1999 and March 2000, the number of foreign wage-earners rose by 22 000.
Breakdown of wage-earners by sector and industry
Analysis of the share of foreign wage-earners working in the major sectors of the economy shows that theyare over-represented in some sectors, such as construction (15.1%) and agriculture (9.4%), compared to anaverage of 5.4%. On the other hand, foreign wage-earners are under-represented in the industrial and tertiarysectors. This pattern is changing very little, except for a slight drop in the share of foreigners in industry and arise in the number employed in the tertiary sector. Some 712 000 foreigners are employed in the tertiary sec-tor (63% of all foreign wage-earners).
The proportion of women among foreign wage-earners is 37%, but this average rate conceals strong dis-parities across industries. It is much lower in the automobile, energy and construction industries (under 10%),but higher (over 50%) in the consumer goods industries, real estate activities, education, health care, socialwork and administration.
Unemployment of foreigners
Since March 1997, the number of unemployed has fallen significantly in France (down 14%between 1999 and 2000). The employment situation has also improved for foreign workers, but unemploymenthas declined less rapidly, dropping by 10% for all foreigners and by 11% for non-EU foreigners. As a result, the

Trends in International Migration
168
© OECD 2001
share of foreigners in total unemployment has risen, with foreigners accounting for 12.5% of the jobless (0.5 ofa percentage point higher than in previous years). In other words, the overall unemployment rate of foreignersis falling, but the differential with the unemployment rate of nationals is widening (9.4% for nationals and20.8% for foreigners in 2000).
Although foreigners from EEA countries have an unemployment rate close to that of nationals, the unem-ployment rate of foreigners from other countries is 27.7%. Women are over-represented among non-EU job-less, with an unemployment rate of 35.5%, compared to 23.6% for men. Similarly, although unemploymentamong young foreigners is down, it still remains very high.
4. Policy developments
A provisional assessment of the regularisation programme
As the review procedure launched in June 1997 is nearly complete, a provisional assessment can now bemade. In all, since 1997, 75 600 foreigners have been regularised under this procedure: just under20 000 in 1997, over 50 700 in 1998 and some 6 000 in 1999. Of the 5 900 applications approved in 1999,2 550 were classified as entries on family reunion grounds and 3 300 were recorded separately.
Three-quarters of the people regularised came from Africa (some 55 000), including 30 000 from sub-Saharan Africa and rather less than 25 000 from the Maghreb. The remaining one-fourth were from Asia (20%)and Europe (5%). The breakdown by nationality was highly concentrated, four nationalities accounting for 45%of regularisations: 12 000 Algerians, 8 800 Moroccans, 7 500 Chinese and 5 900 nationals of the former Zaire.
In accordance with the criteria laid down in the regularisation procedure, greater importance is beinggiven to family ties, 78% of cases involving family reunion. Nevertheless, of the total number of applications,43 000 were classified in the “wage-earner” category.
Signature of a bilateral Franco-Algerian agreement on the status of Algerians in France
On 11 July 2001, the French and Algerian Governments signed an agreement on the status of Algerians inFrance aimed at bringing it in line with the status of other foreigners. This agreement is a protocol tothe 1968 Franco-Algerian Agreement defining the conditions for the movement, employment and residence ofAlgerian nationals and their families. This protocol is aimed at extending the benefits of ordinary law to Algerians,since, due to various changes in the legislation, particularly in the Act of 1998, Algerians were governed by anagreement that was on the whole less favourable than the ordinary law applying to other foreigners. Thisagreement will only enter into force after it has been ratified by the parliaments of both countries.
This new agreement between France and Algeria should make it possible to consolidate from a legal andsocial standpoint the families of Algerians established in France, who constitute the third largest foreign com-munity (471 000). The main changes concern family reunion, the status of retired persons, work by studentsand regularisation.
Under this agreement, the Algerian ascendants of French children will be eligible for the “private andfamily life” card entitling them to a ten-year residence card after one year. This will put an end to the paradox-ical situation in which the parents of French children could neither be deported nor regularised. Spouses ofFrench nationals will be able to obtain the right of residence even if they entered France with a short-stay visa;previously they were required to return to Algeria to obtain a long-stay visa before they could obtain the right ofresidence. In line with the legislation in force for other countries, polygamy will now be prohibited in familyreunion cases, and family reunion will only be allowed after one year of residence (until now, there was no wait-ing period). The only specific family provision maintained for Algerians is that family reunion is still allowed forchildren adopted under the “kefala” regime, which is not authorised for other nationals of the Maghreb.
As regards pensioners, previously Algerians were not eligible for the residence permit provided for underthe 1998 Réséda Act, which allows pensioners to return to their country and live there without losing the rightto return to France. The new agreement entitles them to this pensioner’s card. Lastly, Algerian students inFrance, who previously were able to work on a part-time basis without authorisation, must now apply to theadministration as required under the general regime.

Germany
169
© OECD 2001
Germany
Introduction
Migration flows into Germany have increased since the opening up of the frontiers in Eastern Europe, withseveral hundred thousand people coming into the country every year, despite unfavourable economic trends.Between 1998 and 2000, growth was once again buoyant (3% in 2000) and unemployment fell to 7.8%, as aresult of which inflows of foreigners have again risen and Germany’s migration balance is once again positive.
The German Government considers the integration of foreigners resident in Germany and measures tocombat xenophobia to be priority issues. In 1999, the Nationality Act was amended with these objectives inview, the aim being to facilitate the naturalisation of foreigners resident in Germany for a long time. Lastly,Germany is currently considering amending the legislation on foreigners entering and staying in the country,so as to adapt immigration flows to the requirements of the German economy.
1. Trends in migration movements
Inflows and outflows of foreigners
In 1999, there were 674 000 recorded entries, which was 11% up on 1998 (see Table III.15) and marked theend of a decline in inflows that had been in progress since 1992 (over 1 million entries). In contrast, the num-ber of departures from Germany fell by 13%, to 556 000, resulting in a positive migration balance. This followednegative balances in 1997 and 1998, when the number of departures exceeded that of inflows, whereas fromthe mid-1980s to 1992 the migration balance had risen uninterruptedly, reaching over 600 000 in 1992.
Of the inflows recorded in 1999, it was nationals of the former Federal Republic of Yugoslavia (particularlyKosovo) who formed the biggest immigrant group, followed by Poles. Some of the inflows were accounted for
GERMANY
Box III.4. The 1999 census
The Decree of 29.12.1999 approved the results of the census of 8 March 1999 and authorised their initial use.In 1999, the population of France stood at 60.2 million, with 1.68 million in the four overseas départements and58.52 million in metropolitan France. This represents a total increase of 2.1 million on the 1990 census. Analysis ofthe results by nationality and place of birth makes it possible to determine both the number of foreigners andthe number of immigrants in metropolitan France, the definition of foreigner being based on the criterion ofnationality and immigrant on the place of birth and migration. In the strict sense, immigrants are foreigners bornoutside France who have emigrated in order to settle in France.
At the time of the 1999 census, there were 3.26 million foreigners in France, or 5.6 of the metropolitan popu-lation. This shows that the decline in the foreign population that began in 1990 has continued (down by 9%). Thenumber of immigrants (obtained by correlating place of birth and nationality) was greater than the number of for-eigners: 4.31 million, which represented 7.3% of the metropolitan population. The difference between the numberof “foreigners” and “immigrants” can be explained by the fact that many immigrants acquire French citizenship (atleast 1.55 million became French nationals by acquisition) and are therefore no longer counted as foreigners, andby the fact that a number of foreigners are born in France (0.51 million) and are therefore not immigrants.
Lastly, the census shows that 10% of the metropolitan population was born outside France. Of this 10%, some27% are French nationals born abroad, 26.5% are naturalised French citizens and 46.9% are foreigners. Two-thirdsof those who had acquired French nationality were born outside France. Four-fifths of foreigners were born out-side France.

Trends in International Migration
170
© OECD 2001
Table III.15. Current figures on the components of total population change, on migration flows and stocks of foreign population and labour force, Germany
All figures in thousands unless otherwise indicated
1996 1997 1998 1999
Components of population changesTotal population (Total change) 195.4 45.4 –20.3 126.4
Natural increase –86.8 –48.2 –67.3 –75.6Net migration 282.2 93.7 47.1 202.0
Germans (Total change)1 256.5 252.4 218.2 175.4Natural increase –179.7 –141.7 –153.6 –156.5Net migration 133.3 115.4 80.6 83.7Acquisition of German nationality 302.8 278.7 291.3 248.2
Foreigners (Total change) –61.1 –207.0 –238.5 –49.1Natural increase 92.8 93.5 86.3 80.9Net migration 148.9 –21.8 –33.5 118.2Acquisition of German nationality –302.8 –278.7 –291.3 –248.2
Migration of foreigners2
Inflows by nationality (Top 5 in 1999) 708.0 615.3 605.5 673.9of which:
Federal Rep. of Yugoslavia 42.9 31.2 59.9 87.8Poland 77.4 71.2 66.1 72.2Turkey 73.2 56.0 48.0 47.1Italy 45.8 39.0 35.6 34.9Russian Federation 31.9 24.8 21.3 27.8
Net migration by nationality (Top 5 in 1999) 148.9 –21.8 –33.5 118.2of which:
Federal Rep. of Yugoslavia 8.6 –13.3 14.8 39.5Russian Federation 19.3 13.6 11.0 17.7Poland 5.7 1.0 5.4 13.6Turkey 29.7 10.0 2.8 6.2Romania 0.4 –2.4 0.4 2.2
Inflows of ethnic Germans from:Central and Eastern Europe 177.8 134.4 103.1 104.9of which:
Former USSR 172.2 131.9 101.6 103.6Romania 4.3 1.8 1.0 0.9Poland 1.2 0.7 0.5 0.4
Inflows of asylum seekers 116.4 104.4 98.6 95.1of which:
Former Yugoslavia 18.1 14.8 35.0 33.7Turkey 23.8 16.8 11.8 9.1Iraq 10.8 14.1 7.4 8.7Afghanistan 5.7 4.7 3.8 4.5
Stock of foreign population by duration of stay(31 December of the year indicated)2 7 314.0 7 365.8 7 319.6 7 343.6Less than one year (%) 5.6 5.2 5.2 5.61 year to less than 4 years (%) 18.2 15.8 14.8 13.94 to less than 8 years (%) 22.0 22.9 21.0 19.58 to less than 10 years (%) 5.7 6.9 8.1 8.810 to less than 20 years (%) .. 19.2 19.9 20.220 years and more .. 30.0 31.1 31.9Total (%) 100.0 100.0 100.0 100.0
Issuance of work permits for a first employment3 440.0 451.0 402.6 433.7of which:
Asylum seekers 21.3 24.8 .. ..Contract workers 54.5 54.8 .. ..
By duration of stay in GermanyNewly entered 262.5 285.4 275.5 ..0f which: Polish workers 180.8 205.6 .. ..Not newly entered 177.5 165.6 127.0 ..
By kind of permit4 ..General permit 346.3 352.4 .. ..Special permit 93.4 98.5 .. ..

Germany
171
© OECD 2001
by ethnic Germans (Aussiedler) from the Eastern European countries. Since 1997, however, the number of immi-grants of German origin has fallen sharply from the levels of the early 1990s. In 1999, the figure for returningGermans was 105 000, mainly from the former Soviet Union.
Illegal immigration
There are no overall estimates for illegal entries. The only data available concern the number of foreign-ers arrested at the frontier, who, having been on the increase, seem to have fallen in 1999 (37 800) and 2000(31 500). The bulk of them are Romanians, Afghans, nationals of the former Yugoslavia, Moldavians, Iraqis,Indians and Turks.
Refugees and asylum seekers
The change in the legislation concerning the right of asylum (amendment to the Basic Law, enacted1 July 1993), making entry conditions more restrictive, resulted in a very sharp reduction in the number of for-eigners co ming into the cou ntry as asylum seekers since 1992. In the space of a few years ,between 1992 and 1995, inflows fell from over 400 000 to 95 000 (see Table III.15). The rate of recognition of
Table III.15. Current figures on the components of total population change, on migration flows and stocks of foreign population and labour force, Germany (cont.)
All figures in thousands unless otherwise indicated
Note: The data cover Germany as a whole, unless otherwise indicated. Data for Former Yugoslavia cover Montenegro and Serbia.1. Figures include ethnic Germans whose German origin has been recognised.2. Data are from population registers.3. Citizens of EU Member States are not included.4. A general permit is only granted if no domestic worker is available. This is not the case for the issuance of a special permit. Activity of holders of a special
work permit is not restrictive.5. Contract workers are recruited under bilateral agreements. Quotas by country of origin are revised annually.6. Seasonal workers are recruited under bilateral agreements and they are allowed to work 3 months per year.Sources: Bundesanstalt für Arbeit; Statistiches Bundesamt.
1996 1997 1998 1999
Stock of foreign workers (microcensuses) – Top 5 nationalitiesTurkey .. 1 039 .. 1 008Italy .. 375 .. 386Greece .. 214 .. 219Croatia .. 215 .. 189Austria .. 123 .. 118Others .. 1 609 .. 1 625Total .. 3 575 .. 3 545
Contract workers (annual average)5 45.8 38.5 33.0 40.0of which :
Poland 24.4 21.1 16.9 18.2Hungary 9.0 5.8 5.0 6.4Romania – 1.0 2.6 3.9Croatia 4.4 3.6 2.8 3.9Czech Republic 1.9 1.4 1.1 1.4
Seasonal workers by nationality6 220.9 226.0 201.6 223.4of which :
Poland 196.3 202.2 182.0 199.4Slovak Republic 6.3 6.4 4.9 6.0Croatia 5.7 5.8 3.9 3.4Romania 5.0 5.0 5.6 7.1Hungary 3.5 3.6 2.8 3.3
Unemployment (national definition)Total number of unemployed workers (Germany as a whole) 3 965.1 4 384.5 4 279.3 4 099.2Total number of unemployed workers (western Germany) 2 796.2 3 020.9 2 904.3 2 755.5
Unemployment rate (%) (western Germany) 10.1 11.0 10.5 8.8Total number of foreign unemployed workers (western Germany) 496.0 521.6 505.2 477.7
Foreigners’ unemployment rate (%) (western Germany) 18.9 20.4 19.6 18.4

Trends in International Migration
172
© OECD 2001
refugee status remains very low, only 6 150 people being granted refugee status in 1999, i.e. 3% of all appli-cants (4% in 1998).
The share of applicants of European origin fell from 72% in 1993 to 40% in 1997, but has stabilised at a lit-tle over 50% since 1998. Some 37% of applicants come from Asia and 10% from Africa.
2. Structure and trends in the foreign population
Numerical trends
Like inflows, the stock of foreigners resident in Germany stabilised in the late 1990s. In 1999,7 344 000 foreigners were resident in Germany (+0.3%) (see Table III.15), meaning that the number of foreign-ers has remained stable since 1997 after increasing very appreciably from the mid-1980s (when 4.5 million for-eigners were resident in Germany). Foreigners accounted for 8.9% of the total population in 1999.
The biggest foreign community is made up of Turks (28%), followed by nationals of the former Yugoslavia(10%), Italians (8.4%), Greeks (5%) and Poles (4%). More than half of all foreigners are men. Compared to 1998,the share of ex-Yugoslavia nationals has decreased steeply with the departure of large numbers of nationals ofBosnia Herzegovina. All told, one-quarter of all foreigners are nationals of European Union countries.
Analysis of the length of stay in Germany shows that immigrants settle on a lasting basis and that naturali-sation rules were very strict prior to the 1999 reform. In 1999, nearly one-third of foreigners had been residentin Germany for over 20 years and 20% had been there for between 10 and 20 years. Of the foreigners who hadbeen in the country for more than 10 years, 40% were Turks, 12% Italians and 9% nationals of the former Yugo-slavia (see Chart III.7).
Chart III.7. Foreigners in Germany by country of origin and length of stay, 1999Thousands
1. France, United Kingdom, Austria, the Netherlands, Spain and Portugal.Source: Federal Statistical Office.
900
800
700
600
500
400
300
200
100
0
900
800
700
600
500
400
300
200
100
0
1 321.9
More than10 years Less than 10 years
Turkey EU: maincountriesof origin1
Italy Fed. Rep.of Yugoslavia
Greece Croatia Poland BosniaHerzegovina
Romania RussianFederation
900
800
700
600
500
400
300
200
100
0
900
800
700
600
500
400
300
200
100
0
1 321.9
More than10 years Less than 10 years
Turkey EU: maincountriesof origin1
Italy Fed. Rep.of Yugoslavia
Greece Croatia Poland BosniaHerzegovina
Romania RussianFederation
900
800
700
600
500
400
300
200
100
0
900
800
700
600
500
400
300
200
100
0
1 321.9
More than10 years Less than 10 years
Turkey EU: maincountriesof origin1
Italy Fed. Rep.of Yugoslavia
Greece Croatia Poland BosniaHerzegovina
Romania RussianFederation

Germany
173
© OECD 2001
German reunification has done little to change the regions where immigrants are resident. Only 3% of for-eigners live in the new Länder. The average share of foreigners in the German population (9%) does not reflecttheir real presence, which varies appreciably from one Land to another: 19% of the inhabitants of the Land ofHamburg are foreigners, while in Hesse or Berlin, the figure is about 14%. In contrast, the foreign population isno more than 2% in the eastern Länder.
Of the total number of foreigners resident in Germany on 31 December 1999, 1.24 million were refugeesand asylum seekers. From the various sources of information available, it is possible to determine that185 000 of these people entered Germany as refugees and 130 000 as accompanying family members. Some44 000 are people whose protection Germany guarantees because of the persecution they suffer on thegrounds of race, religion or belonging to a minority in their country of origin. Approximately 9 500 are admittedas humanitarian refugees. In addition, 120 500 are Jews from the former Soviet Union and 13 500 are displacedpersons. Lastly, 264 000 of them are asylum seekers waiting for the question of their status to be settled and50 000 are refugees from Bosnia Herzegovina. The remaining third (423 000) are made up of de facto refugeeswho have not filed asylum applications or whose applications have been turned down but who, for humanitar-ian and political reasons, cannot envisage returning to their own countries. These numbers reflect the scale ofthe flows of refugees and asylum seekers who have entered Germany since the mid 1980s.
Foreign birth
In 1998, 430 700 marriages were celebrated in Germany, which was slightly more than in 1997 (+2%). Ofthese, some 14% were between German and foreign nationals.
Mixed marriages
Foreigners continue to contribute substantially to the birth rate in Germany. Of 770 800 births registeredin 1999, 12.4% were to foreigners. That share, which is bigger than the share of foreigners in the total popula-tion, reflects the fact that the structure of the foreign population is younger and the birth rate higher, on aver-age. Compared to 1998, the share is down two percentage points, after rising steadily since the mid-1980s.Almost 80% of foreign children born in 1999 were Turks or nationals of former Yugoslavia (40% in the case ofeach of the two communities). Italian children account for 6% of births, followed by Greek and Portuguese chil-dren (3.5 and 1.4% respectively).
Naturalisations
The amendment to the Nationality Code voted in July 1999 came into force on 1 January 2000. The aim isto make it easier for foreigners who have been resident in Germany for a long time, and also their families, toobtain German nationality by introducing a right based in part on jus soli. Since 1997, there has been a steadyand appreciable increase in the number of naturalisations of people not of ethnic German origin, the rate ofincrease being some 30% per year. According to the estimates produced by the Federal Statistical Office, thenumber of naturalisations rose between 1997 and 2000 from 82 900 to over 186 000. Some 39% of naturalisationapplications were based on the change to the minimum length of residence, which went to 8 years in 1999(Article 85 of the Law on Foreigners), and 26% on the right to nationality (1999 Nationality Act) granted to chil-dren of foreigners born in Germany and aged under 10. Of these naturalisations in 2000, 44% were of Turkishorigin, 7.7% were Iranian nationals and 5.2% were from the former Yugoslavia.
Schooling of migrant’s children
In 1999, the share of foreign children in the total number of school childrenwas some 10% and their schoolresults appear to be improving over the years. In the 1980s, for example, approximately 30% of foreign chil-dren left education with no sort of diploma, whereas that percentage is down to just 17% nowadays (comparedto only 9% for German children). Despite this difference in school performance between foreign and Germanchildren, which may be explained by socio-economic factors, the trend in the said indicator is an encouragingsign that integration is being achieved through schooling, even if more sophisticated analysis would beneeded to confirm that finding.

Trends in International Migration
174
© OECD 2001
3. Migration and the labour market
Migration for employment and work permits
Work permits granted
The number of work permits granted continued to fall in 1999, as has been the trend since 1995. In 1999,for example, 1 034 500 permits were granted, which was several thousand fewer than in 1998 (down 1.5%).Since the Act of 1 January 1998, however, several categories of foreigners have been exempted and are there-fore no longer included in the relevant data. This is the case, for example, of nationals of the European Unioncountries and the European Economic Area, as it is for people with indefinite residence permits. All in all,3.6 million foreigners are exempt from the obligation to have a work permit in order to enter the labour mar-ket. Of the permits granted in 1999, the majority were “ordinary permits” (86.5%) – i.e. subject to the rule ofprior entitlement for German or foreign workers with comparable status – and are valid only for a specificactivity. The remaining were “special permits”, which give unrestricted access to the labour market and aregranted especially to Turkish nationals under agreements signed between Turkey and the European Union.More than 90% of permits issued in 1999 were for jobs located in the western Länder.
Contract workers, guest workers, seasonal workers and border workers
Along with other European countries, Germany ended the immigration of foreign workers in 1973. Despitethis, co-operation agreements between countries allow a certain number of workers to enter the country for alimited period, either for seasonal work or for work within the framework of co-operation agreements designedto train foreign workers.
Thus, countries such as Poland, the Czech Republic, the Slovak Republic, Hungary, Bulgaria, Slovenia,Croatia, Bosnia Herzegovina, the former Yugoslav Republic of Macedonia, Latvia and Turkey have signedagreements with Germany allowing German firms to take on contract labour (at the same time complying withcollective agreements and German labour law). In 1999, 40 000 contract workers were hired in Germany.
Apart from the above type of agreement, there is also the possibility of obtaining “guest worker” status,whereby foreigners can obtain employment for 12 to 18 months with the object of upgrading their skills, learn-ing German and, conceivably, setting up their own businesses in their country of origin. Such contracts are con-fined to people aged between 18 and 40, while the countries concerned are those of Central and EasternEurope. In 1999, 3 700 young foreign workers took advantage of this type of employment.
Since 1991, seasonal work has also been authorised (for a maximum of three months per year) for certainnationals of Central and Eastern European countries with which agreements have been signed. After fallingslightly in 1998, the number of seasonal workers moved back to the 1997 level, Germany registering223 400 seasonal workers in 1999 (see Table III.15) The majority are Polish (89%), the remainder coming fromRomania, the Slovak Republic, Hungary, Croatia and Bulgaria. Seasonal work permits for foreigners are onlyissued as long as working conditions and pay are the same as for German nationals (to avoid any dumping).The sectors concerned are those in which there are big seasonal fluctuations in demand for labour: hotels andcatering, agriculture and forestry.
Lastly, seasonal work is authorised for Czechs and Poles under certain conditions, namely they mustremain resident outside Germany and must return home at least five nights per week.
“Green card” holders
In 2000, to remedy the shortage of labour in certain sectors such as new information and communicationtechnologies and data processing, the government introduced a new work permit – the “green card” – which isreserved for computer specialists not from European Union countries. To be accepted, candidates have toprove that they have very sound computer skills or that their starting salaries were very high (overDM 100 000 per year). The visa is issued very quickly (less than eight days after the application was filed),thanks to simplified administrative procedures. Annual quotas are laid down for every nationality.
As it transpires, the number of “green card” applicants and recipients is much smaller than was initiallyplanned. Between August 2000 and February 2001, slightly over 5 000 “green cards” were issued, of the

Germany
175
© OECD 2001
20 000 initially planned. The biggest contingents come from India, the former Soviet Union and Romania. Themajority are men (88%). Over half of the jobs occupied are in small and medium-sized firms (less than100 employees). The “green card’s” limited success may be attributed to linguistic problems and the limitedduration of the permit (5 years).
Labour market integration
The labour market situation improved in 1999 and 2000, employment rising by 1.1% and unemploymentsettling at 7.8% in 2000, though it still stands at 17.4% in the new Länder. There also appear to be sectorallabour shortages, and these cyclical shifts have had an impact on the employment of foreigners.
Characteristics of the employment of foreign labour
In 1999, the share of foreign labour stood at 8.9% of total labour in the western Länder and less than 1% inthe eastern Länder. In all, 1 988 114 foreigners were affiliated to the Social Security, which was more thanin 1998 (adjusted data). Although on the increase, the share of foreign women in foreign employment remainsrelatively small (34%).
The nationality breakdown of workers affiliated to the Social Security matches that of foreigners in thetotal population, approximately 29% being Turks, 16.4% nationals of the former Yugoslavia and 10% Italians.Some 32% were from European Union countries.
The biggest concentration of foreign workers is in agriculture (13.5%), construction (11.1%), manufacturing(10.6%) and “miscellaneous services” (10.1%). In other areas of activity, such as mining and energy, retailing, insur-ance and local government, non-profit organisations and domestic services, foreigners are under-represented.
Lastly, self-employment among foreigners is increasing, with some 263 000 people involved in 1999, towhom may be added 23 000 family workers – this according to an annual micro-census.
Unemployment of foreigners
The fall in unemployment also concerns foreigners, amongst whom the overall unemployment rate hasdeclined, standing at 18.4% in 1999 against 20.4% in 1997 (see Table III.15). Between 1998 and 1999, the num-ber of jobless foreigners fell by 4.6%, yet this appreciable decline must not be allowed to hide the fact that thesteep rise in foreign unemployment that began in the early 1990s has by no means been halted. Thus, unem-ployment among the foreign population rose from 10.7% in 1991 to over 20% in 1997, unemployment amongnationals increasing by less than 4 points over the same period. Taking the whole of the 1990s, the unemploy-ment differential between foreigners and nationals therefore widened and foreigners became even more vul-nerable than nationals to unemployment. That said, the average duration of unemployment is slightly shorteramong foreigners than among nationals (13.5 and 14.7 months, respectively)
Unemployment varies according to nationality. While unemployment is above average among Turks,Greeks and Italians (23.3, 17.6 and 18.4%, respectively), it is well below average among nationals of the formerYugoslavia, the Spanish and the Portuguese (12.6, 12.2 and 13.6%, respectively).
There are a number of reasons for the unemployment differential between foreigners and nationals. Apartfrom any discrimination with regard to foreigners, which is hard to measure, there are structural factors relatingto skills and demographic characteristics that can also intervene. The fact is that foreigners are, on average,less skilled than their German counterparts and are also younger.
4. Policy developments
Admission and residence (including integration measures)
Integration policy
The government attaches great importance to integration policy which attracts substantial budget fund-ing. The prime targets of integration policy are foreign workers with permanent resident status and the mem-bers of their families. The integration policy conducted by the Ministry of Labour and Social Affairs isdesigned to improve communication between government departments with regard to foreigners’ welfare
Trends in International Migration
176
© OECD 2001
entitlements, vocational training and the understanding of foreign languages. This prompted the introduction,for various countries, of a binational programme of courses for young foreigners living in Germany. Anotherpart of the integration programme targets foreign women (German language courses, information about train-ing facilities, etc.), and over 300 000 women have attended language courses since 1985. The final strand ofintegration policy concerns the measures taken to combat racism and xenophobia and improve everyday rela-tions between foreigners and nationals.
Draft framework law on immigration
In September 2000, the Ministry of the Interior set up a cross-party committee with the task of makingproposals regarding the legislative framework surrounding immigration and bringing it into line with the needsof the German economy. The project (the Süssmuth Report) was submitted in July 2001 and contains propos-als which could give rise to a new law on immigration in 2002. The proposals concern, on one hand, immigra-tion by foreign workers, which would be facilitated in the case of skilled workers with good knowledge ofGerman (points system) and whose skills match the needs of the German economy – as assessed by a futureFederal Office. Such workers would be awarded a permanent residence permit. In the case of asylum seekers,on the other hand, admission could be limited initially to three months and family reunion confined to chil-dren aged under 12. There is nothing definitive about these proposals for the time being, but they do givesome idea of the new thrust of migration policy in Germany.
Combating illegal immigration
In addition to stepping up border controls, the measures being taken to combat illegal immigration are oftwo sorts. On the one hand, the authorities are particularly anxious to crack down on trafficking of humanbeings. On the other, they are seeking to sign readmission agreements with the countries most concerned byillegal immigration – agreements which would oblige them to readmit people who had entered Germany ille-gally, once their nationality had been established beyond doubt.
Greece
Introduction
In 2001, Greece joined the Euro area. The economic adjustments under way for several years with a viewto membership have reduced public debt and inflation, with the result that Greece’s growth rate of 4.1%in 2000 was above the European Union average (3.3%). The situation on the labour market is still giving causefor concern, however, with an unemployment rate at 10.8%, one point above the EU average and particularlyhigh for some categories of workers (women and young people). This makes integration precarious for manyforeign immigrants or Greek “repatriates”.
Greece is now confirming its status as an immigration country, whereas emigration had long been the pre-dominant trend. The foreign population, including illegal immigrants, is thought to account for between 7.5%and 9.5% of the total population. However, the shortcomings of the reporting system, currently being over-hauled, make estimates difficult.
1. Trends in migration movements
Emigration and returning nationals
The Greek statistical system ceased collecting data on emigration in 1977. Information has therefore to beobtained from the records of recipient countries. However, Greek emigration flows have declined sharply overthe past two decades and only a few of the host countries traditionally preferred by Greek emigrants provide
GREECE

Greece
177
© OECD 2001
significant statistics. Exceptionally, the 1999 data for the United States are unavailable, but the figuresfor 1987-97 show that Greek entry flows are clearly in decline (down 60%) and amount to only around one thou-sand people (down from 2 650 in 1987 to 1 050 in 1997). In 1999, 364 354 Greeks were living in Germany. Entryflows have levelled out at under 20 000 since the early 1990s and are slightly up on 1998 (9%). Net migrationwith Germany stands at around –1 820, meaning that more Greeks are leaving than entering Germany.
Arrival of Greek Pontians
Since the late 1980s, Greece has seen an influx of ethnic Greeks from the region of Pontos but resident inthe Commonwealth of Independent States (Greek Pontians). In 1999, the number of Greeks “returning” fromthe former USSR fell again and the decline continued in 2000. In 1999 just over 4 400 ethnic Greeks returned toGreece, compared with 25 500 in 1993. Of these, it is hard to determine exactly how many were Greek Pon-tians.
The majority of immigrants since the mid-1980s have come from Georgia (52%), Kazakhstan (20%), Russia(15%) and Armenia (6%). Most have settled in the regions of Thrace and Macedonia.
Inflows and outflows of foreigners
As the statistical system is being overhauled, no data are available for 1999 on new residence permits. In 1998,some 74 600 permits were issued, for a foreign population of 309 400. However, the statistics were affected bythe 1998 regularisation programme, which attracted 370 000 applications. In February 2000, 212 000 “whitecard” holders proceeded to the second stage of the programme and applied for a “green card” entitling themto work and apply for the renewal of their residence permits under certain conditions. By September 2000,147 800 people had obtained a “green card” (compared with 57 400 by the end of September 1999).
Of those 147 800 “green card” holders, 43% were living in the Athens region, 17% in the Peloponnese, 15%in Macedonia, 11% in Thessaly and 8% in Crete (see Table III.16). The regularisation process is still under way,and 240 000 “white card” holders are awaiting decisions regarding their “green card” applications.
Refugees and asylum seekers
After a decline in the number of refugees and asylum seekers since 1997, entries in 2000 were 40% upon 1999. In spite of a marked decline in their number, Iraqis still headed the list of asylum seekers in 2000(38%), followed by Turks (23%), Afghans (15%) and Pakistanis (5%).
The refusal rate is still very high. In 1999 and 2000, respectively 146 and 169 people were granted the sta-tus of political refugee, meaning that over 90% were turned down. A further 106 applicants were granted the
Table III.16. Regularisation programme of immigrants in an irregular situation, 2000, Greece
Issuances of "green cards" by region in thousands
Note: The regularisation programme occurred in two stages: first, illegal immigrants had to ask for a temporary"white card" before the end of May 1998. When they had obtained this document, they could apply for a"green card" (valid for 3 years). Data are still provisional.
Source: Ministry of Labour and Social Insurance.
30 September 2000
Attica and Islands 63.1Peloponnesos 25.6Ipeiros 5.1Macedonia 22.5Thrace 3.1Crete 12.3Thessalia 16.1Total 147.8

Trends in International Migration
178
© OECD 2001
status of humanitarian refugee in 2000 (compared with 407 in 1999). Since 1980, Greece has awarded political-refugee status to a total of 6 460 asylum seekers, mainly Turks (36%), Poles (26%), Romanians (11%), Iraqis (7%)and Iranians (4%).
2. Structure and changes in the foreign population
Numerical trends
The foreign population officially present on Greek soil in 1998 was an estimated 309 400. This figure doesnot include those regularised under the 1998 procedure. Overall, it has been estimated that between800 000 and one million foreigners are living in Greece, around one-third of them illegally.
Naturalisations
Greek citizenship can be obtained in various ways. Foreigners who are not ethnic Greeks may obtain citi-zenship either by marrying a Greek national (once the marriage has produced children and provided the cou-ple reside in Greece), or by spending ten of the previous twelve years in Greece.
Another option is open to ethnic Greeks who live in the former Soviet Union or have entered Greece on atourist visa. They must submit proof of their Greek origins to the Greek Consulate if they live abroad, or to theregional General Secretariat if they live in Greece. While their case is being reviewed, they are given “SpecialIdentity Cards” authorising them and their spouse and children to live and work in Greece.
After an upsurge in the mid-1990s, the number of naturalisations has steadily declined since 1995 and thetrend continued in 1999 and 2000. In 1999, some 2 000 people were granted Greek citizenship, 21% downon 1998. By October 2000, the figure was only 924.
3. Migration and the labour market
Migration for employment and work permits
In 1999, only 19 000 foreigners held work permits, including some 5 000 EU citizens and 3 000 ethnicGreek immigrants. The majority of them were males (69%). In addition to these official permit-holders, thereare 150 000 “green card” holders on the labour market, largely in commerce and services. There are also some6 000 official refugees and a few thousand asylum seekers who have been legally authorised to worksince 1999. However, the available data underestimate the real number of foreign workers present on theGreek labour market.
Foreign permit-holders work in commerce, catering or the hotel industry (31%), “other services” (32%),transport (15%), construction (7%), industry (7%) and agriculture (5%). This last figure is definitely underesti-mated owing to the large number of illegal workers.
As for seasonal work, new bilateral agreements were signed in 1996 with Albania and in 1997 with Bul-garia, the aim being to give these workers legal status. In fact the agreements are seldom applied, one reasonbeing the large illegal workforce available. In August 2000 some 3 000 seasonal permits were granted to Alba-nians and 800 to Bulgarians.
Every two years, a list is made of foreigners and Greeks working on ships of over 100 tons under Greekownership and flying a Greek or foreign flag. From 1982 to 1998 there was a sharp fall in the total number ofsailors working on Greek-owned ships (down 36%), but the general decline reflects two contrasting trends andindicates that foreigners are replacing Greek sailors. On one hand, the number of Greek sailors has fallen byhalf while, on the other, the number of foreigners has risen by 8%. This is particularly noticeable on shipsunder foreign flags, where the number of foreign sailors rose by 96% over the period. Foreign sailors on shipsin Greece are mostly from the Philippines, India, Indonesia and Pakistan.
Greece
179
© OECD 2001
4. Policy developments
Admission and residence (including integration measures)
Framework Act on Immigration
The Greek Parliament is expected to pass a Framework Act drawn up in 2000. This should give rise to acomprehensive reform of the legislation on migration:
• Changing the legislative framework on non-EU immigration by redefining categories of migrants andentry requirements.
• Redefining the requirements for family reunion (residence, work by spouse or children) applicable toeach category of migrant.
• Defining the rights and obligations of foreign residents.
• Laying down penalties for breaching the laws on immigration, residence and work on Greek soil.
• Redefining the procedure for naturalisation and access to Greek citizenship.
• Decentralising some of the authority regarding foreigners to prefectures and municipal authorities.
Review of the legislation on family reunion
To facilitate the integration of migrants wishing to settle permanently in Greece, the authorities are focus-ing increasingly on the question of family reunion. Greek legislation on the subject is complex and specific toeach category of migrant:
• Family reunion is subject to relatively strict conditions regarding the spouse and children of “greencard” or “white card” holders. The 1998 Act protects the children and spouse of a cardholder from expul-sion while the card is valid, but family reunion is only possible for “green card” holders if they haveheld a residence permit for at least two of their previous five years in the country. Family reunion isthen subject to further conditions, including conjugal life prior to departure, valid papers and a mini-mum income.
• For asylum seekers who have obtained the status of humanitarian or political refugee, family reunion ispossible and the requirements are far less strict than for foreign workers (1999 Act). For humanitarianrefugees, work and residence permits are granted for one year to applicants and family members.
• Finally, ethnic Greek immigrants are not subject to any restrictions on family reunion, particularly lengthof stay. Family reunion can be immediate for ethnic Greek immigrants (1993 Act). For those with only atourist visa, applications must be submitted to the Regional Secretariat and depend on the parents giv-ing proof that they are of Greek origin.
Integration programmes for returning Greeks and foreign immigrants
Integration policy covers returning Greeks, ethnic Greek immigrants and foreigners alike. For returningand ethnic Greeks the programme launched in the early 1990s, leading to the establishment of a NationalFoundation for the Reception and Settlement of Repatriated Greeks to assist with housing and economic inte-gration, was deemed inadequate given the numbers involved. Consequently a new Act was passed in 2000 tostep up the scheme and provide more accommodation, vocational training and job opportunities, social andcultural integration and public-sector jobs. Subsidies have also been granted to host regions. However, thescheme has benefited only a few, 5 650 families, or 22 000 individuals, having received this assistancesince 1991.
Other initiatives for Greek emigrants seek to strengthen ties with host countries, particularly since returnmigration is on the decline. For instance, the government promotes Greek culture abroad by setting up cul-tural schemes and cultural centres in other countries, signing employment agreements, setting up Greekchambers of commerce abroad to strengthen economic ties with Greece, and providing assistance for Greekcitizens abroad.

Trends in International Migration
180
© OECD 2001
With regard to the integration of foreigners, the Greek Government has sought to improve informationand communication for and with foreign immigrants by publishing regional and national guides, for instance,and launching initiatives to inform foreign women, in particular, about their rights. In addition, the Greek radioservice, working closely with the BBC, broadcasts programmes in 12 languages for foreign residents in Greece.
Combating illegal immigration
As there is so much illegal immigration into Greece, particularly because of its extensive land and coastalborders, combating illegal entries is one of the leading aims of the Greek Government. In 1999 almost20 000 foreigners were expelled following administrative decisions, 8 000 more than in 1998. Almost two-thirdswere from the Balkans and most of them were men, except in the case of Russia, Ukraine, Kazakhstan andMoldavia, where women were the majority.
Over the past five years, more than one million Albanians have also been turned back at the border. Afterdeclining from 1997 to 1998, the number of people turned back at the border in 1999 rose again to 154 200.
Schooling of migrant’s children
In 1999-2000, there were 65 500 pupils of foreign or ethnic Greek origin in primary education and 27 700 insecondary education. At primary level, 70% were foreigners and 30% children of ethnic Greeks. Of the foreignchildren, 83% were Albanian. At secondary level the percentages were similar.
To facilitate the integration and reintegration of migrants’ children, the Greek Government has set upthree types of structure: reception classes, tutoring (after school hours in small groups of 3 to 9 pupils) andintercultural classes. In 1999-2000, 500 reception classes and 700 tutor groups were operating in primaryschools, primarily in the Athens region. Some 8 540 pupils were in reception classes, or 13% of all migrants’children, irrespective of category, and some 5 000 pupils, or 7.5% of the total, received tutoring. In 1999-2000,there were 20 intercultural classes throughout the country. These are classes where pupils learn and are taughtin more than one language. In 1999-2000 there were 3 498 pupils in this type of class at various levels.
Hungary
Introduction
Between 1998 and 2000, Hungary’s GDP grew at an average rate of just over 4.8%. Forecasts for 2001 indi-cate that growth will still remain very strong (4.7%). Job creation has increased, with unemployment falling toaround 5.1% in 2000 (as compared with 8% in 1998 and 7.1% in 1999). Officially recorded migration has levelledoff after rising sharply in the early 1990s, and the number of foreign residents has increased only very slightly.However, undocumented immigration has increased considerably.
In a regional context, Hungary plays a key role in the field of migration. Its geographical position, itsstrong economic growth and prospective membership of the European Union are increasing its importance asa transit country for immigration. The fact that neighbouring countries have Hungarian minorities that mayimmigrate to Hungary is also a key factor. Recent developments and the possible growth of immigration in thefuture will also have social consequences in a country that has experienced a demographic decline.
1. Trends in migration movements
Inflows and outflows of foreigners
In 1999, some 15 000 immigrants arrived in Hungary, compared to some 13 000 in 1998. This sharp rise wasmainly the result of immigration from Romania, the former Yugoslavia and Ukraine (see Table III.17). Nationalsof these three countries account for 62% of all immigrants. They are mostly members of the Hungarian minority
HUNGARY

Hun
gary
181
© O
EC
D 2001
Table III.17. Current figures on migration flows and stocks of foreign population, Hungary
Figures in thousands unless otherwise indicated
1. Preliminary data.2. Foreigners who have been residing in the country for at least a year and who currently hold a long-term permit. Data are presented by actual year of entry (whatever the type of permit when entering the
country).3. Number of applications for a permanent permit which have been approved.4. Valid work permits at the end of the year.Source: Ministry of the Interior ; Central Statistical Office.
1996 1997 1998 19991 1996 1997 1998 19991
Registered long-term immigration by country of origin2 Acquisition of the Hungarian nationality 12.3 8.7 6.4 6.1Romania 4.0 3.4 4.1 6.0 of which, in per cent of total acquisitions:Former USSR 1.8 1.7 2.0 2.2 Romania 69.7 60.4 59.7 57.1of which: Ukraine 1.3 1.2 1.3 1.6 Former Yugoslavia 16.3 18.6 16.8 18.7
Russian Federation 0.5 0.4 0.5 0.4 Former USSR 10.0 9.1 11.1 14.4Former Yugoslavia 1.0 1.0 0.8 1.7EU countries 1.5 1.7 1.5 1.5 Registered foreign workers, by country of origin4
Other countries 4.4 4.5 3.9 3.6 Romania 8.5 9.5 10.6 ..Total 12.8 12.2 12.3 15.0 China 2.2 3.1 2.8 ..of which: Women 5.6 5.4 6.3 7.3 Former USSR 1.0 1.1 1.0 ..
Poland 1.0 1.0 1.0 ..Grants of residence permits by type of permit Slovak Republic 0.4 0.4 1.1 ..
Short-term permits (including renewals) 25.1 20.9 23.6 22.1 Other 7.1 6.7 6.0 ..Long-term permits (including renewals) 15.4 20.4 24.3 29.5 Total 18.8 20.4 22.4 ..Permanent permits3 2.8 2.8 3.7 2.7
Number of expulsions 14.0 15.6 22.6 18.4Inflows of asylum seekers and refugees 1.3 2.1 7.1 11.5 of which:
Romanians 7.9 9.8 10.2 11.3Stocks of permanent residents 77.4 73.7 71.1 72.4 Former Yugoslavs 2.3 2.6 7.1 2.6of which: Women 41.8 40.1 38.9 39.4Stocks of foreign residents (long-term and permanent residents), by country of origin Number of deportations 9.8 11.9 16.6 12.9
Romania 61.6 57.4 .. 48.6 of which:Former Yugoslavia 16.4 16.0 .. 15.3 Romanians 5.3 7.3 6.9 7.4Germany 8.3 8.4 .. 8.5 Former Yugoslavs 2.0 2.3 6.1 2.0China 6.7 7.9 .. 7.7Ukraine 12.0 12.2 .. 7.6Other 37.2 41.9 .. 39.4Total 142.2 143.8 .. 127.0of which: Women 66.1 66.7 .. 63.8
Trends in International Migration
182
© OECD 2001
in these countries, 50% of all immigrants being considered to be of ethnic Hungarian origin by the authorities.Their numbers increased considerably in 1999 (1998: 37%), no doubt due to the crisis in Kosovo and the fearthat borders would soon be closed because of the prospect of Hungary acceding to the European Union.Other immigrants came from Asia (12%), mainly from China.
Illegal immigration
In 1999, the number of illegal immigrants stopped at the Hungarian border fell to 4 000, compared with4 700 in 1998. The number of undocumented migrants intercepted when leaving Hungary was, in that sameyear, three times higher than the recorded number of illegal entries. This shows the growing importance oftransit flows to western Europe through Hungary, although Hungary is also becoming a destination for immi-gration. The vast majority of the illegal migrants apprehended entered the country by means of the East andSouth-East borders, from Romania and the former Yugoslavia, whereas almost all of those stopped when tryingto leave Hungary were intercepted at the borders with Slovenia, the Slovak Republic and Austria.
There is an organised traffic in illegal migration, as demonstrated by the statistics on the number of traf-fickers arrested over the last three years. Although the number of trafficker-assisted entries recorded averagedsome 700 per year during most of the 1990s, it rose sharply in 1998 (2 000). Trafficking in women is one of theaspects of illegal migration most frequently discussed in Hungary, since these operations are run by a cross-border criminal network. In 1999, some 18 900 foreigners were expelled from Hungary compared to22 500 in 1998.
Refugees and asylum seekers
Since March 1998, when the law on refugees was codified, Hungary has admitted refugees from outsideEurope. As a result, foreigners who have travelled through Hungary to the countries of the European Union toapply for refugee status can be sent back to Hungary. In such cases, it is up to the Hungarian authorities to pro-cess the application. So far, this rule has only been applied on a large scale by Austria: during the second halfof 1998, some 2 500 individuals apprehended in Austria were sent back to Hungary, the country through whichthey had transited.
The number of asylum seekers increased sharply in 1999 to 11 500, as compared with 7 100 in 1998. Nearlyhalf came from the former Yugoslavia, and 52% from non-European countries. In 1999, only 313 applications forrefugee status were granted, with a further 1 776 people being granted exceptional leave to remain, either onhumanitarian grounds or because they could not safely be returned. In 1999, the crisis in Kosovo was the maincause of entries in this latter category. For many migrants, however, this status is not satisfactory as it is diffi-cult for them to obtain permission to work and they are not eligible for social assistance.
2. Structure and changes in the foreign population
Numerical trends
At the end of 1999, some 72 400 foreigners were living legally in Hungary as permanent residents(see Table III.17), while 127 000 were registered as holding long-term permits. Since inflows and outflows ofdocumented foreigners have not changed very much, the fall in the number of naturalisations recordedin 1998 probably explains the increase in the number of foreigners holding a permanent residence permit.
Naturalisations
Some 7 500 people were naturalised in 2000, which was a relatively sharp increase over 1999 (6 100), butwas still lower than in 1996 (12 270) (see Table III.17). After averaging 13 000 in the early 1990s, the number ofapplications has stabilised at around 3 000 per year. As in previous years, 60% of those naturalised were Roma-nian, although this proportion has been falling steadily since 1992 (94%). Approximately 22% were from theformer Yugoslavia and 12% from Ukraine.

Hungary
183
© OECD 2001
Most applicants were of Hungarian origin or were themselves once Hungarian citizens. Re-naturalisationrequests accounted for 17% of the total. A little over 70% of naturalisation applications were from descendantsof Hungarian citizens, and some 10 were from persons married to a Hungarian.
3. Migration and the labour market
Migration for employment and work permits
After a fall in 1996, due to a change in the regulations, the number of newly issued work permits has con-tinued to rise: 30 000 in 1999 as compared with 22 600 in 1998 and 19 700 in 1997. In addition, 10 700 residencepermits were issued for practising gainful activities for which a work permit is not required.
Work permits are generally granted for professions in which there is a shortage of labour or for personswho bring special knowledge and expertise. Almost half of work-permit holders were Romanian citizens, over15% were from European Union countries and North America, 14% from countries of the former Soviet Union(mainly Ukraine), and the rest from Poland, the former Yugoslavia and China. In fact, the proportion of foreign-ers from the developed countries is probably higher than is indicated by the official figures since a significantnumber of them are senior managers in foreign companies and as such do not require a work permit.
The number of settled immigrants and refugees entitled to work without further permission was64 000 in 1999. The number of registered foreigners legally present on the Hungarian labour market can beestimated at 90 000 in all (including students and certain temporary workers who are allowed to work withoutholding a work permit).
Illegal employment of foreigners
The employment of undocumented foreign workers must be seen in the much broader context of theinformal sector and the undeclared labour market in Hungary. According to certain estimates, the informal sectoraccounts for 30% of GDP and the participation of foreigners in this economy is understood to be wide-ranging.Given that it is possible to enter Hungary without a visa from practically all European countries, the majority ofundocumented foreign workers enter as tourists and regularly or occasionally undertake a variety of jobs.Their residence is made “legal” by leaving the country once a month to have an exit stamp put in their pass-ports because the visa regulations allow them to stay only on that condition.
Many of these “tourists” from neighbouring countries work in the construction sector (illegal foreign work-ers are widely employed in this sector) or have a seasonal job in agriculture or occasionally take jobs indomestic services or tourism. The participation of foreigners in retail activities of all kinds is tending to grow,though from a low base. Cross-border commercial activity rose at the time of the conflict in Kosovo and theembargo imposed on the Federal Republic of Yugoslavia.
The majority of undocumented labour migrants are from neighbouring countries, mainly Romania, butalso Ukraine and the former Yugoslavia. After some days, weeks or months of work, they return home beforereturning to Hungary again. Most are ethnic Hungarians who speak the language and have relatives or othercontacts in the country. Some of them use their annual leave to increase their income. These essentially tem-porary migrants do not wish to settle permanently, but working abroad is the only chance they have toimprove their living conditions.
Another aspect of the situation regarding undocumented foreign workers is the growing number of foreigncompanies – European or American – which have set up in Hungary. These international companies are look-ing for skilled workers with good linguistic and computer skills, which leads many young foreigners from thesecountries to take up undocumented employment, for example in language teaching, the media or computerservices.
4. Policy developments
Hungary is increasingly becoming an immigration country, which is why, during the last three years, it hasamended its immigration legislation to bring it into line with policies in European Union countries. Theseamendments relate mainly to the entry and residence of foreigners (including asylum seekers and refugees),

Trends in International Migration
184
© OECD 2001
the acquisition of Hungarian nationality, measures to combat the employment of undocumented foreignersand the signing of international readmission agreements.
However, these changes raise major problems with neighbouring countries, as their nationals may nolonger be able to enter Hungary without a visa. It is planned to introduce visa requirements for Moldavia,Byelorussia and Russia in 2001. Similar measures have already been adopted for the countries of Central Asiaand the Caucasus.
Admission and residence (including integration measures)
In 1993 and 1994, two fundamental Acts were adopted, the first concerning Hungarian citizenship, and thesecond the entry and residence of foreigners. To obtain a permanent residence permit, a foreigner must havelived and worked legally in Hungary for three years. A “Passport, Exit and Entry” Act entered into force in 1998.
One of the conditions for acquiring Hungarian nationality is a minimum residence requirement of at leasteight years.
In 1998, the last pillar of the legal regulation of migration issues, the Act on Refugees, came into force. Itcontains, notably, a provision that only refugees from Europe may be granted asylum in Hungary.
Measures to combat the illegal employment of foreign workers
In 1996 and 1999, two restrictions on the legislation on the employment of foreign workers were adopted.Foreigners who travel to Hungary with the purpose of working there must obtain a work permit or an income-earning activity visa before entering Hungary, regardless of the anticipated length of their stay. A work permitis required for most jobs and may be issued only if there is no locally available Hungarian resident with therelevant qualifications to fill the post. High unemployment in the locality also constitutes an obstacle toemploying new foreign workers. Employers are required to register their application for a permit 60 daysbefore the beginning of the contract, or 30 days in the case of seasonal or occasional employment.
The penalties imposed on employers who recruit undocumented foreign workers have been madeharsher in recent years. Nevertheless, it is the workers who face the greatest penalties: if a foreigner is caughtworking without a valid work permit, the employer must pay a fine equal to at least five times the minimumwage, while the worker can be banned from Hungary for between one and five years.
Adapting Hungarian legislation to European Union norms
Under the Association Agreement signed with the European Union, Hungary has to bring its legislationinto line with that of the European Union. Essentially, this means promoting the free movement of personswithin the European Union and strengthening border controls.
However, it also means introducing systems for regulating immigration and integrating foreigners compa-rable to those in Western Europe, which is why Hungary has set up an “Immigration and Naturalisation Office”,a civil-law body under the supervision of the Interior Ministry.
Special provisions, with preferential treatment for EU citizens, are under preparation, and some wererecently introduced.
As for strengthening border controls, the necessary measures have still to be introduced. This provisionhas raised concern among Hungarians living outside their country that they will no longer be able to crossthe border freely. A visa requirement for nationals of Romania, the Slovak Republic, the Federal Republic ofYugoslavia, Ukraine and Croatia would therefore have a negative impact on family and cultural contacts withthose communities.
Revision of the Readmission Agreement between Austria and Hungary
New provisions were introduced into the Readmission Agreement between Austria and Hungary inFebruary 1997. The Hungarian authorities are now required to accept any person presumed to have enteredAustria illegally via Hungary.

Ireland
185
© OECD 2001
Ireland
Introduction
The remarkably strong performance of the Irish economy continued in 2000 with real GDP growing bynearly 11%. Since 1993 real growth has averaged over 8% and has been accompanied by a net increase inemployment estimated at 488 000, equivalent to an average annual growth rate of more than 5%. Even thoughthe labour force participation rate continued to expand throughout this period, the unemployment rate hadfallen to 4.2% by April 2000. This unprecedented employment growth has given rise to significant labour short-ages across many areas of economic activity, both skilled and unskilled. One consequence of this has been arapid increase in the influx of foreign workers. These have come not only from the European Union, the citi-zens of which enjoy freedom of movement under EU law, but also from a range of other countries under theterms of the existing work permit system. The overall composition of those entering on this basis has alteredsignificantly over recent years. In earlier years, entrants from countries such as the United States, Japan, Indiaand Pakistan formed a sizeable proportion of the total. This has now changed and when the position is viewedin association with the recent trends in the sectoral composition, the implication is that the inflow pattern isnot only different in terms of nationalities, but also in terms of its skill structure, with relatively greater num-bers in unskilled or semi-skilled categories.
While the favourable economic circumstances constitute the main reason attracting sizeable numbers ofboth former emigrants and non-nationals to come to work in Ireland, the numbers have been further aug-mented by a sharply increasing inflow of asylum seekers. In response to the rising inflow, the government hasextended and modified existing legislation. It is also taking measures to improve the efficiency of the applica-tions process and is according increasing attention to the promotion of integration.
1. Trends in migration movements
Emigration and the return of nationals
Having reached very high levels at the end of the 1980s (as high as 70 000 in 1989, a level similar to thatexperienced during earlier periods of large-scale emigration), emigration flows have steadily declined sincethat time. In the year to April 2000, the gross outflow was estimated at approximately 22 000.
Ten years ago, nearly 70% of those who emigrated went to the United Kingdom, some 12% to theUnited States, 6% to other European Union (EU) countries and about 14% to other destinations. By 1993 theUnited Kingdom was no longer, after six decades, the destination of the majority of Irish emigrants. This trendtowards increasing diversity in destinations, though not sustained every year, has continued. In 2000, the pro-portion going to the United Kingdom was less than 30% while that for the rest of the EU was 19%; theUnited States accounted for 14% and all other countries taken in aggregate for just under 40%.
Irish emigration has predominantly been of young people, though when economic conditions in Irelandare severely depressed it also tends to extend to the immediately older age groups. The most recent esti-mates available show that some 55% of the gross outward movement in 1999/2000 related to persons agedbetween 15 and 24 years, with the great majority of the remainder (almost 40%) involving persons agedbetween 25 and 44 years; other sources indicate that most emigrants in this latter age class are between25 and 34 years old (see Chart III.8).
With regard to gender differences, if Irish emigration flows are viewed over a long period, there is nomaterial difference in the balance between males and females. However, this balance can vary substantiallyfrom time to time. The outflows in the 1980s, for example, involved a significant majority of males. However,this differential has decreased greatly in the 1990s: the gross outflow of males between 1990 and 2000 was154 000, compared with 150 000 for women. The overall tendency towards lower female emigration in recentdecades has occurred primarily because the employment prospects for women in the Irish labour market havebeen relatively more advantageous.
IRELAND

Trends in International Migration
186
© OECD 2001
Irish emigrants, who were previously largely unskilled, or at best possessed rudimentary manual skills,are now broadly representative of the skill structure of Irish society. Indeed, there appears to be a tendencytowards disproportionately higher emigration among those with third-level qualifications (advanced diplomasor degrees). Ireland’s graduate labour force involves what might be described as an ongoing or even constantmigratory element, which exists to a significant degree even when the economy is buoyant: published datarelating to recently qualified graduates indicate that whilst unemployment in the immediate post graduationperiod declined markedly during the 1990s there has been, interestingly, little change in the proportion takingup employment abroad. However, the durations of residence abroad, even though sometimes quite long,tend not to be permanent, and thus the oft-voiced fears of a “brain drain” are not in fact well-founded.
Chart III.8. Trends and characteristics of migration, Ireland
1871-81
36-46
46-51
51-61
61-71
71-81
81-91
91-96
1988 89 91 93 95 9997
0-14 45-64
9896949290
60
50
40
20
10
0
30
25-4415-24
26-36
60
40
20
0
-20
-40
-60
-80
60
40
20
0
-20
-40
-60
-801911-
261891-1901
1881-91
96-99
1901-11
Natural increase Net migration
Total change
Net migration
Emigration
Immigration
C. Age distribution of migrants (estimates), 1999Percentages
A. Components of population change,intercensal periods
Thousands, annual averageB. Migration flows (estimates), 1988-1999
Thousands
65 and over
Immigrants Emigrants
Sources: Commission on Emigration, Reports (1954); Census of popula-tion of Ireland 1996; Population and Migration estimates, CSO, 2000.

Ireland
187
© OECD 2001
Inflows and outflows of foreigners
Inward migration (of both returning emigrants and non-nationals) has become a much more importantphenomenon in Ireland over recent years. The gross migration inflow increased from less than 30 000 in thelate 1980s to around 45 000 in the late 1990s. The proportion of non-nationals in the inward flows has risenfrom approximately 35% in the late 1980s to over 50% in the year to April 2000. While the non-national group iscomprised largely of persons coming to work, it also includes students coming to attend third-level institu-tions and, more recently, asylum seekers, as well as dependants of persons in these groups.
The age distribution of the gross inflow has tended to exhibit considerable stability (see Chart III.8).Those aged 25 years or over constitute some 55% of the total inflow, with a significant concentration in the25 to 44 year age band. About 30% of the gross inflow relates to the youth category covering those aged 15 to24 years. Some 12% of inward migrants are children aged less than 15 years, suggesting that a significant num-ber of the incoming migrants enter as family groups. This proportion has, however, shown a tendency to fall inrecent years, probably because the migrant inflow contains an increasing share of non-nationals who are morelikely to come unattached, rather than with families.
Refugees and asylum seekers
The influx of asylum seekers or persons seeking refugee status has emerged as an important issue inIreland over recent years. Until the early 1990s the numbers of refugees and asylum seekers were very small;since then they have risen sharply, from less than 40 in 1992 (not including the several hundred Bosnian pro-gramme refugees, displaced from the former Yugoslavia, whom the Irish Government agreed to accept in thatyear) to over 3 900 in 1997, 4 600 in 1998, almost 7 700 in 1999 and to 10 900 in 2000. Possible reasons for therecent increase include increasing numbers of asylum seekers entering European Union countries generally,and the fact that other countries are adopting more restrictive stances with regard to applications. A knowl-edge of the new application procedures in Ireland, of the welfare supports, and the fact that the employmentsituation is favourable may also be contributing factors.
Recent figures published by the Department of Justice, Equality and Law Reform indicate that over theperiod from 1992 to 1999, over 40% of asylum seekers were of Romanian origin, 34% were from Nigeria andnearly 12% were from Zaire/the Democratic Republic of the Congo. Among the remainder, significant numberswere from Algeria, Poland and Kosovo.
The number of persons who have been granted official refugee status is relatively small. Over the periodfrom the beginning of 1992 until October 2000, of the 5 700 applications which had completed the determina-tion process slightly more than 1 300 (23%) were accepted and the applicants granted official recognition asrefugees. The former figure, it should be noted, excludes nearly 3 000 applicants awaiting the outcome of anappeal following refusal at the first stage of determination; the number of successful applications includes637 persons who secured recognition on appeal. During this period there were also over 7 400 applicationsthat were deemed as being withdrawn or abandoned. At the beginning of October 2000 there were some13 200 applications awaiting determination, either at the first or the appeal stage.
2. Structure and changes in the foreign population
The total number of foreign residents in Ireland is relatively small when compared with other EuropeanUnion countries. However, data from the Quarterly National Household Survey, which provides the only meansof estimating the stock of non-nationals in Ireland, show that this component of the Irish population hasincreased substantially over recent years. Whereas in 1983 there were estimated to be only 83 000, inApril 2000 the figure was put at 126 500 (see Table III.18). They now account for 3.3% of the total population.
The great majority of foreign residents, approximately 92 000, are EU passport holders. Of these, an esti-mated 67 000 are from the United Kingdom. Whereas this latter figure has altered little over the second half ofthe 1990s, the number of other EU citizens has almost doubled and the number of those from outside the EUhas increased by almost the same amount, this notwithstanding the fact that the largest national group in thiscategory, citizens of the United States, are less numerous now than they were in 1995.

Trends in International Migration
188
© OECD 2001
Table III.18. Current figures on migration flows and stocks of total population and labour force, Ireland
Figures in thousands unless otherwise indicated
Note: Figures for the EU refer to the 15 member countries of the Union.1. CSO estimates made on the basis of 1996 Census results.2. Estimated from the annual Labour Force Survey. Fluctuations from year to year may be due to sampling error.3. January to September for the year 2000.Sources: Central Statistical Office; Labour Force Survey.
1997 1998 1999 2000
Immigration by last country of residence1 44.0 44.0 47.5 42.3United Kingdom 20.0 21.1 21.6 16.4Other EU countries 8.1 8.7 10.0 9.8United States 6.6 4.9 5.7 4.6Other countries 9.3 9.3 10.2 11.5
% of return Irish citizens 46.6 52.7 54.5 ..
Emigration of both Irish and foreign people by country of destination1 29.0 21.2 29.0 22.3United Kingdom 12.9 8.5 10.2 6.3Other EU countries 4.1 4.3 4.5 4.3United States 4.1 4.3 5.4 3.2Other countries 7.9 4.1 8.9 8.5
Net migration of both Irish nationals and foreigners1 15.0 22.8 18.5 20.0United Kingdom 7.1 12.6 11.4 10.1Other EU countries 4.0 4.4 5.5 5.5United States 2.5 0.6 0.3 1.4Other countries 1.4 5.2 1.3 3.0
Stock of total population2 3 660.6 3 704.8 3 744.7 3 786.9Irish nationals 3 546.2 3 593.8 3 626.7 3 660.4Total foreign population 113.9 110.9 117.8 126.5
United Kingdom 64.4 66.2 68.8 66.9Other EU countries 16.4 19.0 20.8 25.3United States 11.3 10.0 9.9 8.0Other countries 21.8 15.7 18.3 26.3
% of foreign population in total population 3.1 3.0 3.2 3.3
Asylum seekers 3.9 4.6 7.7 8.0
Labour market
Work permits issued and renewed3 4.5 5.6 6.3 10.7
By nationalityCentral and Eastern Europe .. 0.3 1.3 4.1United States and Canada 1.4 1.6 1.1 1.4India and Pakistan 0.5 0.7 0.6 0.7Other countries 2.6 3.0 3.3 4.4
By sector of activityAgriculture 0.1 0.1 0.4 1.7Industry 0.6 0.7 0.4 0.7Services 3.8 4.9 5.4 8.2
Employment by nationality2 1 338.4 1 494.5 .. 1 670.6
Irish nationals 1 294.7 1 447.0 .. 1 610.7
Foreigners in employment 43.7 47.5 .. 59.9United Kingdom 26.7 28.3 .. 31.9Other EU countries 7.6 10.3 .. 15.6United States 3.2 3.7 .. 2.8Other countries 6.2 5.2 .. 9.6
Employment to total population ratioIrish nationals (%) 36.5 40.3 .. 44.0Foreigners (%) 38.4 42.8 .. 47.4
United Kingdom (%) 41.5 42.7 .. 47.7Other EU countries (%) 46.3 54.2 .. 61.7United States (%) 28.3 37.0 .. 35.0Other countries (%) 28.4 33.1 .. 36.5

Ireland
189
© OECD 2001
3. Migration and the labour market
Migration for employment and work permits
Analysis of the data on the issue and renewal of work permits (which are required for all engagements forfinancial gain, irrespective of duration) provides some indication of the trends in the numbers of non-EUnationals entering the country in order to take up employment. The number of issues and renewals rose rap-idly between 1989 and 1993, from 2 500 to just over 4 250. It did not vary greatly from this level until 1998 whenthe figure rose to almost 5 650. The figure for the first nine months of 2000 was over 10 700 (see Table III.18)and the increased pace of inflow suggests that the annual total could be as high as 18 000, three times thatof 1999 (6 300). Most of the recruitments involved are on a short-term basis, usually for one year, as allowed bythe work permit system. In this context an interesting feature of the recent trend is that, despite the largeincrease in the number of permits issued overall, the number of renewals has actually fallen.
While the recent influx of non-EU workers has involved an increasingly diverse range of nationalities, theincrease in the inflows for some national groups has been particularly marked. The number entering from theBaltic States, for example, was only 17 in 1998 but had risen to almost 1 700 in the first nine months of 2000.Over the same short period, the inflows from other Eastern European countries increased from 285 to 2 400.
The permits issued are overwhelmingly for posts in the services area. Until recently many of the permitsissued under the “services” heading related to the medical sphere, but these have declined in recent years dueto the imposition of more restrictive registration conditions governing eligibility to work as a medical practitio-ner. Over recent years the most rapid relative increases have occurred in the agricultural sector, in manufacturingindustry and in catering activities. The figures for agriculture are quite phenomenal, indicating that the inflow ofpermit holders increased from less than 50 in the mid-1990s to nearly 1 700 in the first nine months of 2000. Mostof those involved are of Latvian nationality, working in the mushroom production industry.
Labour market integration
In 2000, according to the Quarterly National Household Survey, just under 3.7% of the total workforce werenon-nationals, of whom approximately 60 000 were at work and just under 4 000 were unemployed. This latterfigure, is 2 000 lower than in the preceding year and accompanied a fall in the unemployment rate of foreign-ers from nearly 12% to below 6%; this compares with an unemployment rate for the indigenous population of4.2%. It should be borne in mind, however, that the number of non-Irish unemployed in the Irish labour force issmall and, therefore, the related survey estimates would be subject to a significant degree of sampling error.The figures should, therefore, be interpreted with caution.
4. Policy developments
The basic legal framework covering foreign nationals in Ireland in regard to rights of entry, residence andemployment is the 1935 Aliens Act and the subsequent ministerial orders appended to it. It should be noted,of course, that in so far as EU citizens are concerned, the 1935 Act was largely superseded by legislation intro-duced on entry to the European Union in 1973 which, with few restrictions, guaranteed right of entry and resi-dence and access to employment for all EU citizens.
In 1996, in response to the rapid increase in the numbers of asylum seekers, the Refugee Act was intro-duced to parliament with the primary objective of codifying asylum procedures in law and rendering themmore transparent. This act was amended in 1999 through the inclusion of relevant subsections in the Immigra-tion Act passed in that year and by the same means during the passage through parliament of the 2000 IllegalImmigrants (Trafficking) Act.
Admission and residence (including integration measures)
Immigration Act 1999
The Immigration Act 1999 specifies the conditions and circumstances in which any immigrant (whether anasylum seeker or not) could be deported or excluded from the State. Under the original 1935 Aliens Act the
Trends in International Migration
190
© OECD 2001
Minister for Justice, Equality and Law Reform had wide discretion in regard to sanctioning deportations. Inrecent years a number of deportation orders have been challenged in the Courts and overturned, mainly onhumanitarian grounds or for reasons of natural justice. The purpose of the 1999 Immigration Act is to addressthese concerns by setting out in some detail the circumstances and the manner in which non-nationals can belegally deported, or excluded from the State. The new legislation imposes a number of constraints on theauthorities. In determining whether or not to make a deportation order the Minister for Justice must haveregard to relevant circumstances pertaining to the person; these include age, duration of residence in theState, family, employment and general humanitarian issues. A prospective deportee must be issued with adeportation order which allows him or her fifteen working days within which to representations to the Minister.In the case of non-nationals who have been resident in the State for at least five years, deportation, even ifdecided on and officially notified, cannot be implemented for at least three months.
Functioning of the work permit system
As was noted in the sections on the Structure and changes in the foreign population’ and Migration andthe labour market’, there has been a sharp increase in the number of foreign workers entering the country. Inaddition to an influx of workers from the EU, there has been a huge rise in the number of non-EU nationalsentering under the work permit system. This has arisen as a result of growing labour shortages, further facili-tated by relaxation in the conditions associated in the Work Permit regime. There is pressure (in particularfrom employers) for a less restrictive system, especially in view of the impending fall in the numbers leavingthe Irish educational system. However, other commentators, conscious of a possibility of an eventual slow-down in employment growth, are recommending a more cautious approach.
Refugees and asylum
The 1996 Refugee Act (as amended) created the post of Applications Commissioner, the occupant ofwhich can independently assess applications for asylum and make recommendations to the Minister for Jus-tice, Equality and Law Reform. There is also an Appeals Tribunal to which the applicant can have recourse if heor she is dissatisfied with the decision of the Applications Commissioner. The Act also provides for the settingup of a Refugee Advisory Council which is to comprise both representatives of Government ministries andthose representing asylum seekers interests. The Board may review any aspect of asylum policy, includingproposals to amend legislation. UNHCR representatives are entitled to be present at its meetings.
Apart from basic provisions such as those defining what constitutes a refugee (which conform closely tothose set out in the 1951 UN Convention), other significant aspects contained in the Act are:
• Provisions which allow the Irish Government to ratify the Dublin Convention which determines the Stateresponsible for examining applications for asylum lodged in one of the EU member states.
• The codification of procedures in relation to detention. This is to be decided by the courts on the basisof specified grounds and has to be reviewed at intervals of 10 days. Persons aged under 18 years cannotbe detained, except in certain specified circumstances.
• Provisions which allow the Minister to grant permission for family members of the officially recognisedrefugee to enter and reside in the State
• The provision that the UNHCR at all important stages when an application for asylum is being pro-cessed.
• The possibility of taking the fingerprints of asylum applicants and their family members/refugees abovethe age of 14 years.
One of the grounds for detention, the destruction of identity or travel documents or the possession offalse papers without reasonable cause, has attracted criticism. Refugee support groups contend that many ref-ugees would be unable to leave their country of origin using their original passports. The fingerprinting provi-sion has also been the subject of criticism. The stated reason for this is that it facilitates identification andprevents multiple applications under different names; opponents contend that it raises the spectre of the“criminalisation” of refugees.

Ireland
191
© OECD 2001
Inevitably, the large influx of asylum seekers has placed a considerable strain in the administrative struc-tures responsible for dealing with them. Even though the number of public service staff engaged in dealingwith applications for asylum has been greatly increased (from less than 20 in mid-1997 to a current total of 240)the large number of applications currently outstanding indicates that there are ongoing administrative prob-lems in coping with the rapidly increasing inflow. Steps are being taken to augment the staff numbers further,the objective being to raise the total complement to over 600 by mid-2001. In administrative terms, the ulti-mate aim is to attain a position where all applications for asylum are brought to complete finality (includingthe appeal process) within a period of six months.
In December 1999, the Report of the Interdepartmental Working Group on the Integration of Refu-gees in Ireland was presented to the Minister for Justice Equality and Law Reform. The Group reviewedthe arrangements and made recommendations concerning the integration of persons granted refugee sta-tus, including the appropriate institutional structures for the delivery of these services. The WorkingGroup concluded that the appropriate organisational structure for developing integration policy andco-ordinating the implementation of integration measures should be decided within the overall frame-work of structures for asylum and immigration. Although the rights of asylum seekers and those officiallyrecognised as refugees are different, efficiencies can be achieved by adopting a co-ordinated approachto both the reception of asylum seekers and the integration of refugees, as has been done in other EUmember states. The Working Group also took the view that a comprehensive strategy for implementingpolicy in Ireland should be developed in a flexible way in order to allow revisions as further develop-ments emerged. In addition, the Group identified a number of clear needs which required immediateaction. These included the introduction of further measures to promote a tolerant and inclusive society,the provision of referral and information services by existing service providers and the undertaking ofresearch.
Following from the recommendations of the Working Group, the Government has set in train the institu-tion of a Reception and Integration Agency. This body, which is being set up on a statutory basis, is to deal notonly specifically with refugees, but also those whose applications for refugee status is pending, particularly incircumstances where the waiting period is prolonged.
Important issues associated with the refugee question that continue to be controversial include:
• The right of asylum seekers to work. On 27 July 1999, the government modified the previous policy wherebyonly those officially recognised as refugees were allowed to work. Asylum seekers who have been in thecountry for more than twelve months and who are still awaiting a determination of their application forrefugee status were granted the right to obtain work permits. The new rules also apply to those whosought asylum prior to 26 July 1999, as soon as they cross the twelve-month threshold. However, thenumber of asylum seekers that have gained employment thus far as a result of this measure isextremely small (at the end of 1999 only 100 out of the more than 2 000 who were eligible). Steps haverecently been taken in association with the State employment and training services to expedite theprocess.
• Support systems for asylum seekers. Until recently asylum seekers in Ireland received standard welfare pay-ments and their accommodation (usually in the private sector) was paid for from public funds. However,as from April 1999 all new applicants for asylum have been covered by a new system of direct provision.Accommodation is now provided on a full-board basis (covering food and other necessary domesticrequirements), supplemented by special reduced welfare payments (IRP 15 per week for each adultand IRP 7.50 for each child)
• Problems of residential concentration. Due to the very large increase in the number of persons seeking asylumin recent months, and in view of the non-availability of further accommodation in the Dublin area, it wasbeen decided that arrangements should be made to disperse asylum seekers throughout the country.This process has proved slower than anticipated, mainly as a result of objections from local communi-ties. These protests have arisen, not so much from racial or ethnic motives, but as a result of large num-bers of asylum seekers being accommodated in some small rural communities.

Trends in International Migration
192
© OECD 2001
Italy
Introduction
In 1999, the statistics again confirmed Italy’s status as an immigration country, even though its unemploy-ment rate was one of the highest among the EU countries. It became the second-ranking receiving countryafter Germany, with inflows rising by over 20% in 1999 (not including the regularisation programme discussedbelow).
1. Trends in migration movements
Inflows and outflows of foreigners
In 1999, some 268 000 people “entered” Italy, which was over twice as many as in 1998 (an increase of142%). However, this sharp rise in the number of entries recorded must be qualified, since it includes fictitiousentries, of a statistical nature, corresponding to people who benefited from the fourth regularisation pro-gramme launched in 1998. The 130 745 foreign nationals who “entered” under the regularisation programmenot included, the total flow of actual entries amounted to approximately 137 260, or a real increase of 24% overthe previous year. These flows comprise the initial residence permits issued, including short-term permits (forstudy purposes, asylum requests, tourism, etc.).
However, the regularisation programme did not significantly alter the breakdown of entries by nationality.If only nationals from countries having 1 000 or more entries are considered, inflows rose for all nationalitiesin 1999, except for Iraqis and Turks.
The main country of origin of new immigrants was Albania (37 180 people, or 14% of flows including regu-larisations), followed by Morocco and the former Yugoslavia (each accounting for 9% of inflows), Romania (6%)and China (4%). In other words, five sending countries accounted for nearly half of all inflows.
These numbers, which rose sharply over 1998, show that the immigrants who benefited from regularisa-tion came from the same countries as those who entered the country legally. On the other hand, flows areincreasing much more slowly in the case of nationals of developed countries (primarily the United States,Germany, the United Kingdom, Greece, Spain and Japan) and the Russian Federation, who were seldom con-cerned by the regularisation programme.
The two main reasons for immigration are employment (27% of flows) and family reunion (22.3% of flows).
Refugees and asylum seekers
Although it does not have as longstanding a tradition of asylum as some other European countries, Italy isincreasingly becoming a receiving country for humanitarian and political refugees. In 1999, 33 360 asylum seek-ers entered Italy, which was three times as many as in 1998 (only 11 120). These wide fluctuations in flows areobviously connected with outside political events: in 1999, the war in Kosovo, which led to a major influx ofasylum seekers and refugees into Italy, as had occurred in 1991 following the political crisis and changes inAlbania. In 1999, 4 850 asylum applications were filed by nationals of the former Yugoslavia, which is by far themost frequent source of asylum seekers, followed by Iraq (1 840 applications), Turkey (520), the IslamicRepublic of Iran (120) and Afghanistan (100). However, the end of the conflict in Bosnia Herzegovina hasresulted in a sharp drop in inflows of asylum seekers from this region.
To these applications for asylum must be added inflows for humanitarian reasons (18 005 permits issuedto nationals of the Kosovo region in 1999) and “special reasons” (1 015 Bosnians). The legislative framework forasylum requests is still relatively unclear and applications are often filed after illegal immigrants have beenintercepted by the authorities.
ITALY

Italy
193
© OECD 2001
2. Structure and changes in the foreign population
Numerical trends
The total foreign population in Italy has been increasing gradually over the past ten years. In 1999, the for-eign resident population stood at 1 251 997, which was only a few thousand more than in 1998 (according toInterior Ministry data on residence permits issued, see Table III.19). On the whole, the share of foreigners inthe total population has been rising yearly, but remains lower than the EU average and than the share of for-eigners in the population of traditional immigration countries in Europe, such as Germany, France, etc.
By continent of origin of the foreigners residing legally in Italy, nationals of European countries account forthe largest group, with slightly less than 40% of the total, followed by Africa (approximately 29%), Asia (19%)and the Americas (12%). However, the share of EU nationals among foreigners is tending to decline in relativeterms (14% of the total in 1998 and only 12% in 1999) and also in absolute terms, the number of EU nationals inItaly having fallen by 15% between 1998 and 1999.
The largest foreign community in Italy for the past ten years has been the Moroccan community, whichaccounts for 12% of foreign residents, followed by the Albanian community, which has been growing continu-ously since the early 1990s (from 3% of the total in 1991 to 9% in 1999). However, the third largest community,the Filipinos, diminished between 1998 and 1999, falling from 67 574 to 61 004, as did the Tunisians (a 7%decline in numbers between 1998 and 1999). However, some communities grew in size, examples being thoseof the former Yugoslavia (up 33%), China (up 24%) and Romania (up 39%). This change in the structure of theforeign population by nationality clearly reflects the shift in flows and confirms Italy’s status as an immigrationcountry in which flows are diversifying and are not linked to just a few countries.
Other indicators on the structure of the foreign population in Italy show that it is becoming more stableand that immigration is becoming more long term. The proportion of women continues to rise slowly, andin 1999 46% of foreigners holding a residence permit were women. The average age of the foreign populationis also falling, and the share of the foreign population under the age of 18 is growing, which is a sign that familyimmigration is on the increase. Foreigners are also staying for longer, with an increasing proportion of foreign-ers remaining in Italy for several years. In 1999, one-third of foreigners had resided in Italy for longer than fiveyears and approximately one-quarter for longer than ten years. This indicator shows that Italy is not a transitcountry, but has become a permanent immigration country over the past ten years. Lastly, foreigners nowimmigrate throughout Italy, for although foreign residents are still largely concentrated in the regions of north-ern Italy (nearly half), the number of foreigners in southern Italy and the islands is rising steadily.
The relatively stable and lasting nature of immigration in Italy is also reflected in the steadily rising birthrate of the foreign population. In 1999, 21 175 children were born to foreign women, i.e. 4% of total births ascompared to only 1.5% in 1992. This increase is the combined result of the downward trend in the birth rate ofItalians, although it has slowed, and the sharp rise in births to foreigners (up 143% over the period as a whole).
Mixed marriages
The data available in Italy are insufficient to make a detailed analysis of long-term trends concerningmixed marriages (the initial data date from 1996). Marriages in which one or both persons were foreignaccounted for 3.7% of marriages contracted in 1999, but the divorce rate for marriages involving foreigners wastwice as high, which shows that these marriages are more fragile. All communities combined, the mixed mar-riage rate was very high, at 83% of marriages involving a foreign partner.
Naturalisations
The continual increase in the number of naturalisations since 1991 is a further sign that immigration inItaly is becoming more long term. Between 1991 and 1999, the number of naturalisations more than doubled.The increase accelerated in 1999, a 15% rise over 1998. However, it is true that the total share of foreign resi-dents who became naturalised remained small (roughly 1%), since access to Italian nationality remains highlyrestrictive and the main means of obtaining it is to marry an Italian.
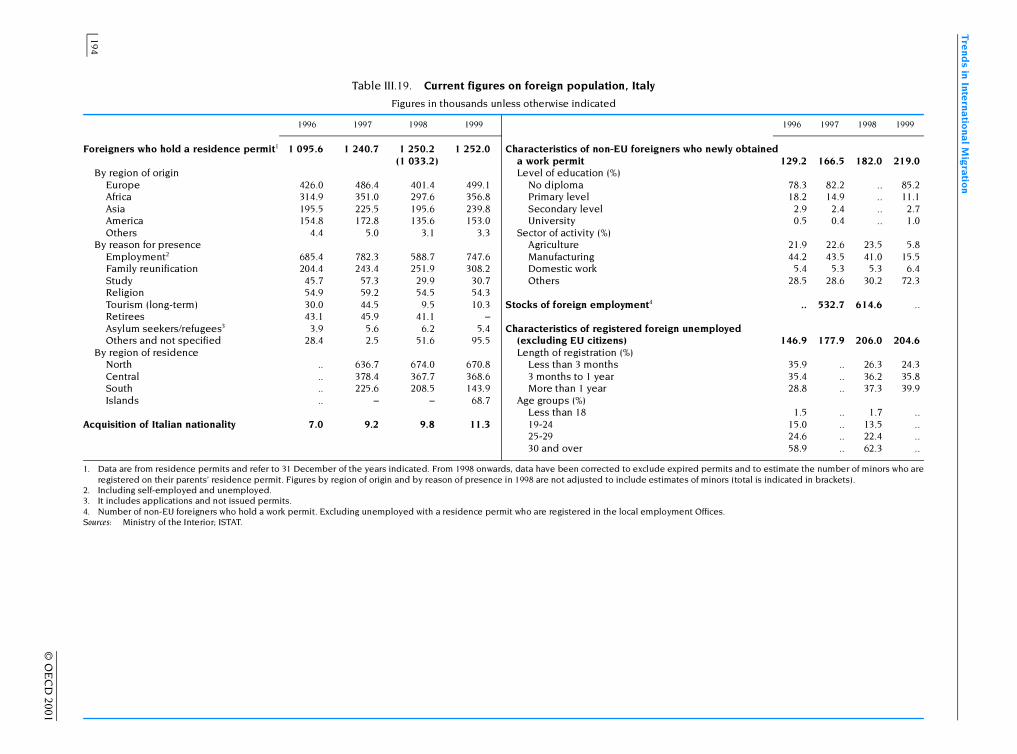
Tre
nds in Inte
rnatio
nal M
igration
194
© O
EC
D 2001
Table III.19. Current figures on foreign population, Italy
Figures in thousands unless otherwise indicated
1. Data are from residence permits and refer to 31 December of the years indicated. From 1998 onwards, data have been corrected to exclude expired permits and to estimate the number of minors who areregistered on their parents’ residence permit. Figures by region of origin and by reason of presence in 1998 are not adjusted to include estimates of minors (total is indicated in brackets).
2. Including self-employed and unemployed.3. It includes applications and not issued permits.4. Number of non-EU foreigners who hold a work permit. Excluding unemployed with a residence permit who are registered in the local employment Offices.Sources: Ministry of the Interior; ISTAT.
1996 1997 1998 1999 1996 1997 1998 1999
Foreigners who hold a residence permit1 1 095.6 1 240.7 1 250.2 1 252.0 Characteristics of non-EU foreigners who newly obtained(1 033.2) a work permit 129.2 166.5 182.0 219.0
By region of origin Level of education (%)Europe 426.0 486.4 401.4 499.1 No diploma 78.3 82.2 .. 85.2Africa 314.9 351.0 297.6 356.8 Primary level 18.2 14.9 .. 11.1Asia 195.5 225.5 195.6 239.8 Secondary level 2.9 2.4 .. 2.7America 154.8 172.8 135.6 153.0 University 0.5 0.4 .. 1.0Others 4.4 5.0 3.1 3.3 Sector of activity (%)
By reason for presence Agriculture 21.9 22.6 23.5 5.8Employment2 685.4 782.3 588.7 747.6 Manufacturing 44.2 43.5 41.0 15.5Family reunification 204.4 243.4 251.9 308.2 Domestic work 5.4 5.3 5.3 6.4Study 45.7 57.3 29.9 30.7 Others 28.5 28.6 30.2 72.3Religion 54.9 59.2 54.5 54.3Tourism (long-term) 30.0 44.5 9.5 10.3 Stocks of foreign employment4 .. 532.7 614.6 ..Retirees 43.1 45.9 41.1 –Asylum seekers/refugees3 3.9 5.6 6.2 5.4 Characteristics of registered foreign unemployedOthers and not specified 28.4 2.5 51.6 95.5 (excluding EU citizens) 146.9 177.9 206.0 204.6
By region of residence Length of registration (%)North .. 636.7 674.0 670.8 Less than 3 months 35.9 .. 26.3 24.3Central .. 378.4 367.7 368.6 3 months to 1 year 35.4 .. 36.2 35.8South .. 225.6 208.5 143.9 More than 1 year 28.8 .. 37.3 39.9Islands .. – – 68.7 Age groups (%)
Less than 18 1.5 .. 1.7 ..Acquisition of Italian nationality 7.0 9.2 9.8 11.3 19-24 15.0 .. 13.5 ..
25-29 24.6 .. 22.4 ..30 and over 58.9 .. 62.3 ..

Italy
195
© OECD 2001
In addition to the naturalisation of Swiss nationals, naturalisations in Italy mainly involve nationals of theCentral and Eastern European countries: firstly Romanians (slightly less than 10% of total naturalisations), fol-lowed by Albanians, Poles and nationals of the Russian Federation. Moroccans, Brazilians and nationals of theDominican Republic are also among the main groups to have acquired Italian nationality.
3. Migration and the labour market
Migration for employment and work permits
In 1999, the number of foreigners in Italy for the purpose of employment increased sharply over 1998 to747 635, to which must be added several thousand refugees who obtained work permits. Employment is thusthe main reason for immigration.
If only residence permits issued to non-EU foreigners are considered, it transpires that the vast majorityof immigrants are low-skilled workers: 85.2% of the new permits issued were granted to persons without diplo-mas and only 1% of immigrants held a higher education diploma. More than 90% of foreign workers are wage-earners, but a growing number are self-employed.
The 1999 data show a change in the structure of foreign employment by sector. While in previous yearsmost permits were for agriculture and industry, in 1999 there was a sharp drop in these two sectors and a shifttowards other sectors and domestic work, which rose slightly.
It appears therefore that, despite unemployment remaining high in Italy, some unskilled jobs are beingshunned by Italians and provide job opportunities for foreigners. These are mainly jobs connected with tourismand seasonal activities, in agriculture and the construction sector and, lastly, family service jobs (childcare, house-hold services, care of the elderly). In this regard, demand for low-paid labour should remain strong because of theageing of the Italian population and the fact that home help is often used rather than public services.
Demand for foreign labour also varies from region to region. For example, in the Northeast, a traditionallyindustrial region, foreigners mainly work in the industrial sector and construction, while agricultural activityremains highly seasonal and demand for family services is limited. In the Northwest, foreigners are primarilyemployed in the mining industry and services (especially in Brescia and Milan). Lastly, in the regions of theCentre and the South, demand for labour is chiefly in the field of family services, except for a few industries inthe Centre that also employ some foreign workers.
Seasonal work by migrant workers continued to increase in 1999 (up by 23.5% over 1998) and there weremore than 20 000 such workers according to official figures. This means that the number of foreign seasonalworkers has risen more than tenfold since 1992. This figure reflects improved registration and a betteradapted legislative framework and shows that some illegal workers have been regularised by being issuedwith seasonal contracts. More generally, this increase in seasonal work is also part of a policy aimed at intro-ducing greater labour market flexibility and developing part-time work.
Although seasonal workers are predominantly men (over two-thirds), the share of women has been risingfor a number of years and doubled between 1996 and 1999.
Labour market integration
After rising continuously during the 1990s, the number of unemployed foreign workers seems to have lev-elled off and even fallen in 1999. The improved economic conditions and labour market situation have had apositive impact on unemployment among foreign workers.
The situation has improved considerably for young jobless under the age of 30, their share in the total numberof unemployed foreign workers falling by several points between 1998 and 1999. However, the more favourableeconomic situation has not reduced the share of foreigners in long-term unemployment. In 1999, 40% of unem-ployed foreigners had been jobless for longer than one year, which was nearly two points higher than in 1998, whilethe share of the short-term unemployed (under three months) fell by two points over the same period.
Insufficient data are available to calculate an unemployment rate for foreigners that can be comparedwith the overall unemployment rate. Although 204 573 non-EU unemployed were registered in 1999

Trends in International Migration
196
© OECD 2001
(see Table III.19), there is no reliable figure that can be used to evaluate accurately the number of non-EU for-eigners in the labour force. However, as regards the total number of non-EU foreigners officially present inItaly, it can be deduced that, as in traditional immigration countries and perhaps even more so, foreign work-ers in Italy are more vulnerable to unemployment and job insecurity, even though an improvement in the eco-nomic situation, when it happens, does also have a positive impact in this regard.
4. Policy developments
The impact of the new Immigration Act (1999)
The new 1998 Immigration Act introduced three objectives with regard to regulating immigration flowsand integrating foreigners: to regulate entries on the basis of annual quotas for countries set by the govern-ment; to step up the enforcement of measures to prevent illegal immigration and smuggling of immigrants;and to promote the integration of foreigners already in Italy.
Two years after this act was passed, only the second point has been fully achieved, stricter measures tocombat illegal entry having been implemented. Between 1998 and 1999, the number of illegal immigrantsdeported (escorted to the border or sent back to their country of origin) nearly tripled. These figures, whichwere stable at fewer than 9 000 in 1998, rose to nearly 25 000 in 1999. The illegal immigrants escorted to theborder were mainly European (roughly two-thirds) and African (just under one-third).
The problem of quotas has yet to be settled: the procedure for setting quotas remains unclear, eventhough the Ministry of the Interior has established quotas for some nationalities and sent instructions to thevarious regional authorities. As for the third point on integration, it remains partially suspended, as it has notbeen possible to implement all the measures contained in the Act. However, the integration of foreigners isnot only an institutional matter but also a de facto process that is often only observed after the event.
Schooling of immigrant children
In the early stages of the immigration process, very few immigrant children were enrolled in school inItaly. For example, in 1985 there were only a few thousand foreign children in the school population (9 134).Since then, enrolments of foreign children have grown steadily and rapidly. In 1999, 119 679 foreign childrenwere enrolled, which was a 40% increase on 1998 and accounted for 1.6% of the total school population. Thisincrease shows, like the other indicators mentioned above, that immigration in Italy is becoming more longterm. This is fundamental since school is the primary means by which immigrant children become integratedinto the society of receiving countries.
Most of these children are in elementary school, with few in secondary school as yet, but secondaryschool enrolments did rise sharply compared to 1998 (up 54%).
However, not all minors are enrolled in school, in particular several thousand unaccompanied minors,which poses a serious problem of integration.
Remittances
In 1998, for the first time, net remittances were negative, i.e. foreigners residing in Italy transferred largeramounts of funds to their families abroad than did Italians living abroad. This trend reflects the growing impor-tance of work-related immigration. Total remittances increased by 30% between 1998 and 1999. There was aparticularly large increase in transfers to EU countries, but also to Central and Eastern Europe and the WestAfrican and Southern Asian countries, although the amount of remittances to the North African countriesdecreased.
In line with the distribution of foreigners in Italy, these remittances came mainly from Central and North-ern Italy.
Illegal immigration and the regularisation procedure: initial assessment
Despite stricter enforcement, illegal immigration has not stopped in Italy and is still very difficult to esti-mate. Illegal immigrants mainly arrive along the southern and south-eastern coast (Salento, Bari, Brindisi,

Japan
197
© OECD 2001
Pantelleria, Lampedusa) and the Ionian coast of Calabria. However, in the absence of statistics, it can beassumed that the number of illegal immigrants in Italy in 1999 was sharply up on 1998 (between 230 000 and290 000 for 1998).
A number of steps have been taken to deal with the problem of illegal entries: readmission agreements(which have reduced the number of illegal immigrants via the Mediterranean), bilateral agreements with thecountries of origin, with the possibility of raising quotas for legal immigration.
Lastly, it is possible to make an initial assessment of the regularisation programme launched in 1998 (thefourth such programme in thirteen years). To be regularised, foreigners had to meet the three following crite-ria: to have been in Italy since 27 March 1998, to have a salaried employment contract or provide proof thatthey are engaged in a professional activity and to have suitable housing. Initially limited to 20 000, the numberof workers to be regularised was ultimately raised to 38 000, with a minimum quota for Albanians (3 000),Moroccans (1 500) and Tunisians (1 500). In January 2000, just under 100 000 applications had been filed, butonly 39 % of them had been processed, so the final results of this regularisation are not yet available.
Japan
Introduction
In spite of the continued recession, the Ministry of Labour estimates that the number of foreigners (notincluding permanent residents, but including estimates of illegal workers) working in Japan remained constantin 1999 at approximately 670 000; this despite a 7% decrease in the number of visa overstayers to just under252 000, the overwhelming majority of whom are understood to be employed. Though the number of long-term residents in employment remained almost unchanged at 220 500, the total number of foreign nationalsresiding with restricted permission to work increased by almost 6% to 125 700. This was a continuation of thesustained upward trend observed since 1996. Half of the increase in this category was attributable to theincrease in the stock of entertainers. Significant rises were also recorded in the number of intra-companytransferees and in the estimated number of students engaged in part-time work. Although the inflow of engi-neers was one third lower in 1999, their stock rose by 3% to 15 670. The Ministry of Labour is undertakingresearch to gauge the extent of labour shortages in the IT sector and the labour market behaviour of foreignworkers possessing IT skills. The authorities will decide on the basis of the results of this investigationwhether or not it is necessary to introduce measures to further facilitate the entry of foreign IT workers andwhat form any such measures should take.
1. Trends in migration movements
Only those staying for more than 90 days (the registration of whom is obligatory under the Alien Registra-tion Law) are considered here. These entrants are assigned a residence status according to their economicactivity in Japan or their personal status as a foreigner eligible to enter and reside there.
Having increased by 10% in 1995, 45% in 1996 and by over two thirds in 1997, the number of personsentering as “long-term residents” (the overwhelming majority of whom are the grandchildren and laterdescendants of Japanese emigrants to South America) fell by almost 30% in 1998. This was attributed in largepart to the extremely unfavourable labour market situation for foreigners not possessing sought-after skills.Although the labour market situation remains weak for this category of labour, their inflow rose by 9%in 1999 to slightly more than 50 500 (see Table III.20).
Entries of individuals with restricted permission to work totalled 108 000, an increase of 6% on the previ-ous year. This overall increase was comprised, on the one hand, of an almost 12% rise in the inflow of enter-tainers who accounted for over three quarters of the total inflow and, on the other, of declines in othersignificant components of the inflow, most notably that of engineers the entries of whom declined by one third(see Table III.21).
JAPAN

Trends in International Migration
198
© OECD 2001
Table III.20. Current figures on migration flows and stocks of foreign population and labour force, Japan
Thousands
1. Excluding temporary visitors and re-entries.2. Registered population as of 1 October of the years indicated.3. Data are based on registered foreign nationals as of 31 December of the years indicated. The figures include foreigners staying in Japan for more than
90 days.4. Essentially Korean nationals. A “special permanent residents” category was introduced in 1992. It includes Koreans and Taiwanese nationals who lost their
Japanese nationality as a consequence of the Peace Treaty of 1952 but who had continued to reside permanently in Japan.5. Estimates including illegal workers. Excluding permanent residents.6. Permanent residents, spouses or children of Japanese nationals, spouses or children of permanent residents and long-term residents have no restriction
imposed to the kind of activities they can engage in Japan and are excluded from these data.7. Estimates made by the Ministry of Foreign Affairs.8. Estimates made by the Ministry of Justice on the basis of the number of overstayers.Sources: Ministry of Justice; Ministry of Foreign Affairs; Ministry of Labour.
1996 1997 1998 1999
Inflows of foreign nationals1 225.4 274.8 265.5 281.9
Stock of total population2 125 864.0 126 166.0 126 486.0 126 686.0
Stock of foreign nationals3 1 415.1 1 482.7 1 512.1 1 556.1By country of origin
Korea 657.2 645.4 638.8 636.5China (including Chinese Taipei) 234.3 252.2 272.2 294.2Brazil 201.8 233.3 222.2 224.3Philippines 84.5 93.3 105.3 115.7United States 44.2 43.7 42.8 42.8Other country 193.1 214.8 230.8 242.6
By status of residencePermanent residents4 626.0 625.5 626.8 635.7Long-term residents 438.2 483.7 482.3 492.5of which:
Spouse or child of Japanese national 258.8 274.5 264.8 270.8Spouse or child of permanent resident 6.5 6.3 6.2 6.4Other 172.9 202.9 211.3 215.3
Foreign workers with permission of employment 98.3 107.3 119.0 125.7Other (accompanying family, student, trainee etc.) 252.6 266.2 284.0 302.1
Naturalisations 14.5 15.1 14.8 16.1of which:
Korea 9.9 9.7 9.6 10.1China 4.0 4.7 4.6 5.3
Foreign labour force (estimates)5 630 660 670 670
Foreign residents with permission of employment by status of residence6
Specialist in humanities or international services 27.4 29.9 31.3 31.8Entertainer 20.1 22.2 28.9 32.3Engineer 11.1 12.9 15.2 15.7Skilled labour 8.8 9.6 10.0 10.5Instructor 7.5 7.8 7.9 8.1Intra-company transferee 5.9 6.4 6.6 7.4Professor 4.6 5.1 5.4 5.9Investor and business manager 5.0 5.0 5.1 5.4Religious activities 5.0 5.0 4.9 5.0Researcher 2.0 2.5 2.8 2.9Journalist 0.5 0.4 0.4 0.4Artist 0.3 0.3 0.3 0.4Medical services 0.1 0.1 0.1 0.1Legal and accounting services 0.1 0.1 0.1 0.1Total 98.3 107.3 119.0 125.7
Trainees and Working Holiday Makers 8.6 12.1 19.6 23.3
Estimates of students engaged in part time jobs 30.1 32.2 38.0 47.0
Estimates of Japanese descents engaged in gainful activities7 211.2 234.1 220.8 220.5
Illegal workers8 280 280 270 252
Number of foreign nationals deported 54.3 49.6 48.5 55.2

Japan
199
© OECD 2001
Table III.21. Inflows of foreigners by status of residence, 1996-1999, Japan
Thousands
1. Excluding temporary visitors and re-entries.Source: Ministry of Justice.
1996 1997 1998 1999% change 1998-1999
Total1 225.4 274.8 265.5 281.9 6.2Diplomat and official 19.0 18.4 16.5 18.1 9.9
Residents with restricted permission to work 78.5 94.0 101.9 108.0 6.0of which :
Entertainer 54.0 67.5 73.8 82.3 11.5Specialist in humanities or international services 6.1 6.7 7.2 6.5 –9.6Engineer 4.4 5.1 5.7 3.7 –35.1Intra-company transferee 2.8 3.4 3.5 3.8 8.6Instructor 2.9 3.1 3.3 3.2 –3.0Skilled labour 3.3 2.8 3.0 3.4 13.3Professor 1.3 1.5 1.4 1.5 8.1Religious activities 1.2 1.2 1.2 1.2 2.4Investor and business manager 1.1 1.1 1.2 1.0 –18.8Researcher 1.1 1.3 1.2 1.1 –8.3Journalist 0.2 0.2 0.2 0.2 –10.0Artist 0.1 0.1 0.1 0.2 59.0
Cultural activities 3.9 4.1 3.7 3.7 –0.2Student 21.2 24.2 28.0 33.9 21.0Trainee 45.5 49.6 49.8 48.0 –3.6Dependant 15.2 16.1 16.1 16.7 3.7"Designated activities" 3.2 3.3 3.0 2.9 –2.2
Long-term residents 38.9 65.3 46.4 50.5 8.9of which:
Spouse and child of Japanese national 25.9 31.6 24.6 26.7 8.7Spouse and child of permanent resident 0.2 0.3 0.4 0.3 –25.0Other 12.8 33.4 21.5 23.5 9.1
Box III.5. Policy on the entry of trainees and the conversion of their status to technical interns
Accompanying the growth in the direct investment by Japanese companies in other Asian countries theemployees of their overseas affiliates or joint ventures have been coming to Japan as trainees since the 1960s.The companies’ three primary objectives have been to compensate for their foreign employees’ lack of basiceducation and general training, to enhance their understanding of the companies’ products and production pro-cesses and to encourage their long-term commitment.
Since 1990, small and medium sized enterprises without an overseas presence have been permitted to bringin overseas trainees. They typically do so through intermediary bodies such as Chambers of Commerce andemployers associations; this exempts them from the 5% ceiling on the proportion of trainees to regular workers.
The Technical Internship Training Programme, an extension of the general trainee scheme, was introducedin 1993 under the supervision of the Japan International Training co-operation Organisation (JITCO). Within theframework of this programme, regular trainees, who pass certain skill tests after a period of training, can becometechnical intern trainees thereby changing their status of residence to come under the “designated activities’ cat-egory and so becoming entitled to the same rights as their Japanese colleagues vis-à-vis the labour standard law,the minimum wage law and other labour-related laws. In addition to being operational, technical intern traineesplay an important role in supervising and assisting the regular trainees. In 1997 their maximum period of stay wasextended from two years to three. JITCO has concluded agreements as a record of discussions with the governmentsof China, India, Indonesia, Laos, Myanmar, Mongolia, Peru, the Philippines, Sri Lanka, Thailand, Uzbekistan andVietnam regarding the exchange of information on trainees and on sending organisations.

Trends in International Migration
200
© OECD 2001
Entries of trainees, which had risen at double-digit rates during the period 1995-1997 and then by only 1%in 1998 actually declined in 1999, by almost 4% to 48 000. As in previous years, nine out of ten were from Asia,of whom half were from mainland China; Indonesia, the Philippines and Thailand together accounted for a fur-ther 30%.
Inflows of students, which have over recent years displayed a marked upward trend, increased by a fur-ther 20% in 1999 to 33 900. The number of such these students engaged in part-time work has been estimatedat 47 000.
Illegal immigration
In May 1997, in response to the sharp rise that was taking place in the number of people detected as hav-ing entered the country without proper documentation the authorities amended the Immigration Act in orderto provide for the imposition of severe penalties on those found to have organised or abetted the smugglingof aliens. This was complemented by a further amendment in August 1999 which removed the statute of limi-tations on the crime of illegal entry, increased the penalties that could be imposed on illegal entrants andextended from one to five years the no re-entry period for those deported. The amendment came into force inFebruary 2000.
Almost 9 350 illegal entrants were detected in 1999. This was 25% more than in 1998 and nearly twicethe 1996 figure. Reflecting the increased use of Japan as a transit destination for North America, almost threequarters of the overall increase was due to the 28% rise in those detected at airports.
Almost 55 200 persons were deported in 1999. Although this was an increase of nearly 14% on 1998, thefigure was in line with those prevailing in the mid-1990s. As in previous years, almost 85% had been workingillegally and 80% of the overall total were visa overstayers.
Refugees and asylum seekers
Though Japan receives few applications for asylum their number has, however, been displaying an upwardtrend. Having received a total of fewer than 1 200 applications during the period 1982-95, 147 applicationswere recorded in 1996, 242 in 1997,133 in 1998 and 260 in 1999; 159 applications were made during the first8 months of 2000. Between 1982 and August 2000 a total of 250 applications had been accepted. The authori-ties have reported that the asylum application procedure is increasingly being abused, in particular by beingused as a means of remaining in the country in order to take up employment during the period that the appli-cation is being considered.
2. Structure and changes in the foreign population
Numerical trends
The recorded stock of foreign nationals (those staying for more than 90 days and registered as requiredunder the Alien Registration Law), stood at just over 1.5 million (1.2% of the total population) at the endof 1999, a 3% rise on 1998 (see Table III.20). Koreans are the most numerous, accounting for over 40% of thetotal; their numbers are steadily and slowly declining however. As was the case in 1998, above the generaltrend increases in the second largest group, the Chinese, and the fourth most important, the Filipinos, explainthe major part of the overall increase.
Numbering 637 700, permanent residents account for 41% of the foreign population. It should be borne inmind that permanent residence is accorded only after a fairly extensive period of stay. Of these persons, justover 80% are special permanent residents, i.e. those Koreans who had lost Japanese nationality on the basis ofthe Treaty of Peace with Japan, and their descendants who, born of foreign parents, are not automatically enti-tled to Japanese nationality. Whereas the number of those with ordinary permanent residence statusincreased by 21% in 1999, the number with the special status declined by 2%.
The stock of long-term residents increased by 2% to 492 500. They account for just under one third of thetotal foreign population and have unrestricted permission to take up employment. Slightly over half of theseare the spouses or children of Japanese nationals. The remainder are ethnic Japanese (the grandchildren and

Japan
201
© OECD 2001
later descendants of Japanese emigrants); an almost negligible number are the spouses or children of perma-nent residents (who themselves are essentially composed of Korean nationals).
Visa overstayers
Through the matching of embarkation and disembarkation cards the number of foreign nationals over-staying their legal period of stay has been estimated twice yearly since 1992. Due, on the one hand, to tight-ened visa control, improved co-operation between the agencies charged with tackling the problem and theimplementation of a publicity campaign dissuading employers from hiring illegal workers their number hasbeen declining steadily since 1993. These factors, along with the continued deterioration in the state of thelabour market, explain why the total number of undocumented residents fell by 7% during 1999 bringing theend of year figure down to 251 700. Significant declines were recorded in all of the principal national groups.
Naturalisations
Having followed a steadily upward trend through to 1997, the number of naturalisations declined slightlyin 1998. In 1999, the number rose once more, by 9% to just over 16 100. Koreans continue to comprise for themajority of those taking citizenship though the proportion is declining. In 1999 they accounted for almost twothirds, while the Chinese accounted for one third. The majority had previously possessed permanent residentstatus.
3. Migration and the labour market
In spite of the recession, the Ministry of Labour estimates that the number of foreigners (not includ-ing permanent residents) working in Japan remained constant in 1999 at approximately 670 000; thisdespite a 19 350 decrease in the number of visa overstayers, the overwhelming majority of whom areunderstood to be employed (see Table III.20). Though the number of long-term residents in employmentremained almost unchanged at 220 500, the total number of foreign nationals residing with restricted per-mission to work increased by almost 6% to 125 700. This was a continuation of the sustained upward trendobserved since 1996. Half of the increase in this category was attributable to the increase in the stock ofentertainers. Significant rises were also recorded in the following categories: intra-company transferees(by 11% to 7 380); those classified under “designated activities” (by 19% to 23 300, this following 60% risein their number in 1998) the overwhelming majority of whom are former general trainees who have beenpermitted to change their status of residence from trainee to technical intern; and, the estimated numberof students engaged in part-time work (by 23% to 47 000). Although the inflow of engineers had declinedsubstantially, their stock rose by 3% in 1999 to 15 670. It should be noted that whilst technical intern train-ees are included in this estimate of foreign workers general trainees are not. Official stock data for theirnumber are unavailable; the estimate of 115 000 quoted in the previous two editions of this report islikely to remain broadly valid.
4. Policy developments
In June 1999 the government approved a report entitled “Ideal Society and Policies for Economic Rebirth”and in August of the same year approved the “9th Basic Plan for Employment Measures”. These two documentsset out, inter alia, the government’s overall policy direction vis-à-vis foreign workers through to 2010. In essence,the policy line adopted is one of facilitating the entry of foreigners possessing professional or technical skillswhilst leaving open for further careful deliberation the issue of permitting the entry of unskilled workers.
The Ministry of Labour is undertaking research to gauge the extent of labour shortages in the IT sector andthe labour market behaviour of foreign workers possessing IT skills. Based on the results of this investigation,the authorities will decide whether or not it is necessary to introduce measures to further facilitate the entry offoreign IT workers and what form any such measures should take.

Trends in International Migration
202
© OECD 2001
Korea
Introduction
Due primarily to buoyant export demand, the Korean economy pulled out of recession in 1999 recordingin that year GDP growth of just under 11% (in 1998 the economy contracted by nearly 7%). Growth was of theorder of 9% in 2000; it is expected to decelerate to a more sustainable rate of around 5% in 2001. The rapidrecovery has been accompanied by sharply increased labour demand. From 1.5 million at the height of the cri-sis in 1998 the number of unemployed has been falling steadily. Numbering 780 000 in May 2001 theyaccounted for slightly more than 3.5% of the total labour force.
At present, foreign workers account for just over 1% of the total workforce. The market for workers pre-pared to take up unskilled employment in the most demanding and low prestige jobs is very tight. For thisreason, the authorities are faced with considerable difficulties in their attempts to combat the undocumentedemployment of foreign workers. Against this background, the Korean government put forward in 2000 a plan topermit openly the immigration of unskilled workers, replacing the present system whereby the entry of suchworkers is allowed only under the auspices of a quota-governed trainee scheme. The plan met with strongopposition from employers and has for this reason been withdrawn.
1. Structure and changes in the foreign population
The rate of growth in the number of foreign nationals, staying more than 90 days and registered as requiredunder the Emigration and Immigration Act, having remained low through to 1991 increased rapidly followingthe 1992 normalisation of diplomatic relations with China. This normalisation led to substantial increases both inthe inflows from China of Chinese and of ethnic Koreans and in the number of trainees entering from other neigh-bouring countries. These increases notwithstanding, at the end of 1997 they numbered only 177 000, less thanhalf of 1% of the total population. Following an over 16% fall in 1998, their number increased by 28% in 1999 tojust over 189 000. In line with the medium term trend of, on the one hand, the rising relative importance of theChinese community and, on the other, the otherwise increasing diversification in the range of origin countries,just under one quarter of the increase in 1999 was due the re-continuation of the rise in the number of personsoriginating from China and a further two thirds was attributable increases in the numbers of those originatingfrom countries other than the six most important, in particular Vietnam and Bangladesh.
2. Migration and the labour market
Migration for employment and work permits
There are three types of migrant worker in Korea: the legally employed; de facto employees acceptedunder the Industrial and Technical Training Programme (ITTP); and the illegally employed. All categories com-bined, they account for slightly more than 1% of the total workforce.
The total stock of foreign workers, having declined by 30% during 1998, increased by over one thirdin 1999. The rebound was most marked for trainees: an over 50% rise in 1999 brought their number up to over98 000, almost 10% more than the pre-crisis figure (see Table III.22). The number of illegal workers rose by overone third during 1999 bringing their total to 135 000 at the end of the year, just over 90% of the pre-crisis figure.The 13% increase in the number of skilled workers present at the end of 1999 brought their number up to12 600, equivalent to 85% of the pre-crisis figure. During 2000, the number of skilled workers rose by a further40% to 17 700. One third of this rise was attributable to a 75% increase in the number of entertainers; a further25% was due to a one quarter increase in the number of language teachers. The number of visa overstayersrose by over one quarter to 172 500; data on trainees have not yet been made available.
Legal employment of foreigners
The legal migrant workers, comprised essentially of professionals, teachers, technicians and entertainers,are all regarded by the authorities as being skilled (see Table III.22) for a numerical breakdown of these cate-gories). Shortly before the onset of the crisis the government had revised the Immigration and Emigration Law
KOREA
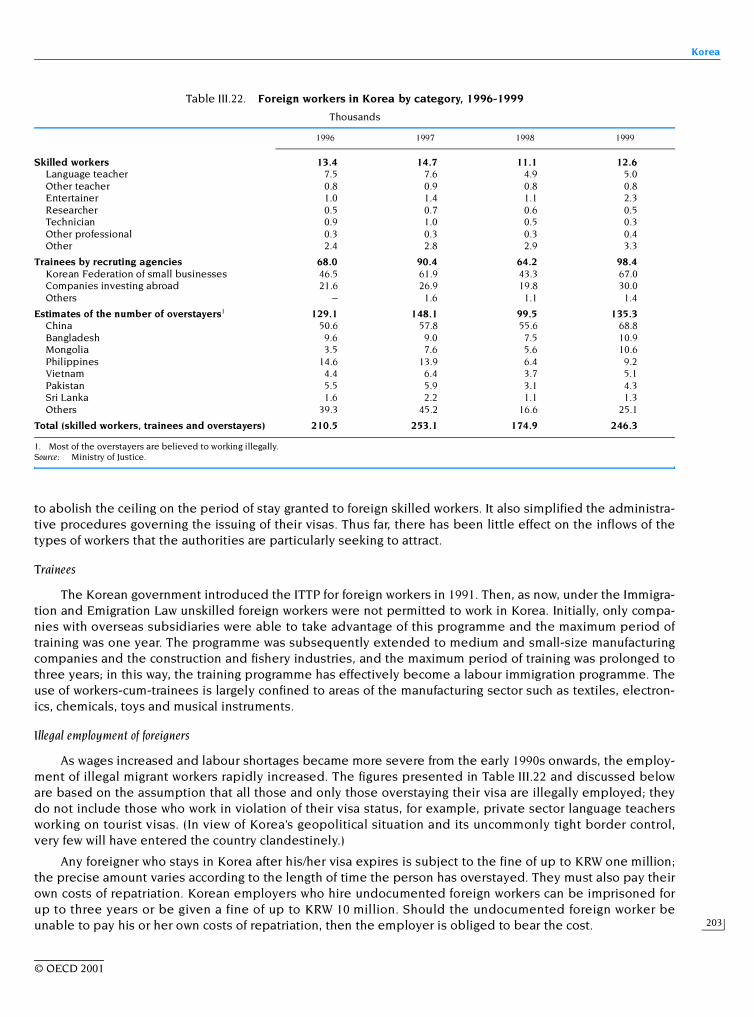
Korea
203
© OECD 2001
to abolish the ceiling on the period of stay granted to foreign skilled workers. It also simplified the administra-tive procedures governing the issuing of their visas. Thus far, there has been little effect on the inflows of thetypes of workers that the authorities are particularly seeking to attract.
Trainees
The Korean government introduced the ITTP for foreign workers in 1991. Then, as now, under the Immigra-tion and Emigration Law unskilled foreign workers were not permitted to work in Korea. Initially, only compa-nies with overseas subsidiaries were able to take advantage of this programme and the maximum period oftraining was one year. The programme was subsequently extended to medium and small-size manufacturingcompanies and the construction and fishery industries, and the maximum period of training was prolonged tothree years; in this way, the training programme has effectively become a labour immigration programme. Theuse of workers-cum-trainees is largely confined to areas of the manufacturing sector such as textiles, electron-ics, chemicals, toys and musical instruments.
Illegal employment of foreigners
As wages increased and labour shortages became more severe from the early 1990s onwards, the employ-ment of illegal migrant workers rapidly increased. The figures presented in Table III.22 and discussed beloware based on the assumption that all those and only those overstaying their visa are illegally employed; theydo not include those who work in violation of their visa status, for example, private sector language teachersworking on tourist visas. (In view of Korea’s geopolitical situation and its uncommonly tight border control,very few will have entered the country clandestinely.)
Any foreigner who stays in Korea after his/her visa expires is subject to the fine of up to KRW one million;the precise amount varies according to the length of time the person has overstayed. They must also pay theirown costs of repatriation. Korean employers who hire undocumented foreign workers can be imprisoned forup to three years or be given a fine of up to KRW 10 million. Should the undocumented foreign worker beunable to pay his or her own costs of repatriation, then the employer is obliged to bear the cost.
Table III.22. Foreign workers in Korea by category, 1996-1999
Thousands
1. Most of the overstayers are believed to working illegally.Source: Ministry of Justice.
1996 1997 1998 1999
Skilled workers 13.4 14.7 11.1 12.6Language teacher 7.5 7.6 4.9 5.0Other teacher 0.8 0.9 0.8 0.8Entertainer 1.0 1.4 1.1 2.3Researcher 0.5 0.7 0.6 0.5Technician 0.9 1.0 0.5 0.3Other professional 0.3 0.3 0.3 0.4Other 2.4 2.8 2.9 3.3
Trainees by recruting agencies 68.0 90.4 64.2 98.4Korean Federation of small businesses 46.5 61.9 43.3 67.0Companies investing abroad 21.6 26.9 19.8 30.0Others – 1.6 1.1 1.4
Estimates of the number of overstayers1 129.1 148.1 99.5 135.3China 50.6 57.8 55.6 68.8Bangladesh 9.6 9.0 7.5 10.9Mongolia 3.5 7.6 5.6 10.6Philippines 14.6 13.9 6.4 9.2Vietnam 4.4 6.4 3.7 5.1Pakistan 5.5 5.9 3.1 4.3Sri Lanka 1.6 2.2 1.1 1.3Others 39.3 45.2 16.6 25.1
Total (skilled workers, trainees and overstayers) 210.5 253.1 174.9 246.3

Trends in International Migration
204
© OECD 2001
3. Policy developments
The rapid recovery of the Korean economy has brought the topic of foreign workers back to the forefrontof political debate. In 2000, the Korean government put forward a plan to transform the current training systeminto an employment permit system and thereby bring to an end the official prohibition on the entry ofunskilled foreign workers. Faced, however, with strong opposition from employers fearful of the impact thatthe abolition of the programme would have on their labour costs, the government has withdrawn its plan.
Luxembourg
Introduction
The growth rate of the Luxembourg economy is considerably higher than that of the other OECD coun-tries. Real GDP growth stood at 7.5% in 1999, well above the long-term average of 5.5% since 1985. The servicesector is the mainstay of economic activity, and foreign cross-border workers are the main beneficiaries of thisgrowth. Luxembourg is also the country with the largest share of foreigners in the total population. This immi-gration is primarily of European, and in particular Portuguese origin, and it enables the country to maintain arelatively high population growth, with annual rates above 1%.
LUXEMBOURG
Box III.6. The Industrial and Technical Training Programme (ITTP)
The Industrial and Technical Training Programme (ITTP) was introduced in 1992 as a compromise betweenthose in favour and those opposed to the immigration of unskilled foreign workers. Its initial stated purpose wasto permit foreign workers employed by the overseas subsidiaries of Korean firms to come to Korea for up to oneyear in order to upgrade their skills. Then, as now, unskilled foreign workers were not permitted to work in Korea.Later, the programme was extended to medium and small size companies in the manufacturing sector sufferingfrom labour shortages; de facto, their trainees are workers. In this way, the training programme has effectivelybecome a programme of unskilled labour importation.
Approximately one third of the trainees admitted under the ITTP are recruited directly by the overseas sub-sidiaries of Korean firms. Almost all of the other two thirds enter under the auspices of the Korea Federation ofSmall Businesses (KFSB). Almost negligible numbers are admitted through the National Federation of FisheriesCo-operatives (NFFC) which has been permitted to bring in trainees since 1997 and latterly the Korean Construc-tion Association (KCA). Each of the three federations requires approval from its relevant Ministry for the firms itselects to receive trainees and the numbers allocated to them. Various ministries and government agencies alsoadmit small numbers of trainees; the number of such admissions has risen rapidly over recent years.
Though the workers-cum-trainees are guaranteed a minimum wage (typically below that of the market, whichexplains why large numbers of them abscond from their initial employer to take up undocumented employment)and are covered by the industrial accident and sickness insurance schemes, some labour rights, such as the rightto strike, are not at present granted to them. The maximum period of their stay has been extended twice,in 1993 and in 1996, to bring it up to three years. In 1997, the last occasion when the possibility of introducing awork permit system for unskilled workers was debated, a revision was made to the ITTP allowing trainees to beemployed as legal workers upon completion of a certain period of training.
Many academics and policymakers have raised the question of whether there is not a better way of maximis-ing the economic benefits from importing unskilled workers without discriminating against them economicallyand socially. The employment levy systems implemented in Singapore and Chinese Taipei as a means of manag-ing the short-term immigration of unskilled workers have been cited as possible models.

Luxembourg
205
© OECD 2001
1. Trends in migration movements
Inflows and outflows of foreigners
The relatively high population growth of recent years is mainly due to a net immigration gain. Some13 000 entries and 8 000 exits were recorded in 1999, giving a net gain of just over 4 700 (see Table III.23).Europe is the main source of the inflows, with 60% of new arrivals being of European origin. In 1999, for the firsttime, there were more French than Portuguese immigrants (2 200 and 2 100 respectively), followed byBelgians, Germans and Italians. The vast majority of new immigrants are aged between 20 and 34. Immigrantshave a strong impact on the birth rate, for the foreign community (especially asylum seekers) has the highestbirth rate and accounts for nearly 50% of births in Luxembourg.
Refugees and asylum seekers
Until 1987, most asylum seekers came under quotas accepted by the Luxembourg Government as part ofinternational refugee resettlement programmes. Until 1995, there were between 200 and 400 applicationsyearly. In 1998 and 1999, with the events in the Federal Republic of Yugoslavia and other nearby countries,there was a sharp r ise in th e numbe r o f asylum seekers and applicat ions to be processed.Between 1997 and 1998, applications rose by nearly 200%, followed by a further 80% increase in 1999.
2. Structure and changes in the foreign population
Numerical trends
The share of foreigners in the population continues to grow. At 1 January 2000, the foreign population wasestimated at 159 400, or 36.6% of the total population of Luxembourg. Nearly 90% of them come from one ofthe 15 EU countries (see Table III.23).
A more detailed breakdown by nationality shows that the Portuguese community is still the largest group,accounting for more than a third of the foreign population. The Italian population has been stable for the pastten years at approximately 20 000. Some 44 000 foreigners come from bordering countries (France, Belgiumand Germany).
Mixed marriages
After rising sharply until 1995, the number of mixed marriages has levelled off at around 500, although ithas been rising slightly every year. Mixed marriages accounted for 26% of all marriages celebrated in 1999.
Naturalisations
To acquire Luxembourg nationality, applicants must be over 18 years of age and have resided in Luxembourgfor at least ten years. The latter requirement may be reduced to five years for applicants born in Luxembourg,or if they have lost their citizenship, are widowed or divorced from a native-born Luxembourg national withwhom they had more than one child and at least one of whom lives in Luxembourg, or if they are stateless orrecognised by the authorities as refugees under the Geneva Convention.
Foreigners may also opt for Luxembourg nationality if they marry a Luxembourg national or if they are theadopted child of a Luxembourg national. Some 50 000 people meet these criteria, yet the number of naturali-sations is low (averaging just over 600 per year). There are two explanations for this low figure: legal reasons,since applicants are required to give up their previous citizenship, and the nationality of immigrants, sincemost of them are European and therefore have little to gain from acquiring Luxembourg nationality.
3. Migration and the labour market
Labour market trends in recent years have been characterised by a continual decline in the share ofnationals in salaried employment. Although this share was still well above 50% at the beginning of the 1990s(54% in 1990), it had fallen to some 40% in 1999 (see Table III.23) and, probably, 38% in 2000. The job market is

Tre
nds in Inte
rnatio
nal M
igration
206
© O
EC
D 2001
Table III.23. Current figures on the components of total population change, on flows and stocks of foreign population and labour force, Luxembourg
Figures in thousands unless otherwise indicated
1. Data are from population registers and refer to the population on 31 December of the years indicated.2. Children acquiring nationality as a consequence of the naturalisation of their parents are excluded.3. Data cover arrivals of foreign workers to Luxembourg and foreign residents entering the labour market for the first time.4. Salaried workers as of 31 March of each year.5. Annual average.Sources: STATEC; Inspection générale de la sécurité sociale (IGSS); Administration de l'emploi.
1996 1997 1998 1999 1996 1997 1998 1999
Components of total population change Inflows of foreign workers3 18.3 18.6 22.0 24.2Natural increase 1.8 1.6 1.5 1.8 of which: Women 6.7 6.4 6.8 8.2of which: Foreigners 1.9 1.9 2.0 2.2 Inflows by region or country of originNet migration 3.7 3.8 4.1 4.7 EU 17.2 17.7 21.0 23.1of which: Foreigners 3.7 3.6 3.9 4.9 of which:Population (31 December) 418.3 423.7 429.2 435.7 France 8.1 8.6 10.2 11.1of which: Foreigners 142.8 147.7 152.9 159.4 Belgium 2.9 3.0 3.4 4.0
Germany 2.5 2.6 3.2 3.5Migration flows by nationality Portugal 2.1 1.8 2.2 2.4
Inflows 10.0 10.4 11.6 12.8 Italy 0.6 0.6 0.8 0.7France 1.5 1.7 2.0 2.2 Other countries 1.1 0.9 1.0 1.1Portugal 2.0 1.9 2.0 2.1 Inflows by major industry divisionBelgium 1.1 1.2 1.2 1.3 Agriculture, forestry 0.2 0.1 0.1 ..Germany 0.7 0.7 0.8 0.7 Extractive and manufacturing industries 1.3 1.6 2.0 ..Other countries 4.7 4.9 5.6 6.5 Building 1.6 1.6 1.8 ..
Net migration 3.7 3.8 4.1 4.7 Trade, banks, insurances 9.3 10.1 12.6 ..France 0.6 0.8 0.9 1.1 Transport, communications 1.4 1.4 1.9 ..Belgium 0.6 0.7 0.5 0.6 Hotels 1.8 1.7 1.8 ..Portugal 0.7 0.6 0.6 0.3 Personal services 0.1 0.2 0.2 ..Germany 0.2 0.2 0.2 0.2 Other services 2.5 2.5 1.6 ..Other countries 1.6 1.6 1.9 2.5
Stock of workers (excluding unemployed)Foreign population by main nationality1 142.8 147.7 152.9 159.4 Total foreign employment 117.8 124.8 134.6 145.7
Portugal 53.1 54.5 55.9 57.0 Breakdown by nationality (%)4
Italy 19.8 19.9 20.0 20.1 Luxembourgers 44 41 40 40France 15.7 16.5 17.5 18.8 Resident and cross-border foreigners 56 59 60 60Belgium 12.4 13.2 13.8 14.5Germany 9.9 10.0 10.3 10.5 Stock of cross-border workers by nationality5 59.6 64.4 70.8 78.4Spain 2.8 2.9 .. .. France (% of total cross-borders) 51.7 52.3 52.7 52.9Other countries 29.1 30.7 35.4 38.5 Belgium (% of total cross-borders) 30.0 29.5 28.9 28.2
Germany (% of total cross-borders) 18.3 18.2 18.4 18.9Acquisition of nationality by country 779 749 631 549
of former nationality (units)2 Job-seekers (national definition) 5.7 6.4 5.5 5.4Italy 193 192 149 94 of which: Foreigners (% of total job seekers) 57.7 57.9 59.4 57.0France 85 79 53 43Germany 55 60 44 41Belgium 65 64 48 53Other countries 381 354 337 318
Mixed marriages (units) 514 554 500 539% of total marriages 24.4 27.6 25.0 25.8

Mexico
207
© OECD 2001
highly regional, some foreign cross-border and other workers being attracted by higher salaries. Employmentgrowth has mainly involved cross-border workers, whose share of total employment has risen from 16%in 1991 to 35% in 2000. Some 53% of cross-border workers come from France, 30% from Belgium and 20% fromGermany.
Nearly 70% of non-EU immigrants hold blue-collar jobs, while over 50% of cross-border workers are white-collar workers. Foreign workers are employed in industry and construction (30% of total foreign employment)and in commerce, banking and insurance.
The vast majority of foreign workers are European nationals (90%), the bulk being Portuguese (45%), French(12%) and German (5%). The second-ranking group is the African community, with only 2% of foreign workers.
According to the latest census data (1991), the age of the domestic labour force is higher than that ofthe foreign labour force. This is mainly due to the predominance of the Portuguese community, since half ofPortuguese workers are in the 25-39 age group.
4. Policy developments
Numerous regulations and laws aimed at promoting the integration of foreigners have been adopted.Among the measures enacted during the past three years, the following are worthy of mention:
• The Act of 19 July 1997 increasing the penalties applicable for the offence of slander or libel motivatedby the victim’s membership of an ethnic group, nation, race or particular religion. The penalties areeven more severe if the offence is committed by a law-enforcement officer.
• A series of acts on labour market regulation, such as the Act of 12 February 1999 on the implementationof a national employment plan prepared in the light of work of the European Council, the Act of29 April 1999 creating a right to a guaranteed minimum income, and the Act of 17 May 1999 on theaccess of EU nationals to the Luxembourg civil service.
• The Act of 18 March 2000 creating a system of temporary protection and a new procedure for reviewingasylum applications. Its objective is to speed up the asylum procedure.
Luxembourg also gives special attention to the integration of children of foreign origin into Luxembourg’sschools. Since 1991, the Ministry of National Education has been developing a general approach aimed at pro-moting the integration of these children on the basis of their needs, whatever their origin, the characteristics ofthe school system and language constraints. This approach is based on the principles of common education,trilingualism and equal opportunity.
What means do schools have of providing the basis for sustainable economic, social and cultural develop-ment? To answer this question, the cultural, educational and economic aspects are being taken into accountand an education project aimed at addressing all of these issues may be forthcoming. One of the goals is tofamiliarise foreign children with Luxembourg culture. At present, one of the answers provided by the ministe-rial authorities has been the creation of a pilot early-education project made mandatory for communes as ofthis year.
Mexico
Introduction
Boosted by a thriving US economy, the Mexican economy has seen strong growth over the last threeyears. Although inflation was still high in 2000 (at 8.9%), it was well down on previous years. Investor confi-dence has undoubtedly been encouraged by a series of structural reforms, aimed chiefly at the public sectorand the banking sector. Real GDP growth was 3.8% in 1999 and 6.9% in 2000. However, given the marked slow-down in the US economy, the outlook for 2001 is more subdued.
MEXICO

Trends in International Migration
208
© OECD 2001
Despite steadily larger inflows of foreign immigrants, particularly asylum-seekers from Guatemala, Mexicois still primarily a country of emigration. The United States exerts a strong pull on Mexican workers who, onceacross the border, are employed – often illegally – in low-skilled jobs in agriculture and the service sector.Mexico is now negotiating with the United States at the highest level in an attempt to improve working condi-tions for migrant workers and gain better control over migration flows.
1. Trends in migration movements
Emigration and returns of nationals
The border zone with the United States is probably one of the busiest in the world (see Table III.24).According to the official statistics for 1999, over 1.7 million Mexicans left the country for the United States (thedestination country for 99% of Mexican emigrants). This was an increase of approximately 9% on the previousyear. However, the true figure is hard to evaluate as little information is available on the numbers of emigrantsentering the United States illegally. In 2000, the US authorities escorted more than 1.3 million Mexicans backacross the border (1.17 million in 1999).
The study conducted for the Zapata Canyon project reveals that a substantial percentage of those escortedback across the border attempt to cross it again within 24 hours of their return to Mexico, and 75% within thenext few months. Half of them are caught within three days of entry. A typical Mexican wishing to leave thecountry for the United States is male (in 96% of cases) over 25 years of age, resident in an urban area and edu-cated to no more than secondary-school level. Over 51% of Mexicans interviewed had already worked in theUnited States (see Table III.25).
For some years now, the Mexican authorities have been focussing on the legal (national sovereignty) andhumanitarian (Human Rights) dimensions of immigration: issues that have loomed larger since “Operation Gate-keeper” and others. This is because potential immigrants are obliged to take greater risks at every attempt toenter the US, finding increasingly more remote and dangerous entry routes. The hunt for undocumentedimmigrants, undertaken in May 2000 by American ranchers near the border, has increased the need for con-structive dialogue and closer co-operation between the two countries.
Table III.24. Mexican emigration to the United States, 1911-19991
Thousands
1. Data refer to grants of permanent residence in the United States. Data refer to fiscal year (October toSeptember of the given year).
Source: US Department of Justice, 1999 Statistical Yearbook of the Immigration and Naturalization Service, forthcoming.
Period Numbersof which: Immigrants who had benefited
from the 1986 Immigration Reform and Control Act (IRCA)
1911-20 219.01921-30 459.31931-40 22.31941-50 60.61951-60 299.81961-70 453.91971-80 640.31981-90 1 655.8 962.71991-99 2 079.8 1 048.6
1989 405.7 339.21990 680.2 623.51991 947.9 894.91992 214.1 122.51993 126.6 17.51994 111.4 4.41995 90.0 3.01996 163.7 3.61997 146.9 2.01998 131.6 0.71999 147.6 ..

Mexico
209
© OECD 2001
Inflows and outflows of foreigners
Mexico issued some 1 700 new residence permits to foreign nationals in 1999 (1 200 in 1998 and2 900 in 1997), most of them to US (316) and Spanish nationals (223). Entry flows to Mexico are of course muchgreater than the statistics suggest. For example, in 1999, 10 500 foreign students entered Mexico as well as184 800 professionals under the North American Free Trade Agreement (NAFTA-FMN permits) and nearly28 800 temporary residents and consultants (NAFTA-FMVC permits). Entries under this latter category, intro-duced in 1995, have risen substantially (1995, 1 700; 1996, 11 400; 1998, 22 700) and were primarily Japanesenationals (26.5%), followed by Brazilian (11.9%), French (10.5%), German (7.2%), British (6.9%) and Korean (6.7%)nationals. Of these, almost 70% were businessmen, technicians (20.5%), consultants (6%) and intra-corporatetransferees (4.4%). Entries under NAFTA’s professional mobility provisions have also increased substantially(+40% from 1995 to 1999), and concerned mainly US nationals (over 95%) and a small percentage of Canadians.
Illegal immigration
There are increasing numbers of illegal immigrants in Mexico. The regularisation programme imple-mented in 2000 does provide a certain amount of information concerning these migrants. Between 1 Februaryand 31 May 2000, for example, 2 700 people applied to have their situation regularised, of which 600 wereGuatemalans, 425 were from El Salvador and 397 from Honduras. For regularisation to be possible, applicantshad to have been resident in Mexico for at least two years. Over the last six months of 2000, some3 000 people did in fact have their situation regularised. In 1999, over 125 400 illegal immigrants were escortedback over the border (136 000 in 2000).
There are estimated to be between 150 000 and 200 000 undocumented Guatemalans in Mexico. Anagreement was signed between Guatemala and Mexico in 1999 to legalise the status of a number of theseimmigrants. It supplements the 1996 amendments to the General Population Law granting “assimilated immi-grant” status and allowing Guatemalans to settle and take up employment in the country.
Table III.25. Socio-economic characteristics of undocumented Mexican immigrants to the United States, 1990, 1998-2000
Percentages
Source: Project Zapata Canyon. Survey of flows of undocumented Mexican immigrants as they cross the border of the United States, El Colegio de la FronteraNorte.
Men Women
1990 1998 1999 2000 1990 1998 1999 2000
Sex 86.1 95.5 96.2 .. 13.9 4.5 3.8 ..
AgeLess than 20 18.2 8.2 7.1 6.6 15.2 7.7 8.2 13.020 to 24 32.4 21.6 22.0 19.8 32.6 23.1 32.5 30.025 to 29 28.4 31.0 30.9 30.7 25.4 31.1 33.1 29.930 and more 21.0 39.2 40.0 42.9 26.7 38.1 26.2 27.0
Level of educationLess than elementary 23.7 15.9 20.6 10.1 22.4 5.9 9.0 6.1Elementary 34.5 43.9 40.1 36.0 34.2 49 45.9 38.1Secondary 30.7 33.7 31.3 47.8 34.2 39.7 34 48.6More than secondary 10.9 6.5 8.0 6.2 8.9 5.4 10.9 7.2No answer 0.1 – – – 0.3 – – –
Last job in MexicoFarm work 32.6 38.3 37.4 36.0 0.9 13.5 5.6 6.5Job in a city 56.0 58.5 57.4 56.3 41.6 59.7 51.1 51.3Unemployed 10.9 3.2 5.0 7.6 55.7 26.5 43.3 42.1No answer 0.4 0.1 0.2 0.1 1.7 0.2 – 0.1
Have you already had a job in the United States?Yes 44.7 46.8 58.4 51.8 40.9 30.1 25.6 22.7No 54.9 53.1 41.6 48.2 58.7 69.9 74.4 77.3No answer 0.4 – – – 0.4 – – –

Trends in International Migration
210
© OECD 2001
2. Policy developments
At Mexico’s initiative, the first Regional Conference on Migration was held in Puebla in 1996 (the PueblaProcess). An advisory rather than decision-making forum, the Conference agreed to recognise that migration isbeneficial to the area, and to promote the rights of immigrants, regardless of their status, as set out inthe 1948 Universal Declaration of Human Rights. Recognised by the United Nations, the Conference’s recom-mendations concern migration policy, linkages between migration and development, combating illegal immi-gration, technical co-operation, international co-operation on the integration of repatriated migrants, anddiscussions on respect for the rights of foreigners. The Conference holds an annual meeting, together withnumerous seminars and working parties attended by the eleven countries of Central and North America, inco-operation with international institutions such as the UNHCR, the IOM and NGOs. The Puebla Process reflectsa genuine determination to gain more insight into the many facets of migration, which countries view as bene-ficial because of its potential to correct asymmetries between them (particularly regarding the labour marketand economic growth). In this respect, co-operation is a vital means of safeguarding not only national sover-eignty in the international arena but immigrants’ rights as well. The Fourth Regional Conference took place inJanuary 1999 in El Salvador and confirmed the major contribution that migration has made to development.
Netherlands
Introduction
Real GDP growth averaged a little over 3% from 1993 to 1999, with the exception of 1998 when real GDPgrowth accelerated to nearly 4%; in 2000 GDP growth was 4.4%. A slight slowdown is expected for 2001, butnot below 4%. As employment grew faster than the labour force, the standardised unemployment rate hascontinued to fall and the tension on the labour market increased further. In June 2000, there were171 000 unemployed people (2.5%) and 201 000 unfilled vacancies. Net migration decreased slightly but immi-gration of labour increased. The most important changes in migration in the last years are due to importantincreases in immigration from Dutch nationals (see Chart III.9).
1. Trends in migration movements
Net migration fell slightly in 1999 from 62 000 to 60 000, mainly as a result of a decrease in the immigrationof foreigners (see Table III.26). But the total level of immigration is expected to be higher in 2000 than anytimein the last 20 years due to the arrival of Dutch nationals from the Antilles and Aruba who flee the poor eco-nomic conditions of the Caribbean. External migration has been stable for the last 10 years.
Emigration
For the fourth consecutive year, emigration had declined in 1999. The decline is strongest for outflows offoreigners. In terms of volumes, Dutch emigration decreased by 800 persons to 38 400 in 1999 and foreign emi-gration by 600 persons to 20 700.
Statistics Netherlands (CBS) produces yearly estimates of the level of unreported emigration of foreign-ers. To the extent that these emigrants entered the Netherlands legally, their numbers reduce the officialmigration surplus. Unreported emigration was estimated around 20 000 persons; these numbers haveremained stable since 1997.
Inflows and outflows of foreigners
The stable pattern of external migration during the last ten years (78 400 immigrants in 1999 and20 700 emigrants, see Chart III.9) masks some important changes in composition.
NETHERLANDS

Netherlands
211
© OECD 2001
The evidence suggested an upturn in foreign immigration as of 1997 but actual numbers had declinedin 1999 for the first time in five years. The net migration of non-Dutch immigrants from within the EU has stabi-lised around 10 800 for two consecutive years whilst immigrants from former Yugoslavia almost quadrupledbetween 1998 and 1999 (2 300). Net external migration from Turkey, Surinam and Morocco declined sharply.
In 1999, there were 3 800 Dutch national emigrants and 11 600 Dutch national immigrants from the DutchAntilles and Aruba, contributing 7 800 to the migration surplus. Refugees and asylum seekers
Although the number of asylum-seekers entering the country has declined somewhat – from45 200 in 1998 to 42 700 in 1999 – it has almost doubled since 1996 (see Table III.26). However, the increase in
Chart III.9. Migration flows and components of foreign population change, 1980-1999, NetherlandsThousands
1980 82 84 86 88 90 92 9694 1986 87 89 91 93 95 9997
80
70
60
50
40
30
20
10
0
1980 9896949290888684
989694929088
80
60
40
20
-20
100
0
-40
-60
-80
82
98
100
80
60
40
20
0
-40
-60
-20
Immigration of foreignersEmigration of foreigners
New requests for asylum
Total grants of asylum
Total changeNaturalisationNet migrationNatural increase
C. Components of foreign population change3
B. Flows of asylum seekersRequests and grants2
Total requests for asylum heard
A. Migration flows1
National and foreigners
Net migration (foreigners)Immigration of nationalsEmigration of nationals
Net migration (nationals)
1. Data are taken from population registers, which include asylum seekersliving in private households. Figures do not include administrative cor-rections.
2. A request heard is a request on which a decision is made in the givenyear without regard to the year in which the request was filed. Requestsgranted refer to applications for asylum in the given or in the previousyear. They include persons who are granted refugee status and personswho receive a temporary residence permit on humanitarian grounds.
3. Net migration figures have not been adjusted to include administrativecorrections while total change figures do.
Sources: Central Bureau of Statistics; Ministry of Justice.

Tre
nds in Inte
rnatio
nal M
igration
212
© O
EC
D 2001
Table III.26. Current figures on flows and stocks of total population and labour force in the Netherlands
Figures in thousands unless otherwise indicated
1. Data are taken from population registers, which include some asylum seekers.2. The administrative corrections account for unreported entries and departures on the population register.3. Data are from population registers and refer to the population on 31 December of the years indicated. Figures include administrative corrections.4. Estimates are for 31 March and include cross-border workers, but exclude the self-employed and family workers.5. “Allochtonous” refers to persons who have at least one parent who is born abroad.6. “Autochtonous” refers to persons who have both parents who are born in the Netherlands.7. Persons who have at least one parent who is born in the mentioned country.Sources: Central Bureau of Statistics; Ministry of Justice; Labour Force Survey.
1996 1997 1998 1999 1996 1997 1998 1999
Migration flows1 Refugees and asylum seekersTotal population New requests for asylum 22.9 34.5 45.2 42.7
Inflows 108.7 109.9 122.4 119.2 Total requests for asylum heard 75.3 .. 38.9 ..Outflows 65.3 62.2 60.4 59.0 Total grants of asylum 23.6 17.0 15.1 13.5Net migration 43.4 47.6 62.0 60.1Net administrative corrections2 –22.0 –17.0 –19.0 –20.0 Expulsions 51.5 62.0 55.7 69.2Adjusted total net migration figures 21.0 31.0 43.0 40.0 of which: Asylum seekers 16.5 18.9 14.3 18.3
Dutch nationalsInflows 31.6 33.1 40.7 40.8 EmploymentOutflows 42.9 40.3 39.2 38.4 Total foreign employment4 218 208 235 ..Net migration –11.3 –7.2 1.5 2.4 Employment of Dutch nationals
Foreigners born abroad and foreigners 509 543 579 ..Inflows 77.2 76.7 81.7 78.4 Total “allochtonous” employment5
Outflows 22.4 21.9 21.3 20.7 (new definition) 853 910 972 1 032Net migration 54.8 54.8 60.4 57.7
Labour force indicators according to the new definitionStock of population3 of “Autochtonous” and “Allochtonous” populationsTotal population 15 567.1 15 654.2 15 760.2 15 863.9 TotalTotal foreign population 679.9 678.1 662.4 651.5 Total labour force (thousands) 6 681 6 838 6 957 7 097of which: Activity rate (%) 63 65 66 67
Morocco 138.7 135.7 128.6 119.7 Unemployment rate (%) 7 6 5 4Turkey 127.0 114.7 102.0 100.7 Autochtonous6
Germany 53.5 53.9 54.1 54.3 Total labour force (thousands) 5 660 5 767 5 852 5 943United Kingdom 39.3 39.2 38.8 39.5 Activity rate (%) 65 66 67 68Belgium 24.0 24.4 24.8 25.4 Unemployment rate (%) 6 5 4 3
Allochtonous5
Total foreign-born population 1 433.6 1 469.0 1 513.9 1 556.3 Total labour force (thousands) 1 006 1 055 1 086 1 130of which: Activity rate (%) 57 59 59 59
Surinam 181.6 182.2 184.2 185.0 Unemployment rate (%) 15 14 11 9Turkey 169.3 172.7 175.5 178.0 Surinam7
Indonesia 174.8 172.1 170.3 168.0 Total labour force (thousands) 120 122 135 135Morocco 142.7 145.8 149.6 152.7 Activity rate (%) 62 61 66 65Germany 128.0 126.8 125.5 124.2 Unemployment rate (%) 16 14 12 10
Turkey7
Naturalisations 82.7 59.8 59.2 62.1 Total labour force (thousands) 79 83 84 90of which: Activity rate (%) 44 45 44 45
Morocco 15.6 10.5 11.3 14.2 Unemployment rate (%) 25 22 17 13Former Yugoslavia 1.8 2.9 6.7 8.0 Morocco7
Turkey 30.7 21.2 13.5 5.2 Total labour force (thousands) 59 65 71 74Surinam 4.4 3.0 3.0 3.2 Activity rate (%) 42 44 45 45European Union 3.5 2.9 2.4 2.1 Unemployment rate (%) 29 21 20 18
Naturalisation rate (%) 11.4 8.8 8.7 9.4 Antilles/Aruba7
Total labour force (thousands) 34 35 37 43Activity rate (%) 58 57 57 61Unemployment rate (%) 21 21 .. ..

Netherlands
213
© OECD 2001
the number of applicants does not directly reflect on the migration surplus. In 1999, only 13 500 people weregranted a humanitarian or refugee status compared with 24 200 in 1996. The available data for 2000 indicate astabilisation around the 1999 level. The three most important sending countries are Serbia-Montenegro,Afghanistan and Iraq; together they account for about 30% of the total.
2. Structure and changes in the foreign-born and foreign population
Numerical trends
The foreign-born population has increased continuously from 1 407 100. In 1995 to 1 556 300 in 1999 butthe natural growth of the foreign population has decreased from 10 900 in 1995 to 8 100 in 1999. Compared toprevious years, mortality among foreigners has stabilised around 2 000 and fertility rates have shown adecrease. In 1999, 30% of the foreign population is EU national, 18% Moroccan and 15% Turkish.
The foreign population has at the same time decreased continuously from 757 100 in 1995 to651,500 in 1999 (see Table III.26). The decrease can be attributed to the high rate of naturalisations(62 100 in 1999) which has for the fourth consecutive year been high enough to offset the migration gain.
Fertility of the foreign population has been on average below the fertility rate of Dutch nationalssince 1997. The decrease in fertility rate of the foreign population, which has been almost continuous over thelast two decades, can in part be explained by convergence to the fertility rate in the host country (seeChart III.10), and in part by naturalisation.
Mixed marriages
There has been a slight increase in the number of mixed marriages between Dutch nationals and foreign-ers (from 12 300 in 1998 to 13 100 in 1999). The number of mixed marriages involving Turkish or Moroccan part-ners decreased slightly during that period. Dutch men marrying with foreign women account for 60% of thetotal number of mixed marriages. There may well be a large number of marriages between two persons of thesame ethnic group that do not appear from the statistics because of the high rate of naturalisation of foreigners.
Chart III.10. Fertility rates according to the nationality of the mother, 1990-1999, Netherlands
Per 1 000 women
Source: Statistics Netherlands.
1990
5.0
1.0
4.5
4.0
3.5
3.0
2.5
2.0
1.5
5.0
1.0
4.5
4.0
3.5
3.0
2.5
2.0
1.5
1991 1992 1993 1994 1995 1996 1997 1998 1999
National Turkey MoroccoTotal (foreigners)Surinam
1990
5.0
1.0
4.5
4.0
3.5
3.0
2.5
2.0
1.5
5.0
1.0
4.5
4.0
3.5
3.0
2.5
2.0
1.5
1991 1992 1993 1994 1995 1996 1997 1998 1999
National Turkey MoroccoTotal (foreigners)Surinam
1990
5.0
1.0
4.5
4.0
3.5
3.0
2.5
2.0
1.5
5.0
1.0
4.5
4.0
3.5
3.0
2.5
2.0
1.5
1991 1992 1993 1994 1995 1996 1997 1998 1999
National Turkey MoroccoTotal (foreigners)Surinam

Trends in International Migration
214
© OECD 2001
Naturalisations
After a record increase since 1992 (from 36 200 to 82 700 in 1997) the rate of naturalisations has beendecreasing due to restrictions to the right to dual citizenship. The rate seems to have stabilised since 1998(62 090 in 1999).
3. Migration and the labour market
Migration for employment and work permits
The number of applications for employment permits has increased from 19 800 in 1998 to 24 000 in 1999.This trend appears to be confirmed in the first two quarters of 2000 with 13 800 applications. The number ofissued permits increased sharply from 15 200 in 1998 to 20 800 in 1999 but seems to have stabilised at thatlevel (11 600 in the first two quarters of 2000). Employment permits that are granted to Iraqi, Russian, Polishand Afghani immigrants show very strong increases from 1998 to 1999; taken together they account for5 129 employment permits (compared with 3 236 in 1998). The increase is partly a result of the employment ofasylum seekers.
It should be noted that the number of Dutch nationals (mainly West Indians and Arubans) immigratinginto the Netherlands has increased dramatically. As they possess Dutch passports, they do not need a workpermit; their numbers do not consequently show in the above figures. The influx of EU-nationals has been sta-ble over the past few years (see Section 1).
Labour market integration
There were 666 700 allochthonous workers in the labour force in 1999; this makes a proportion of 14% intotal labour force.
Unemployment of allochthonous workers has decreased in parallel with the total unemployment rate, butnot at the same pace. Allochthonous unemployment remains high, especially for those of non-western origin(13% compared with 2% for native Dutch). The Dutch government aims to reduce the wide employment/unem-ployment disparities between native and foreign workers by 50% between 1999 and 2002. Those hardest hitare of Turkish, Moroccan and West Indian/Aruban nationality (with unemployment rates of 18%, 15% and 12%,respectively).
4. Policy developments
A new Aliens Act will come into effect mid 2001 and aims to simplify and shorten procedures for asylum-seekers.
Admission and residence (including integration measures)
The new Act makes it impossible for foreigners to apply for a permit in the Netherlands; they can only doso at the Dutch embassy in their country of residence. To qualify for a residence permit, the new Act requiresthat the applicant prove that he (she) has sufficient means to provide not only for him/her (as under the oldlaws) but also for the person with whom he (she) will reside. In cases of family reunion the applicant has toprovide sufficient means for all members of his (her) family; Dutch nationals are no longer exempted from thisrequirement.
Refugees and asylum
The Aliens Act has shortened the asylum procedure. As a consequence, it has become easier to expelunwanted foreigners. Asylum seekers may obtain a permanent residence permit after three years if they meetall conditions and other migrants may do so after five years.

Netherlands
215
© OECD 2001
Measures to combat the illegal employment of foreigners
An official investigation took place in the first six months of 2000 in the horticultural sector in the West ofthe Netherlands and revealed that 10% of all employees were illegally employed. Legal measures have nowbeen implemented to make it more difficult for employers previously convicted of illegal employment of for-eign workers to recommence. It is as yet too early to assess the effects of this new policy.
Box III.7. New definition for Allochtonous
In the summer of 1999 the Dutch Bureau of Statistics (CBS) introduced a new terminology in immigration sta-tistics. Whereas in the past it used different concepts on immigration categories that were related to the countryof birth of the person involved or of his/her parents, the new definitions are consistent.
An allochthonous is a person of whom at least one parent was born abroad. There are two groups of allochth-onous people. The first-generation allochthonous are born abroad with at least one foreign-born parent. The sec-ond-generation allochtonous are born in the Netherlands but have one or both parents born abroad. People whoare born in the Netherlands whose parents are both born in the Netherlands are referred to as autochthonous.
Future immigration statistics will be given using the 1999 definitions of allochthonous and autochthonous.Table III.27 gives for 1998 total labour force, participation rate and unemployment rate statistics by ethnic back-ground for both the pre-1999 and the 1999 definitions of foreign born and allochthonous workers. Allochthonouscomprises both first and second generation, that is, all people with at least one parent born abroad.
Table III.27. Total labour force, participation rate and unemployment rate of the “autochtonous” and “allochtonous” populations according to old and new definitions, 1998, Netherlands
1. According to the old CBS definition, “Allochtonous” are foreigners plus Dutch nationals born outside the Netherlands.2. According to the 1999 CBS definition, “Allochtonous” are persons who have at least one parent who is born abroad.3. Italy, Spain, Portugal, Greece, Former Yugoslavia, Tunisia and Algeria.Source: Labour Force Survey, CBS.
Old definition1 New definition2
“Autochtonous”Total labour force (thousands) 6 294 5 852Activity rate (%) 67 67Unemployment rate (%) 3 4
“Allochtonous” – TotalTotal labour force (thousands) 663 1 086Activity rate (%) 57 59Unemployment rate (%) 12 11
“Allochtonous” from TurkeyTotal labour force (thousands) 61 84Activity rate (%) 44 44Unemployment rate (%) 28 17
“Allochtonous” from MoroccoTotal labour force (thousands) 54 71Activity rate (%) 46 45Unemployment rate (%) 20 20
“Allochtonous” from other Mediterranean countries3
Total labour force (thousands) 50 ..Activity rate (%) 58 62Unemployment rate (%) 14 10
“Allochtonous” from SurinamTotal labour force (thousands) 126 135Activity rate (%) 70 66Unemployment rate (%) 9 12
“Allochtonous” from Antilles/ArubaTotal labour force (thousands) 25 37Activity rate (%) 59 57Unemployment rate (%) 17 ..

Trends in International Migration
216
© OECD 2001
New Zealand
1. Trends in migration movements
The number of permanent and long-term (PLT) departures3 from New Zealand has been steadily increasingthroughout the 1990s. While high levels of immigration meant that net migration remained positive until recentyears, a decline in immigration, coupled with steadily increasing emigration meant the 1998/99 financial year sawthe first period of negative migration in the 1990s with net migration of –11 365. This continued in 1999/2000(albeit with a slight reduction), with a net migration total of –9 760 (see Chart III.11 and Table III.28).
As illustrated in Table III.29, however, New Zealanders make up a significant proportion of the flow of per-manent and long-term arrivals and departures.
Inflows and outflows of foreign-born
The annual immigration target for 1999/2000 was 38 000 residence approvals. There was a shortfall ofaround 7 000 in meeting the 1998/1999 target, also set at 38 000. However, residence approvals increasedin 1999/2000 with over 36 000 people granted residence.4 Chart III.12 shows that 51% of approvals were madeunder New Zealand’s skilled immigration policy (General Skills and Business Categories), 40% under FamilySponsored policy (Family and Humanitarian Categories) and 5% to refugees (UNHCR mandated refugeesgranted residence under the Refugee Quota Programme and persons found to have a genuine claim to refugeestatus).
As in the previous year, the United Kingdom (UK) remained the top source country for migrants to NewZealand, accounting for 13% of residence approvals in 1999/2000. The UK was followed by South Africa, Indiaand the People’s Republic of China accounting for 10% of the total migrant intake each. A significant proportionof all other migrants came from the Asia and Pacific regions. Residence flows from the Pacific are partiallyunderpinned by the Samoan Quota, under which up to 1 100 Samoan citizens may be granted residence eachyear.
NEW ZEALAND
Chart III.11. Flows of permanent and long-term residents, 1991/1992-1999/2000, New Zealand
Source: Statistics New Zealand.
91/92 92/93 93/94 94/95 95/96 96/97 97/98 98/99 99/2000
90 000
80 000
70 000
60 000
50 000
40 000
30 000
Fiscal years
Arrivals
Departures
91/92 92/93 93/94 94/95 95/96 96/97 97/98 98/99 99/2000
90 000
80 000
70 000
60 000
50 000
40 000
30 000
Fiscal years
Arrivals
Departures
91/92 92/93 93/94 94/95 95/96 96/97 97/98 98/99 99/2000
90 000
80 000
70 000
60 000
50 000
40 000
30 000
Fiscal years
Arrivals
Departures
Table III.28. Net migration, 1992/1993-1999/2000, New Zealand
Source: Statistics New Zealand.
1992/1993 8 7021993/1994 16 8151994/1995 22 7291995/1996 29 5061996/1997 16 7701997/1998 4501998/1999 –11 3651999/2000 –9 760

New Zealand
217
© OECD 2001
2. Policy developments
Key immigration policy developments in New Zealand during 1999/2000 include the following.
Migrant Settlement and Refugee Resettlement Policy
The development of an integrated migrant settlement and refugee resettlement strategy was a key prior-ity during 1999/2000. The purpose of the strategy is to ensure that the settlement needs of refugees andmigrants are met in a systematic and comprehensive way. As part of this process a number of pilot settlement
Table III.29. Permanent and long term arrivals and departures, 1999/2000, New Zealand
Top ten countries of birth
Source: Statistics New Zealand.
Arrivals Departures
New Zealand 22 509 New Zealand 55 444United Kingdom 6 228 Australia 3 214China 4 916 United Kingdom 3 122Australia 3 704 Japan 1 470Japan 3 631 United States 946India 2 324 China 406South Africa 2 107 Samoa 366Fiji 1 421 Fiji 277United States 1 160 India 231Samoa 978 South Africa 217
Total Top 10 48 978 Total Top 10 65 693Other countries 12 307 Other countries 5 352Total – all arrivals 61 285 Total – all departures 71 045
Chart III.12. Persons accepted for residence, by category of immigration, 1999/2000, New Zealand
Percentages
Source: NZIS Statistics.
Refugee claimant2%
Business1%
Others1%
Humanitarian6%
Samoan quota3%
Refugee quota3%
Others16%
Skilled workers50%
Family34%
Refugee claimant2%
Business1%
Others1%
Humanitarian6%
Samoan quota3%
Refugee quota3%
Others16%
Skilled workers50%
Family34%
Refugee claimant2%
Business1%
Others1%
Humanitarian6%
Samoan quota3%
Refugee quota3%
Others16%
Skilled workers50%
Family34%

Trends in International Migration
218
© OECD 2001
programmes were developed. These pilots will be provided by third parties and will build on successful exist-ing programmes while being open to innovative approaches from the community. The pilots will be opera-tional in 2001, and will be evaluated in 2002.
Working Holiday Schemes
The previous cap of 10 000 on the total number of working holiday makers able to enter New Zealand inany given year has been increased to 20 000. Similarly, the number of places available to working holiday mak-ers under each individual scheme has been increased in most cases. New arrangements have also been con-cluded with Germany and Hong Kong. The introduction of further schemes with a range of other countries isexpected to continue in 2000/2001.
Family Sponsored Immigration
A first principles review of family sponsored immigration policy (the Family and Humanitarian Categories)was started in 1999/2000. The review culminated in the preparation of reports on the possible establishmentof a refugee sponsored programme; the future of the Humanitarian Category; the definition of family; manag-ing the costs of family sponsored immigration; and provisions for (migrant) victims of domestic violence.
Immigration Programme Approvals Management
As part of the review of family sponsored immigration policy, developmental work commenced on animmigration programme approvals management system which (among other things) has discrete sub-streamsfor family sponsored and international/humanitarian. The new target management system is likely to becomeoperational in 2001/2002.
Transitional Provisions for Well-Settled Overstayers
A streamlined removal process and appeal provision came into full effect on 1 October 1999. From thatpoint, those who are in New Zealand illegally have 42 days to appeal, after which they are liable to immediateremoval. Those overstayers who had become well settled5 would be subject to this new provision, and aretherefore being given the opportunity to apply to regularise their immigration status between1 October 2000 and 30 March 2001. People who successfully apply will be granted an open work permit, andwill be permitted to apply for New Zealand residence after a two-year period.
Norway
Introduction
In early 1999, the period of strong economic growth enjoyed by the Norwegian economy since 1991 wasinterrupted, primarily due to the drop in world oil prices. Despite the recovery in the second quarter of 1999,Norway’s GDP grew at a lower rate than in previous years (i.e. 0.8% in 1999 and 1.8% in 2000), while unemploy-ment levelled off in 1999 and rose slightly in 2000 (3.4%).
Despite this unfavourable economic situation, immigration again increased in 1999, with a net migrationgain of 19 540. The new government intends to continue the policy of relaxing immigration rules initiated bythe preceding coalition.
NORWAY

Norway
219
© OECD 2001
1. Trends in migration movements
Emigration
In 1999, approximately 22 850 people, including 10 150 nationals, emigrated from Norway, a decrease ofsome 0.2% over the previous year. Given the overall population of some 4.5 million, the immigration rate was0.5% in 1999, which was the same as in 1998 and is very high compared to the late 1980s (see Table III.30).
While approximately 28.5% of Norwegian emigrants moved to another Scandinavian country (+30%over 1998), nearly twice as many foreigners did so (53.3%). This reflects significantly greater mobility of foreign-ers within the Nordic area since 1998. Between 1990 and 1997, only one foreign emigrant in three moved else-where in the area.
Inflows and outflows of foreigners
Since 1996, immigration to Norway had mainly been stimulated by its economic performance, butin 1999 the increase in net migration was primarily due to the very large influx of asylum seekers from Kosovo.
A total of nearly 41 850 people (foreigners and Norwegians) entered Norway in 1999, an increase of 14%over 1998 and 39% over 1997. This gain was reflected in net migration. In 1999, 32 200 foreigners immigrated toNorway while 12 700 emigrated, giving a net migration for the foreign population of 19 550 (1998: 13 800; 1997:10 700) (see Table III.30).
In 1999, nearly a quarter of immigrants were nationals of Nordic countries, in particular Sweden (4 500),Denmark (1 780) and Finland (fewer than 1 500). However, while only Swedish immigration made a significantcontribution to net migration in 1998 (+3 300), in 1999 this figure fell to only 980 people. Some3 300 immigrants were from another country of the European Economic Area.
Another significant development in 1999 was the increase in the number of nationals from the formerYugoslavia (1999: 6 450; 1998: 315). Similarly, the number of Iraqi nationals doubled to 2 050 in 1999, most ofwhom were members of the Kurdish minority.
Illegal immigration
In 1998, nearly 350 cases of illegal immigration were recorded by the national Bureau of Crime Investiga-tion (530 in 1998), half of which involved trafficking in human beings (slightly over a quarter in 1998). Althoughthe total number of illegal immigrants seems to be dropping, the number of cases of trafficking in humanbeings has more than tripled since 1996.
Refugees and asylum seekers
Asylum seekers form one of the main categories of immigrants, and made the largest contribution tochanges in net migration in 1999, with a total of 10 160 cases recorded (as compared with 8 540 cases in 1998,an increase of 19%, see Table III.30). This large increase can be explained by an influx of asylum seekers fromIraq (4 070), the former Yugoslavia (1 170) and Somalia (1 340). In 1999, only 181 people obtained refugee sta-tus in the strict sense, while a further 3 032 were accepted on humanitarian grounds (1 810 more than in 1998).
Under a refugee resettlement programme, a further quota of 1 500 people may be accepted each year.In 1998, some 1 120 refugees were accepted under the programme, chiefly Iranians and Iraqis.
The Norwegian authorities, in conjunction with the UNHCR, have also established a system of collectiveprotection for particular emergency cases. This has been applied on two occasions between 1993 and 1998, forBosnians (13 000 people over this period) and in 1999 for Kosovars (nearly 8 000 people were admitted on thisbasis in one year).
It should also be mentioned that in 1999 approximately 1 540 people (915 in 1998) were accepted underthe relaxed family reunion conditions for refugees introduced in June 1997.

Tre
nds in Inte
rnatio
nal M
igration
220
© O
EC
D 2001
Table III.30. Current figures on flows and stocks of foreign population, Norway
Figures in thousands unless otherwise indicated
1. Data on 31 December of the years indicated, taken from population registers.2. Excluding Bosnia Herzegovina and Croatia.Sources: Statistics Norway; Directorate of Immigration.
1996 1997 1998 1999 1996 1997 1998 1999
Total population1 4 392.7 4 417.6 4 445.4 4 478.5 Asylum seekers by nationality 1.8 2.3 8.5 10.2% of foreigners 3.6 3.6 3.7 4.0 Croatia - 0.1 2.5 0.1
Former Yugoslavia2 0.1 0.3 1.2 1.2Migration flows by group of nationality Iraq 0.1 0.3 1.3 4.1Inflows 26.4 32.0 36.7 41.8 Somalia 0.2 0.6 0.9 1.3
Nationals 9.2 9.9 10.0 9.6 Other 1.4 1.0 2.7 3.5Foreigners 17.2 22.0 26.7 32.2of which: Foreign population by region 157.5 158.0 165.1 178.7
Nordic countries 5.8 8.6 10.4 8.1 Europe 95.9 100.9 108.2 118.3EU (15 members) 7.7 10.8 13.3 11.0 Asia 34.9 31.5 31.1 33.3
Africa 10.0 9.7 10.1 11.6Outflows 20.6 21.3 22.9 22.8 North America 10.6 10.4 10.5 10.3
Nationals 10.6 11.2 10.9 10.2 South America 4.6 4.2 4.1 4.0Foreigners 10.0 10.0 12.0 12.7 Other 1.6 1.2 1.1 1.2of which:
Nordic countries 3.4 3.9 5.4 6.8 Acquisition of nationality by previous EU (15 members) 5.1 5.5 6.9 8.1 nationality (units) 12 237 12 037 9 244 7 988
of which:Net migration 5.8 10.7 13.8 19.0 Former Yugoslavia 554 520 560 1 176
Nationals –1.3 –1.3 –0.9 –0.5 Vietnam 1 446 1 276 781 651Foreigners 7.2 12.0 14.7 19.5 Chile 531 416 240 252of which:
Nordic countries 2.5 4.7 5.0 1.4 Mixed marriages (units) 3 194 2 959 4 100 3 975EU (15 members) 2.6 5.4 6.4 2.9 % of total marriages 13.8 12.4 17.5 16.0

Norway
221
© OECD 2001
2. Structure and changes in the foreign population
Numerical trends
The total population of Norway rose by 33 170 people in 1999 (0.6%) and totalled 4.47 million at the endof the year. Given the record immigration registered in 1999, the number of foreign residents rose appreciablyfaster, by approximately 8.2%. At the end of 1999, the resident foreign population totalled 178 700 (1998:165 000), or 3.9% of the total population (see Table III.30).
European Union nationals account for a little under half the total (44%) and within this group nationals ofNordic countries account in turn for around 60%. As a result of the migration flows described above, the pre-dominance of European immigrants in the broad sense has accentuated over recent years. Nationals of Asianand African countries account for only 18.6 and 6.4 respectively of all foreigners.
Swedish nationals constitute the largest group of foreign residents (1998: 24 000; 1999: 25 130), followedby nationals of Denmark (1998: 19 100; 1999: 19 200), Bosnia Herzegovina (1998: 11 800; 1999: 12 200), theUnited Kingdom (1998: 11 200; 1999: 11 360) and the former Yugoslavia (1998: 5 500: 1999: 10 250).
Mixed marriages
Around 16% of all marriages contracted in Norway in 1999 were mixed. The breakdown by nationalityshows considerable differences: while over 90% of North American nationals marry a native-born Norwegian,the figure is only 69% for Asians and Africans.
Naturalisations
During the 1980s, the annual number of naturalisations ranged from 1 800 to 4 600. They averaged approx-imately 5 000 at the beginning of the 1990s. In 1999, some 8 000 foreigners acquired Norwegian nationality(see Table III.30).
Although the figure is relatively high, it represents a significant decline compared with previous years(1996: 12 200; 1997: 12 000; 1998: 9 400). In 1999, the number of naturalisations of nationals of Pakistan (106)and Turkey (170) fell sharply (1 090 and 705 respectively in 1998), while the number of nationals of the formerYugoslavia residing in Norway rose (1998: 560; 1999: 1 176). This shows the backlog that has built up in theadministration responsible for naturalisations, no doubt due to the growing number of applications filed byBosnian refugees who now meet the seven-year minimum residence requirement.
3. Migration and the labour market
Migration for employment and work permits
In 1999, Norway experienced an economic downturn that will inevitably have repercussions on theemployment of foreigners, and the growth rate might continue to be under 2% in 2001 (1.8% in 2000). Never-theless, unemployment still remains low (3.4% in 2000, compared with 3.2% in 1999), and there has not been asubstantial deterioration of the situation of foreigners on the labour market. In 1999, there was still a signifi-cant need for foreign labour.
By 1996, the Norwegian authorities recognised that it could prove necessary to recruit foreign workers insome sectors, especially construction and health care. In 1999, 118 doctors were recruited, mainly fromGermany, Austria and France. During the same period, 300 nurses were recruited from Finland.
Nationals of Nordic countries can settle and work freely in Norway and do not need a residence or workpermit. Nationals of the European Union do not require a permit to work in Norway but must apply for a resi-dence permit for a stay of longer than three months. In 1999, 4 850 residence permits were issued on thisbasis, including some to people not necessarily wanting to work.
Nationals of all other countries must obtain work permits. In 1999, some 19 300 work permits were issued.The permanent work permits were largely issued to immigrants on family reunion grounds.

Trends in International Migration
222
© OECD 2001
Seasonal permits are available, in particular to meet temporary demand in the agricultural sector. Thequota was set at 6 810 in 1997, and raised to 8 000 in 1998 and 8 188 in 1999. Over 90% of seasonal workers arefrom Central and Eastern Europe, in particular Poland.
Labour market integration
After declining until 1998, unemployment grew to 3.2% in 1999 and 3.4% in 2000. Unemployment amongthe immigrant population is considerably higher. However, between 1998 and 1999, contrary to the trend forNorwegian workers, immigrant unemployment fell from 7.1% in 1998 to 6.3% in 1999.
The extent of unemployment varies by region of origin. While unemployment among nationals of Nordiccountries is the same as for Norwegians (2.6% in 2000), unemployment among immigrants from Western Euro-pean countries is only slightly higher than for Norwegians (3.2%), while unemployment among African, Asianand Latin American immigrants is much higher (14.2%, 10.4% and 8.7% respectively). Some headway should benoted in this area, however, as with nationals of Central and Eastern European countries, for whom unemploy-ment has fallen from 17.1% to 9.9% in only four years (up slightly over 1999).
4. Policy developments
Admission and residence (including integration measures)
Lowering unemployment among foreigners remains an important policy objective of the new government,which is focusing on measures aimed at increasing the employability of foreigners (skills, mastery of language)and combating discrimination against them.
The government has therefore created a legal working group to propose changes in the education andtraining system available new immigrants. A major problem for the labour market integration of foreigners isrecognition of their diplomas. For this reason, the Education Ministry is studying reform proposals to improvethe rules for recognising foreign qualifications. The government is also promoting the recruitment of qualifiedforeigners in the public sector so as to reflect the multicultural nature of Norwegian society.
The Ministry of Local Government and Regional Development has also commissioned a three-year studyon foreigners and the labour market and on the problems and discrimination that they face. At the legislativelevel, an amendment of Section 55A of the Working Environment Act, which prohibits discrimination on thebasis of race, colour or national or ethnic origin, was adopted in 1998. A number of measures aimed at ensur-ing better integration of new immigrants have been prepared in consultation with representatives of tradeunions and management (financial incentives for businesses that employ immigrants, a system of sponsoringto promote the integration of immigrants in the workplace).
With regard to the issuing of work permits to foreigners, the government has proposed two reforms to Par-liament, i) authorising seasonal permits throughout the year (they are currently limited to the period runningfrom 15 May to 31 October); and ii) lowering the minimum education requirement for work permits (which is atpresent three years of higher education). Special measures have been taken to relax the regulations on workpermits for nationals of Barents Sea countries, allowing Norwegian fishery firms to hire Russian workers. Thenationals of Central and Eastern European countries should also benefit from this amendment.
Naturalisation
As a rule, foreigners may acquire Norwegian nationality after they have legally resided in the country forseven years. Individuals with a criminal record may be denied naturalisation. There are no language require-ments or financial prerequisites. Despite the backlog that has built up in the administration responsible fornaturalisation, no decision to relax the legislation has been made.
Refugees and asylum
Two significant amendments were made to the asylum rules in 1999. As from 1 July 2000, responsibility forquestioning asylum-seekers will be transferred from the police to the immigration department. In addition,

Poland
223
© OECD 2001
the Norwegian Parliament approved the establishment of an independent panel to hear appeals against deni-als of refugee status. Appeals are currently handled by the Justice Ministry.
Combating illegal immigration
In order to combat illegal immigration, the Immigration Act was amended in 1997 and the prison sentencefor organising the illegal entry of foreigners into Norway for financial gain was raised from a maximum of two tofive years.
International agreements
For over 40 years the “Nordic Passport” has guaranteed complete freedom of movement among the fiveNordic countries. Ultimately, however, free movement within the Nordic countries can now continue onlyif they introduce regulations compatible with the Schengen Agreement, whether or not they belong to theEuropean Union.
Following ratification of the Amsterdam Treaty in May 1999, Norway and Iceland have to concludeco-operation agreements with the States party to the Schengen Agreements. For Norway, the process hasbeen under way since 25 March 2001.
Polan d
Introduction
After a period of strong economic growth between 1994 and 1997 (averaging 6.5%), GDP growth slowedbetween 1998 and 1999, and was down to 4% in 2000. The unemployment rate has been rising againsince 1998 and stood at 16% in 2000.
Poland remains an emigration country, although outflows have decreased sharply in recent years. It alsoremains a transit country for persons wishing to emigrate to European Union countries. As Poland is seeking tojoin the EU, changes in its migration legislation can be expected in the near future in order to bring it into linewith norms in Member States.
1. Trends in migration movements
Emigration
In 1999, Poland experienced a net migration loss of 14 000 people (see Table III.31), while the naturalpopulation increase stood at 600, which means that its population is decreasing in size for the first time sincethe Second World War. Consequently, since 1999 emigration has been responsible for a decline in the totalpopulation.
The available figures on permanent emigration (settlement abroad for a period equal to or in excess ofone year) considerably underestimate the true outward flows as large numbers of migrants do not notify theauthorities of their departure. The extent of permanent emigration fluctuates considerably, with a markeddecline sometimes being followed by a similarly sharp increase. However, the amplitude of the fluctuationshas since 1990 been much less marked than during the two previous decades; since 1996, the flow has stabi-lised at between 20 000 and 22 000 permanent exits per year, with 21 500 in 1999. These figures are quite closeto those observed between 1990 and 1992 and are much lower than those for 1987-89 (see Chart III.13).
In 1999, the flow towards Germany was slightly down, decreasing from 72.7% to 71.3% of the total emigra-tion flow. Europe received over 82% of Polish emigrants in that year. These flows are largely comprised of
POLAND

Trends in International Migration
224
© OECD 2001
Table III.31. Current figures on migration flows and stocks of foreigners in Poland
Thousands
1. Persons who entered Poland (including returning Polish emigrants) and registered in the Central Population Register (PESEL) after obtaining a permanentresidence permit. Figures in the table may be underestimated since not all children accompanying immigrants are registered.
2. Data on permanent residence permits issued are not linked with data from the Central Population Register and therefore are not comparable. There is abreak in series in 1998: since 1 January 1998, two types of permits can be delivered: “permission to settlement” and “fixed-time residence permit”.
3. Estimates made by the Ministry of the Interior on the basis of the number of permanent residents who renewed their permit as it is stipulated bythe 1997 Alien Law.
Sources: Central Statistical Office; Office for Migration and Refugee Affairs; Ministry of the Interior.
1996 1997 1998 1999Total Permanent
residenceFixed-time residence
Migration flows1 Stock of foreign citizens3
Inflows 8.2 8.4 8.9 7.5 (31 December 1999)Outflows –21.3 –20.2 –22.2 –21.5 Europe 24.7 14.9 9.8Net migration –13.1 –11.8 –13.3 –14.0 Germany 1.9 1.1 0.9
Russian Federation 4.4 3.2 1.2Permanent residence permits issued by nationality2 Ukraine 7.0 4.1 2.9Ukraine 0.6 1.0 0.9 2.6 Other Eastern European countries 7.6 4.6 3.0Vietnam 0.3 0.3 0.7 1.5 Other European countries 3.8 2.0 1.8Fed. Rep. of Yugoslavia 0.0 0.0 0.1 1.2 United States 1.4 0.5 0.8Russian Federation 0.3 0.3 0.4 1.1 Canada 0.3 0.1 0.1Germany 0.1 0.2 0.2 0.8 Vietnam 3.3 1.5 1.8Other countries 1.5 2.2 2.7 10.0 Others 13.2 6.1 7.1Total 2.8 4.1 5.1 17.2 Total 42.8 23.1 19.7of which:
Permission for settlementPermission for fixed -time residence
..
......
0.34.8
0.516.7
1998 1999
Work permits granted by occupationManager 3.5 4.2Owner 4.6 4.2Expert, consultant 2.4 2.5Teacher 1.6 1.9Skilled worker 1.8 1.5Unskilled worker 0.5 0.4Other 2.6 2.5Total 16.9 17.1
Chart III.13. Permanent migration flows in Poland, 1960-1999Thousands
Note: Persons who entered Poland (including returning Polish emigrants) and registered in the Central Population Register (PESEL) after obtaining a per-manent residence permit. Some children accompanying immigrants are not counted. Outflows only cover departures of permanent residents registered inthe Central Population Register.
Source: Central Statistical Office.
1960 1965 1970 1975 1980 1985 1990 1995 1999
40
35
30
25
20
15
10
5
0
40
35
30
25
20
15
10
5
0
Inflows of permanent residents Outflows of permanent residents
1960 1965 1970 1975 1980 1985 1990 1995 1999
40
35
30
25
20
15
10
5
0
40
35
30
25
20
15
10
5
0
Inflows of permanent residents Outflows of permanent residents
1960 1965 1970 1975 1980 1985 1990 1995 1999
40
35
30
25
20
15
10
5
0
40
35
30
25
20
15
10
5
0
Inflows of permanent residents Outflows of permanent residents
Poland
225
© OECD 2001
people with a low level of education (over 75% had gone no further than primary school). Nevertheless, theproportion of those with a good level of professional training is rising.
Silesia is still one of the main emigration regions, 62% of all Polish emigrants coming from three of itsadministrative units. It is a region from which the German-speaking minority was very prone to emigrate in theearly 1990s.
Inflows and outflows of foreigners
As the Polish authorities have changed the rules governing the issuance of residence permits, it is difficultto compare the figures for immigration into Poland before 1998 with the current figures. Formerly, the “immi-grant” category covered all new permanent residents arriving from abroad, whether they were Polish or not.However, a new Aliens Act came into force in 1997. It stipulates the conditions governing the stay of foreignersand sets out their rights and duties in Poland. It also brings the status of refugees and asylum seekers into linewith the principles of the Geneva Convention. The new provisions adopted in 1998 have led to the establish-ment of two different kinds of residence status for foreigners, one entitling them to settle in the country(permanent residence) and the other granting a renewable two-year right of temporary residence.Between 1998 and 1999, the number of residence permits issued doubled, mainly because of the growth inthe issuance of temporary residence permits (see Table III.31).
Three characteristics of inflow patterns stand out: i) the roughly equal numbers of men and women enter-ing since 1993, with slightly more men; ii) the predominance of migrants from Europe (60% from Germany), theAmericas (mainly from the United States, which accounts for 14% of entries) and Asia (although the number ofVietnamese is declining); and iii) the large proportion of young people among the new arrivals (approximately60% are under the age of 40).
Refugees and asylum seekers
After increasing between 1996 and 1997 from 850 applications to some 3 550, the number of asylum sek-ers then began to decline (by 11.8%), mainly due to the drop in asylum seekers from the former Yugoslaviaand Sri Lanka. The figures were also lower for other nationalities, such as nationals of Bangladesh, India, Iraq,Pakistan and Somalia, which suggests that the routes used to smuggle immigrants into Western Europe maybe shifting and that fewer illegal immigrants may be transiting through Poland because of stricter border con-trols.
In 1999, some 870 Armenians requested asylum, which was slightly fewer than in previous years (1998:1 000), followed by nationals of Afghanistan (560). However, there was an increase in applications by nationalsof Bulgaria, Romania, Russia and Mongolia. In 1998, the Polish authorities decided to require Armenians wish-ing to come to Poland to obtain a visa because of the large number of asylum requests.
Illegal immigration
Poland remains one of the main transit countries for migrants heading towards Western Europe eventhough for the majority of nationals of Romania, Bulgaria and countries of the former Soviet Union, Poland istheir final destination. Formerly intercepted at the Eastern borders, illegal immigrants now attempt to enterPoland via the borders with the Slovak and Czech Republics. Border controls have been improved and therehas been a drop in the number of foreigners intercepted since 1995, which might indicate that the number ofpeople attempting illegal immigration has fallen and that the measures for combating smuggling of immigrantsare more effective.
The undocumented foreigners apprehended in Poland are chiefly Romanian, (15%) Ukrainian (32%) andBulgarian (22%).
In all, more than 8 500 foreigners were expelled in 1999 (up 7%). Since 1999, the number of undocu-mented foreigners readmitted into Poland under readmission agreements has decreased. They mainly comefrom Germany, and are mostly nationals of the former Yugoslavia and Afghanistan.

Trends in International Migration
226
© OECD 2001
2. Structure and changes in the foreign population
Numerical trends
According to the new register incorporating the reform of the 1997 Aliens Act, which establishes a distinc-tion between temporary and permanent residence permits, 42 800 foreigners were legally resident in Polandat the end of 1999 (See Table III.31). Approximately 54% of them held a permanent residence permit and 46% atemporary permit. Nationals of the republics of the former Soviet Union (Ukraine, Russia, Belarus and Armenia),Germany, Vietnam and the former Yugoslavia constitute the largest national groups.
However, these data do contain some significant distortions, for some foreigners are not registered, andtheir numbers are undoubtedly larger than the figures above show. To be included, foreigners must haveapplied for a residence permit, but they are only required to do so if they have resided in Poland for at leastthree months. Many foreigners from neighbouring countries (such as Ukraine) do not declare Poland as theirmain residence, even though they actually live there, but make a return trip to their home country every threemonths.
Mixed marriages
The number of mixed marriages has fallen after rising sharply in 1998, but still remains higher than theaverage for the decade as a whole (3 600 in 1999, as against an average of roughly 3 000 per year since 1990).The number of marriages between Polish men and foreign women has increased since 1990, and stood at1 300 in 1999, while the number of marriages between Polish women and foreign men has remained relativelystable, ranging from 2 000 to 2 400 throughout the decade.
Mixed marriages accounted for fewer than 2% of the total marriages contracted in 1999. In that year therewere more marriages with Ukrainian nationals than with Germans, who had been the first-ranking nationalityin 1998.
3. Migration and the labour market
Migration for employment and work permits
Recent estimates of the number of Polish workers employed abroad suggest that in 1999 some350 000 Poles were working legally outside Poland, of whom 300 000 were in Germany. It is estimated thatbetween 100 000 to 120 000 of them have one-year work permits. Poland has signed bilateral migration agree-ments with some countries covering a total of 240 000 people, including 220 000 Poles holding seasonal jobseach year in Germany.
The data on the employment of foreign workers are incomplete. What are available are only rough esti-mates based on the number of work permits issued by the Polish authorities, which show that one-third ofpermits were granted to workers in small firms (fewer than five employees). The number of permits issued istending to level off (20 600 in 1999), after having risen sharply every year (up 19% in 1998, giving a total of20 700 permits). They are granted mainly to Ukrainians, followed by Belarus and Vietnamese nationals. Ger-mans rank only fifth, after workers from the United Kingdom, but ahead of Russians and French. Western work-ers are no doubt employees of foreign companies setting up in Poland, and between 1998 and 1999 thesharpest increase was in French nationals (up 19%).
Immigration of skilled workers
The vast majority of work permits are granted to skilled workers (entrepreneurs, consultants and teach-ers). The proportion of unskilled employment (5% in 1997) declined further, while the number of self-employed workers rose. One-quarter of the entrepreneurs are Vietnamese, over half of the teachers are fromthe United Kingdom and Ukraine (in equal proportions) and 36% of manual workers (both skilled andunskilled) are Ukrainian. Senior managers come mainly from four Western countries: France, Germany, theUnited Kingdom and the United States (accounting for 39% of the total), although the Vietnamese appear to

Portugal
227
© OECD 2001
be moving into this kind of jobs. Foreign workers are more attracted to the private sector than the public sec-tor and most frequently have jobs in commerce or the hotel and catering sector.
Employment of undocumented workers
The National Labour Bureau estimated in a 1999 report that over the course of each year some200 000 foreigners worked in the informal sector, mainly in seasonal jobs. Undocumented workers are prima-rily Ukrainian and Vietnamese nationals, with a sharp rise in the latter. Some German, French and Dutchnationals would also appear to be working illegally in Poland in large-scale projects to establish commercialcentres. Many Germans from Länder bordering on Poland are thought to be working in north-western Poland.Many other undocumented foreigners hold jobs in the construction, catering and automobile sectors.
In 1999, following the reform of the Polish administration, responsibility for monitoring the legality ofemployment was transferred from the local (district) level to the sub-regional level, which seems to havereduced its effectiveness. Over 67 000 inspections (compared with 80 000 in 1998) led to the detection ofsome 1 500 illegal workers (2 500 in 1998, mainly Ukrainians, Bulgarians, Armenians and Vietnamese).
4. Policy developments
The political authorities have a full agenda in a number of areas. First, the government has taken two leg-islative initiatives regarding the regulation of migration flows. One of them, the Polish Nationality Act, con-cerns the acquisition, recovery and loss of Polish nationality, as well as the question of dual nationality. ThisAct replaces provisions dating from the beginning of the communist regime. The other initiative proposes toamend the 1997 Aliens Act in order to take into account criticisms from EU institutions. Both of these acts havebeen adopted by the lower House of Parliament.
Poland has been a candidate for membership of the European Union since 1997, and has entered intonegotiations with the European authorities to determine the date when Member countries’ labour markets willbe opened to Polish workers and how this measure will be implemented. Some EU countries intend asking forderogation from the principal of free mobility of persons after the Polish accession to the EU. The Polish Gov-ernment does not share this view.
Steps are also being taken to adapt Polish legislation on labour and foreigners to European standards, toreinforce border controls and strengthen co-operation with Germany regarding the movement of foreigners.
Portugal
Introduction
Between 1996 and 1998, the Portuguese GDP grew at an average rate of 3.8%. Although this rate deceler-ated to 3.5% in 1999, unemployment has continued to decline, from 7.3% in 1996 to 4.5% in 1999. This eco-nomic buoyancy together with sustained employment growth largely explains, together with family reunion,the increased inflow of foreigners (6 500 in 1998; 10 500 in 1999).
As of 31 December 1999, Portugal’s total resident population was estimated to be 10 million, an increaseof 0.2% on the preceding year; this increase was due more to net migration (+10 400) than to natural variation(+7 800). The authorities estimate the number of Portuguese living abroad at about 4.8 million. Portugal is oneof the few OECD countries that has a long-standing policy of facilitating the integration of its citizens livingabroad.
PORTUGAL

Trends in International Migration
228
© OECD 2001
1. Trends in migration movements
Emigration and return of nationals
The emigration of Portuguese nationals began to decrease in the second half of the 1970s, a trend thatbecame a great deal more pronounced during the 1980s. In 1980 approximately 18 000 long-term (for morethan one year) departures were recorded; by 1988 the figure was only 9 500. Departure statistics after 1988 arenot comparable, since the type of passport on which the earlier data were based was abolished at that time.The free movement of Portuguese nationals within the European Union (EU) as of 1992 does not seem to haveproduced any significant upturn in permanent emigration to Member countries. Since 1993 the National Statis-tical Institute has been conducting a sample survey to estimate outflows. According to this survey, approxi-mately 28 000 Portuguese nationals left the country in 1999, an increase of 26% on the preceding year(see Table III.32). This outward flow was overwhelmingly composed of temporary migrants (85.5%). Almostthree-quarters of these persons were male. The principal countries of destination were France (26%), Germany(24%) and Switzerland (23%).
The Portuguese community abroad (both nationals and persons of Portuguese descent) has been esti-mated at 4.8 million, of whom more 60% reside in Brazil, the United States and France and almost 15% residein other European Union countries. Remittances from Portuguese emigrants rose by 4.2% in Euro terms at cur-rent prices in 1999. The sum was equivalent to nearly 3% of GDP.
Return migration to Portugal, which picked up during the 1980s, fell back slightly in 1999 to 15 200. Most camefrom European Economic Area countries, mainly France, Germany, Spain, Switzerland and the United Kingdom.
Inflows and outflows of foreigners
The number of foreigners in possession of a residence permit rose by over 7% in 1999 to slightly less than191 000. During the preceding four years the average annual rate of increase had been below 2%(see Table III.32). According to a survey by the National Statistical Institute, 14 500 immigrants made their firstapplication for a permanent residence permit in 1999, almost two and a half times as many as in 1998. Justover one quarter of these persons had been born in Portugal to foreign parents. Of the remainder, 11% werefrom Brazil, just over one quarter from Portuguese-speaking African countries (in particular Cape Verde,Angola and Guinea-Bissau), almost 10% from Spain, 7.5% from Germany and just less than 7% from both Franceand the United Kingdom. In 1999, information regarding the reason for migration was collected for the firsttime: long-term employment and family reunion were each declared as being the motivating factor behindalmost 30% of the moves.
The data on emigration by foreigners published for 1999 is not comparable with that of previous years. Atslightly more than 400, the recorded figure was just over one tenth of that of 1998. Those departing weremostly Brazilian, German, Spanish, United States and United Kingdom nationals.
Refugees and asylum seekers
Having experienced an exceptional increase in asylum applications in 1993 (to total almost 1 700), withRomanians accounting for nearly two-thirds and Angolans for 20%, applications then fell back sharply.Since 1995 the figure has fluctuated between 250 and 500; the figure for 1999 was at the bottom end of thisrange. Of the 270 applications, approximately 20% were made by citizens of Eastern European countries (inparticular, the former Yugoslavia and Romania); politically unstable African countries accounted for much ofthe remainder: these included, most notably, Sierra Leone (31%), Angola (13%), Nigeria (6%) and Algeria (5%).
2. Structure and changes in the foreign population
Numerical trends
The almost 191 000 foreigners legally residing in Portugal in 1999 accounted for just under 2% of the totalpopulation. Males outnumbered women by a ratio of almost three to two. Approximately two thirds of the
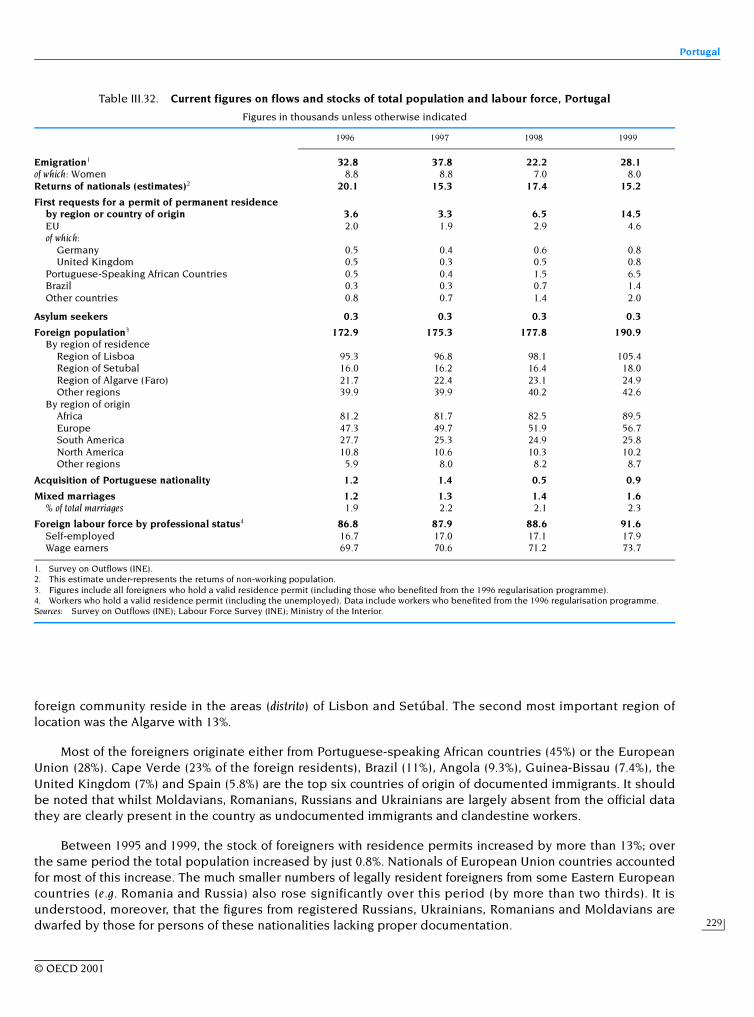
Portugal
229
© OECD 2001
foreign community reside in the areas (distrito) of Lisbon and Setúbal. The second most important region oflocation was the Algarve with 13%.
Most of the foreigners originate either from Portuguese-speaking African countries (45%) or the EuropeanUnion (28%). Cape Verde (23% of the foreign residents), Brazil (11%), Angola (9.3%), Guinea-Bissau (7.4%), theUnited Kingdom (7%) and Spain (5.8%) are the top six countries of origin of documented immigrants. It shouldbe noted that whilst Moldavians, Romanians, Russians and Ukrainians are largely absent from the official datathey are clearly present in the country as undocumented immigrants and clandestine workers.
Between 1995 and 1999, the stock of foreigners with residence permits increased by more than 13%; overthe same period the total population increased by just 0.8%. Nationals of European Union countries accountedfor most of this increase. The much smaller numbers of legally resident foreigners from some Eastern Europeancountries (e.g. Romania and Russia) also rose significantly over this period (by more than two thirds). It isunderstood, moreover, that the figures from registered Russians, Ukrainians, Romanians and Moldavians aredwarfed by those for persons of these nationalities lacking proper documentation.
Table III.32. Current figures on flows and stocks of total population and labour force, Portugal
Figures in thousands unless otherwise indicated
1. Survey on Outflows (INE).2. This estimate under-represents the returns of non-working population.3. Figures include all foreigners who hold a valid residence permit (including those who benefited from the 1996 regularisation programme).4. Workers who hold a valid residence permit (including the unemployed). Data include workers who benefited from the 1996 regularisation programme.Sources: Survey on Outflows (INE); Labour Force Survey (INE); Ministry of the Interior.
1996 1997 1998 1999
Emigration1 32.8 37.8 22.2 28.1of which: Women 8.8 8.8 7.0 8.0Returns of nationals (estimates)2 20.1 15.3 17.4 15.2
First requests for a permit of permanent residenceby region or country of origin 3.6 3.3 6.5 14.5EU 2.0 1.9 2.9 4.6of which:
Germany 0.5 0.4 0.6 0.8United Kingdom 0.5 0.3 0.5 0.8
Portuguese-Speaking African Countries 0.5 0.4 1.5 6.5Brazil 0.3 0.3 0.7 1.4Other countries 0.8 0.7 1.4 2.0
Asylum seekers 0.3 0.3 0.3 0.3
Foreign population3 172.9 175.3 177.8 190.9By region of residence
Region of Lisboa 95.3 96.8 98.1 105.4Region of Setubal 16.0 16.2 16.4 18.0Region of Algarve (Faro) 21.7 22.4 23.1 24.9Other regions 39.9 39.9 40.2 42.6
By region of originAfrica 81.2 81.7 82.5 89.5Europe 47.3 49.7 51.9 56.7South America 27.7 25.3 24.9 25.8North America 10.8 10.6 10.3 10.2Other regions 5.9 8.0 8.2 8.7
Acquisition of Portuguese nationality 1.2 1.4 0.5 0.9
Mixed marriages 1.2 1.3 1.4 1.6% of total marriages 1.9 2.2 2.1 2.3
Foreign labour force by professional status4 86.8 87.9 88.6 91.6Self-employed 16.7 17.0 17.1 17.9Wage earners 69.7 70.6 71.2 73.7

Trends in International Migration
230
© OECD 2001
Mixed marriages
Continuing the upwards trend observed since 1996, there were 1 600 mixed marriages in 1999. Theyaccounted for just over 2.4% of all marriages. The most numerous concerned Brazilians. In contrast to previousyears, the majority of these marriages in 1999 were between Portuguese men and foreign women.
Naturalisations
Following the introduction in 1981 of the possibility of possessing dual nationality, the annual number ofnaturalisations remained very low until 1998 when the figure increased fivefold to over 500. In 1999, the figurealmost doubled to 950 (see Table III.32). The overwhelming majority of naturalisations concerned non-European nationals from major countries of Portuguese emigration: Canadians, Venezuelans and United Statescitizens accounted for 40% of the total, Brazilians for 20% and nationals of Portuguese-speaking African coun-tries for a further 28%.
3. Migration and the labour market
Migration for employment and work permits
Since May 1998 the new Employment of Foreigners Act has allowed legally resident foreigners to work inPortugal without being subject to any numerical restrictions (under the previous legislation, the total numberof foreigners employed in firms with five or more employees could not exceed 10% of the total workforce,though this rule did not apply to nationals of European Economic Area countries, or to nationals of countrieswhich have bilateral agreements with Portugal, notably Brazil and Cape Verde).
The foreign labour force was estimated at 91 600 in December 1999, an increase of 3% on the previousyear (see Table III.25). Nationals of Portuguese-speaking African countries accounted for almost half the total,Brazilians for 11% and European Economic Area nationals for slightly less than 30%. Approximately 80% arewage-earners. Highly qualified occupations are largely performed by Europeans and the low-skilled orunskilled jobs by those from developing countries.
In line with the national trend, the overall unemployment rate for foreigners fell from 5.6% to 4.9% in 1999.This overall figure masks, however, considerable differences between national groups: whereas, for example,the unemployment rates of Spaniards and Germans were below the national average, those of Angolans andcitizens of São Tomé and Principe both exceeded 11%. This difference should, however, be treated with somecaution as these figures do not include undocumented immigrants, the percentage of whom from African coun-tries is disproportionately high.
4. Policy developments
Migration policy in Portugal has two facets, one applicable to the Portuguese community residing abroadand the other applicable to immigrants in Portugal. The two facets of this policy reflect coherent goals andexplain the focus on migrants’ rights, their political and social integration in the host country and objectiveinformation concerning their contribution to development.
Portuguese community abroad
The two main legislative developments in this field in 1999 and 2000 were the introduction of social assis-tance for the needy elderly among the Portuguese overseas communities and the implementation of the“Train in Portugal” programme. The first entitles elderly (over 65 years of age) persons of Portuguese origin liv-ing legally abroad and who are experiencing socio-economic needs that the local systems of social security orpublic aid can not satisfy to a monthly social subsidy corresponding to half of the difference between thePortuguese state pension and the social benefits available in the foreign country. The “Train in Portugal” pro-gramme, overseen by the Ministries of Foreign Affairs and of Labour and Solidarity, is targeted at young Portu-guese nationals (aged between 18 and 30 years old) or young people of Portuguese descent living abroad. The
Portugal
231
© OECD 2001
programme offers 1 000 fellowships of nine months duration in order to enable them to complement and per-fect their socio-professional skills through training and experience in the Portuguese labour market. It aims toenhance the professional skills of the target groups in a context that increases their knowledge of the Portu-guese entrepreneurial fabric and strengths their links with the effective or ancestral origin country.
Regularisation programme
In July 2000, the Government obtained a legislative permit from Parliament to amend the Act of8 August 1998 dealing with the admission, residence and departure of foreigners. Most notably, the acceptedamendment provides for “authorisations of permanence”: these allow undocumented foreigners in possessionof a firm offer of employment to reside in the country temporarily (for an initial period of one year, with thepossibility of the permission being renewed through to a maximum of five years). A promulgation of thisamend is expected since January 2001 and will certainly start a period of special regularisation of the undocu-mented workers living in Portugal. As of July 2001, almost 76 500 residence permits have been delivered (33%to Ukrainians and almost 20 to Brazilians).
International agreements
Under the heading of co-operation policies, measures have been taken to assist the development pro-cesses of the Portuguese-speaking African countries. These measures include the improvement of governancesystems, the development of education and vocational training structures as well as the promotion of joint-ventures between Portuguese and PALOP companies. In the 1990s there was a significant increase in the num-ber of protocols signed between Portuguese and PALOP municipalities; this phenomenon reveals Portugal’sincreasing involvement in international co-operation at the local level.
Box III.8. Links with Portuguese communities abroad
Portuguese nationals residing abroad are represented by directly elected members of Parliament. Across theworld there are a little over 2 000 associations created by migrants or their descendants. The aim of policy with regardto emigrants is to encourage political and social integration of the Portuguese in their host countries whilst respectingthese emigrants’ national identity, and to maintain links with emigrant communities. Measures are therefore designedto safeguard and disseminate the Portuguese language, facilitate links between the communities, and defend theinterests and rights of Portuguese emigrants. To this end, numerous approaches have been developed. They includeassistance for the teaching of Portuguese; grants to associations, missions and other organisations of Portuguese resid-ing abroad; and, socio-cultural exchanges and vocational training programmes co-funded by the European Social Fund.
There are other forms of aid, such as financial assistance, legal, economic and social services, special bankaccounts and preferential credit through an emigrant savings scheme which makes capital loans. Further mea-sures were introduced in 1996, chiefly focusing on developing and modernising the services of Portuguese consu-lates and improving the dissemination of legal information to Portuguese communities abroad (using theInternet, for instance). In September 1996, Parliament unanimously passed a law setting up the Council of Portu-guese Communities, a body to advise the government on policies concerning emigrant communities. This Councilrepresents all Portuguese people living abroad who wish to be involved. It has one hundred elected members.

Trends in International Migration
232
© OECD 2001
Romania
Introduction
Between 1990 and 1992, substantial numbers of Romanian citizens, both of non-Romanian and Romanianorigin, left to settle permanently abroad. Current estimates of the outflow by the Romanian authorities suggestthat having fallen substantially to a relatively low level the flow continues to diminish. Although return migra-tion declined in 1999, the figure was nevertheless almost twice that of 1995; readmissions were virtuallyunchanged. Previous reports have underlined Romania’s increasing importance as a transit destination in theEast-west emigration flow, a feature linked, inter alia, to its relaxed visa regime. As part of their efforts to securemembership of the European Union, the authorities are making greater efforts at combating this phenomenon.These efforts include, most notably, greater vigilance regarding the issuance of visas and increased attentionto border control.
1. Trends in migration movements
Emigration
According to estimates made by the Ministry of the Interior on the basis of compulsory customs formscompleted by those intending to leave the country on a permanent basis and data on those already abroadwho apply for the renewal of their passport at a local embassy or consulate, the permanent emigration flowdeclined once again in 1999, by 28% to 12 600. This was less than half the 1995 figure which itself was approxi-mately one quarter of that of 1990. Although the countries of destination are becoming more diffuse, over 90%settle in OECD Member countries; the European Union receives 50%. Accompanying the steadily declining rel-ative importance of the emigration flow to Germany, that to the United States is gaining in importance:in 1999 the figures were virtually identical, each accounting for just under 19% of the total. Of the 2 450 personswho had tertiary-level education, slightly less than one third went to Canada, just under one quarter went tothe United States and just over 10% went to Germany. The proportion of the total flow accounted for by mem-bers of ethnic minorities has been in steady decline: whereas in 1993 they accounted for just over half thetotal outflow, in 1999 the figure was less than 10% (see Chart III.14).
Excepting the relatively small volume arranged under the aegis of the Ministry of Labour and Social Wel-fare, temporary foreign employment is registered only in the general flow of those temporarily leaving thecountry. Data on individually arranged seasonal work remains sketchy.
Based on agreements between the Governments of Germany and Romania, 3 900 employment contractsof eighteen months duration and just over 7 100 seasonal contracts of three months duration in the fields ofagriculture, forestry and hospitality were approved in 1999, an increase of 40% on 1998. The beneficiaries ofthe eighteen months contracts are young workers aged 18-35 years in possession of a high level of educationand a solid understanding of the German language. Information on the similar bilateral arrangements withHungary, Greece, Italy and Turkey is not available.
Previous editions of this report noted that the Israeli authorities had estimated the contingent of docu-mented and undocumented Romanian workers employed in their country at between 60 000 and 100 000; amore recent estimate has not been made available.
Romanian citizens as asylum seekers
Although the UNCHR, having come to the view that basic standards of human rights were being observedin Romania, ceased at the end of 1997 to consider it as a generator of refugees, the number of new applica-tions submitted in 1999 was, at slightly over 9 400, 4% more than in 1998. Whereas the proportion of theseapplications made in France declined sharply from just under one third to less than 5%, the proportionreceived by United Kingdom doubled to over 20% and that received by Ireland rose from 11% to 24%. The
ROMANIA

Romania
233
© OECD 2001
Chart III.14. Demographic characteristics of permanent emigrants,1 1990-1999, RomaniaPercentages
56
00
00 100
54
52
50
48
46
100
80
60
40
20
0
100
80
60
40
20
0
80
60
40
20
0
100
80
60
40
20
0
-18 18-25 26-40 40+
1990 91 92 93 94 95 96 98
1990 91 92 93 94 95 96 98 1990 91 92 93 94 95 96 98
1990 91 92 93 94 95 96 981990 91 92 93 94 95 96 98 9797
97
97 97
99 99
99
99 99
Ethnic groups Destination countries
Share of women (%) Age groups
Educational attainment
VocationalSecondaryPost-secondary
OtherPrimary
OthersHungariansGermansRomanians2 Germany United States Canada Others
1. Estimates by the Ministry of the Interior. Persons having reported theirintention to settle abroad.
2. Romanian nationals with no other declared ethnic affiliation.Source: Ministry of the Interior.
Trends in International Migration
234
© OECD 2001
overall recognition rate is extremely low, indicating, it would be reasonable to suppose, that the motivatingfactor behind the claims was to render legitimate the applicants’ residence status.
Inflows and outflows of foreigners
Having increased steadily through to the mid-1990s and then by 35% in both 1997 and 1998, the numberof applications for repatriation declined by 7% in 1999 to 10 500. This overall decline was due to a fall in thenumber returning from countries other than Moldova. Such persons accounted for 30% of the total in 1998; dueto the absolute decline in their numbers and the 3% rise in 1999 (following an almost five-fold riseover 1997 and 1998) in the number of persons returning from Moldova they accounted for only 20% of the totalin 1999. Of these countries, the most important are Germany, Hungary and the United States – together theyaccounted for just under 10% of the total in 1998 and for 7% in 1999.
Since 1993, approximately 140 000 Romanian citizens (the majority of whom were found in illegal situa-tions) have been expelled from third countries. Almost two thirds were expelled from Germany and slightlyover one fifth from Hungary. There were 21 900 expulsions in 1999, almost exactly the same as the precedingyear. Just over 90% of these expulsions were made by the 18 countries with which Romania has signed a read-mission agreement. Whereas the numbers being returned from Germany are steadily declining (at 4 500, thefigure in 1999 was just over half that of 1997), that from Hungary has been rising sharply since 1997: at almost8 000, the 1999 figure was over twice that of the previous two years combined.
Refugees and asylum seekers
Romania received nearly 1 670 applications for refugee status in 1999, an increase of one third onthe 1998 figure. Citizens of Bangladesh (460), the former Yugoslavia (390), Afghanistan (290), Iraq (150) andPakistan (100) together accounted for over 80% of the total. Of the 1 750 decisions made in 1999 fewer than600 were positive: applications by citizens of countries other than the former Yugoslavia (only 40 rejected ofover 410 decisions made), Afghanistan (just under 150 accepted out of 270 decisions made) and Iraq(30 accepted out of nearly 190 decisions) were almost invariably rejected. Most notably, with the exception ofthe 22 acceptances out of the 68 decisions made concerning citizens of the Congo, Morocco, Rwanda, SierraLeone, Somalia and Sudan, all decisions concerning persons from Africa and the Indian sub-continent werenegative.
Illegal immigration
The number of people caught attempting to illegally cross Romania’s borders by evading official bordercrossing points continues to rise. Having been broadly constant from 1994 to 1997, the number rose by overone third in 1998 and by 13% in 1999 to 1 900. By contrast, whereas in 1997 36 000 foreign citizens were foundto be in illegal situation as consequence of controls carried out within the country (more than doublethe 1993 figure), in 1999 the figure was less than 7 300; of these, 1 170 were expelled.
2. Structure and changes in the foreign population
A clear trend has developed whereby due in part to return migration (particularly in the case of Greek cit-izens) and to the fact that since 1990 there has not existed an institution with the authority to grant this status,the stock of immigrants with permanent resident status continues to decline, standing at present at slightlyless than 1 300 (see Table III.33). A proposal to have this institutional deficiency remedied in the context of anew law on foreign citizens’ status is still awaiting approval by the Romanian Parliament.
In the absence of the possibility of acquiring permanent residence status, foreigners wishing to prolongtheir stay beyond 120 days are obliged to obtain a renewable temporary residence permit. The number ofsuch persons rose by 12% in 1999 to 61 900. The most significant increases were of Chinese (30% to bring theirnumber up to over 6 700), Italians (29% to 4 600), Turks (22% to 5 200) and Moldavians (14% to 6 900). Alongwith the Greeks, whose number declined slightly to 5 120, these national groups comprise almost 50% of thetotal. As in recent years, nearly half were classified as entrepreneurs. Over 95% of the Chinese were so classi-fied as were over 80% of the Turks; the proportion of Moldavians in this category is negligible. Students and

Romania
235
© OECD 2001
trainees accounted for just under one third of the temporary residence permit holders. Their number, whichwas almost unchanged in 1999 at 17 800, is determined largely by the quantity of scholarships awarded by theRomanian government. The largest proportion, almost two fifths, are from Moldova; just under one quarter areGreek. Of particular note in 1999 was the almost 40% increase to 6 100 in the number of persons holding tem-porary residence permits with the object of providing technical assistance, usually in the context of foreigndirect investment projects. Of these persons, 1 150 were Italian, nearly 700 German and just over 500 British.
Naturalisations
Though they remain few in number, the number of naturalisations has been increasing sharply. From70 in 1997, the figure rose to 195 in 1998 and to almost 250 in 1999 (all of which were granted in the first half ofthe year). As previously, the majority (three quarters) of applications were approved upon completion ofthree years of marriage to a Romanian citizen. The remainder were company proprietors and a small numberof employees with permanent contracts who had resided in Romania for over five years. In almost all casesnaturalised foreign citizens have retained their original citizenship. In 1999, over one third of those naturalisedwere from Syria and almost one quarter were from Italy.
Table III.33. Current migration figures in Romania
Thousands
1. Residence permits valid for a period longer than 120 days.2. Estimates based on the number of expulsions, the number of persons detected within Romania and at the border.Sources: Romanian Ministry of the Interior; Statistiches Bundesamt (Germany).
1996 1997 1998 1999
Stocks of foreignersStock of persons with permanent residence status 1.6 1.4 1.4 1.3Stock of persons with temporary residence visas1 55.7 55.0 55.3 61.9
Republic of Moldova 7.1 6.9 6.0 6.9Greece 6.2 5.7 5.3 5.1China 4.4 5.4 5.2 6.7Turkey 5.1 5.5 4.2 5.2Italy .. .. 3.6 4.6Syria 4.1 3.8 3.3 3.4Other 28.8 27.7 27.7 30.0
of which: Foreign citizens in education and training 22.7 20.4 17.6 17.8Republic of Moldova .. .. 5.9 6.7Greece 5.8 4.9 4.7 4.2Albania .. .. 0.6 0.7Israel 1.2 1.0 0.6 0.5
Return migration 6.3 8.4 11.3 10.6
Asylum seekers and refugeesRefugee claims submitted 0.6 1.4 1.2 1.7Refugee status granted 0.1 0.1 0.3 0.6
Illegal immigrationNumber detected at border (including romanian citizens) 1.0 1.2 1.7 2.0Number detected within borders 4.2 5.5 4.0 7.3Estimated stock of illegal migrants2 15.0 18.0 18.0 18.0
ExpulsionsRomanian citizens expelled from other countries 18.1 16.9 21.6 21.9Foreigners expelled from Romania 1.2 1.4 1.6 1.2
Romanian citizens in Germany:A. Migration flows between Romania and Germany
Ethnic Germans from Romania 4.3 1.8 1.0 0.9Inflows of Romanian nationals 17.1 14.2 17.0 18.8Outflows of Romanian nationals 16.6 13.6 13.5 14.7Asylum seekers from Romania 1.4 0.8 0.3 0.2
B. Stock of people from Romania in GermanyStock of Romanian nationals 100.7 95.2 89.8 87.5Acquisitions of German nationality by former Romanians 9.8 8.7 6.3 ..

Trends in International Migration
236
© OECD 2001
3. Policy developments
Co-operation with the European Union
An inter-departmental working group was established in February 2000. Its principal task is to draw upshort and medium-term measures to bring national policies relating to the free movement of persons into linewith those of the European Union and thereby accelerate the obtention of free movement for Romanian citi-zens in the European Union area. This working group includes representatives of the Ministry of ForeignAffairs, the Ministry of Justice, the Ministry of Home Affairs, the Ministry of Finances, the Ministry of PublicFunction and Romanian Intelligence Office.
Since the third quarter of 2000, under the auspices of the Phare Programme, the Romanian authoritieshave been making increased efforts to secure the country’s borders; passports complying with the criteria ofthe Schengen area were introduced at the beginning of 2001.
Readmission agreements
Following the signature of a readmission agreement with the Finnish Government on 5 November 1999 theonly EU Member States with which Romania had not yet concluded such an agreement were the United Kingdomand Portugal: the Romanian Ministry of Foreign Affairs has recently submitted a draft agreement to UnitedKingdom authorities.
As a part of their efforts to harmonise their immigration legislation with the acquis communautaire, the Roma-nian authorities are particularly keen to conclude readmission agreements with countries known as having ahigh emigration potential. To this end, the Romanian authorities have drawn up draft agreements which are tobe put forward, as initial negotiation positions, to the authorities of Afghanistan, Albania, Bangladesh, China,Estonia, Macedonia, Mexico and Sri Lanka. Proposals have already been made to the authorities of Egypt, Iranand Lebanon. A readmission agreement with Bulgaria was signed on 23 July 2000.
Labour migration agreements
In the first half of 2000, Romania signed labour migration agreements with the governments of Germany,Hungary and Switzerland.
The agreement with Hungary came into force in July 2000. Under this agreement, 7 000 seasonal workerscan take up employment in Hungary for a maximum 6 months during the calendar year. The agreement alsoprovides for 800 trainees to work in Hungary for one year, with the possibility of their stay being extended bysix months. The trainees must be aged between 18 and 35 years and should have undertaken a skilled activityfor at least two years. Others wishing to work in Hungary will be assisted by the specialised agencies of theMinistry of Labour and Social Protection. Although a work permit is required they are free of charge; this alsoapplies to Hungarians wishing to work in Romania.
The agreement concluded with Switzerland also came into force in July 2000. Under this agreement,Switzerland will take 150 trainees each year. As with the agreement with Hungary, the trainees must be agedbetween 18 and 35 years and should have undertaken a skilled activity for at least two years. The training con-tracts are also valid for an initial 12 month period with the possibility of a six month extension.
The agreement concluded with Germany came into force in August 2000. It only applies to informationtechnology graduates. The persons selected will be able to sign a three year employment contract, with thepossibility of it being extended to five years.
Work permits
Work permits were introduced in December 1999. Valid for an initial six month period upon payment of aUSD 200 fee with the possibility of further six month extensions at a cost of USD 100, they are issued by theMinistry of Labour and Social Protection. Though issued to the foreign employees, they are retained and man-aged by the employer (natural or legal person). Employing a foreigner without a permit renders the employerliable to a fine of USD 250 to 500.

Slovak Republic
237
© OECD 2001
The following categories of foreigner are exempt: Those who:
• Have settled their domicile in Romania in compliance with the law regulating this situation.
• Have been granted refugee status in Romania.
• Have been hired by natural or legal persons residing permanently abroad and are sent by them to carryout certain temporary activities in Romania.
• Are required by Ministries or by other central or local government bodies to carry out certain temporary(not exceeding 30 days) activities (teaching, scientific or artistic activities, etc.) on Romania’s territory.
• Are in other situations set out by conventions or agreements to which Romania is a signatory.
Integration of refugees
In the absence of governmental programmes designed to promote the economic, social and cultural inte-gration of refugees, the organisation “Romanian Forum for Refugees and Migrants” set up in January 2000 aprogramme to provide advice and assistance refugees seeking work. This programme is designed in particularto assist refugees who are no longer receiving the reimbursable financial allowance that is granted for a maxi-mum period of nine months upon obtaining refugee status.
Slovak R epublic
Introduction
After several years of strong economic performance, GDP growth plunged from 6.5% in 1997 to 1.9%in 1999. The unemployment rate had been stable around 12% in 1997 and 1998 but increased rapidly to 16.4%in 1999 and 18.6% in 2000.6 The government’s decision that government consumption is not a structural meansto promote economic growth and the consequent drastic cuts may explain much of the sharp rise in unem-ployment. Inflation shot up from 6.1% in 1997 and 6.7% in 1998 to 14.2% in 1999.
The natural population growth has slowed down dramatically from 4.2 births per thousand inhabitantsin 1993 to 0.7 in 1999. Net migration accounted for 38% of the total population growth in 1999. The elderly sup-port ratio has been stable around 3.5 since 1997.
1. Trends in migration movements
Immigration has decreased since 1996 whilst emigration has been increasing since 1994; net migration isnegative and with some fluctuation has been growing in absolute terms from –1.1 in 1996 to –1.6 in 1999 (seeTable III.34).
Emigration
Emigration has seen a rising trend since the first year of the existence of the Republic in 1993, and grewfrom 154 persons in 1994 to 618 persons in 1999. The lion’s share in emigration is emigration to Europe, and inparticular to the Czech Republic. These numbers are gross underestimates because parting residents areasked to report their departure, but without obligation. More reliable numbers can be obtained by using thenumbers on Slovak immigrants as the Czech Statistical Office reports them.7 They show a stable pattern ofaround 3 000 on an annual basis.
SLOVAK REPUBLIC

Trends in International Migration
238
© OECD 2001
Inflows and outflows of foreigners
Annual inflows of foreigners are modest and have shown a slightly decreasing trend. There were in total2 072 immigrants in 1999 of which 846 were of Czech origin. The second largest group of immigrants comesfrom the Ukraine, but their numbers have rapidly decreased since 1997.
Illegal immigration
Compared to the registered migration movements, illegal border crossings are numerous. Their numbersfluctuate but show a strong increasing trend. Most people are caught trying to get into Slovak territory at the
Table III.34. Current migration figures, Slovak Republic
Figures in thousands unless otherwise indicated
1. The outflow is under-reported because people leaving the country are requested but not required to report their departure.2. Changes of permanent residence in the Czech Republic. The data are issued by the Czech Statistical Office.3. Stocks as of 31 December of the years indicated.4. The data refer to the stock of work permit holders as of 31 December of the years indicated.5. Under a bilateral agreement signed by the Czech and Slovak Republics in 1992, nationals of each Republic have free access to both labour markets. Data
on Czech workers are monitored by the National Labour Office of the Slovak Republic.Sources: Ministry of Labour and the National Labour Office of the Slovak Republic; Czech Statistical Office.
1996 1997 1998 1999
Inflows of permanent residents 2.5 2.3 2.1 2.1Arrivals (excluding those from Czech Republic) 1.5 1.4 1.3 1.2Arrivals from Czech Republic 1.0 0.9 0.8 0.9
Outflows of permanent residents 3.6 3.1 3.4 3.6Departures (excluding those to Czech Republic)1 0.1 – 0.5 0.4Departures to the Czech Republic2 3.5 3.1 2.9 3.2
Net migration –1.1 –0.8 –1.3 –1.6
Residence permits newly granted by categoryLong-term residence permits 3.5 4.1 4.7 4.4Permanent residence permits 1.9 2.0 1.7 1.4
Family reunification 1.5 1.6 1.3 1.1Other 0.4 0.4 0.4 0.3
Inflows of asylum seekers 0.4 0.6 0.5 1.3
Illegal migrants caught at the border 3.3 2.8 8.2 7.8of which:
Inflows 1.0 0.7 1.9 2.7Outflows 2.4 2.1 6.3 5.1
Holders of permanent or long-term residence permit, by country of origin3
Czech Republic 5.1 5.8 .. ..Ukraine 3.0 3.5 .. ..Poland 2.5 2.8 .. ..Former Yugoslavia 2.0 2.0 .. ..Other 11.6 10.7 .. ..Total 24.1 24.8 27.4 29.5
Work permit holders, by country of origin4
Ukraine 0.6 0.7 0.7 0.4Poland 0.5 0.6 0.7 0.2United States 0.4 0.3 0.3 0.2Other 1.8 2.2 2.0 1.3Total 3.3 3.8 3.7 2.2
Estimates of Czech workers5 1.5 1.7 2.2 2.4
Slovak citizens abroadSlovak workers in the Czech Republic 72.2 69.7 61.3 53.2
% of total foreign workers in the Czech Republic 50.4 53.3 55.1 56.9Slovak citizens in Hungary 3.7 3.7 1.6 1.7
% of total registered foreigners in Hungary 2.6 2.6 1.0 1.1Slovak workers in Austria 3.7 4.0 4.0 4.0
% of total foreign workers in Austria 1.4 1.6 1.6 1.7

Slovak Republic
239
© OECD 2001
Hungarian and Ukrainian borders while most illegal outflows appear to occur at the Czech, Austrian and Polishborder. This may indicate transit flows from East to West and from South to North. Since the introduction ofvisa obligations for Ukrainian nationals, the number of illegal border crossings at the Ukrainian border has vir-tually exploded (from 99 in 1997 to 1 589 in 1999). In 2000, up to October, 4 920 people were caught attemptingto cross the Slovak borders illegally.
Refugees and asylum seekers
The number of asylum applications has more than doubled in 1999 (1 320, from 506 one year earlier). Thistrend appears to continue in 2000 (1 550 applications). Of these, in 1999, only 27 were granted the refugee sta-tus and 2 could obtain Slovak nationality. Most applications come from Afghanistan refugees (57% in the first9 months of 1999).
Family reunion
Around 72% of all permanent residence permits in 2000 (see Section 2) are granted for reasons of familyreunification. (Between January and October 2000, 614 out of 852 permanent residence permits were grantedfor family reunification).
2. Structure and changes in the foreign population
Numerical trends
At the end of 1999, there were 29 498 resident foreigners in the Slovak Republic. Of these, there were11 650 long-term residence permits and 17 848 permanent residence permits (see Table III.34). Foreignersfrom former socialist countries hold the largest share of residence permits, i.e., the Czech republic, theUkraine, Poland, Hungary, the Federal Republic of Yugoslavia and Vietnam. There is no track of visas for lessthan 180 days.
According to declared ethnic origin, the largest group of foreigners originate from Hungary (567 800 or10.5% of the total population in 1999). Hungarians are concentrated in the South and the East of the country,near the Hungarian and Ukrainian borders. Romanians (1.7%) and Czechs (1.1%) are the second and third larg-est minority groups, respectively. Self-reporting in the population census may result in some nationalities’being underrepresented in the national population statistics (particularly Romanians).
The Romanian population has a much higher growth rate than the native Slovak population and theirshare in the total population has been continuously increasing from 1.5% in 1991. An explanation may be theage structure of the immigrant Romanian population, which is much younger than the native population’s agestructure. Immigrant populations of other nationalities are in general older than the native Slovak population.
3. Migration and the labour market
Migration for employment and work permits
The Act on Employment from 1996 and the Labour Code regulate the employment of foreigners: all for-eigners need a work permit to undertake any professional activities in the Slovak Republic. Foreigners holdinga permanent residence permit, Czech citizens; foreigners of Slovak origin and refugees are exempted. A workpermit can only be granted on the basis of a residence permit. The initial work permits for foreign employees,to be requested by either the worker or the employer, are linked to the employer and do not give unrestrictedaccess to the Slovak Labour market. Prior to granting the preliminary permit, the Labour Office must verifywhether the job had been reported to the vacancy register and whether there are no suitable candidatesamong the registered unemployed.
In 1999, there were 2 003 such permits granted (of which 31 were temporary and 1 172 permanent per-mits). In addition, there were 1 571 temporary permits granted for entrepreneurs. A total of 1 753 work permitswere granted in the first 9 months of 2000. It appears from the statistics on the first 9 months of 2000 that the

Trends in International Migration
240
© OECD 2001
number of residence permits for employment or self-employment began to decrease, especially for self-employed workers.
The total stock of valid work permits has decreased quite considerably from 3 700 in 1998 to 2 200 in 1999(see Table III.34). This decline reflects the dramatic increase in unemployment that has hit the country(see Introduction). Ukrainians hold most work permits (18%), followed by Polish (11%), American (10%) andGerman (10%) workers.
Labour market integration
The presence of workers from the Czech Republic has become stronger and amounted to 2 400 in 1999,up from 2 200 in 1998. Of these, 92 were unemployed; at a rate of 3.9% it is much lower than that of Slovaknationals. Czech immigrants need neither residence nor work permit.
4. Policy developments
International agreements
In 1998, the Slovak Republic concluded a bilateral agreement with Switzerland authorising free move-ment, and is about to sign a similar agreement with Austria. Other agreements concerning free movement toand from Indonesia, the Philippines and France are in course of preparation. Free movement agreementsreserved exclusively to diplomats or the holders of special passports were signed in 1998 with Kazakhstan, theformer Yugoslav Republic of Macedonia, Algeria and Chile.
On the other hand, in the face of hundreds of applications for asylum from gypsies arriving from theSlovak Republic, the United Kingdom has unilaterally suspended its free movement agreement with thatcountry, as did Ireland, shortly afterwards, and the Bahamas. In the summer of 1999, the same measures wereadopted temporarily by Finland, while Norway adopted a preventive measure. Finland and Norway aban-doned these measures in November 1999.
Spain
Introduction
Spain’s economic growth accelerated again in 1999 to 4.1% which was almost 1 point more than the OECDaverage. This excellent performance, coupled with major labour market reforms, resulted in a more buoyantlabour market. Between 1996 and 1999, 1.4 million jobs were created, bringing the unemployment rate downto a little under 16%. Immigration benefited from the improved economic situation, with more than 91 000 newwork permits issued in 1999, an increase of 7% on 1998. The share of foreigners in Spain’s total population is2%, much lower than the average for the European Economic Area. That said, the number of foreigners isincreasing and has been higher than the different government estimates for the last few years.
1. Trends in migration movements
Inflows and outflows of foreigners
Spain’s migration policy is essentially quota-based. Its quota for foreign workers, set in 1993, had been themost stable in Spain’s migration history. Over the period 1993 to 1999, the number of applications filed all but tri-pled – from 37 000 to 97 000 – a figure that far exceeded the maximum quota of 30 000 set by the government.
A breakdown by nationality shows that the vast majority of migrant workers in Spain are Moroccans(around 40%), followed by immigrants from Ecuador, Peru and China (8.4, 7.3 and 6.7%, respectively). With
SPAIN

Spain
241
© OECD 2001
immigration so strongly concentrated, it has been possible to reach agreements and implement measures tocontrol and organise flows so as to facilitate the settlement of new arrivals.
Refugees and asylum seekers
In 1999, 8 400 asylum applications were filed, i.e. a 24% increase on the previous year. Around 96% wererefused. The largest groups of applicants were Algerians (16%) and Romanians (12%). Over the past 10 years,flows of asylum seekers have been steady, with no single nationality predominant.
2. Structure and changes in the foreign population
Numerical trends
In December 1999, the residence permit register showed that over 800 000 foreigners were resident inSpain, i.e. 2% of the total population (see Table III.35). The new regularisation operation should bring that fig-ure to 1 million or 2.5% of the total population by the end of 2000. Over the past three years, the foreign popu-lation has been increasing more rapidly, reaching an average of 14% per year. In the past five years, the foreignpopulation has doubled from 500 000 in 1996, to 1 million in 2000.
Nearly half of Spain’s foreign-born population is of European Community origin. It is expected thatthis figure will change as a result of the regularisation operation and show a larger percentage of non-EC
Table III.35. Current figures on flows and stocks of total population and labour force in Spain
Thousands
1. Stock of foreigners who hold a residence permit. Permits of short duration (less than 6 months) as well as students are excluded. Data refer to the populationon 31 December of the years indicated and include permits delivered following the 1996 regularisation programme.
2. Excluding persons recovering their Spanish nationality.3. Total permits issued, including seasonal and cross-border workers and renewals of permits. Provisional figures for 1999.4. Since 1 January 1992, the nationals of the European Union do not need a work permit.5. Seasonal and cross-border workers.6. Data are for 31 December of each year and are numbers of valid work permits. Workers from the EU are not included. Data include work permits delivered
following the 1996 regularisation programme. Provisional data for 1999.Sources: General Directorate on Migration; Ministry of Labour and Social Security; Ministry of Justice.
1996 1997 1998 1999 1996 1997 1998 1999
Stock of foreign residents1 539.0 609.8 719.7 801.3 Total work permits granted3 126.4 86.8 85.5 91.6of which: Women 39.7 31.9 35.3 35.1
By region of origin By industry divisionEurope 273.3 289.1 330.5 361.9 Agriculture 26.0 18.4 18.6 18.1Africa 98.8 142.8 179.5 211.6 Industry 8.6 5.8 4.6 6.5America 121.3 127.0 147.2 159.8 Building 12.2 7.2 5.1 8.7Asia 43.4 49.1 60.7 66.5 Services 72.7 53.5 55.5 55.7Oceania 0.9 0.9 1.0 1.0 Not specified 6.9 2.0 1.6 2.6Stateless 0.4 1.0 0.7 0.5 By region of origin
Africa 70.6 44.2 36.6 41.8By region of residence Central and South America 30.2 23.3 29.1 28.9
Madrid 111.1 116.0 148.1 158.9 Asia 15.8 12.5 12.3 12.0Barcelona 84.5 90.7 104.3 129.2 Europe (except EU)4 8.0 5.7 6.4 7.8Malaga 37.1 41.9 47.1 53.1 North America 1.6 1.1 1.0 0.9Alicante 42.7 42.6 44.6 51.9 Oceania and other 0.2 0.2 0.2 0.2Other 263.5 318.7 375.6 408.3 By type of permit
Long-term work permitsAcquisition of Spanish nationality2 8.4 10.3 13.2 16.4 Employees 29.6 27.3 17.3 24.3
Self employed 4.8 3.7 2.9 3.3One-year work permit
Employees 81.1 51.1 61.7 60.4Self employed 7.0 3.1 2.0 1.7
Other5 3.9 1.7 1.6 1.9
Stock of foreign workers6 166.5 178.7 197.1 172.8
Trends in International Migration
242
© OECD 2001
immigrants. The figure reflects both the high refusal rate for applications to extend stays in Spain – which hasled to an increase in the number of illegal residents who want to remain in the country anyway – and an under-estimation of the numbers of non-EC foreigners. The results of the 1996 regularisation operation, which wasaimed solely at foreigners who had previously held a residence permit, clearly showed that a high percentageof illegal residents remained in the territory despite being banned.
Half of all foreign residents are aged between 25 and 44 and 20% are aged between 45 and 46. Moreretired residents are from EC countries than from elsewhere. The majority of South American and Africanimmigrants are between 25 and 44 years of age. This said, the Moroccan community has a high proportion ofyoung children and careful monitoring is required to facilitate their integration into the education system.
Naturalisations
The number of naturalisations rose for the fourth consecutive year. In 1999, more than 16 000 foreignersobtained Spanish nationality (see Table III.35). Despite this, the percentage of naturalisations is quite low(2.3%), although it is Spain’s highest ever. Almost two-thirds of those naturalised were from South America,mainly from the Dominican Republic and Peru. One in five applicants was of African origin, mainly fromMorocco. The biggest increase was in applications from nationals of Ecuador and Cuba.
3. Migration and the labour market
Migration for employment and work permits
In 1999, more than 90 000 work permits were issued, 6 000 more than in the previous year (seeTable III.35). This figure is an underestimate, given the time lapse between the closing of the statistical regis-ter and the registration of new arrivals in certain provinces. The actual figure is more likely to be around115 000 permits, reflecting the buoyancy of the labour market in 1999. Over 90% of permits were for salariedemployment and the breakdown by sector shows that the majority were for the service sector (over 60%) andthe primary sector (20%) rather than industry and construction (10% and 7%, respectively). This said, the con-struction sector showed the highest increase, along with the hotel and catering sector.
At the end of 1999, a total of 335 000 foreign workers were registered with the Social Security. Menaccounted for 65% of that total and, of them, 80% were under 45 years old. Two out of three workers wereemployed in the service sector and seven out of ten were concentrated in nine provinces. Of these,213 000 were of non-EC origin. The majority (77 000) were from Morocco, followed by Peru (14 500).
Regularisation in 2000
Spain conducted another regularisation operation in 2000, its third in 10 years, after similar operationsin 1991 and 1996. Of a total of almost 245 000 applicants, 150 000 were granted legal status. Provisional results(with 40 000 applications still to be processed) indicate that most applications were filed by new immigrants,and only 7% by applicants who had previously held a permit which had not been renewed. Over 90% of appli-cants filed an application for a residence and work permit, 6% just for a residence permit and 2% for aEuropean Community residence card. However, there is still some hope for those whose applications wereturned down. The government has been trying to reach agreement with the opposition on a Bill on the statusof foreigners, which provides for a review of applications that have been refused and eases the criteria forregularisation.
Around one-third of applicants are seeking employment in agriculture, 15% in domestic service androughly the same percentage in the construction sector. The majority of applicants (around one-third) are ofMoroccan origin, followed by nationals of Ecuador and Columbia (10%). The only new development has beenthe big increase in applications from the latter two countries. Until recently, Peru and the Dominican Republichad been the main Latin American countries of origin of immigrants to Spain.

Sweden
243
© OECD 2001
4. Policy developments
In November 2000, the Spanish Parliament passed Spain’s new Immigration Act after the first reading of theBill. In many areas, it is much more restrictive than the previous Act, which came into force in February 2000. Thenew Act provides for the immediate expulsion of foreigners resident in Spain illegally, while the previous legisla-tion had simply introduced a system of fines. Permanent residence permits can now be obtained only after fiveyears residing and working in Spain, instead of two under the previous legislation. There are now three criteriafor entry into Spain: the possession of valid identity papers, proof of sufficient means of support for the durationof the stay and proof of the purpose and conditions of stay. Except in special circumstances, the government willno longer be required to explicitly state or justify the reasons for refusing to grant an entry visa. What is more, thetext restricts some of the constitutional rights that had been granted to all foreigners under the January 2000 Actconcerning foreigners resident in Spain illegally, such as the right to work, the right to strike and join unions andthe right of association and demonstration. Lastly, foreigners have the right to vote in municipal elections inSpain only if Spanish nationals are accorded reciprocal rights in the foreigner’s country of origin.
Sweden
Introduction
After a period of stagnation, Sweden’s economy has recovered, with a growth of 3.6% in 1998 and of 4.1%in 1999. The recovery has actually had a highly positive impact on the labour market, with the unemploymentrate falling to 6.4%, substantially below 8% for the first time since 1993.
In 1999, there were 981 633 foreign born people living in Sweden, out of a total population of 8.8 million.Over the last ten years, migration flows have fluctuated considerably. These changes are due both to eco-nomic trends and to the new thrust of Sweden’s migration policy.
1. Trends in migration movements
Inflows and outflows of foreigners
Emigration flows of foreigners have been relatively stable for the past ten years but have slightly gonedown the last three years. In 1999, 13 500 foreigners left Sweden. Scandinavian nationals used to be in major-
SWEDEN
Box III.9. 2000 regularisation campaign
The campaign applies to all foreigners continuously resident in Spain since 1 January 1999, provided thatthey are not the subject of an expulsion order, legal proceedings or an exclusion order, that they indicate on theirapplication the sector and profession in which they wish to work and meet at least one of the following require-ments: have been the holder of a valid work and residence permit during the period from 1 February 1997 to1 February 2000, have applied for a work and residence permit before 31 March 2000, or have filed an applicationfor asylum before 1 February 2000.
The campaign applies to three types of permit: the work and residence permit, residence permit and Euro-pean Community residence card. There are no geographical or sectoral limitations. Applicants who had previ-ously held one type of permit may upgrade it. Other applicants may be granted a one-year permit or, in the caseof family members of a Spanish national, a five-year permit.

Trends in International Migration
244
© OECD 2001
ity but their number is decreasing (5 200 in 1999, against 11 700 in 1990). Immigration peaked in 1994 with75 000 permanent entries (people stating that they wish to remain in Sweden for more than a year, not includ-ing asylum seekers with applications pending). By 1997, the figure had fallen by over a half to 33 400. In 1999,the figure rose slightly, to 34 573; the migration gain totalled 20 991, which was around 600 more than in 1998(see Table III.36).
Around 37 000 residence permits were issued in 1999, a decrease of 2 000 in comparison with 1998. Overhalf the permits were issued on family reunion grounds, 15% to refugees and 16% under European agreements.Immigration for employment purposes is negligible (343).
The main groups are of Scandinavian, Iraqi, Yugoslav, Iranian and Bosnian origin. Immigration from the fif-teen European Union countries totalled 8 836, or 25% of the total immigration. Some 52% of immigrants arefemale.
Refugees and asylum seekers
Since the early 1990s, the number of asylum seekers has fluctuated significantly, peaking in 1992 duringthe war in the former Yugoslavia, with a total of 84 000 applications. Numbers have since fallen substantially,numbering 5 800 in 1996. There were 12 460 asylum applications in 1998; the figure for 1999 reached 11 200.
In 1999, almost half of the asylum applications (48%) were made by Iraqis and nationals of the formerYugoslavia, 7.6% by Iranians, while smaller groups sought asylum from Afghanistan, Turkey, Somalia, Syria andLebanon.
The Swedish Government has taken further steps to encourage refugees to return home. The Governmentco-operates with the other Nordic countries in order to help elderly Bosnians to return. The project is not yetcompleted and it is too early to tell about its outcome. Earlier experiences, however, show that the outcome ofthese kinds of projects is patchy.
2. Structure and changes in the foreign population
In 1999, Sweden’s total population stood at 8.86 million, of whom 5.5% (487 200) were foreign citizens. Atthis time, over 981 600 people had been born abroad (11.8% of the total population). Of these, 40% had beenin the country for over twenty years and 581 500 held Swedish nationality. A further 796 200 people were bornin Sweden but had links, via their parents, with at least one other country. In 1999, there were in total1 777 800 people of foreign origin, accounting for 20% of the total population (see Table III.36).
After declining steadily since 1993, the number of naturalisations rose spectacularly in 1998. Naturalisa-tions totalled 46 502, a level not seen for over ten years, and included 8 991 nationals of the former Yugoslavia,and approximately 1 700 Finns and Turks. In 1999 the naturalisations declined to 37 800 and included4 000 nationals of the former Yugoslavia.
3. Migration and the labour market
During the 1950s and 1960s, Sweden made intensive use of immigrant labour to meet the needs of its rap-idly expanding labour market. Over that period, unemployment among immigrants was similar to that of thewhole population. The situation has deteriorated markedly since then and the number of immigrants receiv-ing social benefits has risen fivefold.
In 1999, there were 222 000 foreign workers in Sweden, of whom 111 000 were women (see Table III.36).This figure, relatively stable over the past five years, represents around 5% of the total labour force. Thosefrom the other Nordic countries and the former Yugoslavia predominate on the labour market. The largestgroup of foreigners are the Finns at around 52 000, followed by Yugoslavs (28 000) and Norwegians (19 000).Iranians, of whom there are approximately 8 000, form the largest non-European group.
The number of residence permits issued for employment purposes, chiefly to highly skilled workers andbusiness persons, was marginal (343) as in previous years. However, EU and Norwegian nationals are notincluded in these statistics.

Sw
eden
245
© O
EC
D 2001
Table III.36. Current figures on flows and stocks of foreign population and labour force, Sweden
Figures in thousands unless otherwise indicated
1. Data are from population registers and refer to the population on 31 December of the years indicated.2. Data are from population registers and refer to persons who declare their intention to stay in Sweden for longer than one year. Figures do not include asylum seekers who are waiting for decisions and
temporary workers.3. Residence permits are not required for Nordic citizens.4. Foreign background, first or second generation immigrant only.5. Persons with at least one parent born abroad. The increase between 1997 and 1998 is due to quality improvements in the population register.6. Annual average from the Labour Force Survey.Sources: Swedish Immigration Board ; Statistics Sweden.
1996 1997 1998 1999 1996 1997 1998 1999
Total population1 8 844.5 8 847.6 8 854.3 8 861.4 Number of residence permits % of foreign population 6.0 5.9 5.6 5.5 by category of admission3 31.7 36.6 39.4 37.4
Family reunification 18.8 18.9 21.7 21.7Stock of foreign population1 526.6 522.0 499.9 487.2 Refugees 4.8 9.6 8.2 5.6
Nordic countries 160.8 162.2 159.7 155.2 EEA-agreement 5.2 4.6 5.7 6.1Finland 103.1 101.3 99.9 99.0 Foreign students 1.5 2.4 2.7 2.8Norway 31.7 31.0 30.6 30.9 Adopted children 1.1 0.7 0.8 0.9Denmark 26.0 25.4 25.0 25.0 Employment 0.3 0.4 0.4 0.3
Other countries 365.8 359.8 340.2 332.0of which: Asylum seekers 5.8 9.6 12.5 11.2
Iraq 22.8 24.8 26.6 30.2 of which:Former Yugoslavia 36.6 33.6 26.0 22.7 Iraq 1.6 3.1 3.8 3.6Iran 27.2 26.2 19.8 16.1 Former Yugoslavia 1.0 3.0 4.9 2.4
Inflows of foreigners by nationality Persons with foreign background4 1 656.6 1 683.7 1 746.9 1 777.8or region of origin2 29.3 33.4 35.7 34.6 Foreign-born 943.8 954.2 968.7 981.6Nordic countries 5.6 5.3 5.8 7.0 Swedish citizens 510.6 579.2 558.2 581.5
Finland 2.6 2.8 3.0 3.4 Foreigners 433.2 375.0 410.5 400.1Norway 1.5 1.5 1.6 2.0 Born in Sweden 712.8 729.0 778.6 796.2Denmark 1.4 1.0 1.1 1.3 Swedish citizens5 632.3 646.0 695.5 716.9
Other countries 23.8 28.1 29.6 27.6 Foreigners 80.5 83.0 83.0 79.3of which:
Iraq 2.1 3.7 5.3 5.5 Stock of foreign labour6 218.0 220.0 219.0 222.0Finland 2.6 2.8 3.0 3.4 Nordic nationals 90.0 87.0 85.0 86.0
Non-nordic nationals 128.0 133.0 134.0 136.0Net migration of foreigners
by nationality2 14.9 18.1 21.8 21.0 Acquisition of nationality Nordic countries –1.0 –1.1 –0.3 1.4 by country of former nationality 25.6 28.9 46.5 37.8
Finland –0.2 –0.2 0.1 0.7 Former Yugoslavia 2.4 6.1 9.0 4.0Norway –0.5 –0.6 –0.1 0.5 Finland 2.0 1.9 1.7 1.6Denmark –0.2 –0.4 –0.1 0.3 Turkey 2.0 1.4 1.7 1.8
Other countries 15.8 19.3 22.1 19.6 Other countries 19.1 19.5 34.1 30.3of which:
Former Yugoslavia 1.9 4.4 1.7 0.9 Mixed marriages 6.2 6.3 6.3 7.0% of total marriages 17.2 18.0 18.2 18.1

Trends in International Migration
246
© OECD 2001
Temporary work permits are not systematically recorded in Sweden, but are issued for example to scien-tists and artists or for seasonal work, especially fruit-picking. Temporary work permits totalled 8 400 in 1996.
4. Policy developments
Migration policy
Numerous changes have occurred in Sweden’s migration policy in recent years. In particular, migrationprocedures as a whole are now managed by the Swedish Immigration Board, rather than by the police. TheBoard has recently taken over responsibility for all applications for residence permits. New offices have beenopened in air and seaports and in some provincial towns. The Board also runs the detention centres and it isgradually taking over responsibility for handling applications lodged at Sweden’s embassies throughout theworld.
New integration policy and a new authority
A new policy on integration came into effect in 1998 and a new authority was established to implement it.In September 1997, the government submitted a bill to Parliament entitled “Sweden, the Future and the Plu-ral Society – From Immigration Policy to Integration Policy”. In this framework, recognition of cultural and eth-nic diversity is considered a prerequisite for the shaping and enforcement of new legislation, in whateversector or sphere of society. Policies directly addressing immigrants, as a group, should be confined to expen-diture and measures necessary in the early years after arrival in Sweden.
Integration policy seeks particularly to:
• Provide opportunities to enable individuals to support themselves and to integrate in society.
• Preserve essential democratic values and work to guarantee equal rights and opportunities for men andwomen.
• Prevent and eradicate discrimination, xenophobia and racism.
The National Integration Office was set up in June 1998. It is responsible for implementing measuresdesigned to attain the objectives of the integration policy and seeing that the new approach impacts on allsectors of society. The Office further monitors and assesses developments concerning ethnic and cultural plu-rality in the community as a whole.
New naturalisation measures
Since the start of 1999, people who are unable to prove their identity may obtain Swedish citizenship ifthey have resided in Sweden for at least eight years and can provide some evidence that their declared iden-tity is correct.
In July 2001 a new Citizenship Law was enacted, which recognise dual nationality. The new law facilitatesthe acquisition of Swedish nationality for the children of unmarried Swedish fathers, adopted children andstateless persons.
Committee on Family Reunion
In 2000 the Government appointed a parliamentary committee to evaluate the effects of changes in rulesfor family reunion the Alien’s Act. The committee is also to investigate and evaluate issues concerning mar-riages, smuggling and the responsibilities for transporteurs. The committee will report to the Government atthe end of 2001.
A metropolitan policy
The economic and social differences in metropolitan regions increased during the 1990s. Many of the resi-dents in the most disadvantaged neighbourhoods are immigrants or children of immigrants. The Governmenttherefore decided it was necessary to formulate a metropolitan policy that would promote development in

Switzerland
247
© OECD 2001
these neighbourhoods. The policy was presented in a Bill and adopted by Parliament in December, 1998. Theobjectives of the policy are:
• To provide the foundations for sustainable growth in the metropolitan areas.
• To stop social, ethnic and discriminating segregation in the metropolitan regions, and to work for equaland comparable living conditions for people living in the cities.
Local development agreements have been concluded between seven municipalities and the Govern-ment. Since 1999, the National Integration Office has been engaged in co-ordinating the national evaluation ofthe local development agreements. So far the Office has presented three reports and further reports are beingcarried out. A final report on the effects of the policy will presented to the Government in June 2002.
Switzerland
Introduction
The economic upturn in Switzerland, which began in 1997, has continued over the past three years, withreal GDP growth likely to exceed 3% in 2000 and reach between 2 and 2.5% in 2001. The labour market situa-tion has again improved under the combined effect of a sharp rise in exports and intense activity in the con-struction industry, stimulated by substantial investment in housing and huge public utility projects. Thesound economic situation has had the effect of reducing unemployment, which should fall from 2.7% in 1999 tounder 2% in 2001. Demand for skilled foreign labour has increased in certain sectors and the quotas set everyyear were completely used up in 2000.
1. Trends in migration movements
Inflows and outflows of foreigners
The statistics show an appreciable increase (of 15%) in the number of new immigrants in 1999, more than86 000 foreigners coming into Switzerland in 1999, compared to 75 000 the year before (see Table III.37). A lit-tle more than 76 000 of them obtained residence permits and nearly 10 000 were given settlement permits.The number of foreigners entering the country with the object of being gainfully employed was 31 500, ofwhom 2 350 came in on family reunion grounds. Nearly 54 000 non-active foreign nationals came into Switzerlandunder the heading of family reunion. Cantonal and federal one-year residence permits have enabled19 000 foreigners to settle in Switzerland.
For three years now, Germans have formed the biggest immigrant group (12.9% of inflows), followed bynationals of the former Yugoslavia (8 400 people, or 9% of all immigrants). Next come the French, the Italiansand the Portuguese, meaning that the bulk of immigrants are European.
The new arrivals work mainly in catering and the hotel industry, in education and in health. These threeareas account for 35% of all workers, a figure which goes up to 55% of all new workers if the metal-working anddistributive sectors are added.
A breakdown by age bracket shows that nearly three-quarters of new arrivals are aged between 20 and 64.Those over 65 make up 1% of all new arrivals.
Slightly more than 58 000 foreigners left Switzerland in 1999, of whom 40% had worked mainly in the hoteland catering sector, the distributive trades, banking and insurance. Italians formed the largest group to leavethe country (15%), followed by Portuguese (14%), Germans (10%) and nationals of the former Yugoslavia (4%).Over half of those leaving were men aged between 20 and 39.
SWITZERLAND

Tre
nds in Inte
rnatio
nal M
igration
248
© O
EC
D 2001
Table III.37. Current figures on the components of total population change, on migration flows and stocks of foreign population and labour force, Switzerland
Figures in thousands unless otherwise indicated
1. Data cover only foreigners with annual or settlement permits and include conversions of seasonal work permits into annual or settlement permits.2. Data include only foreigners who obtained an annual or settlement permit during the indicated year. Conversions of seasonal work permits into annual or settlement permits are not included.3. Federal Republic of Yugoslavia in 1999.4. Figures cover foreign workers with settlement, annual, cross-border and seasonal permits.Source: Federal Foreign Office.
1996 1997 1998 1999 1996 1997 1998 1999
Population on 31 December of the years indicated 7 081.3 7 096.5 7 123.5 7 164.4 Foreign population by main nationality1 1 337.6 1 340.8 1 347.9 1 368.7% of foreigners 18.9 19.0 19.0 19.2 Italy 350.3 342.3 335.4 327.7
Former Yugoslavia3 305.0 313.5 321.1 189.4Components of foreign population change1 7.0 3.2 7.1 20.8 Portugal 137.1 136.3 135.8 135.0
Net migration1 12.0 9.3 16.0 27.7 Germany 92.7 94.7 97.9 102.7Natural increase 14.1 13.4 12.7 13.4 Spain 97.7 94.0 90.4 86.8Acquisitions of Swiss nationality –19.4 –19.2 –21.3 –20.4 France 54.3 55.0 56.1 58.0Other 0.2 –0.3 –0.3 – Other countries 300.5 305.0 311.2 469.1
Migration flows of foreigners2 Foreign workers4 869.7 847.4 842.3 856.0Inflows by main nationality2 74.3 72.8 74.9 85.8 of which: Women 313.6 309.4 309.6 316.4
Former Yugoslavia 14.1 12.8 11.5 12.6 Inflows by status of residenceGermany 8.7 8.5 9.3 11.0 % of resident workers 81.5 81.7 82.1 81.9France 5.0 4.8 5.4 6.2 % of cross-border workers 16.9 16.7 17.9 16.9Italy 5.4 5.0 5.3 6.0Portugal 5.5 4.0 5.1 5.0 Foreign resident workersOther countries 35.7 37.7 38.3 45.0 By main nationality1 709.1 692.8 691.1 701.2
Outflows by main nationality 67.7 63.4 59.0 58.1 Italy 202.5 191.7 184.4 179.3Italy 10.8 9.9 8.6 8.7 Former Yugoslavia 136.2 138.2 142.8 80.4Portugal 7.9 8.7 7.8 8.0 Portugal 79.3 77.4 76.6 76.5Germany 6.2 5.9 5.5 5.9 Germany 56.7 57.3 58.7 61.3Spain 6.3 5.8 5.3 5.4 Spain 59.8 56.4 53.7 51.7France 3.7 3.5 3.3 3.7 Others 174.6 171.7 174.9 252.0Other countries 32.7 29.6 28.5 26.5
Net migration by main nationality 6.6 9.3 16.0 27.7 By major industry divisionFormer Yugoslavia 5.1 5.6 5.3 10.4 Agriculture, forestry 14.5 15.5 13.6 13.5Germany 2.4 2.6 3.8 5.1 Extractive and manufacturing industries 308.2 292.2 283.2 278.9France 1.3 1.3 2.1 2.6 Building 87.4 80.5 76.2 72.5Portugal –2.3 –4.7 –2.7 –3.0 Trade 90.6 89.5 90.0 90.7Italy –5.4 –4.9 –3.2 –2.6 Hotel, restaurants 80.4 80.0 81.2 82.2Spain –4.3 –4.0 –3.6 –3.8 Other services 128.1 135.0 147.0 163.4Other countries 9.9 13.4 14.3 19.1
Cross-border workers by nationality 147.0 142.0 142.5 144.8Asylum seekers 18.0 24.0 41.3 46.1 France (% of the total) 49.5 50.2 50.3 51.0
Italy (% of the total) 23.4 23.0 22.7 22.0Acquisition of nationality by country of former nationality 19.4 19.2 21.3 20.4 Germany (% of the total) 21.1 21.0 20.9 21.0
Italy 5.2 5.0 5.6 5.5 Others (% of the total) 6.0 5.8 6.1 6.0Former Yugoslavia 2.8 3.0 3.3 2.4Turkey 1.4 1.8 2.1 2.3France 1.0 1.0 1.2 0.8Other countries 8.9 8.4 9.1 9.4

Switzerland
249
© OECD 2001
Refugees and asylum seekers
Some 46 000 people asked for asylum in 1999, which was 11.5% up on 1998. The attraction of Switzerlandto refugees stems partly from its practice of recruiting seasonal workers, most of them from the former Yugoslavia. Acommunity of between 135 000 and 150 000 Kosovar Albanians has been formed over the past two years, cre-ating a network of relations between refugees. Under the Dublin Convention, asylum seekers whose applica-tions are dismissed in a European Union country are obliged to turn to Switzerland. Since July 1999, however,when the Kosovo conflict came to an end, their numbers have been declining sharply, and the Federal Officefor Refugees put the number of applicants in 2000 at 28 000. While a considerable number of asylum seekerscome from Iraq (4%) and Sri Lanka (3%), they are far outnumbered by nationals of the former Federal Republicof Yugoslavia (63%).
Asylum has been granted to a little over 2 000 people, of which slightly less than 400 under the heading offamily reunion, giving an acceptance rate of approximately 4.5%. The rate varies a lot according to the national-ity of the applicant: 1.2% for nationals of the Federal Republic of Yugoslavia, 3.4% for Sri Lankans and 91.3% forVietnamese.
All told, the migration balance has improved considerably since 1998 (+73%). The balance is positive inthe case of nationals of the former Yugoslavia, Germany and France, strengthening the tendency for migrationflows to shift towards northern Europe.
2. Structure and changes in the foreign population
Numerical trends
The foreign population increased by 20 800 in 1999, or 1.9% (see Table III.37). The gross increase is attrib-utable to the number of entries, births and the conversion of seasonal permits into one-year permits andeven, exceptionally, permits to settle.
All told, the resident foreign population at 1 January 2000 was 1 400 000, i.e. 19.2% of the total population.There are two categories of permit: one-year residence permits (held by 25% of the population) and settle-ment permits (75%). Over the past twenty years, the nationality mix of that population has changed. The mostnumerous are migrants from the European Union, who make up 60% of the foreign community, 40% of whomcome from countries that share borders with Switzerland. The Italian community is the biggest, at 330 000, butthat figure is constantly shrinking (down 40% since 1974). The second most numerous are migrants from theformer Yugoslavia, who totalled 190 000 at end-1999, but if the nationals of all the ex-Yugoslav countries aretaken into account, the total number comes to 330 000, i.e. 24% of the foreign population. The Portuguese com-munity is in third place with 135 000 nationals, i.e. 10% of the foreign population.
The Germans and Spanish come in fourth and fifth place, respectively, but while the size of the Germancommunity (103 000 in 1999) is constantly increasing, that of the Spanish community (86 000) is moving in theopposite direction.
Almost two-thirds of foreign residents live in the German-speaking region and the other third in French-speaking Switzerland. Nearly 55% of them are male and three-quarters fall into the 20-64 age bracket, which is8 percentage points higher than the figure for the native Swiss population. On the other hand, the number ofSwiss likely to receive a retirement pension is three times higher than in the case of the foreign population.
Mixed marriages
Around 40% of the foreign population are unmarried. The number of married women is smaller, at a littleover 300 000, than the number of married men (390 000). There have been some 73 000 mixed marriages,between foreigners and Swiss women.
Trends in International Migration
250
© OECD 2001
The Swiss abroad
As at 30 June 1999, there were 573 000 Swiss living abroad – a relatively high figure which is attributable inpart to the number of Swiss with dual nationality (70%). Rather less than two-thirds live in Europe, mainly inEuropean Union countries, and 27% in America.
Naturalisations
The naturalisation rate is one of the lowest in Europe because of the high costs involved and administrativeprocedures that oblige the applicant to prove his/her integration in the country. The number of people who fulfilthe criteria for obtaining Swiss nationality is put at 600 000, and the total number of people to acquire Swissnationality in 1999 was slightly over 20 000. Federal legislation makes a distinction between the different ways ofobtaining Swiss nationality, there being ordinary naturalisation, facilitated naturalisation, reintegration, recogni-tion of Swiss citizenship under the new right of filiation, marriage to a Swiss citizen and, lastly, adoption. Theordinary procedure is by far the most commonly used, 67% of applicants having obtained Swiss nationality in thisway. Next come those who became Swiss citizens through facilitated naturalisation (30%). Almost 77% of naturali-sations were accounted for by Europeans, of which 40% were nationals of European Union countries.
3. Migration and the labour market
According to the Federal Statistical Office, the total labour force numbered a little under 3 900 000 peoplein the last quarter of 1999, of whom 701 000 were foreigners (see Table III.37). To these numbers must beadded 10 000 seasonal workers and 145 000 cross-border workers. The majority of foreigners in the labourforce are men, the main nationalities represented being the Italians (25%), the French (12%), the Germans(10%) and the Portuguese (9%). The majority work in the distributive trades, banking and insurance.
At end-1999, the foreign participation rate was nearly 52%, and varied considerably according to national-ity (for example, 41% for Turkish nationals and 61% for Austrian nationals). Some 5.4% of foreigners were unem-ployed, as against 1.7% of Swiss, with the result that, in January 2000, approximately 91 000 jobless wereregistered with job centers.
According to unofficial estimates, moonlighting could account for 8.9% of Swiss GDP, i.e. the lowest rateamong OECD countries. That said, the sums drawn off by this activity are considerable, being put atSF35 billion. There is not at present any talk of an amnesty for the various protagonists, given the poor resultsobtained by other European countries that have introduced such measures. However, there have been consul-tations between the different parties involved. The results of these talks could take the form of proposed leg-islation aimed at stepping up measures to combat illegal work: participation of representatives of the socialpartners, creation of tripartite committees, harsher penalties for employers, etc.
4. Policy developments
In May 2000, the seven bilateral agreements already signed with the European Community and its Mem-ber States, including that on the free movement of persons, were accepted by the Swiss people with a major-ity of 67.2% of votes cast. The latest agreement provides for a gradual shift towards unrestricted movement ofpersons, but it will not come into force until the European Union Member countries have ratified it – probablyin 2001. The rules that will apply to nationals of third countries as soon as the agreement on free movementcomes into force will be contained in a revised version of the Order limiting the number of foreigners (OLE).Despite the desire to move closer to the European Union on this question, an initiative designed to acceler-ate the procedure was rejected in March 2001 (with almost 77% of the votes against).
A comprehensive revision of the framework law on the residence and settlement of foreigners, datingfrom 1931, is currently being discussed by the main groups concerned. The new legislation will give increasedlegitimacy to Swiss policy on foreigners by spelling out their rights and obligations.
Access to the labour market depends on economic interests and on the long-term chances of integration –apart from humanitarian reasons justifying immigration, family reunion and training courses, which will also begoverned by the new legislation. Access to the labour market will in principle be confined to skilled labour

Switzerland
251
© OECD 2001
and annual quotas will be set. The law is also designed to improve foreigners’ legal status: the legal obstaclesto changing profession, job or canton will be reduced and the right to family reunion will be extended to allresidence permit holders.
Switzerland has also expressed the intention of liberalising its policy on visas. The government decidedduring the summer of 2000 to waive the visa obligation for foreigners with valid passports from their countriesof origin and valid Schengen visas. This measure concerns nationals of Bahrein, Qatar, Kuwait, Oman, SaudiArabia, Thailand and the United Arab Emirates.
Also, the authorities have implemented a programme designed to regularise the situation of certain cate-gories of foreigner. In March 2000, they decided temporarily to admit different groups of people who could begiven asylum, and also foreigners who entered Switzerland before 31 December 1992, on condition that theywere in a situation of serious personal distress.
There were two reasons for this measure. First, the length of these persons’ stay was not the result ofunseemly behaviour and, second, they clearly wanted to integrate. Approximately 13 000 people were con-cerned by this regularisation operation, particularly Sri Lankan nationals.
Migration policy was also concerned by a referendum on a proposal designed to ensure that the propor-tion of foreigners in Switzerland did not exceed 18% (whereas the present figure is 19%). The proposal wasrejected by a very large majority of the population (see box).
Five principles underlie Switzerland’s policy on asylum:
• Any person threatened or persecuted in their country of origin, according to criteria recognized by inter-national law, will be given asylum in Switzerland.
• Switzerland participates actively in international campaigns aimed at supporting and protecting peoplein distress.
• Switzerland allows temporary right of entry to those living in war or disaster zones when it is unable toprovide assistance to those regions.
• Rejected asylum seekers will systematically be sent back to their counties of origin.
• Strict measures will be taken against applicants who have committed offences.
Box III.10. The 18% initiative
The said initiative, lodged on 28 August 1995, altered the way of calculating the proportion of foreigners, nolonger counting scientists and skilled management staff, artists, pupils and students, but including asylum seek-ers, people admitted on a temporary basis and war refugees resident in Switzerland for more than one year. Oncethe 18% threshold was exceeded, after being put in place, a voluntary emigration policy would have been intro-duced and no new residence permits would have been issued as long as the number of births among the foreignpopulation exceeded the number of voluntary departures. The measure also aimed to bring in tougher rules onasylum seekers, war refugees, foreigners admitted on a temporary basis and foreigners of no fixed abode. Theintention was that such people would no longer receive financial assistance during their stay in the country. Thepossibility of imprisoning foreigners who had been served with an expulsion order was also envisaged.
The Federal Council asked the population to reject the proposal, which was not in conformity with interna-tional agreements and whose implementation would have posed too many difficulties – economic in particular. Itwas in fact thought that firms would no longer be able to go abroad to hire the labour needed for the proper func-tioning of numerous sectors of the economy, and that they would therefore have to turn to moonlighting and ille-gal immigration and possibly consider relocating.
The result of the vote was unequivocal, the proposal being rejected in September 2000 by a 64% majority.
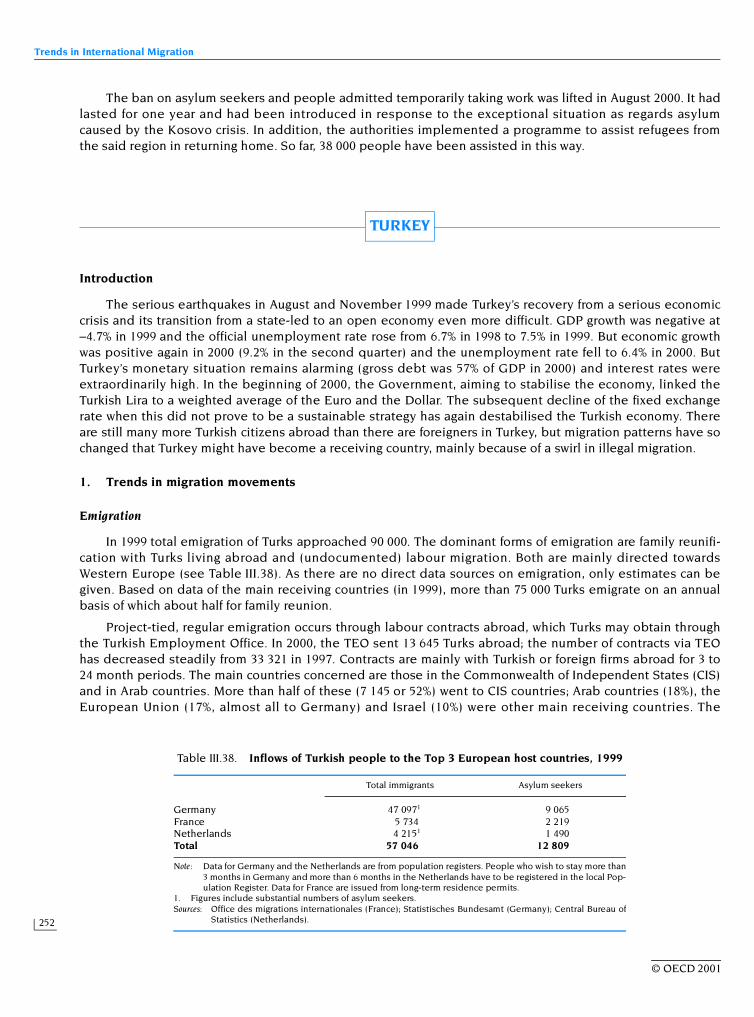
Trends in International Migration
252
© OECD 2001
The ban on asylum seekers and people admitted temporarily taking work was lifted in August 2000. It hadlasted for one year and had been introduced in response to the exceptional situation as regards asylumcaused by the Kosovo crisis. In addition, the authorities implemented a programme to assist refugees fromthe said region in returning home. So far, 38 000 people have been assisted in this way.
Turkey
Introduction
The serious earthquakes in August and November 1999 made Turkey’s recovery from a serious economiccrisis and its transition from a state-led to an open economy even more difficult. GDP growth was negative at–4.7% in 1999 and the official unemployment rate rose from 6.7% in 1998 to 7.5% in 1999. But economic growthwas positive again in 2000 (9.2% in the second quarter) and the unemployment rate fell to 6.4% in 2000. ButTurkey’s monetary situation remains alarming (gross debt was 57% of GDP in 2000) and interest rates wereextraordinarily high. In the beginning of 2000, the Government, aiming to stabilise the economy, linked theTurkish Lira to a weighted average of the Euro and the Dollar. The subsequent decline of the fixed exchangerate when this did not prove to be a sustainable strategy has again destabilised the Turkish economy. Thereare still many more Turkish citizens abroad than there are foreigners in Turkey, but migration patterns have sochanged that Turkey might have become a receiving country, mainly because of a swirl in illegal migration.
1. Trends in migration movements
Emigration
In 1999 total emigration of Turks approached 90 000. The dominant forms of emigration are family reunifi-cation with Turks living abroad and (undocumented) labour migration. Both are mainly directed towardsWestern Europe (see Table III.38). As there are no direct data sources on emigration, only estimates can begiven. Based on data of the main receiving countries (in 1999), more than 75 000 Turks emigrate on an annualbasis of which about half for family reunion.
Project-tied, regular emigration occurs through labour contracts abroad, which Turks may obtain throughthe Turkish Employment Office. In 2000, the TEO sent 13 645 Turks abroad; the number of contracts via TEOhas decreased steadily from 33 321 in 1997. Contracts are mainly with Turkish or foreign firms abroad for 3 to24 month periods. The main countries concerned are those in the Commonwealth of Independent States (CIS)and in Arab countries. More than half of these (7 145 or 52%) went to CIS countries; Arab countries (18%), theEuropean Union (17%, almost all to Germany) and Israel (10%) were other main receiving countries. The
TURKEY
Table III.38. Inflows of Turkish people to the Top 3 European host countries, 1999
Note: Data for Germany and the Netherlands are from population registers. People who wish to stay more than3 months in Germany and more than 6 months in the Netherlands have to be registered in the local Pop-ulation Register. Data for France are issued from long-term residence permits.
1. Figures include substantial numbers of asylum seekers.Sources: Office des migrations internationales (France); Statistisches Bundesamt (Germany); Central Bureau of
Statistics (Netherlands).
Total immigrants Asylum seekers
Germany 47 0971 9 065France 5 734 2 219Netherlands 4 2151 1 490Total 57 046 12 809
Turkey
253
© OECD 2001
Russian Federation, Germany, Turkmenistan, Saudi Arabia and Uzbekistan are the top five receiving countriesfor Turkish workers.
Inflows and outflows of foreigners
Thousands of migrants have passed through Turkey in the past two decades as temporary residents. Thecame from countries such as Iraq, Egypt, Morocco, Ghana and Afghanistan to find their way into the developedcountries in North and Western Europe. But the restrictive immigration policies of the EU may cause anincreasing share of migrants to wish to settle in Turkey. By the year 2000, a total of 168 000 residence permitswere granted to 61 000 Bulgarian immigrants; 11 000 immigrants from Azerbaijan; 7 000 from Greece and7 000 from the Russian Federation.
Illegal immigration
Undocumented immigration has more than doubled in the last four years, from 18 800 in 1996 to47 700 in 2000. Most undocumented immigrants come from various parts of Asia and Africa and are passingthrough on their way to the higher developed regions of Europe.
Refugees and asylum seekers
Political unrest in Iran and Iraq resulted in a flow of asylum seekers into Turkey in the 1980s and and thiscontinues today. The total number of asylum seekers has remained rather stable over the past five years andamounted to 5 700 in 2000. Of these, 3 700 people came from Iran and 1 600 from Iraq. Other countries of originare Afghanistan, Sri Lanka, Algeria and Nigeria.
2. Structure and changes in the foreign population
Naturalisations
Most applications for naturalisation in Turkey come from people from Turkish descent. In 2000 there were7 159 new applications in addition to the 16 997 applications already being processed. There is no data avail-able on the number of people who obtain Turkish citizenship in any year.
Host country legislation on the acquisition of nationality varies in its restrictiveness. Recently, Germany,the main receiving country, liberalised its legislation and, for the first time, the principle of jus sanguinis is nolonger the only criterion used, since, under certain conditions, jus solis can now be recognised. Children born inGermany to foreign parents who have lived in the country for at least 8 years and who have had a permanentresidence permit for at least 3 years will be eligible for German nationality. But these children will have tochoose between German or Turkish nationality between the ages of 18 (age of majority) and 23. Thereafter,they lose the right to apply for German citizenship. It is important to bear in mind that since 1995, althoughTurkish law allows for dual nationality, renunciation of Turkish nationality no longer automatically results in theconfiscation of property.
3. Migration and the labour market
In 2000, 3.6 million people or nearly 6% of the entire Turkish population was living abroad; an estimated5 to 6% of the total Turkish labour force was employed in foreign countries. Of these, there were a near3.2 million Turkish expatriates in Europe (just over 3 million in the EU), 120 000 Turkish workers in the Arabcountries and 50 000 in the CIS states. 230 000 Turks were living and working elsewhere in the world, mainly inAustralia, Canada and the United States.
Only 14% (24 198) of all residence permits were granted on the basis of work permits. Data on trends isnot available.

Trends in International Migration
254
© OECD 2001
4. Policy developments
Measures to combat the illegal employment of foreigners
Turkey recognises its changing status from an emigration to an immigration country and is preparing newlegal arrangements for work and residence permits. The aim of the intended legislation is combating illegalemployment. The Ministry of Labour and Social Security will become responsible for issuing work permits andworkers who employ illegal immigrant labour can be penalised (up to 2.5 billion Turkish Liras) as well as theillegal workers themselves (up to 500 million Turkish Liras).
Un ited Kingdom
Introduction
Although GDP grew by 2.2% in 1999 and expanded by 3% in 2000 as a whole, output growth slowed mark-edly during the second half of this latter year, falling well below potential in the final quarter. Notwithstanding,the outlook continues to be favourable. With the employment rate rising from 74.2 to 74.7% the labour marketis becoming increasingly tight. Despite overall economic growth there is some evidence that the UK economyis becoming less homogeneous, the main dichotomies being between the manufacturing and service sectorsand between the North and the South. In southern Britain, particularly the South-east, growth is much fasterthan in the rest of the country. Nevertheless, most regions report some skill shortages and this has caused thegovernment to adopt a more positive approach to labour immigration.
Although economic performance was strong in 1999, the growth in migration inflows was not as substantialas in the recent past; net migration fell back by almost 20%. Furthermore, the traditional labour-force balanceof these flows, one favouring those not in employment, reasserted itself. The number of illegal immigrantsdetected continues to increase substantially, the figure in 1999 being over 20 000. The number of asylumapplications rose sharply once again in 1999, by over 50% to 71 200.
1. Trends in migration movements
Inflows and outflows of foreigners
Net flows of non-UK nationals have been positive throughout the 1980s and 1990s. The flow pattern hasbroadly reflected changes in economic conditions with a lag of some 12-18 months. The amplitude of fluctua-tion has been rather less than that of British citizens. A disaggregation of the flow data into European Union(excluding Ireland whose citizens share with those of the United Kingdom a Common Travel Area) and non-EUcitizens reveals that the former, having fluctuated between –4 and +9 000 during the 1980s (with the exceptionof 1986), have increased substantially since 1994. Having remained broadly constant in 1997, the number roseonce again in 1998, by almost 50% to 43 000 but fell back sharply in 1999 to 13 000 (see Table III.39). Duringthe 1980s and through to 1992 the net flows of non-EU citizens fluctuated to a greater extent around a corevalue of approximately 40 000 since which time they have increased year on year to 65 000 in 1997, to91 000 in 1998 and to 96 000 in 1999, the highest recorded in this data series.
The balance of immigration, traditionally very much in favour of those not in employment, having swungaround in 1998 changed back in 1999. In 1997, 59% of the outflow but only 48% of the inflow was employed;in 1998 the figures were 60% and 58% respectively. In 1999, whilst the proportion of the employed in the inflowfigure was virtually unchanged at 59%, the proportion of the employed in the outflow rose to 65%. This beingthe case, whereas in 1998 the United Kingdom enjoyed an overall net gain of 71 000 persons in employmentcompared with 60 000 not in employment, the 1999 figures were 41 400 and 67 500 respectively.
UNITED KINGDOM

Unite
d K
ingd
om
255
© O
EC
D 2001
Table III.39. Current figures on migration flows and stocks of total population and labour force, United Kingdom
All figures in thousands unless otherwise indicated
1. Data are from the International Passenger Survey. Movements between the Republic of Ireland and the United Kingdom are not recorded. Data for 1999 are provisional. Data do not include adjustments forasylum seekers and for persons admitted as short-term visitors who are subsequently granted an extension of stay for other reasons.
2. An acceptance of settlement is not required for EU citizens.3. Data are from the national Labour Force Survey.Sources: International Passenger Survey; Home Office Statistical Bulletin; Control of Immigration Statistics; National Labour Force Survey.
1996 1997 1998 1999 1996 1997 1998 1999
Migration flows1 Total grants of citizenship in the United KingdomTotal inflows 272 285 332 354 by previous country or region of nationality 43.1 37.0 53.5 54.9
Inflows of non-British citizens 168 188 221 239 Indian Sub-continent 10.8 8.5 14.6 14.8of which: Africa 9.2 8.0 12.9 12.9
EU 54 61 68 60 Asia 8.7 6.9 10.7 10.9non-EU 114 127 153 179 Middle East 3.5 2.8 4.3 4.7
Inflows of British citizens 104 97 111 116 Remainder of Asia 5.2 4.1 6.4 6.2Total outflows 216 225 199 245 Europe 4.7 4.3 5.9 7.3
Outflows of non-British citizens 77 94 88 131 European Economic Area 1.7 1.5 1.3 1.7of which: Remainder of Europe 2.9 2.8 4.6 5.6
EU 24 32 26 47 America 4.3 3.5 5.2 5.4non-EU 53 62 62 84 Oceania 1.5 1.4 1.6 1.5
Outflows of British citizens 139 131 111 115 Other 3.9 4.3 2.5 2.2Net migration 56 60 134 109
Non-British citizens 91 94 133 108 Asylum seekers (Total applications received) 29.6 32.5 46.0 71.2of which: By region of origin
EU 30 29 43 13 Europe 6.5 9.1 17.8 28.3Non-EU 61 65 91 96 Africa 11.3 9.5 12.4 18.4
British citizens –35 –34 – 1 America 1.8 2.8 1.0 2.0Asia 7.9 8.6 11.9 17.5
Acceptances for settlement 61.7 58.7 69.8 97.1 Middle East 2.2 2.3 2.8 4.2By region of origin Other 4.0 0.1 0.1 0.8
Europe (excluding EU)2 7.4 7.6 7.3 16.0 According to the place where the application was received (%)America 8.5 7.8 10.8 8.5 At port 41.9 51.1 50.9 59.0Africa 13.0 13.2 16.1 27.0 In country 58.1 48.9 49.1 41.0Indian Sub-continent 13.6 13.1 16.4 21.4Middle East 4.8 4.2 4.2 5.6 Illegal immigration statisticsRemainder of Asia 9.5 8.4 9.5 13.1 Persons against whom enforcement action taken 21.4 19.9 21.1 42.0Oceania 3.5 3.1 3.7 4.1 Persons removed from country 5.4 6.5 7.3 29.0Other 1.5 1.4 1.8 1.4
By category of acceptance Available sources on inflows of foreign workersAccepted in own right 6.7 7.6 10.3 31.7 Labour Force Survey 50.0 59.0 68.0 64.0Spouses and dependents 48.6 46.2 53.0 65.2 International Passenger Survey 89.0 79.0 120.0 127.0Other 6.5 4.9 6.4 0.2 Department of Social Security 145.9 130.3 .. ..
Work permits 37.7 42.4 49.7 55.5Stock of total population3 of whichTotal population 57 624 57 870 58 106 58 298 Short-term 16.8 19.0 23.5 21.8Total number of British citizens 55 680 55 796 55 895 56 079 Long-term 16.9 18.7 25.0 30.6Total number of foreign nationals 1 934 2 066 2 207 2 208 Trainees 4.0 4.7 .. . .
Total stock of employment3
Total 25 962 26 446 26 736 27 025British citizens 25 095 25 497 25 696 26 018Foreign nationals 865 949 1 039 1 005
Trends in International Migration
256
© OECD 2001
Illegal immigration
Some 21 200 “illegal” entrants – persons who entered the country by deception or clandestinely – weredetected in 1999. This compares with 7 500 in 1994, 10 400 in 1995, 14 500 in 1996, 14 300 in 1997 and16 500 in 1998 and thus maintains the strong upward trend of recent years. One reason for this is that increas-ingly effective detection procedures have reduced the possibilities for illegal entry. The number of personsremoved as illegal entrants, including those who left voluntarily following the initiation of enforcement action,decreased by 350 to 5 200 in 1999. In the first six months of 2000, enforcement action was initiated against15 900 illegal entrants detected, compared with 7 100 in the equivalent period of 1999.
Refugees and asylum seekers
The basis for granting refugee status continues to be the 1951 Geneva Convention and the 1967 Protocol.Applicants who do not fully meet the Convention criteria, but for whom it would be unreasonable to enforcetheir return to their home country, may be granted “exceptional leave to remain” (ELR) status, renewableannually. From time to time there are special refugee programmes, normally involving people already recogn-ised as Convention refugees, in response to particular problems. These people (such as the 25 000 South-eastAsian refugees, mainly Vietnamese, accepted for settlement since 1979) are not normally included in the sta-tistics of asylum applications and decisions. Neither do the figures include certain people who were allowedto remain on an exceptional basis, without applying for asylum, because of the situation in the country of ori-gin, for instance particularly vulnerable individuals from the former Yugoslavia and their dependants receivedin the United Kingdom under arrangements announced on 30 November 1992 and 6 August 1995.
Almost 71 200 asylum applications (excluding dependants) were received in 1999, 55% more thanin 1998 and nearly 120% more than in 1997. The proportion of applications made in-country was 59%, up from50% in 1998. Just under 40% of all applications in 1999 were from nationals of European states, 30% from Asiaand 26% from Africa. The main nationalities of applicants were the Federal Republic of Yugoslavia (FRY) (17%– the majority Kosovars), Somalia (11%), Sri Lanka (7%), Afghanistan (6%) and Turkey (4%). There were particu-larly large rises, compared with the year before, for the first four of these. Conversely, there were noticeablefalls in applications from Nigerians and Kenyans. Applications in the first ten months of 2000 totalled justunder 63 000. If continued for the rest of 1999, this would result in a figure approaching 75 600 applications forthe year, easily the highest total ever. In only two months has the number of applications fallen below6 000 and the latest available figure, that for October, was nearly 7 000. In October, the largest number of appli-cations was from Iraqis (1 175), followed by Sri Lankans, Iranians and Afghans (each 530-550).
There is no received view as to why asylum applications have increased so much in 1999 and 2000 in theface of three Asylum Acts in 1993, 1996 and 1999, each of which was designed to reduce the level of applica-tions. Several hypotheses may be advanced. First, that asylum seekers are attracted to the UK by relativelygenerous social security benefits. While this may be true in comparison with some other countries, there is lit-tle evidence to suggest that the UK is way out of line in this regard generally. Second, the appeals procedureis cumbersome and slow, conducive to the build-up of a backlog that delays decisions and provides asylumseekers with the hope that they may be able to stay for long periods while their cases are dealt with. Third,that the country is targeted by traffickers who are able to perceive the administrative weaknesses of the sys-tem. Fourth, that many of the sending countries are former colonies where there is marked instability and per-secution of minorities and whose citizens naturally look to the “mother country” for protection. Fifth, that theseeming inexorable build-up of a backlog of cases is spreading the idea that there will be some form ofamnesty for those whose cases have not been dealt with. Being in the UK at that time would clearly be advan-tageous. Sixth, that the provisions of the Dublin Convention are not having the anticipated effect with theresult that the UK’s geographical position does not form some kind of defensive barrier. Seventh, that theabsence of identity documents and hence internal controls renders extremely difficult the removal of unsuc-cessful applicants.
The growing number of unaccompanied children (aged under 17), arriving in the UK and not known to bejoining a close relative has become an increasing source of concern over the last few years. The numbers ofsuch children rose from 245 in 1993 to 3 350 in 1999. The main countries of origin were FRY (45%), Afghanistan,Somalia and China (each 5-6%).

United Kingdom
257
© OECD 2001
2. Structure and changes in the foreign population
Numerical trends
The Labour Force Survey is the only source of data permitting a breakdown by nationality of the stock offoreign population and workforce in the United Kingdom. The survey includes all United Kingdom and foreigncitizens, but the relatively small size of the sample (one sample interviewee is weighted up to approximately300 people) means that disaggregation by nationality and migrant characteristics cannot be detailed.
During the period 1992-97 stocks of foreign nationals in the United Kingdom fluctuated around the2 million mark. Having increased by almost 7% in 1998 to just over 2.2 million (see Table III.39), the figureremained constant in 1999 before rising once more by 6% to 2.34 million. The preponderance of femalesamong the foreign population observed during the 1990s continued (53.1%).
As in previous years, the Irish were easily the largest national group in 2000. However, they accounted foronly 17%, as compared to 25% in 1992. Indians and United States citizens again occupied second and thirdplaces. There were substantial numbers also from Pakistan and Bangladesh. After the Irish, the next largestEuropean group were the Italians, followed by the French, whose numbers have been increasing over recentyears. African numbers continued their rise since 1997, reaching almost 300 000 in 2000, the largest numberrecorded from that source and an increase of 20% on 1999. The number from Africa having fallen in 1999 roseby 7% in 2000 to 558 000, while those from Asia fell slightly but still totalled over half a million. The number ofAustralians rose by over one third to 75 000 while the number of Canadians was almost unchanged at 31 000.
Settlement
“Settlement”, in the context of migration in the United Kingdom, refers to the acquisition of permanentresidence status. Most of the individuals acquiring permanent residence status have already resided in theUnited Kingdom for a considerable period of time (typically four years continuously) in order to fulfil qualify-ing periods of residence. In 1999, a total of 97 120 persons were granted settlement. This was about 27 300(39%) more than in the previous year (see Table III.39). The increase was mainly due to a significant rise in thenumber of recognised refugees and persons granted exceptional leave to remain, including acceptancesunder measures aimed at reducing the backlog of pre-1993 asylum applications. There were also increaseswithin the categories of husbands, wives and children. The number was partly offset by small decreases in thenumber of persons of independent means, in business, parents and grandparents, other acceptances andother discretionary acceptances.
There were substantial increases in 1999 in acceptances from Europe (by 8 700 to 16 000 bringing the pro-portion up from 10% to 15%) and Africa (by 10 900 to 27 000, bringing this continent’s share up from 23% to28%). Though the number of those from the Indian sub-continent rose by 5 000, their share of the totaldeclined by 2% to 22%). The number from Asia excluding the Indian sub-continent also rose by 5 000, bringingthe number up to 18 600. The number of acceptances from the Americas fell by 2 300 to 8 500.
Naturalisations
Grants of citizenship in the UK have fluctuated over the last decade or so. From the late 1980s until themid 1990s, the general trend in numbers appeared to be downward (There was an exception in 1989 in conse-quence of the 1981 British Nationality Act, which caused a last minute rush of applications in 1987 to beat thedeadline before the transitional provisions of the Act ended.) Over the last two years the number hasincreased to a level approaching that of the early 1990s. Around 55 000 people were granted citizenshipin 1999, a 2% rise on the previous year; 4 000 applications were refused (see Table III.39).
The most frequent basis for grant of citizenship continues to be a period of residence in the UK. Althoughin recent years residence has become less important than formerly, it still accounted for about 42% of all grantsin 1999, just below the average of 45% for the 1990s. Grants on the basis of marriage, numbering 18 500 in 1998,rose to 18 900, 35% of the total and was the highest figure since 1991 and highest proportion for the whole ofthe 1980s and 1990s. Grants to minor children rose for the fourth year in succession to 12 300, around 22% of

Trends in International Migration
258
© OECD 2001
the total. Most grants, over four-fifths, are now discretionary rather than by entitlement: The British NationalityAct 1981 reduced greatly the number of persons eligible for British citizenship by reason of entitlement.
Citizens of Indian sub-continent countries accounted for 27% of all grants in 1999, with the rest of Asia andAfrica accounting for about 23 and 20% respectively. The remaining 30% was split between Europe (13%), theAmericas (10%), and others including Oceania (7%). The proportion from Africa has increased from 15%in 1992 to 23% in 1999, with decreases over the period from EEA countries, the Middle East, and “Others”.
3. Migration and the labour market
Migration for employment and work permits
The number of foreign nationals working in the United Kingdom fluctuated between 850 and900 000 from 1993 to 1996. Having since risen strongly, to exceed one million for the first time in 1998 (3.9% ofthe total in employment, see Table III.39), the number fell back slightly to 1.005 million in 1999 before risingagain in 2000 to their highest recorded figure of 1.107 million. Of these some 452 000 foreign workers were fromother EU countries, virtually the same figure as in the two previous years and accounting for 41% of all foreignemployment, well down on the 45% of the year before which was the highest proportion of recent years. Thisleaves 655 000 from non-EU countries, almost 100 000 up on 1999. Thus, a static foreign workforce from the EUis being supplemented by a considerable rise in that from non-EU countries.
The importance of the Republic of Ireland as a supplier of workers to the UK economy remains apparent.The Irish accounted for 45.6% of EU foreign workers and 18.6% of all foreign workers in the UK in 2000. However,the role of the Irish has been diminishing. In 1995 they accounted for 49% of EU foreign workers and 22.7% ofall foreign workers. It appears that the strong economy of the Republic is either pulling large numbers of Irishback home or stopping new workers crossing the Irish Sea for employment in the UK. After the Irish, Italians,French and Germans continue to be the main groups of EU citizens working in the UK. There were 63 000 fromthe rest of Europe, an increase of 16 000 on the year before; this included 45 000 from Eastern Europe and theformer Soviet Union, 20 000 more than in 1999. Other significant groups were 141 000 from the Indian sub-continent, 61 000 from the United States, 46 000 from Western African states and 54 000 from Australia, all wellup on 1999.
Just over half (52.8%) of the foreign workforce was male, but not for those from the EU among whomfemales were in a slight preponderance (50.4%), a continuation of the pattern common during the 1990s butinterrupted in 1997. Among Africans, Antipodeans, Americans and Asians, males were in a clear majority, con-tinuing the pattern in recent years. Comparison of the sex balance of foreign workers with the total foreignpopulation shows a continuing and significant difference: males are a majority of the former but a minority ofthe latter.
Overall, the trend suggests that during the 1990s the UK labour market has become more open, abso-lutely and relatively, to workers from other European states, a trend continuing in 2000. While this was lesstrue for nationals from outside Europe until 1995, in the last few years the situation appears to have changed,with the UK labour market becoming more open to non-EU nationals. On this evidence it would seem that theUK continues to suck in increasing numbers of foreign workers, predominantly from beyond the EU.
Work permits
Applications for work permits are made by the employer on behalf of the non-EEA potential employee inorder to fill a specific post. (Since 1994, EEA nationals have not required a work permit.) During 1998, newissues of work permits and first permissions for those engaged in training combined with work experiencetotalled 49 700, an increase of 17% on 1997. In 1999, the number fell back by 10% to 44 500. Whereasin 1995 United States citizens were granted 33% of all issues, in 1999 the proportion fell to 23% (9 700) from27% the previous year. Another noteworthy change is the declining proportion of permits issued to Japanesecitizens and the growth in the numbers to Indian, Australasian, South African and Canadian citizens. In 1995,10% of all permits were issued to Japanese citizens; in 1999 the proportion had declined to 5.9% (2 500). Num-bers of issues granted to Indian citizens almost tripled between 1995 and 1999 from 2 000 to 5 700 (13.5% of
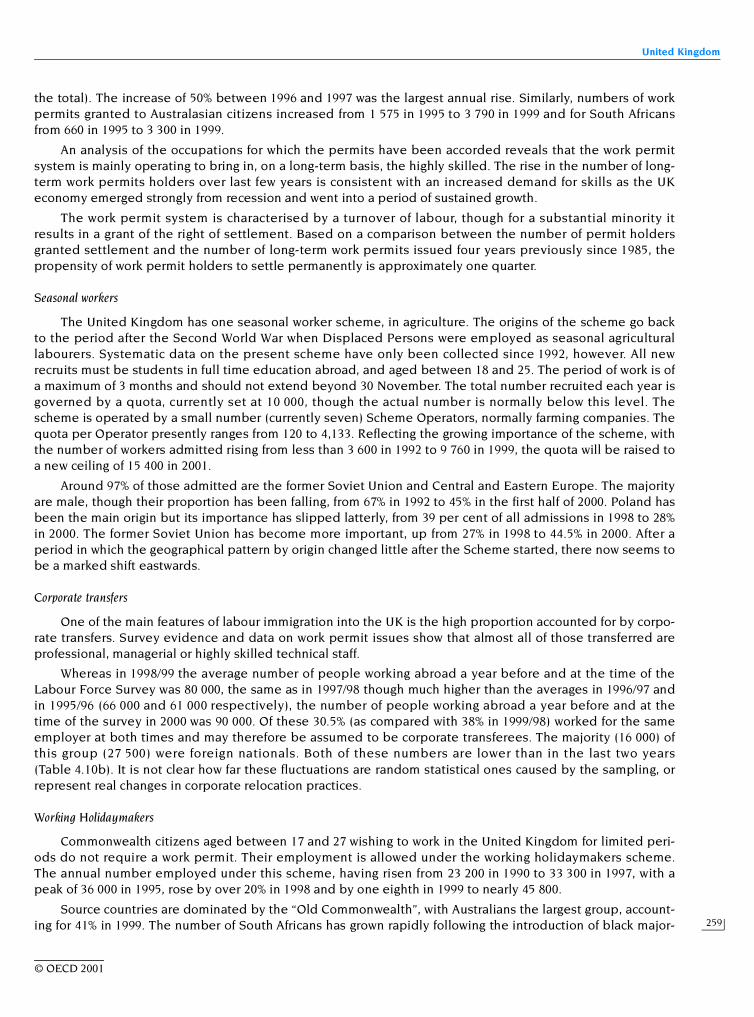
United Kingdom
259
© OECD 2001
the total). The increase of 50% between 1996 and 1997 was the largest annual rise. Similarly, numbers of workpermits granted to Australasian citizens increased from 1 575 in 1995 to 3 790 in 1999 and for South Africansfrom 660 in 1995 to 3 300 in 1999.
An analysis of the occupations for which the permits have been accorded reveals that the work permitsystem is mainly operating to bring in, on a long-term basis, the highly skilled. The rise in the number of long-term work permits holders over last few years is consistent with an increased demand for skills as the UKeconomy emerged strongly from recession and went into a period of sustained growth.
The work permit system is characterised by a turnover of labour, though for a substantial minority itresults in a grant of the right of settlement. Based on a comparison between the number of permit holdersgranted settlement and the number of long-term work permits issued four years previously since 1985, thepropensity of work permit holders to settle permanently is approximately one quarter.
Seasonal workers
The United Kingdom has one seasonal worker scheme, in agriculture. The origins of the scheme go backto the period after the Second World War when Displaced Persons were employed as seasonal agriculturallabourers. Systematic data on the present scheme have only been collected since 1992, however. All newrecruits must be students in full time education abroad, and aged between 18 and 25. The period of work is ofa maximum of 3 months and should not extend beyond 30 November. The total number recruited each year isgoverned by a quota, currently set at 10 000, though the actual number is normally below this level. Thescheme is operated by a small number (currently seven) Scheme Operators, normally farming companies. Thequota per Operator presently ranges from 120 to 4,133. Reflecting the growing importance of the scheme, withthe number of workers admitted rising from less than 3 600 in 1992 to 9 760 in 1999, the quota will be raised toa new ceiling of 15 400 in 2001.
Around 97% of those admitted are the former Soviet Union and Central and Eastern Europe. The majorityare male, though their proportion has been falling, from 67% in 1992 to 45% in the first half of 2000. Poland hasbeen the main origin but its importance has slipped latterly, from 39 per cent of all admissions in 1998 to 28%in 2000. The former Soviet Union has become more important, up from 27% in 1998 to 44.5% in 2000. After aperiod in which the geographical pattern by origin changed little after the Scheme started, there now seems tobe a marked shift eastwards.
Corporate transfers
One of the main features of labour immigration into the UK is the high proportion accounted for by corpo-rate transfers. Survey evidence and data on work permit issues show that almost all of those transferred areprofessional, managerial or highly skilled technical staff.
Whereas in 1998/99 the average number of people working abroad a year before and at the time of theLabour Force Survey was 80 000, the same as in 1997/98 though much higher than the averages in 1996/97 andin 1995/96 (66 000 and 61 000 respectively), the number of people working abroad a year before and at thetime of the survey in 2000 was 90 000. Of these 30.5% (as compared with 38% in 1999/98) worked for the sameemployer at both times and may therefore be assumed to be corporate transferees. The majority (16 000) ofthis group (27 500) were foreign nationals. Both of these numbers are lower than in the last two years(Table 4.10b). It is not clear how far these fluctuations are random statistical ones caused by the sampling, orrepresent real changes in corporate relocation practices.
Working Holidaymakers
Commonwealth citizens aged between 17 and 27 wishing to work in the United Kingdom for limited peri-ods do not require a work permit. Their employment is allowed under the working holidaymakers scheme.The annual number employed under this scheme, having risen from 23 200 in 1990 to 33 300 in 1997, with apeak of 36 000 in 1995, rose by over 20% in 1998 and by one eighth in 1999 to nearly 45 800.
Source countries are dominated by the “Old Commonwealth”, with Australians the largest group, account-ing for 41% in 1999. The number of South Africans has grown rapidly following the introduction of black major-
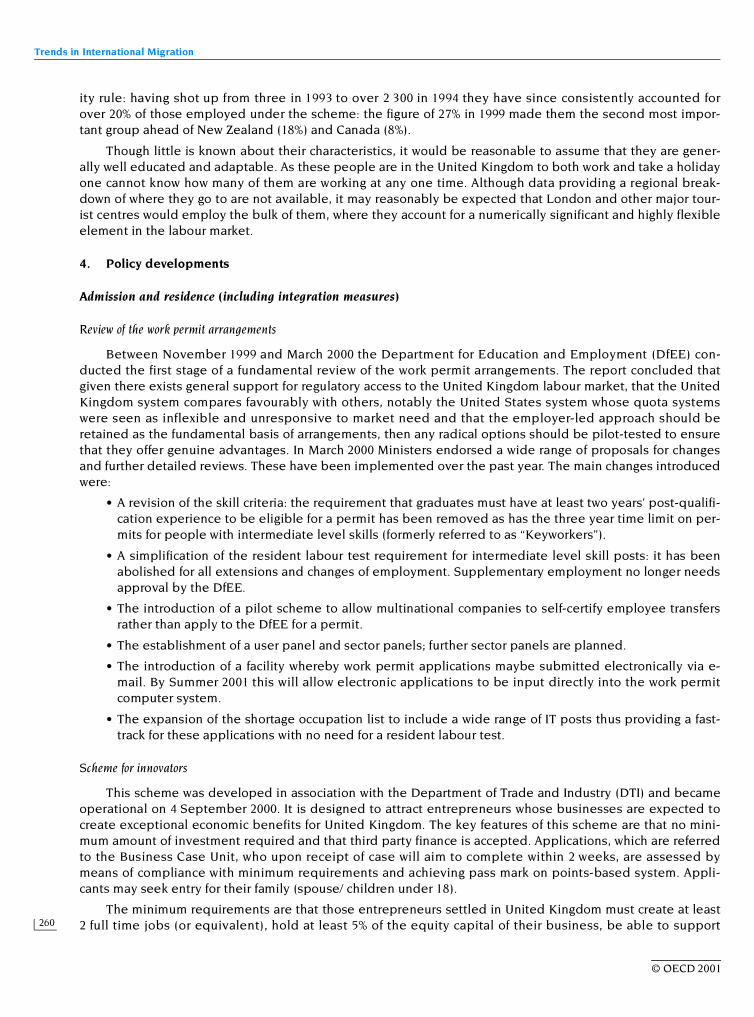
Trends in International Migration
260
© OECD 2001
ity rule: having shot up from three in 1993 to over 2 300 in 1994 they have since consistently accounted forover 20% of those employed under the scheme: the figure of 27% in 1999 made them the second most impor-tant group ahead of New Zealand (18%) and Canada (8%).
Though little is known about their characteristics, it would be reasonable to assume that they are gener-ally well educated and adaptable. As these people are in the United Kingdom to both work and take a holidayone cannot know how many of them are working at any one time. Although data providing a regional break-down of where they go to are not available, it may reasonably be expected that London and other major tour-ist centres would employ the bulk of them, where they account for a numerically significant and highly flexibleelement in the labour market.
4. Policy developments
Admission and residence (including integration measures)
Review of the work permit arrangements
Between November 1999 and March 2000 the Department for Education and Employment (DfEE) con-ducted the first stage of a fundamental review of the work permit arrangements. The report concluded thatgiven there exists general support for regulatory access to the United Kingdom labour market, that the UnitedKingdom system compares favourably with others, notably the United States system whose quota systemswere seen as inflexible and unresponsive to market need and that the employer-led approach should beretained as the fundamental basis of arrangements, then any radical options should be pilot-tested to ensurethat they offer genuine advantages. In March 2000 Ministers endorsed a wide range of proposals for changesand further detailed reviews. These have been implemented over the past year. The main changes introducedwere:
• A revision of the skill criteria: the requirement that graduates must have at least two years’ post-qualifi-cation experience to be eligible for a permit has been removed as has the three year time limit on per-mits for people with intermediate level skills (formerly referred to as “Keyworkers”).
• A simplification of the resident labour test requirement for intermediate level skill posts: it has beenabolished for all extensions and changes of employment. Supplementary employment no longer needsapproval by the DfEE.
• The introduction of a pilot scheme to allow multinational companies to self-certify employee transfersrather than apply to the DfEE for a permit.
• The establishment of a user panel and sector panels; further sector panels are planned.
• The introduction of a facility whereby work permit applications maybe submitted electronically via e-mail. By Summer 2001 this will allow electronic applications to be input directly into the work permitcomputer system.
• The expansion of the shortage occupation list to include a wide range of IT posts thus providing a fast-track for these applications with no need for a resident labour test.
Scheme for innovators
This scheme was developed in association with the Department of Trade and Industry (DTI) and becameoperational on 4 September 2000. It is designed to attract entrepreneurs whose businesses are expected tocreate exceptional economic benefits for United Kingdom. The key features of this scheme are that no mini-mum amount of investment required and that third party finance is accepted. Applications, which are referredto the Business Case Unit, who upon receipt of case will aim to complete within 2 weeks, are assessed bymeans of compliance with minimum requirements and achieving pass mark on points-based system. Appli-cants may seek entry for their family (spouse/ children under 18).
The minimum requirements are that those entrepreneurs settled in United Kingdom must create at least2 full time jobs (or equivalent), hold at least 5% of the equity capital of their business, be able to support

United States
261
© OECD 2001
themselves and their family without having to take other work/use public funds and that they can provideproof that seed capital is in place for first six months.
The points-based system is broken into three sections. These are: personal characteristics; viability ofbusiness plan; and, economic benefit to the United Kingdom. The personal characteristics section considerstheir work/business experience, their capacity to prove their entrepreneurial ability, educational qualificationsand personal references. The business plan viability section considers their financial viability (How will youfinance your proposals?), commercial viability (Will anyone want it?), technical viability (Does the idea work?)and the establishment of a management team. The economic benefit to the United Kingdom section consid-ers the numbers and types of jobs created, the introduction of new technology, processes or products toUnited Kingdom, the expenditure on Research and Development/ownership of patents and any innovation ine-commerce.
Changes under consideration
A proposal to enable graduates to transfer into the work permit category upon completion of their degreewithout first leaving the UK and a proposal to introduce an entry route for the highly skilled to come to the UKin the absence of a job offer are being considered.
United States
Introduction
Although the US economy continued to enjoy healthy economic growth in the late 1990s with the realgross domestic product increasing by 5% between 1999 and 2000, permanent immigration levels did notincrease. In fact, a downward trend in the number of annual immigrant admissions has continued since 1996.Employment-based immigration accounts for a relatively small share of annual flows. In the United States,admissions criteria and numerical limitations are modified only infrequently with the last major changes legis-lated in 1990. Finally, processing backlogs have kept immigrant admissions at lower than expected levels.
In contrast, temporary migration programs have been the subject of considerable legislative activity inthe past year. Perhaps most notable is the expansion in the size of the H-1B program for specially workers forthe second time in two years. Additional visa programs have been created to allow for the admission ofspouses and children of US citizens and lawful permanent residents who are waiting for their permanent immi-gration applications to be processed. Legislation designed to provide assistance and protection to traffickingvictims was also passed.
1. Trends in migration movements
Emigration
There do not exist reliable statistics on emigration flows. It is estimated, however, that emigration hasbeen rising steadily since 1950, at an annual rate of more than 100 000 between 1970 and 1990, and more than200 000 a year in the 1990s. The US Bureau of the Census estimates that the annual emigration flow (of both UScitizens and foreigners) is currently 220 000 (i.e., less than 0.1% of the total population).
Inflows and outflows of foreigners
Migrants into the United States can be divided into three main streams, that of: i) “immigrants” – personsgranted permanent residence and who are eligible for eventual US citizenship; ii) “non-immigrants”– personsadmitted temporarily for a specific purpose –; and, iii) illegal migrants.
UNITED STATES

Trends in International Migration
262
© OECD 2001
In 1999, 646 600 persons were granted immigrant status, the lowest number since 1988. This level was instark contrast with the peak immigration year of 1991 when over 1 827 000 received immigrant status, largely asa result of the legalization program in 1986 legislation. Immigration in 1999 was nearly 30% lower than 1996– the peak year of the last five years – when nearly 916 000 immigrants were admitted, many of whom werefamily members of the previously admitted legalized immigrants.
However, this markedly lower level of immigrants in 1999 does not reflect a decline in the number ofapplications but rather is a reflection of increasing backlogs in the processing of applications. For example, inOctober 1995, there were 321 000 applications awaiting processing within the United States. By October 1999,the number of applications had grown to 951 000 and year later, the backlog surpassed one million. The Immi-gration and Naturalization Service (INS) has estimated that during the period 1995-98, the annual volume ofimmigration would, on average, have been 110 000 to 140 000 higher (i.e., much the same as over the previousseveral years) had the length of the waiting list remained constant.
Much of the processing backlog is attributable to a 1995-97 program which shifted workload from US con-sulates overseas to the Immigration and Naturalization Service offices within the United States. The programknown as “section 245(i)” (based on its location in the US Immigration and Nationality Act) enabled illegal res-idents who had filed an immigrant application to adjust to permanent immigrant status without having toleave the United States, if and when their application is approved. However, it does not convey protection tomigrants during the time they are in the United States in illegal status. Nonetheless, the reason section 245(i)is important is that without it, illegal aliens are required to seek their immigrant visa in their home country,but, because of their illegal status in the United States for any period over 6 months, they would be barredfrom reentering the US for at least three years.
Permanent immigrant status is granted primarily on the grounds of family reunion (73.7% of the totalin 1999). In that year, those entering under this category for reasons of employment (including accompanyingfamily members – see section 3, Migration and the labour market) accounted for a further 8.8% of the total andthose accepted on humanitarian grounds (i.e., refugees and asylees) accounted for 6.6%. Immigrants admittedunder the diversity program accounted for an additional 7.4%.
It must be stressed that the figures available on the number of new immigrants do not reflect the numberof new entries into the United States. The possibilities for students, temporary workers or other temporaryimmigrants to transform their temporary status into permanent immigrant status are numerous. Thus, in 1999,approximately 38% of new immigrants had already been living in the United States.
Asia, Europe, the Caribbean, and Mexico provide the largest number of immigrants. Mexico continues tobe the principal country of origin by far, accounting for nearly 23% of all immigration in 1999. In contrast, thenext largest sending countries were People’s Republic of China and India, each accounting for slightly lessthan 5% of US immigration. In 1999, six States (California, New York State, Florida, Texas, New Jersey and Illi-nois) received over two-thirds (68%) of the new immigrants.
Illegal immigration
All those who have crossed the border illegally or who have failed to respect the terms of their temporaryvisa are classified as illegal immigrants. The Immigration and Naturalization Service estimates that visa over-stayers accounted for nearly 41% of all illegal immigrants in 1996.
The release of April 2000 Census results – with higher overall population numbers than expected – hasindicated that the resident illegal population may be greater than previously thought. Although the essentialnumbers on the foreign born enumerated in the Census have yet to be released, it has been speculated thatthe illegal population could easily be as high as 7-9 million in the year 2000. Previously, the INS had estimateda 1999 illegal immigrant population of almost 6 million (based upon estimates of 4.6-5.4 million forOctober 1996 and annual growth of 275 000). It had been estimated that Mexicans account for over half of allillegal immigrants, followed, a long way behind, by nationals of El Salvador (6.7%) and Guatemala (3.3%). Therelease of the 2000 Census results, by country of nativity, should shed further light on the number and compo-sition of the illegal population in the United States.

United States
263
© OECD 2001
Refugees and asylum seekers
Migrants entering as refugees and asylum-seekers are often the second largest group of immigrants intothe United States, after family-based immigrants. The law defines and treats those persons fleeing persecu-tion differently according to whether they have applied for asylum in the United States (asylum-seekers) orfrom outside (refugees). Both groups can eventually adjust to immigrant status: refugees are eligible after hav-ing been in the country for one year, but successful asylum seekers often take longer as the number of adjust-ments to immigrant status is limited to 10 000 per year.
Every year, Congress sets a ceiling on the number of refugees to be allowed into the country. It is notstrictly a quota since it can be revised during the year (for example, the ceiling was adjusted upwards inAugust 1999 because of the Kosovo crisis), but nonetheless this figure and the actual number of refugeesadmitted are closely correlated. The ceiling contains a regional breakdown, though it is possible for transfersto be made from one region to another during the year if this is considered to be necessary. The ceilingfor 2001 was set at 80 000 entries, whereas for each of the previous three years it was higher, ranging between83 000 and 90 000.
For each of the past three years, the largest regional ceilings have been for Eastern Europe and the formerSoviet Union, followed by Africa. In August 1999, in response to the Kosovo crisis, the total ceiling was raisedfrom 78 000 to 91 000. Nearly 14 000 refugees arrived from Kosovo, of whom 3 400 have left the United States.
At the start of 1990s, the United States had to cope with the arrival of large numbers of Haitians andCubans fleeing their respective countries. The exodus of the Haitians came to an end with the return to powerof President Aristide in October 1994. That of the Cubans was checked by an agreement by the US and Cubangovernments under which the United States would admit 20 000 Cubans immigrants each year, in return forwhich the Cuban government agreed to take the necessary steps to stem the outflow of its citizens.
Reforms to the asylum process and a doubling of the staffing of asylum officers since the mid 1990s haveresulted in declines in the backlog of cases. Regulations put into place in January 1995 provide for i) an inte-grated processing system that would grant meritorious claims within 60 days and refer non-granted claimsdirectly to immigration judges and ii) removal of the link between work authorisation and the asylum processby withholding work authorisation until asylum is granted or until a claim remains pending for 180 days, as adeterrent to the filing of frivolous or fraudulent claims. The “Illegal Immigration Reform and ImmigrantResponsibility Act of 1996” (IIRIRA) incorporated these reforms into the legislation, as well as requiring thatasylum seekers must now apply for asylum within one year of entering the United States. At present, only15 000 of the requests filed before the reforms are still pending.
Family reunion
Family reunion, the principal component of the permanent immigration into the United States, accountedfor nearly three-quarters of all immigrants in 1999. It is composed of two categories:
• Immediate family members of US citizens, i.e., spouses, unmarried minor children (including adop-tions), and parents. This category does not have a numerical limit and accounted for over 40% of all newpermanent immigrants in 1999.
• Family-based preference immigrants comprising other family members, i.e., the adult children, brothersand sisters of US citizens and the spouses and unmarried children of earlier arrived immigrants. Thereare four “preference” categories, each subject to a numerical limit. Family-based preference immigrantsaccounted for nearly 34% of all new permanent immigrants in 1999.
2. Structure and changes in the foreign-born population
Numerical trends
Immigrant data collection from the monthly population survey (Current Population Survey) was launchedin January 1994. It provides the United States with a second source of data on the foreign-born population, theother being the ten-year census.

Trends in International Migration
264
© OECD 2001
Between 1970 and 1999, the foreign-born population increased much more rapidly than the native popu-lation. It rose from 9.6 million to 26.4 million, and its proportion of the total population doubled, now account-ing for nearly 10% of the total US population. The geographical origin of the foreign-born population in theUnited States has changed considerably since the 1970s. Whereas in 1970 the European-born immigrant pop-ulation accounted for nearly 60% of the total foreign-born population, it accounted for only 16% in 1999. Manyof the earlier-arriving European cohorts have entered old-age and have begun to experience high mortalityrates, whereas recent flows from other regions have accelerated. Today, Central America and Asia account forthe largest share of the foreign born, 34% and 27%, respectively.
Naturalisations
To acquire US nationality, it is necessary to meet a number of conditions regarding age, lawful entry andlength of residence in the country, command of English and knowledge of the United States’ history. The num-ber of naturalisations quadrupled between 1992 and 1996 (from 240 000 to 1 045 000). Naturalisationsincreased for several reasons – the large number of immigrants who had been legalised under IRCA becameeligible, social benefits were being curtailed for non-citizens, immigrants needed to apply for new identifica-tion cards anyway, and the Citizenship USA initiative streamlined the process. Additional quality control mea-sures were imposed in the mid 1990s and the processing of applications slowed, reaching a low of463 000 in 1998. Additional resources have recently been re-allocated and preliminary statisticsfor 1999 and 2000 show naturalisations numbering 872 000 and 898 000, respectively.
3. Migration and the labour market
Migration for employment and work permits
As of 1992, the year in which the 1990 Immigration Act (IMMACT 90) came into force, the numerical limit onthe annual number of employment-based visas increased from 54 000 to a minimum of 140 000. In those yearswhen the family-based cap had not been reached the previous year, the employment-based cap is furtherincreased by an amount corresponding to that part of the family-based quota which had not been used. Thusin 1999, the numerical limit for employment-based immigration had been increased to 160 898. Backlogs inthe processing prevented this cap from being reached and only 56 817 employment-based immigrants wereadmitted, accounting for less than 9% of all US immigrants. In fact, persons admitted as workers were less than4% of all immigration in 1999 because their spouses and unmarried minor children accounted for more thanhalf of the visas which were utilised in the employment-based preferences (see Table III.40). The employ-ment-based preference system favours the entry of highly-skilled workers, with only 10 000 visas beingreserved for unskilled workers and their families.
Immigration of highly-skilled personnel
The United States also takes in a large number of temporary workers categorised as “non-immigrants”, alarge proportion of whom are highly-skilled workers. Analysing non-immigrant data can be very difficult, andeven misleading, because the statistics include multiple entries by the same person at different times. Addi-tionally, many of these temporary workers stay in the country for more than one year – for example, holders ofthe H-1B visa, created for the highly-skilled, can stay for six years and even beyond. The main categories oftemporary workers are traders and investors entering on the basis of international agreements, H-1B profes-sionals and intra-company transferees.
The flows in other categories such as professionals entering under the North American Free Trade Agree-ment (NAFTA), agricultural workers, and unskilled temporary workers have increased substantially in recentyears. The number of Canadian professionals entering the United States to work under NAFTA has grown from25 000 in 1994 to over 60 000 in 1999 (in this latter year there were also 16 000 family members). By contrast,the number of Mexican professionals entering under NAFTA remains low, i.e., less than 1 500 per year. NAFTAfacilitates the temporary entry of 4 groups of business persons: business visitors, investors, intra-companytransferees and professionals. Whereas there is no numerical ceiling on entries from Canada, entries from
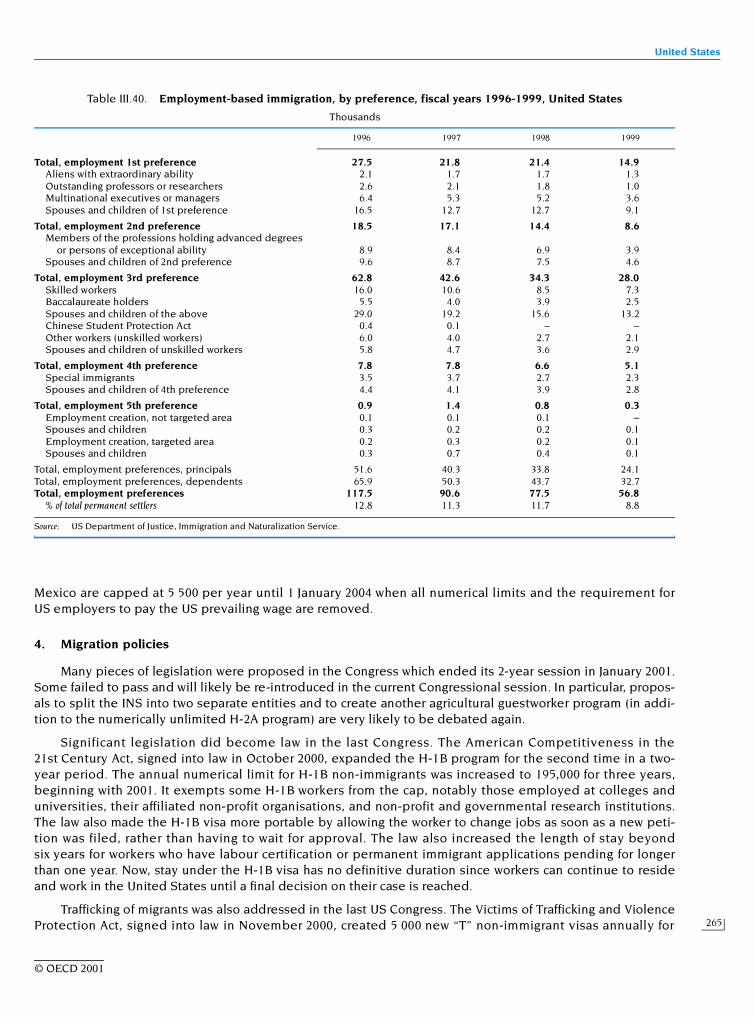
United States
265
© OECD 2001
Mexico are capped at 5 500 per year until 1 January 2004 when all numerical limits and the requirement forUS employers to pay the US prevailing wage are removed.
4. Migration policies
Many pieces of legislation were proposed in the Congress which ended its 2-year session in January 2001.Some failed to pass and will likely be re-introduced in the current Congressional session. In particular, propos-als to split the INS into two separate entities and to create another agricultural guestworker program (in addi-tion to the numerically unlimited H-2A program) are very likely to be debated again.
Significant legislation did become law in the last Congress. The American Competitiveness in the21st Century Act, signed into law in October 2000, expanded the H-1B program for the second time in a two-year period. The annual numerical limit for H-1B non-immigrants was increased to 195,000 for three years,beginning with 2001. It exempts some H-1B workers from the cap, notably those employed at colleges anduniversities, their affiliated non-profit organisations, and non-profit and governmental research institutions.The law also made the H-1B visa more portable by allowing the worker to change jobs as soon as a new peti-tion was filed, rather than having to wait for approval. The law also increased the length of stay beyondsix years for workers who have labour certification or permanent immigrant applications pending for longerthan one year. Now, stay under the H-1B visa has no definitive duration since workers can continue to resideand work in the United States until a final decision on their case is reached.
Trafficking of migrants was also addressed in the last US Congress. The Victims of Trafficking and ViolenceProtection Act, signed into law in November 2000, created 5 000 new “T” non-immigrant visas annually for
Table III.40. Employment-based immigration, by preference, fiscal years 1996-1999, United States
Thousands
Source: US Department of Justice, Immigration and Naturalization Service.
1996 1997 1998 1999
Total, employment 1st preference 27.5 21.8 21.4 14.9Aliens with extraordinary ability 2.1 1.7 1.7 1.3Outstanding professors or researchers 2.6 2.1 1.8 1.0Multinational executives or managers 6.4 5.3 5.2 3.6Spouses and children of 1st preference 16.5 12.7 12.7 9.1
Total, employment 2nd preference 18.5 17.1 14.4 8.6Members of the professions holding advanced degrees
or persons of exceptional ability 8.9 8.4 6.9 3.9Spouses and children of 2nd preference 9.6 8.7 7.5 4.6
Total, employment 3rd preference 62.8 42.6 34.3 28.0Skilled workers 16.0 10.6 8.5 7.3Baccalaureate holders 5.5 4.0 3.9 2.5Spouses and children of the above 29.0 19.2 15.6 13.2Chinese Student Protection Act 0.4 0.1 – –Other workers (unskilled workers) 6.0 4.0 2.7 2.1Spouses and children of unskilled workers 5.8 4.7 3.6 2.9
Total, employment 4th preference 7.8 7.8 6.6 5.1Special immigrants 3.5 3.7 2.7 2.3Spouses and children of 4th preference 4.4 4.1 3.9 2.8
Total, employment 5th preference 0.9 1.4 0.8 0.3Employment creation, not targeted area 0.1 0.1 0.1 –Spouses and children 0.3 0.2 0.2 0.1Employment creation, targeted area 0.2 0.3 0.2 0.1Spouses and children 0.3 0.7 0.4 0.1
Total, employment preferences, principals 51.6 40.3 33.8 24.1Total, employment preferences, dependents 65.9 50.3 43.7 32.7Total, employment preferences 117.5 90.6 77.5 56.8
% of total permanent settlers 12.8 11.3 11.7 8.8

Trends in International Migration
266
© OECD 2001
women and children who have been victims of “severe trafficking”. An additional 10 000 new “U” non-immigrantvisas were created for aliens who have suffered physical or mental abuse as victims of crimes such as rape,domestic violence and involuntary servitude. After three years in either a “T” or “U” status, the non-immigrantbecomes eligible to adjust to permanent resident status.
In December 2000, the Legal Immigration Family Equity (LIFE) Act became law. The law contained severalmajor immigration provisions. First, it temporarily reinstated section 245(i) until April 30, 2001, once againauthorising illegal residents who had filed an immigrant application to adjust to that status without having todepart from the United States. The LIFE Act also expanded the “K” visa ordinarily reserved for fiancés andfiancées of US citizens to cover those spouses and minor children of US citizens who are waiting outside theUnited States for approval of their immigrant visa. A “V” visa was created enabling the admission of thosespouses and children of permanent residents whose immigrant applications had been pending for at leastthree years. Finally, the LIFE Act will allow people who would have been eligible for legalization underthe 1986 IRCA program but were rejected or did not apply because of INS’ interpretation of IRCA to apply forimmigrant status.
In February 2001, US President George Bush and Mexican President Vicente Fox met and pledged toengage in high-level negotiations “to constructively address migration and labor issues between our two coun-tries”. Proposals concerning legal permanent migration, expansion of temporary worker programs, safety at theborder, and regularization of the illegal population in the United States are expected to be negotiated. Manyof the new initiatives will require legislation to be passed by the US Congress.

267
© OECD 2001
NOTES
1. Austria entered the EEA in 1994 which made entry-permits unnecessary for large groups of further workers. Hence,there is a structural break in the series.
2. Developed countries are defined as EU, Nordic countries and North America.
3. “Permanent Long Term” is defined as any person who states they are either leaving or entering New Zealand for aperiod of 12 months or more.
4. Data as at 30 June 2000.
5. Those with a New Zealand resident or citizen partner, New Zealand born children, or who had been in New Zealand forfive years or more by 30 March 2001.
6. LFS unemployment rates as a percentage of the total labour force, national sources. The unemployment rate concealsconsiderable regional variations; the unemployment rate of the Bratislava region is less than half that any otherregion’s.
7. The Czech Statistical Office has supplied the numbers that are given in the Table on Emigration to the Czech republic.