Trends in Emergency Department Utilization for Dental and ... to Share Chalmers_USCF...2013 Health...
28
Trends in Emergency Department Utilization for Dental and Oral Health Related Conditions DentaQuest Institute Office of Analytics and Publication Natalia I. Chalmers DDS, PhD - UCSF DPH175 seminar, June 6 th 2017 @ChalmersDDSPhD
Transcript of Trends in Emergency Department Utilization for Dental and ... to Share Chalmers_USCF...2013 Health...

Trends in Emergency Department Utilization for Dental and Oral Health Related ConditionsDentaQuest Institute Office of Analytics and Publication
Natalia I. Chalmers DDS, PhD - UCSF DPH175 seminar, June 6th 2017
@ChalmersDDSPhD

Opportunity for Improvement in Dentistry


Oral Health
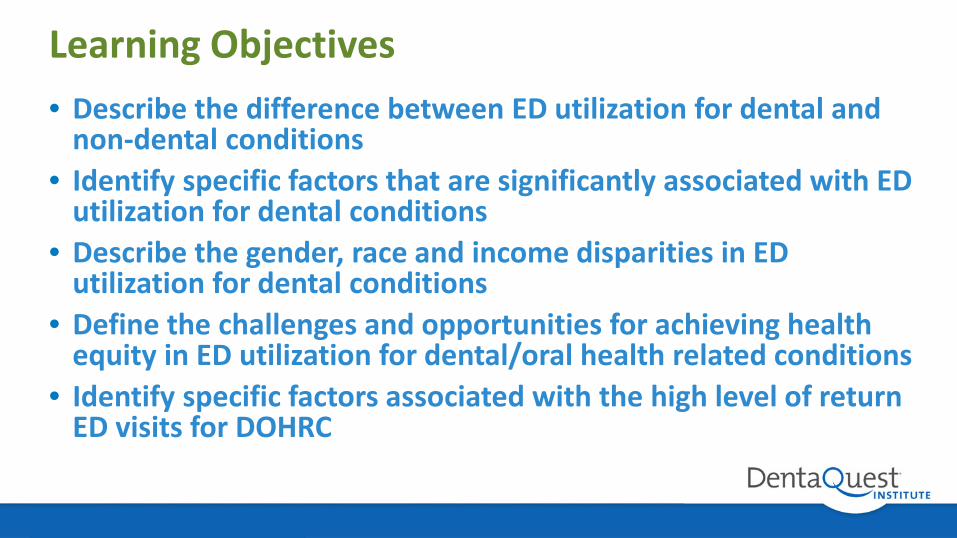
Learning Objectives• Describe the difference between ED utilization for dental and
non-dental conditions• Identify specific factors that are significantly associated with ED
utilization for dental conditions• Describe the gender, race and income disparities in ED
utilization for dental conditions• Define the challenges and opportunities for achieving health
equity in ED utilization for dental/oral health related conditions• Identify specific factors associated with the high level of return
ED visits for DOHRC
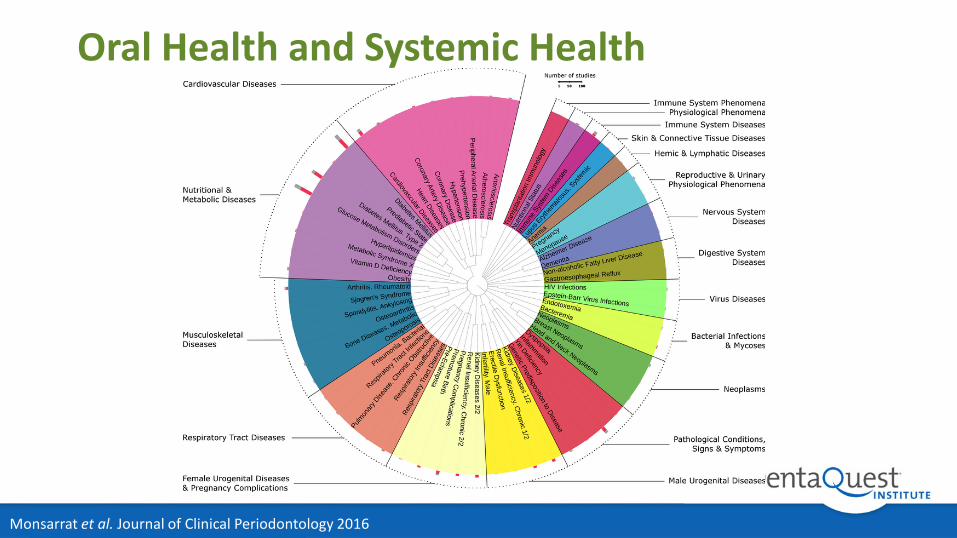
Oral Health and Systemic Health
Monsarrat et al. Journal of Clinical Periodontology 2016

Association between Overall Health and Oral Health
55
60
65
70
75
80
85
10 12.5 15 17.5 20 22.5 25
Data Value of Subset of Subset of Behavioral Risk Factor Data Health-Related Quality of Life HRQOLAdul
ts a
ged
18+
who
hav
e vi
sited
a d
entis
t or
dent
al c
linic
in th
e pa
st y
ear
Adults aged 18+ with fair or poor self-rated overall health
National Oral Health Surveillance System (NOHSS) and HRQOL: Percentage with fair or poor self-rated health Each data point is state
Chalmers et al JADA 2017

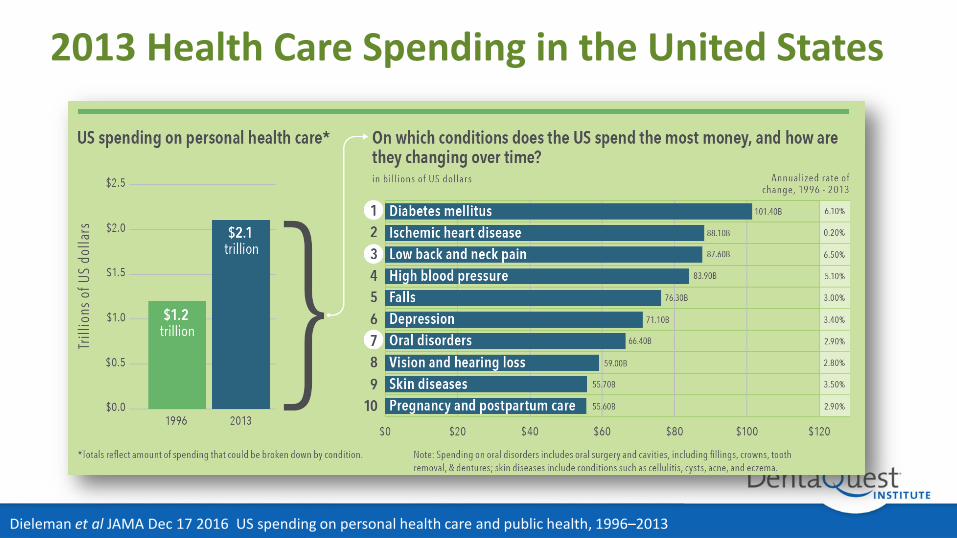
2013 Health Care Spending in the United States
Dieleman et al. JAMA Dec 17 2016 US spending on personal health care and public health, 1996–2013
2013 Health Care Spending in the United States
Dieleman et al JAMA Dec 17 2016 US spending on personal health care and public health, 1996–2013

National Health Expendituresand Dental Services ExpendituresAggregate and per Capita Amounts, Percent Distribution and Annual Percent Change by Source of Funds: Calendar Years 2009-2025

2,296
3,029 3,206 3,358 3,5393,966
5,549
15.9%17.4% 17.8% 18.1% 18.3% 18.6%
19.9%
0.0%
5.0%
10.0%
15.0%
20.0%
25.0%
$0
$1,000
$2,000
$3,000
$4,000
$5,000
$6,000
2007 2014 2015 2016 2017 2019 2025
% o
f Gro
ss D
omes
tic P
rodu
ct
Expe
nditu
re in
Bill
ions
of D
olla
rsNational Health Expenditure NHE as a % of GDP
Note: Data from 2016-20205 is projected. Source: Keehan SP, Stone DA, Poisal JA, et al. National Health Expenditure Projections, 2016–25: Price Increases, Aging Push Sector To 20 Percent Of Economy. Health Affairs. 2017.

97113 118 122 128
141
185
4.5%
3.9% 3.9% 3.8% 3.8% 3.7%3.5%
0.0%
0.5%
1.0%
1.5%
2.0%
2.5%
3.0%
3.5%
4.0%
4.5%
5.0%
$0
$20
$40
$60
$80
$100
$120
$140
$160
$180
$200
2007 2014 2015 2016 2017 2019 2025 % o
f Tot
al H
ealth
Con
sum
ptio
n Ex
pend
iture
s
Expe
nditu
re in
Bill
ions
of D
olla
rs
Expenditure on Dental Services % of Total Health Consumption Expenditures
Note: Data from 2016-20205 is projected. Source: Keehan SP, Stone DA, Poisal JA, et al. National Health Expenditure Projections, 2016–25: Price Increases, Aging Push Sector To 20 Percent Of Economy. Health Affairs. 2017.

Dental Services Expenditures by Sources of Funds
$43 $43 $44 $45 $46 $46 $47 $48 $50 $52 $55$59 $62 $66 $69 $73
$76
$49 $50 $51 $52 $52 $54 $57 $59 $62 $65 $68 $71$75
$79 $82 $86 $90
$0.3 $0.2 $0.3 $0.4 $0.5 $0.4 $0.4 $0.5 $0.5 $0.5 $0.6 $0.6 $0.7 $0.7 $0.8 $0.9 $0.9$8 $8 $9 $9 $9 $10 $12 $13 $14 $15 $16 $17 $19 $20 $22 $24 $26
$0
$10
$20
$30
$40
$50
$60
$70
$80
$90
$100
2009 2010 2011 2012 2013 2014 2015 2016 2017 2018 2019 2020 2021 2022 2023 2024 2025
Expe
nditu
re in
Bill
ions
of D
olla
rs
Out of Pocket Payment Private Health Insurance Medicare Medicaid

Distribution of Dental Services Expenditures by Sources of Funds
DentaQuest Institute © Confidential | Not for Distribution
41.6% 41.3% 41.2% 41.5% 41.3% 40.3% 39.3% 38.7% 38.4% 38.2% 38.0% 38.5% 38.5% 38.5% 38.4% 38.4% 38.4%
48.3% 47.8% 47.8% 47.4% 47.3% 47.6% 47.7% 47.7% 47.7% 47.6% 47.4% 46.7% 46.4% 46.2% 45.8% 45.5% 45.1%
0.3% 0.2% 0.3% 0.3% 0.4% 0.4% 0.4% 0.4% 0.4% 0.4% 0.4% 0.4% 0.4% 0.4% 0.5% 0.5% 0.5%
7.5% 8.0% 7.9% 7.9% 8.0% 8.9% 9.7% 10.2% 10.5% 10.8% 11.1% 11.4% 11.7% 11.9% 12.3% 12.7% 13.1%
0.0%
5.0%
10.0%
15.0%
20.0%
25.0%
30.0%
35.0%
40.0%
45.0%
50.0%
2009 2010 2011 2012 2013 2014 2015 2016 2017 2018 2019 2020 2021 2022 2023 2024 2025
Out of Pocket Payment Private Health Insurance Medicare Medicaid

1996 Dental Spending in the United States
Dieleman et al JAMA Dec 17 2016 US spending on personal health care and public health, 1996–2013

2013 Dental Spending in the United States
Dieleman et al JAMA Dec 17 2016 US spending on personal health care and public health, 1996–2013

2013 Access to Dental Service (0-20 years)

The Problem
DentaQuest Institute © Confidential | Not for Distribution

National Trends in ED utilization for Dental
2,548,423
2,136,839 2,095,195 2,229,651
817.90
680.30 666.35 699.15
0.00100.00200.00300.00400.00500.00600.00700.00800.00900.00
0
500,000
1,000,000
1,500,000
2,000,000
2,500,000
3,000,000
2011 2012 2013 2014
Rate
s of D
OH
RC
Coun
ts o
f DO
HRC
Count of DOHRC Discharges Rate Per 100K of DOHRC Discharges

Most Commonly Diagnosed Dental Conditions

The following slides are part of manuscript in progress and can not be distributed or published online
DentaQuest Institute © Confidential | Not for Distribution

Maryland: The Patients
http://www.usatoday.com/story/news/local/2015/06/24/er-visits-dental-problems-rising/29242113

Why are Maryland’s Cost Lower?• The Hospital Rate Regulation
Model (from 1974/1977) and the All-Payer Model (from 2014).
– Sets identical hospital service rates for all payers
– From 2014, includes outpatient costs.
– 2014 CMS waiver includes goals in line with the Triple Aim
• 2016 progression plan to extend to chronic care management
– http://healthaffairs.org/blog/2017/01/31/marylands-all-payer-model-achievements-challenges-and-next-steps/

Repeat Visits

DentaQuest Institute © Confidential | Not for Distribution
The following slides are part of manuscript in progress and can not be distributed or published online

Dental Care in the Emergency Departments
• Costs are high $820 per visit• For Dental Medicaid bears the burden• Age and gender disparities • Racial disparities (state)• Income disparities • Majority of patients are healthy• Nondefinitive care with high return rate (state)

Learning Objectives• Describe the difference between ED utilization for dental and
non-dental conditions• Identify specific factors that are significantly associated with ED
utilization for dental conditions• Describe the gender, race and income disparities in ED
utilization for dental conditions• Define the challenges and opportunities for achieving health
equity in ED utilization for dental/oral health related conditions• Identify specific factors associated with the high level of return
ED visits for DOHRC

Natalia I. Chalmers DDS, PhDDiplomate, American Board of Pediatric Dentistry Director, Analytics and Publication DentaQuest Institute, 10320 Little Patuxent Pkwy, Suite 231Columbia MD, [email protected] (202) 579-5801