
Trends in Commercial-Off-The-Shelf vs. Proprietary ...
37
Journal of International Technology and Information Management Journal of International Technology and Information Management Volume 25 Issue 4 Article 2 2016 Trends in Commercial-Off-The-Shelf vs. Proprietary Applications Trends in Commercial-Off-The-Shelf vs. Proprietary Applications Vijay K. Agrawal University of Nebraska at Kearney Vipin K. Agrawal University of Texas at San Antonio A. Ross Taylor University of Nebraska at Kearney Follow this and additional works at: https://scholarworks.lib.csusb.edu/jitim Part of the Business Intelligence Commons, Communication Technology and New Media Commons, Computer and Systems Architecture Commons, Data Storage Systems Commons, Digital Communications and Networking Commons, E-Commerce Commons, Information Literacy Commons, Management Information Systems Commons, Management Sciences and Quantitative Methods Commons, Operational Research Commons, Science and Technology Studies Commons, Social Media Commons, and the Technology and Innovation Commons Recommended Citation Recommended Citation Agrawal, Vijay K.; Agrawal, Vipin K.; and Taylor, A. Ross (2016) "Trends in Commercial-Off-The-Shelf vs. Proprietary Applications," Journal of International Technology and Information Management: Vol. 25 : Iss. 4 , Article 2. Available at: https://scholarworks.lib.csusb.edu/jitim/vol25/iss4/2 This Article is brought to you for free and open access by CSUSB ScholarWorks. It has been accepted for inclusion in Journal of International Technology and Information Management by an authorized editor of CSUSB ScholarWorks. For more information, please contact [email protected].
Transcript of Trends in Commercial-Off-The-Shelf vs. Proprietary ...
Journal of International Technology and Information Management Journal of International Technology and Information Management
Volume 25 Issue 4 Article 2
2016
Trends in Commercial-Off-The-Shelf vs. Proprietary Applications Trends in Commercial-Off-The-Shelf vs. Proprietary Applications
Vijay K. Agrawal University of Nebraska at Kearney
Vipin K. Agrawal University of Texas at San Antonio
A. Ross Taylor University of Nebraska at Kearney
Follow this and additional works at: https://scholarworks.lib.csusb.edu/jitim
Part of the Business Intelligence Commons, Communication Technology and New Media Commons,
Computer and Systems Architecture Commons, Data Storage Systems Commons, Digital
Communications and Networking Commons, E-Commerce Commons, Information Literacy Commons,
Management Information Systems Commons, Management Sciences and Quantitative Methods
Commons, Operational Research Commons, Science and Technology Studies Commons, Social Media
Commons, and the Technology and Innovation Commons
Recommended Citation Recommended Citation Agrawal, Vijay K.; Agrawal, Vipin K.; and Taylor, A. Ross (2016) "Trends in Commercial-Off-The-Shelf vs. Proprietary Applications," Journal of International Technology and Information Management: Vol. 25 : Iss. 4 , Article 2. Available at: https://scholarworks.lib.csusb.edu/jitim/vol25/iss4/2
This Article is brought to you for free and open access by CSUSB ScholarWorks. It has been accepted for inclusion in Journal of International Technology and Information Management by an authorized editor of CSUSB ScholarWorks. For more information, please contact [email protected].

Trends in Commercial-Off-the-Shelf V. K. Agrawal, V. K. Agrawal & A. R. Taylor
© International Information Management Association, Inc. 2016 1 ISSN: 1543-5962-Printed Copy ISSN: 1941-6679-On-line Copy
Trends in Commercial-Off-The-Shelf vs. Proprietary Applications
Vijay K. Agrawal*
Department of Marketing and MIS
University of Nebraska at Kearney
USA
Vipin K. Agrawal
Department of Finance, BB4.04.31
University of Texas at San Antonio
USA
A. Ross Taylor
Department of Marketing and MIS
University of Nebraska at Kearney
USA * Names are given in alphabetical order
ABSTRACT
This study examines factors valued by IS managers in deciding if COTS software is a viable
alternative to proprietary software. The results indicate managers who anticipate increased usage
of COTS packages in 5 years used the same top three factors in the formation of their decisions to
adopt COTS as their colleagues who anticipated either zero change in COTS usage or an
increased usage of proprietary software used in deciding not to adopt COTS software. Managers
anticipating increased COTS usage had a statistically significant higher value for each of those
items compared to managers not anticipating growth in COTS software.
Keywords: Commercial-Off-The-Shelf, Proprietary, Application Software
INTRODUCTION
The average information technology (IT) investment reported by organizations participating in the
Society for Information Management’s 36th Anniversary IT Trends Study was 5.3% of their gross
revenue (Kappelman, et al., 2016) and IT contributes up to 50% of total capital costs (Applegate
et. al. 2009). IT is essential to survival for most businesses. In the United States (US), President
Obama requested a decrease of 2.9 percent in spending for IT projects for fiscal year 2015 bringing
total requested IT spending for the United States Government to $79 billion (Information Week,
2014). This savings of $2.4 billion (2.9 percent) attributed to consolidation of commodity IT
products and services, reduction of duplication, and cutting waste. Between 2011 and 2014 the
Federal Government IT spending increased from $79.4 billion to $81.4 billion. Global spending
on IT is expected to have a compound annual growth rate of 3.3 percent per year from 2015-2020
with IT products and services growing from almost $2.4 trillion in 2015 to over $2.7 trillion in
2020 (IDC, 2016). This increase is likely to be driven by demand for new technologies such as
cloud computing, software as a service (SaaS) and Enterprise Resource Planning (ERP) packages
among others Luftman et al. (2015).

Journal of International Technology and Information Management Volume 25, Number 4 2016
© International Information Management Association, Inc. 2016 2 ISSN: 1543-5962-Printed Copy ISSN: 1941-6679-On-line Copy
Businesses are becoming increasingly reliant upon information technology and are likely to
continue to be so into the future. Driven by customer demands and desires for increased
effectiveness and efficiency businesses are increasing usage of software solutions. The increased
usage is fueling a growth in demand for IT applications and increasing the need for software both
in the proprietary and commercial-off-the-shelf (COTS) domains and across ERP and non-ERP
use cases. As an example, customers increasingly expect to be able to utilize smart phones and
other mobile devices to accomplish an increasing array of tasks that were not previously possible
with access to a full computer. This increased demand for more useful and powerful applications
permeates an industry to the point that it becomes a basic expectation and any business not keeping
current in their technological offerings is at a competitive disadvantage. Cloud computing, IT
resource price decline, decreased costs of storage, and the increased processing power available at
an affordable price point allows many small and medium size companies to afford IT applications
for their organizations when they previously would not have been able to do so (Srinivasan 2013).
These factors and others lead to a trend of annual increases in IT investments worldwide. Increased
maturity in business intelligence, mobile computing, web-enabled transactions, and other areas are
being seen as applications whose usage is beneficial for an increasing percentage of organization.
However, limited available of resources is projected to lead to an increased reliance on cloud
computing and outsourcing/offshoring services. Companies using cloud computing and/or
offshoring/outsourcing, will have a decreased need for employees with higher IT skills (Himmel
and Grossman, 2014). These trends in aggregate are expected to lead to a growth in the need for
end user computing (EUC), the development and use of information systems by people outside the
IS department (McLean 1979), within the organizations (Agrawal, et al. 2011).
The Information Technology (IT) market is experiencing global growth in IT investment but the
high risk and cost involved in the development of application packages and the reduced life cycles
for both products and systems (Turban et al., 2015) are factors that make it challenging for
organizations to keep up with demand for application packages. This has led to alternate avenues
evolving to overcome the significant backlog caused by the demand increase. These outlets
include, but are not limited to, end-user computing, outsourcing, cloud computing, COTS
packages, and ERP solutions. The exponential growth in capability per dollar in the technology
sector for resources such as network capacity, processing power, storage, and other basic factors
have led to a continuous growth in the usage of off-the-shelf/ERP solutions in business
organizations (Agrawal 2005a). In the current study, the application packages are categorized as
proprietary (non-ERP), proprietary (ERP), COTS (non-ERP), and COTS (ERP) packages. ERP
packages are kept as a separate category because of their size and scope.
The theme of this research is to gain an understanding of the changing trends in the utilization of
different categories of the application software. The objective of this study is to identify the current
and future trends in the demand for different categories of software and the contributing factors
influencing the future trends. The identification of both current and future trends in the demand
for different categories of software will help organizations in formulating their IT strategies and
their human resources planning. Further, the trends in usage of different categories of software

Trends in Commercial-Off-the-Shelf V. K. Agrawal, V. K. Agrawal & A. R. Taylor
© International Information Management Association, Inc. 2016 3 ISSN: 1543-5962-Printed Copy ISSN: 1941-6679-On-line Copy
will help academic institutions amend the curriculum offered to meet the changing needs of the
business organizations. The specific research questions addressed are:
What will be the trends in usage of various categories of application software?
Will there be usage of COTS/ERP packages in higher proportion compared to
proprietary packages?
What contributing factors are driving the above trend of COTS solutions?
The present work conducts an analysis on the manufacturing sector and service sector. For the
purpose of this study the manufacturing sector includes the automobile, computer hardware,
pharmaceutical, telecommunication (hardware), and “other” industries. The service sector is
comprised of the banking, retail, hotels, computer software, construction, government, healthcare,
insurance, technology, transportation, utilities, and “other” industries. The quantitative and
qualitative data were collected through a survey of Executives, Directors, First Line Managers,
and Middle Managers from large, medium, and small scale organizations in the United States. This
study offers projections of trends in usage of packages and the possible motivations of these trends.
The study will help in identifying opportunities for both practitioners and researchers.
This article is organized in the following manner. First the literature review and development of
the research model along with research hypotheses are presented. The measurement followed by
the methodology section and the implementation of research methodology is presented. Finally,
data processing and results follows the limitations of the study, implications for practice,
suggestions for future work, and concluding remarks.
BACKGROUND AND DEVELOPMENT OF RESEARCH MODEL
A review of the literature in information systems, operations, supply chain management, and
related fields was conducted with the most relevant information found summarized below. The
study is focused on the United States and is not represented as being generalizable to non-US
companies. This design choice was made to increase the power of the statistical tests and as a
matter of convenience and practicality.
The requirements trends for COTS, proprietary and ERP packages have been researched
extensively as an area of considerable interest for IS researchers for decades. The history of ERP
systems dates back to the early 1950’s when Lyons Teashops used computers to plan material
needs, take orders, plan for goods distribution and other functions (Rahman & Kurien, 2007). In
the 1960’s J.I. Case and IBM collaborated to develop Materials Requirement Planning software
that was the forerunner to modern ERP systems (, although it would be the early 1990’s before the
actual ERP term was used by the Gartner Group (Sturdy, 2012). One of the first studies to quantify
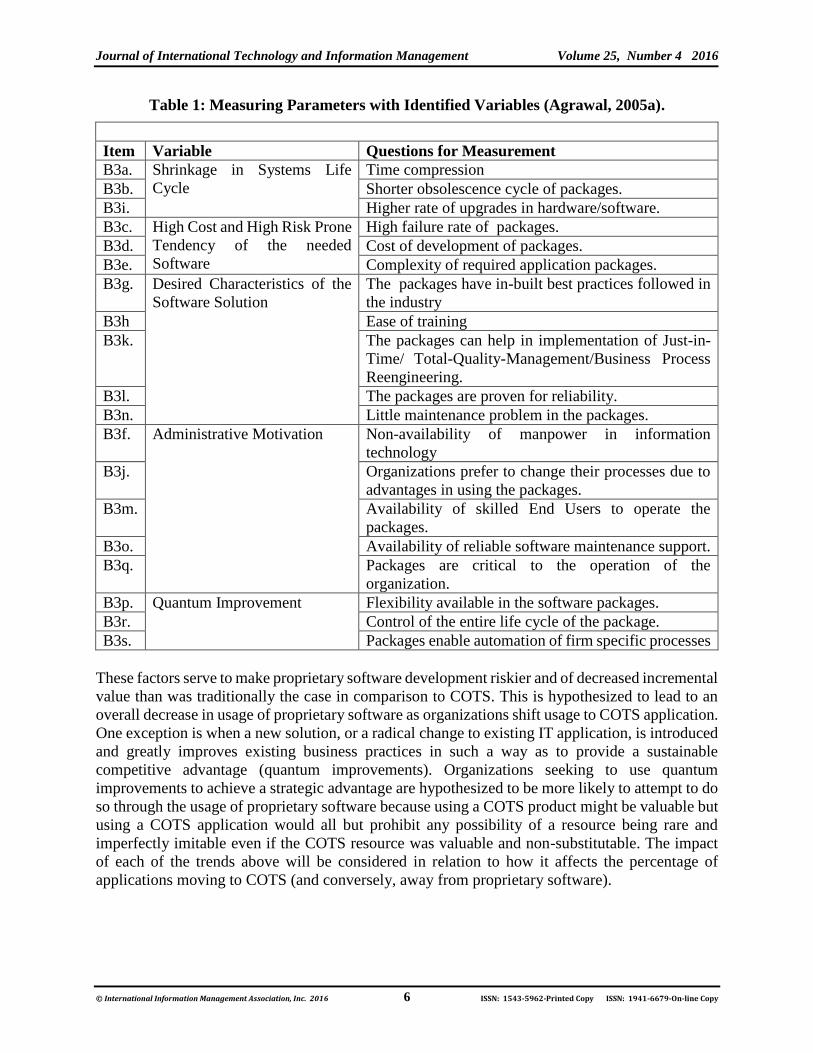
the trends was Agrawal (2005a). Figure 1 illustrates a model presented in Agrawal’s paper and the
parameters (Table 1) thought to influence application software trends in usage across multiple
categories. This study uses the model for the design of a survey to test the model and potentially
offer suggestions for how to improve the model’s predictive validity. In Agrawal’s study, the
variables were shrinkage in systems life cycle, the high cost and risk prone tendency of the needed
software, desired characteristics of the software solution, administrative motivations, and quantum
improvements. The first four independent variables were hypothesized to lead to an increase in

Journal of International Technology and Information Management Volume 25, Number 4 2016
© International Information Management Association, Inc. 2016 4 ISSN: 1543-5962-Printed Copy ISSN: 1941-6679-On-line Copy
the dependent variable, usage of off-the-shelf/ERP solutions while the last variable, quantum
improvements, was hypothesized to lead to a decrease in the dependent variable. Each of the
constructs, along with the expected relationships and hypotheses are discussed in six parts:
proprietary software (including automation in application software development), and
commercial-off-the-shelf software (including systems life cycle is shrinking, high cost and risk-
prone tendency of the needed software, desired characteristics of software, administrative
motivation, continuous improvements/quantum improvements).
Organizations are increasingly moving to the cloud to decrease their investments in IT
infrastructure while also engaging in initiatives to reduce costs via productivity improvements,
moving away from proprietary ERP usage to COTS ERP solutions, using COTS customer
relationship management (CRM) solutions, and developing initiatives to generate additional
revenue via CRM, analytics, and other IT enabled methods Luftman et al. (2015). Luftman et al.
forecasts that over the next 3 – 5 years as organizations shift IT spending in a desire for flexibility
and need for security cloud technologies will be one of the top investments in technology.
PROPRIETARY SOFTWARE
As information technology has matured it has become more strategically vital in some areas while
also being reduced to a role similar to a commodity in other areas. In 2003 Nicholas Carr’s article
“IT Doesn’t Matter” (Carr, 2003) was published in the Harvard Business Review and almost
instantly sparked passionate debate in academic circles. While the authors of this article do not
want to rekindle a debate on the now distant article we believe that Carr’s point was that IT no
longer mattered in the way that it once did. At one time IT was valuable, rare, imperfectly imitable,
and non-substitutable. In other words, it fits the criteria to be a resource that can be used to
establish a sustainable competitive advantage according to the resource based view of the firm.
According to the resource based view of the firm, in order for a firm to develop a sustainable
competitive advantage the firm needs to have a resource, or resources, that is/are heterogeneous
and immobile. Four attributes needed to achieve this are that the resources have to be valuable,
rare, imperfectly imitable, and not substitutable by a resource that does not meet the previous three
criteria (Barney, 1991). But by 2003 IT had become much more ubiquitous and high quality
software packages were available to address many of the problems companies had once had to
develop individually if they wanted to have a solution at all. Many IT solutions were no longer a
strategic resource. Instead they were an expense that needed to be minimized to the extent possible
while still meeting the organizations expectations at an acceptable level. But in areas where IT
could be a strategic resource, IT mattered greatly. One of Carr’s main points was that the level of
corporate investment in IT needed to be considered strategically and according to whether each
particular IT solution was more properly considered a secondary activity or if it added value as a
strategic resource that could provide a strategic advantage.
Since it is difficult in a free market to obtain and keep a sustainable competitive advantage (Porter,
1980) when an organization can obtain a strategic resource through the usage of IT they should
usually invest in proprietary IT to increase their strategic flexibility by maintaining control of the
software development (Agrawal, 2005a) if doing so will assist the organization in preserving rarity
and imperfect imitability to the maximum extent possible. When an organization can’t use IT as
a strategic resource rivals can act as fast followers to develop and implement similar IT solutions

Trends in Commercial-Off-the-Shelf V. K. Agrawal, V. K. Agrawal & A. R. Taylor
© International Information Management Association, Inc. 2016 5 ISSN: 1543-5962-Printed Copy ISSN: 1941-6679-On-line Copy
quickly. Wailgum (2007) uses Walmart, Dell, and Jet Blue as examples of organizations that have
used proprietary software for competitive advantage. But that advantage has faded or disappeared
for these and many other companies. As the quality of COTS products has increased across most
domains the comparative differences between COTS and proprietary applications has been greatly
reduced, in many cases to the point that COTS can not only serve as an effective substitute to even
very good proprietary systems but the COTS product can usually do so at a fraction of the cost.
Companies such as Walmart were innovators in building IT applications to support business
processes that were best practices. But given the IT business environment that they now operate
in, they continue to build custom applications where it makes sense from a strategic perspective
but they have started to increasingly use commercial applications for business intelligence and
other infrastructural needs (Wailgum, 2007).
Figure 1: Conceptual Model – Strategic Issues in Development of Software: Source
Agrawal (2005a, p. 24).
Four major trends leading to decreased usage of proprietary software are faster development time
(shrinkage in systems life cycle), more complex projects (high cost and risk-prone tendency of the
needed software), ease of use and predictability (desired characteristics of the software solution),
and the desire of senior management to avoid risks and to focus on core competencies
(administrative motivation) (Agrawal 2005a).
Off-the-shelf/ERP
solutions/customized
packages
V/S
Proprietary (Tailor-
made) packages
Shrinkage in systems
life cycle
+
High cost & risk-prone
tendency of the needed
software
+
+ Desired characteristics
of the software solution
__
+
Administrative
motivation
Quantum improvements
+ Increase
__ Decrease
Journal of International Technology and Information Management Volume 25, Number 4 2016
© International Information Management Association, Inc. 2016 6 ISSN: 1543-5962-Printed Copy ISSN: 1941-6679-On-line Copy
Table 1: Measuring Parameters with Identified Variables (Agrawal, 2005a).
Item Variable Questions for Measurement
B3a. Shrinkage in Systems Life
Cycle
Time compression
B3b. Shorter obsolescence cycle of packages.
B3i. Higher rate of upgrades in hardware/software.
B3c. High Cost and High Risk Prone
Tendency of the needed
Software
High failure rate of packages.
B3d. Cost of development of packages.
B3e. Complexity of required application packages.
B3g. Desired Characteristics of the
Software Solution
The packages have in-built best practices followed in
the industry
B3h Ease of training
B3k. The packages can help in implementation of Just-in-
Time/ Total-Quality-Management/Business Process
Reengineering.
B3l. The packages are proven for reliability.
B3n. Little maintenance problem in the packages.
B3f. Administrative Motivation Non-availability of manpower in information
technology
B3j. Organizations prefer to change their processes due to
advantages in using the packages.
B3m. Availability of skilled End Users to operate the
packages.
B3o. Availability of reliable software maintenance support.
B3q. Packages are critical to the operation of the
organization.
B3p. Quantum Improvement Flexibility available in the software packages.
B3r. Control of the entire life cycle of the package.
B3s. Packages enable automation of firm specific processes
These factors serve to make proprietary software development riskier and of decreased incremental
value than was traditionally the case in comparison to COTS. This is hypothesized to lead to an
overall decrease in usage of proprietary software as organizations shift usage to COTS application.
One exception is when a new solution, or a radical change to existing IT application, is introduced
and greatly improves existing business practices in such a way as to provide a sustainable
competitive advantage (quantum improvements). Organizations seeking to use quantum
improvements to achieve a strategic advantage are hypothesized to be more likely to attempt to do
so through the usage of proprietary software because using a COTS product might be valuable but
using a COTS application would all but prohibit any possibility of a resource being rare and
imperfectly imitable even if the COTS resource was valuable and non-substitutable. The impact
of each of the trends above will be considered in relation to how it affects the percentage of
applications moving to COTS (and conversely, away from proprietary software).
Trends in Commercial-Off-the-Shelf V. K. Agrawal, V. K. Agrawal & A. R. Taylor
© International Information Management Association, Inc. 2016 7 ISSN: 1543-5962-Printed Copy ISSN: 1941-6679-On-line Copy
COMMERCIAL-OFF-THE-SHELF SOFTWARE
The systems life cycle is shrinking
The number of organizations competing and the number of workers employed by those
organizations has been growing. The growth is characterized by an increased level of international
business and a systems life cycle that continues to shrink as formal software development
methodologies and other improvements occur. The environment is rapidly changing, turbulent,
and unpredictable (Applegate et al., 2009, Scott-Morton, 1991; Turban & Volonino, 2011). Time-
compression, short product life cycles, discontinuity of strategies, an increased need for in depth
knowledge, and an approach that focuses on the customer are common in the current IT
environment. (El Sawy, Malhotra, Gosain, & Young, 1999). In addition to, and at least partially
because of, these factors packages will also be costlier because of faster obsolescence. Many
businesses now compete on the basis of time (Li & Ye, 1999) further added to the pressure on IT
systems. Changes in strategy will have to occur more frequently because of the pace of business
enabled largely by IT and these changes will lead to still more alterations in processes and
subsequent changes to the supporting software. The accelerated changes in technology leads to
software firms having very short development time cycles (Matheson & Tarjan, 1998; Nidumolu
& Knotts,1998). Naukam (2014) asserted that the business users are not satisfied with the backlog
of projects and performance of IT department. Commercial Off the Shelf ERP systems are
expected to experience increased adoption because of the resulting higher rate of obsolescence
Agrawal (2005b). Largely because of the IT environment described above most organizations will
strive to reduce the amount of time and money invested in IT software development by utilizing
COTS, cloud computing, software as a service, COTS/ERP, and other solutions to decrease the
expense and risk of developing proprietary software (Agrawal et al. 2011).
Hypothesis 1: The mean “Systems life cycle shrinkage” score for managers who are
anticipating increased usage of COTS/ERP in the next 5 years will be different than the
mean “Systems life cycle shrinkage” score for managers who do not anticipate increased
usage of COTS/ERP in the next 5 years.
High cost and risk-prone tendency of the needed software
IT outsourcing has grown because of three primary reasons 1.) companies increasingly want to
concentrate on their core competencies so they outsource areas such as technologies and IT
components when those are not core competencies; 2.) officer dissatisfaction with the information
systems department’s performance; 3.) outsourcing is more cost effective (Lucas, 2000; Turban,
McLean, & Whetherbe, 2001; Turner & Kambil, 1994; Venkatraman & Short, 1992).
Purely technical IT tasks, such as change management and implementation, were projected to not
be good candidates for outsources but the rest of the organizational IT functions, such as coding,
are good candidates to outsource in order to reduce IT expenses (Markus & Benjamin,1996).
Palvia and Wang (1995) found that outsourcing and downsizing was being considered by many IS
executives to improve their IT Department’s performance. Software development is expensive and
risky due to the complexity of modern systems and high project failure rates are common. A report
by Standish Group 2015 Chaos Report on the success of software projects reveals that during year
Journal of International Technology and Information Management Volume 25, Number 4 2016
© International Information Management Association, Inc. 2016 8 ISSN: 1543-5962-Printed Copy ISSN: 1941-6679-On-line Copy
2015 in the United States 29% of all projects succeeded (delivered on time, on budget, with
required features and functions), 52% were challenged (late, over budget, and/or with less than the
required features and functions), and 19% failed (cancelled prior to completion or delivered and
never used). Furthermore, estimated success of large-scale (large and grand) software development
(projects with more than $10 million in labor content) stated that 10.5% of all projects succeeded,
57% were challenged, and 32.5% failed (Hastie & Wojewoda, 2015).
Complex systems are more likely to fail as are integrated systems since development of integrated
systems tends to be both complex and large (Jeong & Klein, 1999). Software development
productivity has increased because of improvements in code reusability and customizability
resulting from the object oriented approach and this has led to increased flexibility, increased
predictability, and fewer errors (Nidumolu & Knotts, 1998). However fast obsolescence rate
combined with high cost and risk factors will continue to make in-house development less
desirable for complex projects if the functionality required is available in a COTS alternative. With
the shift of the role of information technology toward a strategic necessity approach (Carr, 2013,
2003), reduced investments on IT applications will be preferred when requirements can be met by
a COTS product at a significantly lower cost.
Hypothesis H2: The mean “Higher development cost and risks associated with the
development of proprietary software” score for managers who are anticipating increased
usage of COTS/ERP in the next 5 years will be different than the mean “Higher
development cost and risks associated with the development of proprietary software” score
for managers who do not anticipate increased usage of COTS/ERP in the next 5 years.
Desired characteristics of software
Ease of use and predictability of cost and outcome are desired characteristics of software that
favor COTS/ERP. Davis (1986) found that ease of use and usefulness predict user intention to use
a technology. Many COTS products now offer a standardized user interface that helps end users
learn how to use similar products quicker than would have previously been possible. In order to
reduce training costs and improve user satisfaction firms want software that is easy to use. A
simpler user interface and improved artificial intelligence are factors that are leading many COTS
systems to be usable with little or no training. Reliable predictions of costs of acquisition,
implementation, and use or off-the-shelf/ERP solutions can be determined with some precision
(Heikkilä, Saarinen, & Sääksjärvi, 1991; Laudon and Laudon, 2015) but as mentioned in the
preceding section, the development of proprietary systems is subject to cost overruns, budget
delays, and an uncertain ability to meet the expectations of the users (Hastie & Wojewoda, 2015).
To avoid some of the risk factors mentioned earlier firms want predictability. Furthermore, COTS
packages are immediately available and can save up to 50% or more compared to the costs of
development efforts. In addition, organizations can reduce maintenance costs by implementing
COTS/ERP packages. As much as 80% of a corporations’ IT budget can be dedicated to
maintenance costs of in-house developed proprietary packages (Turban et al. 2011). With the

Trends in Commercial-Off-the-Shelf V. K. Agrawal, V. K. Agrawal & A. R. Taylor
© International Information Management Association, Inc. 2016 9 ISSN: 1543-5962-Printed Copy ISSN: 1941-6679-On-line Copy
installation of a new application such as a COTS/ERP allows them to upgrade their processes using
best practices built into the packages (Turban et al., 2001).
Hypothesis H3: Managers with a higher mean score on the “desired characteristics of
software” construct who are anticipating increased usage of COTS/ERP in the next 5 years
will be different than the mean ““desired characteristics of software” construct” score for
managers who do not anticipate increased usage of COTS/ERP in the next 5 years.
Administrative motivation
As many of the IT functions that would previously have been addressed by the information
systems department have been decentralized to the end users the manpower and budget has to
accomplish those functions has also gone to the end user and the manpower and budget allocated
to information systems departments has been decreasing (Edberg and Bowman, 1996; He, Kusy,
& Zhao, 1998; Lucas, 2000). This shift is largely driven by an increased availability of user-
friendly software, knowledgeable end-users, and extensive company support to EUC (Turban et
al., 2001). End-users are assuming increased responsibilities for information systems applications,
and end-user involvement is positively correlated with the success of information systems (Doll
and Torkzaddah, 1988; McLean, Kappelman, & Thompson, 1993; Winter, Chudoba, & Gutek,
1997). Turban et al. (2001) claimed that many of the user requirements are smaller in size and can
be developed by end-users themselves. The percentage of knowledge and information work
constitutes 60% of America’s GNP and 55% in America’s labor force (Laudon and Laudon, 1999).
As more knowledge workers are available and the have tools with simple user interfaces for daily
work and application development tools/utility programs end users may develop most smaller one-
time application software with no or minimal assistance from IT professionals (Agrawal et al.
2011). Many of the previously mentioned factors also serve as administrative motivation for
moving to COTS. Administrative motivation reasons also include the continuing growth in
software and the outsourcing market that can be attributed to the shifting role of IT as a commodity
due to the reliability of services provided by these sources (Carr 2003, 2013). Because
management is not satisfied with the performance of IT departments they are replacing in-house
development with COTS (Naukam 2014). In order for organizations to survive in an increasingly
more competitive environment they have to consider the usage of COTS or outsourcing where
appropriate.
Hypothesis H4: Managers with a higher mean score on the “administrative motivation,
system performance” construct who are anticipating increased usage of COTS/ERP in the
next 5 years will have a statistically significant different score than the mean

Journal of International Technology and Information Management Volume 25, Number 4 2016
© International Information Management Association, Inc. 2016 10 ISSN: 1543-5962-Printed Copy ISSN: 1941-6679-On-line Copy
“administrative motivation, system performance” construct score for managers who do not
anticipate increased usage of COTS/ERP in the next 5 years.
Continuous improvements/quantum improvements
Intense competition leads to uncertainty and stimulates higher innovation and adoption rates that
will, in turn, increase competition (Ettlie, 1983; Lewin, Lewin, & Meisel, 1987). Supernormal
profits are not sustainable in a competitive market with free entry (Porter, 1980).
Short-term profits are possible but over time the profit earned will equal the cost of capital plus
compensation to the owner for unique inputs to production. When secrecy is maintained IT can
provide a short-term competitive advantage but duplication time for applications is months at most
in many cases and rapidly developed new innovations will make the old ones obsolete (Porter,
1996; Turban et al., 2015). In light of this, IT in unlikely to be a source for gaining a competitive
advantage in most cases. IT has been identified as mostly a commodity or a strategic necessity for
the organization and cannot be a source of sustainable competitive advantage (Brynjolfsson, 1996;
Carr 2003, 2013; Clemons 1990, 1991; Clemons and Kimbrough, 1986; Emery, 1990; Kermer and
Sosa, 1991; McNurlin, 1991). In the industrial world most businesses could not function without
computers and software (Jones, 1994). As IT’s role as a strategic necessity to obtain a competitive
advantage decreases the level of corporate investment in IT will be decreased as well for most
organizations (Carr 2003, 2013). Organizations will minimize their application packages expenses
by using COTS/ERP solutions with a policy of continuous improvements. Alternatively, when
organizations have a possibility of establishing a sustainable strategic advantage they will develop
proprietary application packages in order to maintaining control of the software development and
the flexibility in the packages even though the expense involved will be greater.
Hypothesis H5: Managers with a higher mean score on the “importance of quantum
improvement” construct who are anticipating increased usage of COTS/ERP in the next 5
years will have a statistically significant different score than the mean “the importance of
quantum improvement” construct score for managers who do not anticipate increased
usage of COTS/ERP in the next 5 years.
MEASURES
For the constructs the measures were based upon prior available literature (Table 1), validated, and
adapted to the context of this study. Multiple-item measures were used for assessing the various
research constructs. All the items were measured using a seven-point Likert type scale. Details of
the process are given in section 5, “Implementation of Research Methodology.”
METHODOLOGY
The scope of study for this research project is the manufacturing and service sectors for United
States based organizations. This study has been defined as exploratory and descriptive. A

Trends in Commercial-Off-the-Shelf V. K. Agrawal, V. K. Agrawal & A. R. Taylor
© International Information Management Association, Inc. 2016 11 ISSN: 1543-5962-Printed Copy ISSN: 1941-6679-On-line Copy
“survey” approach was used to achieve more generalizability and additional richness. The study is
divided into three phases:
Phase 1 – Exploratory study: In this phase a literature search was conducted and the
findings were analyzed. Based upon the results of that analysis the problem list and a
revised version of Agrawal’s questionnaire (Agrawal, 2005a) were developed.
Phase 2 – Survey and construct validity: In this phase, a questionnaire survey was used to
answer the research questions. For testing the construct validity of the questionnaire, a
principal component factor analysis, combined with Varimax rotation, was performed.
Phase 3 – Data analyses: The data are quantitative in nature. The data were used to test
the hypotheses using t-test, and correlation.
IMPLEMENTATION OF RESEARCH METHODOLOGY
This section is divided into six sub-sections: questionnaire design, questionnaire validation,
reliability using Cronbach's Alpha, questionnaire testing, administering the instrument, and profile
of responding firms and respondents.
Questionnaire design
The questionnaire uses the Likert scale with seven intervals, from low to high, with equal weights.
Because of the difficulties in measurement, open-ended questions were avoided.
Questionnaire validation
The questionnaire validation exercise was divided into four parts: face validity, criterion-related
validity, content validity, and construct validity.
Face validity
The variables and items developed by Agrawal (2005a) were used for initial development of the
questionnaire. This study’s authors discussed and agreed upon a revised set of variable attributes
with agreed upon wording to describe each attribute. The wording of each attribute’s description
was used as an item to describe the over-all constructs being studied. The construct each item on
the questionnaire was hypothesized to represent was validated and refined using the following
process. Three professors served as judges and independently specified which construct, if any,
each item represented. The perceptions were then compared. If all judges agreed on which
construct the item represented the item was considered to have acceptable face validity. Where
there was disagreement the judges discussed the meaning of the question to make sure each judge
had the same understanding of the meaning. If the disagreement of the judges was not with the
wording of the question but rather with the meaning the question was considered to not be a good
item to measure the underlying construct the item was meant to measure and the question was
Journal of International Technology and Information Management Volume 25, Number 4 2016
© International Information Management Association, Inc. 2016 12 ISSN: 1543-5962-Printed Copy ISSN: 1941-6679-On-line Copy
discarded. Where the meaning of the question was perceived differently the question was reworded
to clarify the meaning and the judges independently evaluated each item again.
This process continued until all three judges agreed on which underlying construct the item would
measure or the meaning of the question was clearly understood but there was still disagreement on
the suitability of that question to serve as an item to measure a particular construct, in which case
that item was discarded. The idea was to bring out the mental image for the variables in acceptable
language. This exercise helped in evolving operational definitions of variables and in modifying
the language of the questions. Once the items had face validity they were operationalized through
the questionnaire.
Criterion-related validity
This helped in understanding the questionnaire, its objective, purpose, language, context, and
feasibility of answering from the respondent's point of view. Four IS executives from different
firms were involved in this exercise, which helped in making the questions more specific. Based
on their experience, the execut executives commented on the wordings, size and time required to
respond and suggested several major changes. Items changed as a result of this process were then
reexamined for face validity.
Content validity
A document containing the objective of the study and operational definitions of the variables and
the questionnaire was supplied to four professors and three IS executives. The judges were to
indicate which questions measured which variables. The questions which scored less than 70
percent agreement were modified. After correcting the questionnaire, the judges helped in
resequencing the questions so they represented the logical relationship of variables and natural
flow of thoughts.
Construct validity
Prior to the extraction of the factors, several tests were used to assess the suitability of the
respondent data for factor analysis. These tests included Kaiser-Meyer-Olkin (KMO) Measure of
Sampling Accuracy (Kaiser, 1970, Kaiser and Little Jiffy, 1974), Correlation Analysis (Kim and
Mueller, 1978), and Bartlett’s Test of Sphericity (Bartlett, 1950). SPSS version 23.0 was used for
all data analysis conducted in this study. The KMO index, in particular, is recommended when the
cases to variable ratio are less than 1:5. The KMO index ranges from 0 to 1, with 0.5 considered
suitable for factor analysis (Hair, Anderson, Tatham, Black. 1995, Tabachnick and Fidell, 2007).
When analyzing the correlations of the items only items with a correlation of .4 and above should
be retained for factor analysis (Kim and Mueller, 1978). All items were correlated with all other
items at greater than the .4 level with .437 being the lowest correlation between any two items.
The Bartlett’s Test of Sphericity should be significant (p<0.05) for factor analysis to be suitable
(Hair et al., 1995, Tabachnick and Fidell 2007). For the data used in this study, the KMO index is

Trends in Commercial-Off-the-Shelf V. K. Agrawal, V. K. Agrawal & A. R. Taylor
© International Information Management Association, Inc. 2016 13 ISSN: 1543-5962-Printed Copy ISSN: 1941-6679-On-line Copy
0.934 and Bartlett’s Test of Sphericity has a significance level p = 0.000 (Table 2), therefore the
respondents’ data are suitable for factor analysis.
Table 2: Measurement of Sampling Adequacy Using KMO and Bartlett’s Test of Sphericity
Kaiser-Meyer-Olkin Measure of Sampling Adequacy. .934
Bartlett's Test of Sphericity Approx. Chi-Square 2530.010
Df 190
Sig. .000
In order to determine the number of factors for each construct an eigenvalue greater than one rule
is recommended for established instruments (Churchill, 1979). For exploratory analysis the
selection of the number of factors is determined using both the underlying theory used to develop
the instrument and on empirical results (Hinkin, Tracey, & Enz, 1997). Six factors were used for
factor analysis in this study to test the theory-based proposed 5 factor model. Factor analysis was
also conducted with 4, 5, and 7 factors to test for the possibility that the items might better conform
to a different factor structure. Of the models tested, the 6 factor model fit the best. Loadings greater
than 0.40 in absolute value are suggested as the criterion for significant factor loadings (Ford,
MacCallum, & Tait , 1986) and all items load in excess of 0.4 (Table 5). The items employed in
this study to assess factors influencing the trend in requirements of categories of application
software was a 20-item evaluation of all samples in manufacturing and service sectors of the
United States. A principal components factor analysis of the evaluation scale was conducted using
the 148 valid responses collected. Factor analysis can obtain an accurate solution with a sample
size of 150 observations or more if intercorrelations are reasonably strong (Guadagnoli and
Velicer, 1988) so the sample size is considered adequate. The questionnaire items generally loaded
under the variables they sought to measure (Table 3). In some cases, items loaded on a construct
different from the one hypothesized by the research review conducted in the paper.

Journal of International Technology and Information Management Volume 25, Number 4 2016
© International Information Management Association, Inc. 2016 14 ISSN: 1543-5962-Printed Copy ISSN: 1941-6679-On-line Copy
Table 3: The Modified Constructs with Measuring Data Items.
Item Variable Questions for Measurement
13 Desired Characteristics of the
Software Solution (Factor 1)
Availability of skilled End Users to operate the
packages.
14 Reduced maintenance problems in the packages
15 Availability of reliable software maintenance
support.
16 Flexibility available in the software packages
17 Packages are critical to the operation of the
organization.
19 Packages enable automation of firm specific
processes
21 The packages can help in implementation of Just-in-
Time/ Total-Quality-Management/Business Process
Reengineering.
1 Shrinkage in Systems Life Cycle
(Factor 2)
Rapid changes in the business cycle.
2 Applications are becoming obsolete quickly
3 High failure rate of packages during development
9 Administrative Motivation,
System Performance (Factor 3)
Faster upgrades in hardware/software
10 Organizations prefer to change processes to gain
advantages using packages
12 The packages are proven for better reliability
20 Availability of a user community
6 Administrative Motivation, HR
(Factor 4)
Shortage of information technology professionals
7 The packages have in-built best practices followed
in the industry
8 Ease of training
4 High Cost and High Risk Prone
Tendency of the needed Software
(Factor 5)
Cost of development of packages
5 Complexity of required application packages.
18 Quantum Improvement (Factor 6) Control of the entire life cycle of the package
If the item had more than a .2 difference it was used to measure the construct it loaded on the
highest. Some items loaded on more than one factor but every item loaded on at least one factor at
a significant level. Some possible reasons for the cross loadings are discussed in the “limitations”
section of this paper.
Six distinct factors were used. The Eigenvalues and variance explained by each factor are
presented in Table 4. The 7-item factor of desired characteristics of the software solution explained
the majority of the scale variance, followed by 4-item factor administrative motivation, system
performance, 3-item factor shrinkage in systems life cycle, and 3-factor administrative motivation,
HR. The high-cost and risk prone tendency of needed software explained by the 2-item factor and
the sixth factor quantum improvement by one-item. The factors emerged as anticipated, given a

Trends in Commercial-Off-the-Shelf V. K. Agrawal, V. K. Agrawal & A. R. Taylor
© International Information Management Association, Inc. 2016 15 ISSN: 1543-5962-Printed Copy ISSN: 1941-6679-On-line Copy
subjective knowledge of the participants’ responses. The summary of constructs and factor
loadings are narrated in Table 4 and Table 5 respectively.
“
“Desired characteristics of the software solution” was the label given to the first factor. Thi s 7-
item dimension explained the most variance of the five emergent factors (59.702%). Example
items include: “availability of skilled End Users to operate the packages,” and “reduced
maintenance problems in the packages.” The second factor “shrinkage in systems life cycle”
contains items such as “rapid changes in the business cycle,” “applications are becoming obsolete
quickly,” and “high failure rate of packages during development.” The high failure rate of packages
during development,” which was proposed under “High cost and high risk prone tendency of the
needed software,” loaded strongly on “shrinkage in systems life cycle.” This is possibly because
the shrinkage in the system life cycle is associated with a higher failure rate for ERP and is thus
an important consideration when considering the acquisition of a new software application. The
proposed factor “administrative motivation” is split into two factors: administrative motivation,
system performance and administrative motivation, HR, which contain items such as “the
packages have in-built best practices followed in the industry,” “ease of training,” and “faster
upgrades in hardware/software.” The faster upgrades of hardware/software classified under
administrative motivation may be because of this feature. With the shift to COTS solutions
customers have come to expect each organization to provide all of the latest features. For example,
if one organization in an industry offers the ability to track packages customers expect that all
organization in that industry will be able to track packages. Organizations not using IT for a
competitive advantage can more easily introduce capabilities made possible with newer versions
of software at a rapid pace using COTS/ERP packages. This would likely not apply to companies
such as Facebook, Netflix, Amazon, and others that use their information systems as a core part of
their business strategy. Furthermore, fourth factor “high cost and risk prone tendency of the needed
software” contain the items “cost of development of packages” and “complexity of required
application packages.” These questions were also identified with the same variables by Agrawal
(2005a). A sixth factor “quantum improvement” is associated with only one item “control of the
entire life cycle of the package.”
Table 4. Factor Analysis – Loading and Variances in the Identified Factors
Factor Items Eigenvalue % of Variance
Desired Characteristics of the software
solution (Factor 1) 7 11.940 59.702
Shrinkage in systems life cycle (Factor
2) 3 1.064 5.319
Administrative motivation 1 (Factor 3) 4 0.972 4.858
Administrative motivation 2 (Factor 4) 3 0.870 4.349
High cost and risk prone tendency of the
needed software (Factor 5) 2 0.645 3.225
Quantum Improvement (Factor 6) 1 0.601 3.007

Journal of International Technology and Information Management Volume 25, Number 4 2016
© International Information Management Association, Inc. 2016 16 ISSN: 1543-5962-Printed Copy ISSN: 1941-6679-On-line Copy
Table 5: Loading of Data Items on the Factors Rotated Component Matrixa
Component
1 2 3 4 5 6
B3_1 .249 .800 .235 .226 .083 .124
B3_2 .420 .659 .218 -.043 .279 .145
B3_3 .315 .586 .146 .353 .295 .113
B3_4 .254 .272 .068 .100 .830 .159
B3_5 .213 .151 .297 .389 .705 .095
B3_6 .304 .288 .061 .784 .254 -.008
B3_7 .297 .189 .493 .596 .188 .241
B3_8 .285 .166 .484 .563 .068 .407
B3_9 .115 .393 .675 .035 .295 .391
B3_10 .490 .264 .671 .249 .103 .001
B3_12 .579 .292 .614 .183 .126 -.049
B3_13 .757 .260 .207 .155 .311 -.123
B3_14 .741 .227 .104 .204 .197 .212
B3_15 .755 .250 .203 .277 .176 .198
B3_16 .639 .252 .359 .310 .143 .294
B3_17 .714 .261 .223 .165 .100 .345
B3_18 .364 .395 .140 .142 .305 .626
B3_19 .470 .463 .255 .312 .195 .345
B3_20 .173 .596 .433 .363 .212 .134
B3_21 .410 .575 .189 .308 .255 .301
Extraction Method: Principal Component Analysis.
Rotation Method: Varimax with Kaiser Normalization.a
a. Rotation converged in 12 iterations.
Factor 1 = Desired Characteristics of the Software Solution
Factor 2 = Administrative Motivation
Factor 3 = System Performance
Factor 4 = Administrative Motivation, HR
Factor 5 = High Cost and High Risk Prone Tendency of the needed Software
Factor 6 = Quantum Improvement
Based on the results of the exploratory factor analysis an additional hypothesis for the new
construct developed and is reflected in a revised model (Figure 2).
Hypothesis H6: Managers with a higher mean score on the “administrative motivation
(HR)” construct who are anticipating increased usage of COTS/ERP in the next 5 years
will have a statistically significant different score than the mean “administrative motivation
(HR)” construct score for managers who do not anticipate increased usage of COTS/ERP
in the next 5 years.
Based on the constructs identified, the model is revised and shown in Figure 2 which is considered
uniformly to facilitate the needed analysis of responses from organizations in the United States. In

Trends in Commercial-Off-the-Shelf V. K. Agrawal, V. K. Agrawal & A. R. Taylor
© International Information Management Association, Inc. 2016 17 ISSN: 1543-5962-Printed Copy ISSN: 1941-6679-On-line Copy
spite of seeming limitations, this provides confidence that the questionnaire administered had
enough construct validity.
Figure 2: Modified Conceptual Model – Strategic Issues in Development of Software.
Reliability using Cronbach’s Alpha: Cronbach's Alpha Was used to estimate the reliability of a
scale. An increase in the correlation between items will result in an increase in the value of
Cronbach's Alpha. Table 6 shows the results of a reliability analysis conducted using Cronbach’s
Alpha.
Table 6. Reliability Analysis
Cronbach’s
Alpha
Factor Items COTS Software
Desired Characteristics of the software solution
(Factor 1) 7 0.937
Shrinkage in systems life cycle (Factor 2) 3 0.830
Administrative motivation, system performance
(Factor 3) 4 0.873
Administrative motivation, HR (Factor 4) 3 0.850
High cost and risk prone tendency of the needed
software (Factor 5) 2 0.774
Quantum Improvement (Factor 6) 1 Single Item
Five of the six factors had alpha reliabilities that were within the traditionally acceptable range of
above 0.70 (Nunnally, 1970). The factor quantum improvement is explained by one-item and
therefore its alpha reliability could not be calculated.
Usage of
Commercial-off-the-
shelf/ERP solutions
Shrinkage in systems
life cycle +
High cost & risk-prone
tendency of the needed
software +
+ Desired characteristics
of the software solution
__
+
Administrative
motivation, System
Performance
Quantum improvements
+ Increase
__ Decrease
Administrative
motivation, HR
+
Journal of International Technology and Information Management Volume 25, Number 4 2016
© International Information Management Association, Inc. 2016 18 ISSN: 1543-5962-Printed Copy ISSN: 1941-6679-On-line Copy
Questionnaire testing
The questionnaire was tested with the help of four professors and three IS executives. The
respondents were encouraged to identify difficulties in completing the questionnaire. Complaints
regarding the format, length, language, and context of some of the statements were noted and the
questionnaire was redesigned.
Administering the instrument
The questionnaire survey was administered following the guidelines suggested by Dillman (1978,
2000). The targeted sample was of IT professionals with some responsibility for making IT
software acquisition decisions for organizations based in the United States. The survey instrument
was operationalized electronically using the fees-based non-probability internet panel service from
Qualtrics. Blankenship, Breen, and Dutka (1998) indicated that online panels were lower cost,
faster response, and had the ability to obtain a targeted sample of people who are scarce in the
general population.
The questionnaire survey was sent to a panel of senior managerial IT professionals (directors, chief
information officers, middle managers, etc.) of firms in the United States. All recipients of the
invitation were selected from among those who have registered to participate in Qualtrics online
surveys and polls. The data have not been weighted to reflect demographic composition of IT
professionals and no demographic analysis is conducted. In order to participate subjects were
required to read and accept the institutional review board (IRB) statement and to select a qualifying
description of the management position they served in. If anyone opted out of the survey after
reading the IRB statement or if they indicated they were not in an appropriate job function to
participate, the survey terminated before advancing to the research questions. In order to have
adequate representation for analysis in each industry type, target quotas of 80 service sector
responses and 70 manufacturing sector responses were established. The service sector industry
type had a further target quota of 40 respondents in the Computer Software industry sector and 40
respondents for other service industry sectors. Once a quota was reached Qualtrics deactivated the
links given in the invitation to participate for that sector. The deactivated links were based upon
the industry each person’s panel profile indicated they worked in. Because respondents were paid
only if they completed the survey the quota results were not exact. Respondents who had changed
industry or who began a survey before the link was deactivated were allowed to finish the survey..
Out of the 153 questionnaires started, the total usable responses were 148. According to Callegaro
and DiSogra (2008) calculating a response rate for non-probability samples is not meaningful
because determining the denominator is not possible. This resulted in a break-off rate of 96.73
percent, indicating that subjects who started the survey were very likely to fully or partially
complete the survey. Because the sample is based on those who initially self-selected for
participation rather than a probability sample, no estimates of sampling error can be calculated.
All sample surveys and polls may be subject to multiple sources of error, including but not limited
to sampling error, coverage error, and measurement error (Baker, et al., 2010).

Trends in Commercial-Off-the-Shelf V. K. Agrawal, V. K. Agrawal & A. R. Taylor
© International Information Management Association, Inc. 2016 19 ISSN: 1543-5962-Printed Copy ISSN: 1941-6679-On-line Copy
Profile of responding firms and respondents
This section is divided into three parts: industry type, organization size, and respondent profile.
Industry type
47% of the respondents (Table 7) were from the manufacturing sector and 53% from the service
sector. Respondents from manufacturing and computer software/technology were relatively higher
compared to other industries in both sectors.
Organization size
About 41 percent of respondents (Table 8) were from medium and large organizations having
annual sales of above $250 million. The remaining respondents were from smaller size
organizations. The respondents were approximately in equal proportion in the organizations above
and below $250 million in the United States.
Respondent profile: The perception about issues related to IT (Tables 9 and 10) seems to have a
fair representation based on the respondent’s profile in the organization. 79% of the respondents
are from information systems departments, as intended for this survey research. The remaining
respondents were directly associated with the information systems department. The largest
proportion of respondents were from senior level management. In most of the respondents’
organizations the fulltime information systems’ employees were 100 or higher having IT
department’s budget more than $10 million.

Journal of International Technology and Information Management Volume 25, Number 4 2016
© International Information Management Association, Inc. 2016 20 ISSN: 1543-5962-Printed Copy ISSN: 1941-6679-On-line Copy
Table 7: Distribution of Types of Industries in the Sample.
What is the primary industry of your host
organization Responses Percentage
Manufacturing Sector Automobile Manufacturing 1 1%
Computer Hardware 17 11%
Manufacturing 47 32%
Pharmaceutical Manufacturing 2 1%
Telecommunications Hardware 1 1%
Other Manufacturing 0 0%
--Aerospace 1 1%
--Pl 1 1%
Total Manufacturing Sector 70 47%
Service Sector Computer Software 36r 25%
Technology 21 14%
Construction 3 2%
Government 3 2%
Healthcare 2 1%
Insurance 2 1%
Banking 3 2%
Retail 1 1%
Transportation 3 2%
Utilities 1 1%
Other -- Consumer 1 1%
-- Accounting Firm 1 1%
-- Engine 1 1%
Total Service Sector 78 53%
Total of Both Sectors 148 100%
Table 8: Size of the Organizations in the Sample.
What is the annual sales of your host organization Number of Responses Percentage
Up to 5 million 8 5%
5 million to 20 million 28 19%
20 million to 50 million 22 15%
50 million to 250 million 29 20%
250 million to 500 million 14 9%
500 million to 1 billion 24 16%
1 billion to 2 billion 13 9%
More than 2 billion 10 7%
Total 148 100%

Trends in Commercial-Off-the-Shelf V. K. Agrawal, V. K. Agrawal & A. R. Taylor
© International Information Management Association, Inc. 2016 21 ISSN: 1543-5962-Printed Copy ISSN: 1941-6679-On-line Copy
Table 9: Level of Respondents in the Organizations and their Functional Departments.
What is your level in the
organization
Responses % Functional department Responses %
Executive 53 36% Accounting 4 3%
Directors 35 23% Administration 9 6%
First Line Management 28 19% Engineering 12 8%
Middle Management 32 22% Information Systems 116 79%
Production 1 1%
Sales/Marketing 4 3%
Other
--Purchasing 1 1%
--
Development/Support
1 1%
148 100% 148 100%
Table 10: Number of Full-time Employees and IT Budget.
Full-time information systems’
employee in your organization
No. of
responses
% Budget of organization's IT
Department
No. of
responses
%
1 to 25 16 11% Up to 10 million 57 39%
26 to 100 19 13% 10 million to 25 million 35 23%
101 to 500 38 26% 25 million to 50 million 40 27%
501 to 1,000 34 23% More than 50 million 16 11%
1,000 to 2,000 26 17%
More than 2,000 15 10%
148 100% 148 100%
DATA PROCESSING AND RESULTS
The results of statistical analysis are presented to show the degree of association among the
variables and to examine the statistical significance of the model presented. The significance levels
of 0.01 and 0.05 are very common in research. In the case of this study we considered 0.05 to be
appropriate since the research is exploratory in nature. The software package used for all of the
statistical analysis in this paper were done using SPSS version 23.00.
This part is divided into five sub-parts: descriptive statistics, ranking of variables and data items,
trends in usage of category of software packages, analysis and validation of major hypothesis,
contributing factors to support the trends in IT outsourcing/offshoring.

Journal of International Technology and Information Management Volume 25, Number 4 2016
© International Information Management Association, Inc. 2016 22 ISSN: 1543-5962-Printed Copy ISSN: 1941-6679-On-line Copy
Table 11: Descriptive Statistics of Variables.
Range Mean
Std.
Deviati
on Variance Skewness Kurtosis
Statist
ic
Statist
ic
Std.
Error Statistic Statistic
Statist
ic
Std.
Error
Statisti
c
Std.
Error
C.Usage of Off-the-shelf,
Non-ERP Software 100 25.31 1.820 22.136 489.984 1.770 .199 3.740 .396
C.Usage of Proprietary,
Non-ERP Software 100 24.16 1.624 19.757 390.354 1.678 .199 4.475 .396
C.Usage of Off-the-shelf,
ERP Software 100 24.96 1.787 21.740 472.638 1.584 .199 3.440 .396
C. Usage of Proprietary,
ERP Software 100 25.57 1.791 21.784 474.546 1.164 .199 1.869 .396
F.Usage of Off-the-shelf,
Non-ERP Software 100 24.37 1.610 19.593 383.868 1.638 .199 4.617 .396
F.Usage of Proprietary,
Non-ERP Software 100 25.74 1.749 21.282 452.944 1.697 .199 4.187 .396
F.Usage of Off-the-shelf,
ERP Software 100 24.77 1.822 22.169 491.484 1.641 .199 3.599 .396
F. Usage of Proprietary,
ERP Software 100 25.12 1.952 23.752 564.148 1.427 .199 2.068 .396
Change in Usage of
COTS over 5 Years 170.0 -1.128 1.6755 20.3832 415.473 -1.974 .199 10.086 .396
Change in Usage of
Proprietary Software over
5 Years
170.0 1.128 1.6755 20.3832 415.473 1.974 .199 10.086 .396
COTS.Desired
Characteristics of
Software Solution (Factor
1)
6.0 5.036 .105 1.28 1.627 -1.315 .199 1.844 .396
COTS.Shrinkage in
Systems Life Cycle
(Factor 2)
6.0 4.82 .111 1.354 1.834 -.836 .199 .466 .396
COTS.Administrative
Motivation, system
performance (Factor 3)
6.00 5.016
9 .10568 1.29 1.653 -1.060 .199 1.169 .396
COTS.Administrative
Motivation, HR (Factor 4) 6.0 4.865 .1121 1.364 1.861 -.919 .199 .708 .396
COTS.High Cost and
Risk Prone Tendency of
the Needed Software
(Factor 5)
6.0 5.020 .1057 1.2856 1.653 -.807 .199 1.044 .396
COTS.Quantum
Improvement (Factor 6) 6.0 4.973 .1126 1.3700 1.877 -1.029 .199 1.246 .396
Trends in Commercial-Off-the-Shelf V. K. Agrawal, V. K. Agrawal & A. R. Taylor
© International Information Management Association, Inc. 2016 23 ISSN: 1543-5962-Printed Copy ISSN: 1941-6679-On-line Copy
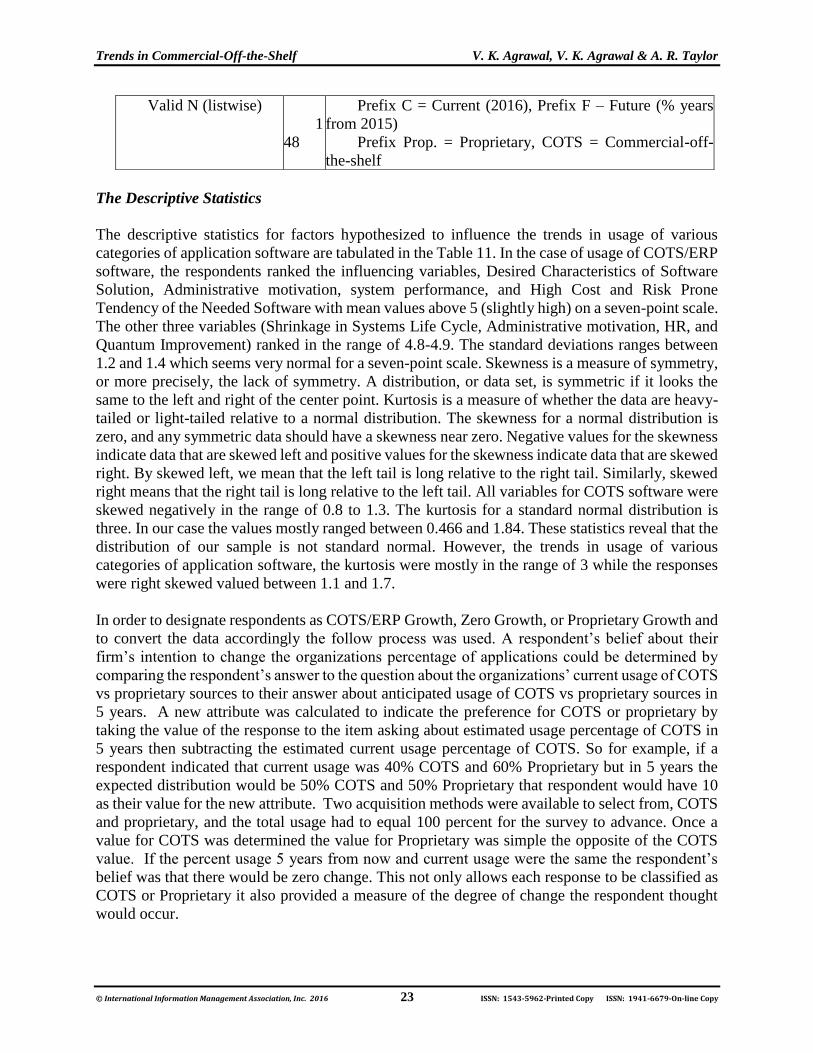
The Descriptive Statistics
The descriptive statistics for factors hypothesized to influence the trends in usage of various
categories of application software are tabulated in the Table 11. In the case of usage of COTS/ERP
software, the respondents ranked the influencing variables, Desired Characteristics of Software
Solution, Administrative motivation, system performance, and High Cost and Risk Prone
Tendency of the Needed Software with mean values above 5 (slightly high) on a seven-point scale.
The other three variables (Shrinkage in Systems Life Cycle, Administrative motivation, HR, and
Quantum Improvement) ranked in the range of 4.8-4.9. The standard deviations ranges between
1.2 and 1.4 which seems very normal for a seven-point scale. Skewness is a measure of symmetry,
or more precisely, the lack of symmetry. A distribution, or data set, is symmetric if it looks the
same to the left and right of the center point. Kurtosis is a measure of whether the data are heavy-
tailed or light-tailed relative to a normal distribution. The skewness for a normal distribution is
zero, and any symmetric data should have a skewness near zero. Negative values for the skewness
indicate data that are skewed left and positive values for the skewness indicate data that are skewed
right. By skewed left, we mean that the left tail is long relative to the right tail. Similarly, skewed
right means that the right tail is long relative to the left tail. All variables for COTS software were
skewed negatively in the range of 0.8 to 1.3. The kurtosis for a standard normal distribution is
three. In our case the values mostly ranged between 0.466 and 1.84. These statistics reveal that the
distribution of our sample is not standard normal. However, the trends in usage of various
categories of application software, the kurtosis were mostly in the range of 3 while the responses
were right skewed valued between 1.1 and 1.7.
In order to designate respondents as COTS/ERP Growth, Zero Growth, or Proprietary Growth and
to convert the data accordingly the follow process was used. A respondent’s belief about their
firm’s intention to change the organizations percentage of applications could be determined by
comparing the respondent’s answer to the question about the organizations’ current usage of COTS
vs proprietary sources to their answer about anticipated usage of COTS vs proprietary sources in
5 years. A new attribute was calculated to indicate the preference for COTS or proprietary by
taking the value of the response to the item asking about estimated usage percentage of COTS in
5 years then subtracting the estimated current usage percentage of COTS. So for example, if a
respondent indicated that current usage was 40% COTS and 60% Proprietary but in 5 years the
expected distribution would be 50% COTS and 50% Proprietary that respondent would have 10
as their value for the new attribute. Two acquisition methods were available to select from, COTS
and proprietary, and the total usage had to equal 100 percent for the survey to advance. Once a
value for COTS was determined the value for Proprietary was simple the opposite of the COTS
value. If the percent usage 5 years from now and current usage were the same the respondent’s
belief was that there would be zero change. This not only allows each response to be classified as
COTS or Proprietary it also provided a measure of the degree of change the respondent thought
would occur.
Valid N (listwise)
1
48
Prefix C = Current (2016), Prefix F – Future (% years
from 2015)
Prefix Prop. = Proprietary, COTS = Commercial-off-
the-shelf

Journal of International Technology and Information Management Volume 25, Number 4 2016
© International Information Management Association, Inc. 2016 24 ISSN: 1543-5962-Printed Copy ISSN: 1941-6679-On-line Copy
Table 12: Ranking of Data Items and Variables.
Items Data Item Mean Rank
21
The packages can help in implementation of Just-in-Time/
Total-Quality-Management/Business Process
Reengineering.
5.149
1
9 Faster upgrades in hardware/software 5.115 2
15 Availability of reliable software maintenance support. 5.115 2
17 Packages are critical to the operation of the organization. 5.108 4
4 Cost of development of packages 5.054 5
14 Reduced maintenance problems in the packages 5.054 5
12 The packages are proven for better reliability 5.047 7
7 The packages have in-built best practices followed in the
industry
5.014 8
5 Complexity of required application packages. 4.986 9
20 Availability of a user community 4.986 9
18 Control of the entire life cycle of the package 4.973 11
19 Packages enable automation of firm specific processes 4.973 11
2 Applications are becoming obsolete quickly 4.959 13
16 Flexibility available in the software packages 4.953 14
1 Rapid changes in the business cycle. 4.946 15
10 Organizations prefer to change processes to gain
advantages using packages
4.919 16
8 Ease of training 4.912 17
13 Availability of skilled End Users to operate the packages. 4.899 18
6 Shortage of information technology professionals 4.669 19
3 High failure rate of packages during development 4.568 20
Variables
Desired Characteristics of Software Solution (Factor 1) 5.036 1
High Cost and Risk Prone Tendency of the Needed Software
(Factor 5) 5.020 2
Administrative Motivation 1 (Factor 3) 5.017 2
Quantum Improvement (Factor 6) 4.973 4
Administrative Motivation 2 (Factor 4) 4.865 5
Shrinkage in Systems Life Cycle (Factor 2) 4.824 6
Ranking of Variables and Data Items
For the growth in usage of COTS/ERP software, the respondents perceived the top three variables
as “Desired characteristics of software solution”, “High cost and risk prone tendency of the needed
software”, and “Administrative motivation, system performance” (Table 12). The top six data
items are “The packages can help in implementation of just-in-time/total-quality-
management/business process reengineering”, “Faster upgrades in hardware/software”,
“Availability of reliable software maintenance support”, “Packages are critical to the operation of
the organization”, “Cost of development of packages”, and “Reduced maintenance problems in
the packages.” The faster upgrades in software and hardware can be argued considering that the
Trends in Commercial-Off-the-Shelf V. K. Agrawal, V. K. Agrawal & A. R. Taylor
© International Information Management Association, Inc. 2016 25 ISSN: 1543-5962-Printed Copy ISSN: 1941-6679-On-line Copy
COTS/ERP packages are upgraded regularly and with the faster upgrades the organizations can
get competitive advantages. In addition, the cost of development of proprietary packages which is
relatively higher compared to COTS/ERP packages irrespective of benefits in costs due to
automation in development of proprietary packages.
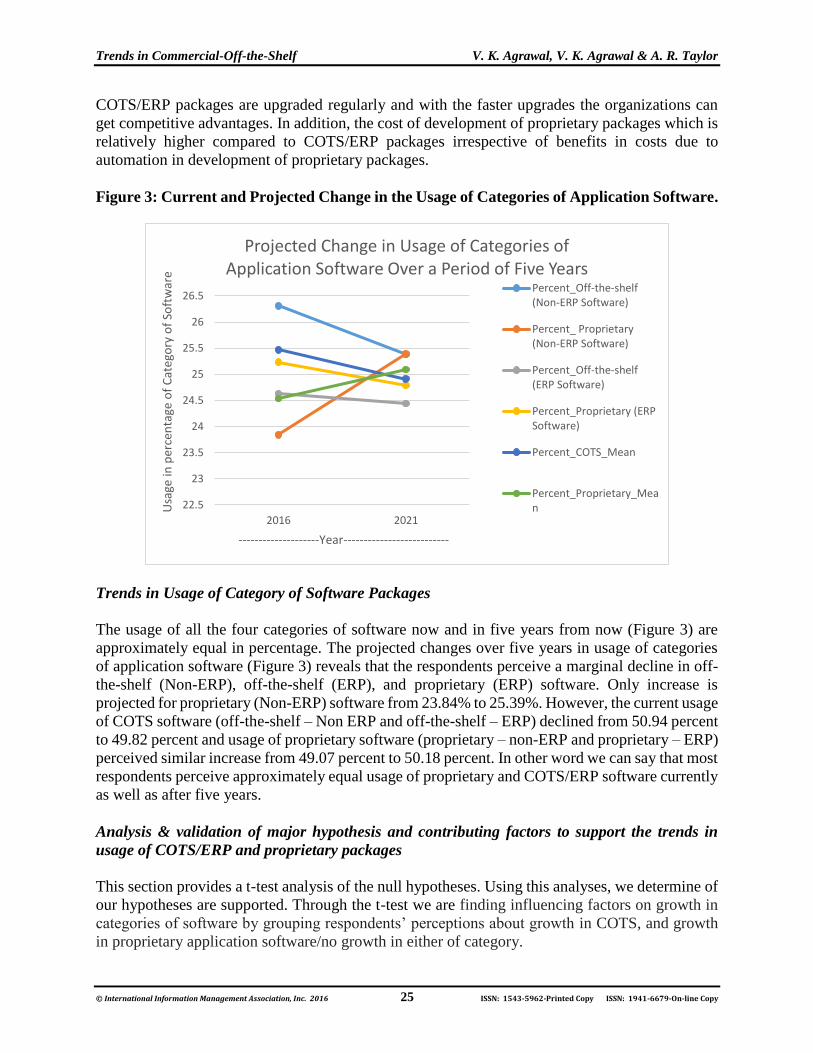
Figure 3: Current and Projected Change in the Usage of Categories of Application Software.
Trends in Usage of Category of Software Packages
The usage of all the four categories of software now and in five years from now (Figure 3) are
approximately equal in percentage. The projected changes over five years in usage of categories
of application software (Figure 3) reveals that the respondents perceive a marginal decline in off-
the-shelf (Non-ERP), off-the-shelf (ERP), and proprietary (ERP) software. Only increase is
projected for proprietary (Non-ERP) software from 23.84% to 25.39%. However, the current usage
of COTS software (off-the-shelf – Non ERP and off-the-shelf – ERP) declined from 50.94 percent
to 49.82 percent and usage of proprietary software (proprietary – non-ERP and proprietary – ERP)
perceived similar increase from 49.07 percent to 50.18 percent. In other word we can say that most
respondents perceive approximately equal usage of proprietary and COTS/ERP software currently
as well as after five years.
Analysis & validation of major hypothesis and contributing factors to support the trends in
usage of COTS/ERP and proprietary packages
This section provides a t-test analysis of the null hypotheses. Using this analyses, we determine of
our hypotheses are supported. Through the t-test we are finding influencing factors on growth in
categories of software by grouping respondents’ perceptions about growth in COTS, and growth
in proprietary application software/no growth in either of category.
22.5
23
23.5
24
24.5
25
25.5
26
26.5
2016 2021
Usa
ge in
per
cen
tage
of
Cat
ego
ry o
f So
ftw
are
--------------------Year--------------------------
Projected Change in Usage of Categories of Application Software Over a Period of Five Years
Percent_Off-the-shelf(Non-ERP Software)
Percent_ Proprietary(Non-ERP Software)
Percent_Off-the-shelf(ERP Software)
Percent_Proprietary (ERPSoftware)
Percent_COTS_Mean
Percent_Proprietary_Mean
Journal of International Technology and Information Management Volume 25, Number 4 2016
© International Information Management Association, Inc. 2016 26 ISSN: 1543-5962-Printed Copy ISSN: 1941-6679-On-line Copy
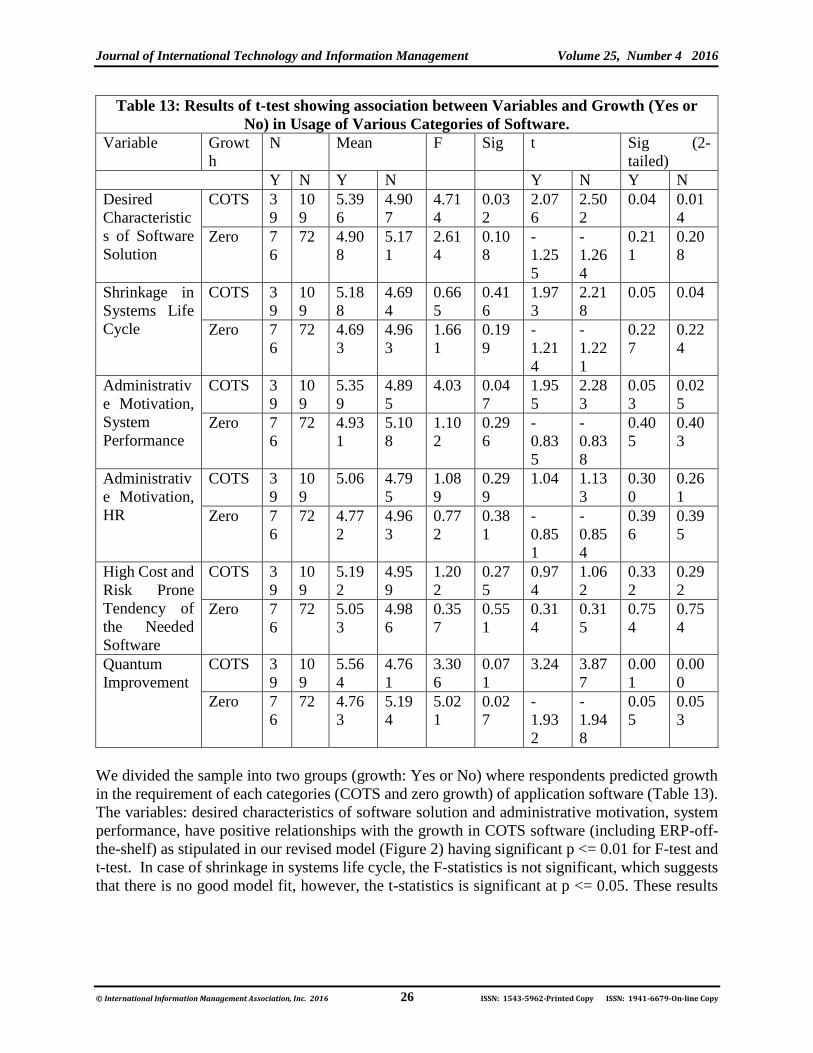
Table 13: Results of t-test showing association between Variables and Growth (Yes or
No) in Usage of Various Categories of Software.
Variable Growt
h
N Mean F Sig t Sig (2-
tailed)
Y N Y N Y N Y N
Desired
Characteristic
s of Software
Solution
COTS 3
9
10
9
5.39
6
4.90
7
4.71
4
0.03
2
2.07
6
2.50
2
0.04 0.01
4
Zero 7
6
72 4.90
8
5.17
1
2.61
4
0.10
8
-
1.25
5
-
1.26
4
0.21
1
0.20
8
Shrinkage in
Systems Life
Cycle
COTS 3
9
10
9
5.18
8
4.69
4
0.66
5
0.41
6
1.97
3
2.21
8
0.05 0.04
Zero 7
6
72 4.69
3
4.96
3
1.66
1
0.19
9
-
1.21
4
-
1.22
1
0.22
7
0.22
4
Administrativ
e Motivation,
System
Performance
COTS 3
9
10
9
5.35
9
4.89
5
4.03 0.04
7
1.95
5
2.28
3
0.05
3
0.02
5
Zero 7
6
72 4.93
1
5.10
8
1.10
2
0.29
6
-
0.83
5
-
0.83
8
0.40
5
0.40
3
Administrativ
e Motivation,
HR
COTS 3
9
10
9
5.06 4.79
5
1.08
9
0.29
9
1.04 1.13
3
0.30
0
0.26
1
Zero 7
6
72 4.77
2
4.96
3
0.77
2
0.38
1
-
0.85
1
-
0.85
4
0.39
6
0.39
5
High Cost and
Risk Prone
Tendency of
the Needed
Software
COTS 3
9
10
9
5.19
2
4.95
9
1.20
2
0.27
5
0.97
4
1.06
2
0.33
2
0.29
2
Zero 7
6
72 5.05
3
4.98
6
0.35
7
0.55
1
0.31
4
0.31
5
0.75
4
0.75
4
Quantum
Improvement
COTS 3
9
10
9
5.56
4
4.76
1
3.30
6
0.07
1
3.24 3.87
7
0.00
1
0.00
0
Zero 7
6
72 4.76
3
5.19
4
5.02
1
0.02
7
-
1.93
2
-
1.94
8
0.05
5
0.05
3
We divided the sample into two groups (growth: Yes or No) where respondents predicted growth
in the requirement of each categories (COTS and zero growth) of application software (Table 13).
The variables: desired characteristics of software solution and administrative motivation, system
performance, have positive relationships with the growth in COTS software (including ERP-off-
the-shelf) as stipulated in our revised model (Figure 2) having significant p <= 0.01 for F-test and
t-test. In case of shrinkage in systems life cycle, the F-statistics is not significant, which suggests
that there is no good model fit, however, the t-statistics is significant at p <= 0.05. These results

Trends in Commercial-Off-the-Shelf V. K. Agrawal, V. K. Agrawal & A. R. Taylor
© International Information Management Association, Inc. 2016 27 ISSN: 1543-5962-Printed Copy ISSN: 1941-6679-On-line Copy
shows that we can reject the null hypotheses for H1, H3, and H4 thereby confirming those
hypotheses.
Additionally, the group of respondents who perceive zero growth in COTS packages is influenced
by factor quantum improvement, where the F-statistics and t-statistics have significant negative
relationships with p <= 0.05.
Using the results of t-test we can reject the null hypotheses for shrinkage of systems life cycle
(H1), desired characteristics of software solution (H3), and administrative motivation, system
performance (H4). We can summarize our findings by narrating that the growth in usage of
COTS/ERP packages are significantly associated with shrinkage in systems life cycle, desired
characteristics of software, and administrative motivation, HR.
LIMITATIONS OF THE STUDY
As with any other study, this research also has several limitations that need to be discussed. First,
the list of variables pertaining to IT related issues might reflect some biases. Although the
literature was thoroughly reviewed and additional perspectives were obtained form IS
academicians and managers, it is not claimed that these are the only variables that could be
included. The loading of an item on more than one construct could be due to high intercorrelations
of the factors, the accidental inclusion of an unidentified factor, or the absence of a factor that
could result in items loading cleaner when the questionnaire is refined. While these possibilities
are not mutually exclusive it appears that some of the cross loading occurs on questions that relate
to ease of use. Since ease of use is a known determinant of intention to use (Venkatesh and Davis,
1996) it is likely that refining the items to more clearly reflect the role of ease of use in the decision
process would add explanatory power. An instrument may need several administrations before its
construct validity can be ensured.
Thus, it must be stressed that any interpretation of the findings must be made in lieu of the selected
set of variables, issues, and categories. The questionnaire survey involved people from various
departments such as information systems, administration, accounting/finance, production, etc. A
balance among the number of respondents from each department could not be achieved.
Furthermore, samples were collected from the manufacturing sector (automobile, computer
hardware, pharmaceutical, telecommunication (hardware), and other) and service sector (banking,
retail, hotels, computer software, construction, government, healthcare, insurance, technology,
transportation, utilities, and other). Other types of organizations like airlines manufacturing,
railway, chemicals, airlines operations, etc. are not included in the sample. Thus, any inferences
based on the results might be restricted to the companies listed in the directory. The sample size is
148 which is moderate and approximately equally divided among manufacturing and service
sectors.
IMPLICATIONS FOR PRACTICE
This study has demonstrated that organizations are currently meeting their software needs by using
approximately in equal percentages of all the four categories of application software [off-the-shelf
(Non-ERP), off-the-shelf (ERP), proprietary-ERP, and proprietary-Non-ERP) and this can be
expected to continue for the next five years. The approximately equal usage of COTS and

Journal of International Technology and Information Management Volume 25, Number 4 2016
© International Information Management Association, Inc. 2016 28 ISSN: 1543-5962-Printed Copy ISSN: 1941-6679-On-line Copy
proprietary software solutions in the organizations indicates the role of IT is moving towards a
necessity but commodity like function. The organizations whose business strategy is not built
around IT as a product or service prefer to invest the moderate amount on application software and
should concentrate more on core product/services than IT applications for a competitive advantage.
The equal usage of off-the-shelf/ERP solution in the organizations will require relatively fewer in-
house IT professionals for development of proprietary software, maintenance of IT applications
and infrastructure. In addition, for approximately 50 percent of COTS software, relatively fewer
IT professionals having skills in business processes are needed for implementation of readily
available application software. Further, the End-users training requirements are to be met by IT
professionals as and when the need arises. For another 50 percent proprietary software, either IT
department develop on their own or get the same from outsourcers. If they develop on their own,
then they require a good number of IT professionals, otherwise, if it is outsourced, then their
requirements can be met by fewer IT professionals. At the strategic level, the senior level of IT
professionals is needed for formulating IT strategy and for advising to the organizations the needed
IT architecture to meet changing needs of the functional departments. The trend towards natural
language processing will make IT applications simple and the availability of knowledge workers
and growth in EUC is expected to replace IT professionals from operations and maintenance of
software applications. In many cases the End-users will be able to develop most of the smaller
one-time applications by themselves. Further, they will contribute equally with in-house IT
professionals in development, selection, and procurement of application software.
The current and future trends in the requirements of software categories will affect the curriculum
of educational institutions. The IT curriculum must be redesigned equally to cater to the
development and implementation needs of application software.
The organizations will rely on in-house IT department and on outsourcers, application service
providers, and software houses. The vendor development and dealing with them is expected to be
a vital function, as it is in manufacturing and other service sectors of the business. The faster rate
of obsolescence in technology will warrant time-to-time consultations for in-house IT
professionals for upgrading of their skill sets with external professionals in the field.
From the above, it can be argued that the current and future trends of usage of the various categories
of software projected has far reaching implications for organizations and educational institutions.
Consequently, it will influence the government policies and tax structure. Lastly, it can be argued
that this trend may lead to a new era pertaining to applications software. This in-turn will open up
tremendous opportunities for research.
SUGGESTIONS FOR FURTHER WORK
This study provides several opportunities for future research. The results suggest that it might be
useful to develop a number of comprehensive models. Thus, future research can extend this study
to include additional factors such as organizational maturity, IS sophistication, effect of
outsourcing/offshoring and cloud computing on growth in COTS/ERP and proprietary packages,
etc; and to test a variety of such factors. In studying this, future research may also employ more
rigorous methodologies using longitudinal approaches and non-linear relationships. The need for
further refinement of the survey is also a priority. While the current survey items were able to help
advance this exploratory research the amount of factors that cross-loaded is a concern. Further,

Trends in Commercial-Off-the-Shelf V. K. Agrawal, V. K. Agrawal & A. R. Taylor
© International Information Management Association, Inc. 2016 29 ISSN: 1543-5962-Printed Copy ISSN: 1941-6679-On-line Copy
with a broader sample and number of variables, the more generalized model can be developed. A
comparative study of U.S. organizations with their counterparts in other nations can help the
collaborations among them. In addition, a study on IT related issues on other industries in the
United States -- i.e., airlines manufacturing, railway, chemicals, airlines operations, etc. -- can
provide more generalization of results.
CONCLUSION
The main objective of this study was to arrive at a better understanding of the current and future
trends in the usage of categories of application software and its implications for organizations in
the United States. The perceived usage of approximately equal percentage of COTS and
proprietary solution leads us to believe that IT is not as much a source of competitive advantage
as it was in the past to the corporations.
The results of t-tests reveal that the growth in the usage of COTS packages contributed by desired
characteristics of software solution, administrative motivation, System Performance and shrinkage
in systems life cycle as stipulated in our revised model (Figure 2).
For the growth in usage of COTS/ERP software, the respondents perceived the top three variables
as desired characteristics of software solution, high cost and risk prone tendency of the needed
software, and administrative motivation, System Performance, and top five data items as the
packages can help in implementation of just-in-time/ total-quality-management/business process
reengineering, faster upgrades in hardware/software, availability of reliable software maintenance
support, packages are critical to the operation of the organization, and cost of development of
packages. The faster upgrades in software and hardware can be argued considering that the
COTS/ERP packages are upgraded regularly and with the faster upgrades the organizations can
get competitive advantages. In addition, the cost of development of proprietary packages which is
relatively higher compared to COTS/ERP packages irrespective of benefits in costs due to
automation in development of proprietary packages.
The current and changing phase of software in approximately equal usage of COTS and proprietary
packages will result in more reliance on outsourcers, application service providers, software
houses, and consulting organizations. Because the organizations may use external agencies
(outsourcers, application service providers, software houses, and consulting organizations) for
development and/or maintenance of proprietary packages, the balance between in-house and
external agencies may tilt towards external sources and there will be elimination of development
activities to a great extent in the corporation and this shift is expected to trim in-house IT
professionals significantly. The major work of in-house IT professionals will be in implementation
of COTS/proprietary software and training to the End-users, in addition to partly development of
application software. The senior IT professionals are expected to contribute in development of IT
strategies and IT architecture, in collaboration with functional departments. The growth in
knowledge workers, usage of COTS/proprietary packaged solutions, and trends towards natural
language processing may lead to transfer of control on IT budget and IT human resources in the
hands of End-users.

Journal of International Technology and Information Management Volume 25, Number 4 2016
© International Information Management Association, Inc. 2016 30 ISSN: 1543-5962-Printed Copy ISSN: 1941-6679-On-line Copy
REFERENCES
Agrawal, V. K. (2005a). From proprietary software to off-the-shelf/ERP solutions: Identifications
of critical factors. National Social Science Journal, 23, 9-32.
Agrawal, V. K. (2005b). Implications of environmental and cultural factors on the trends in usage
of various categories of software. National Social Science Journal, 25, 1-15.
Agrawal, V. K., Agrawal, V. K., Taylor, A., & Tenkorang, F. (2011). Trends in IT human
resources and its determinants. In Luftman, Jerry Managing IT Human Resources:
Considerations for Organizations and Personnel, 20-36, Hershey, PA: Business Science
Reference (an imprint of IGI Global).
Applegate, L. M, Austin, R. D. & McFarlan, F. W. (2009). Corporate information strategy and
management: Text and cases. New York, NY: McGraw Hill/Irwin.
Baker, R., Blumberg, S. J., Brick, J. M., Couper, M. P., Courtright, M., Dennis, J. M., Dillman,
D., Frankel, M. R., Garland, P., Groves, R. M., Kennedy, C., Krosnick, J., Lavrakas, P. J.,
Lee, S., Link, M., Piekarski, L., Rao, K., Thomas, R. K., & Zahs, D. (2010). Research
synthesis: AAPOR report on online panels. Public Opinion Quarterly 74:711–81.
Barney, J. (1991). Firm resources and sustained competitive advantage. Journal of Management,
17, 99-120.
Bartlett, M. S. (1950). Tests of significance in factor analysis. British Journal of Psychology,
3(Part II), 77-85.
Blankenship, A. B., Breen, G., & Dutka. A. (1998). State of the Art Marketing Research Second
Edition, Chicago, IL: American Marketing Association.
Brynjolfsson, E. (1996). The contribution of Information Technology to consumer welfare.
Information Systems Research, 7, 281-300.
Callegaro, M., & DiSogra, C. (2008). Computing Response Metrics for Online Panels. Public
Opinion Quarterly, 72 (5): 1008-1032.
Carr, N. G. (May 2003). IT doesn't matter. Harvard Business Review. Boston, MA: Harvard
Business School Press.
Carr, N. (2013). The big switch: Rewriting the world from Edison to Google. New York, NY:
W.W. Norton & Co. Inc.
Churchill, G. A., Jr. (1979). A paradigm for developing better measures of marketing constructs.
Journal of Marketing Research, 16, 64-73.
Clemons, E. K. (1990). MAC-Philadelphia national banks strategic venture in shared ATM
networks. Journal of Management Information Systems, 7, 5-25.
Clemons, E. K. (1991). Evaluation of strategic investments in information technology.

Trends in Commercial-Off-the-Shelf V. K. Agrawal, V. K. Agrawal & A. R. Taylor
© International Information Management Association, Inc. 2016 31 ISSN: 1543-5962-Printed Copy ISSN: 1941-6679-On-line Copy
Communications of the ACM, 34, 22-36.
Clemons, E. K., & Kimbrough, S. O. (1986). Information systems, telecommunications, and their
effects on industrial organizations. In Maggi, L., Zmud, R., and Wetherbe, J. (eds),
Proceedings of the Seventh International Conference on Information Systems, San Diego,
CA, 99-108.
Davis, F. D. (1986). A technology acceptance model for empirically testing new end-user
information systems: Theory and results. Doctoral Dissertation, Sloan School of
Management, Massachusetts Institute of Technology, Cambridge, MA.
Dillman, D. A. (1978). Mail and Telephone Surveys: The Total Design Method. New York, NY:
Wiley Intersciences.
Dillman, D. A. (2000). Mail and Internet Surveys: The Tailored Design Method, 2nd Edition. New
York, NY: John Wiley Co.
Doll, W. J., & Torkzaddeh, G. (1988). The measurement of end-user computing satisfaction. MIS
Quarterly, June, 259-274.
Edberg, D. T., & Bowman, B. J. (1996). User-developed applications: An empirical study of
application quality and developer productivity. Journal of Management Information
Systems, 13, Summer, 167.
El Sawy, O. A., Malhotra, A., Gosain, S., & Young, K. M. (1999). IT-intensive value innovation
in the electronic economy: Insights from Marshall Industries. MIS Quarterly, Vol.23,
September, 305-335.
Emery, J. C. (1990). Misconception about strategic information systems. MIS Quarterly, 14, June,
VII-VIII.
Ettlie, J. E. (1983). Organizational policy and innovation among suppliers to the food processing
sector. Academy of Management Journal, 26, 27-44.
Ford, J. K., MacCallum, R. C., & Tait. M. (1986). The application of exploratory factor analysis
in applied psychology: A critical review and analysis. Personnel Psychology, 39, 291-314.
Guadagnoli, E., & Velicer, W. F. (1988). Relation of sample size to the stability of component
patterns. Psychological Bulletin, 103, 265-275.
Hair, J., Anderson, R. E., Tatham, R. L., & Black, W.C. (1995). Multivariate data analysis. 4rt
Edn. New Jersey, NJ: Prentice Hall Inc.
Hastie, S., & Wojewoda, S. (2015). Standish Group 2015 Chaos Report – Q & A with Jennifer
Lynch. InfoQ, October 4, Retrieved from https://www.infoq.com/articles/standish-chaos-
2015
He, Z. M., Kusy, K. M., & Zhao, T. (1998). A survey study of the current IS usage in the Chinese

Journal of International Technology and Information Management Volume 25, Number 4 2016
© International Information Management Association, Inc. 2016 32 ISSN: 1543-5962-Printed Copy ISSN: 1941-6679-On-line Copy
manufacturing industry. Information and Management, 34, 285-294.
Heikkilä, J. T., Saarinen, T., & Sääksjärvi, M. (1991). Success of software packages in small
businesses: An exploratory study. European Journal of Information Systems, 1, 159-169.
Himmel, M. A., & Grossman, F. (2014). Security on distributed systems: Cloud security versus
traditional IT. IBM Journal of Research and Development, 58, Paper 3.
Hinkin, T. R., Tracey, J. B., & Enz, C. A. (1997). Scale construction: Developing reliable and valid
measurement instruments. Cornell University School of Hotel Administration: The
Scholarly Commons, Retrieved from http://scholarship.sha.cornell.edu/articles/613.
IDC (2016, August 29). Worldwide IT Spending Forecast to Reach $2.7 Trillion in 2020 Led by
Financial Services, Manufacturing, and Healthcare, Retrieved January 19, 2017, from
https://www.idc.com/getdoc.jsp?containerId=prUS41699316
Information Week. (2014). Federal IT spending slashed in proposed 2015 budget. March 5,
Retrieved from http://www.informationweek.com/government/cybersecurity/federal-it-
spending-slashed-in-proposed-2015-budget/d/d-id/1114126
Jeong, J. J., & Klein, G. (1999). Risks to different aspects of system success. Information and
Management, 36, 263-272.
Jones, M. (1994). Don’t emancipate, exaggerate: Rhetoric, reality and reengineering. In R.
Baskerville, S. Smithson, C. Ngwenyama & J. I. DeGross (Eds.), Transforming
organization with Information Technology. (pp. 357-378). North Holland: Elseiver
Science.
Kaiser, H. F. (1970). A second-generation little jiffy. Psychometrika, 35, 401-415.
Kaiser, H. F. (1974). Little Jiffy, Mark IV. Educational and psychological measurement, 34, 111-
117.
Kappelman, L., McLean, E., Johnson, V. & Torres, R. (2016). The 2015 SIM IT issues and trends,
Management Information Systems Quarterly Executive, 15:1, 55-83
Kemerer, C. F., & Sosa, G. L. (1991). Systems development risks in strategic Information Systems.
Information and Software Technology, 33, 212-223.
Kim, J., & Mueller, C. W. (1978). Introduction to factor analysis: What it is and how to do it.
Beverly Hills, CA: Sage Publications.
Laudon, K. C., & Laudon, J. P. (1999). Essentials of management Information Systems:
Transforming business and management. Upper Saddle River, NJ: Prentice Hall.
Laudon, K. C., & Laudon, J. P. (2015). Management information systems: Managing the digital

Trends in Commercial-Off-the-Shelf V. K. Agrawal, V. K. Agrawal & A. R. Taylor
© International Information Management Association, Inc. 2016 33 ISSN: 1543-5962-Printed Copy ISSN: 1941-6679-On-line Copy
firm, 14th Edition. Upper Saddle River, NJ: Pearson Education Limited.
Lewin, S. G., Lewin, S. L., & Meisel, J. B. (1987). A dynamic analysis of the adoption of a new
technology: The case of optical scanners. Review of Economics and Statistics, 69, 12-17.
Li, M. F., & Ye, R. L. (1999). Information technology and firm performance: Linking with
environmental strategic and managerial contexts. Information and Management, 35, 43-
51.
Lucas, H. C. (2000). Information Technology for management, 7th ed. New York, NY: McGraw-
Hill, Inc.
Luftman, J., Derksen, B., Dwivedi, R., Santana, M., Zadeh, H. S., & Rigoni, E. (2015). Influential
IT management trends: An international study. Journal of Information Technology, 30,
293-305.
Markus, M. L., & Benjamin, R. I. (1996). Change agentry–The next IS frontier. MIS Quarterly,
December, 385-407.
Matheson, L. & Tarjan, R. (1998). Culturally induced information impactedness: A prescription
for failure in software ventures. Journal of Management Information Systems, 15.
McLean, E. R. (1979). End Users as Application Developers. MIS Quarterly, 3(4), 37.
doi:10.2307/249047.
McLean, E. R., Kappelman, L. A., & Thompson, J. P. (1993). Converging end-user computing
and corporate computing. Communications of the ACM, 36, 79-92.
McNurlin, B. (Ed) (1991). Trends in Information Technology. Chicago, IL: Anderson Consulting.
Naukam, D. (2014). Finance must adapt to cloud-based subscription models. Financial Executive,
Spring, 10-13.
Nidumolu, S. R., & Knotts, G. W. (1998). The effect of customizability and reusability on
perceived process and competitive performance of software firms. MIS Quarterly, 105-
137.
Nunnally, J. C. (1970). Introduction to psychological measurement. New York, NY: McGraw-
Hill.
Palvia, Prashant, & Wang, P. (1995). An expanded global information technology issues model:
An addition of newly industrialized countries. Journal of Information Technology
Management, VI, 29-39.
Porter, M. (1980). Competitive strategy. New York, NY: Free Press.

Journal of International Technology and Information Management Volume 25, Number 4 2016
© International Information Management Association, Inc. 2016 34 ISSN: 1543-5962-Printed Copy ISSN: 1941-6679-On-line Copy
Porter, M. E. (1996). What is a strategy? Harvard Business Review, November/December.
Rahman, W., & Kurien, P. (2007). Blind men and the elephant: demystifying the global IT services
industry. (pp. 136-137) Thousand Oaks, CA: SAGE Publications.
Morton, S. (1991). The corporation of the 1990s: Information Technology and organizational
transformation. Oxford University Press.
Srinivasan, S. (2013). IS security realistic in cloud computing? Journal of International
Technology and Information Management, Vol. 22, 47-66.
Sturdy, G. R. (2012). Customer relationship management using business intelligence. Newcastle
upon Tyne, UK: Cambridge Scholars Publishing.
Tabachnick, B. G., & Fidell, L. S. (2007). Using multivariate statistics. Boston, MA: Pearson
Education Inc.
Turban, E., McLean, E., & Whetherbe, J. (2001). Information Technology for management:
Making connections for strategic advantages, 2nd ed. New York, NY: John Wiley and
Sons, Inc.
Turban, E., & Volonino, L. (2011). Information technology for management: Improving the
strategic and operational performance, 8th edition. New York, NY: John Wiley and Sons,
Inc.
Turban, E., Volonino, L., & Wood, G. (2015). Information technology for management: Digital
strategies for insight, action, and sustainable performance, 10th edition. New York, NY:
John Wiley and Sons, Inc.
Turner, J., & Kambil, A. (1994). Outsourcing of information systems as a strategy for
organizational alignment and transformation. Unpublished Paper, Stern School, New York
University, NY.
Venkataraman, N., & Short, J. E. (1992). Baxter Healthcare: Evolution from ASAP to value link
in the hospital supplies marketplace. In Proceedings of the Twenty-fifth Annual Hawaii
International Conference on System Sciences, Vol.4,.666-677.
Venkatesh, V., & Davis, F. D. (1996). A model of the antecedents of perceived ease of use:
Development and test. Decision Sciences, 27, September, 451-481.
Wailgum, T. (October 2007). How Wal-Mart lost its technology edge. CIO. Retrieved from
http://www.cio.com/article/print/143451
Winter, S. J., Chudoba, K. M., & Gutek, B. A. (1997). Misplaced resources? Factors associated
with computer literacy among end-users. Information and Management, 32, 29-42.

Trends in Commercial-Off-the-Shelf V. K. Agrawal, V. K. Agrawal & A. R. Taylor
© International Information Management Association, Inc. 2016 35 ISSN: 1543-5962-Printed Copy ISSN: 1941-6679-On-line Copy
ABOUT THE AUTHOR
Vijay K. Agrawal
Department of Marketing and MIS
University of Nebraska at Kearney
West Center 250W, Kearney, NE 68849
Phone: (308) 865-1548, Fax: (308) 865-8387
Vipin K. Agrawal
Department of Finance, BB4.04.31
University of Texas at San Antonio
One UTSA Circle
San Antonio, TX 78249
Phone: 714-930-6948
Email: [email protected]
A. Ross Taylor
Department of Marketing and MIS
University of Nebraska at Kearney
West Center 262W, Kearney, NE 68849
Phone: (308) 865-8347, Fax: (308) 865-8387
Journal of International Technology and Information Management Volume 25, Number 4 2016
© International Information Management Association, Inc. 2016 36 ISSN: 1543-5962-Printed Copy ISSN: 1941-6679-On-line Copy
This Page Left Intentionally Blank