TRANSVERSE LOADING DISTRIBUTION RELATED … LOADING DISTRIBUTION RELATED TO MICRO-CRACKS ......
14
385 WOOD RESEARCH 61 (3): 2016 385-398 TRANSVERSE LOADING DISTRIBUTION RELATED TO MICRO-CRACKS EVOLUTION ON A TIMBER-CONCRETE SLAB Lukas Blesak, Kamila Cabova, Frantisek Wald Czech Technical University in Prague Department of Steel and Timber Structures Prague, Czech Republic Sandra R.S. Monteiro, Alfredo M.P.G. Dias University of Coimbra Department of Civil Engineering Coimbra, Portugal (Received January 2016) ABSTRACT Numerical simulation based on a non-linear material behaviour definition of concrete being a part of a coupled timber-concrete load-bearing system is presented in this paper. The main goal of a NL material modelling performed and introduced herein is to define the influence of concrete fragility over transverse loading distribution horizontally a locally loaded slab. The gained knowledge is consequently applied in a local fire exposure problem. Numerical simulations based on both linear elastic (LE) and non-linear (NL) material behaviour are compared with the results obtained from several real-size experiments and the effects of specific phenomena are discussed further. NL material definition of concrete is also termed as a “damaged material model” in certain references. This work is a continuation of the research performed at the Department of Civil Engineering, University of Coimbra, which’s result had been analysed and further published in paper (Dias et al. 2013) and doctoral thesis (Monteiro 2015). KEYWORDS: Crack evolution, fraction, concrete slab, glued laminated timber, transverse loading distribution.
Transcript of TRANSVERSE LOADING DISTRIBUTION RELATED … LOADING DISTRIBUTION RELATED TO MICRO-CRACKS ......
385
WOOD RESEARCH 61 (3): 2016 385-398
TRANSVERSE LOADING DISTRIBUTION RELATED TO
MICRO-CRACKS EVOLUTION ON A TIMBER-CONCRETE
SLAB
Lukas Blesak, Kamila Cabova, Frantisek WaldCzech Technical University in Prague
Department of Steel and Timber Structures Prague, Czech Republic
Sandra R.S. Monteiro, Alfredo M.P.G. DiasUniversity of Coimbra
Department of Civil EngineeringCoimbra, Portugal
(Received January 2016)
ABSTRACT
Numerical simulation based on a non-linear material behaviour definition of concrete being a part of a coupled timber-concrete load-bearing system is presented in this paper. The main goal of a NL material modelling performed and introduced herein is to define the influence of concrete fragility over transverse loading distribution horizontally a locally loaded slab. The gained knowledge is consequently applied in a local fire exposure problem.
Numerical simulations based on both linear elastic (LE) and non-linear (NL) material behaviour are compared with the results obtained from several real-size experiments and the effects of specific phenomena are discussed further. NL material definition of concrete is also termed as a “damaged material model” in certain references.
This work is a continuation of the research performed at the Department of Civil Engineering, University of Coimbra, which’s result had been analysed and further published in paper (Dias et al. 2013) and doctoral thesis (Monteiro 2015).
KEYWORDS: Crack evolution, fraction, concrete slab, glued laminated timber, transverse loading distribution.
386
WOOD RESEARCH
INTRODUCTION Coupled timber-concrete load-bearing systems have been applied it the civil engineering
practise for the last decades. These systems dispose of several advantages, such as lower deformations, higher load-carrying capacity, lower noise transmission, decrease in vibrations (Dias et al. 2013) and other. Deformation and distribution of a loading force applied over a coupled timber-concrete system is majorly influenced by its coupling system and stiffness properties of the used structural elements. Tangential and axial stiffness of coupling as a part of prefabricated, semi-prefabricated and systems casted in-situ is well known and described in the relevant standards (EN 1995-1-1 2006), other papers (Proksa 2013, Manaridis 2010) and many other. However, the phenomena of local loading distribution in the transverse direction – perpendicular to beams’ axis, has not been analysed to a sufficient extent yet and the references in this field of research can hardly be found.
This problem is naturally highly effected by concrete ant its NL behaviour. Concrete is neither homogeneous nor isotropic. Non-isotropic feature of concrete makes its compressive strength different from its tensile strength (Buyukozturk 2004), and so NL material models are preferably used more than LE models, see e.g. (Wang et al. 2012). However, its justness needs to be considered carefully.
Cracks can dramatically reduce the long-term durability performance of concrete, e.g. due to permitting increased fluid ingress (Hearn 1999), therefore preventing cracks from its initiation and a further evolution, for example by an application of permanent shuttering, using high strength concrete, e.g. fibre concrete, may increase durability of concrete slabs significantly.
In this paper, the phenomena of transverseloading distribution over a coupled timber-concrete load-bearing slab is analysed, numerical simulations being compared with the real-size experiment are introduced and consequent results are summarized and discussed further with focus on the micro-cracks evolution. A particular attention is paid to local phenomena, such as static friction resistance of shuttering/concrete contact underneath a loaded area, post-crack behaviour of concrete or cracked concrete resistance, localisation of micro-cracks initiation and their effect over the global thin concrete slab behaviour.
MATERIAL AND METHODS
ExperimentSeveral real-size experimental set-ups were considered to analyse the global behaviour of
a thin concrete slab coupled with overall five glued laminated timber beams focused on transverse loading distribution when the slab being loaded locally. To make the results and a further discussion clearer, only one experimental set-up is described below. Other details are to be found in (Monteiro 2015).
Concrete slab with thickness 50 mm (t) sized 3.39 x 3.48 m (L x B, L - dimension parallel to the beams’ axes) was coupled with overall 5 glued laminated beams GL 28 h, made of spruce – Picea abies, with cross-section 100 x 200 mm (b x h), placed 0.75 m from one another. Concrete slab was provided with a structural steel rebar mesh sized 100 x 100 mm (m x n), bar diameter equal to 5 mm (ϕ), placed in the middle all aver the ground plan area. Material properties of the timber beams and concrete mixture were tested experimentally and the proper values were applied in the further analysis. A layer of pine wood shuttering (PWS) with thickness 20 mm (tpws) was assembled between the concrete slab and timber beams. Coupling was ensured by applying studs

387
Vol. 61 (3): 2016
with diameter equal to 8 mm, placed vertically each 100 mm. The structure was fixed in the vertical direction and left free in both horizontal directions. Loading was applied locally through a steel plate dimensioned 200 x 200 x 40 mm in several places, right above a beam – in the middle or in a quarter of its span. Deflections and vertical reactions were being recorded during each experiment. A vertical force equal to 40 – 50 % of its ultimate value was applied over the tested assembly. The experimental set-up can be seen in Fig. 1. Beams are marked by No. 1 to 5 from one side to another.
Fig. 1: Real-size experiment set-up – slab “S0” – beams B1 to B5 left to right.
Numerical simulation Overall four loading scenarios were opted to be numerically simulated, two of them are
presented herein. Beams No. 2 and 3, loaded in the middle and in a quarter of span, respectively.
B2 1/2 – Beam No. 2 loaded in the middle of span, F = 49.9 kN (43 % of ultimate load)B2 1/4 – Beam No. 2 loaded in the quarter of span, F = 51.7 kN (40 % of ultimate load)
Software ATENA Science based on FEM was used for both LE and NL simulations. This software was chosen for its advanced definition of concrete post-crack behaviour, taking fracture energy Gf and other parameters definition into account (Červenka and Jendele 2014). Elementary input data applied in the numerical simulation is plotted in Fig. 2.
Fig. 2: Numerical model –scheme of timber-concrete connection area.
CCIsoShellBrick elements with 4 cross-section layers were used for a concrete slab simulation. Reinforcement layer with an appertaining cross-section area and material properties was placed in the middle of the concrete slab (Fig. 2). The same elements with 4 layers within a cross-section represented the PWS layer. 3D solid elements were considered for glued laminated timber structural parts. Computing requirements such as an element dimensions ratio, number of iteration points etc., together with the computing efficiency based mainly on the results precision

388
WOOD RESEARCH
and computing time, served as the defining factor for choosing the proper elements type. Modulus of elasticity (MOE) of glued laminated timber was defined experimentally by
testing each of the beams, respectively, and the appertaining values of MOE for each beam (12.7, 14.0, 13.4 MPa) were considered in the numerical simulation. As opposed to other studies, e.g. see (Hataj et al. 2015), timber was considered as an elastic material in this study. Material properties of concrete resulted from compression tests performed on the subjected concrete mixture were used in a default material model “SOLID Concrete Cementitious 2” and its definition. This material model was chosen for its most appropriate σ-ε function of concrete in both tension and compression (Červenka and Jendele 2014).
Two interlayers Ka and Kc were applied in the model (Fig. 2). Shear (tangential) stiffness of timber-concrete coupling was defined in a previous research following an experimental output data (Fig. 3).
Fig. 3: Shear stiffness of timber-concrete coupling. Fig. 4: Cross-section of coupled timber-concrete
slab.
An average value of tangential stiffness KTT.b was defined linearly (marked as “Simulation” in Fig. 3). As the timber-concrete coupling is modelled through two shear planes - “glued laminated timber + PWS” and “PWS + concrete”, the partial values of KTT.b (2 x KTT.a, Fig. 2) were defined as plotted in Eq.1.
(1)
where: F - the force acting over the connection, Δslip - slip movement, B - beam width, ms - distance between screws parallel to beam axis.
Normal stiffness (in the vertical direction - axis “z”) KNN.a = KNN.c ≈ ∞. Tangential stiffness KTT.c was assumed as being equal to 0. A plastic film with thickness
approx. 0.1 mm was placed between PWS and concrete slab in order to prevent any friction between the connected elements, see Fig. 4.
Material Material for timber elements was defined as LE in all the models, whilst a global MOE
was applied for each beam respectively; material for concrete was varied from LE to NL due reaching satisfactory convergence criteria. Particular input data for NL material model of concrete fo slab “S0”are as follows: Young’s modulus of elasticity E = 27.8 GPa, Poisson’s coefficient ν = 0.2, Tensile strength ft = 1.71 MPa, Compression strength fcm = -21.6 MPa, fck(cube) = -16 MPa,

389
Vol. 61 (3): 2016
Fracture energy Gf = 127 N.m-1, Onset of crushing = -3.59 MPa, Reduction of fc due to cracking = 0.8. Identical Young’s modulus of elasticity and Poisson’s coefficient were considered in the LE material model of concrete.
Exponential crack opening law was considered for tensile behaviour of the subjected concrete. The crack opening function was derived experimentally (Hearn 1999) and the fracture energy value is based on (Vos 1983). Material properties of concrete, particularly in tension, are of a crucial importance in this case.
For the experiment presented herein, biaxial stress state in a thin slab was taken into account. Based on (Buyukozturk 2004):
- biaxial stress state is affected by micro-cracking- when concrete is compressed in biaxial stress state:- compressive and tensile strength is higher than its uniaxial strength - tensile ductility is greater than that under uniaxial compression- elastic limit is shifted upResulting the facts listed above, material properties of concrete, based on a relevant standard,
may not represent the real behaviour of an analysed experiment. Failure modes depend on various stress combinations and possibly other local phenomena discussed in the following chapters.
RESULTS AND DISCUSSION
Primarily, the vertical reactions obtained from numerical simulations and the data gained experimentally were compared to one another. The results are depicted in Figs. 5 to 8. When evaluating the results, two numerical models were considered:
- “elastic” – material parameters of all the applied materials considered to be LE – defined by a relevant MOE and Poisson’s coefficient
- “Cem2” – timber material considered to be LE; concrete material considered to be NL (damaged material model)
- results marked as “exp.”– values measured experimentally
Reactions expressed in % in the following graphs represent a percentage contribution of a particular beam in the overall loading distribution to the vertical supporting system. Reactions on both beam ends were summed up and divided by the force acting over the structure. It should be noted, that LE material model was also performed neglecting the presence of PWS (Monteiro 2015) and similar results were obtained as when PWS was considered. As the ratio of slab bending stiffness and PWS bending stiffness was evaluated to approx. 1/40 → 2.5 %, contribution of PWS bending stiffness may be neglected in this case (concrete slab is 50 mm thick, PWS is 20 mm thick, Econcrete ≈ 3 x Epine.wood).
390
WOOD RESEARCH
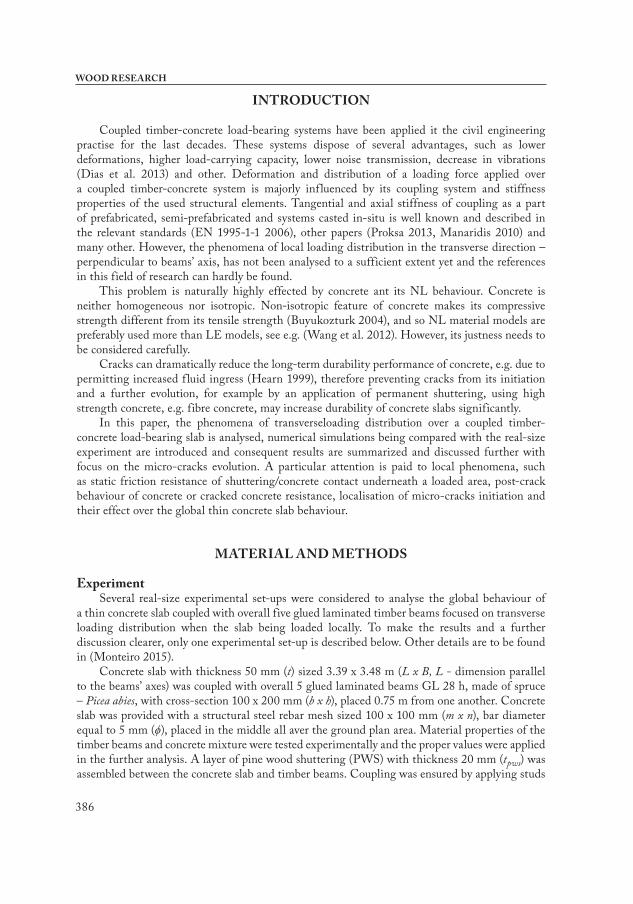
Fig. 5: Reactions distribution on beam No. 2 loaded in 1/2 of its span.
As can be seen in Fig. 5, contribution of the particular beams to the loading force distribution towards the vertical supports varies from the experimental results in case of NL concrete behaviour application. On the other hand, LE simulation shows results similar to the experimental ones. The bigger slab curvature is achieved, the bigger differences between the experimental and NL models were observed. The same phenomena was observed in case of all the loading scenarios.
Even NL material definition is generally considered to be more realistic, models with LE material definition gave results closer to the experimental ones in this case.
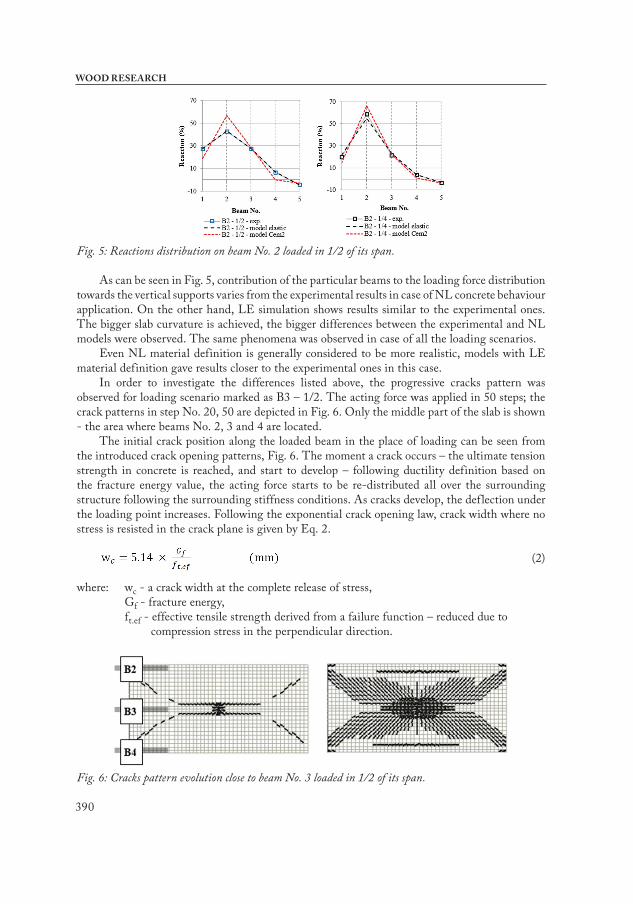
In order to investigate the differences listed above, the progressive cracks pattern was observed for loading scenario marked as B3 – 1/2. The acting force was applied in 50 steps; the crack patterns in step No. 20, 50 are depicted in Fig. 6. Only the middle part of the slab is shown - the area where beams No. 2, 3 and 4 are located.
The initial crack position along the loaded beam in the place of loading can be seen from the introduced crack opening patterns, Fig. 6. The moment a crack occurs – the ultimate tension strength in concrete is reached, and start to develop – following ductility definition based on the fracture energy value, the acting force starts to be re-distributed all over the surrounding structure following the surrounding stiffness conditions. As cracks develop, the deflection under the loading point increases. Following the exponential crack opening law, crack width where no stress is resisted in the crack plane is given by Eq. 2.
(2)
where: wc - a crack width at the complete release of stress, Gf - fracture energy, ft.ef - effective tensile strength derived from a failure function – reduced due to compression stress in the perpendicular direction.
Fig. 6: Cracks pattern evolution close to beam No. 3 loaded in 1/2 of its span.
391
Vol. 61 (3): 2016
The maximal width of cracks parallel to the beams’ axes was equal to 0.541 mm. Following Eq. 2, crack width at the complete release of stress was evaluated to 0.382 mm. Variety of stress values as well as their pattern can be seen in Fig. 7 (loading point is marked with “X”). In case of a LE material model, tensile stresses exceeded the ultimate tensile strength of concrete approx. 9 times. On the other hand, tensile stress in a NL material model did not exceed the ultimate tensile strength of concrete, whilst the maximum value 1.81 MPa was reached. Summarizing the results listed above, a question arises:
“Why does a linear elastic material model represent the reality very precisely when concrete is expected to crack and behave in a non-linear manner?”
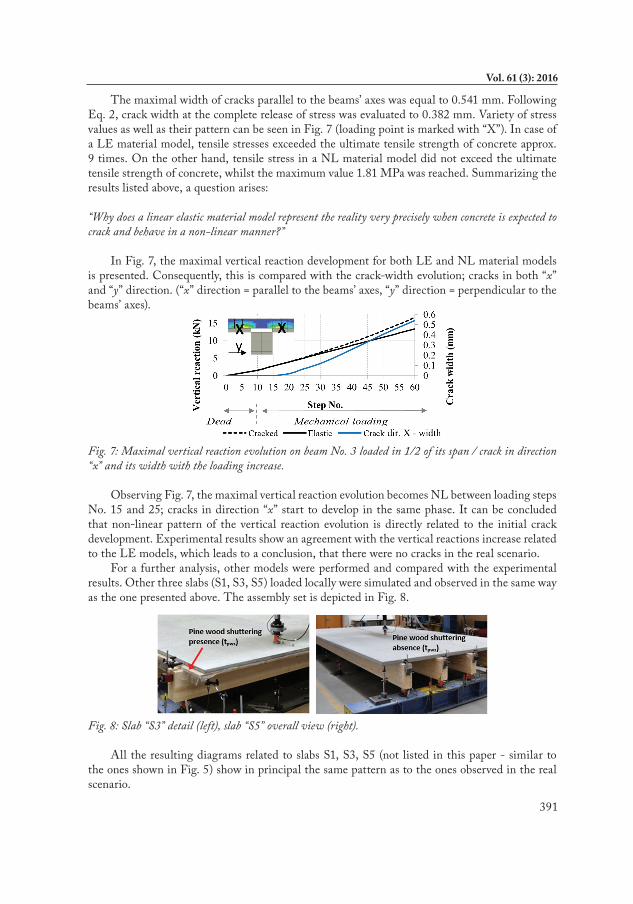
In Fig. 7, the maximal vertical reaction development for both LE and NL material models is presented. Consequently, this is compared with the crack-width evolution; cracks in both “x” and “y” direction. (“x” direction = parallel to the beams’ axes, “y” direction = perpendicular to the beams’ axes).
Fig. 7: Maximal vertical reaction evolution on beam No. 3 loaded in 1/2 of its span / crack in direction “x” and its width with the loading increase.
Observing Fig. 7, the maximal vertical reaction evolution becomes NL between loading steps No. 15 and 25; cracks in direction “x” start to develop in the same phase. It can be concluded that non-linear pattern of the vertical reaction evolution is directly related to the initial crack development. Experimental results show an agreement with the vertical reactions increase related to the LE models, which leads to a conclusion, that there were no cracks in the real scenario.
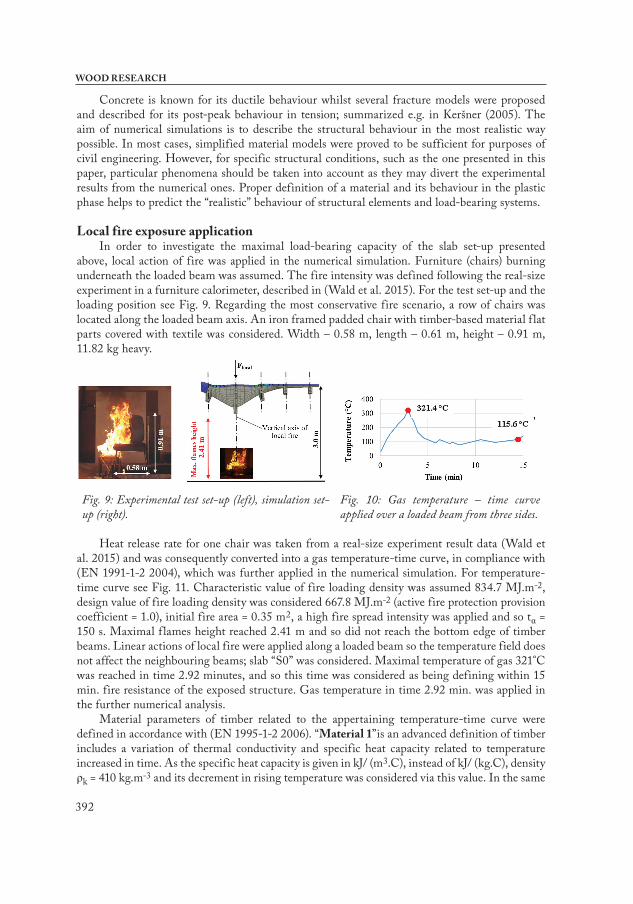
For a further analysis, other models were performed and compared with the experimental results. Other three slabs (S1, S3, S5) loaded locally were simulated and observed in the same way as the one presented above. The assembly set is depicted in Fig. 8.
Fig. 8: Slab “S3” detail (left), slab “S5” overall view (right).
All the resulting diagrams related to slabs S1, S3, S5 (not listed in this paper - similar to the ones shown in Fig. 5) show in principal the same pattern as to the ones observed in the real scenario.
392
WOOD RESEARCH
Concrete is known for its ductile behaviour whilst several fracture models were proposed and described for its post-peak behaviour in tension; summarized e.g. in Keršner (2005). The aim of numerical simulations is to describe the structural behaviour in the most realistic way possible. In most cases, simplified material models were proved to be sufficient for purposes of civil engineering. However, for specific structural conditions, such as the one presented in this paper, particular phenomena should be taken into account as they may divert the experimental results from the numerical ones. Proper definition of a material and its behaviour in the plastic phase helps to predict the “realistic” behaviour of structural elements and load-bearing systems.
Local fire exposure application In order to investigate the maximal load-bearing capacity of the slab set-up presented
above, local action of fire was applied in the numerical simulation. Furniture (chairs) burning underneath the loaded beam was assumed. The fire intensity was defined following the real-size experiment in a furniture calorimeter, described in (Wald et al. 2015). For the test set-up and the loading position see Fig. 9. Regarding the most conservative fire scenario, a row of chairs was located along the loaded beam axis. An iron framed padded chair with timber-based material f lat parts covered with textile was considered. Width – 0.58 m, length – 0.61 m, height – 0.91 m, 11.82 kg heavy.
Fig. 9: Experimental test set-up (left), simulation set-up (right).
Fig. 10: Gas temperature – time curve applied over a loaded beam from three sides.
Heat release rate for one chair was taken from a real-size experiment result data (Wald et al. 2015) and was consequently converted into a gas temperature-time curve, in compliance with (EN 1991-1-2 2004), which was further applied in the numerical simulation. For temperature-time curve see Fig. 11. Characteristic value of fire loading density was assumed 834.7 MJ.m-2, design value of fire loading density was considered 667.8 MJ.m-2 (active fire protection provision coefficient = 1.0), initial fire area = 0.35 m2, a high fire spread intensity was applied and so tα = 150 s. Maximal f lames height reached 2.41 m and so did not reach the bottom edge of timber beams. Linear actions of local fire were applied along a loaded beam so the temperature field does not affect the neighbouring beams; slab “S0” was considered. Maximal temperature of gas 321°C was reached in time 2.92 minutes, and so this time was considered as being defining within 15 min. fire resistance of the exposed structure. Gas temperature in time 2.92 min. was applied in the further numerical analysis.
Material parameters of timber related to the appertaining temperature-time curve were defined in accordance with (EN 1995-1-2 2006). “Material 1”is an advanced definition of timber includes a variation of thermal conductivity and specific heat capacity related to temperature increased in time. As the specific heat capacity is given in kJ/ (m3.C), instead of kJ/ (kg.C), density ρk = 410 kg.m-3 and its decrement in rising temperature was considered via this value. In the same
393
Vol. 61 (3): 2016
manner thermal conductivity was varied in rising temperature valued in compliance with (EN 1995-1-2 2006). In case of “Material 2”, constant values of specific heat capacity and thermal conductivity were assumed.
To define a charring rate of timber, an advanced material model described above using a 2D FEM simulation was performed and appropriate reduction of Young’s modulus of elasticity in time was applied. Reduction of cross-sectional stiffness properties of a timber member (thermal effects) was replaced by Young’s modulus of elasticity reduction in time.
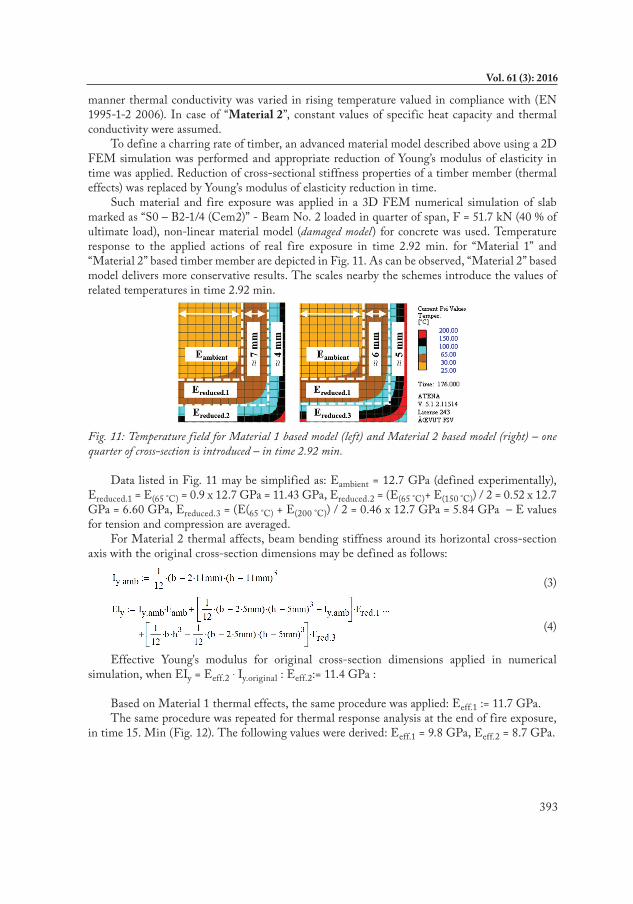
Such material and fire exposure was applied in a 3D FEM numerical simulation of slab marked as “S0 – B2-1/4 (Cem2)” - Beam No. 2 loaded in quarter of span, F = 51.7 kN (40 % of ultimate load), non-linear material model (damaged model) for concrete was used. Temperature response to the applied actions of real fire exposure in time 2.92 min. for “Material 1” and “Material 2” based timber member are depicted in Fig. 11. As can be observed, “Material 2” based model delivers more conservative results. The scales nearby the schemes introduce the values of related temperatures in time 2.92 min.
Fig. 11: Temperature field for Material 1 based model (left) and Material 2 based model (right) – one quarter of cross-section is introduced – in time 2.92 min.
Data listed in Fig. 11 may be simplified as: Eambient = 12.7 GPa (defined experimentally), Ereduced.1 = E(65 °C) = 0.9 x 12.7 GPa = 11.43 GPa, Ereduced.2 = (E(65 °C)+ E(150 °C)) / 2 = 0.52 x 12.7 GPa = 6.60 GPa, Ereduced.3 = (E(65 °C) + E(200 °C)) / 2 = 0.46 x 12.7 GPa = 5.84 GPa – E values for tension and compression are averaged.
For Material 2 thermal affects, beam bending stiffness around its horizontal cross-section axis with the original cross-section dimensions may be defined as follows:
(3)
(4)
Effective Young's modulus for original cross-section dimensions applied in numerical simulation, when EIy = Eeff.2 . Iy.original : Eeff.2:= 11.4 GPa :
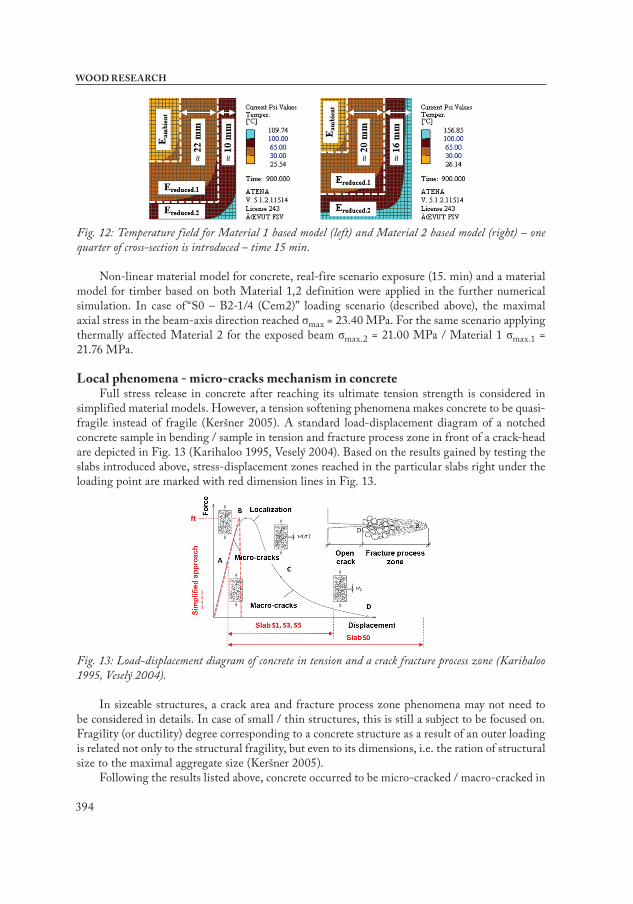
Based on Material 1 thermal effects, the same procedure was applied: Eeff.1 := 11.7 GPa.The same procedure was repeated for thermal response analysis at the end of fire exposure,
in time 15. Min (Fig. 12). The following values were derived: Eeff.1 = 9.8 GPa, Eeff.2 = 8.7 GPa.
394
WOOD RESEARCH
Fig. 12: Temperature field for Material 1 based model (left) and Material 2 based model (right) – one quarter of cross-section is introduced – time 15 min.
Non-linear material model for concrete, real-fire scenario exposure (15. min) and a material model for timber based on both Material 1,2 definition were applied in the further numerical simulation. In case of “S0 – B2-1/4 (Cem2)” loading scenario (described above), the maximal axial stress in the beam-axis direction reached σmax = 23.40 MPa. For the same scenario applying thermally affected Material 2 for the exposed beam σmax.2 = 21.00 MPa / Material 1 σmax.1 = 21.76 MPa.
Local phenomena - micro-cracks mechanism in concreteFull stress release in concrete after reaching its ultimate tension strength is considered in
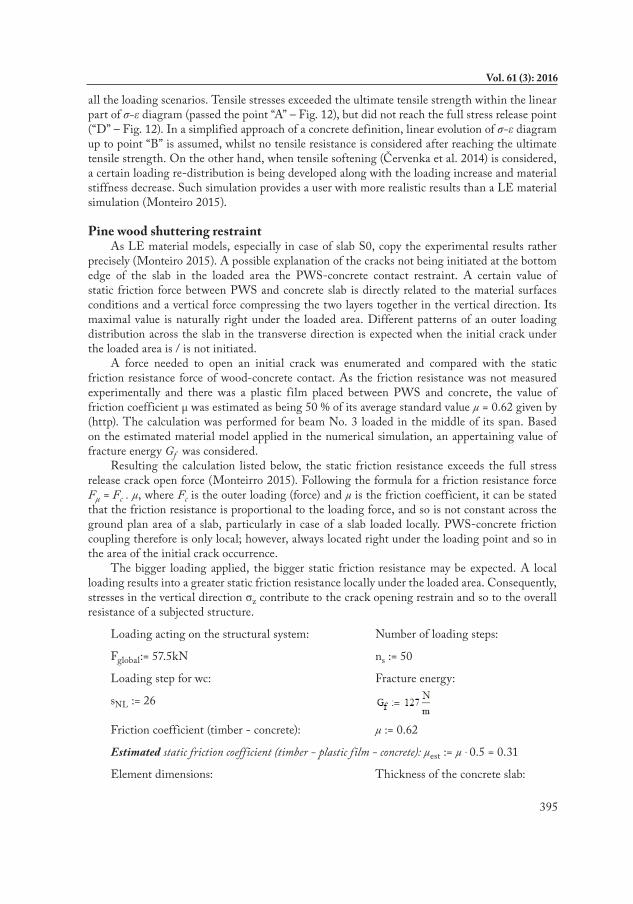
simplified material models. However, a tension softening phenomena makes concrete to be quasi-fragile instead of fragile (Keršner 2005). A standard load-displacement diagram of a notched concrete sample in bending / sample in tension and fracture process zone in front of a crack-head are depicted in Fig. 13 (Karihaloo 1995, Veselý 2004). Based on the results gained by testing the slabs introduced above, stress-displacement zones reached in the particular slabs right under the loading point are marked with red dimension lines in Fig. 13.
Fig. 13: Load-displacement diagram of concrete in tension and a crack fracture process zone (Karihaloo 1995, Veselý 2004).
In sizeable structures, a crack area and fracture process zone phenomena may not need to be considered in details. In case of small / thin structures, this is still a subject to be focused on. Fragility (or ductility) degree corresponding to a concrete structure as a result of an outer loading is related not only to the structural fragility, but even to its dimensions, i.e. the ration of structural size to the maximal aggregate size (Keršner 2005).
Following the results listed above, concrete occurred to be micro-cracked / macro-cracked in
395
Vol. 61 (3): 2016
all the loading scenarios. Tensile stresses exceeded the ultimate tensile strength within the linear part of σ-ε diagram (passed the point “A” – Fig. 12), but did not reach the full stress release point (“D” – Fig. 12). In a simplified approach of a concrete definition, linear evolution of σ-ε diagram up to point “B” is assumed, whilst no tensile resistance is considered after reaching the ultimate tensile strength. On the other hand, when tensile softening (Červenka et al. 2014) is considered, a certain loading re-distribution is being developed along with the loading increase and material stiffness decrease. Such simulation provides a user with more realistic results than a LE material simulation (Monteiro 2015).
Pine wood shuttering restraint As LE material models, especially in case of slab S0, copy the experimental results rather
precisely (Monteiro 2015). A possible explanation of the cracks not being initiated at the bottom edge of the slab in the loaded area the PWS-concrete contact restraint. A certain value of static friction force between PWS and concrete slab is directly related to the material surfaces conditions and a vertical force compressing the two layers together in the vertical direction. Its maximal value is naturally right under the loaded area. Different patterns of an outer loading distribution across the slab in the transverse direction is expected when the initial crack under the loaded area is / is not initiated.
A force needed to open an initial crack was enumerated and compared with the static friction resistance force of wood-concrete contact. As the friction resistance was not measured experimentally and there was a plastic film placed between PWS and concrete, the value of friction coefficient μ was estimated as being 50 % of its average standard value μ = 0.62 given by (http). The calculation was performed for beam No. 3 loaded in the middle of its span. Based on the estimated material model applied in the numerical simulation, an appertaining value of fracture energy Gf was considered.
Resulting the calculation listed below, the static friction resistance exceeds the full stress release crack open force (Monteirro 2015). Following the formula for a friction resistance force Fμ = Fc . μ, where Fc is the outer loading (force) and μ is the friction coefficient, it can be stated that the friction resistance is proportional to the loading force, and so is not constant across the ground plan area of a slab, particularly in case of a slab loaded locally. PWS-concrete friction coupling therefore is only local; however, always located right under the loading point and so in the area of the initial crack occurrence.
The bigger loading applied, the bigger static friction resistance may be expected. A local loading results into a greater static friction resistance locally under the loaded area. Consequently, stresses in the vertical direction σz contribute to the crack opening restrain and so to the overall resistance of a subjected structure.
Loading acting on the structural system: Number of loading steps:
Fglobal:= 57.5kN ns := 50
Loading step for wc: Fracture energy:
sNL := 26
Friction coefficient (timber - concrete): μ := 0.62
Estimated static friction coefficient (timber - plastic film - concrete): μest := μ . 0.5 = 0.31
Element dimensions: Thickness of the concrete slab:

396
WOOD RESEARCH
Le := 70mm Be := 70mm t := 50mm
Approximate height of the crack: Tension strength of concrete:
ft := 1.71 MPa
Crack area:Ac := Be . hc = 4.375 x 10⁻⁴ . m2
Full stress release crack width: (assumed ft.ef = ft ) Force necessary to open the crack to width wc:
Loading distribution through steel plate Asp := (200 mm)2
200 x 200 mm: Vertical force acting over the cracked element: Static friction resistance force: Summary: Full stress release crack open force Fwc = 748N Static friction resistance force Fμ = 1135N
CONCLUSIONS
All the assumptions, estimated values of coefficients or material properties were carefully opted in order to strictly copy the experimental results, as the experimental results are considered to be the “only true” outputs. In order to quantify the assumptions listed above, a further experimental study in this field is required.
Following the knowledge presented in this paper, the following conclusions have been drawn: - pine wood shuttering and its contribution in cracks restraint may be considered, especially
in case of structures loaded locally - when stress-release crack width is not achieved, application of a linear elastic material model
of concrete represents the real structural behaviour within an acceptable range of error - non-linear material properties of concrete given by the relevant standards further applied in
a numerical simulation, may not describe its real behaviour accurately in case of thin slabs loaded locally due to local defects, tri-axial stress state, non-homogeneity in aggregate size, local loading concentration etc.; permanent shuttering application may prevent the local
397
Vol. 61 (3): 2016
defects and stabilize unpredictable cracks pattern occurrence- application of homogenous aggregate size with maximal gravel-fraction size related to a slab
thickness may prevent local defects and so increase the global structural resistance - initial crack evolution under the loaded area influences a further crack pattern evolution and
so the global loading distribution across the slab in the horizontal direction- application of high ductility concretes, e.g. fibre concrete, is an effective solution for thin
concrete slabs - considering thermal and mechanical response, a simplified material model for timber given
by an appertaining standard results into conservative results comparing to an advanced material model given by the appertaining standard with difference from 3 to 10 % in an exposed beam’s stiffness – the absolute value of variation is not constant in time.
ACKNOWLEDGMENTS
The work presented in this paper is supported by the project of Grant Agency Czech Republic Coupled model of structural standard fire test, GACR 16-18448S.
REFERENCES
1. Buyukozturk, O., 2004: 1.054/1.541 Mechanics and design of concrete structures (3-0-9), Outline 2 micro-cracking of concrete / Behaviour under multiaxial loading, Massachusetts Institute of Technology. Pp 6-7.
2. Červenka, J., Jendele, L., 2014: ATENA Program documentation. Part 6: Atena Input File Format, Červenka Consulting Ltd, 301 pp.
3. Červenka, V., Jendele, L., Červenka, J., 2014: ATENA Program documentation. Part 1. Theory, Červenka Consulting Ltd, 304 pp.
4. Dias, A.M.P.G., Monteiro, S.R.S., Martins, C.E.J., 2013: Reinforcement of timber f loors - transversal load distribution on timber-concrete systems. Advanced Materials Research 778: 657-664.
5. EN 1995-1-1, 2006: Design of timber structures, Part 1-1: General. Common rules and rules for buildings.
6. EN 1991-1-2, 2004: Actions on structures – Part 1-2: General actions – Actions on structures exposed to fire.
7. EN 1995-1-2, 2006: Design of timber structures – Part 1-2: General – Structural fire design.
8. Hataj, M., Vídeňský, J., Kuklík, P., 2015: New method of timber element joining exposed to embedment perpendicular to grain. In: Proceedings of the International Conference SHATIS 15. Wroclaw: Wroclaw University of Technology. Pp 907-913, ISSN 0860-2395. ISBN 978-83-7125-255-6.
9. Hearn, H., 1999: Effect of shrinkage and load-induced cracking on water permeability of concrete. ACI material Journal 96(2): 234-240.
10. http://www.engineershandbook.com/Tables/frictioncoefficients.htm11. Karihaloo, B.L., 1995: Fracture mechanics of concrete. Longman Scientific & Technical,
New York.
398
WOOD RESEARCH
12. Keršner, Z., 2005: Brittleness and fracture mechanics of cement-based composites. Habilitation thesis – abridged version, Brno. Pp 7-10.
13. Manaridis, A., 2010: Evaluation of timber-concrete composite f loors. Report TVBK – 5187, Lund University. Pp 17-30.
14. Monteiro, S.R.S., 2015: Load distribution on timber-concrete composite f loors. Doctoral thesis, University of Coimbra, Portugal. Pp 57-96.
15. Proksa, D., 2013: Coupling optimization of coupled timber-concrete structures. Doctoral thesis, Slovak University of Technology in Bratislava, Slovak Republic. Pp 31-45.
16. Veselý, V., 2004: Parameters of concrete for description of fracture behaviour. Doctoral thesis - abridged version, University of Technology in Brno, Czech Republic. Pp 7-14.
17. Vos, E., 1983: Influence of loading rate and radial pressure on bond in reinforced concrete. Doctoral thesis, Delft University of Technology, Netherlands. Pp 219-220.
18. Wang, Y.C., Burgess, I., Wald, F., Gillie, M., 2012: Performance-based fire engineering of structures. Boca Raton: CRC Press. New York. Pp 221-231.
Lukas Blesak, Kamila Cabova, Frantisek WaldCzech Technical University in Prague
Department of Steel and Timber StructuresPrague, Czech Republic
Corresponding author: [email protected] [email protected]
Sandra R.S. Monteiro, Alfredo M.P.G. DiasUniversity of Coimbra
Department of Civil EngineeringCoimbra, Portugal