MftiFtitSttManufacturing Footprint Strategy · design production distribution and related services...
25
M f t i F t i tSt t Manufacturing Footprint Strategy Making the Right Things in the Right Places MANUFACTURING FOOTPRINT STRATEGY Making the Right Things in the Right Places IfM Briefing Day Tuesday 15 May 2012 Paul Christodoulou Principal Industrial Fellow [email protected] Don Fleet Principal Industrial Fellow [email protected] © Copyright Institute for Manufacturing 1
Transcript of MftiFtitSttManufacturing Footprint Strategy · design production distribution and related services...
M f t i F t i t St tManufacturing Footprint StrategyMaking the Right Things in the Right Places
MANUFACTURING FOOTPRINT STRATEGYMaking the Right Things in the Right Places
IfM Briefing DayTuesday 15 May 2012
Paul ChristodoulouPrincipal Industrial [email protected] y
Don FleetPrincipal Industrial [email protected]
© Copyright Institute for Manufacturing 1

AIMS & AGENDA
1. Why lean, offshoring & outsourcing are not enough
2. What leading companies are doing
3. A structured approach
4. Summary & questions
© Copyright Institute for Manufacturing 2
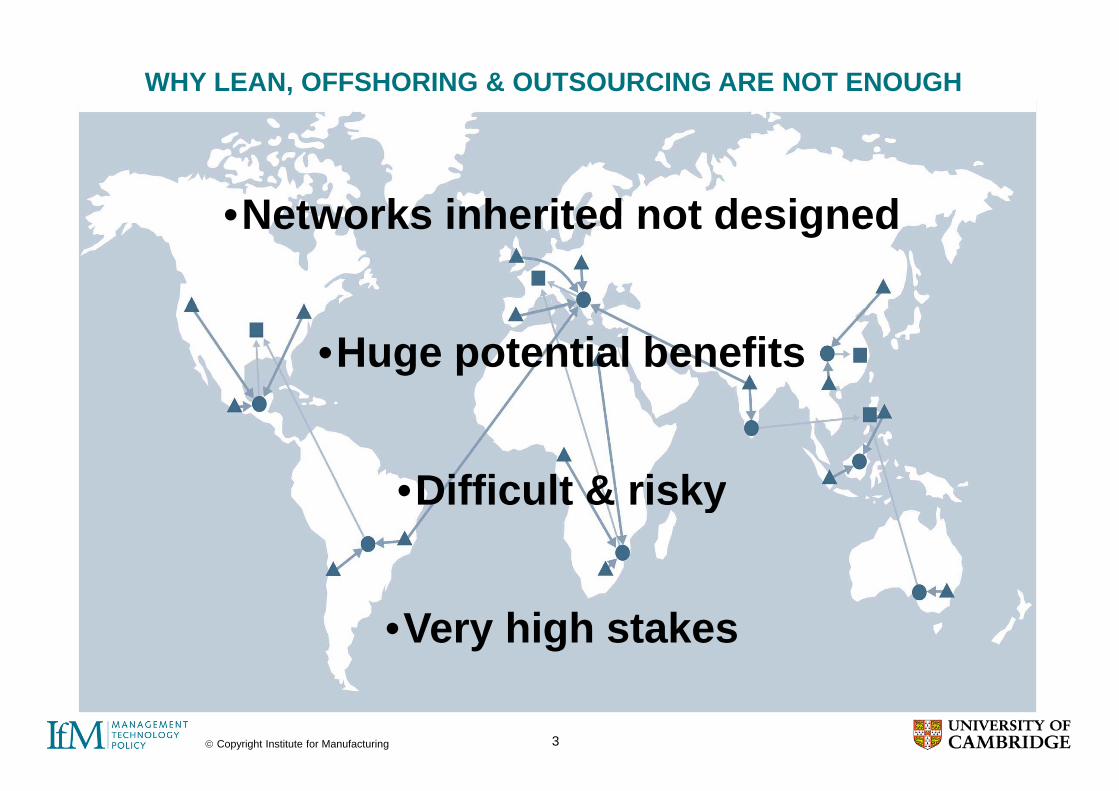
WHY LEAN, OFFSHORING & OUTSOURCING ARE NOT ENOUGH
•Networks inherited not designed•Networks inherited not designed
•Huge potential benefits
•Difficult & risky•Difficult & risky
•Very high stakes
© Copyright Institute for Manufacturing 3
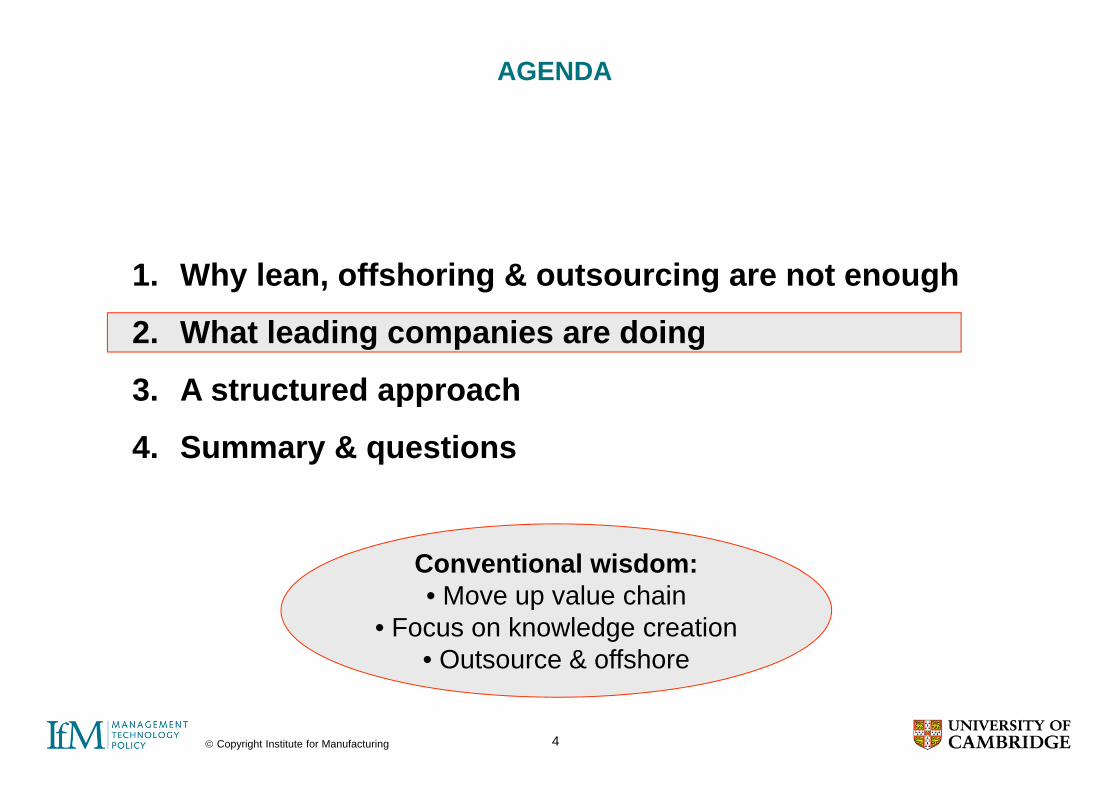
AGENDA
1. Why lean, offshoring & outsourcing are not enough
2. What leading companies are doing
3 A structured approach3. A structured approach
4. Summary & questions
Conventional wisdom:• Move up value chain
• Focus on knowledge creation• Outsource & offshore
© Copyright Institute for Manufacturing 4
Outsource & offshore

DEFINING MANUFACTURING AS A BROADER VALUE CHAIN
“The full cycle from understanding markets through product
design production distribution and related services within andesign, production, distribution and related services within an
economic and social context”
ServiceDistributionProductionDesignResearch ServiceDistributionProductionDesignResearch
This makes it possible to be in manufacturing without owning a factory!
© Copyright Institute for Manufacturing 5
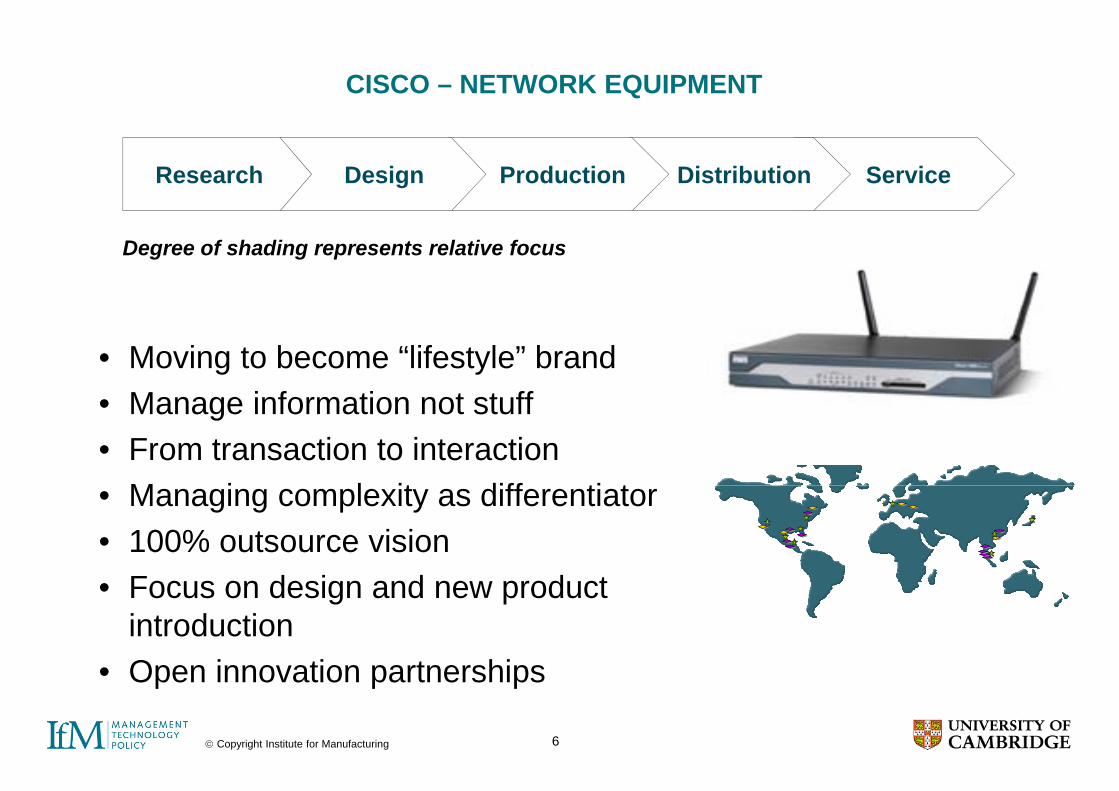
CISCO – NETWORK EQUIPMENT
ServiceDistributionProductionDesignResearch
Degree of shading represents relative focus
• Moving to become “lifestyle” brandM i f ti t t ff• Manage information not stuff
• From transaction to interactionM i l it diff ti t• Managing complexity as differentiator
• 100% outsource visionF d i d d• Focus on design and new product introductionO i ti t hi
© Copyright Institute for Manufacturing 6
• Open innovation partnerships
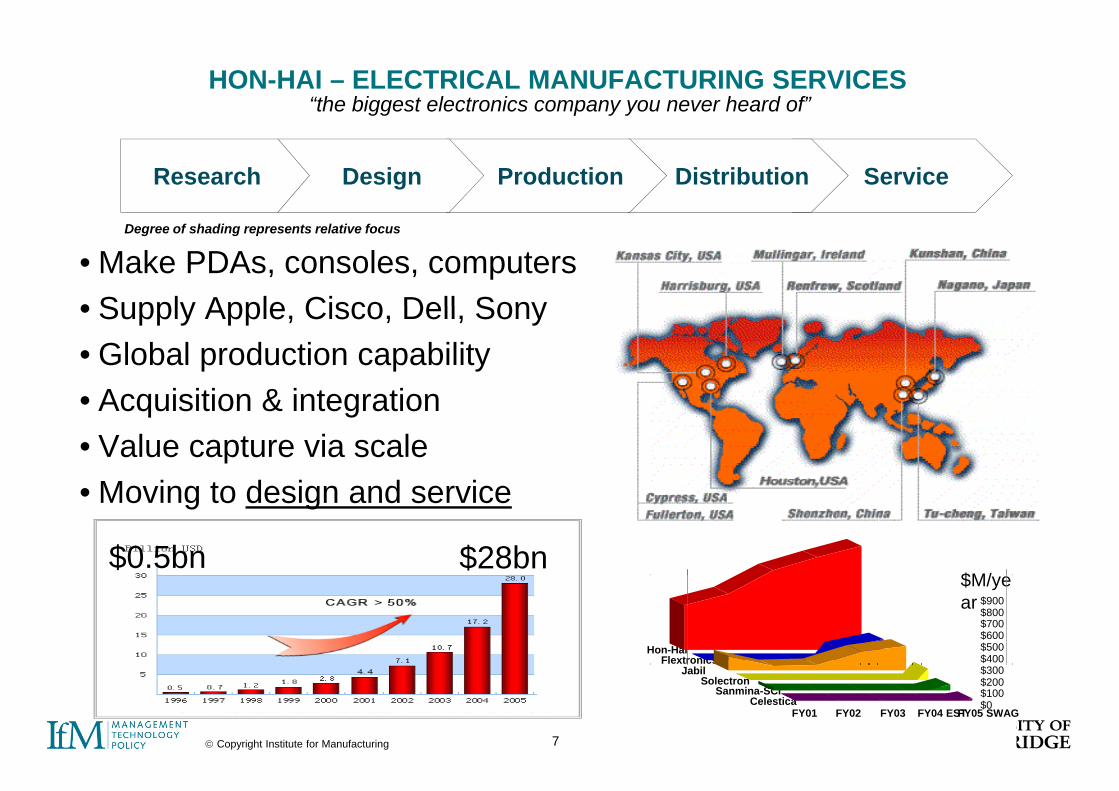
HON-HAI – ELECTRICAL MANUFACTURING SERVICES“the biggest electronics company you never heard of”
ServiceDistributionProductionDesignResearch
• Make PDAs, consoles, computers• Supply Apple Cisco Dell Sony
Degree of shading represents relative focus
• Supply Apple, Cisco, Dell, Sony• Global production capability
Acquisition & integration• Acquisition & integration• Value capture via scale
M i t d i d i• Moving to design and service
$2,000
$M/$0.5bn $28bn
-$2,000
-$1,000
$0
$1,000
Hon-Hai Flextronics Jabil Solectron Sanmina-SCI Celestica
Hon-HaiFlextronics $400
$500$600$700$800$900
$M/year
© Copyright Institute for Manufacturing 7
-$4,000
-$3,000
$ ,Jabil
SolectronSanmina-SCI
Celestica $0$100$200$300
FY01 FY02 FY03 FY04 ESTFY05 SWAG
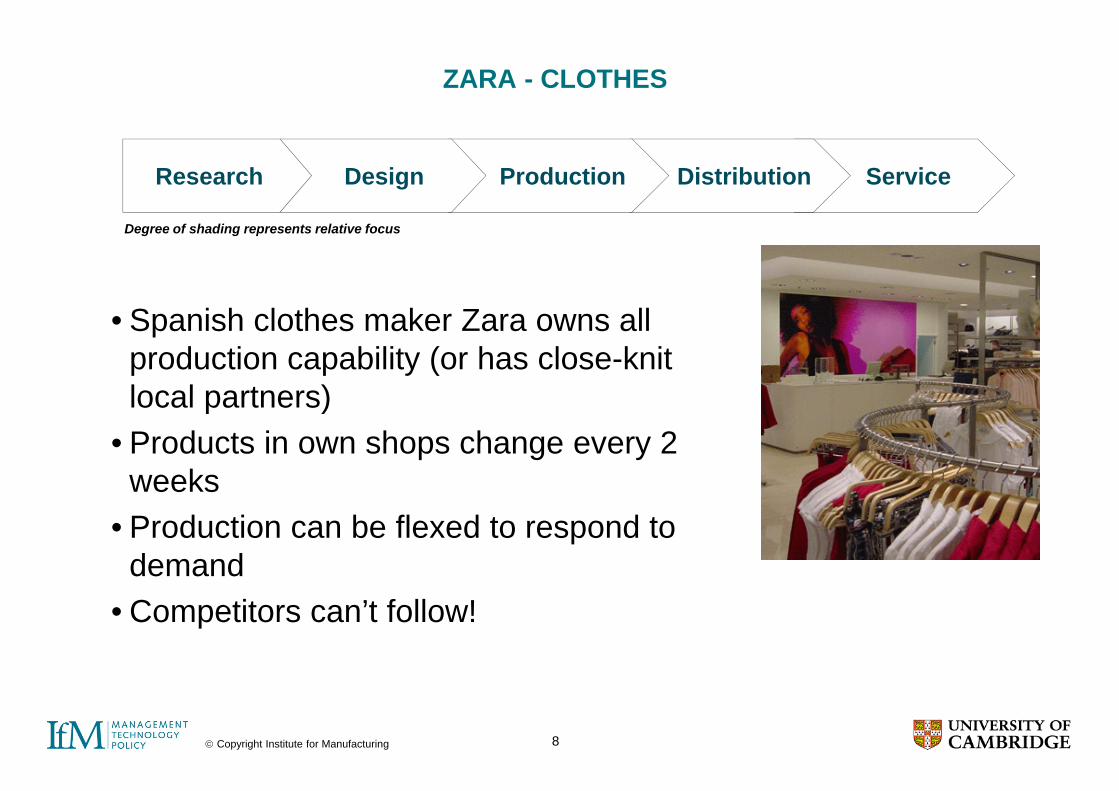
ZARA - CLOTHES
ServiceDistributionProductionDesignResearch
Degree of shading represents relative focus
• Spanish clothes maker Zara owns all production capability (or has close-knit local partners)local partners)
• Products in own shops change every 2 weeksweeks
• Production can be flexed to respond to demanddemand
• Competitors can’t follow!
© Copyright Institute for Manufacturing 8
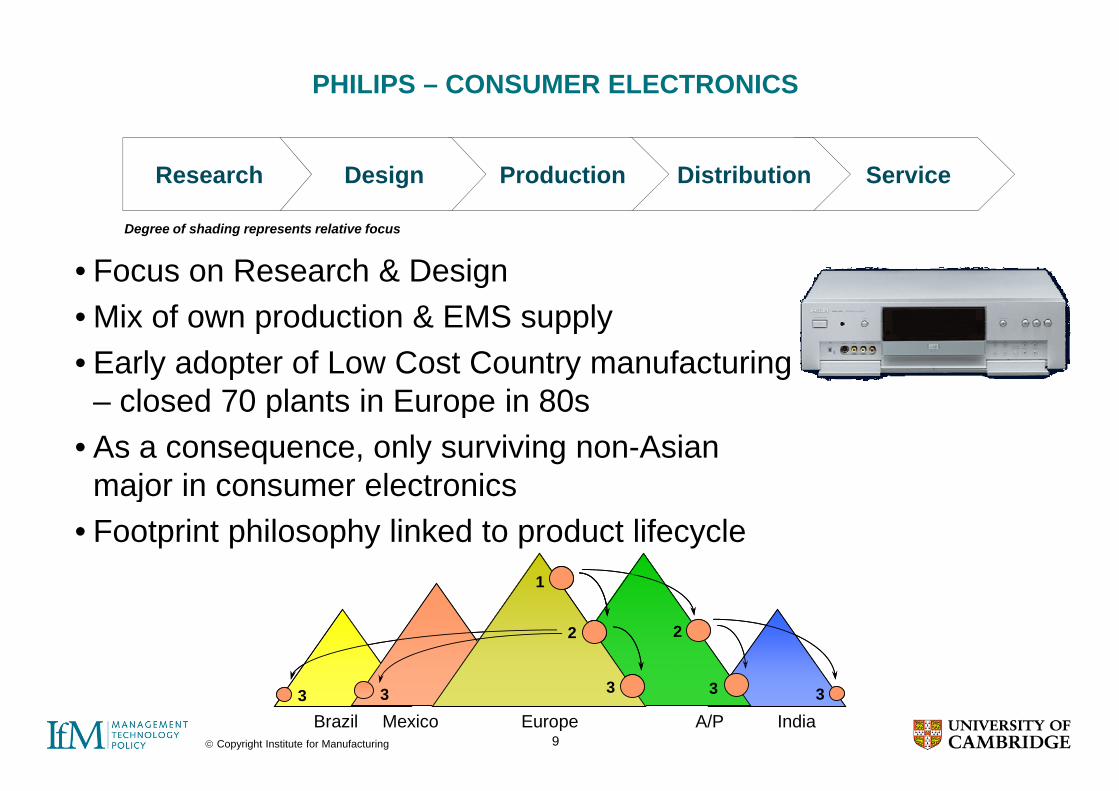
PHILIPS – CONSUMER ELECTRONICS
ServiceDistributionProductionDesignResearch
Degree of shading represents relative focus
• Focus on Research & DesignMi f d ti & EMS l• Mix of own production & EMS supply
• Early adopter of Low Cost Country manufacturing closed 70 plants in Europe in 80s– closed 70 plants in Europe in 80s
• As a consequence, only surviving non-Asian major in consumer electronicsmajor in consumer electronics
• Footprint philosophy linked to product lifecycle1
2 2
1
2 2
© Copyright Institute for Manufacturing 9Brazil Mexico Europe A/P India
33 3 3 333 3 3 3
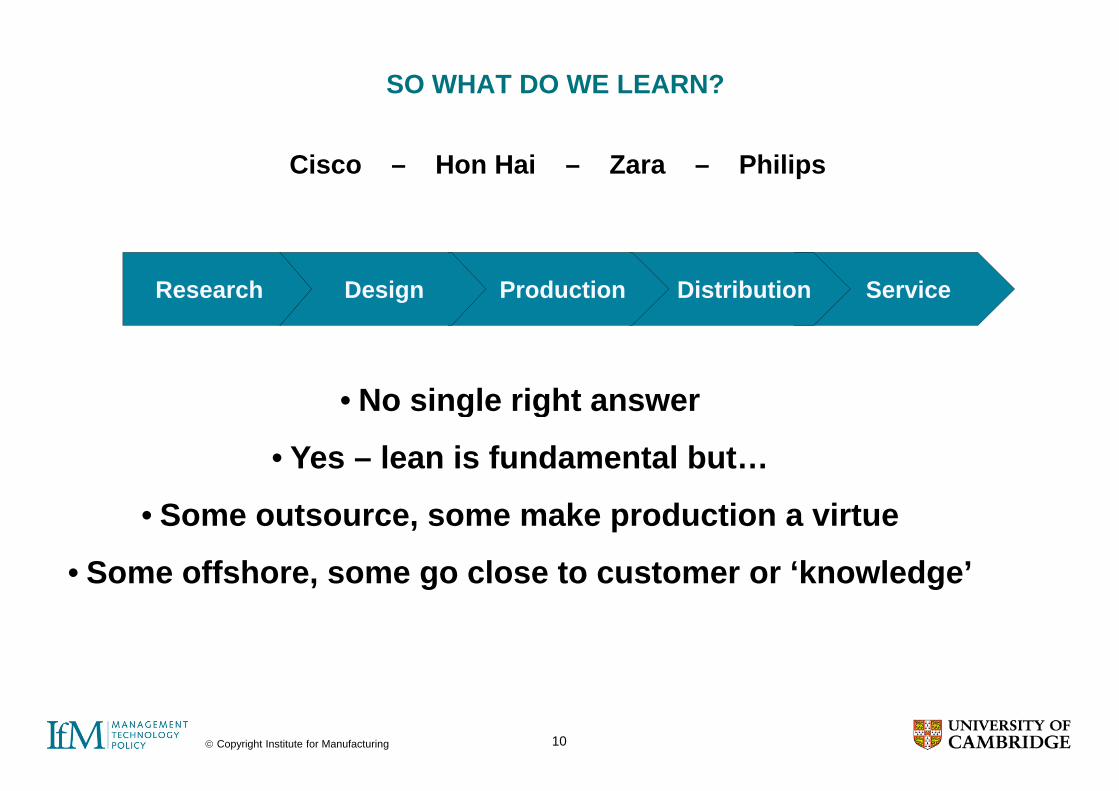
SO WHAT DO WE LEARN?
Cisco – Hon Hai – Zara – Philips
ServiceDistributionProductionDesignResearch
No single right answer• No single right answer
• Yes – lean is fundamental but…
• Some outsource, some make production a virtue
• Some offshore some go close to customer or ‘knowledge’• Some offshore, some go close to customer or knowledge
© Copyright Institute for Manufacturing 10
AGENDA
No single right answer but…
We think there is a good way to approach this
1. Why lean, offshoring & outsourcing are not enough
2. What leading companies are doing
3 A structured approach3. A structured approach
4. Summary & questions
© Copyright Institute for Manufacturing 11
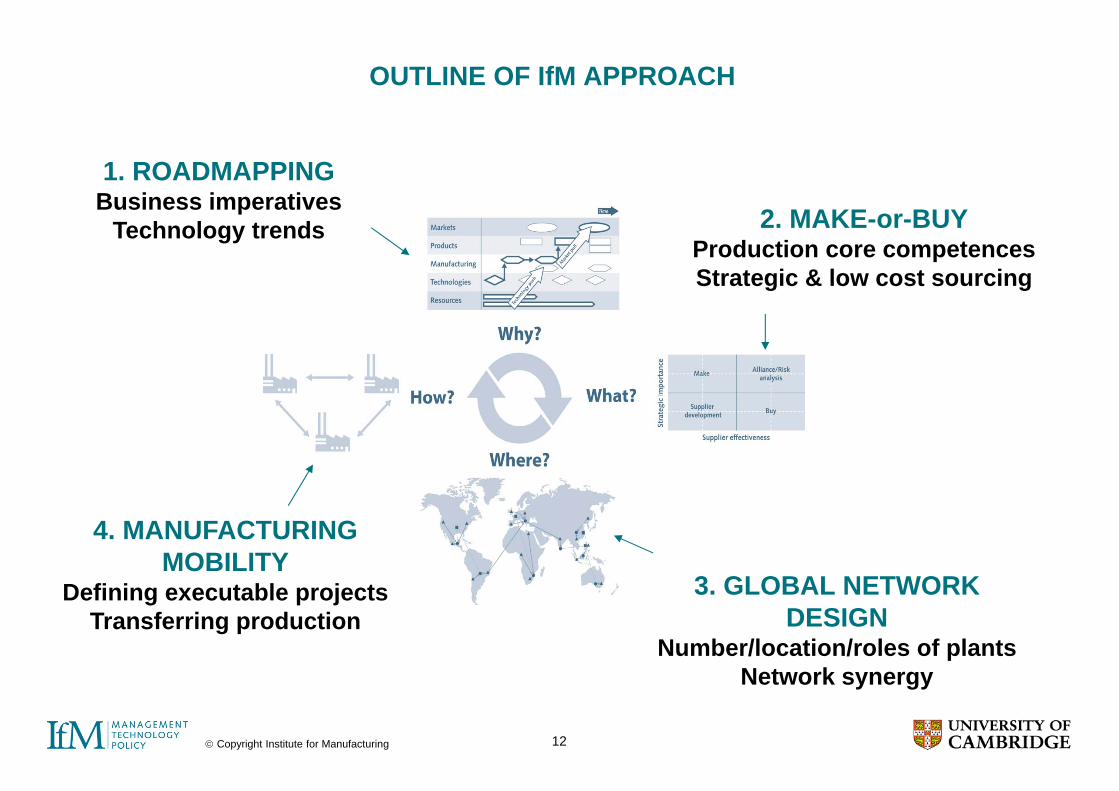
OUTLINE OF IfM APPROACH
1. ROADMAPPING Business imperatives 2 MAKE or BUYTechnology trends 2. MAKE-or-BUY
Production core competencesStrategic & low cost sourcing
4. MANUFACTURING MOBILITY
3. GLOBAL NETWORK DESIGN
Number/location/roles of plants
Defining executable projectsTransferring production
© Copyright Institute for Manufacturing 12
Network synergy
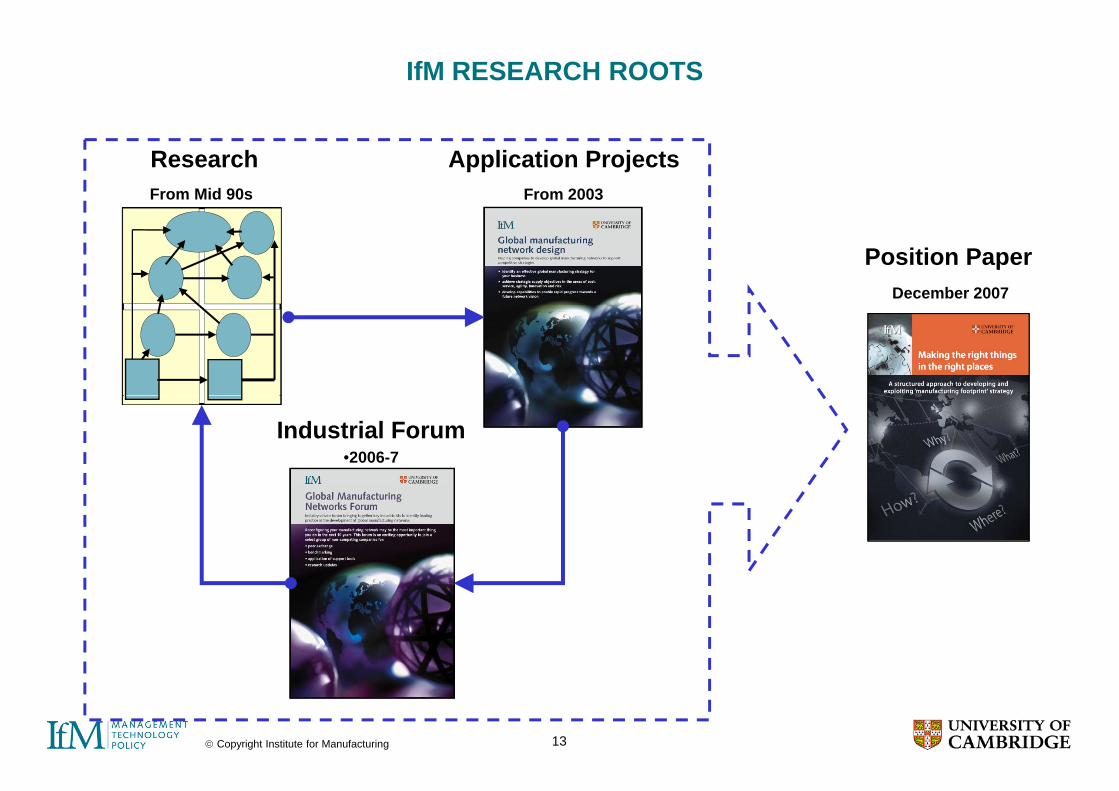
IfM RESEARCH ROOTS
Application ProjectsFrom 2003
ResearchFrom Mid 90s
Position PaperDecember 2007
Industrial Forum•2006-7
© Copyright Institute for Manufacturing 13

SUMMARY OF APPLICATIONS
Large Vehicles
Film Products
Food Equipment
Transport Services
Speciality Chemicals
Hydraulic Pumps
Electrical Devices FMCG Plastic
Products Petrochem Aerospace Plastic Toys
$40bn 110 $4bn 50 $1bn 12 £2bn 17 $2bn 21 $3bn 14 $15bn 200 $5bn 20 $1 5bn 45 $10bn 60 $16bn 40 $2bn 12Scale $40bn, 110 plants
$4bn, 50 plants
$1bn, 12 plants
£2bn, 17 plants
$2bn, 21 plants
$3bn, 14 plants
$15bn, 200 plants
$5bn, 20 plants
$1.5bn, 45 plants
$10bn, 60 plants
$16bn, 40 plants
$2bn, 12 plants
Outcome10 year
evolutionary strategy
5 year aggressive
realign-
2 year turnaround
plan
5 year strategy
5 year consolidation / pre-merger
Staged evolutionary
strategy
Footprint design model
Continuous strategy process
5 year re-configuration
plan
Ideal future network
Impact of new process technologies
Revised vision
following strategy ment plan plan strategy process plan technologies turnaround
Hard benefits
Significant cost savings
$50-60m pa declared cost
savings
Business survival
20% cost saving
Significant cost savings
Access to growth
markets
Significant cost
savings
Enablement of global
expansion
Significant cost
savings
Fundamental shift in
network approach
In process In process
pp
Soft benefits
New processes across 30
SBUs
120 top managers
aligned with change
Minimised business disruption
M&A integration framework
Refocusing of core
business
Trained trainers for staged roll-
out
Post M&A optimisation
Pre-empt need for periodic
restructuring
Consensus across
complex organisation
Distillation of key drivers In process In process
12 very different companies
© Copyright Institute for Manufacturing 14

Overview Benefits
CATERPILLAR CASE STUDY
Overview• $40bn sales, 100+ plants worldwide• 24 month strategy co-development• Implemented across 30 SBUs in
l i ti
Benefits• New process & common language to
engage the senior team• Broke the default approach of reinvesting
i th t tcomplex organisation• Evolution towards 10 year vision
in the status quo• Framework to guide ongoing investment
Strategy process developmentStrategy process development
Pilot implementations
E b d i l t t
Roll-out by SBU
C t ti i
2004 2005 2006 20072003 2008
Embed in annual strategy process
2009
Cost optimiser
© Copyright Institute for Manufacturing 15

SEALED AIR CASE STUDY
Overview• $4bn sales, 50+ plants worldwide• 18 month strategy co-development• 120 senior managers involved
Benefits• Reinvestment in process technology
leadership• Leading positions in emerging markets• 120 senior managers involved
• Phase 1 now complete• Leading positions in emerging markets• $55m declared cost savings so far
Strategy development
Phase 1 implementation
Strategy review
2005 2006 2007 20082004 2009
Phase 2 implementation
2010
Strategy UpdateWe remain committed to our
Strategy Announcement July 2006• step change in costs
• access to emerging marketsStrategy Update
Latest financial evaluation:growth strategies, which
capitalize on our strong global footprint.
Press Release July 2008
g g• reinvestment in process technology
leadershipRights issue required to fund $250m
Target annual savings $50m
a es a c a e a ua o• investment will total $200m
• savings of $45m in 2009, increasing to $55m in 2010.
Press Release January 2008
© Copyright Institute for Manufacturing 16
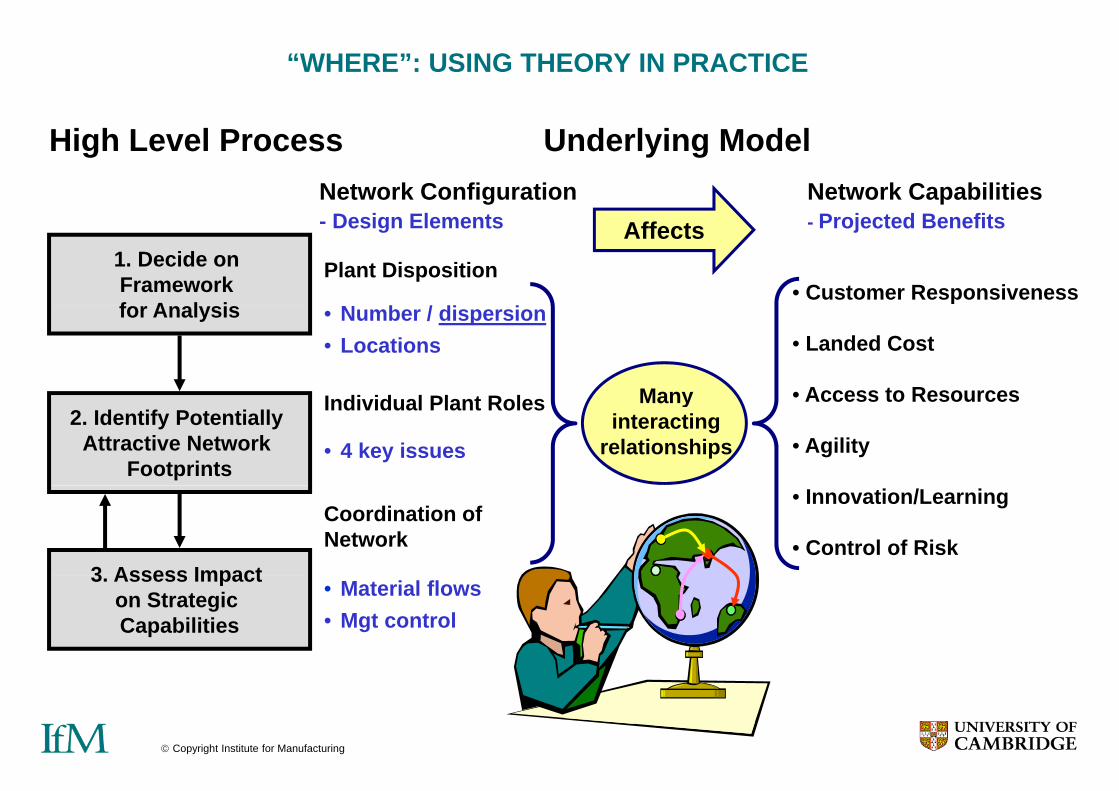
“WHERE”: USING THEORY IN PRACTICE
Network ConfigurationD i El t
Network CapabilitiesP j t d B fit
High Level Process Underlying Model
Plant Disposition
N b / di i
- Design Elements - Projected Benefits
• Customer Responsiveness
Affects1. Decide on Framework f A l i
I di id l Pl t R l
• Number / dispersion• Locations • Landed Cost
• Access to ResourcesMany
for Analysis
• 4 key issues
Individual Plant Roles • Access to Resources
• Agility
Many interacting
relationships2. Identify Potentially
Attractive Network Footprints
Coordination ofNetwork
• Innovation/Learning
• Control of Risk3 Assess Impact • Material flows
• Mgt control
3. Assess Impact on Strategic Capabilities
© Copyright Institute for Manufacturing 17

USA2
USA1 WHERE: NETWORK DESIGN Example Before Optimisation
Iowa Park
USA4
USA3
USA7USA6 USA5
VenezuelaMexico
Russia
France
GermanyUK
Hungary
Poland
Venezuela
Colombia
Spain
Italy
Brazil
ArgentinaChile
S Africa
JapanKorea
China
© Copyright Institute for Manufacturing 18N Zealand
AustraliaMalaysia
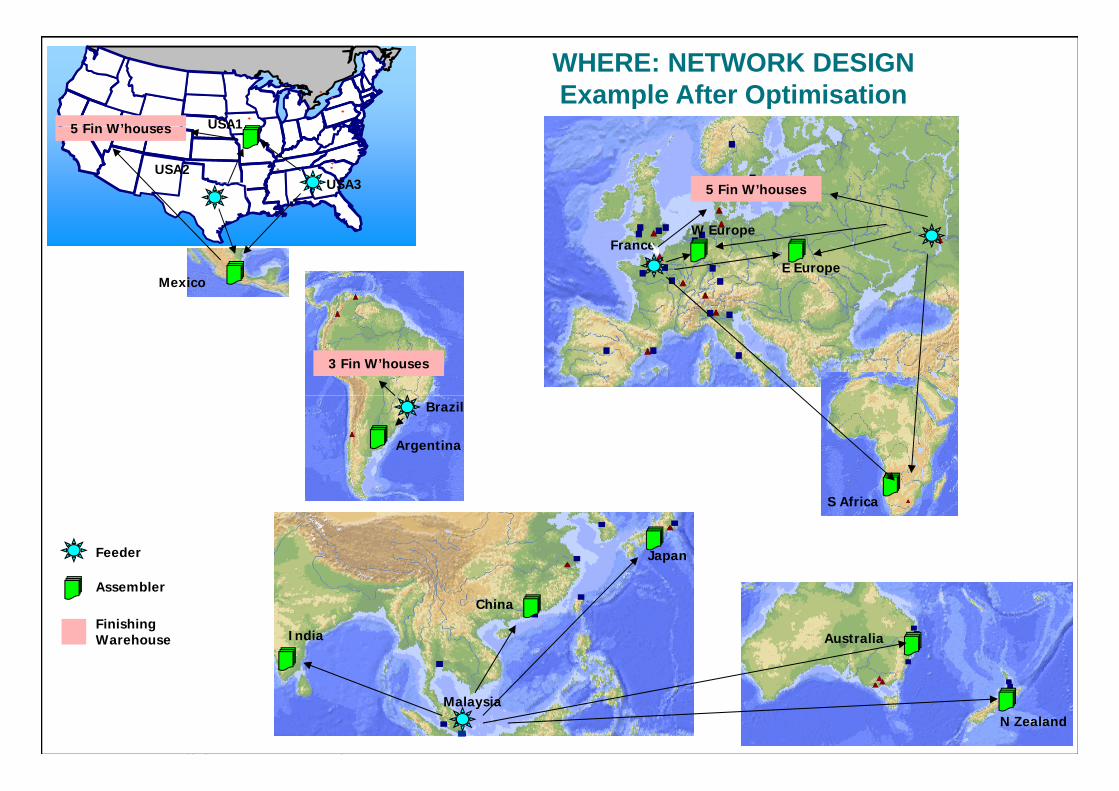
USA15 Fin W’houses
WHERE: NETWORK DESIGN Example After Optimisation
5 Fin W’housesIowa ParkUSA2
USA3
USA15 Fin W’houses
FranceW Europe
E EuropeMexico
3 Fin W’houses
Brazil
Argentina
S Africa
JapanFeeder
China
India Australia
Assembler
Finishing Warehouse
© Copyright Institute for Manufacturing 19
MalaysiaN Zealand

HOW: TRANSFERRING PRODUCTION & COMPETENCE
Capturing tacit knowledge
Packaging / adapting
Infrastructure
Improving capabilities
© Copyright Institute for Manufacturing 20
Aligning incentives Ramp up
AGENDA
1. Why lean, offshoring & outsourcing are not enough
2. What leading companies are doing
3 A structured approach3. A structured approach
4. Summary & questions
© Copyright Institute for Manufacturing 21
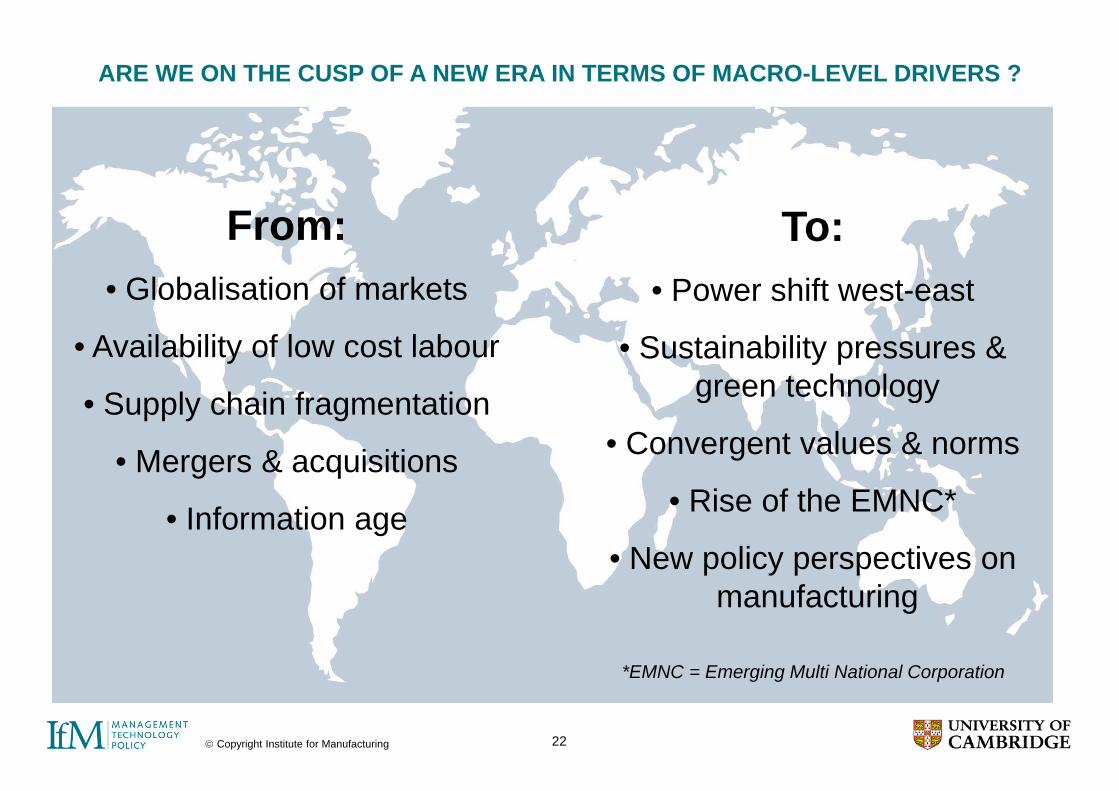
ARE WE ON THE CUSP OF A NEW ERA IN TERMS OF MACRO-LEVEL DRIVERS ?
F TFrom:• Globalisation of markets
To:• Power shift west-east
• Availability of low cost labour
S l h i f t ti
• Sustainability pressures & green technology• Supply chain fragmentation
• Mergers & acquisitions
green technology
• Convergent values & norms
• Information age • Rise of the EMNC*
• New policy perspectives on p y p pmanufacturing
*EMNC E i M lti N ti l C ti
© Copyright Institute for Manufacturing 22
*EMNC = Emerging Multi National Corporation
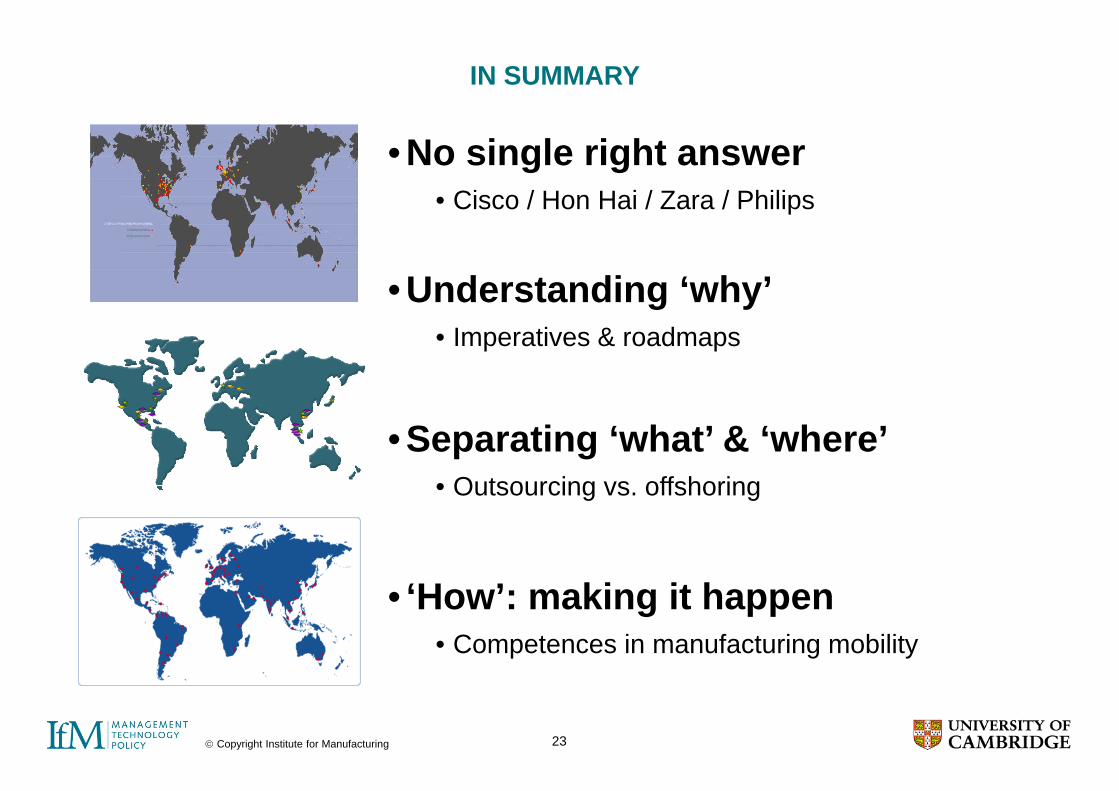
IN SUMMARY
• No single right answer• Cisco / Hon Hai / Zara / Philips
• Understanding ‘why’g y• Imperatives & roadmaps
• Separating ‘what’ & ‘where’• Outsourcing vs offshoring• Outsourcing vs. offshoring
• ‘How’: making it happen• Competences in manufacturing mobility
© Copyright Institute for Manufacturing 23
ANY QUESTIONS
IfM t il bl t d l d fIfM report available to download from: www.ifm.eng.cam.ac.uk/service/books/form_footprint.html
© Copyright Institute for Manufacturing 24
Further information
Paul ChristodoulouPrincipal Industrial FellowPrincipal Industrial [email protected]
Don FleetPrincipal Industrial Fellowdef25@cam ac [email protected]
© Copyright Institute for Manufacturing 25