Transversal Activity Report - AFROSAI-E · imperatives and, to align with changes to the...
81
Transversal Activity Report 2015 Presented at the AFROSAI-E Governing Board meeting in Abuja, Nigeria, May 2016
Transcript of Transversal Activity Report - AFROSAI-E · imperatives and, to align with changes to the...

Transversal
Activity
Report
2015 Presented at the AFROSAI-E Governing Board meeting in Abuja, Nigeria, May
2016

AFROSAI-E Transversal Activity Report for the year 2015
2
Contents
FOREWORD .......................................................................................................................................... 6
EXECUTIVE SUMMARY .................................................................................................................... 7
CHAPTER 1: INTRODUCTION TO THE ICBF .................................................................................. 9
1.1 Introduction ............................................................................................................................. 9
1.2 The Transversal Activity Report ............................................................................................. 9
1.3 Institutional Capacity Building Framework (ICBF) ............................................................... 9
1.4 QA Support Visits and General Findings.............................................................................. 11
1.5 AFROSAI-E DEVELOPMENT TOOLS ............................................................................. 11
1.6 The ICBF and SAI-Performance Measurement Framework (SAI-PMF) ............................. 12
CHAPTER 2: REPORT METHODOLOGY ........................................................................................ 14
2.1 Introduction ........................................................................................................................... 14
2.2 The Annual Questionnaire .................................................................................................... 14
2.3 Credibility of Self-Assessments ............................................................................................ 14
2.4 The New Questionnaire ........................................................................................................ 15
2.5 Response Rates ..................................................................................................................... 15
2.6 Structure of the report ........................................................................................................... 16
CHAPTER 3: AGGREGATED ASSESSMENT OF THE FIVE DOMAINS ..................................... 17
3.1 Introduction ........................................................................................................................... 17
3.2 ICBF Domain Average Scores .............................................................................................. 17
3.2.1 Performance on domains from 2012 to 2015 ................................................................ 18
3.2.2 Measuring SAI Performance ......................................................................................... 19
3.2.3 Communicating Audit Results ...................................................................................... 20
3.3 Quality Control and Assurance ............................................................................................. 22
CHAPTER 4: INDEPENDENCE AND LEGAL FRAMEWORK ...................................................... 25
4.1 Introduction ........................................................................................................................... 25
4.2 Assessment of the Domain .................................................................................................... 25
4.2.1 Financial Independence ................................................................................................. 26
4.2.2 Administrative Independence........................................................................................ 27
4.2.3 Follow-up Mechanism and Reporting on own Performance ........................................ 27
CHAPTER 5: ORGANISATION AND MANAGEMENT .................................................................. 29
5.1 Introduction ........................................................................................................................... 29
5.2 SAI Assessment .................................................................................................................... 29
5.2.1 Strategic and Operational Planning ............................................................................... 30
5.2.2 Integrity and Code of Ethics ......................................................................................... 31

3 AFROSAI-E Transversal Activity Report for the year 2015
5.2.3 Performance Audit Function ......................................................................................... 32
5.2.4 IT Support Function ...................................................................................................... 33
CHAPTER 6: HUMAN RESOURCES DOMAIN ............................................................................... 34
6.1 Introduction ........................................................................................................................... 34
6.2 SAI Assessment .................................................................................................................... 34
6.2.1 Human Strategy............................................................................................................. 35
6.2.1 SAI Performance Management Systems ....................................................................... 36
6.2.3 Training and Development of Staff............................................................................... 37
CHAPTER 7: AUDIT STANDARDS AND METHODOLOGY ........................................................ 39
7.1 Introduction ........................................................................................................................... 39
7.2 Assessment of the Domain .................................................................................................... 39
7.2.1 Regularity Auditing....................................................................................................... 41
7.2.2 Performance Auditing ................................................................................................... 42
7.2.3 IT Auditing .................................................................................................................... 44
CHAPTER 8: COMMUNICATION AND STAKEHOLDER MANAGEMENT ............................... 46
8.1 Introduction ........................................................................................................................... 46
8.2 Assessment of Domain.......................................................................................................... 46
8.2.1 Communication Policies and Strategy .......................................................................... 47
8.2.2 Internal Communication ............................................................................................... 48
8.2.3 SAI Stakeholder Engagement ....................................................................................... 49
CHAPTER 9: GENERAL PERFORMANCE OF THE SAIs .............................................................. 50
9.1 Introduction ........................................................................................................................... 50
9.2 SDGs and AU AGENDA 2063 Goals .................................................................................. 50
9.3 Timeliness and audit coverage .............................................................................................. 51
9.4 Size and composition of audit staff ....................................................................................... 52
9.5 Financial resourcing of SAIs................................................................................................. 53
CHAPTER 10: CONCLUSIONS ......................................................................................................... 55
10.1 Summary ............................................................................................................................... 55
10.2 Progress during the year ........................................................................................................ 55
10.2.1 Professionalisation of public sector Auditing ............................................................... 56
10.2.2 SAI becoming credible voice for beneficial change ..................................................... 56
10.2.3 Transforming leadership capacity to capability ............................................................ 57
10.2.4 Driving Innovation and Creativity ................................................................................ 57
APPENDICES ...................................................................................................................................... 58
Appendix 1: Afrosai-E Institutional Capacity Building Framework (ICBF): A Generic Format of
the Institutional Perspective .............................................................................................................. 59

AFROSAI-E Transversal Activity Report for the year 2015
4
Appendix 2: Country Level Presentations 2014 ............................................................................... 62
Appendix 3: Quality Assurance Questions – average for all countries per question ........................ 76
Appendix 4: Quality assurance questions compared to quality assurance visits ...................... 78
Appendix 5: Number of auditors in the region ................................................................................. 80
List of Figures
Figure 1: Average self-assessed level for the region (Comparison between domains 2013 to 2015). 17
Figure 2: SAI scores on the different questions relating to monitoring and evaluation of SAI systems
and processes........................................................................................................................................ 20
Figure 3: SAI scores on the different questions relating to how the SAIs communicate their audit
results .................................................................................................................................................... 21
Figure 4: Quality Assurance Level calculated on a subset of the original quality assurance questions in
the self-assessment questionnaire. The percentage is based on 25 SAIs in 2015, 25 SAIs in 2013 and
2014, that have reached level 3 and higher or respectively level 2.5 or higher [note that estimates
were used for Angola based on 2013 figures ....................................................................................... 22
Figure 5: SAI Comparisons on Independence and Legal Framework domain (2013 figures were used
for Angola) ............................................................................................................................................ 25
Figure 6: How SAIs responded to key questions on financial independence ....................................... 26
Figure 7: How SAIs responded to key questions on Administrative Independence ............................. 27
Figure 8: SAI responses to key questions on follow-up of audit recommendation and SAI
performance reporting ......................................................................................................................... 28
Figure 9: SAI comparisons on Organisation and Management domain (2013 figures were used for
Angola) .................................................................................................................................................. 30
Figure 10: How SAIs responded to key questions on strategic and operational planning ................... 30
Figure 11: SAIs responses to key questions on MIS, time recording, ethics and integrity management
.............................................................................................................................................................. 31
Figure 12: How SAIs responded to key questions on SAI IT function and related IT issues ................. 33
Figure 13: SAI comparisons on Human Resources domain (2013 figures were used for Angola) ........ 34
Figure 14: How SAIs scored key questions on SAI HR policies and Performance management Systems
.............................................................................................................................................................. 36
Figure 15: How SAIs scored key questions on SAI HR Training and development functions ............... 37
Figure 16: How SAIs scored key questions on overall annual audit planning for all types of audits ... 41
Figure 17: How SAIs scored key questions on Regularity Audit quality control measures ................. 42
Figure 18: How SAIs scored key questions on quality control measures for performance auditing .... 43
Figure 19: The different platforms used by governments in the region .............................................. 44
Figure 20: How SAIs scored key questions on IT/IS audit development ............................................... 45
Figure 21: SAI comparisons on Communication & Stakeholders Management domain (2013 figure
were used for Angola) ........................................................................................................................... 46
Figure 22: How SAIs scored key questions on Communication policy and strategy ............................ 47
Figure 23: How SAIs scored key questions on Internal Communication .............................................. 48
Figure 24: How SAIs scored key questions on stakeholder engagement ............................................. 49
Figure 25: The numbers of auditors in the region in selected disciplines ............................................ 52

5 AFROSAI-E Transversal Activity Report for the year 2015
List of Tables
Table 1: The five levels and the institutional perspective on each level in the ICBF ............................ 10
Table 2: Number of SAIs responding to the survey over the years 2006-2015 ..................................... 16
Table 3: Comparison between the number of SAIs on level 3 and 4 in 2012, 2013, 2014 and 2015
(2013 figures were used for Angola) ..................................................................................................... 18
Table 4: Four SAIs in the region were subject to quality assurance visits by AFROSAI-E during 2015.
The table shows the difference between the maturity levels in accordance to the quality assurance
reports on the one hand and the SAIs’ own self assessed rating in the self-assessment questionnaire
for 2015. ................................................................................................................................................ 23
Table 5: Capacity of SAIs to audit SDGs and AU AGENDA 2016 Goals ................................................. 50
Table 6: Percentages of SAI budgets against their National Budgets (SAI Angola, Eritrea and
Mozambique did not submit their figures) ........................................................................................... 54

AFROSAI-E Transversal Activity Report for the year 2015
6
FOREWORD
It gives me great pleasure to present the 2015 Transversal Activity Report. The report is based on the
annual Institutional Capacity Building Framework (ICBF) questionnaire sent out to AFROSAI-E
member SAIs. 2015 marked the start of our new Corporate Plan period (2015-2019) and the format
of the questionnaire as well as the questions were updated and revised to reflect our new strategic
imperatives and, to align with changes to the requirements of ISSAI 12, draft ISSAI 30, ISSAI 100, 200,
300 and 400.
The ICBF is now a well-accepted and understood tool in the region. Its adoption by the AFROSAI-E
Auditors General has stimulated a spirit of constructive competition amongst the SAIs with a positive
impact on the development activities in the region. Whilst the challenges are ambitious it is certainly
within the capability of all SAIs to continue improving their performance and thus facilitate public
service accountability throughout the region. The progress made by SAIs is visible and will eventually
demonstrate the impact of their work in the years ahead by means of improved accountability,
transparency and governance in the region’s public sector.
The updated questionnaire has 189 questions divided into the five domains of the ICBF as well as an
additional section containing general questions addressing the SAI outputs, outcomes and
environment. It should be noted that the questionnaire still contains the questions from previous
years for easy of comparison. Further, the changes in layout and content were made in response to
the complexity and dynamic changing realities within the scope of the region’s capacity building
needs. The questions in the general section of the questionnaire are not used to measure the SAI
development levels but rather to provide context and add content to the narrative of the report.
In line with our organisational value of embracing innovation, the ICBF questionnaire was distributed
for the first time using an online survey tool. Utilising the Survey Monkey platform has allowed us to
take great strides in the manner in which we collect information. We envisage that going forward
the Secretariat will continue to work towards automating its offerings with hope of making a
difference in the performance of our member-SAIs.
This Transversal Activity Report was presented at our Governing Board meeting in Abuja, Nigeria in
May 2016. Members were given until the end of May 2016 to provide comments on the report.
Wessel Pretorius
Chief Executive Officer
AFROSAI-E Secretariat
7 AFROSAI-E Transversal Activity Report for the year 2015
EXECUTIVE SUMMARY
The Transversal Activity Report for year 2015 is based on the outcomes of self-assessments by 25
out of 26 member Supreme Audit Institutions (SAIs) within the AFROSAI-E region. The self-
assessment questionnaire and the resulting report are based on the AFROSAI-E Institutional Capacity
Building Framework (ICBF) which was adopted by its Governing Board in 2006.
The response rate for the year 2015 increased to 25 out of 26 SAIs in comparison to 23 out of 25 SAIs
in 2014. The results presented in this report are primarily based on the responses provided by the 25
SAIs. However, the results of on-site quality assurance reviews by the Secretariat at selected SAIs
were also taken into account. In addition, the outcomes of our 2015 Integrated Annual Report are
also referred to in this report.
2015 marks the first year of our new five-year Corporate Plan period ending December 2019. The
results of the year ending December 2014 were used as baseline information in the development of
the 2015 Activity Report. The focus for this strategic cycle is the establishment of mechanisms to
drive continuously higher levels of achievement in line with the region’s strategic goals and
objectives. Some analysis on the underlying factors affecting development in the region was done by
focusing on how key questions within particular ICBF elements were scored and the comments
offered were then used to corroborate those scores. This has resulted in a better understanding as
to why some of the improvement in the region is not reflected in the aggregated figures despite the
efforts made.
On a general level there has been incremental improvement within the different ICBF domains.
Three domains, namely the independence and legal framework domain, the audit standards and
methodology domain and the communication and stakeholder management domain show
significant incremental improvement when compared with the previous years. Increased capacity
building interventions in the region may attribute to the improvement in the scoring. However, two
domains, namely the organisation and management domain and the human resources domain show
slight decreases in the scoring. This may be due to an increased awareness by SAIs on what is
needed in order for a higher score to be attained. On the other hand the number of questions used
in the questionnaire was increased with an added focus on the monitoring and evaluation processes
within the SAI systems.
Specifically this report identifies capacity gaps in the development and implementation of ISSAI
compliant audit tools and their practical usage by the auditors and the organisations themselves.
The challenge for a majority of the SAIs is implementation of the various tools, new policies and
systems developed. In this report the implementation challenges has been attributed to funding
challenges and technical skills gaps to drive the policies, strategies and monitor the deployment of
the tools. Additionally, the absence of effective communication at both the operational and strategic
levels may also be a factor in the challenges being faced by SAIs.
Although there are significant improvements recorded when compared with previous years, there
are also development opportunities which could be exploited both at the SAI and regional levels.
These opportunities exist across all five domains of the ICBF. In exploiting these opportunities the
principles enshrined in ISSAI 12: The Values and Benefits of SAIs, are instructive. SAIs need to
demonstrate their value and benefit to society. This raises different capacity building questions in

AFROSAI-E Transversal Activity Report for the year 2015
8
terms of why, when and how SAIs can build their capacities to effectively execute their audit
mandates. The following key areas are important for focusing capacity building initiatives:
Professionalisation of public sector auditing as well as accounting
In view of the ISSAI implementation drive by members, professionalisation of public sector auditing
can provide a long term solution to skills capacity challenges. The critical need for SAIs to pull
resources together to drive training for staff to get technically qualified and accredited cannot be
overemphasised.
SAIs becoming credible voices for beneficial change
SAIs occupy an important position in society and as such they are expected to ‘walk the talk’ if they
are to be credible voices for change. It is therefore the responsibility of SAIs to ensure that what they
communicate is credible and adds value to society. As such, the communication of audit results
needs to be timely to allow decision makers to choose appropriate interventions for improved
service delivery. Areas that require attention include strengthening of SAI communication functions,
systems, processes and structures.
Transforming the capacity of leadership into capability
There can be no debate on the critical importance of effective leadership SAIs to drive
transformation and provide direction in this era of economic, political and technological
uncertainties and disruptive changes in the global environment. Leadership and management
capacity development in SAIs need to be treated as a strategic tool for addressing organisational
challenges to achieve predefined goals and performance outcomes. While leadership skills are
required at every level of the SAI, the primary responsibility of “turning capacity to capability” lies in
the domain of the top executives of the SAI.
Driving innovation and creativity in SAIs
The sustainable development of any organisation lies in its ability to be innovative and creative in
the process of executing its mandate. In our region, the governments of all our member SAIs have
automated their financial management systems. However, IT support and audit capacity is not
growing in tandem. The area of IT support and IT audit is lagging behind in a majority of SAIs and
thus compromising the credibility of reports produced. Innovation and creativity is required in the
areas of audit processes, working papers and various SAI corporate services systems and processes.

9 AFROSAI-E Transversal Activity Report for the year 2015
CHAPTER 1: INTRODUCTION TO THE ICBF
1.1 Introduction
This chapter defines the Transversal Activity Report and it provides an overview of the AFROSAI-E
Institutional Capacity Building Framework (ICBF). The chapter addresses the region’s quality
assurance support visits and how they are linked to the annual ICBF self-assessment questionnaire
as well as the role of other development tools produced by the region. It concludes by providing
clarifications on the complimentary relationship between the ICBF and the SAI Performance
Measurement Framework (PMF).
1.2 The Transversal Activity Report
The Transversal Activity Report is part of capacity building through the ICBF framework. It provides a
cross sectional and longitudinal view on how SAIs have performed and progressed in terms of the
ICBF framework for the twelve-month reporting period. The report aims to facilitate the analysis by
providing member SAIs with information from an institutional perspective on the status of their
development and that of public sector auditing in the region through self-assessments. This provides
a platform for broad comparison within the region and could be of benefit for benchmarking among
members SAIs as well as use by our development partners and other key stakeholders including the
donor community.
Further, the activity report is an important instrument for the Governing Board and its Executive
Secretariat to monitor developments in the region against the agreed objectives and activities
outlined in the Corporate Plan. The Secretariat’s enabling role to better support its members in the
execution of their mandates, is as well enhanced by the information provided in this report.
1.3 Institutional Capacity Building Framework (ICBF)
At its annual meeting in 2006, the Governing Board adopted an institutional capacity building
framework as a basis for the organisation and its members to approach development and strategic
planning. The framework has its roots in a capability model that was developed in 2001 and updated
in 20051. It consists of five development levels, level 1 to 5, and five institutional development areas
or domains:
Independence and Legal Framework,
Organisation and Management,
Human Resources,
Audit Standards and Methodology and,
Communication and Stakeholder Management.
1 1 AFROSAI-E: A good practice guide to enhance the independence of Supreme Audit Institutions (SAIs) in
English-Speaking African countries, 2005.
AFROSAI-E Transversal Activity Report for the year 2015
10
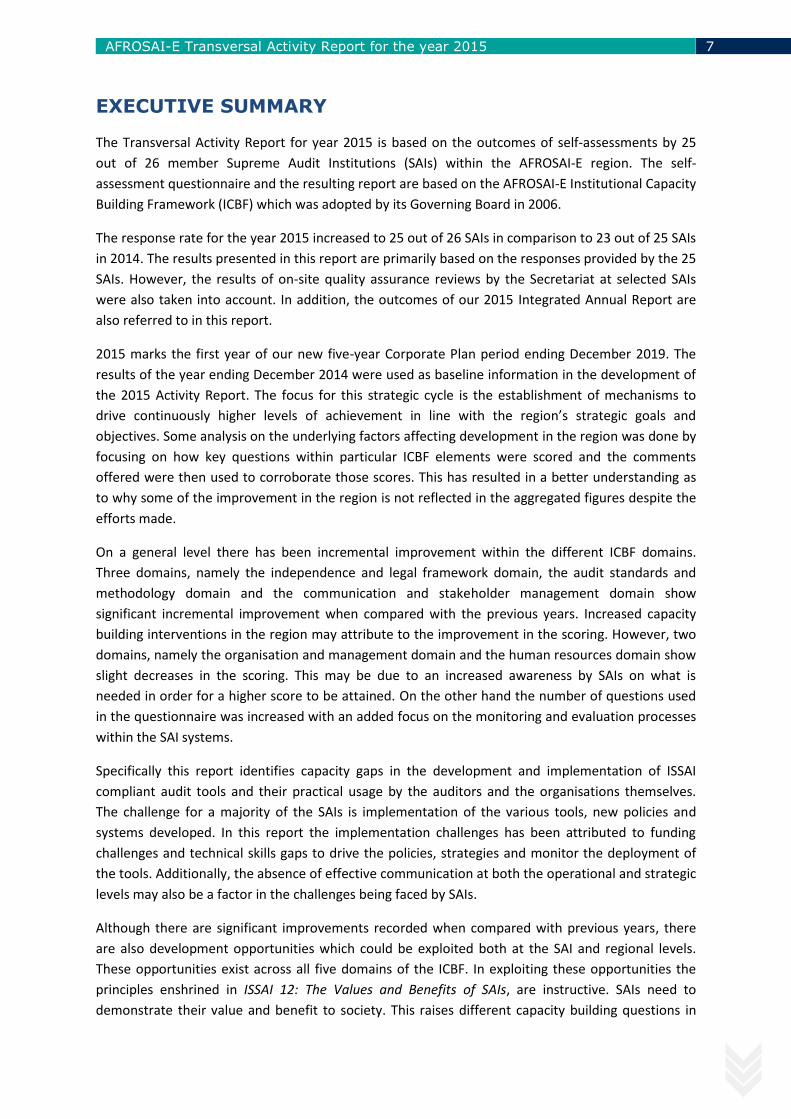
Each domain contains a number of elements as shown in appendix 1.
The ICBF is primarily a practical tool for SAIs to use in supporting their development endeavours with
the intent of reaching the established level (level 3) and ideally an optimised level (level 4) of
institutional capacity on each of the five domains in the best possible way. Using the tool enhances
the possibilities for a SAI to develop its different branches in parallel, that is, strategic management,
auditing core business and corporate services, so that they can be linked to support each other. This
is especially important in relation to the linkages between the functional / operational planning of a
SAI and its strategic planning, monitoring and reporting.
The objective of the tool is to help the SAI focus on how it can improve its results and thereby its
position in relation to its counterparts in the INTOSAI community and specifically in the AFROSAI-E
region. In this way, the ICBF can be used as a tool to improve the performance of a SAI. It is
therefore much more than an instrument for assessment which differentiates it from most other
capacity building models. An illustration of the development levels of the ICBF is presented in table 1
below:
Institutional Capacity Building Framework (ICBF)
INSTITUTIONAL PERSPECTIVE
DEV
ELO
PM
ENT
LEV
EL
Independence
and
Legal Framework
Organisation
and
Management
Human
Resources
Audit Standards
and
Methodology
Communication
and
Stakeholder
Management
Level 5 ------------------------------------------ OPTIMI SE D LE VEL ----------------------------------------------------
Level 4 ------------------------------------------ MANAGE D LE VEL -----------------------------------------------------
Level 3 ------------------------------------------EST ABL I SHE D LE VEL -------------------------------------------------
Level 2 ------------------------------------------ DEVELO PI NG LE VEL -------------------------------------------------
Level 1 ------------------------------------------ FOU ND I NG LE VEL ----------------------------------------------------
Table 1: The five levels and the institutional perspective on each level in the ICBF
Each domain in the framework is composed of a number of issues or topics, here called elements
(see appendix 1) which are considered to be necessary to build a sustainable institution. The
domains with their elements are based on standards and best practices. Each of the five levels
includes indicators that must be fulfilled before the SAI can claim to have achieved the said level of
development. Their assessment provides the SAI with an institutional and holistic perspective in
terms of its mandate and role. The domains need to be developed to a greater extent at the same
time as they are interdependent of each other. For example, communication is an important cross-
cutting issue for independence, audit standards and human resources and would therefore need to
be developed not only in the communication and stakeholder management domain but practiced
across other domains as well.
11 AFROSAI-E Transversal Activity Report for the year 2015
Within the region, an annual self-assessment questionnaire is utilised as the tool for SAIs to
determine their level of development against each of the domains and elements. A guideline has
been developed to assist SAIs in assessing their position in accordance with the indicators developed
for each element in the ICBF and; to help SAIs position them on the right development level.
1.4 QA Support Visits and General Findings
While on one hand the self-assessment questionnaire is a tool that assists SAIs to determine their
level of development, another tool used to support the capacity building efforts of member SAIs is
the quality control and assurance model. This model is based on the five domains of the ICBF. Since
its adoption by the Governing Board in 2006, the implementation of the ICBF has gone hand in hand
with quality assurance support visits to members, based on a two to three year cycle.
Subsequently, handbooks and other guidance tools to support SAIs in the development of robust
quality control management systems were produced with the guidance of the Secretariat. Currently,
the Secretariat together with regional resource persons and experts from institutional partners carry
out on average six to eight quality assurance support visits per year. The results of these support
visit reviews are annually summarised and form part of the findings and conclusions of this report.
Consequently, at the regional level the objectivity and credibility of the annual self-assessment
results of the SAIs are ensured to a greater extent by the general findings of the quality assurance
support visits. This is true in places where SAIs over and under assess themselves. While the
assessment scores are not changed, the discussion includes the aspects of the quality support visits
general findings in order to bring about clarity as to the level of development within the domain.
1.5 AFROSAI-E DEVELOPMENT TOOLS
In support of the developmental targets set by SAIs and the Governing Board for the region as a
whole, the Secretariat produces a range of capacity building tools. These include guidance materials
(handbooks, guidelines and manuals), courseware (including e-learning programmes), training
workshops (regional and in-country) as well as on-site support and quality assurance reviews. Since
2012 more than 14 SAIs have benefited from the in-country roll-outs of Management Development
(MDP) courses and follow-up workshops to customise and implement the range of development
tools that are available.
The following developmental tools were developed and launched during 2015:
Forensic Audit Manual
Fact Sheet of Fiscal Governance
Fraud and Corruption Guideline
Fact Sheet on the Audit of Open Data
Performance Audit Module 1 e-learning Programme
AFROSAI-E Transversal Activity Report for the year 2015
12
In 2014 a new intervention was launched at the Governing Board meeting in Ethiopia, to address
continued capacity challenges to fully comply with international standards of public sector auditing.
The Executive Leadership Development Programme (ELDP) was developed in partnership with the
Swedish National Audit Office to support the establishment of professional, relevant and competent
top executive teams at SAIs in the region to lead their organisations towards full compliance. The
first phase of the programme involved 24 participants from six SAIs and was rolled-out over a period
of eight months.
The development of SAIs in the region is not only based on capacitating resource persons from
members, but is also materially dependent on support from institutional and other partners.
AFROSAI-E is working closely with subject matter experts from its institutional and other partners
together with members who are willing to support their counterparts at regional and bilateral
events. In view of the need to strengthen this model of working relationships, resource persons are
organised into different networks to enable the building of capacity within the different strategic
imperatives.
1.6 The ICBF and SAI-Performance Measurement Framework (SAI-PMF)
As a member of the Performance Measurement Framework (SAI-PMF) task team, AFROSAI-E has the
opportunity to provide inputs on the current version of the SAI PMF before its submission at the
2016 INCOSAI. The development of this performance measurement tool is being spearheaded by the
INTOSAI Development Initiative (IDI) in cooperation with INTOSAI regions and the Capacity Building
Committee (CBC).
Although the ICBF and the PMF tools
assign different domain names, i.e.
the ICBF has five and the SAI-PMF has
seven (refer to Box 1); on a general
level the two frameworks use similar
criteria to measure performance. This
similarity may be attributed to the
fact that both tools are based on
ISSAIs and best practice and; that the
development of the SAI-PMF was
partly based on the ICBF work and
frame of reference.
However, it is acknowledged that the results of a self-assessment based on the ICBF are only one of
the ways for a SAI to determine its performance levels as well as development needs. A SAI can also
utilise additional means like the SAI-PMF and other available business tools for this purpose. It is the
responsibility of the SAI to choose and use appropriate instruments in such a way that it can get the
best information for its own development and performance measurement requirements.
Notwithstanding, as a self-assessment tool, the ICBF continues to provide an efficient and cost-
effective method for members of the region to assess their developmental needs on an annual basis.

13 AFROSAI-E Transversal Activity Report for the year 2015
It is expected that the SAI-PMF will provide SAIs with an additional measurement tool as a
compliment to the ICBF, for enhanced external credibility.
The results reflected in this report are used by the Secretariat to better understand the needs and
challenges of member SAIs. It is a vital source of information for long-term and annual operational
planning and provides a comparative position of SAIs in the region for the interest of their
stakeholders.
AFROSAI-E Transversal Activity Report for the year 2015
14
CHAPTER 2: REPORT METHODOLOGY
2.1 Introduction
This chapter covers the reporting methodology in terms of the preferred design and methods that
were used to analyse the questionnaire responses. Secondly, the chapter elaborates on how the
report is structured and communicated using the ICBF domains as the major divisions.
2.2 The Annual Questionnaire
This report was compiled based on the responses by member SAIs on the 2015 ICBF self-assessment
questionnaire. It provides a broad overview on how the region has progressed and developed within
the five domains of the ICB framework and; in an effort to provide greater perspective; it shows
comparative results from 2013 to 2015.
It should however be noted that the 2015 results fall within the new Corporate Plan period (2015-
2019) and the analysis does therefore address issues related to the new strategic direction. In
addition, the questions used in the 2015 questionnaire have been materially adjusted in view of the
following:
The new 2015-2019 strategic imperatives;
The principles of the new ISSAI 12, 100 – 400 and draft ISSAI 30; and
The need to align the questions with the criteria used in the SAI-PMF.
Notwithstanding the above factors, the questions are still aligned to the basic values and principles
of the five domains of the ICBF and its regional context. Further, lessons learnt from previous
surveys were captured and instrumental in shaping the questions for this strategic period.
2.3 Credibility of Self-Assessments
In general credibility and validity concerns are raised when addressing the issue of self- assessments.
It is not within the scope of this report to discuss the merits and demerits of self-assessments.
However, based on the regional history of self-assessments over a period of ten years, the region
has observed significant improvements in terms of members submitting objective responses that are
in turn used by the SAIs for adjusting and reviewing their strategic and operational plans.
Nonetheless, when using this report the following factors are still important to consider:
First, the responses are based on self-assessments by member SAIs and are therefore a product of
perceptions on performance. In order to increase the relevance and reliability of responses, and to
ensure consistency, an abridged version of the ICBF guideline was sent together with the
questionnaire to assist and guide members to carry out the self-assessment. The abridged guideline
is meant to assist SAIs internalise the application of the ICBF tool and improve objectivity when
assessing the level of development in a given area.

15 AFROSAI-E Transversal Activity Report for the year 2015
Second, in situations where there have been sudden or extreme variations compared with the
previous years this may be due to different people answering the questions over the years since
inception to date. To mitigate against extreme variations, SAIs were encouraged to establish cross
functional teams to draft responses before final approval is given by the head of SAI.
Third, a simple averaging methodology is used to calculate the scoring under each domain and
imperative for the period under review and this may also blur the true development levels of
individual SAIs and the region as a whole. To mitigate these weaknesses, results of the quality
assurance support visits by the Secretariat were used to interpret and develop conclusions under
each domain.
2.4 The New Questionnaire
The 2015 questionnaire included 189 questions which were divided into the five domains and; an
additional section containing general questions addressing the SAI outputs, outcomes and its
environment. The general questions are not used to measure the SAI development levels but are
instead used to provide context and add to the narrative content of the report.
In line with our organisational value of innovation and creativity, the 2015 questionnaire was
distributed to SAIs using an electronic platform for the first time. Utilising the Survey Monkey tool
resulted in greater accuracy and speed to analyse the results. To facilitate easy collection of data a
soft copy of the questionnaire was included in the package sent out to member SAIs.
2.5 Response Rates
Over the years the numbers of countries responding to the survey have varied. For instance, in the
year 2011, 20 of the then 23 members responded to the survey, while 24 out of the 24 members
responded in the year 2013. In 2014 we had 23 out of 25 members responding and in 2015 we had
25 SAIs responding out of the now 26 member SAIs (see Table 2). The 26th member (SAI Somalia) was
accepted during the 2015 Governing Board meeting in South Africa.
Year Number of SAIs who
responded
Total Number of
member SAIs
2006 12 23
2007 13 23
2008 17 23
2009 22 23
2010 23 23
2011 20 23

AFROSAI-E Transversal Activity Report for the year 2015
16
As shown in table 2, the number of SAIs responding have more than doubled since 2006. An 88.5%
response rate is a positive trend as members have been forthcoming in providing the required
feedback.
2.6 Structure of the report
For the 2015 reporting period, the five domains are used to structure the report. The data is
presented in two forms, that is, aggregated averages on clustered responses from SAIs and; a
detailed analysis on key issues within each domain. Thereafter the report moves into conclusions.
2012 21 24
2013 24 24
2014 23 25
2015 25 26
Table 2: Number of SAIs responding to the survey over the years 2006-2015

17 AFROSAI-E Transversal Activity Report for the year 2015
CHAPTER 3: AGGREGATED ASSESSMENT OF THE FIVE
DOMAINS
3.1 Introduction
This chapter covers the aggregated average scores of the 25 SAIs that completed the 2015 ICBF self-
assessment questionnaire. The objective is to provide an integrated summary of the region’s
development level in 2015 as well as to indicate the significant gaps and challenges that the member
are still facing especially in the area of quality control. Apart from addressing the average scores of
all the five domains, the chapter also focuses on SAI performance reporting and communication of
audit results across all the five domains of the ICBF. This is considered in terms of regional
development as a whole, and individual SAI development against each of the domains. The
individual SAI development level is captured in appendix 2.
3.2 ICBF Domain Average Scores
The self-assessment levels on the domains range from level 0-5. The regional target is to achieve
level three and above on the ICBF. In this report the results from 2013 and 2014 are used to provide
baseline information regarding the development levels in the region. As can be observed from the
results of the self-assessment in Figure 1, on aggregate there has been a significant movement
within the five domains.
Figure 1: Average self-assessed level for the region (Comparison between domains 2013 to 2015)
In the current reporting period (2015) within the five domains, the region experienced
improvements in three out of the five domains as can be seen in Figure 1. For instance the
Independence and Legal Framework moved from 3.09 in 2014 to 3.16 in 2015; Audit Standards and
Methodology moved from 2.57 to 2.82 and Communication and Stakeholder Management moved
from 2.53 to 2.55. Two domains, namely Organisation and Management and Human Resources
0.00
1.00
2.00
3.00
4.00
5.00
Independence &Legal Framework
Organization &Management
HumanResources
Audit Standards &Methodology
Communication &StakeholderManagement
DOMAINS
2013 2014 2015

AFROSAI-E Transversal Activity Report for the year 2015
18
experienced drops in the assessed aggregate averages moving from 2.82 (2014) to 2.77 (2015) and
2.69 (2014) to 2.55 (2015), respectively.
As can be seen in Figure 1 the region has achieved the targeted level 3 of ICBF since 2013 on the
Independence and Legal Framework domain and has been improving while the remaining domains
are moving towards the targeted level. More importantly is the improvement in the Audit Standards
and Methodology domain which is an encouraging phenomenon given that the core business of the
SAI is housed in this domain.
At an individual level the development of SAIs is more contextualised. The development level of
each SAI was aggregated against the five domains of the ICBF. Appendix 2 shows the development
levels of each SAI in accordance with the ICBF. As can be observed from appendix 2, it is the
responsibility of each concerned SAI to prioritise the areas that need improvement based on their
own identified gaps within the framework of their individual resource constrains. The Secretariat will
use this information to prioritise the MoUs with members that request bilateral and technical
support.
3.2.1 Performance on domains from 2012 to 2015
In the current strategic period (2015-2019) the targeted level of development is level 3 and above.
The targeted level for this period under review is for 40% of SAIs to attain level three and above.
Table 3 depicts the trend from 2012 to 2015.
Number of SAIs in the region on level 3 and 4 in 2012, 2013, 2014 and 2015
Year & ICBF Level of
Development
2012 2013 2014 2015
Level 3 Level 4 Level 3 Level 4 Level 3 Level 4 Level 3 Level 4
Independence 12 0 12 0 15 0 16 0
Organisation &
Management 8 0 9 0 6 0 6 0
Human Resources 7 0 7 0 6 0 3 0
Audit Standards &
Methodology 4 0 6 0 4 0 10 0
Communication &
Stakeholder
Management
3 0 4 0 4 0 5 0
Table 3: Comparison between the number of SAIs on level 3 and 4 in 2012, 2013, 2014 and 2015 (2013 figures
were used for Angola)
As can be observed from Table 3, a substantial number of SAIs i.e. 16 (64%), have reached level 3
and above in the Independence and Legal Framework. On the other hand there are no significant
improvements in the number of SAIs who reported that they were now at a level 3 on the

19 AFROSAI-E Transversal Activity Report for the year 2015
Organisation and Management domain, with the numbers staying static at 6 (24%) compared with
the previous year. The Human Resources domain experienced a drop from 6 to 3 SAIs at level three
and above.
In terms of the Audit Standards and Methodology domain, there has been a significant increase in
the number of SAIs on level 3 and above, from 4 (12%) in 2014 to 10 (40%) in 2015, which is an
increase of 28%. On the Communications and Stakeholders Management domain, the number of
SAIs at responding at level 3 and above increased from 4 to 5 SAIs between 2014 and 2015
respectively.
There are various reasons that can explain the movement of the ratings under each of the domains.
The differences and explanations in how the SAIs self-assessed will be discussed in detail when
addressing the individual domains in the chapters ahead. However, analysing cross-cutting issues
such SAI performance measurement indicators and audit communication issues reveal some
interesting results.
3.2.2 Measuring SAI Performance
Monitoring and evaluating the operations of the different SAI processes and systems is an important
enabler for measuring SAI performance. In figure 2, eight selected questions that measure the
establishment of monitoring and evaluation mechanisms were taken from across the five ICBF
domains. The effectiveness of these mechanisms is expected to enable the SAIs to measure their
own performance in any given reporting period.
As can be seen in figure 2, the majority of SAIs indicated that they established systems and processes
that monitor and evaluate the execution and achievement of goals and objectives of their strategic
(58% scoring level 3 and above) and operational (71% scoring level 3 and above) plans. On the other
hand monitoring and reporting on the execution of HR and Communication strategies and plans
appear to be done by only a few SAIs. For instance, only 21% and 33% of the SAIs respectively scored
level 3 and above indicating they were monitoring and evaluating the execution of the HR and
Communication strategies.

AFROSAI-E Transversal Activity Report for the year 2015
20
Figure 2: SAI scores on the different questions relating to monitoring and evaluation of SAI systems and
processes
Further, in figure 2 the scores of the SAIs also indicated that a majority of SAI do not seek to obtain
the satisfaction degrees of their stakeholders when it comes to regularity audits (76% scoring level 2
and below) and performance audits (80% scoring level 2 and below). It appears the contents of
performance reports of the majority of the SAIs do not include measures on satisfaction rates of
stakeholders as well as issues relating to the effectiveness of their internal control systems. This is
because while a majority of SAIs indicated that they publish their SAI performance reports (64%
scoring level 3 and above), a few indicated that they collect data to measure the extent to which
stakeholders are satisfied with their services.
3.2.3 Communicating Audit Results
Another cross-cutting dimension is communication. Apart from being in domain five; communication
can also take place across the other four domains. Of particular interest is how SAIs communicate
their audit results, both from an internal and external perspective. Since audit results are an output
of the interplay between a SAI’s inputs and its processes and systems; analysing the dynamics of
what happens in the SAIs may provide important information about the effectiveness of such
64%
60%
68%
52%
20%
32%
24%
20%
36%
40%
32%
48%
80%
68%
76%
80%
0% 20% 40% 60% 80% 100%
The SAI submits an annual report on its ownperformance to Parliament and other key stakeholders.
The SAI has developed and implemented a monitoringand evaluation mechanism to provide input on the
achievement of strategic goals and objectives as wellas input into the next strategic planning phase.
The SAI has implemented a system for monitoring andevaluation of the annual operational plan.
The SAI has established a system for annually carryingout reviews of its internal control environment andpublishes the results of such reviews in its annual
performance report.
The SAI has implemented a system to monitor andevaluate the different aspects of the human resource
development strategy the results of which are includedin the SAIs annual performance report.
The SAI is monitoring the implementation of thecommunication policy and strategy and reporting on the
outcomes in the annual performance report.
The SAI annually reports on the percentage of keystakeholders who consider that regularity audit adds
value to the stakeholders and the country.
The SAI annually reports on the percentage of keystakeholders who consider that performance audit adds
value to the stakeholders and the country.
Level 2andbelowLevel 3andabove

21 AFROSAI-E Transversal Activity Report for the year 2015
communication processes. Figure 3 gives a summary of how the SAIs communicate with
stakeholders across the domains.
Figure 3: SAI scores on the different questions relating to how the SAIs communicate their audit results
As can be seen in figure 3, the majority of SAIs (96% scoring level 3 and above) have the freedom to
decide on the content and timing of their audit reports and, to publish and distribute them.
However, there appears to be challenges when it comes to the issue of following-up on the results of
audit recommendations for both regularity and performance audits. While the self-assessment
results show that a majority of SAIs were on a level 3 and above in terms of communication during
the audit process, the results of the quality assurance support visits indicate that there are still
challenges in this area. There may be need for SAIs to improve on the reporting times. For example,
when it comes to submission of annual audit report to Parliament; 44% of the SAIs scored 2 and
below indicating that a significant number of SAIs are not submitting the annual audit reports within
six months after year-end. This may be attributed to different statutory requirements where the
96%
72%
52%
68%
68%
64%
68%
80%
48%
92%
92%
60%
48%
56%
16%
12%
4%
28%
48%
32%
32%
36%
32%
20%
52%
8%
8%
40%
52%
44%
84%
88%
0% 50% 100% 150%
SAI has freedom to decide on content and timing of audit reportsand to publish and disseminate them.
The SAI has access to submit its reports direct to Parliament.
The SAI has implemented follow-up mechanisms forperformance audit recommendations as well as those made by…
The SAI has implemented follow-up mechanisms for regularityaudit recommendations as well as those made by the…
The SAI has a communication strategy for the relations with theauditee as part of the requirements of its audit process.
The SAI has implemented a regular communication processeswith relevant experts where appropriate during the audit process.
The SAI has implemented a regular communication processeswith internal auditors.
The SAI has implemented mechanisms for the follow-up ofprevious years recommendations.
The SAI reports to Parliament on the implementation status ofthe PAC recommendations.
The SAI has implemented a standard structure for reports thatare user friendly.
The SAI has established communication channels to strengthenrelations with PAC.
The SAI's annual regularity audit coverageas as %age of thenational budget expenditures
During the year the SAI has published X number performanceaudits
The SAI submits audit report(s) to the Executive or Parliamentwithin six months following the end of the financial/fiscal year.
The percentage of implemented regularity auditrecommendations after two (2) years.
The percentage of implemented performance auditrecommendations after three (3) years.
Level 2andbelow
Level 3andabove

AFROSAI-E Transversal Activity Report for the year 2015
22
reporting timeframes are more than six months after year-end. Further, a majority of SAIs do not
report on the percentage of implemented audits recommendations as shown by 88% and 84% for
performance and regularity audits, respectively scoring level 2 and below.
3.3 Quality Control and Assurance
Quality control is a fundamental ingredient in ensuring the delivery of quality audit services by the
SAI. Acknowledging this critical aspect in their development; the heads of SAIs, during the 2006
Governing Board meeting, resolved to carry out external quality assurance support visits based on a
cycle of at least two to three years per member SAI. This resulted in the development of a quality
assurance model by the region as an ICBF tool to assist SAIs to build the requisite capacities that
would enable them achieve the desired levels of development.
It follows that quality control and assurance remain an area of operational focus in the region. The
development levels of the SAIs on this area of focus is summarised in figure 4 for the periods 2013 to
2015.The fairly high score (50% of 25 SAIs who responded have passed level 3 and above) shows
significant progress has been made compared with the 24% recorded in 2014.
Figure 4: Quality Assurance Level calculated on a subset of the original quality assurance questions in the self-assessment questionnaire. The percentage is based on 25 SAIs in 2015, 25 SAIs in 2013 and 2014, that have reached level 3 and higher or respectively level 2.5 or higher [note that estimates were used for Angola based on 2013 figures
In figure 4, an average of 50% of the 25 SAIs who responded had passed level 3. The score is
compiled out of a number of questions shown in appendix 3. These questions cover different aspects
of quality; addressing both institutional and individual audit disciplines like regularity, performance
and IT audit questions. However, the IT questions have been excluded from the list that was used to
calculate the levels of development. Recalculating the numbers by taking out the questions2 for
quality concerning IT will thereby give a higher score on quality assurance, which better corresponds
to the efforts put into this operational area.
2 The questions for the quality assurance imperative and the changes are attached in appendix 3
17%
67%
24%
56% 50%
21%
0%
10%
20%
30%
40%
50%
60%
70%
80%
Percentage of SAIs on level 3 or above Percentage of SAIs on level 2.5 or above
2013
2014
2015

23 AFROSAI-E Transversal Activity Report for the year 2015
It should be noted also that only the questions on quality control and not on quality assurance have
been extracted. In figures 17 and 18 the scores on quality control measures in place for regularity
audit and performance audit are discussed in the Audit Standards and Methodology domain chapter.
Figure 4 shows that in year 2015, 50% of the SAIs scored level 3 and above which is a significant
improvement as compared to 24% in the previous year. This can be explained by the significant drop
in the number of SAIs (21%) on level 2.5 to 2.9. However, the number of SAIs who are below level
2.5 (29%), is not reflected.
In order to improve the quality of the audit services, SAIs need to continue to establish and maintain
well-developed quality control systems. Part of such systems require the development and
implementation of robust quality control measures for the SAIs to be able to continuously follow up
on the improvements, identify possible gaps, strengths and weaknesses and design strategies that
address the gaps.
Further, four quality assurance review visits were made by the Secretariat during 2015. Comparing
the rating for 10 key issues – as another subset of questions in the self-assessment questionnaire3 –
with the rating in the quality assurance reviews, the tendency to rate oneself higher than an external
reviewer was observed. However, it must also be said that the majority of the ratings are on the
same level for the self-assessment and the external reviews. Table 4 shows a comparison between
the ratings done by the four SAIs and results of quality assurance support visits reports by the
Secretariat.
Table 4: Four SAIs in the region were subject to quality assurance visits by AFROSAI-E during 2015. The table
shows the difference between the maturity levels in accordance to the quality assurance reports on the one
hand and the SAIs’ own self assessed rating in the self-assessment questionnaire for 2015.
The result in table 4 shows that the insight and understanding of the actual development stage in
the SAIs on a general level corresponds well to what is interpreted from an external perspective,
thus providing an opportunity for a better prerequisite for further development. This result is also in
3 The questions compared with the quality assurance visits are attached in appendix 4
Comparison between the SAIs self-assessed level on a number of relevant questions in the
questionnaire and the SAI’s level according to the QA reports for year 2015
QUESTION 1 2 3 4 5 6 7 8 9 10 Total %
Self-assessed level is
higher than in QA
report
3 1 1 0 1 3 0 1 0 0 10 25%
Self-assessed level is
equal to QA report 1 3 2 4 2 1 3 3 4 4 27 68%
Self-assessed level is
lower than in QA
report
0 0 1 0 1 0 1 0 0 0 3 7%

AFROSAI-E Transversal Activity Report for the year 2015
24
line with the aforementioned interpretation of the stabilisation for the scoring on the aggregated
general level for the domains and strategic imperatives; though one needs to note that there are still
some few SAIs that tend to overrate themselves.

25 AFROSAI-E Transversal Activity Report for the year 2015
CHAPTER 4: INDEPENDENCE AND LEGAL FRAMEWORK
4.1 Introduction
This domain covers the demands on the independence of the SAI as formulated in the Lima
Declaration (ISSAI 1) and the Mexico Declaration (ISSAI 10). It is concerned with the existence and
mandate of the SAI as to whether it is appropriately and broadly prescribed in the constitution or a
comparable legal framework that may not be amended without a two thirds legislature majority
vote and/or in line with the national laws. It seeks to assess whether the SAI has operational,
financial and administrative independence stipulated in the law(s) as well as whether the
independence of the head of the SAI and staff is guaranteed in the same laws.
This domain addresses criteria that include among others: constitutional and legal framework;
financial/managerial/administrative autonomy and appropriate human, financial and material
resources; independence of Head of SAI and staff of SAI; SAI has a broadly sufficient mandate; have
mandate and discretion to discharge its function through access to information; have mandate and
discretion to discharge its function through discretion of selection of audit topics; there is freedom
to decide on content, timing of audit reports and to publish and disseminate them; have mandate to
a direct submission of reports to Parliament; effective follow up mechanisms on recommendations;
SAI reporting on its activities and use of resources and; Parliament or an oversight body appoints the
SAIs external auditors.
4.2 Assessment of the Domain
The performance for the year under review based on 25 SAIs who responded is presented in
figure 3. With reference to figure 3; most countries have achieved or are close to achieving level 3.
16 SAIs (62.5%) SAIs indicated achievement of level 3 and above as compared to 14 SAIs (56%) in
2014. The increase can be attributed to a greater awareness by SAIs on the need to lobby their
governments to review the relevant legislative frameworks.
Figure 5: SAI Comparisons on Independence and Legal Framework domain (2013 figures were used for
Angola)
0.000.501.001.502.002.503.003.504.004.505.00
An
gola
Bo
tsw
ana
Erit
rea
Eth
iop
ia
Gam
bia
Gh
ana
Ke
nya
Leso
tho
Lib
eria
Mal
awi
Mau
riti
us
Mo
zam
biq
ue
Nam
ibia
Nig
eri
a
Rw
and
a
Seyc
hel
les
Sie
rra
Leo
ne
Som
alia
Sou
th A
fric
a
Sou
th S
ud
an
Sud
an
Swaz
ilan
d
Tan
zan
ia
Uga
nd
a
Zam
bia
Zim
bab
we
Leve
l
2015 SAI Comparison on Independence & Legal Framework
SAI

AFROSAI-E Transversal Activity Report for the year 2015
26
In figure 5, it is also apparent that more than 88% (21) of SAIs are at level 2.5 and above on the ICBF.
While on aggregate SAIs are progressing satisfactorily towards the targeted level 3, there are still
some areas that need attention in to ensure achievement of a higher level of development. It is
important to note that legislative independence is not necessary independence in practice. A more
detailed analysis is given in the paragraphs below.
We restate here that independence is the foundation of SAIs as declared in the Lima and Mexico
declarations (ISSAI 1 and 10). When it comes to operationalising independence in practice the
responses were subdued. Thus, it is of interest to analyse closely some key principles relating to
financial and administrative independence of SAIs.
4.2.1 Financial Independence
Financial independence is one of the key pillars of SAI independence. SAIs are expected to be
financially independent if they are to execute their mandate efficiently and effectively. While on
average the results shows greater improvement in terms of SAI independence the scenario changes
when individual questions are analysed. Figure 6 shows an analysis of three questions relating to
financial independence.
Figure 6: How SAIs responded to key questions on financial independence
Despite the overall score showing that most SAIs have achieved close to level 3 and above there are
still challenges when it comes to SAIs maintaining financial independence. Figure 6 shows that 52%
of SAIs still requires executive approval and release of their budgets. Firstly, only 48% of the
responding SAIs indicated that the executive does not take part in the preparations and approval of
their budgets. Secondly, in the event of the SAIs requiring additional funding, only 48% can approach
Parliament directly to submit their requests. 52% of SAIs still have no leeway to approach Parliament
for approval of additional funding. Thirdly, as it concerns transparency and accountability 36% of the
responding SAIs indicated that they do not appoint external auditors to audit their financial
statements. Instead, the SAIs still provides own external audit services. However, it is encouraging to
note that 64% of the respondents do not appoint their own external auditors, a significant
improvement when compared with 52% for the year 2014.
48%
48%
64%
52%
52%
36%
0% 10% 20% 30% 40% 50% 60% 70%
The executive does not take part in thepreparation of the SAIs budget appropriation
or the final decision on the SAIs budget.
The SAI has leeway to apply directly toParliament for additional funding.
The Parliament or another oversight bodyappoints the SAIs external auditors.
Level 2 or below
Level 3 or above

27 AFROSAI-E Transversal Activity Report for the year 2015
4.2.2 Administrative Independence
Another SAI independence pillar is administrative independence. SAIs are expected to have the
autonomy to appoint, remunerate, promote and discipline their own staff. However, most SAIs in
the region still fall under the public service and can therefore not determine their own policies and
procedures when it comes to ensuring adequate human resource capacity to execute their mandate.
Figure 7 shows scorings by SAIs on selected key questions under the independence and legal
framework domain.
Figure 7: How SAIs responded to key questions on Administrative Independence
As shown in figure 7, a majority of SAIs (80%) scored a level 3 and above when it comes to the
determination of their own organisational structure. However, only 52% of them have the mandate
to decide on human resource matters (recruitment, remuneration, promotion and others). The
other 48% of those who responded scored level 2 and below meaning they do not have the mandate
to decide on their own staff. Consequently, when asked to score on whether the SAIs had adequate
and appropriate human, material and monetary resources in relation to their mandate; 60% of them
scored level 2 and below indicating that they do not have adequate human, material and monetary
resources to execute their mandate. This has fundamental implications on the quality of their audit
services and effectiveness in executing their mandates.
Although there have been significant improvements in the Independence and Legal Framework
domain; SAIs still need to continue lobbying their executives and other development partners to
ensure the establishment of appropriate measures that would guarantee their financial and
administrative independence. Operationalising independence may be the next challenge facing SAIs
in the region within the next reporting strategic period. This may also have implications on the
governance structures of SAIs to ensure that they become model organisations that lead by
example.
4.2.3 Follow-up Mechanism and Reporting on own Performance
In accordance with the requirements of the ISSAI 10 principles, SAI are expected to establish robust
follow-up mechanisms for their audit recommendations and reporting on their own performance.
Figure 8 shows the responses of SAIs when it comes to whether they had systems in place to ensure
effective follow-up of audit recommendations and whether they publish reports on their own
performance.
80%
52%
40%
20%
48%
60%
0% 50% 100%
The SAI decides on its own organisation.
The SAI has the mandate to decide on allhuman resource matters (recruitment,remuneration, promotion etc.).
The SAI has appropriate human, materialand monetary resources in relation to itsmandate.
Level 2 or below
Level 3 or above
AFROSAI-E Transversal Activity Report for the year 2015
28
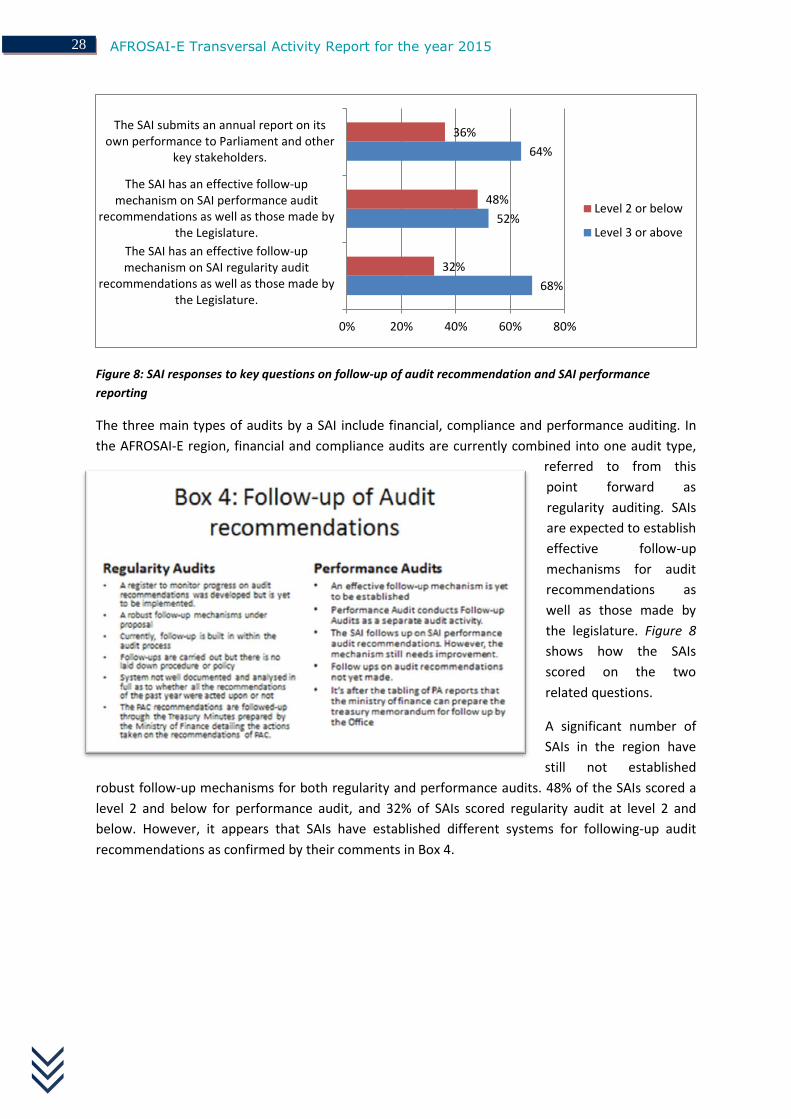
Figure 8: SAI responses to key questions on follow-up of audit recommendation and SAI performance
reporting
The three main types of audits by a SAI include financial, compliance and performance auditing. In
the AFROSAI-E region, financial and compliance audits are currently combined into one audit type,
referred to from this
point forward as
regularity auditing. SAIs
are expected to establish
effective follow-up
mechanisms for audit
recommendations as
well as those made by
the legislature. Figure 8
shows how the SAIs
scored on the two
related questions.
A significant number of
SAIs in the region have
still not established
robust follow-up mechanisms for both regularity and performance audits. 48% of the SAIs scored a
level 2 and below for performance audit, and 32% of SAIs scored regularity audit at level 2 and
below. However, it appears that SAIs have established different systems for following-up audit
recommendations as confirmed by their comments in Box 4.
68%
52%
64%
32%
48%
36%
0% 20% 40% 60% 80%
The SAI has an effective follow-upmechanism on SAI regularity audit
recommendations as well as those made bythe Legislature.
The SAI has an effective follow-upmechanism on SAI performance audit
recommendations as well as those made bythe Legislature.
The SAI submits an annual report on itsown performance to Parliament and other
key stakeholders.
Level 2 or below
Level 3 or above

29 AFROSAI-E Transversal Activity Report for the year 2015
CHAPTER 5: ORGANISATION AND MANAGEMENT
5.1 Introduction
Organisation and Management is the second domain of the ICBF. The domain covers organisational
and management tools such as plans and how they should be used efficiently and effectively. The
domain also covers how managers should behave as leaders. It is based on the principles of ISSAI 20,
30, 40, INTOSAI Govs. 9100 and 9130 as well as best practices.
It addresses itself to important issues concerning how the SAI is run and organised. The key aspects
of the domain are based on organisational planning processes and their implementation, thus
integrating both strategic and operational levels of the organisation. Included in the domain are
issues relating to leadership and direction, strategic planning, annual operational planning,
organisation of the SAI, internal control system, use of resources and code of ethics and its
monitoring.
The key assessment issues under this domain seeks to establish whether the head of SAI and senior
management demonstrate visionary, exemplary and strategic leadership based on ethical and
professional behaviour(s). At the organisational level the assessment focuses on whether the SAI has
efficient and effective strategic and operational planning systems anchored in robust monitoring and
reporting mechanisms. In relation to the promotion of credibility and integrity the assessment if the
SAI has developed and implemented a Code of Ethics and established effective integrity
management control systems. Finally, it assesses the level of robust planning and effective use of
assets mechanisms and infrastructure manned by professional administrative support services
5.2 SAI Assessment
The average aggregate scoring of this domain is presented in Figure 9. The overall picture from this
domain shows that only a few SAIs have been able to achieve the established level with 23% (6) of
the SAIs who responded on level three and above. This is one percentage point lower when
compared with 2014 which had 24% of the SAIs at this level.
It is significant to note that about 77% (20 out of 26) of the SAIs are at level 2.5 and above. This
demonstrates that while there is still a small number of SAIs at level 3 and above there are a large
number of SAIs moving towards level 3 in terms of development.

AFROSAI-E Transversal Activity Report for the year 2015
30
Figure 9: SAI comparisons on Organisation and Management domain (2013 figures were used for Angola)
In figure 9 it can be observed that 23% (6) of the SAIs are still below level 2.5 in terms of organisation
and management domain with SAI Gambia almost reaching 2.5 score at 2.48. Key issues that attract
attention under this domain include strategic and operational planning and implementation,
integrity management control systems and the establishment of performance audit and IT functions.
The details will now be discussed under each identified issue area.
5.2.1 Strategic and Operational Planning
Strategic and operational planning, execution, monitoring and evaluation are fundamental in
ensuring organisational effectiveness. SAIs are expected to establish dynamic strategic and
operational plans to ensure efficient and effective achievement of their goals and objectives. The
assessment scores of SAIs on selected questions regarding strategic and operational plans are shown
in figure 10.
Figure 10: How SAIs responded to key questions on strategic and operational planning
0.00
0.50
1.00
1.50
2.00
2.50
3.00
3.50
4.00
4.50
5.00A
ngo
la
Bo
tsw
ana
Erit
rea
Eth
iop
ia
Gam
bia
Gh
ana
Ken
ya
Leso
tho
Lib
eri
a
Mal
awi
Mau
riti
us
Mo
zam
biq
ue
Nam
ibia
Nig
eria
Rw
and
a
Seyc
hel
les
Sier
ra L
eon
e
Som
alia
Sou
th A
fric
a
Sou
th S
ud
an
Sud
an
Swaz
ilan
d
Tan
zan
ia
Uga
nd
a
Zam
bia
Zim
bab
we
Leve
l 2015 SAI Comparison on Organisation & Management
SAI
96%
72%
76%
72%
4%
28%
24%
28%
0% 20% 40% 60% 80% 100% 120%
The SAI has developed and implemented astrategic plan to strengthen its institutional
environment.
The SAI has developed and implemented amonitoring and evaluation mechanism on
the achievement of strategic goals and…
The SAI has developed and implemented anannual operational plan based on its
strategic plan.
The SAI has implemented a system formonitoring and evaluation of the annual
operational plan.
Level 2 or below
Level 3 or above

31 AFROSAI-E Transversal Activity Report for the year 2015
In figure 10, 96 % of respondents scored level 3 and above on strategic plans having being developed
and implemented. But when asked about the implementation of monitoring and evaluation
mechanism for the achievement of strategic goals and objective the percentage goes down to 72%
meaning 28% of SAIs are still to establish these types of mechanisms.
Similarly, figure 10 shows that 76% of SAIs who responded have developed and implemented
operational plans but the numbers decrease to 72% when asked about the establishment of
monitoring and evaluation mechanisms to measure the achievement of operational plans.
However, the general findings of quality assurance support visits indicated that while the majority of
SAIs have strategic and operational plans in place there are still challenges and gaps when it comes
to content quality, implementation and reporting on the achievement of the strategic and
operational plan goals and objectives. In addition, the establishment of robust strategic and
operational planning processes that ensures both leadership and staff ownership within SAIs still
require attention. These internal processes are critical for the effective formulation and execution of
SAI strategic and operational plans.
5.2.2 Integrity and Code of Ethics
Integrity is a fundamental value that every SAI is expected to embrace and demonstrate at both
individual and organisational level. The new draft ISSAI 30 now requires both the SAI and individual
staff members to conduct themselves in an ethical manner. Figure 11 shows how SAIs scored the
questions relating to MIS and time recording, ethics and integrity.
Figure 11: SAIs responses to key questions on MIS, time recording, ethics and integrity management
The results of the four questions in figure 11 relating to management information systems, time
recording, code of ethic and the use of integrity management tools and interventions like IntoSAINT,
show that although a majority of SAIs have a documented Code of Ethics (96% of SAIs scored level 3
and above) there are still gaps when it comes to operationalising the same documents (72% of SAIs
scored level 2 and below). A majority of SAIs indicated that they have no documented management
40%
36%
96%
28%
60%
64%
4%
72%
0% 20% 40% 60% 80% 100% 120%
The SAI has implemented a managementinformation system (MIS).
The SAI has implemented a time recordingsystem, which enables reporting on costs of
staff.
The SAI has code of ethics which sets outethical rules or codes, policies and practices
that are aligned with ISSAI 30
The SAI has assessed its vulnerability andresilience to integrity violations through the
use of the IntoSAINT or a similar tool.
Level 2 or below
Level 3 or above

AFROSAI-E Transversal Activity Report for the year 2015
32
information systems (60% of SAIs scored level 2 and below) that would ensure effective monitoring
of their operations.
Further, a majority of SAIs (64%
scored level 2 and below) have
not yet fully implemented time
recording systems that would
enable them to capture and
measure the costs of their staff.
For instance, a significant
number of SAIs commented
that there were implementation
challenges when it comes to the
establishment and monitoring
of the implementation of time
recording systems. It appears
there may be capacity and
resource constraints in a
significant number of SAIs that
would require technical and funding support to assist SAIs in operationalising their time recording
systems.
5.2.3 Performance Audit Function
According to ISSAI 100, one of the main types of audits under the different mandates of SAIs is
performance auditing. In accordance with the elements in the Management and Organisation
domain of the ICBF, SAI who have a mandate for
carrying out performance audits are encouraged
to set-up and support a stand-alone function to
ensure the existence of adequate capacity for
carrying the audits.
Out of the 25 SAIs who responded to the
questionnaire, 20 SAIs scored a level 3 and
above; meaning their performance audit units
are made up of at least ten performance
auditors per SAI. The remaining five SAIs who
responded scored level 2 and below; meaning
the SAIs do not have a performance audit
function in place. Some of the reasons submitted included capacity and resources constraints as
shown in Box 6. It appears capacity and resource constraints may be a contributing factor when it
comes to the expansion of performance auditing in the region. As of 31 December 2015 the number
of trained performance auditors in the region totalled 518 in comparison to 497 in 2014. A detailed
analysis will be provided in the general section of this report.

33 AFROSAI-E Transversal Activity Report for the year 2015
5.2.4 IT Support Function
In the era of dynamic technology advancements and change, SAIs are forever confronted by the
need to automate their work processes and systems in order to remain relevant. This brings with it
both strategic and business risks that require constant attention by each SAI. Figure 12 shows some
of the questions and responses SAIs were asked to score themselves against.
Figure 12: How SAIs responded to key questions on SAI IT function and related IT issues
As shown in figure 12, 52% of SAIs have established an IT support function with responsibilities that
include hardware, software and network support and; is staffed with at least one IT person for every
30 members of staff in the SAI. The other 48%
are yet to establish the IT support function.
On the other hand, 44% indicated that they
had developed and implemented an ICT
strategy that is aligned to the SAI strategy.
Further, 52% of the SAIs still need to conduct
risk assessments of their information assets
and put in place mitigation measures to
secure the assets.
Box 7 contain free comments from the SAIs
and indicates capacity constraints and
general government policy as the main
factors preventing them from developing
and implementing IT strategies that are aligned to their strategies. However, based on the general
findings from quality support visits, it is argued that if technical capacity is available, SAIs can still
establish IT strategies that are aligned to government policy as is expected.
52%
44%
48%
48%
56%
52%
0% 10% 20% 30% 40% 50% 60%
The SAI has an IT support function with atleast one (1) IT person for every 30 staff
members and has functions for hardware,software, and network support.
The SAI has developed and implemented anICT strategy which is aligned to the SAI
strategy.
The SAI has conducted a risk assessment ofits information assets and taken safeguards
to secure them.
Level 2 or below
Level 3 or above

AFROSAI-E Transversal Activity Report for the year 2015
34
CHAPTER 6: HUMAN RESOURCES DOMAIN
6.1 Introduction
The domain Human Resources covers items of importance for the management and development of
the SAI mangers and staff. Specifically the domain comprises aspects that include a Human Resource
and professional development policy, development plans, management of personnel, training
aspects with monitoring and evaluation mechanism, ethical considerations and capacity to train
staff. Critical is the need to monitor, evaluate and report on the effectiveness of HR policies and
procedures within the SAI.
6.2 SAI Assessment
It is accepted that the most important resource in any organisation is human capital. It follows that a
strategically positioned HR function enables a SAI to anticipate change and leverage audit capacity
for greater efficiency and effectiveness. As such the SAI’s HR policies, strategies and procedures
should address key issues such as; “… recruitment … professional development … promotion …
retention… [as well as emphasise for all audit and non-audit assignments the need for hiring] …
personnel with suitable qualifications, developing and training employees … [by accepting the need
for all SAI staff to] … maintain professional competence through continuing professional
development”. An overview on how SAIs scored themselves in this domain in 2015 is presented in
figure 11.
Figure 13: SAI comparisons on Human Resources domain (2013 figures were used for Angola)
As can been seen in figure 13 only 15% (4 SAIs) scored domain averages of level 3 and above and
68% (17 SAIs) averaging scores of level 2.5 and above. This can partly be explained by the absence of
administrative independence in most SAIs as explained in chapter 4. Secondly, a majority of SAIs still
fall under the public service and as such the policy development process is slow and bureaucratic.
0.000.501.001.502.002.503.003.504.004.505.00
Ango
la
Bots
wan
a
Eritr
ea
Eth
iopia
Gam
bia
Gha
na
Kenya
Le
so
tho
Lib
eria
Ma
law
i
Ma
uritius
Mo
za
mb
iqu
e
Na
mib
ia
Nig
eri
a
Rw
anda
Seych
elle
s
Sie
rra L
eon
e
Som
alia
South
Afr
ica
South
Suda
n
Suda
n
Sw
azila
nd
Tan
za
nia
Ug
and
a
Zam
bia
Zim
ba
bw
e
Lev
el
2015 SAI Comparison on Human Resources
SAI

35 AFROSAI-E Transversal Activity Report for the year 2015
Thirdly, because of the absence of financial independence in a majority of SAIs in the region, the
recruitment and retention of qualified and experienced staff is constrained. The following discussion
of scores on selected questions would help in identifying capacity gaps in the SAI.
6.2.1 Human Strategy
When asked whether the SAIs had developed and implemented HR strategies that are aligned to
their organisational strategies, 48% of the SAIs scored level 3 and above while the other 52% scored
level 2 and below as shown in figure 12. This shows that a significant number of SAIs are yet to
develop and implement HR strategies that are aligned to their strategic plans and directions. SAI
responses on the implementation of HR annual development plans were similar, with 48% of the
scoring level 2 and below, indicating that the annual plans are not aligned to the strategic and
operational plans objectives.
Figure 12: SAIs scoring on key questions related to HR strategy development, implementation and
monitoring
Further, in figure 12 the SAIs (80% scoring level of 2 and below) indicated that the monitoring and
evaluation of the different aspects of the HR development strategy and reporting on the same was
not being comprehensively
covered. This may be due
to capacity gaps as well as
constraints imposed by
the public sector
environment under which
a majority of the SAIs fall.
Some of the comments
are captured in Box 8.
48%
20%
52%
52%
80%
48%
0% 10% 20% 30% 40% 50% 60% 70% 80% 90%
The SAI has developed and implemented ahuman resource strategy that is aligned and
linked to its strategic plan.
The SAI has implemented a system tomonitor and evaluate the different aspects of
the human resource development strategythe results of which are included in the SAIs
annual performance report.
The SAIs annual HR development plan isimplemented and aligned with the strategic
plan and/or relevant operational plan.
Level 2 or below
Level 3 or above

AFROSAI-E Transversal Activity Report for the year 2015
36
According to the general findings of the quality assurance supports visits; another important factor
may be the shortage of qualified and competent HR practitioners who possess the requisite
knowledge and skills necessary to manage the HR function and coordinate the development of HR
strategies and annual plans that are aligned to SAI strategies. On another dimension it should be
acknowledged that traditionally, HR officers seconded from the public service to the SAI were
personnel management cadres that were only responsible for staffing and pay roll issues and
excluded the key strategic issues that would position the HR function as a strategic partner in the
achievement of the SAI’s strategic goals and objectives. As can be observed from the comments in
Box 8, SAI HR strategies were addressed at the level of the whole public service and not at the SAI
level. The disadvantage of this arrangement is that HR strategic issues, that are that fundamental to
the achievement of the SAI strategy, would not be closely monitored in time.
6.2.1 SAI Performance Management Systems
Another important dimension of HR is setting up performance management systems at both the
individual and organisational levels. In this section focus is on individual levels as part of the HR
function including but not limited to recruitment, placement, appraisals, development, retention
and others. For example, SAIs were asked to score on whether they had implemented approved HR
policies and procedures including an approved performance management system. Their responses
revealed capacity gaps within the HR functions and the organisational levels.
Figure 14: How SAIs scored key questions on SAI HR policies and Performance management Systems
Figure 14 shows that while the establishment of approved HR policies had 64% of SAIs scoring level 3
and above; the development
and implementation of effective
performance management
systems reflected a decrease. It
appears a significant number of
SAIs (48% on level 2 and below)
indicated absence of approved
performance management
systems.
While a significant number of
SAIs fall under the civil/public
service it is argued that the
64%
52%
36%
48%
0% 10% 20% 30% 40% 50% 60% 70%
The SAI has implemented approved HRpolicies and procedures
The SAI has implemented approvedperformance management systems.
Level 2 or below
Level 3 or above

37 AFROSAI-E Transversal Activity Report for the year 2015
establishment of robust performance management systems are a prerequisite for high productivity
at both the individual and organisational levels. It is encouraging to note that in their comments
(refer to Box 9) SAIs indicated the need for linking the appraisal of staff not only for development
purposes but for rewarding and sanctioning high and poor performance, respectively.
6.2.3 Training and Development of Staff
Another important function for the HR function is training and development of staff. SAIs are
expected to develop and implement development programs such as induction of new staff, on-the-
job training programs, professionalisation programs, development programs for all managers and
leadership teams and other interventions that would prepare the SAIs for current and future
performance challenges.
Figure 15: How SAIs scored key questions on SAI HR Training and development functions
As shown in figure 15, 72% of the SAIs scored level 3 and above indicating that they had developed
and implemented training programs for new staff while the remaining SAIs indicated that they were
at different levels of implementing consistent induction programs for new entrants. Second,
programs for on-the-job training for all staff appear to show that a sizeable number of SAIs
acknowledge the need to improve the documentation and delivery of the same. 32% of the SAIs
scored level 2 and below indicating that the programs are not yet documented or are at various
levels of development and still to be implemented.
Third, a significant number of SAIs (48% scoring level 2 and below) indicated that they do not have
their own established management and or leadership development program(s). Some of the smaller
SAIs commented that they rely on regional training programs for developing their staff and
managers.
72%
52%
68%
76%
40%
28%
48%
32%
24%
60%
0% 20% 40% 60% 80%
The SAI has implemented training programs for newentrants.
The SAI has a specific MDP and leadershipdevelopment programfor all its management staff in
place
The SAI has implemented on-the-job trainingprograms for all its staff.
The SAI has implemented training programs to assistits staff to obtain professional qualifications in
relevant disciplines.
The SAI has implemented a system to monitor andevaluate the different aspects of training and results
achieved.
Level 2 or below
Level 3 or above

AFROSAI-E Transversal Activity Report for the year 2015
38
Fourth, a majority of SAIs (76%
with a score of level 3 and
above) indicated that they have
established some programs for
their staff to obtain professional
qualifications. However, little is
known about the impact of such
programs because of lack of
effective monitoring and
evaluation systems for the
different aspects of the training
programs as shown by 60% of
SAIs scoring level 2 and below
when asked about the
monitoring and evaluation of
various training programs.
Abridged comments by SAIs are
shown in Box 10. Based on the
comments, the main challenge
related to training programs is
capacity limitations including
financial constraints. Another
challenge is the issue of smaller SAIs that cannot afford to sustain the rollout of such programs. The
region may need to find new ways of assisting small SAIs to build their HR capacities to train and
equip their SAIs with the requisite technical and soft skills.
39 AFROSAI-E Transversal Activity Report for the year 2015
CHAPTER 7: AUDIT STANDARDS AND METHODOLOGY
7.1 Introduction
The Audit Standards and Methodology domain covers the audit process from the planning stage to
reporting. Certain elements in this domain are closely linked to other domains such as Human
Resources and Communication and Stakeholder Management. Key ISSAIs under this domain include
ISSAI 100 to 400 as well as audit process guidance standards at level 4 of the ISSAI framework. In this
domain SAIs are expected to develop, implement and maintain appropriate up-to-date ISSAI
compliant audit tools like manuals, guidelines, and templates in accordance with their mandate and
national legislative requirements. The implementation of these same tools should be facilitated by
robust policies, systems and processes that recognise the importance of delivering quality audit
services.
This domain’s key elements include: SAIs development and implementation of overall annual audit
plans and; development, implementation and maintenance of audit manuals that are aligned and
compliant with international standards. The audit tools are expected to be linked to training
programs that are reviewed and updated regularly. Further, some of the additional elements in this
domain include quality control measures and quality assurance, audit techniques such as electronic
working papers and Computer Assisted Audit Techniques (CAATS) and the implementation of the
audit communication strategies during the whole audit process.
7.2 Assessment of the Domain
Figure 15 shows how the 25 SAIs scored the various questions that fall under this domain. While in
2014 only 4 (16%) SAI were at level 3 and above in this domain, it is encouraging to observe that in
2015 10 (40%) SAIs were at level 3 and above. Considering scores of level 2.5 and above, there was
still a significant movement from 12 (48%) SAIs in 2014 compared with 18 (72%) in 2015.
The improvement is an acknowledgement of the great work undertaken by the region in building the
capacity of its members to achieve level 3 and above. The region has come a long way in terms of
implementing ISSAIs and the provision of ISSAI compliant audit services. However, there is still more
challenges that call for the attention of the region in terms of establishing robust quality control
management systems in SAIs; monitoring the effectiveness of the same systems and; computerising
the audit processes to including use of CAATs. More so, SAIs are expected to consider the issue of
professionalisation of their staff. In order to build and maintain sustainable capacity, members SAIs
are expected to take the professionalisation route as well as to continue to develop their managers
and leaders who will drive the necessary change agenda.

AFROSAI-E Transversal Activity Report for the year 2015
40
Figure 15: SAI comparisons on Audit Standards and Methodology domain (2013 figures were used for
Angola)
Figure 15 shows that 8 (32%) SAIs scored averages of below level 2.5. The majority of these eight
SAIs are of medium to small sizes. As earlier discussed in chapter 6 of this report, small to medium
SAIs in the region are confronted with capacity and funding challenges. Consequently, these SAIs
may not develop to level 3 and above in the next few years if more technical and funding assistance
are not received from the region or from bilateral arrangements.
The concept of overall audit planning linked to strategic and operational goals and objectives has
now taken root in the region. A majority of SAIs indicated that they had approved overall audit plans
and that the implementation was being effectively monitored and evaluated each year. Figure 16
shows that the majority of SAIs are at the established level when it comes to overall annual planning.
For example, 79% of the SAIs indicated that they had annual plans for all types of audits and that
they are based on risk assessments (83%) and; aligned to the strategic and operational plans (79%).
However, an area that requires improvement appears to be in the alignment of the risk-based
methodology to the allocation of available resources. For instance, there were 29% of respondents
who indicated that they are yet to fully align the allocation of the available resources based on the
results of the risk assessments.
0.00
0.50
1.00
1.50
2.00
2.50
3.00
3.50
4.00
4.50
5.00
Ango
la
Bots
wan
a
Eritr
ea
Eth
iopia
Gam
bia
Gha
na
Kenya
Le
so
tho
Lib
eria
Ma
law
i
Ma
uritius
Mo
za
mb
iqu
e
Na
mib
ia
Nig
eri
a
Rw
anda
Seych
elle
s
Sie
rra L
eon
e
Som
alia
South
Afr
ica
South
Suda
n
Suda
n
Sw
azila
nd
Tan
za
nia
Ug
and
a
Zam
bia
Zim
ba
bw
e
Le
vel
2015 SAI Comparison on Audit Standards & Methodology
SAI

41 AFROSAI-E Transversal Activity Report for the year 2015
Figure 16: How SAIs scored key questions on overall annual audit planning for all types of audits
It appears the process, the content and products of overall annual audit planning requires
continuous improvement by the SAIs. The paragraphs that follow addresses how the SAIs scored the
different questions within the domain and specifically in the areas of regularity auditing,
performance auditing and IT audits.
7.2.1 Regularity Auditing
In the region, regularity auditing is the mainstay of all audit services being provided by the SAIs. The
capacity of SAIs to conduct regularity audits has been increasing in the last 10 years. For instance in
2015 from the 25 SAIs who responded to the questionnaire there were 9359 regularity auditors in
the region (9483 if the Angola’s 2014 figure of 124 are included) compared to 9268 in 2014. There is
an incremental growth of slightly above 200 auditors of which 37 were from Somalia the region’s
newest member. During 2015 a total of 9177 regularity audits were completed out a planned total of
11 070 audits. Of these planned audits about 1417 audits could not be completed in the prescribed
timeframes due to late submission of accounts and financial constraints faced by the SAIs.
The implementation of ISSAIs received considerable attention in the last 10 years and the flagship
has been the customisation of the Regularity Audit Manual (RAM) by the majority of SAIs and the
development of other relevant guidance tools. Several respondents indicated in their comments the
importance of the RAM to the provision of audit services that are compliant with the ISSAIs.
Figure 17 shows how the SAIs scored selected key questions on quality control and assurance. On all
five questions the majority of SAI scored level 3 and above indicating that the process and tools for
carrying out regularity audits are ISSAI compliant. For example, all SAIs indicated that their RAMs are
ISSAI compliant. Comments submitted indicate that this was attributed to the support provided by
AFROSAI-E through its RAM and related training interventions that enables SAI to remain ISSAI
compliant.
79%
83%
79%
71%
21%
17%
21%
29%
0% 50% 100%
The SAI has an overall annual audit plan for all typesof its audits covering assessments of constraints,
current issues and stakeholder expectations.
The SAI has an overall annual audit plan coveringrisk assessments for prioritising audits.
The SAI has implemented an overall audit planningprocess covering all types of audits that is aligned to
its operational and strategic planning objectives.
In its overall annual audit plan the SAI has identifiedall its auditees in a register and follows a risk based
methodology in the allocation of its availableresources.
Level 2 andbelow
Level 3 andabove

AFROSAI-E Transversal Activity Report for the year 2015
42
Figure 17: How SAIs scored key questions on Regularity Audit quality control measures
However, a significant number of SAIs are yet to establish quality assurance units to monitor
compliance with their policies, processes, structures and systems. In some SAI these functions are
carried out by appointed teams. For example, the quality control monitoring tools like the Quality
Assurance Handbook / guidelines of significant number of SAIs (25% with scores of level 2 and
below) are still to be reviewed and updated to be in-line with the requirements of the newly
endorsed ISSAIs. This is corroborated by the quality assurance support visits general conclusions that
SAIs need to strengthen the monitoring elements of their quality control measures.
7.2.2 Performance Auditing
In the region, the development of performance auditing is relatively new but it has been growing
steadily over the last 10 years. In 2015 there were 518 performance auditors (the 3 auditors from
Somalia were included for the first time) in the region compared with 497 in 2014. It would appear
that 18 performance auditors were added to the region during the year 2015. However, as at 31
December 2015 the regional records show that more than 700 performance auditors had gone
through the AFROSAI-E three-module performance auditing course. It is of concern to observe that a
number of SAIs still do not deploy their staff to carry out performance audits after going through
training but instead redeploys them to carry out regularity auditing. For example, in their written
comments a few SAIs commented that although they had trained auditors who had gone through
the three-module course; the staff concerned were not deployed to the performance audit function
due to other competing priorities.
When it comes to productivity; in 2015 the 25 SAIs who responded indicated that 115 performance
audit reports were completed and signed off. As at December 2015 a total of 1105 performance
audit reports have been produced in the region since performance auditing was introduced. The
production time period for performance audits ranged from 6 to 24 months. For the year 2015 the
100%
79%
79%
75%
71%
0%
21%
21%
25%
29%
0% 50% 100% 150%
The SAIs' regularity audit manual is compliant withISSAIs and other good practices.
The SAI has implemented a quality controlmanagement system for regularity audit based on
ISSAIs and other good practices.
The SAIs' QCMS for RA clearly define the roles andresponsibilities of all team players.
The SAIs' QC measures for regularity audit clearlyspecifies the requirements for the planning of typesof reviews, including nature, scope and frequency.
The SAIs' quality assurance handbook/guideline forregularity audit is compliant with ISSAIs.
Level 2 andbelow
Level 3 andabove

43 AFROSAI-E Transversal Activity Report for the year 2015
average production time for performance audits was 11.4 months from the time of starting a pre-
study to publication. This improvement in the average production times may be due to the influence
of the best performance audit competition funded by the Swedish National Audit Office, which limits
entrants to reports that are produced within 12 months.
Further, a majority of the SAIs now possess the legal power to submit their reports to Parliament,
either directly or through other appropriate bodies. An analysis of key issues relating to quality
control measures reveals important information about the quality of performance audits in the
region (refer to figure 18).
Figure 18: How SAIs scored key questions on quality control measures for performance auditing
As stated in chapter 4, the majority of SAIs have explicit legal mandates (87% of SAIs scored level 3
and above) to carry out performance audits as shown in figure 18. The majority of the SAIs (63%
scoring level 3 and above) indicated that they have established adequate quality control
management systems for performance auditing. However, there are key areas that require
immediate attention: (1) the need to set up appropriate systems for pre-issuance reviews (58% of
the SAs scoring level 2 and below). This may possibly be attributed to structural challenges and
capacity limitations in terms of experienced staff that small SAIs in particular experience when it
comes to setting up independent pre-issuance review functions. (2) The need to have ISSAI
compliant guidelines and tools in place. Again, given that PA is relatively new in the region; the
majority of SAIs are dependent on the Secretariat to develop the needed tools.
The above is corroborated by the SAI comments which indicated that they would customise the ISSAI
compliant AFROSAI-E Performance Audit Manual to ensure that their manuals are up to date and
compliant. SAIs also commented that greater reliance is on the AFROSAI-E performance audit
training courses to build their technical capacity. This is corroborated by the general findings of the
87%
63%
67%
63%
58%
42%
13%
37%
33%
37%
42%
58%
0% 50% 100%
The SAI is empowered to audit the economy,efficiency and effectiveness of government orpublic entities operations (performance audit).
The SAI has implemented a quality controlmanagement system for performance audit based
on ISSAIs and other good practices.
The SAIs QC management systems for PA clearlydefine the roles and responsibilities of all key team
playes.
The SAI QC monitoring measures for PA clearlyspecifies the requirements for planning, types ofreviews, including nature, scope and frequency.
The SAI has implemented QC control measuresfor PA when it comes to the need for a QAhandbook/guideline complying with ISSAIs.
The SAI has implemented an appropriate systemwith pre-issuance reviews of all performance audit
reports.
Level 2and below(No)
Level 3and above(Yes)

AFROSAI-E Transversal Activity Report for the year 2015
44
quality assurance support visits. Details of these interventions are contained in the Integrated
Annual Report.
7.2.3 IT Auditing
IT audit is a relatively new thematic audit in the region. At the end of 2015 there were 243 IT
auditors in the region as compared to 221 in 2014. However, 128 of the IT auditors in the region are
based in SAI South Africa. Out of the 25 SAIs who responded to the questionnaire, 18 of the SAIs
indicated that they audited IFMIS and mostly at the level of general controls reviews. Figure 19
shows the different platforms on which different governments’ integrated financial management
system (IFMIS) run.
Figure 19: The different platforms used by governments in the region
The majority of governments in the region (52%) use oracle as their platform of choice followed by
Epicor and SAP. The balance of 24% is made up different platforms either bought from the market or
developed internally.
There is also an increase in both the number of audits carried out in the region which is in tandem
with the increased number of IT auditors. In 2015 the SAIs produced 901 IT audits of which 710 of
them were from South Africa followed by Mauritius with 100 audits. The balance of 91 was shared
by twelve countries, namely; Botswana, Eritrea, Ghana, Kenya, Nigeria, Rwanda, Sudan, Seychelles,
Uganda, Zambia and Zimbabwe. This shows that the capacity to carry out IT audits is still limited in
the region. This is shown in detail in figure 20.
52%
12%
12%
24%
Platform of IFMIS
ORACLE
EPICOR
SAP
OTHER

45 AFROSAI-E Transversal Activity Report for the year 2015
Figure 20: How SAIs scored key questions on IT/IS audit development
Figure 20 shows that there are capacity gaps in the region when it comes to the development of IT
/IS audits. For example, when asked to score whether the SAI has developed IT/IS audit strategies for
their IT/IS audits only 37% score level 3 and above, indicating that the majority of SAIs do not have
approved IT/IS audit strategies to drive the development of the same audits in the SAI. Secondly,
while SAIs are expected to carry out audits on at least 75% of the number of national IT/IS systems
for them to be at level 3, it is concerning to note that only 8% of SAIs indicated that they satisfy this
criterion. Thirdly, only 21% of SAIs indicated that they have integrated IT/IS audits when carrying out
either regularity or performance audits. Further, the majority of SAIs in the region are yet to
automate their audit processes like using CAATs (only 46% scored level 3 and above) and the use of
electronic working papers (only 42% scoring level 3 and above).
Comments provided by the SAIs indicated that lack of funding and technical skills are limiting factors
when it comes to the development of IT audit in the region. This is shown by the low number of IT
auditors employed by SAIs, limited IT infrastructure and equipment and shortage of technical IT
audit skills in the region as discussed in the organisation and management domain chapter. In
conclusion while governments in the region have invested in automating their integrated financial
management systems, it has not been augmented by an equal level of development and
strengthening of the capacity to audit these systems.
37%
42%
46%
21%
8%
63%
63%
58%
54%
79%
92%
37%
0% 20% 40% 60% 80% 100%
The SAI has developed an Information Technology(IT)/Information Systems (IS) audit strategy for its
IT/IS audits.
The SAI is using tools such as electronic workingpapers.
The SAI is using tools such as computer assistedaudit techniques (CAATS).
The SAI's integrated IT/IS audit in performanceaudit and regularity audit are all preceded by an
IT/IS audit of the systems producing financialstatements.
The SAI's annual IT/IS audit coverage in % of thenumber of national IS systems.
The SAI has audited the main integrated financialmanagement expenditure and revenue systems of
the country.
Level 2 andbelow
Level 3 andabove
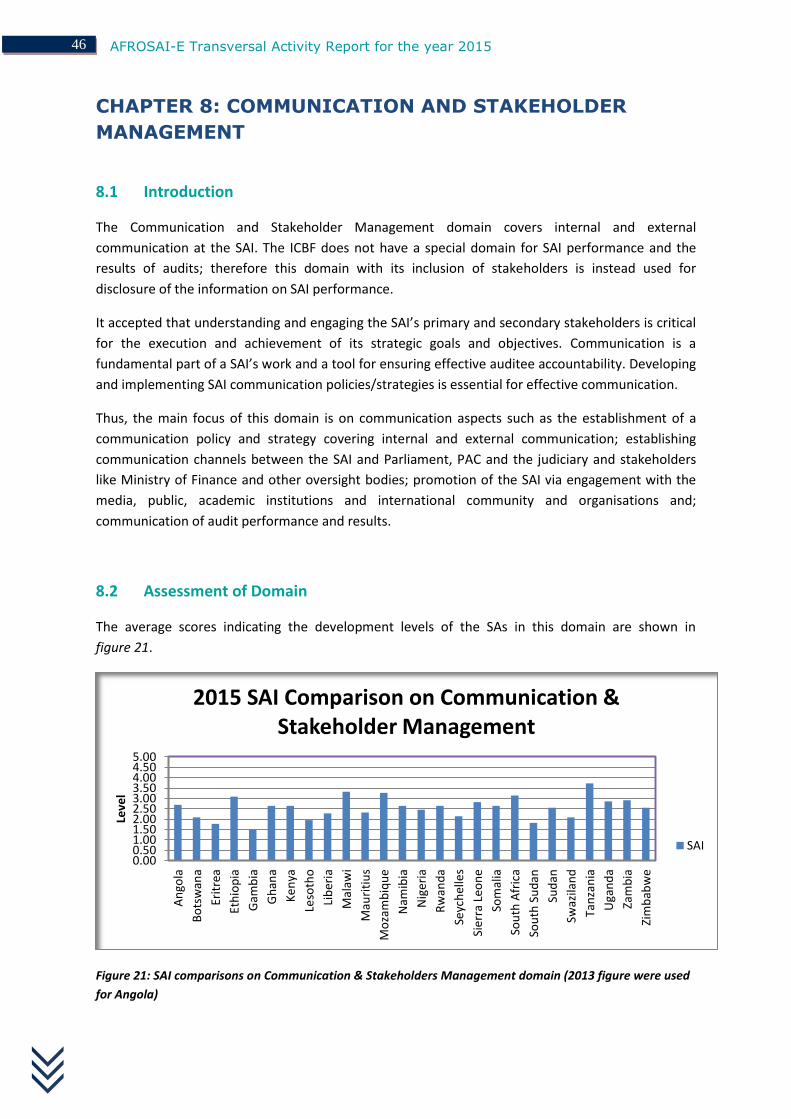
AFROSAI-E Transversal Activity Report for the year 2015
46
CHAPTER 8: COMMUNICATION AND STAKEHOLDER
MANAGEMENT
8.1 Introduction
The Communication and Stakeholder Management domain covers internal and external
communication at the SAI. The ICBF does not have a special domain for SAI performance and the
results of audits; therefore this domain with its inclusion of stakeholders is instead used for
disclosure of the information on SAI performance.
It accepted that understanding and engaging the SAI’s primary and secondary stakeholders is critical
for the execution and achievement of its strategic goals and objectives. Communication is a
fundamental part of a SAI’s work and a tool for ensuring effective auditee accountability. Developing
and implementing SAI communication policies/strategies is essential for effective communication.
Thus, the main focus of this domain is on communication aspects such as the establishment of a
communication policy and strategy covering internal and external communication; establishing
communication channels between the SAI and Parliament, PAC and the judiciary and stakeholders
like Ministry of Finance and other oversight bodies; promotion of the SAI via engagement with the
media, public, academic institutions and international community and organisations and;
communication of audit performance and results.
8.2 Assessment of Domain
The average scores indicating the development levels of the SAs in this domain are shown in
figure 21.
Figure 21: SAI comparisons on Communication & Stakeholders Management domain (2013 figure were used
for Angola)
0.000.501.001.502.002.503.003.504.004.505.00
An
gola
Bo
tsw
ana
Erit
rea
Eth
iop
ia
Gam
bia
Gh
ana
Ke
nya
Leso
tho
Lib
eria
Mal
awi
Mau
riti
us
Mo
zam
biq
ue
Nam
ibia
Nig
eri
a
Rw
and
a
Seyc
hel
les
Sie
rra
Leo
ne
Som
alia
Sou
th A
fric
a
Sou
th S
ud
an
Sud
an
Swaz
ilan
d
Tan
zan
ia
Uga
nd
a
Zam
bia
Zim
bab
we
Leve
l
2015 SAI Comparison on Communication & Stakeholder Management
SAI

47 AFROSAI-E Transversal Activity Report for the year 2015
As shown in Figure 21, there are five SAI that scored averages of level 3 and above namely; Ethiopia,
Malawi, Mozambique, Sierra Leone, South Africa and Tanzania. Compared with 2014 average figures
there is an increase of one SAI from four to the current 2015 figure of five. If and average score of
level of 2.5 and above is used the number increases to 16 (64%) as compared to 13 SAIs (52%) in
2014.
It appears this movement may have been the result of such interventions like the SAI-PAC program
that is currently being rolled out, the annual communication workshops as well as roll-out of
management development programmes (MDP). The challenge is to keep a sustained momentum of
the development to support the majority of SAIs to move to level 3 and above. However, based on
the results of quality assurance support visits there may have been instances of SAIs over scoring in
some of the questions. This is corroborated by comments given by the SAIs where they indicated
that there are still major capacity and funding challenges in the SAIs that threaten the development
of their communication functions.
Possibilities of over-rating in this domain appear to be significant especially in the area of internal
communication and stakeholder engagement. It appears there is a mistaken view that
communication just happens without the SAI being strategic and deliberate about it. The discussion
below that show how the SAIs responded to some key questions in the areas of implementing SAI
communication strategies, SAI-PAC relations and stakeholder engagement is revealing.
8.2.1 Communication Policies and Strategy
Under domain five, SAIs are expected to develop and implement communication policies based and
aligned to the requirements and guidance of the ISSAIs and in particular ISSAI 10, 12 and 20 within
the contexts of their national legislative regimes and environments. Second, SAIs are expected to
develop and implement communication strategies that are linked to their strategic plans and
strategies. Figure 22 illustrates the extent to which SAIs in the region have developed and
implemented communication policies and strategies to drive and demonstrate their value and
benefits to their particular societies.
Figure 22: How SAIs scored key questions on Communication policy and strategy
As can be seen in Figure 22, 68% of SAIs indicated that they are yet to develop and implement
communication policies and strategies that are based on their legal framework, vision, mission and
32%
48%
44%
68%
52%
56%
0% 10% 20% 30% 40% 50% 60% 70% 80%
The SAI has implemented a communicationpolicy and strategy based on the SAIs legal
framework, vision, mission and values.
The SAI has implemented a communicationpolicy and strategy based on stakeholder
analysis (including prioritisation).
The SAI has implemented a communicationpolicy and strategy based on a SWOT, gap
or similar analysis considerations.
Level 2 orbelowLevel 3 orabove

AFROSAI-E Transversal Activity Report for the year 2015
48
values. Only 32% of the SAIs scored level 3 and above. A majority of the SAIs (52%) indicated that
their policies and strategies are yet to be based and linked to the analysis of stakeholder needs and
expectations. It appears the majority of policies and strategies (56% of SAIs scoring level 2 and
below) are yet to develop frameworks for the drawing up their policies and strategies.
8.2.2 Internal Communication
Despite the fact that a majority of SAIs in figure 22 indicated gaps in the development of coherent
communication policies and strategies that are linked and compliant to standards, national legal
requirements and SAI strategies; it is surprising that SAIs went on to indicate that in the majority of
cases their internal communication strategies, processes and structures were above level 3 and
above of the ICBF. This is illustrated in Figure 23.
Figure 23: How SAIs scored key questions on Internal Communication
Figure 23 shows the number of SAIs that indicated they have implemented internal communication
strategies that are aligned to their vision, mission and objectives. 76% of the SAIs scored level 3 and
above indicating that internal communications were based on SAI strategy. Further, 80% of the SAIs
indicated that internal communication strategies being implemented included effective information
sharing practices, websites, meetings and newsletters. The SAI internal communication were also
said to be aligned to the SAI vision, mission and objectives (76% of the SAIs indicating level 3 and
above). This appears to be contradicting what Figure 22 illustrated where the SAIs indicated that
their policies and strategies were not linked to their legal framework, vision, mission and values.
Similarly, figure 24 shows that stakeholders needs and expectation were not usually taken into
consideration in the development of policies and strategies.
It appears in answering the questions the SAIs did not link the development and implementation of
communication policies and strategies to a critical component of the communication processes of a
SAI, which is internal communication. Or it may be a mistaken assumption by SAIs that internal
communication just happens automatically. Further, results from quality assurance support visits
68%
76%
80%
32%
23%
20%
0% 10% 20% 30% 40% 50% 60% 70% 80% 90%
The SAI is monitoring the implementation ofthe communication policy/strategy and
reporting on the outcomes in the annualperformance report.Â
The SAI has implemented an internalcommunication strategy including alignment of
staff to SAIs vision, mission and objectives.
The SAI has implemented an internalcommunication strategy including effective
information sharing practices, websites,meetings, newsletters.
Level 2 orbelow
Level 3 orabove
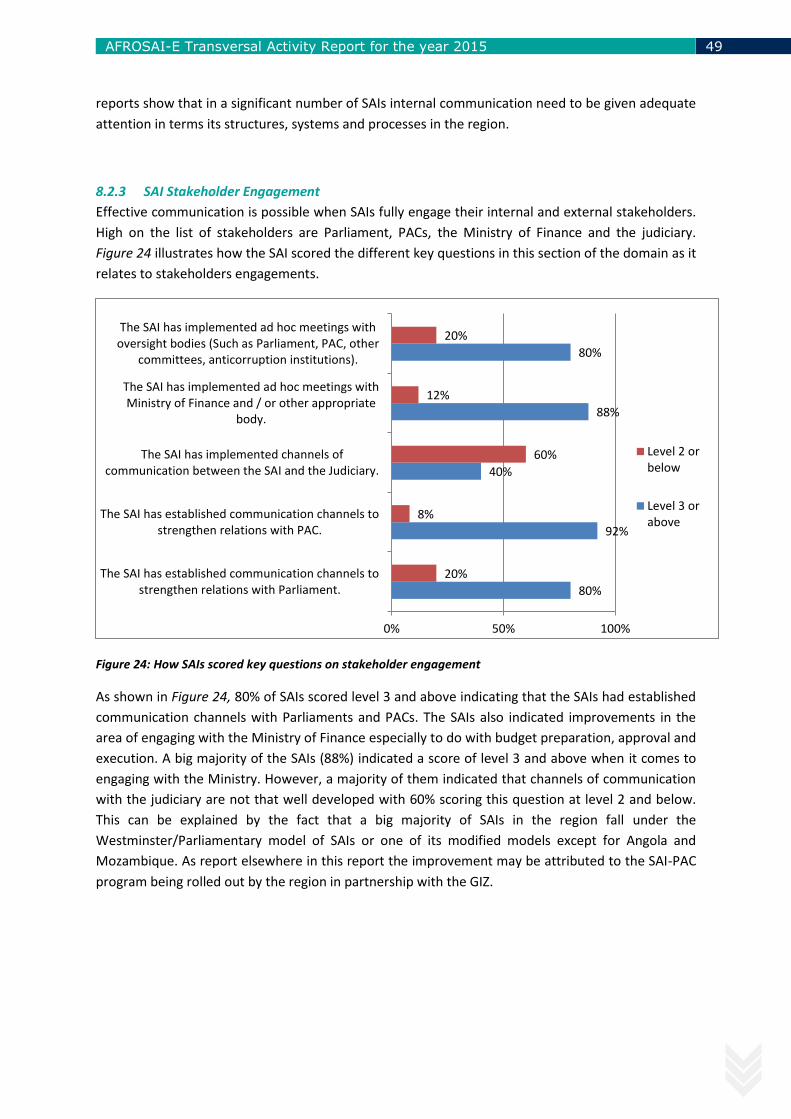
49 AFROSAI-E Transversal Activity Report for the year 2015
reports show that in a significant number of SAIs internal communication need to be given adequate
attention in terms its structures, systems and processes in the region.
8.2.3 SAI Stakeholder Engagement
Effective communication is possible when SAIs fully engage their internal and external stakeholders.
High on the list of stakeholders are Parliament, PACs, the Ministry of Finance and the judiciary.
Figure 24 illustrates how the SAI scored the different key questions in this section of the domain as it
relates to stakeholders engagements.
Figure 24: How SAIs scored key questions on stakeholder engagement
As shown in Figure 24, 80% of SAIs scored level 3 and above indicating that the SAIs had established
communication channels with Parliaments and PACs. The SAIs also indicated improvements in the
area of engaging with the Ministry of Finance especially to do with budget preparation, approval and
execution. A big majority of the SAIs (88%) indicated a score of level 3 and above when it comes to
engaging with the Ministry. However, a majority of them indicated that channels of communication
with the judiciary are not that well developed with 60% scoring this question at level 2 and below.
This can be explained by the fact that a big majority of SAIs in the region fall under the
Westminster/Parliamentary model of SAIs or one of its modified models except for Angola and
Mozambique. As report elsewhere in this report the improvement may be attributed to the SAI-PAC
program being rolled out by the region in partnership with the GIZ.
80%
92%
40%
88%
80%
20%
8%
60%
12%
20%
0% 50% 100%
The SAI has established communication channels tostrengthen relations with Parliament.
The SAI has established communication channels tostrengthen relations with PAC.
The SAI has implemented channels ofcommunication between the SAI and the Judiciary.
The SAI has implemented ad hoc meetings withMinistry of Finance and / or other appropriate
body.
The SAI has implemented ad hoc meetings withoversight bodies (Such as Parliament, PAC, other
committees, anticorruption institutions).
Level 2 orbelow
Level 3 orabove

AFROSAI-E Transversal Activity Report for the year 2015
50
CHAPTER 9: GENERAL PERFORMANCE OF THE SAIs
9.1 Introduction
The 2015 questionnaire also included general questions about the organisation and structure of the
SAI. This was done to help explain the performance of the SAI as well assists in explaining their
development levels. General question were not used to score the domains but were significant
explaining the environments of the SAIs.
9.2 SDGs and AU AGENDA 2063 Goals
In the 2015 questionnaire, questions were also included to gather baseline information on new focus
areas as well as productivity levels of the SAIs. This year there are two new focus areas, namely the
capacity to audit and report to the National Assembly or another appropriate body on the adequacy
and comprehensiveness of the government systems and process aimed at the achievement of the
Sustainable Development Goals (SDGs) as well as the African Union Agenda 2063 goals. These areas
became important given the adoption of UN SDGs in 2015 which are the successors of the MDGs.
The main challenges listed by SAIs include lack of technical capacity and funding constraints. Table 5
shows a summary of comments provided by the SAIs.
Table 5: Capacity of SAIs to audit SDGs and AU AGENDA 2016 Goals
Country Capacity to audit Social Development Goals
(SDGs)
Capacity to audit AGENDA 2063 Goals
Botswana Once the organisational review exercise is
completed, the Office will have information
on staffing requirements to deliver on its
mandate. Currently the Executive avail
resources on the basis of justified needs
Once the organisational review exercise is
completed, the Office will have information
on staffing requirements to deliver on its
mandate. Currently the Executive avail
resources on the basis of justified needs
Eritrea Apart from the result of regularity audit
reports, the SAI does not report on the
adequacy and comprehensiveness of
government systems
The SAI works to encourage a culture of
transparency and accountability which is
compatible with the AU agenda 2063 goals
Malawi Yes that is in place we are now working on
including them in our audit manuals. No
audits yet.
We are working on the systems and to be
implemented soon. No audits yet.
Namibia OAG has conducted some research on the
area of Performance Information as to the
viability of implementation thereof. However,
none specifically conducted to measure
achievements of SDGs (NDP) goals.
OAG has conducted some research on the
area of Performance Information as to the
viability of implementation thereof. No
Organisational review similar to that for AU
yet planned or executed.

51 AFROSAI-E Transversal Activity Report for the year 2015
Swaziland The SAI audits and reports on the adequacy
and comprehensiveness of government
systems and processes aimed at the
achievement of SDGs.
No audits yet
Seychelles The Constitution and the Auditor General Act,
2010 duly provide for these but no audit yet
The Constitution and the Auditor General
Act, 2010 duly provide for these but no audit
yet
South Africa Yes the AGSA is adequately capacitated. Yes we have adequate capacity
Uganda There is need to disaggregate audit findings
along the SDG to establish the level of
achievement under the various goals. No
specific SDG audits being done due to
capacity constraints
Audit themes are aimed at service delivery
to citizens which is in line with the national
resource utilization.
Zambia There is financial as well as human resource
capacity constraints.
There is financial as well as human resource
capacity constraints.
9.3 Timeliness and audit coverage
Timeliness in the submission of audit reports and overall audit coverage are critical factors that
define the quality of audit services. However, timing for tabling audit reports is not only dependent
on the date of submission of the reports to the legislature but it also paints a picture of how well the
public financial management system works as well as how the SAI itself works.
As such, the parameters have been expanded to ensure compatibility with the requirements of PEFA
indicators on the scope, nature and follow-up of external audits4. According to the PEFA indicator
number 26, level C, twelve months is the limit for audit reports to be submitted to the legislature. In
the region we have used a benchmark of 6 months as several legislative frameworks in the region
now require the finalisation and submission of such reports to be within 6 months after the financial
year end. In figure 3, 56% of the SAIs that indicated that they now submit their regularity audit
reports within six months of financial year end while for performance auditing it is ad hoc.
In comparison to 2013 and 2014, there have been incremental improvements observed in the
timeliness of submission of audits reports by SAIs in the region. For example, for the year 2014, 80%
of regularity audits were completed and finalised within the prescribed legal timeframes against
non-compliance of 20%. In 2015 for regularity audits there has been an improvement in that 83%
(9177 out of 11070 audits) were completed within the statutory timeframes. While for performance
audits the time period ranged from 2 months to 12 months after signing off by the head of SAI. The
reasons for non-compliance were various, for instance; shortage of staff and funds, non-submission
of the financial statements by auditees, late submission by the same and others.
4 The indicator was developed by PEFA, a multi-agency partnership sponsored by among others the World
Bank, the European Commission and DFID; PEFA – Public Expenditure and Financial Accountability

AFROSAI-E Transversal Activity Report for the year 2015
52
3
11
3
4
3
100%
99-75%
75-50%
49-25%
Less 25%
0 5 10 15
Box 11: 2015 Percentage of National Budget Covered by RA Audits
Number ofSAIs
Box 11 shows the percentage of national
budgets that were audited in 2015. Eleven
SAIs indicated that their audit coverage is 99-
75%, three SAIs indicated 100% and three
SAIs indicated 75-50% of the national
budgets. On the other hand, SAIs also
attributed the reasons for not attaining 100%
audit coverage to budgetary and staff
capacity constraints and; SAI capacity
limitations as well limiting legislative
instruments.
9.4 Size and composition of audit staff
The size of the audit staff complement and its composition are of interest as reported elsewhere in
this report. The financial/regularity auditors by far make up the largest part of the audit staff, at
approximately 93%. The performance auditor complement is just 5% while IT auditors constitute
about 2%. Figure 25 shows the total number of audit staff in the 25 SAIs that responded including
the 127 figure from the 2014 Angola figures. Over the years there has been a sizeable increase in the
number of regularity, performance and IT auditors across the region.
Figure 25: The numbers of auditors in the region in selected disciplines (including 2014 Angola figures)
The capacity to carry out financial audits by SAIs in the region is increasing as shown by the increase
in the number of regularity/financial auditors (see figure 25). Compared with other disciplines,
performance auditing comes out a distant second even though there is a steady increase in the
9483
518 254
0
1000
2000
3000
4000
5000
6000
7000
8000
9000
10000
Regularity(Financial)Auditors
PerformanceAuditors
IT/IS auditors
Number of Auditors in the Region
Number of Auditors

53 AFROSAI-E Transversal Activity Report for the year 2015
number of performance auditors in the region. The same is true when it comes to the number of
IT/IS auditors. It is acknowledged that currently and in the foreseeable future the region’s number
one priority would remain carrying out regularity audits. This can be explained by the explicit
mandate of a big majority of SAIs to carry out such audits annually while for performance and IT
audits the mandates are less explicit. This may take some time before the numbers begin to even
out between the audit disciplines. Encouraging though, is the fact that there is steady movement in
terms of building the numbers of performance and IT auditors
9.5 Financial resourcing of SAIs
Another important indicator for SAI development is in the area of financial resourcing. As reported
elsewhere in this report; financial resourcing of the majority of SAIs in the region is still dependent
on government budgetary allocations with the executive wielding influence on the size, amount, and
classification of their budgets. In the 2015 questionnaire, the majority of SAIs commented that
funding constraints were significant in terms of limiting the extent to which their capacity building
initiatives would be sustainable. A significant number of the SAIs acknowledged their dependence on
donor support to build and sustain their audit capacities, especially when it comes to their training
budgets.
Out of the 25 SAIs that responded, two SAIs namely Eritrea and Mozambique did not submit
information about their own as well as their countries’ national budget figures. Angola did not
respond to the questionnaire. The total national budget figures for the remaining 23 countries
amounted to about USD 225 billion and the total SAI budgets in the same countries amounted to
USD 406 million representing an average of 0.18% against the total country budget figures. It should
be noted the 2015 total regional budget figures were materially lower than the 2014 figures in terms
of US dollar figures. For example, in 2014 the total regional SAI budgets figure was US$595.8 million
for 20 SAIs but surprisingly the total figure for 2015 decreased to USD 406 million. The different
exchange rates dates used by the SAIs to convert their local currency figures to arrive at the US
dollar budget figures and depreciation of regional currencies may explain the discrepancies.
Secondly, there might be errors in the figures submitted by some SAIs which were not correctly
verified at the point of submission to the Secretariat. The Secretariat will carry out its own
verification to authenticate the budget figures in the 2016 report.
The region seeks to establish how a well-resourced SAI should be funded. As such the comparison of
national budget versus SAI budget figures was seen as a good rough indicator to determine the
extent to which SAIs in the region are resourced. The aim is to develop an approximate indicator of
what a well-resourced SAI should have in terms of their budget against the national budget. SAI
South Africa was then used a good practice indicator because it is generally accepted that when
compared with other SAIs in the region the SAI is well developed and resourced. In 2015 SAI South
Africa’s budget ratio against their national budget was 0.21% (refer to Table 6). Based on the
assumption made above it is submitted here that 0.21% is the ratio to be used for the regional
benchmark for the year 2015. However, it should be noted that a significant number of SAIs who
scored higher percentages also commented that the higher rates were due to once-off budgetary
items. Table 6 shows the SAIs’ budgets as percentages of their national budgets.
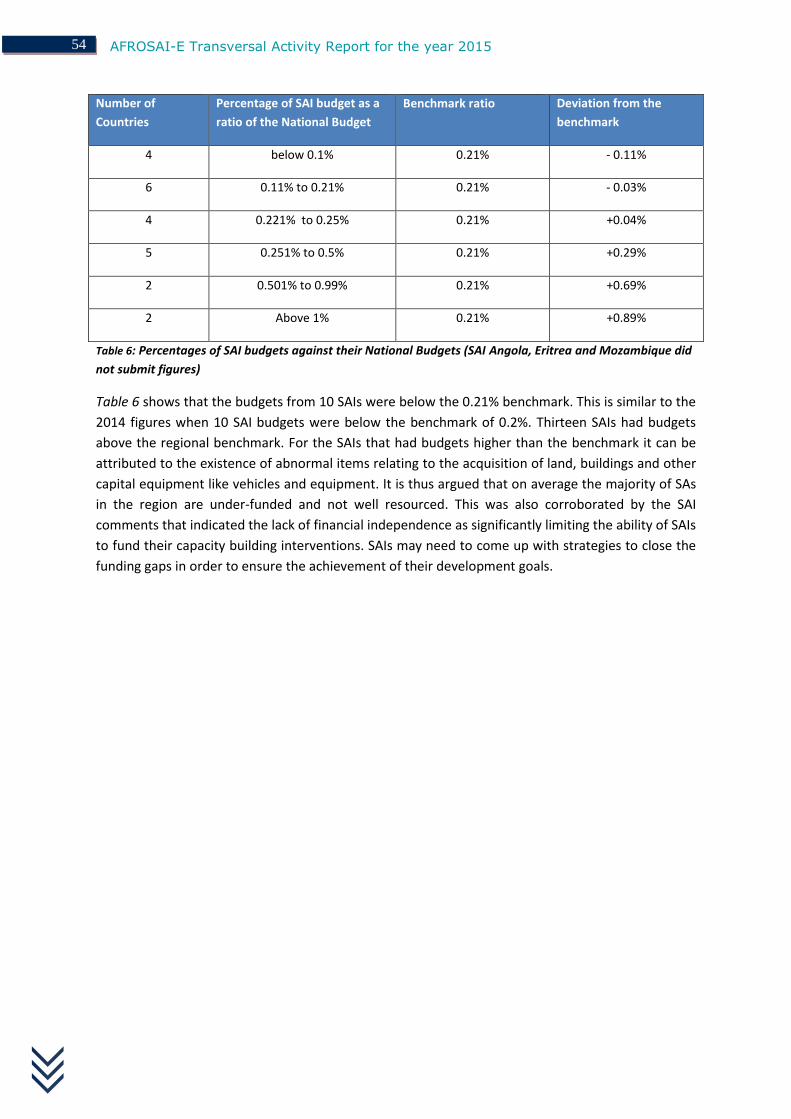
AFROSAI-E Transversal Activity Report for the year 2015
54
Number of
Countries
Percentage of SAI budget as a
ratio of the National Budget
Benchmark ratio Deviation from the
benchmark
4 below 0.1% 0.21% - 0.11%
6 0.11% to 0.21% 0.21% - 0.03%
4 0.221% to 0.25% 0.21% +0.04%
5 0.251% to 0.5% 0.21% +0.29%
2 0.501% to 0.99% 0.21% +0.69%
2 Above 1% 0.21% +0.89%
Table 6: Percentages of SAI budgets against their National Budgets (SAI Angola, Eritrea and Mozambique did
not submit figures)
Table 6 shows that the budgets from 10 SAIs were below the 0.21% benchmark. This is similar to the
2014 figures when 10 SAI budgets were below the benchmark of 0.2%. Thirteen SAIs had budgets
above the regional benchmark. For the SAIs that had budgets higher than the benchmark it can be
attributed to the existence of abnormal items relating to the acquisition of land, buildings and other
capital equipment like vehicles and equipment. It is thus argued that on average the majority of SAs
in the region are under-funded and not well resourced. This was also corroborated by the SAI
comments that indicated the lack of financial independence as significantly limiting the ability of SAIs
to fund their capacity building interventions. SAIs may need to come up with strategies to close the
funding gaps in order to ensure the achievement of their development goals.
55 AFROSAI-E Transversal Activity Report for the year 2015
CHAPTER 10: CONCLUSIONS
10.1 Summary
The ICBF covers the different elements that have to be taken into consideration when establishing
and developing an effective SAI. The framework is divided into five domains, which all have a
number of elements and five development levels. There are two main tools that are used to
measure the development levels of member SAIs, namely; the quality assurance model which is used
when carrying out quality assurance support visits at least 2-3 years cycle per SAI and the annual
self-assessment questionnaire.
The self-assessment questionnaire which is annually sent out to the member SAIs covers the
different domains of the ICBF. The results of the self-assessment questionnaire are compiled in the
transversal activity report. It should be noted that when compiling the report some of the elements
have been highlighted and others have been left out. The objective is to analyse and discuss in more
detail the key outstanding issues observed in this year’s survey, so as to provide a clearer picture of
areas that still need more attention in the region in future.
In this year’s report the results generally show that the responses are stabilising. This in turn shows
that the self-awareness of the situation is also interpreted in a more consistent way between the
years, which is good. However, there are still some areas; though few, where SAIs over rated
themselves, especially in the area of Organisation and Management, Human Resources, Audit
Standards and Methodology as well as some areas in the Communication and Stakeholder
Management domains.
10.2 Progress during the year
The self-assessment results of 2013 and 2014 revealed that in the work of SAIs there were weak
linkages between the strategic and the operational/business planning levels. The results of this year
show that the gaps have been narrowed down. However, there are still some gaps identified when it
comes to the existence of appropriate legal frameworks and operationalising the same. For instance,
in the domain of Independence and Legal Framework of SAIs, the weak link has been observed to be
in the slow progress in operationalising the legal framework elements that include financial and
administrative independence, establishing robust follow-up of audit recommendations mechanisms
and annual performance reporting by SAIs.
Additional gaps include the existence of SAI policies and systems versus the actual implementation
of the same on the ground, as well as the development of ISSAI compliant audit tools and their
practical usage by the auditors and the organisations themselves. Key constraints that can be used
to explain the gaps are those relating to funding challenges and skills gaps to drive the policies,
strategies and deploy the tools. Secondly, absence of effective communication at both the
operational and strategic levels may also be a factor in the challenges being faced by SAIs when one
considers the development and implementation of policies, systems, processes and audit tools.

AFROSAI-E Transversal Activity Report for the year 2015
56
The different SAI scores leads to the raising of several different capacity building questions because
there are different dimensions and reasons that can be used to explain the differences. Although the
scores show that there are significant improvements recorded when compared with previous years
there are also development opportunities which could be exploited both at the SAI and regional
levels. These opportunities exist across all the five domains of the ICBF. In exploiting these
opportunities the principles enshrined in ‘The Values and Benefits of SAIs’ (ISSAI 12) are instructive.
It is acknowledged that building capacity of SAIs during this period of uncertainties as shown by
global financial crises, disruptive political change and demands by stakeholders, and operating
environments that are continuously being shaped by technological advancement; calls for adaptable
and visionary leadership as well as malleable organisations. In view of this, driving the development
of the region forward requires recognition of four important dimensions namely:
professionalisation of public sector auditing as a whole as well as accounting;
SAIs focusing on becoming credible voices for beneficial change;
Transforming the capacity of leadership into capability; and
Driving innovation and creativity.
10.2.1 Professionalisation of public sector Auditing
It has been shown in this report that when it comes to the execution of their mandates, member
SAIs are faced with technical auditing capacity and funding constraints. Small to medium sized SAIs
are the ones that are most exposed. In view of the drive towards ISSAI implementation by member
SAIs; professionalisation of public sector auditing can provide a long term solution to the skills
problems. The need for SAIs to pull resources to drive training of staff to create technically qualified
and accredited cadres cannot be overemphasised. While we have big SAIs in the region that are
driving their own professionalisation programs; small and medium sized SAIs may not have the
required capacity, at least in the short to the medium term. Secondly, SAI may need to influence
both the executive and legislative arms of government to embrace professionalisation of the public
sector as a strategy to improve service delivery. The report shows the need for an integrated
approach to the challenge of building auditing adequate capacity.
10.2.2 SAI becoming credible voice for beneficial change
ISSAI 12 – Value and Benefits of SAIs calls upon all SAIs to demonstrate their value to stakeholders.
Auditing is a form of communicating the extent to which auditees are transparent and accountable
to their funding sources for the resources committed to them in a defined financial or fiscal period.
The responsibilities of SAIs must then be to ensure that what they communicate is credible and adds
value to society. Communication of audit results needs to be timely to allow decision makers to
choose appropriate interventions for improved service delivery. The SAIs themselves are expected to
‘walk the talk’ if they are to be credible voices of change. Areas that require attention include
strengthening of SAI communication functions, systems, processes and structures.

57 AFROSAI-E Transversal Activity Report for the year 2015
10.2.3 Transforming leadership capacity to capability
Transformation of SAIs requires effective managerial leadership capacity to drive change and
provide direction in this era of economic, political and technological uncertainties and disruptive
change in the global environment. It follows that leadership and management development in SAIs
need to be treated as a strategic tool for addressing organisational challenges to achieve predefined
organisational goals and performance outcomes. Secondly, SAIs may need to take leadership
development as a channel for employee engagement and transformation of their work environment
to ensure sustainable individual and organisational development.
The existing capacity of managerial leadership may be enhanced if it is transformed into effective
capabilities through SAIs treating leadership and managerial development interventions as strategic
tools for driving the implementation of the ISSAIs. Pooling of resources by member SAIs to build
their capabilities may also be considered as an effective strategy.
10.2.4 Driving Innovation and Creativity
In the era of financial constraints and scarcity, innovation and creativity are essential to drive
sustainable audit service delivery by SAIs. In the region, all the governments of member SAIs have
automated their financial management systems as shown in this report. However, the capacity to
audit these systems is not growing tandem as shown by the low number IT/IS audits produced in the
region. The area of IT support and audit as shown in this report is lagging. Regularity and
performance audit itself need to be automated to be in line with current technologies in use by
service providers. It follows innovation and creativity is required in the areas of automating audit
processes, working papers and various SAI corporate services systems and processes.

AFROSAI-E Transversal Activity Report for the year 2015
58
APPENDICES

Appendix 1: Afrosai-E Institutional Capacity Building Framework (ICBF): A Generic Format of the Institutional Perspective
FIVE DOMAINS WITH ELEMENTS FOR ALL THE 5 LEVELS IN THE FRAMEWORK (ICBF)
INDEPENDENCE AND LEGAL FRAMEWORK ORGANISATION AND MANAGEMENT HUMAN RESOURCES AUDIT STANDARDS AND METHODOLOGY COMMUNICATION AND STAKEHOLDER
MANAGEMENT
INDEPENDENCE OF THE SAI
Appropriate and effective
constitutional/statutory/ legal
framework
Financial autonomy
Managerial and administrative
autonomy
Appropriate human, material and
monetary resources
INDEPENDENCE OF THE HEAD OF SAI AND
MEMBERS OF COLLEGIAL INSTITUTIONS
Security of tenure
Legal immunity in the normal
discharge of their duties
SUFFICIENTLY BROAD MANDATE
A broad mandate and full
discretion in the discharge of SAI
functions
LEADERSHIP AND DIRECTION
STRATEGIC PLANNING
ANNUAL OPERATIONAL PLANNING
ORGANISATION OF THE SAI
Organisational
development
Existence of a performance
audit function
Existence of an IS audit
function
Existence of an IT support
function
INTERNAL CONTROL SYSTEM
HUMAN RESOURCE AND
PROFESSIONAL DEVELOPMENT
POLICY
Including:
Recruitment
Remuneration
Performance
management system
Career development
Training
Staff welfare
Professional
development
Job rotation
Retaining
Exit
DEVELOPMENT PLANS
Aligned with:
Strategic plan
ANNUAL AUDIT PLAN
Covering:
Assessments of constraints
Current issues and stakeholder
expectations
Risk assessments in place for
prioritizing audit risk
Clear statement of audit
coverage
Activity plans for regularity and
performance audits
Addressing of backlogs
AUDIT MANUALS
Aligned to international
standards
Connected to a training program
Reviewed and updated regularly
QUALITY CONTROL MEASURES AND QUALITY
COMMUNICATION POLICY AND STRATEGY
COVERING INTERNAL AND EXTERNAL
COMMUNICATIONS
Based on:
Legal framework
Vision, mission and values
Stakeholder analysis
(including prioritization)
SWOT or similar analysis
Gap analysis considerations
CHANNELS OF COMMUNICATION
Between:
SAI and Parliament
PAC and Judiciary
AD HOC MEETINGS
With:

AFROSAI-E Transversal Activity Report for the year 2015
60
Direct submission of reports to
Parliament
Access to information
Discretion in selection of audit
issues
Freedom to decide on content,
timing of audit reports and to
publish and disseminate them
in line with International
standards
USE OF RESOURCES
A management information
system (MIS) tracking key
management information
A time recording system to
enable reporting of staff
costs
Annual operational plan
MANAGEMENT OF PERSONNEL
Recruitment
Development
Staff welfare
Performance appraisals
Retaining
Filling of vacant posts
Exit
ASSURANCE
SAI policy and procedures
Roles and responsibilities
Type of review specified and
planned, including nature, scope
and frequency
Implementation of a quality
assurance handbook or guidance
for full compliance to
international standards
Ministry of Finance and
oversight bodies
INTERNAL COMMUNICATION Including:
Alignment of staff to SAI’s vision,
mission, goals and objectives
Implementation of effective
information sharing practices
INDEPENDENCE AND LEGAL FRAMEWORK ORGANISATION AND MANAGEMENT HUMAN RESOURCES AUDIT STANDARDS AND METHODOLOGY COMMUNICATION AND STAKEHOLDER
MANAGEMENT
EFFECTIVE FOLLOW UP MECHANISM
at the SAI on its recommendations
SAIS REPORTING ON ITS OWN ACTIVITIES AND
USE OF RESOURCES
OVERSIGHT AND ACCOUNTABILITY
The Parliament or an oversight body
CODE OF ETHICS
and its monitoring
TRAINING ASPECTS WITH
MONITORING AND
EVALUATION MECHANISMS
For:
New entrants
Management
development
On the job training
Secondments to other
SAIs
Audit/accounting
QUALITY ASSURANCE PROCESSES
PERFORMED BY OTHERS
AUDIT IT-TECHNIQUES
Such as:
Electronic working papers
Computer assisted audit
techniques (CAATS)
IMPLEMENTATION OF THE SAI
PROMOTION OF THE SAI
Via:
Engagement with:
> Media
> The public
> Academic institutions
> International community and
Organisations
Use of effective information
sharing practices

61 AFROSAI-E Transversal Activity Report for the year 2015
appoints the SAI’s external auditors qualifications
Coaching and
mentoring process
CAPACITY TO TRAIN ITS STAFF
To:
use information
develop knowledge
develop skill
COMMUNICATION STRATEGY
for the audit process with the
auditees
COMMUNICATION
With:
Relevant experts
Professional bodies
Relevant journals
Internal audit
Other public sector audit
institutions
SAI REPORTING
Should include:
Follow up on previous
recommendations
Standard structure of reports,
user-friendly with materiality
considerations
AUDIT PERFORMANCE AND RESULTS
Such as:
Audit coverage of expenditure
Number of signed and issued or
published performance audit
reports
Number of/percentage of
performance auditors in relation
to total audit staff
Integration of IS audit in
regularity and performance
audit
Coverage of IS audit
Time for submission of the
annual audit report to
Parliament from the beginning
of the year
Time for implementation of
the recommendations
Key stakeholders view on the
benefit of the audit
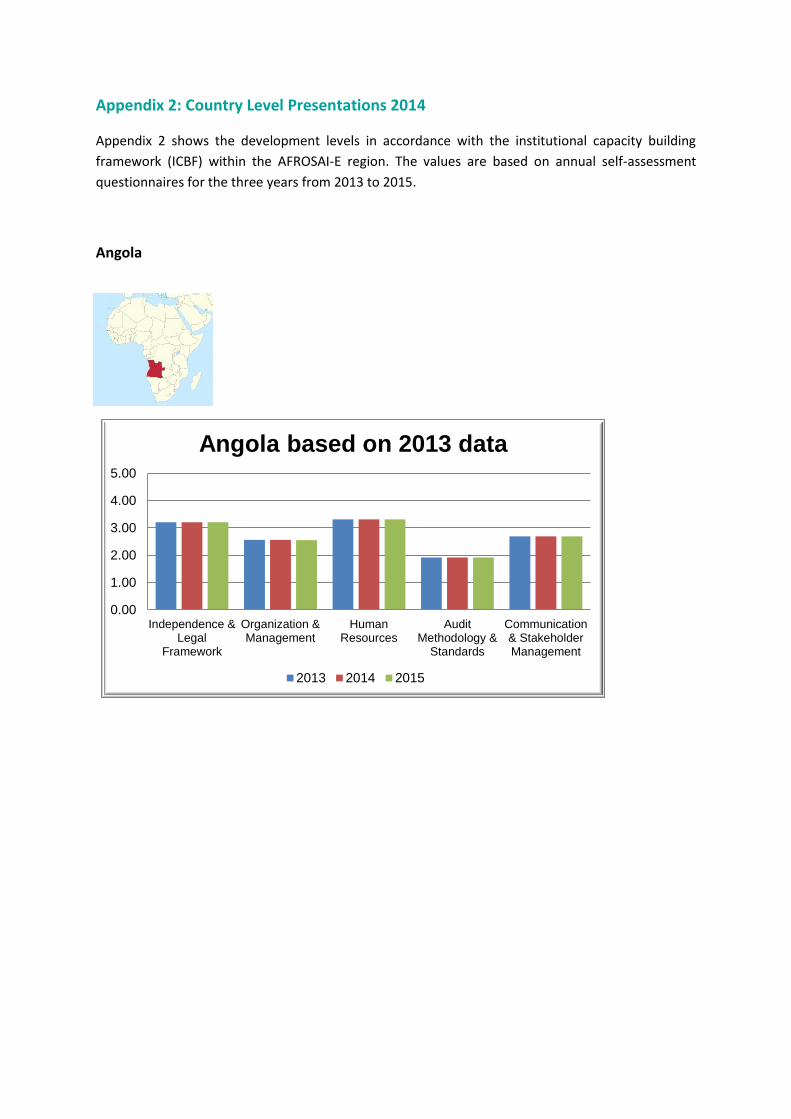
Appendix 2: Country Level Presentations 2014
Appendix 2 shows the development levels in accordance with the institutional capacity building
framework (ICBF) within the AFROSAI-E region. The values are based on annual self-assessment
questionnaires for the three years from 2013 to 2015.
Angola
0.00
1.00
2.00
3.00
4.00
5.00
Independence &Legal
Framework
Organization &Management
HumanResources
AuditMethodology &
Standards
Communication& StakeholderManagement
Angola based on 2013 data
2013 2014 2015

63 AFROSAI-E Transversal Activity Report for the year 2015
Botswana
Eritrea
0.00
1.00
2.00
3.00
4.00
5.00
Independence &Legal
Framework
Organization &Management
HumanResources
AuditMethodology &
Standards
Communication& StakeholderManagement
Botswana
2013 2014 2015
0.00
1.00
2.00
3.00
4.00
5.00
Independence &Legal
Framework
Organization &Management
HumanResources
AuditMethodology &
Standards
Communication& StakeholderManagement
Eritrea
2013 2014 2015

AFROSAI-E Transversal Activity Report for the year 2015
64
Ethiopia
The Gambia
0.00
1.00
2.00
3.00
4.00
5.00
Independence &Legal
Framework
Organization &Management
HumanResources
AuditMethodology &
Standards
Communication& StakeholderManagement
Ethiopia
2013 2014 2015
0.00
1.00
2.00
3.00
4.00
5.00
Independence &Legal
Framework
Organization &Management
HumanResources
AuditMethodology &
Standards
Communication& StakeholderManagement
The Gambia
2013 2014 2015

65 AFROSAI-E Transversal Activity Report for the year 2015
Ghana
Kenya
0.00
1.00
2.00
3.00
4.00
5.00
Independence& Legal
Framework
Organization &Management
HumanResources
AuditMethodology &
Standards
Communication& StakeholderManagement
Ghana
2013 2014 2015
0.00
1.00
2.00
3.00
4.00
5.00
Independence& Legal
Framework
Organization &Management
HumanResources
AuditMethodology &
Standards
Communication& StakeholderManagement
Kenya
2013 2014 2015

AFROSAI-E Transversal Activity Report for the year 2015
66
Lesotho
Liberia
0.00
1.00
2.00
3.00
4.00
5.00
Independence &Legal
Framework
Organization &Management
HumanResources
AuditMethodology &
Standards
Communication& StakeholderManagement
Lesotho
2013 2014 2015
0.00
1.00
2.00
3.00
4.00
5.00
Independence& Legal
Framework
Organization &Management
HumanResources
AuditMethodology &
Standards
Communication& StakeholderManagement
Liberia
2013 2014 2015

67 AFROSAI-E Transversal Activity Report for the year 2015
Malawi
Mauritius
0.00
1.00
2.00
3.00
4.00
5.00
Independence& Legal
Framework
Organization &Management
HumanResources
AuditMethodology &
Standards
Communication& StakeholderManagement
Malawi
2013 2014 2015
0.00
1.00
2.00
3.00
4.00
5.00
Independence &Legal
Framework
Organization &Management
HumanResources
AuditMethodology &
Standards
Communication& StakeholderManagement
Mauritius
2013 2014 2015

AFROSAI-E Transversal Activity Report for the year 2015
68
Mozambique
Namibia
0.00
1.00
2.00
3.00
4.00
5.00
Independence &Legal
Framework
Organization &Management
HumanResources
AuditMethodology &
Standards
Communication& StakeholderManagement
Mozambique
2013 2014 2015
0.00
1.00
2.00
3.00
4.00
5.00
Independence& Legal
Framework
Organization &Management
HumanResources
AuditMethodology &
Standards
Communication& StakeholderManagement
Namibia
2013 2014 2015
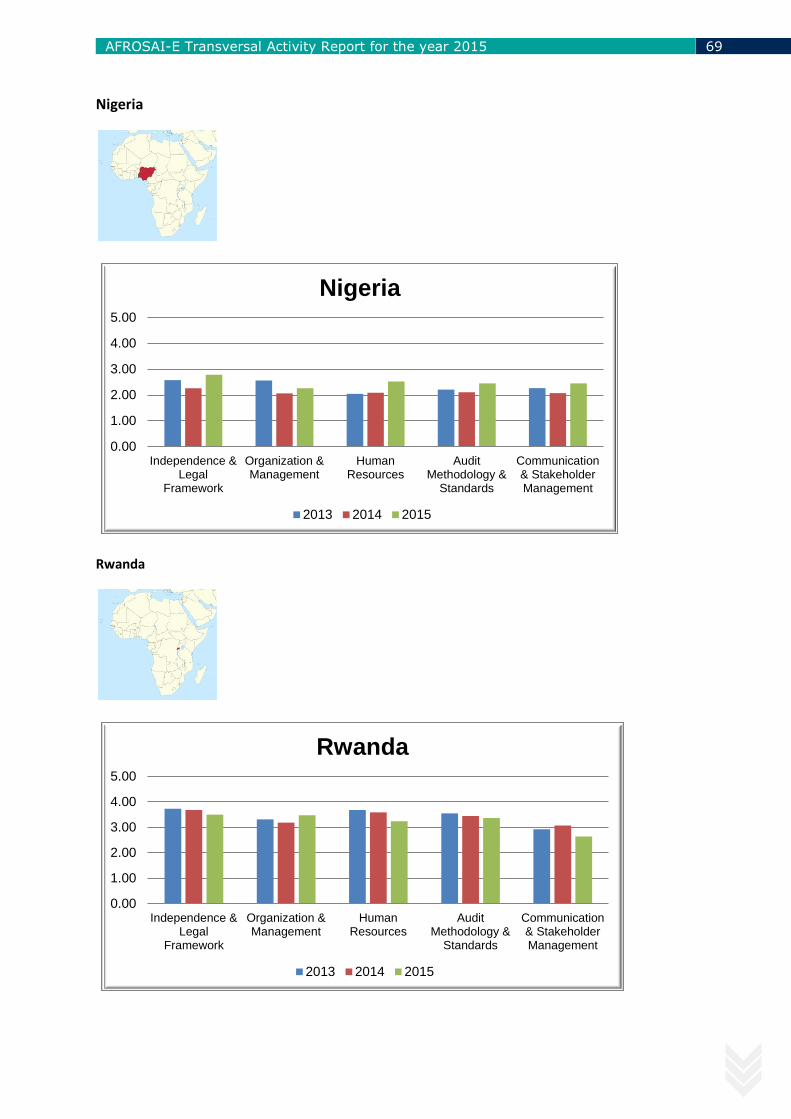
69 AFROSAI-E Transversal Activity Report for the year 2015
Nigeria
Rwanda
0.00
1.00
2.00
3.00
4.00
5.00
Independence &Legal
Framework
Organization &Management
HumanResources
AuditMethodology &
Standards
Communication& StakeholderManagement
Nigeria
2013 2014 2015
0.00
1.00
2.00
3.00
4.00
5.00
Independence &Legal
Framework
Organization &Management
HumanResources
AuditMethodology &
Standards
Communication& StakeholderManagement
Rwanda
2013 2014 2015
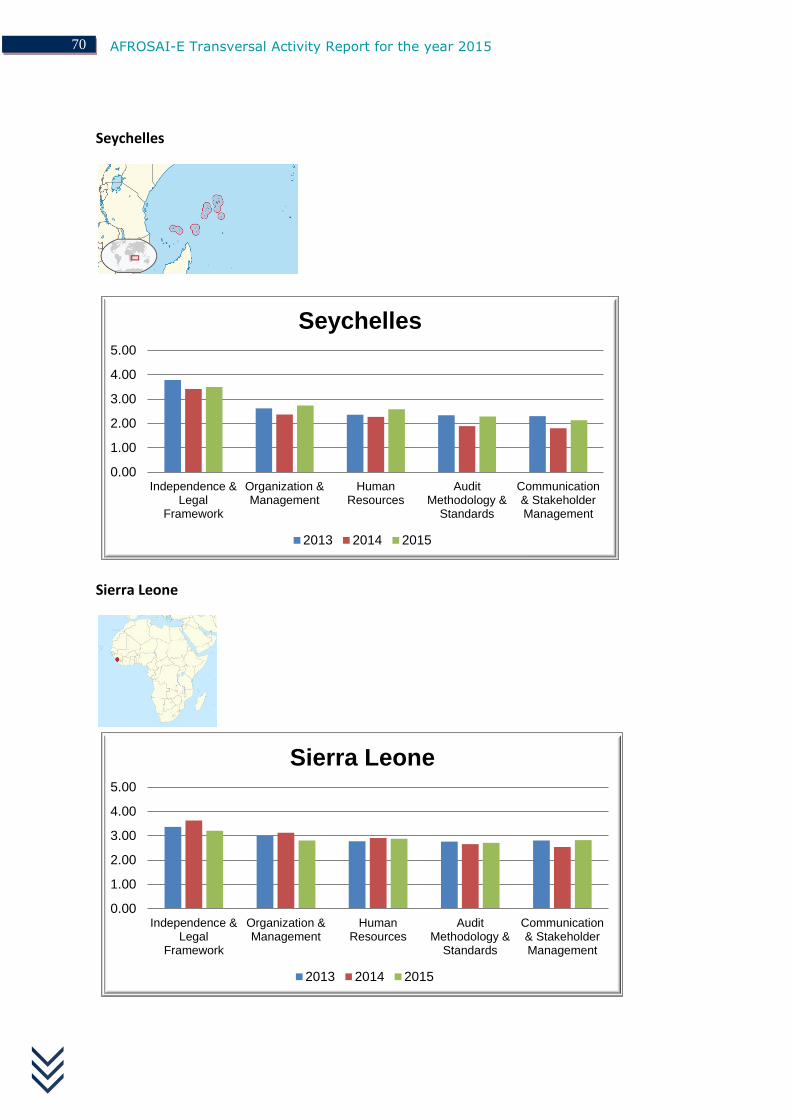
AFROSAI-E Transversal Activity Report for the year 2015
70
Seychelles
Sierra Leone
0.00
1.00
2.00
3.00
4.00
5.00
Independence &Legal
Framework
Organization &Management
HumanResources
AuditMethodology &
Standards
Communication& StakeholderManagement
Seychelles
2013 2014 2015
0.00
1.00
2.00
3.00
4.00
5.00
Independence &Legal
Framework
Organization &Management
HumanResources
AuditMethodology &
Standards
Communication& StakeholderManagement
Sierra Leone
2013 2014 2015

71 AFROSAI-E Transversal Activity Report for the year 2015
Somalia
South Africa
0
1
2
3
4
5
Independence &Legal
Framework
Organization &Management
HumanResources
AuditMethodology &
Standards
Communication& StakeholderManagement
Somalia
2015
0.00
1.00
2.00
3.00
4.00
5.00
Independence& Legal
Framework
Organization &Management
HumanResources
AuditMethodology &
Standards
Communication& StakeholderManagement
South Africa
2013 2014 2015

AFROSAI-E Transversal Activity Report for the year 2015
72
South Sudan
Sudan
0.00
1.00
2.00
3.00
4.00
5.00
Independence& Legal
Framework
Organization &Management
HumanResources
AuditMethodology &
Standards
Communication& StakeholderManagement
South Sudan
2013 2014 2015
0.00
1.00
2.00
3.00
4.00
5.00
Independence& Legal
Framework
Organization &Management
HumanResources
AuditMethodology &
Standards
Communication& StakeholderManagement
Sudan
2014
2015
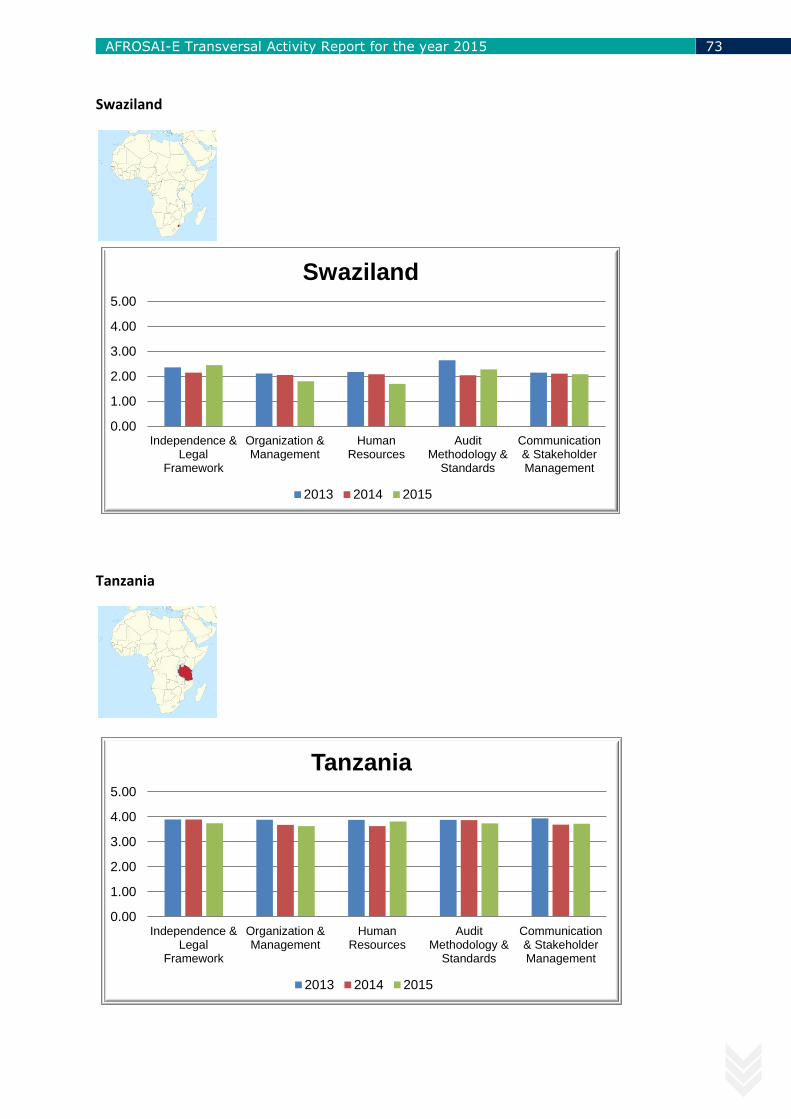
73 AFROSAI-E Transversal Activity Report for the year 2015
Swaziland
Tanzania
0.00
1.00
2.00
3.00
4.00
5.00
Independence &Legal
Framework
Organization &Management
HumanResources
AuditMethodology &
Standards
Communication& StakeholderManagement
Swaziland
2013 2014 2015
0.00
1.00
2.00
3.00
4.00
5.00
Independence &Legal
Framework
Organization &Management
HumanResources
AuditMethodology &
Standards
Communication& StakeholderManagement
Tanzania
2013 2014 2015

AFROSAI-E Transversal Activity Report for the year 2015
74
Uganda
Zambia
0.00
1.00
2.00
3.00
4.00
5.00
Independence &Legal
Framework
Organization &Management
HumanResources
AuditMethodology &
Standards
Communication& StakeholderManagement
Uganda
2013 2014 2015
0.00
1.00
2.00
3.00
4.00
5.00
Independence& Legal
Framework
Organization &Management
HumanResources
AuditMethodology &
Standards
Communication& StakeholderManagement
Zambia
2013 2014 2015
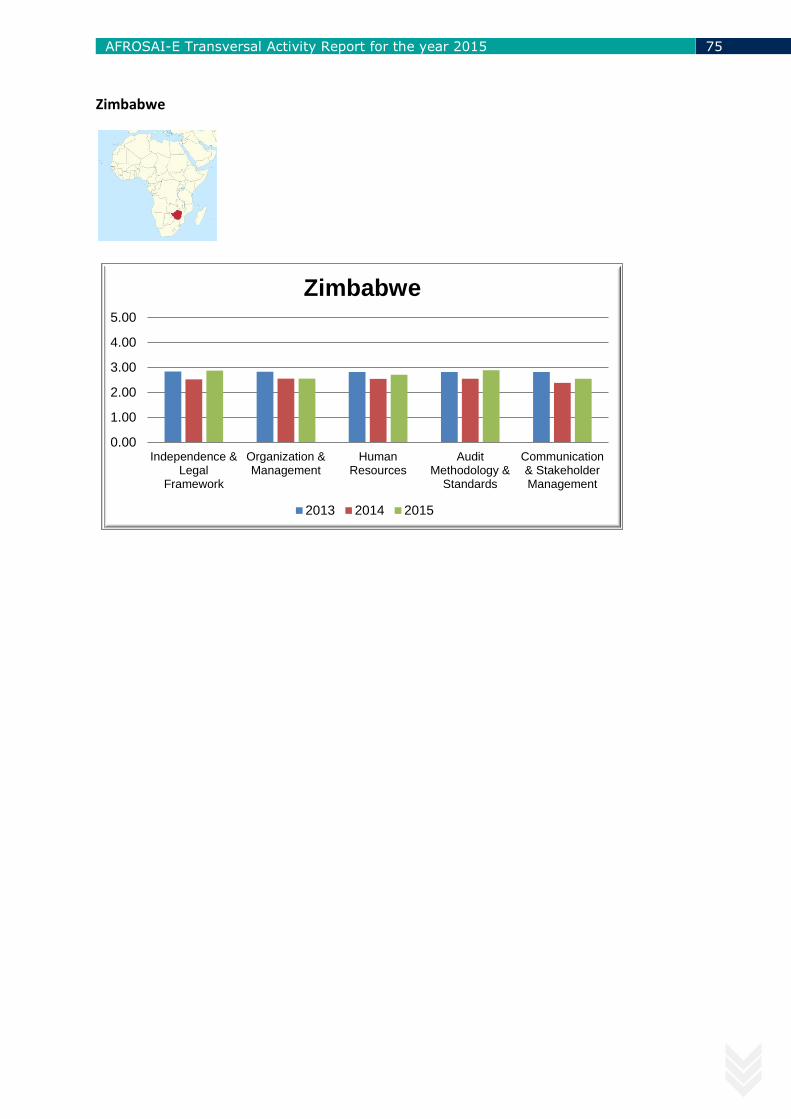
75 AFROSAI-E Transversal Activity Report for the year 2015
Zimbabwe
0.00
1.00
2.00
3.00
4.00
5.00
Independence &Legal
Framework
Organization &Management
HumanResources
AuditMethodology &
Standards
Communication& StakeholderManagement
Zimbabwe
2013 2014 2015

AFROSAI-E Transversal Activity Report for the year 2015
76
Appendix 3: Quality Assurance Questions – average for all countries per question
The white fields are left out in the subset of quality assurance questions
Year 2013 2014 2015
The Head of SAI has implemented leadership responsibilities that promotes a culture of
quality in all the work 3.0 2.96 3.24
The Head of SAI has implemented measures to ensure that the SAI's managers and staff
can carry out the audits according to international standards and other requirements
(legal, competence, ethics, resources, supervision etc.
3.08 3.08 3.24
The SAI has developed an IT/IS audit strategy for its IT/IS audits 2.33 2.32 2.20
The SAI has an IT support function with at least one (1) IT person for every 30 staff
members 2.38 2.48 2.6
The SAI has approved internal control policies, rules and regulations and procedures that
are clearly documented and applied in promoting an effective internal control
environment
2.63 2.68 2.92
The SAI has implemented a time recording system, which enables reporting on costs of
staff 2.25 2.24 2.16
The SAI has implemented a quality control management system for regularity audits
based on ISSAIs and other good practices. 2.71 2.68 2.88
The SAI’s quality control management system for regularity clearly define the roles and
responsibilities of all team members, team leaders, audit managers, and engagement
partners as well as pre-issuance reviewers where applicable
2.75 2.84 2.96
The SAI’s quality control monitoring measures for regularity clearly specifies the
requirements for planning of types of reviews, including nature, scope and frequency 2.71 2.88 2.88
The SAI has implemented quality control measures for regularity audits when it comes to
the need for a quality assurance handbook/guideline for full compliance with
international standards (ISSAIs)
2.58 2.76 2.84
The SAI has implemented a quality control management system for performance audits
based on ISSAIs and other good practices. 2.42 2.40 2.64
The SAI’s quality control management system for performance audit clearly define the
roles and responsibilities of all team members, team leaders, audit managers, and
engagement partners as well as pre-issuance reviewers where applicable
2.33 2.40 2.68
The SAI’s quality control monitoring measures for performance audit clearly specifies the
requirements for planning of types of reviews, including nature, scope and frequency. 246 2.44 2.64
The SAI has implemented quality control measures for performance audits when it comes
to the need for a quality assurance handbook/guideline for full compliance with
international standards (ISSAIs)
2.38 2.52 2.64
The SAI has been peer reviewed/quality assessed during the year by other member SAIs
or SAIs outside the AFROSAI-E region 1.50 1.44 1.7

77 AFROSAI-E Transversal Activity Report for the year 2015
The SAI has been independently quality reviewed at least once by AFROSAI-E during the
past three years. 2.50 2.24 3.24
The SAI has been externally reviewed or quality assess using SAI-PMF tool and
methodology during the past five years or similar not part of the regional program(s) 1.33 1.24 2.13
The SAI is using tools such as electronic working papers 2.21 2.32 2.28
The SAI is using tools such as computer assisted audit techniques (CAATS) 2.50 2.36 2.36
The SAI has integrated IT/IS audit in performance audit and regularity audit 2.04 2.08 2.08
The SAI's annual IT/IS audit coverage in % of the number of national IS systems 1.71 1.68 1.84

AFROSAI-E Transversal Activity Report for the year 2015
78
Appendix 4: Quality assurance questions compared to quality assurance visits
Questions compared to the quality assurance reviews in year 2015. Comparisons between the reviews and the
result from the survey shown in table 5 in the report.
1. The head of SAI is appointed with sufficiently long and fixed term to comply with the requirement that “The Head of SAI,
and (where relevant) members of collegial institutions… (are) given appointments with sufficiently long and fixed terms, to
allow them to carry out their mandates without fear of retaliation”
2. The relevant and applicable legislative framework(s) specifies, “…. the conditions for appointments … removal … of the
Head of the SAI, and (where relevant) members of collegial institutions … by a process that ensures their independence from
the executive” (e.g. with the approval of the legislature, and where relevant, the Head of State; removal only for just
cause/impeachment, similar protections to those that apply to a High Court Judge)
3. The executive does not take part in the preparation of the SAI’s budget appropriation or the final decision on the SAI’s
budget
4. The SAI submits an annual report on its own performance to Parliament and other key stakeholders
4.1 The head of SAI, top and senior management set appropriate tone and direction for the whole Organisation by
documenting and disseminating the SAI vision and core values and promoting these in the SAI’s public activities as well as to
all staff.
4.2 The SAI has developed and implemented an annual operational plan based on its strategic plan
4.3 The SAI has implemented an annual operational plan based on assessments of risks in the environment and expectations
from stakeholders
4.4 The operational plan is linked to the SAI budget and there is evidence to prove that all planned activities have been
allocated adequate resources and covers all the functions and types of audits that will be carried out.
4.5. The SAI has implemented a system for monitoring and evaluation of the annual operational plan
5.1 The SAI has implemented approved Human Resource policies and procedures that provide it with reasonable assurance
that it has sufficient personnel with capabilities, competence and commitment to ethical principles necessary to perform its
audits in accordance with professional standards and national laws and regulations.
5.2 The SAI has developed and implemented recruitment, remuneration, promotion, staff development and retention,
welfare policies and procedures as demonstrated, for instance, by existence of approved recruitment procedures, up-to-date
job profiles, required competencies and or up to date job descriptions relevant for the achievement of its current strategic
objectives for each position on the organisational structure
5.3 The SAI has implemented approved performance management systems and provisions that include consistent appraisal of
all staff, rewarding system that is linked to performance, job rotation, transparent carrier path development and succession
procedures that are compliant with professional standards and national laws and regulations
5.4 The SAI has implemented a Human Resource policy in line with best practice including provisions for professional
development and training of staff in the main audit disciplines to effectively discharge its mandate
5.5 The SAI has implemented a system to monitor and evaluate systems of the different aspects of the Human Resource
development policy, strategy whose results are included in its annual performance report
6.1 The SAI’s annual HR development plan is implemented and aligned with the strategic plan and/or relevant operational
plan.
6.2 The SAI has implemented training programs for new entrants

79 AFROSAI-E Transversal Activity Report for the year 2015
6.3 The SAI has a specific management development program (MDP) and leadership development program (LDP) for all its
management staff in place in accordance with international standards and good practice
6.4 The SAI has implemented on-the-job training programs for all its staff
6.5 The SAI has implemented training programs to assist its staff obtain professional qualifications in relevant disciplines
6.6 The SAI has implemented a system to monitor and evaluate the different aspects of training and results achieved
7.1 The SAI has implemented a quality control management system for regularity and performance audits based on ISSAIs
and other good practices.
7.2 The SAI’s quality control management system for regularity and performance audit clearly define the roles and
responsibilities of all team members, team leaders, audit managers, and engagement partners as well as pre-issuance
reviewers where applicable
7.3 The SAI’s quality control monitoring measures for regularity and performance audit clearly specifies the requirements for
planning of types of reviews, including nature, scope and frequency.
7.4 The SAI has implemented quality control measures for regularity and performance audits when it comes to the need for a
quality assurance handbook/guideline for full compliance with international standards (ISSAIs)
8.1 The SAI has implemented a communication policy and strategy based on the SAIs legal framework, vision, mission and
values
8.2 The SAI has implemented a communication policy and strategy based on stakeholder analysis (including prioritization)
8.3 The SAI has implemented a communication policy and strategy based on a SWOT, gap or similar analysis considerations
8.4 The SAI is monitoring the implementation of the communication policy/strategy and reporting on the outcomes in the
annual performance report
9. The SAI is continually optimising its organisation
10.1 The SAI has regularity and performance audit manuals which are compliant with ISSAIs and other good practices
10.2 The SAI’s training programs for regularity and performance auditors are based on its regularity and performance audit
manual.
10.3 The SAI’s regularity and performance audit manuals are implemented, reviewed and updated on a regular basis
10.4 The SAI’s regularity and performance audit manuals are customized to fit the country SAI’s specific country prerequisites
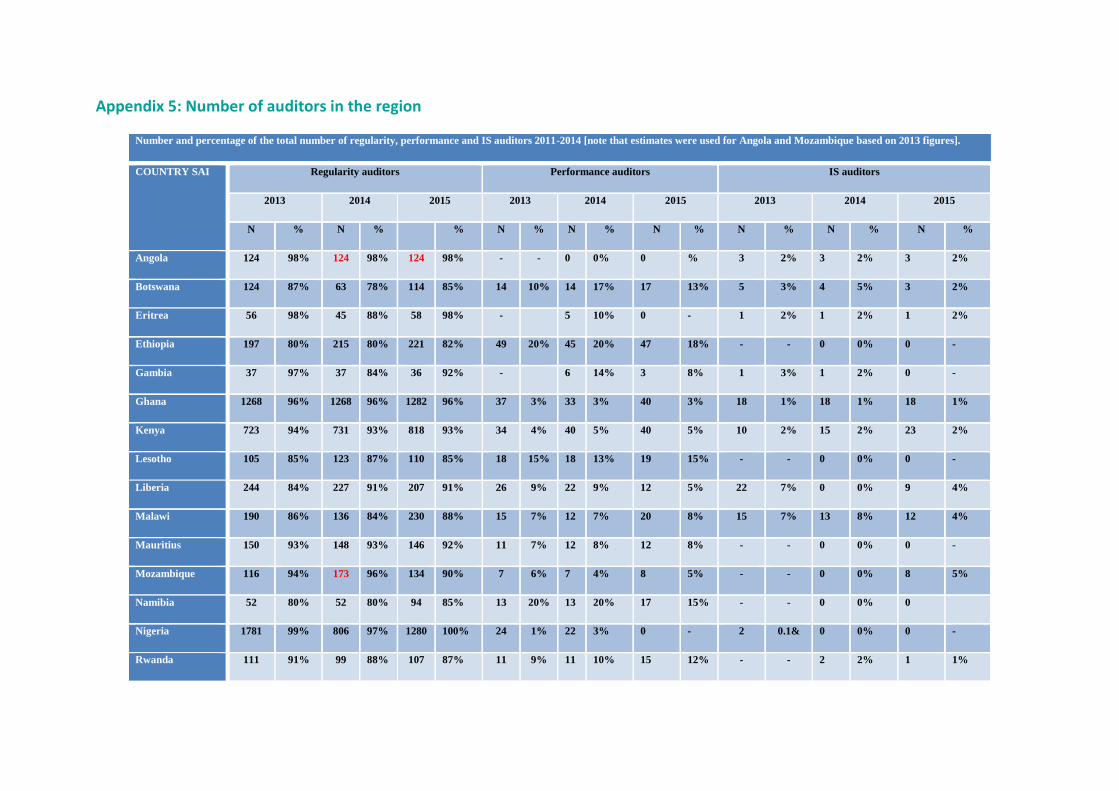
Appendix 5: Number of auditors in the region
Number and percentage of the total number of regularity, performance and IS auditors 2011-2014 [note that estimates were used for Angola and Mozambique based on 2013 figures].
COUNTRY SAI Regularity auditors Performance auditors IS auditors
2013 2014 2015 2013 2014 2015 2013 2014 2015
N % N % % N % N % N % N % N % N %
Angola 124 98% 124 98% 124 98% - - 0 0% 0 % 3 2% 3 2% 3 2%
Botswana 124 87% 63 78% 114 85% 14 10% 14 17% 17 13% 5 3% 4 5% 3 2%
Eritrea 56 98% 45 88% 58 98% - 5 10% 0 - 1 2% 1 2% 1 2%
Ethiopia 197 80% 215 80% 221 82% 49 20% 45 20% 47 18% - - 0 0% 0 -
Gambia 37 97% 37 84% 36 92% - 6 14% 3 8% 1 3% 1 2% 0 -
Ghana 1268 96% 1268 96% 1282 96% 37 3% 33 3% 40 3% 18 1% 18 1% 18 1%
Kenya 723 94% 731 93% 818 93% 34 4% 40 5% 40 5% 10 2% 15 2% 23 2%
Lesotho 105 85% 123 87% 110 85% 18 15% 18 13% 19 15% - - 0 0% 0 -
Liberia 244 84% 227 91% 207 91% 26 9% 22 9% 12 5% 22 7% 0 0% 9 4%
Malawi 190 86% 136 84% 230 88% 15 7% 12 7% 20 8% 15 7% 13 8% 12 4%
Mauritius 150 93% 148 93% 146 92% 11 7% 12 8% 12 8% - - 0 0% 0 -
Mozambique 116 94% 173 96% 134 90% 7 6% 7 4% 8 5% - - 0 0% 8 5%
Namibia 52 80% 52 80% 94 85% 13 20% 13 20% 17 15% - - 0 0% 0
Nigeria 1781 99% 806 97% 1280 100% 24 1% 22 3% 0 - 2 0.1& 0 0% 0 -
Rwanda 111 91% 99 88% 107 87% 11 9% 11 10% 15 12% - - 2 2% 1 1%

81 AFROSAI-E Transversal Activity Report for the year 2015
Seychelles 25 78% 25 81% 27 79% 5 16% 5 16% 6 18% 2 6% 1 3% 1 3%
Sierra Leone 111 89% 111 89% 97 87% 14 11% 14 11% 14 13% - - 0 0% 0 -
Somalia 37 52% 37 77% 3 4% 3 6% - - 8 11% 8 17%
South Africa 2403 92% 2400 92% 2887 93% 74 3% 65 3% 78 3% 123 5% 123 5% 128 4%
South Sudan 112 100% 90 90% 250 96% - - 10 10% 10 4% - - 0 0% 0 -
Sudan - - 792 95% 908 95% - - 30 4% 30 3% - - 16 2% 16 2%
Swaziland 72 82% 66 87% 66 81% 16 18% 10 13% 10 12% - - 0 0% 5 7%
Tanzania 597 95% 722 95% 776 94.8% 24 4% 31 4% 41 5% 4 0.6% 4 1% 2 0.2%
Uganda 267 85% 313 88% 318 87% 37 12% 36 10% 36 10% 9 3% 8 2% 11 3%
Zambia 255 91% 299 93% 273 91% 17 6% 17 5% 20 7% 8 3% 7 2% 7 2%
Zimbabwe 132 85% 166 89% 165 86% 19 12% 16 9% 20 10% 5 3% 5 3% 6 4%