Transportation Ecoefficiency: Social and Political Forces for Change in U.S. Metropolitan Areas
19
Transportation Ecoefficiency Social and Political Forces for Change in U.S. Metropolitan Areas By Anna C. McCreery
-
Upload
anna-mccreery -
Category
Technology
-
view
256 -
download
0
Transcript of Transportation Ecoefficiency: Social and Political Forces for Change in U.S. Metropolitan Areas
Transportation Ecoefficiency
Social and Political Forces for Change in U.S. Metropolitan Areas
By Anna C. McCreery
Presentation Overview
A new metric for Transportation Ecoefficiency (TE) 4 TE components
TE trends in US metro areas Social & Political drivers of TE
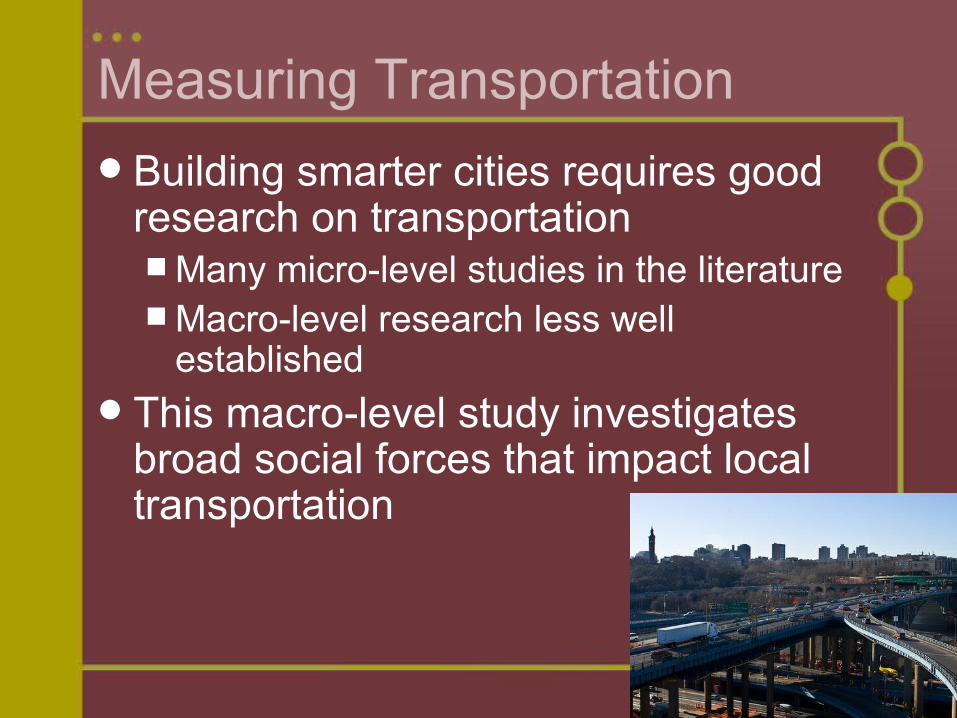
Measuring Transportation
Building smarter cities requires good research on transportation Many micro-level studies in the literature Macro-level research less well
established This macro-level study investigates
broad social forces that impact local transportation
Transportation Ecoefficiency Environmental impact of
transportation, per unit of travel
Measured by proxy as the index of: Population density1
% of commuters driving to work alone (sign reversed)
% of commuters taking public transit % of commuters walking or bicycling
1 Cervero 2007, Ewing and Cervero 2010, Naess 2006

Measuring TE: Data & Sample
Sample: 225 U.S. Metropolitan Statistical Areas (MSAs), from 1980 to 2008
Source: Census data and American Community Survey
Photo credits: http://bloximages.newyork1.vip.townnews.com/stltoday.com/content/tncms/assets/v3/editorial/c/e9/ce992098-0d5e-11e0-9cbd-0017a4a78c22/4d1140277e0fb.image.jpg
http://census2010.georgetown.org/files/2011/02/acslogo.gif
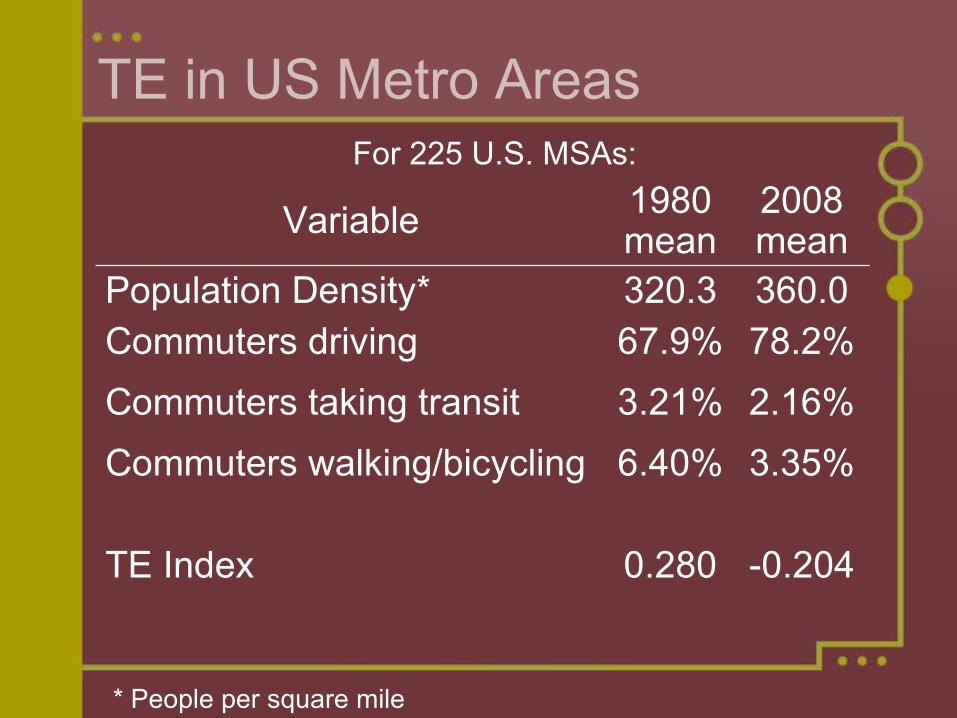
TE in US Metro Areas
Variable 1980 mean
2008 mean
Population Density* 320.3 360.0Commuters driving 67.9% 78.2%
Commuters taking transit 3.21% 2.16%
Commuters walking/bicycling 6.40% 3.35%
TE Index 0.280 -0.204
* People per square mile
For 225 U.S. MSAs:
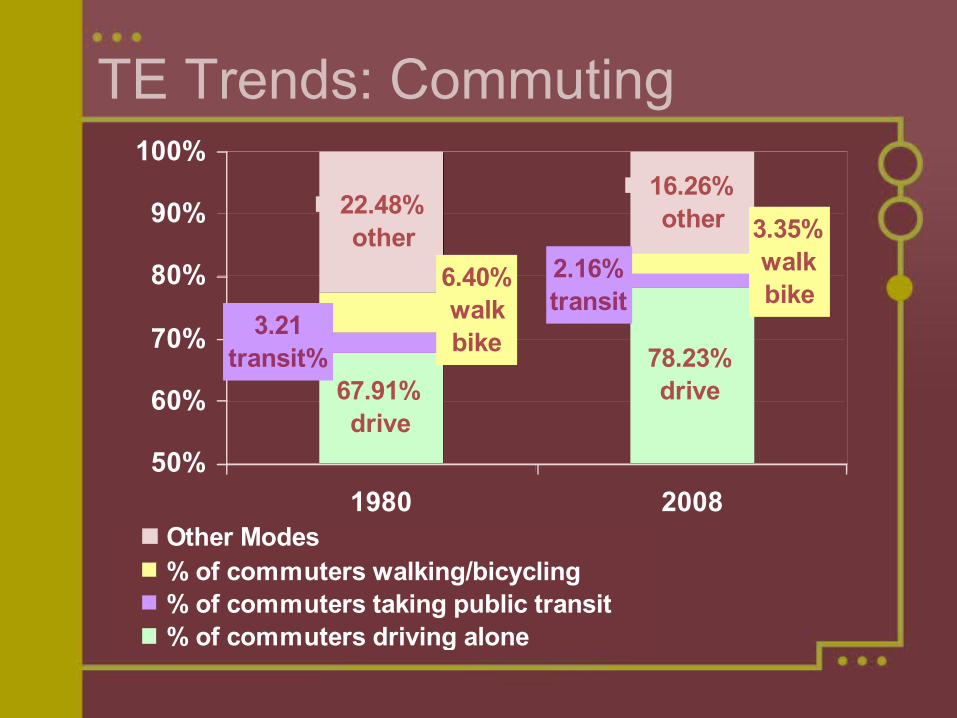
TE Trends: Commuting
78.23%drive67.91%
drive
2.16%transit
3.21transit%
6.40%walkbike
3.35%walkbike
16.26%other22.48%
other
50%
60%
70%
80%
90%
100%
1980 2008Other Modes% of commuters walking/bicycling% of commuters taking public transit% of commuters driving alone
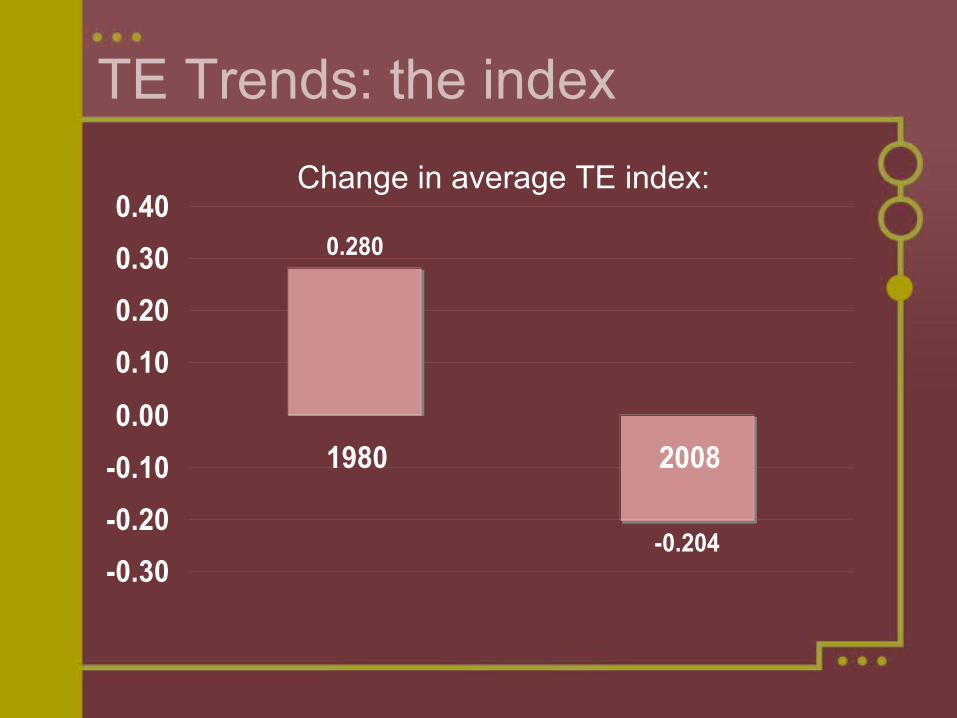
TE Trends: the index
0.280
-0.204-0.30
-0.20
-0.10
0.00
0.10
0.20
0.30
0.40
1980 2008
Change in average TE index:
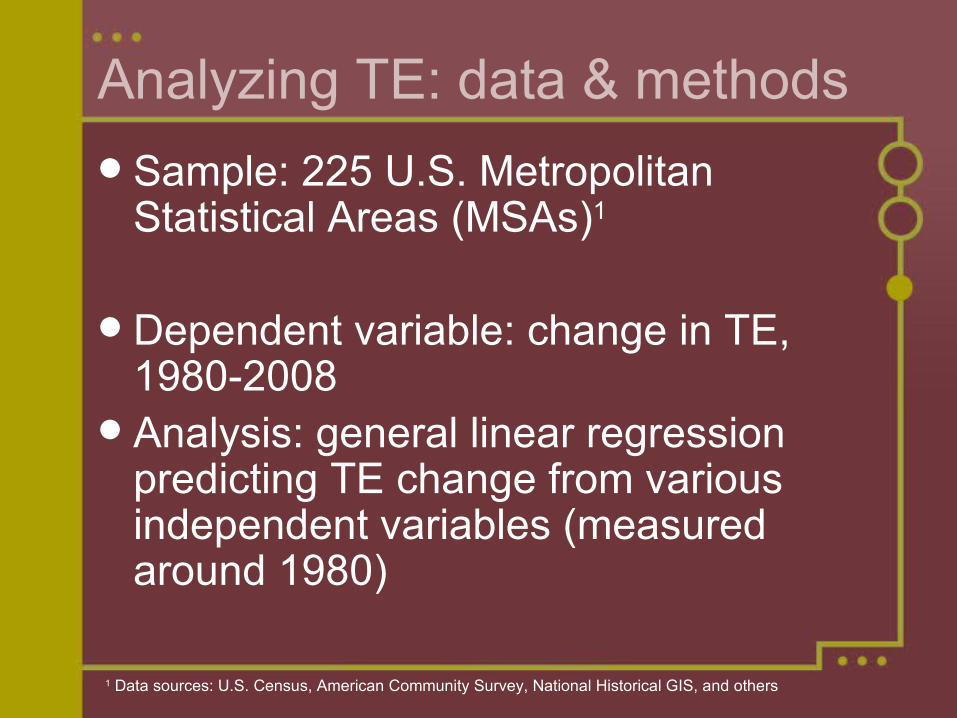
Analyzing TE: data & methods
Sample: 225 U.S. Metropolitan Statistical Areas (MSAs)1
Dependent variable: change in TE, 1980-2008
Analysis: general linear regression predicting TE change from various independent variables (measured around 1980)
1 Data sources: U.S. Census, American Community Survey, National Historical GIS, and others
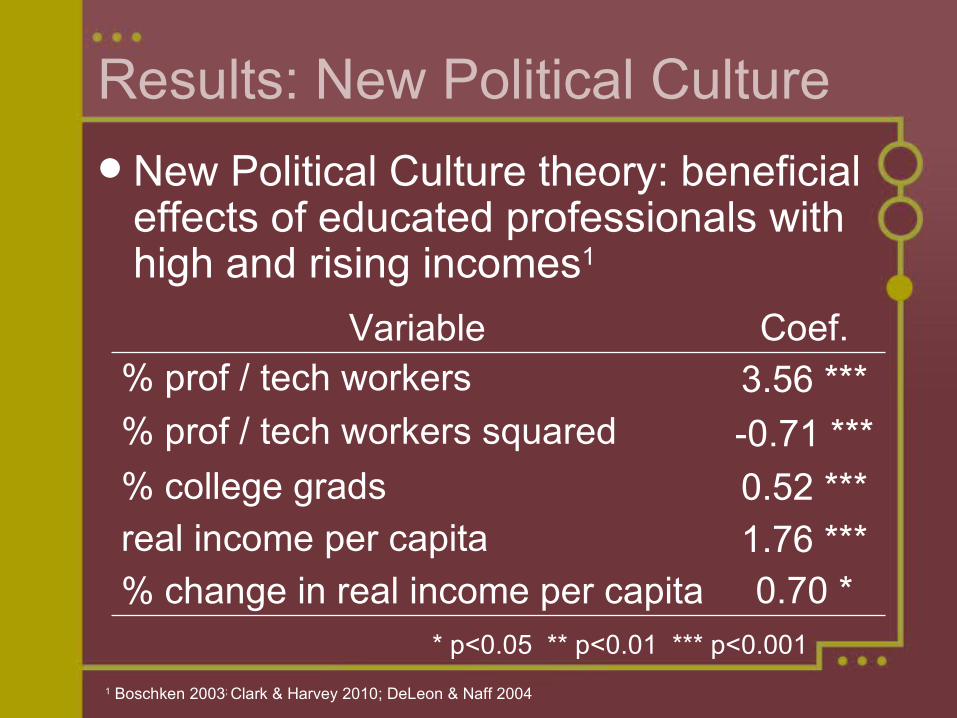
Results: New Political Culture
New Political Culture theory: beneficial effects of educated professionals with high and rising incomes1
1 Boschken 2003; Clark & Harvey 2010; DeLeon & Naff 2004
Variable Coef.% prof / tech workers 3.56 ***% prof / tech workers squared -0.71 ***
% college grads 0.52 ***real income per capita 1.76 ***% change in real income per capita 0.70 *
* p<0.05 ** p<0.01 *** p<0.001
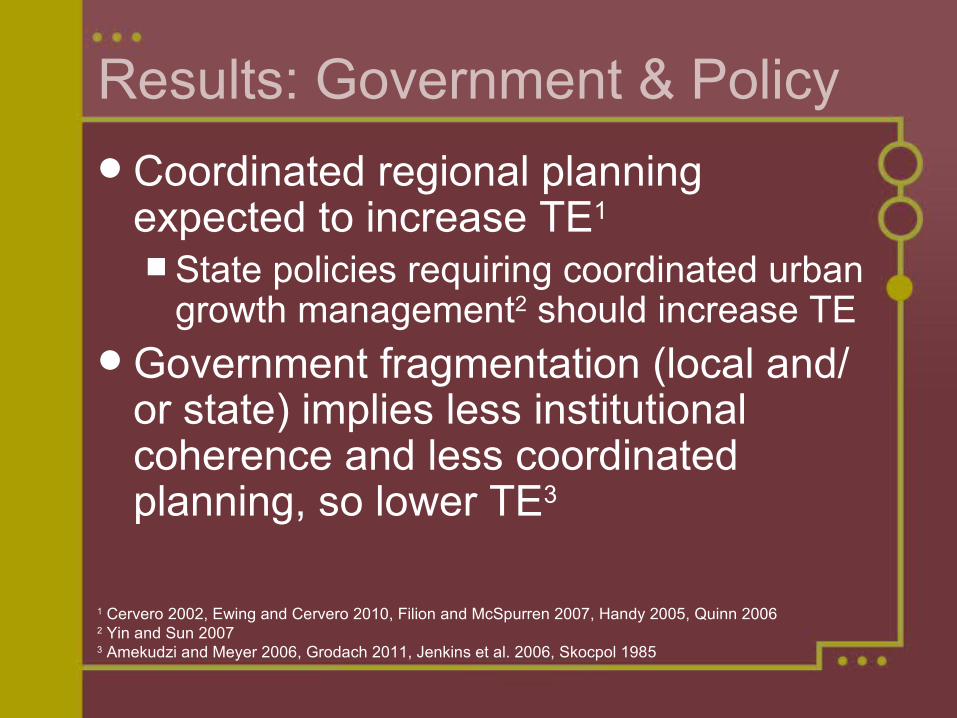
Results: Government & Policy
Coordinated regional planning expected to increase TE1 State policies requiring coordinated urban
growth management2 should increase TE Government fragmentation (local and/
or state) implies less institutional coherence and less coordinated planning, so lower TE3
1 Cervero 2002, Ewing and Cervero 2010, Filion and McSpurren 2007, Handy 2005, Quinn 20062 Yin and Sun 20073 Amekudzi and Meyer 2006, Grodach 2011, Jenkins et al. 2006, Skocpol 1985
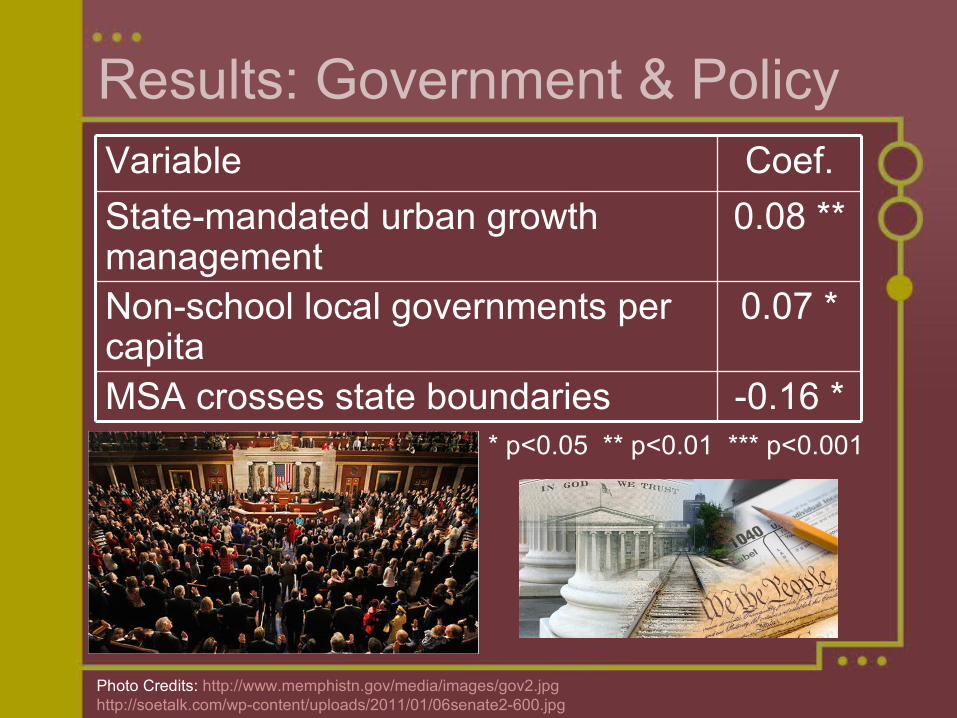
Results: Government & PolicyVariable Coef.
State-mandated urban growth management
0.08 **
Non-school local governments per capita
0.07 *
MSA crosses state boundaries -0.16 ** p<0.05 ** p<0.01 *** p<0.001
Photo Credits: http://www.memphistn.gov/media/images/gov2.jpg http://soetalk.com/wp-content/uploads/2011/01/06senate2-600.jpg
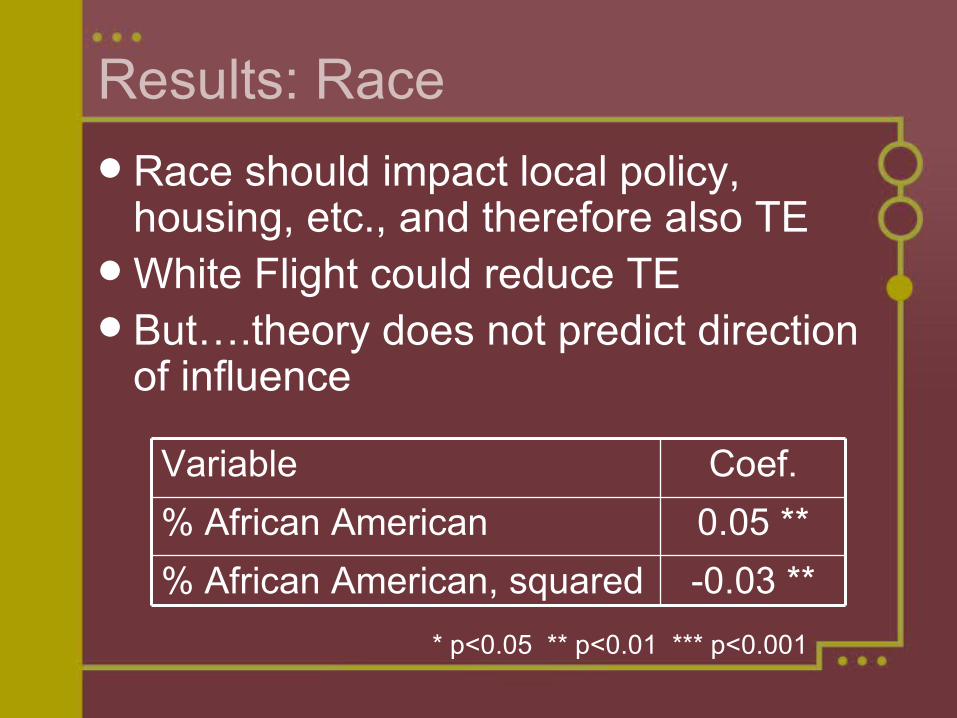
Results: Race
Race should impact local policy, housing, etc., and therefore also TE
White Flight could reduce TE But….theory does not predict direction
of influence
Variable Coef.
% African American 0.05 **
% African American, squared -0.03 **
* p<0.05 ** p<0.01 *** p<0.001
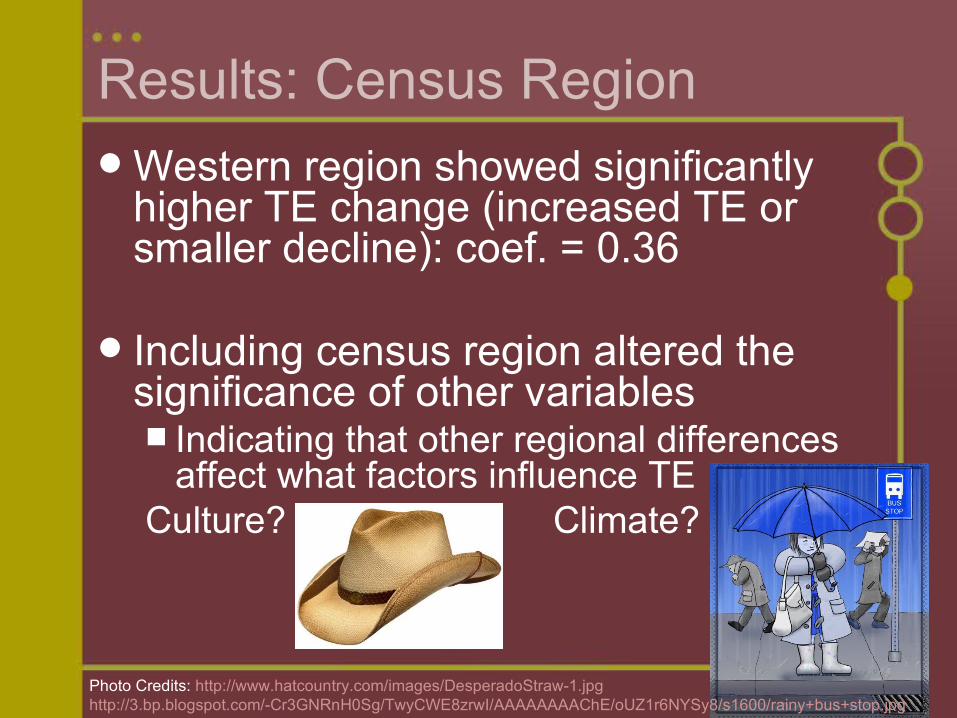
Results: Census Region Western region showed significantly
higher TE change (increased TE or smaller decline): coef. = 0.36
Including census region altered the significance of other variables Indicating that other regional differences
affect what factors influence TECulture? Climate?
Photo Credits: http://www.hatcountry.com/images/DesperadoStraw-1.jpghttp://3.bp.blogspot.com/-Cr3GNRnH0Sg/TwyCWE8zrwI/AAAAAAAAChE/oUZ1r6NYSy8/s1600/rainy+bus+stop.jpg

Main Contributions
The TE concept and measure is a useful empirical tool
Macro-level social forces impact urban transportation in significant and under-studied ways
Grand sociological theories can lead to testable hypotheses and new insights about transportation
References Amekudzi, Adjo and Michael D. Meyer. 2006. “Considering the Environment
in Transportation Planning: Review of Emerging Paradigms and Practice in the United States.” Journal of Urban Planning and Development 132(1): 42-52.
Boschken H.L. 2003. “Global Cities, Systemic Power, and Upper-Middle-Class Influence” Urban Affairs Review 38(6): 808-830
Cervero, Robert. 2002. “Built environments and mode choice: toward a normative framework.” Transportation Research Part D- Transport and Environment 7(4): 265-284.
Cervero, R. 2007. “Transit-Oriented Development’s Ridership Bonus: A Product of Self-Selection and Public Policies,” Environment and Planning A 39: 2068-2085.
Clark, T.N. and R. Harvey. 2010. “Urban Politics” pp. 423-440 in: Kevin T. Leicht and J. Craig Jenkins, eds. Handbook of Politics: State and Society in Global Perspective New York: Springer.
DeLeon, R.E. and K.C. Naff. 2004. “Identity Politics and Local Political Culture: Some Comparative Results from the Social Capital Benchmark Survey” Urban Affairs Review 39(6): 689-719.
References Ewing, R., and R. Cervero. (2010) “Travel and the Built Environment: A Meta-
Analysis,” Journal of the American Planning Association 76(3): 265-294. Filion, Pierre and Kathleen McSpurren. 2007. “Smart Growth and
Development Reality: The Difficult Co-ordination of Land Use and Transport Objectives” Urban Studies 44(3): 501-523.
Grodach, Carl. 2011. “Barriers to Sustainable Economic Development: The Dallas-Fort Worth Experience” Cities 28: 300-309.
Handy, S. 2005. “Smart growth and the transportation - Land use connection: What does the research tell us?” International Regional Science Review 28(2): 146-167. Holden, E., and K.G. Hoyer. (2005) “The Ecological Footprint of Fuels,” Transportation Research Part D 10: 395-403.
Jenkins, J. Craig, Kevin T. Leicht and Heather Wendt. 2006. "Class Forces, Political Institutions and State Intervention: Subnational Economic Development Policy in the U.S., 1971-1990.” American Journal of Sociology 111(4): 1122-80.
Kaufman, A.S., P.J. Meier, J.C. Sinistore, D.J. Reinemann. (2010) “Applying Life-Cycle Assessment to Low Carbon Fuel Standards: How Allocation Choices Influence Carbon Intensity for Renewable Transportation Fuels,” Energy Policy 38: 5229-5241.
References Naess, P. (2006) “Accessibility, activity participation and location of activities:
Exploring the links between residential location and travel behaviour,” Urban Studies 43(3): 627-652.
Quinn, Brian. 2006. “Transit-Oriented Development: Lessons from California” Built Environment 32(3): 311-322.
Skocpol, Theda. 1985. “Bringing the State Back In: Strategies of Analysis in Current Research” (chapter) in Peter B. Evans, Dietrich Rueschemeyer, and Theda Skocpol, Bringing the State Back In. Cambridge, N.Y.: Cambridge University Press.
Wackernagel, M., W. Rees. (1996) Our Ecological Footprint: Reducing Human Impact on the Earth. New Society Publisher, Gabriola Island.
Yang, C., D. McCollum, R. McCarthy, and W. Leighty. (2009) “Meeting and 80% Reduction in Greenhouse Gas Emissions from Transportation by 2050: A Case Study in California,” Transportation Research Part D 14: 147-156.
Yin, Ming, and Jian Sun. 2007. "The Impacts of State Growth Management Programs on Urban Spral in the 1990s" Journal of Urban Affairs 29(2): 149-179.
Colleagues
Dr. J. Craig Jenkins
Dr. Ed MaleckiDr. Maria Conroy
Funding & Resources
Ohio State University Dept. of Sociology
Ohio State University Environmental Science Graduate Program
The Fay Graduate Fellowship Fund in Environmental Sciences
Acknowledgements