
Transportation Asset Management – What is taking place...
9
1 Transportation Asset Management – What is taking place in the USA? Stephen J. Gaj Leader, System Management & Monitoring Team Office of Asset Management Federal Highway Administration May 2, 2011 NATIONAL SCENE- (1992-2008) BRIDGE CONDITIONS 2 NATIONAL SCENE (2004-2009) PERFORMANCE OF NHS AND IS PAVEMENTS 3 NATIONAL CALL FOR ACCOUNTABILITY - PERFORMANCE Congress is considering a performance management systems for transportation US DOT’s 2012 Budget Proposal provides funding to focus investment on safety, state of good repair, and livability and establish a performance-based highway program, etc. The National Revenue Study Commission also called for accountability The GAO endorsed performance metrics AASHTO has proposed a performance measurement process 4 NATIONAL CALL FOR SUSTAINABILITY The concept of sustainability has gained increasing relevance It applies not only to the natural environment but also to the economic and cultural environment The concept of sustainability is more relevant than ever to the strategic management of transportation resources 5 • Agencies are facing increasing demands to demonstrate accountability and contribute to sustainability • TAM provides an overarching, rational long-term management approach that addresses both demands TAM IN AN ERA OF ACCOUNTABILITY, SUSTAINABILITY, and PERFORMANCE • Asset Management combines a focus on metrics and long-term system sustainability • By taking a long term view and anticipating future conditions (sustaining for long-term conditions) • By having short term targets to accomplish the long term plan and maximize future performance and condition of infrastructure 6
Transcript of Transportation Asset Management – What is taking place...

1
Transportation Asset Management – What is
taking place in the USA?
Stephen J. Gaj
Leader, System Management & Monitoring Team
Office of Asset Management
Federal Highway Administration
May 2, 2011
NATIONAL SCENE- (1992-2008) BRIDGE CONDITIONS
2
NATIONAL SCENE (2004-2009)PERFORMANCE OF NHS AND IS PAVEMENTS
3
NATIONAL CALL FOR ACCOUNTABILITY -PERFORMANCE
Congress is considering a performance management systems for transportation
US DOT’s 2012 Budget Proposal provides funding to focus investment on safety, state of good repair, and livability and establish a g p , yperformance-based highway program, etc.
The National Revenue Study Commission also called for accountability
The GAO endorsed performance metrics
AASHTO has proposed a performance measurement process
4
NATIONAL CALL FORSUSTAINABILITY
The concept of sustainability has gained increasing relevance
It applies not only to the natural environment but also to the economic and cultural but a so to t e eco o c a d cu tu aenvironment
The concept of sustainability is more relevantthan ever to the strategic management of transportation resources
5
• Agencies are facing increasing demands to demonstrate accountability and contribute to sustainability
• TAM provides an overarching, rational long-term management approach that addresses both demands
TAM IN AN ERA OF ACCOUNTABILITY, SUSTAINABILITY, and PERFORMANCE
g pp
• Asset Management combines a focus on metrics and long-term system sustainability• By taking a long term view and anticipating future
conditions (sustaining for long-term conditions)• By having short term targets to accomplish the
long term plan and maximize future performance and condition of infrastructure
6

2
FHWA REPORT
• ‘Beyond The Short Term’
• Examines these demands in greater detail
• Compares TAM to other Quality Systems
/Transportation Asset Management Accountability
Beyond The Short Term Transportation Asset Management For Long‐Term Sustainability, Accountability and Performance
• Shows the use of TAM to demonstrate accountability & sustainability
http://www.fhwa.dot.gov/asset/10009/index.cfm7
US EXAMPLES-SUCCESS IN PERFORMANCE BASED ASSET MANAGEMENT
• DOTs in Utah, North Carolina, Missouri, Oregon and Maryland were examined
• Case studies demonstrate the intertwining of Asset Management and Performance Management for long-term effective, sustainablemanagement of assets
• Also demonstrating transparency and accountability
8
2025 ChallengesIn just 14 years:
• Population and economic growth
• Increased VMT/congestion
• Freight movements are expected to double
• Truck weight limits?
• Aging infrastructure - Preservation
• Funding shortfalls – fuel tax relationship
What is Transportation Asset Management?
A strategic and systematic process of A strategic and systematic process of operating, maintaining, upgrading and operating, maintaining, upgrading and expanding physical assets effectively expanding physical assets effectively
throughout their lifecycle. It focuses on throughout their lifecycle. It focuses on business and engineering practices for business and engineering practices for resource allocation and utilization, with resource allocation and utilization, with the objective of better decision making the objective of better decision making
based upon quality information and well based upon quality information and well defined objectives.defined objectives.
Goals and Objectives
Analysis of Optionsand Tradeoffs
Preservation, Operations,Capacity Expansion Policies
Transportation Asset Management
Overview
Decision-Making &Resource Allocation
Implementation
Monitoring and Performance Measures
Fee
db
ack
Budgets
Expectations
Target Setting
Goals and Objectives
Performance Measures
Policies
Performance Management Elements
Overview
Evaluate Progeams and Projects
Allocate Resources (Budget and Staff) &
Implementation
Measure and Report Results
Fee
db
ack
Budgets
Expectations
3
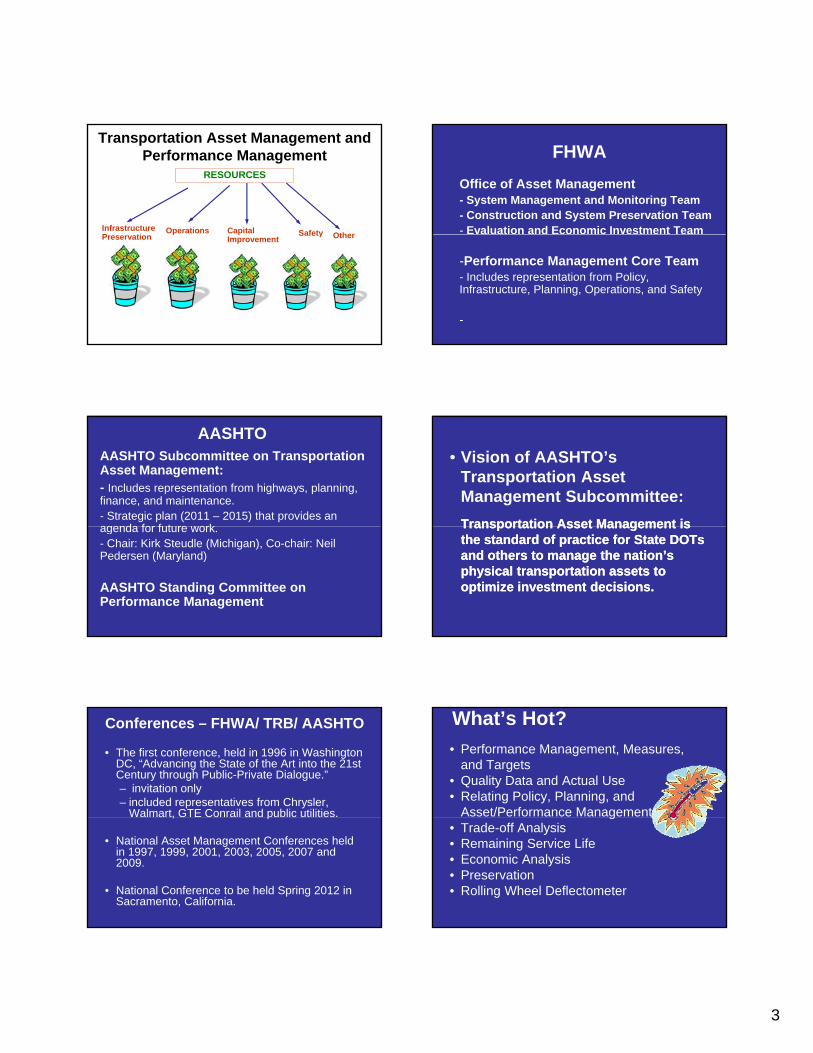
Transportation Asset Management and Performance Management
Infrastructure P ti
Capital Operations
RESOURCES
Safety OtherPreservationp
Improvementp Safety Other
FHWA
Office of Asset Management- System Management and Monitoring Team- Construction and System Preservation Team- Evaluation and Economic Investment Team
-Performance Management Core Team- Includes representation from Policy, Infrastructure, Planning, Operations, and Safety
-
AASHTOAASHTO Subcommittee on Transportation Asset Management:- Includes representation from highways, planning, finance, and maintenance.- Strategic plan (2011 – 2015) that provides an agenda for future workagenda for future work.- Chair: Kirk Steudle (Michigan), Co-chair: Neil Pedersen (Maryland)
AASHTO Standing Committee on Performance Management
• Vision of AASHTO’s Transportation Asset Management Subcommittee:
Transportation ATransportation Asset Management issset Management isTransportation ATransportation Asset Management is sset Management is the standard of practice for State DOTs the standard of practice for State DOTs and others to manage the nation’s and others to manage the nation’s physical transportation assets to physical transportation assets to optimize investment decisions.optimize investment decisions.
Conferences – FHWA/ TRB/ AASHTO
• The first conference, held in 1996 in Washington DC, “Advancing the State of the Art into the 21st Century through Public-Private Dialogue.” – invitation only – included representatives from Chrysler,
Walmart, GTE Conrail and public utilities. , p
• National Asset Management Conferences held in 1997, 1999, 2001, 2003, 2005, 2007 and 2009.
• National Conference to be held Spring 2012 in Sacramento, California.
What’s Hot?
• Performance Management, Measures, and Targets
• Quality Data and Actual Use • Relating Policy, Planning, and
Asset/Performance Managementg• Trade-off Analysis• Remaining Service Life• Economic Analysis• Preservation• Rolling Wheel Deflectometer
4
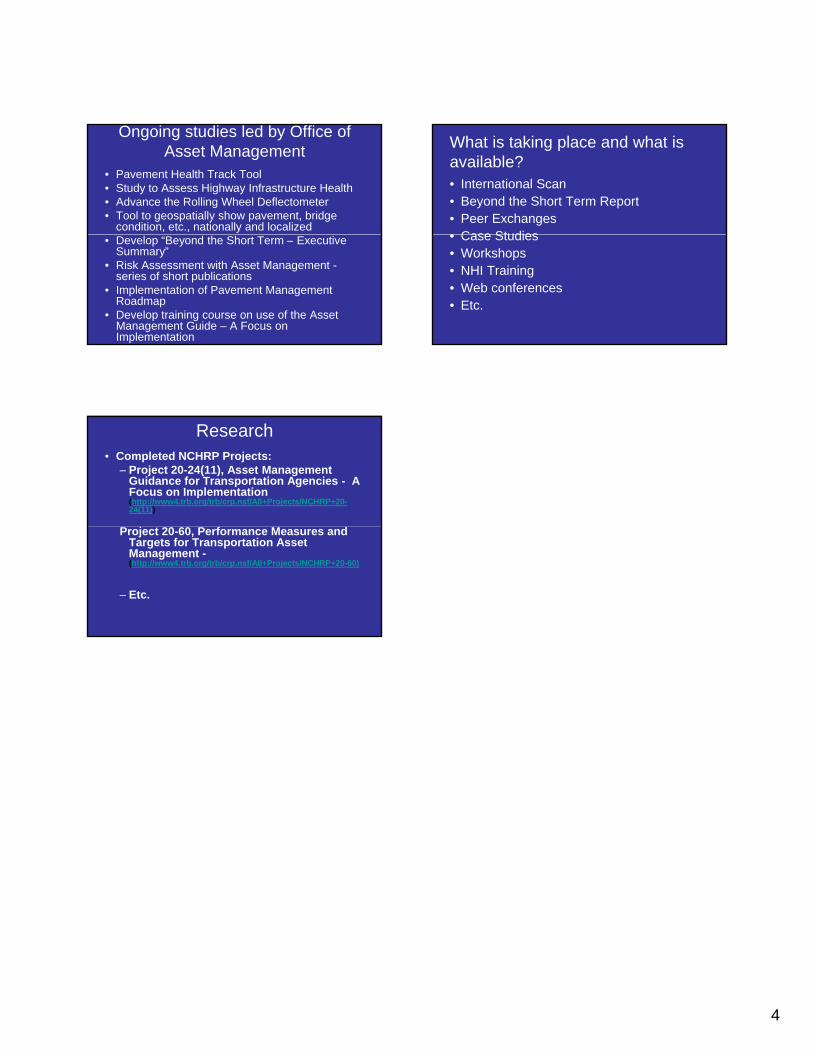
Ongoing studies led by Office of Asset Management
• Pavement Health Track Tool• Study to Assess Highway Infrastructure Health • Advance the Rolling Wheel Deflectometer• Tool to geospatially show pavement, bridge
condition, etc., nationally and localized• Develop “Beyond the Short Term – Executive
Summary”• Risk Assessment with Asset Management -
series of short publications• Implementation of Pavement Management
Roadmap • Develop training course on use of the Asset
Management Guide – A Focus on Implementation
What is taking place and what is available?• International Scan• Beyond the Short Term Report• Peer Exchanges• Case Studies• Case Studies• Workshops• NHI Training• Web conferences• Etc.
Research• Completed NCHRP Projects:
– Project 20-24(11), Asset Management Guidance for Transportation Agencies - A Focus on Implementation(http://www4.trb.org/trb/crp.nsf/All+Projects/NCHRP+20-24(11))
Project 20-60, Performance Measures and Targets for Transportation Asset Management -(http://www4.trb.org/trb/crp.nsf/All+Projects/NCHRP+20-60)
– Etc.

5/2/2011
1
Asset Management:One Step at aTime to BuildCapacity
Cathy Nelson, Chief Engineer
Laura Wipper, Asset Management Integration
Manager
• 1990’s – OTMS in response to ISTEA (1991)– Infrastructure for seven major systems in various
stages of development by 1996• 2005 – Strategic plan for comprehensive
program
ODOT’s Asset Management Timeline
program • 2006 – Year of the pilot• 2007 – Revisit strategies; reprioritize
– Inventory work plans; AM Task Force; AM Integration Section
• 2009 – Making data more accessible• 2010 – Sustain gains and broaden input• 2011 – Incorporate integrated data
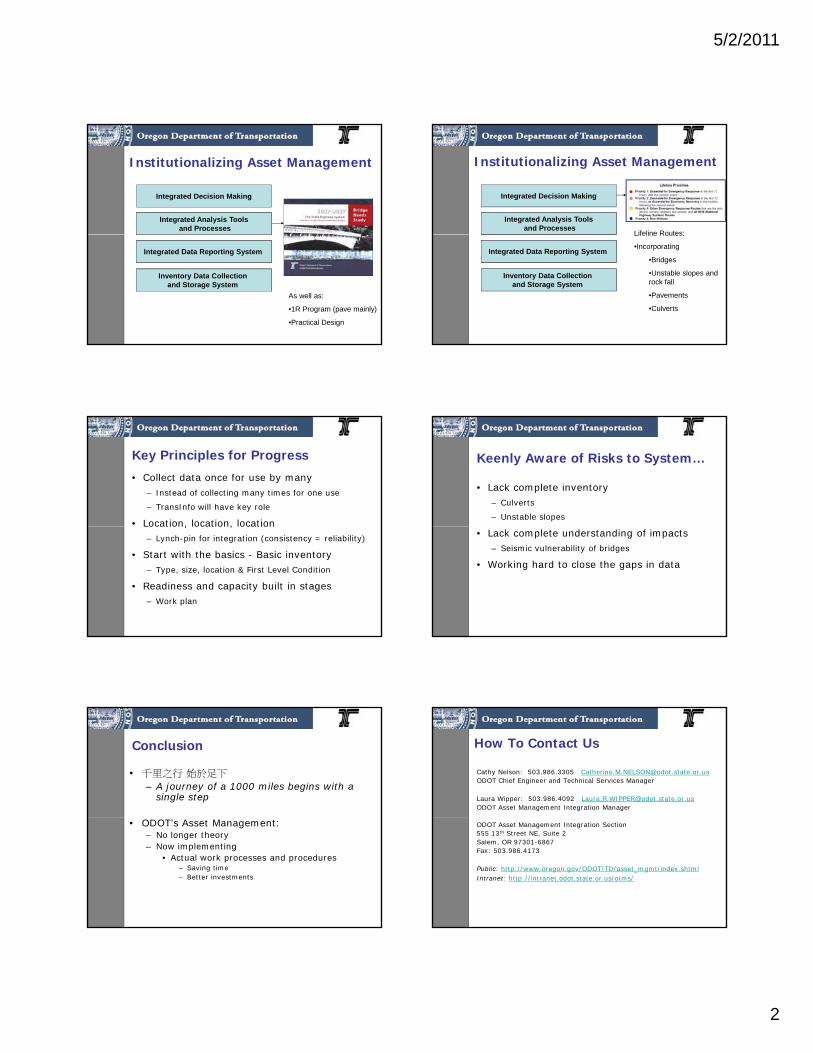
Institutionalizing Asset Management
Analysis Tools and ProcessesIntegrated Analysis Tools
and Processes
Integrated Decision Making
Data Collection and Storage System
Data Reporting System
Inventory Data Collection and Storage System
Integrated Data Reporting System
Institutionalizing Asset Management
Analysis Tools and ProcessesIntegrated Analysis Tools
and Processes
Integrated Decision Making
Data Collection and Storage System
Data Reporting System
Inventory Data Collection and Storage System
Integrated Data Reporting System
ProgressAsset
Statewide data available in
2005?
Statewide data available now?
Bridges X XTunnels X
ITS X XPavement X X
Right of Way X XSigns X
Traffic Barriers XSidewalks X
ADA Ramps XBike Facilities X
Culverts 6ft and over NBI in progressCulverts under 6ft in progress
WIM Sites XSound Barriers X X
Wetland Mitigation Sites XMaterial Sources X
Signals and Beacons Tri-color only Tri-color onlyRetaining Walls in progressUnstable Slopes in progress
Approaches in progressMajor Traffic Support just startingStorm Water Facilities just starting
Illumination
Institutionalizing Asset Management
Analysis Tools and ProcessesIntegrated Analysis Tools
and Processes
Integrated Decision Making
As well as:•TransInfo
•Platform for corporate data•Complimented by FileNet, data warehouse
Data Collection and Storage System
Data Reporting System
Inventory Data Collection and Storage System
Integrated Data Reporting System
5/2/2011
2
Institutionalizing Asset Management
Analysis Tools and ProcessesIntegrated Analysis Tools
and Processes
Integrated Decision Making
As well as:
•1R Program (pave mainly)
•Practical Design
Data Collection and Storage System
Data Reporting System
Inventory Data Collection and Storage System
Integrated Data Reporting System
Institutionalizing Asset Management
Analysis Tools and ProcessesIntegrated Analysis Tools
and Processes
Integrated Decision Making
Lifeline Routes:
Data Collection and Storage System
Data Reporting System
Inventory Data Collection and Storage System
Integrated Data Reporting System
Lifeline Routes:
•Incorporating
•Bridges
•Unstable slopes and rock fall
•Pavements
•Culverts
Key Principles for Progress
• Collect data once for use by many– Instead of collecting many times for one use
– TransInfo will have key role
• Location, location, locationLocation, location, location– Lynch-pin for integration (consistency = reliability)
• Start with the basics - Basic inventory– Type, size, location & First Level Condition
• Readiness and capacity built in stages– Work plan
Keenly Aware of Risks to System…
• Lack complete inventory – Culverts
– Unstable slopes
• Lack complete understanding of impacts– Seismic vulnerability of bridges
• Working hard to close the gaps in data
Conclusion
• 千里之行 始於足下
– A journey of a 1000 miles begins with a single step
• ODOT’s Asset Management:– No longer theory– Now implementing
• Actual work processes and procedures – Saving time– Better investments
How To Contact Us
Cathy Nelson: 503.986.3305 [email protected] Chief Engineer and Technical Services Manager
Laura Wipper: 503.986.4092 [email protected] Asset Management Integration Manager
ODOT Asset Management Integration Section555 13th Street NE, Suite 2Salem, OR 97301-6867Fax: 503.986.4173
Public: http://www.oregon.gov/ODOT/TD/asset_mgmt/index.shtmlIntranet: http://intranet.odot.state.or.us/otms/
5/2/2011
1
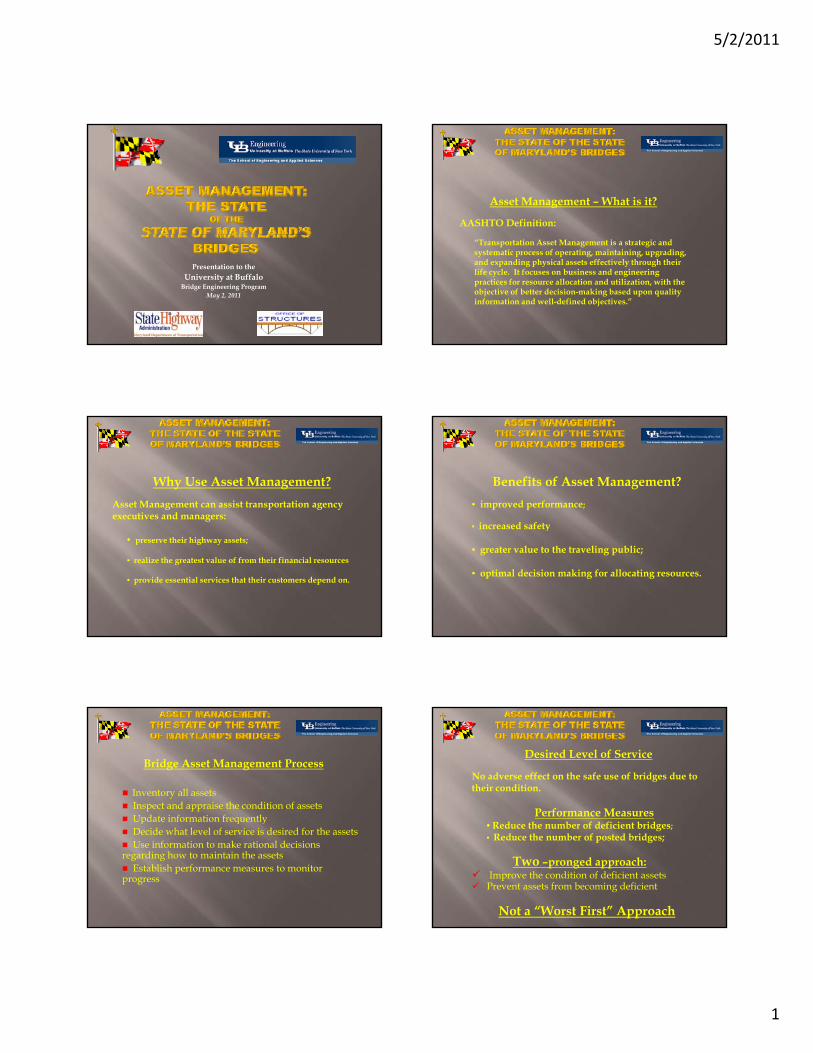
Presentation to theUniversity at Buffalo
Bridge Engineering Program May 2, 2011
Asset Management – What is it?
AASHTO Definition:
“Transportation Asset Management is a strategic and systematic process of operating, maintaining, upgrading, and expanding physical assets effectively through their life cycle. It focuses on business and engineering practices for resource allocation and utilization, with the objective of better decision-making based upon quality information and well-defined objectives.”
Why Use Asset Management?
Asset Management can assist transportation agency executives and managers:
• preserve their highway assets;
• realize the greatest value of from their financial resources
• provide essential services that their customers depend on.
Benefits of Asset Management?
• improved performance;
• increased safety• increased safety
• greater value to the traveling public;
• optimal decision making for allocating resources.
Bridge Asset Management Process
Inventory all assets Inspect and appraise the condition of assets Update information frequently Update information frequently Decide what level of service is desired for the assets Use information to make rational decisions regarding how to maintain the assets Establish performance measures to monitor progress
Desired Level of Service
No adverse effect on the safe use of bridges due to their condition.
Performance Measures• Reduce the number of deficient bridges;• Reduce the number of posted bridges;
Two –pronged approach: Improve the condition of deficient assets Prevent assets from becoming deficient
Not a “Worst First” Approach

5/2/2011
2
Maryland’s Bridges• By Number:
Total # - all Maryland bridges 5,156Total # - SHA bridges 2,576 (50%)
• By Area:Total area - all Maryland bridges 49M SFTotal area – SHA bridges 28M SF (57%)
• SHA’s Small StructuresTotal Number 4,127Small bridges (< 20’ long) 1,180Pipes (> 3 ft. dia. ) 1,965Retaining Walls 740 (over 50 miles)Noise Walls 242 (over 100 miles)
1064%
247096%
STRUCTURALLY DEFICIENT STATE BRIDGES
# Structurally Deficient96% # Structurally Deficient Bridges
# Non-Structurally Deficient Bridges
Total Number of State Bridges = 2576April 2011
163153 151 156
148 148
289 292283
274 274268
275
261256 252 256
249238 237
200
250
300
idg
es
OUTCOME: 18% decrease in structurally deficient local bridges since 1998.153 151 148 144 148 143 143
130 129
114107 106
0
50
100
150
1998 1999 2000 2001 2002 2003 2004 2005 2006 2007 2008 2009 2010 2011
Nu
mb
er o
f S
tru
ctu
rally
Def
icie
nt
Br
YearState SD Local SD
OUTCOME: 35% decrease in structurally deficient state bridges since 1998.
g 20%
25%
30%
35%
fici
ent
Bri
dg
es
Structurally Deficient Bridges by Owner Type
0%
5%
10%
15%
MD DE DC NJ NY NC OH PA VA WV Region USA
Per
cen
tag
e o
f S
tru
ctu
rally
Def
States in Mid-Atlantic RegionBridges owned by State Department of Transportation
Bridges owned by Local Governments and Others
Total - All Bridges in State
LEGEND:
Source of data - Federal Highway Administration website (www.fhwa.dot.gov/bridge/nbi) for 2010
5/2/2011
3
300
350
400
450
EL
EM
EN
TS
D
ER
LIN
E)
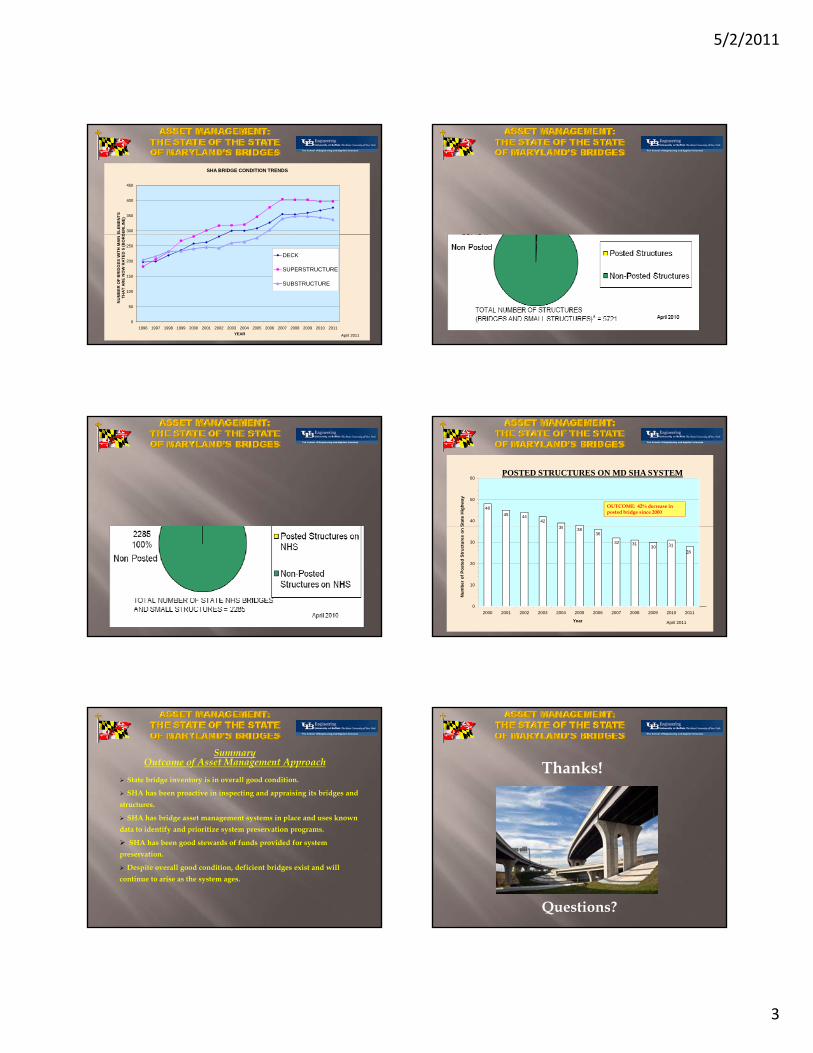
SHA BRIDGE CONDITION TRENDS
0
50
100
150
200
250
1996 1997 1998 1999 2000 2001 2002 2003 2004 2005 2006 2007 2008 2009 2010 2011
NU
MB
ER
OF
BR
IDG
ES
WIT
H M
AIN
T
HA
T A
RE
NO
W R
AT
ED
5 (
BO
RD
YEAR
DECK
SUPERSTRUCTURE
SUBSTRUCTURE
April 2011
48
45 4442
39
40
50
60POSTED STRUCTURES ON MD SHA SYSTEM
Sta
te H
igh
way
OUTCOME: 42% decrease in posted bridge since 2000
39 3836
32 31
0
10
20
30
2000 2001 2002 2003 2004 2005 2006 2007 2008 2009 2010 2011
30
Nu
mb
er o
f P
ost
ed S
tru
ctu
res
on
S
Year April 2011
2831
SummaryOutcome of Asset Management Approach
State bridge inventory is in overall good condition.
SHA has been proactive in inspecting and appraising its bridges and
structures.
SHA has bridge asset management systems in place and uses known SHA has bridge asset management systems in place and uses known
data to identify and prioritize system preservation programs.
SHA has been good stewards of funds provided for system
preservation.
Despite overall good condition, deficient bridges exist and will
continue to arise as the system ages.
Thanks!
Questions?


