Transport modelling supported by GIS – an overview … modelling supported by GIS – an overview...
9
Transport modelling supported by GIS – an overview of GIS features now within Cube T. Vorraa Citilabs Regional Director, UK Abstract This paper gives an overview of the GIS capabilities within the travel demand modelling software package Cube. An example project is used to explain how a transport model can benefit from using native GIS data sources and how GIS features in standard GIS packages such as ERSI’s ArcGIS can be combined with features in Cube to create a geodatabase ready for use with the transport model. 1 Introduction Cube is a family of software products that form a complete travel forecasting system providing exceptional, easy to use, capabilities for the comprehensive planning of transportation systems. It is one of the world’s most used travel demand forecasting suites and is based on legacy products TRIPS and TRANPLAN. Cube offers multiple modules that provide different functions for different tasks. Cube Base provides the interfaces for developing models, handling data and scenarios and for examining and displaying results. In its version 5, Cube has now embedded GIS features, powered by ESRI. The GIS features within Cube have been tested and used on numerous model applications already including a new traffic model developed for the Norwegian coastal town of Haugesund. The work getting together the data for this model is explained. 2 Cube Base Cube Base provides the interfaces for developing models, handling data and scenarios and for examining and displaying results. In its version 5, Cube has now embedded GIS features, powered by ESRI. www.witpress.com, ISSN 1743-3509 (on-line) WIT Transactions on The Built Environment, Vol 107, © 2009 WIT Press Urban Transport XV 235 doi:10.2495/UT090221
Transcript of Transport modelling supported by GIS – an overview … modelling supported by GIS – an overview...
Transport modelling supported by GIS – an overview of GIS features now within Cube
T. Vorraa Citilabs Regional Director, UK
Abstract
This paper gives an overview of the GIS capabilities within the travel demand modelling software package Cube. An example project is used to explain how a transport model can benefit from using native GIS data sources and how GIS features in standard GIS packages such as ERSI’s ArcGIS can be combined with features in Cube to create a geodatabase ready for use with the transport model.
1 Introduction
Cube is a family of software products that form a complete travel forecasting system providing exceptional, easy to use, capabilities for the comprehensive planning of transportation systems. It is one of the world’s most used travel demand forecasting suites and is based on legacy products TRIPS and TRANPLAN. Cube offers multiple modules that provide different functions for different tasks. Cube Base provides the interfaces for developing models, handling data and scenarios and for examining and displaying results. In its version 5, Cube has now embedded GIS features, powered by ESRI. The GIS features within Cube have been tested and used on numerous model applications already including a new traffic model developed for the Norwegian coastal town of Haugesund. The work getting together the data for this model is explained.
2 Cube Base
Cube Base provides the interfaces for developing models, handling data and scenarios and for examining and displaying results. In its version 5, Cube has now embedded GIS features, powered by ESRI.
www.witpress.com, ISSN 1743-3509 (on-line) WIT Transactions on The Built Environment, Vol 107, © 2009 WIT Press
Urban Transport XV 235
doi:10.2495/UT090221

Figure 1: Cube model interface – model and data management in Cube Base.
The following three components provide these capabilities.
2.1 GIS
At the core of the GIS is an embedded version of ESRI’s market leading ArcGIS, known as ArcGIS Engine. Citilabs developed a specialized application of this technology for transportation modelling by adding transportation topology rules fully exploited within its geodatabase, and a large number of transportation-specific editing and analysis tools. The GIS in Cube is an extremely powerful transportation GIS system that is directly compliant with ESRI technologies and provides many of ArcGIS’s capabilities, for example, on-the fly projections.
2.2 Application Manager or ‘AM’
This component is where the analyst designs and creates the model process. It has captured the hearts of many transportation specialists with it’s flow-chart method. It makes model design and development an intuitive and even pleasurable experience.
2.3 Scenario Manager or ‘SM’
Once the data have been put into place and checked using the GIS, and AM can be used to design and develop the model stream, it is time to use SM to apply the model. SM comes with tools to develop a user interface for the model. In fact, you can create many different user menus designed specifically for different types of users of the model. Expose all of the possibilities and complexities in
www.witpress.com, ISSN 1743-3509 (on-line) WIT Transactions on The Built Environment, Vol 107, © 2009 WIT Press
236 Urban Transport XV

the user menu for expert users and during model calibration, or create a simple user menu for non-specialists making the model easy to use. SM is where you can really take a complex model and make it as simple or complex as you like depending on the type of application and the experience and knowledge of the person using the model. SM is also where the analyst creates, manages and runs or batches their tests.
3 GIS editing and visualization in Cube Base
The GIS window displays the geographic information in a geodatabase as a map. The GIS window uses the ArcGIS application, ArcMap, to interpret geodatabase data and depict the corresponding map. The GIS window reads and writes to the geodatabase. Using the GIS window, you can edit geodatabase data, create maps, analyze data, and submit map-based queries. For example, you might use the GIS window to display and edit the geographic data in travel demand models, such as transportation networks and transportation analysis zones.
Figure 2: Spatial analysis in Cube.
The GIS window represents geographic information as a collection of layers along with defined elements in a map. Common map elements include a scale bar, north arrow, title, descriptive text, and a symbol legend. All data except for trip table and impedance data (matrices) may be stored in the geodatabase. The user may also store data in Citilabs’ formats such as *.net, *.lin, etc. By exploiting the geodatabase capability, data can be directly taken from any application using the ESRI geodatabase including ArcGIS. Equally,
www.witpress.com, ISSN 1743-3509 (on-line) WIT Transactions on The Built Environment, Vol 107, © 2009 WIT Press
Urban Transport XV 237
Figure 3: Network with image underlay.
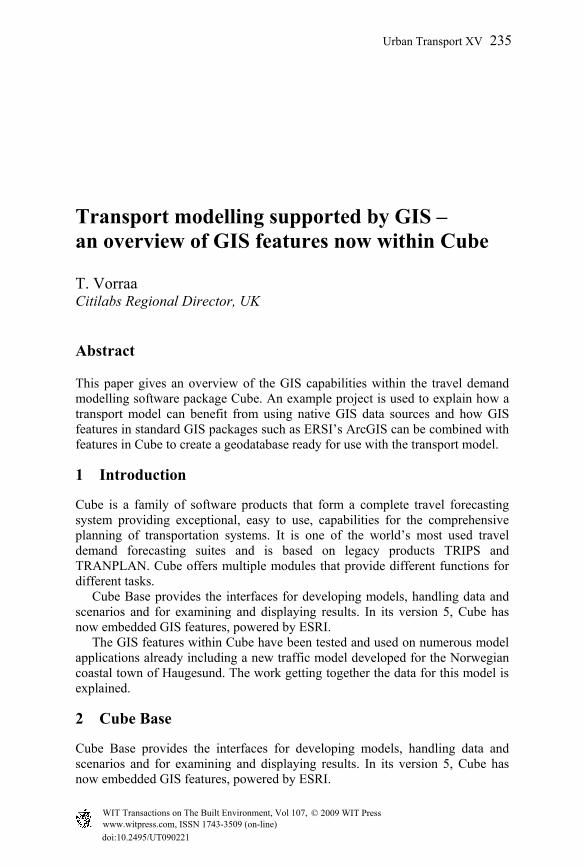
Figure 4: Geodatabase browser.
www.witpress.com, ISSN 1743-3509 (on-line) WIT Transactions on The Built Environment, Vol 107, © 2009 WIT Press
238 Urban Transport XV
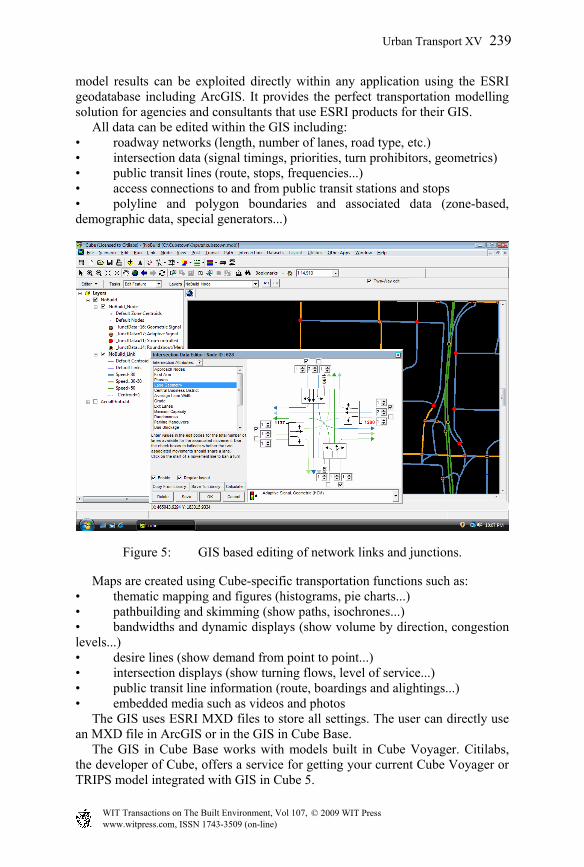
model results can be exploited directly within any application using the ESRI geodatabase including ArcGIS. It provides the perfect transportation modelling solution for agencies and consultants that use ESRI products for their GIS. All data can be edited within the GIS including: • roadway networks (length, number of lanes, road type, etc.) • intersection data (signal timings, priorities, turn prohibitors, geometrics) • public transit lines (route, stops, frequencies...) • access connections to and from public transit stations and stops • polyline and polygon boundaries and associated data (zone-based, demographic data, special generators...)
Figure 5: GIS based editing of network links and junctions.
Maps are created using Cube-specific transportation functions such as: • thematic mapping and figures (histograms, pie charts...) • pathbuilding and skimming (show paths, isochrones...) • bandwidths and dynamic displays (show volume by direction, congestion levels...) • desire lines (show demand from point to point...) • intersection displays (show turning flows, level of service...) • public transit line information (route, boardings and alightings...) • embedded media such as videos and photos The GIS uses ESRI MXD files to store all settings. The user can directly use an MXD file in ArcGIS or in the GIS in Cube Base. The GIS in Cube Base works with models built in Cube Voyager. Citilabs, the developer of Cube, offers a service for getting your current Cube Voyager or TRIPS model integrated with GIS in Cube 5.
www.witpress.com, ISSN 1743-3509 (on-line) WIT Transactions on The Built Environment, Vol 107, © 2009 WIT Press
Urban Transport XV 239

Figure 6: Desire line plot.
Figure 7: Workflow combining features of ArcGIS and Cube for creating the geodatabase for the Haugesund model.
4 Example application: combining ESRI’s ArcGIS with Cube GIS
One of the strengths of GIS is the availability of geo-data and the possibility for performing spatial analyses combining several data layers and sources to create the database needed for modelling transport. This comprises the street networks, public transport services and zonal census data. This type of functionality within
Arcgis 9.2
Microsoft Access
Zoning
Network
Demand Data
GEODATABA
SE
Cube Spatial Analysis
www.witpress.com, ISSN 1743-3509 (on-line) WIT Transactions on The Built Environment, Vol 107, © 2009 WIT Press
240 Urban Transport XV

Cube and ArcGIS was widely exploited in a recent model development for the Norwegian coastal town of Haugesund. Cube can store data in a ‘private’ geodatabase in MS Access MDB format and in ‘enterprise’ database solutions such as SQL, Oracle and others. For the Haugesund model, the MS Access MDB format was used and therefore the data handling was also supported by MS Access itself. The software and procedure used in the Haugesund model development project is described in bullet point style below.
4.1 Demand data
Software: Microsoft Access Data used were buildings type data, population data and zonal data These data were put into a Access Database “Demand_Data.mdb” and
were prepared for the spatial analyses needed for creating the model zones
4.2 Zone disaggregation
Software: ARCGIS 9.2 Starting from a wide area representing the whole of West-Norway only
the zones near Haugesund were considered and a layer of macro zones was created, (107 zones), figure 8.
Starting from this layer the macro zones were split in 351 micro zones that represent the modelled zones, figure 9.
The disaggregation of the zone boundary layer and the zonal data was done based on spatial calculations combining information about building types and population and employment statistics.
Figure 8: Macrozones.
www.witpress.com, ISSN 1743-3509 (on-line) WIT Transactions on The Built Environment, Vol 107, © 2009 WIT Press
Urban Transport XV 241

Figure 9: Microzones.
4.3 Network
Software: ARCGIS 9.2 Using spatial features in ArcGIS, the Haugesund model area network was
cut out from a national geodatabase Checks were made to ensure that two- and one-way links were coded
correctly Software: CUBE 5
The network was imported to the Cube geodatabase Centroid nodes (zonal points) were created using the zonal boundary
layer Centroid links were created using automated features in Cube Some new nodes were added by splitting links in order to avoid
connecting centroid links with intersections External zones were connected them to the network
4.4 Geodatabase
Software: CUBE 5 A new Geodatabase “Haugesund_Geodatabase.mdb” was created which
contains the network, the zonal layer and demand data etc…. A workspace file “Haugesund.mdx” was created to set up automated
views of data showing different characteristics of the network links, zones, nodes for model input and output data
5 Conclusions
Being able to combine the use of Cube GIS with ArcGIS and MS Access without having to convert data between the different software platforms brought great
www.witpress.com, ISSN 1743-3509 (on-line) WIT Transactions on The Built Environment, Vol 107, © 2009 WIT Press
242 Urban Transport XV

advantages to the project. One database was created for use with all three packages and the strengths of each package could be utilised in a very efficient way. For more information about Cube and its GIS capabilities, visit our web site, www.citilabs.com.
References
[1] Cube help system, version 5. May 2008 [2] Project report: Haugesund - Model development and Calibration. May 2008
www.witpress.com, ISSN 1743-3509 (on-line) WIT Transactions on The Built Environment, Vol 107, © 2009 WIT Press
Urban Transport XV 243