Transmission Access Charge Options - caiso.com
37
Transmission Access Charge Options Public Workshop – January 11, 2016 Lorenzo Kristov Principal, Market & Infrastructure Policy
Transcript of Transmission Access Charge Options - caiso.com

Transmission Access Charge Options
Public Workshop – January 11, 2016
Lorenzo Kristov
Principal, Market & Infrastructure Policy

Agenda
Time (PST) Topic Presenter
10:00-10:10Introduction and Stakeholder Process
OverviewKristina Osborne
10:10-10:30 Overview of PacifiCorp Benefit Study J.D. Podlesnik
10:30-12:00Background, scope of initiative and
important clarificationsLorenzo Kristov
12:00-12:45 Lunch break
12:45-2:45Discussion of issues raised in
submitted comments Lorenzo Kristov
2:45-3:00 Next Steps Kristina Osborne
Page 2

ISO Stakeholder Engagement Process:
Policy Development Phase
Paper Proposal Final
Proposal
Tariff Development Phase Implementation Phase
Draft Final
Tariff Tariff
Planning BPM Market
Documents Revisions SimulationBoard FERC
Go Live
Stakeholder Input
This diagram represents the typical process, often phases will run in parallel.
Page 3

ISO Stakeholder Process
Page 4
POLICY AND PLAN DEVELOPMENT
Issue
Paper Board
Stakeholder Input
We are here
Straw
Proposal
Draft Final
Proposal
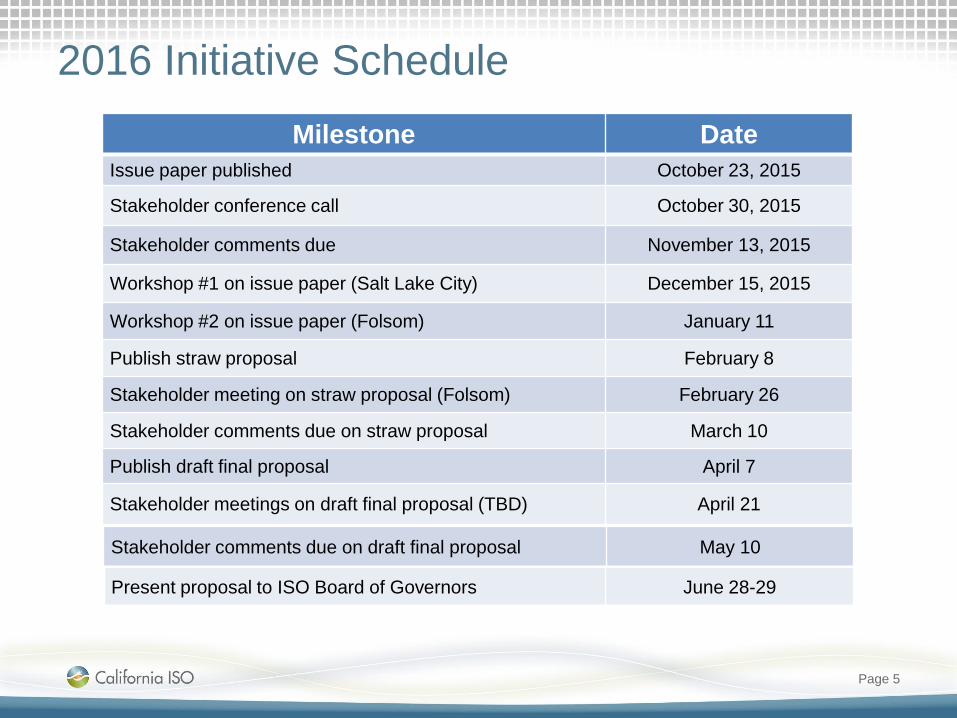
2016 Initiative Schedule
Milestone Date
Issue paper published October 23, 2015
Stakeholder conference call October 30, 2015
Stakeholder comments due November 13, 2015
Workshop #1 on issue paper (Salt Lake City) December 15, 2015
Workshop #2 on issue paper (Folsom) January 11
Publish straw proposal February 8
Stakeholder meeting on straw proposal (Folsom) February 26
Stakeholder comments due on straw proposal March 10
Publish draft final proposal April 7
Stakeholder meetings on draft final proposal (TBD) April 21
Page 5
Stakeholder comments due on draft final proposal May 10
Present proposal to ISO Board of Governors June 28-29
Overview of PacifiCorp Benefits Study
Page 6

Gross Benefits Study Key Findings
• Gross benefits study results were released October 13, 2015
• Integration of PacifiCorp and ISO systems results in significant benefits for both PacifiCorp and ISO customers over 20 year period of 2020-2039:
Savings in 2015$ Billions and incremental to EIM benefits
• The study quantifies benefits in four areas:
1. More efficient dispatch and commitment
2. Lower peak capacity savings
3. More efficient overgeneration management
4. Renewable procurement savings
• Additional benefits not quantified are discussed in the report
Area Low High
PacifiCorp $1.6 $2.3
ISO $1.8 $6.8
Combined Benefit: $3.4 $9.1
http://www.caiso.com/Documents/StudyBenefits-PacifiCorp-ISOIntegration.pdf
http://www.caiso.com/Documents/Study-TechnicalAppendix-Benefits-PacifiCorp-ISOIntegration.PDF

Gross Benefits Study Conclusions
• Quantified benefits for PacifiCorp and ISO customers are significant and growing over time
• Savings are sufficient to support continued progress and review toward PacifiCorp and ISO integration
• Over time, integration would provide PacifiCorp and ISO customers greater flexibility to respond to ongoing changes in state and federal environmental policies, to develop renewable energy, and to reduce greenhouse gas emissions at a lower cost
• High-value, longer-term savings are linked to planning and investment decisions that require long lead times and clear guidance

Background, scope of initiative and
important clarifications
Page 9

Transmission Access Charge (TAC) is ISO’s mechanism
for transmission-owning utilities to recover their costs of
transmission assets.
• A transmission-owning utility transferring operational
control to the ISO becomes a “participating transmission
owner” (PTO)
• The PTO continues to own, maintain and operate
transmission assets turned over to ISO operational
control
• ISO “operational control” involves performing balancing
authority area (BAA) functions through day-ahead and
real-time markets
• Cost of transmission is less than 10% of electricity cost
Page 10
ISO market system integrates reliable operation with
energy transactions.
• Day-ahead and real-time markets perform essential BAA
functions:
– Schedule use of the grid by suppliers and load-serving entities
– Maintain supply-demand balance and reliable grid operation
– Manage congestion to ensure schedules are feasible
• ISO market settlements manage and clear transactions
related to grid and market use
– ISO invoices grid and market users for transmission service and
market energy transactions
– Invoices include TAC charges, which ISO redistributes to PTOs
– ISO charges TAC to wholesale load & exports; state regulators
decide how to pass TAC charges to retail customers
– ISO maintains financially neutral position, except for Grid
Management Charge (GMC) to pay for ISO servicesPage 11

Transmission-owning utilities recover costs of owning,
maintaining and operating transmission assets.
• PTO files “transmission revenue requirements” with FERC
for approval of costs to be recovered (TRR)
• The ISO uses a FERC-approved mechanism to recover the
TRR from users of the transmission system
• That mechanism is the Transmission Access Charge (TAC)
– The TRR amounts are approved at beginning of each year
– A $/MWh rate is calculated to fully recover TRR from internal load
and exports
– Balancing accounts enable periodic adjustment as needed to ensure
actual revenues equal approved recovery amounts
– Wheel-through transactions and some municipal load pay “wheeling
access charge” (WAC) – same charge by a different name
Page 12

FERC Order 890 (2007) set broad principles for
regional transmission cost allocation.
• Allows regional flexibility
• Weighs several factors, including
– Alignment of costs among participants
– Adequate incentives to construct new transmission
– General support from participants across the region
• Recognizes that cost allocation is not an exact science
Page 13

Order 1000 established six principles that apply to
regional cost allocation of newly approved projects.
1. Costs must be allocated in a way that is roughly commensurate with benefits
2. Costs may not be allocated involuntarily to those who do not benefit
3. A benefit to cost threshold may not exceed 1.25
4. Costs may not be allocated involuntarily to a region outside of the facility’s location
5. The process for determining benefits and beneficiaries must be transparent
6. A planning region may choose to use different allocation methods for different types of projects
Page 14
Cost allocation for new projects is linked with transmission
planning for the expanded BAA.
• Expanded TPP would include benefits determination for proposed transmission projects
• Design of future TPP for expanded BAA will be subject of a new initiative to start late 2016– See “Regional Transitional Implementation Items” in ISO’s
12/15/15 Stakeholder Initiatives Catalog
– TAC Options initiative will not address transmission planning
• ISO’s current TPP is not the only possible design for a future TPP for the expanded BAA – Currently all reliability, policy & economic projects to be placed
under ISO operational control must be approved through the comprehensive TPP, including low voltage PTO-specific projects
– ISO’s function as planning coordinator does not require ISO to approve “local” or low-voltage projects
Page 15

Existing TAC structure for the current ISO region was
approved by FERC as part of Order 1000 compliance.
Existing TAC structure consists of:
• Postage stamp “regional” rate to recover TRR for all
facilities rated > 200 kV under ISO operational control
– $/MWh charge to all internal load and exports
• PTO-specific “local” rates to recover TRR for all facilities
rated < 200 kV under ISO operational control
– $/MWh charge to internal load in each PTO’s territory
• Load pays based on point of load interconnection to grid,
without regard to locations of supply resources
• Currently there is no differentiation of cost allocation based
on project type (e.g., reliability, economic, policy projects),
in-service date or other non-voltage level factors
Page 16
This initiative considers whether revisions to TAC
structure are appropriate when adding a new PTO with
a load service territory to the ISO.
• ISO is not assuming ex ante that revisions to existing
TAC structure are or are not needed
• Initiative focuses on “regional” or high-voltage TRR only
– Assume that < 200 kV costs continue to be recovered through
PTO-specific rates
• Focus on adding a PTO with load service obligation
– Entities who build transmission but have no load service territory
become PTOs under existing TAC structure, but have no load
that pays TAC
• Assume, initially, that TAC will continue to be charged as
a per-MWh rate to internal load and exports
Page 17

TAC versus Wheeling Access Charge (WAC)
• WAC rates are the same as TAC rates
• WAC is paid by wheeling schedules based on export
MWh
• WAC is paid by non-PTO load – municipal utilities
embedded within ISO BAA that are not PTOs –
based on load measured at “city gate” or point of
interconnection to the ISO controlled grid
Page 18
TAC versus transmission service contracts
• TRR recovery in other BAAs may be achieved through
sales of long-term transmission rights or contracts
• ISO’s TAC aligns with system of allocating transmission
use through the day-ahead and real-time markets
– ISO honors qualified pre-ISO legacy contracts but mostly uses
market allocation of transmission use
– TAC charge depends on load location and amount only, not on
locations of supply resources
• This initiative does not preclude possibility that new PTO
may maintain its qualified existing transmission contracts
upon joining the ISO
Page 19
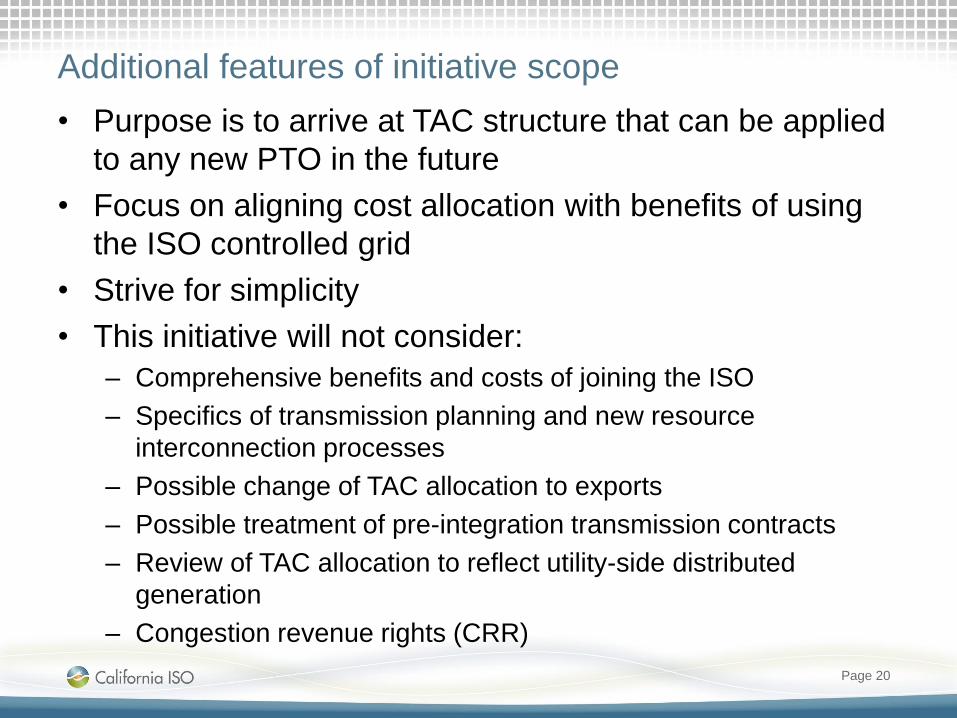
Additional features of initiative scope
• Purpose is to arrive at TAC structure that can be applied
to any new PTO in the future
• Focus on aligning cost allocation with benefits of using
the ISO controlled grid
• Strive for simplicity
• This initiative will not consider:
– Comprehensive benefits and costs of joining the ISO
– Specifics of transmission planning and new resource
interconnection processes
– Possible change of TAC allocation to exports
– Possible treatment of pre-integration transmission contracts
– Review of TAC allocation to reflect utility-side distributed
generation
– Congestion revenue rights (CRR)
Page 20
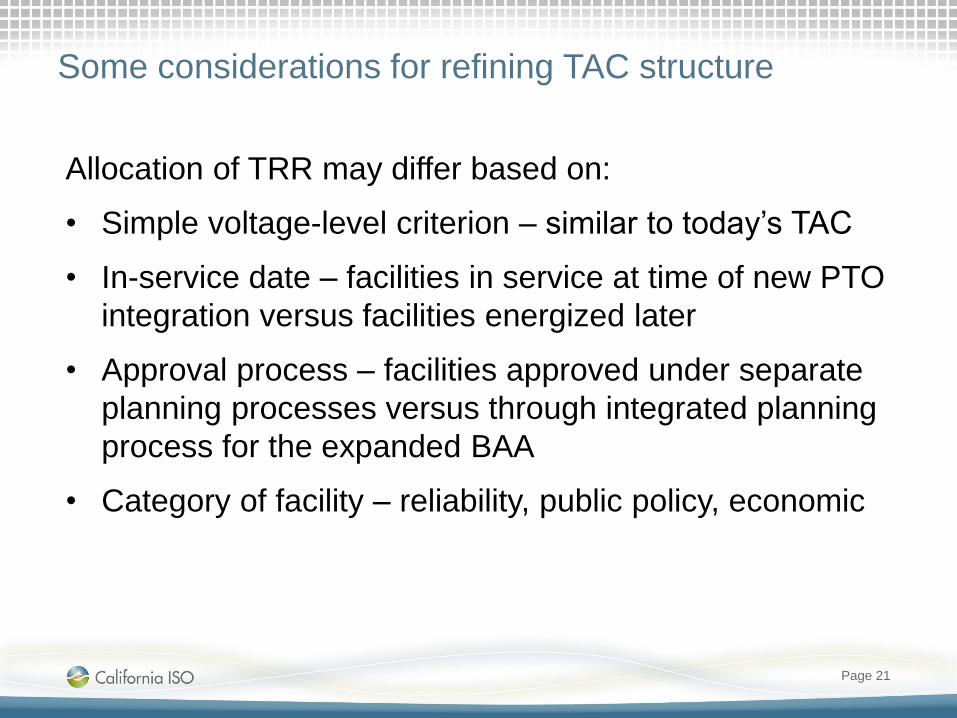
Some considerations for refining TAC structure
Allocation of TRR may differ based on:
• Simple voltage-level criterion – similar to today’s TAC
• In-service date – facilities in service at time of new PTO
integration versus facilities energized later
• Approval process – facilities approved under separate
planning processes versus through integrated planning
process for the expanded BAA
• Category of facility – reliability, public policy, economic
Page 21
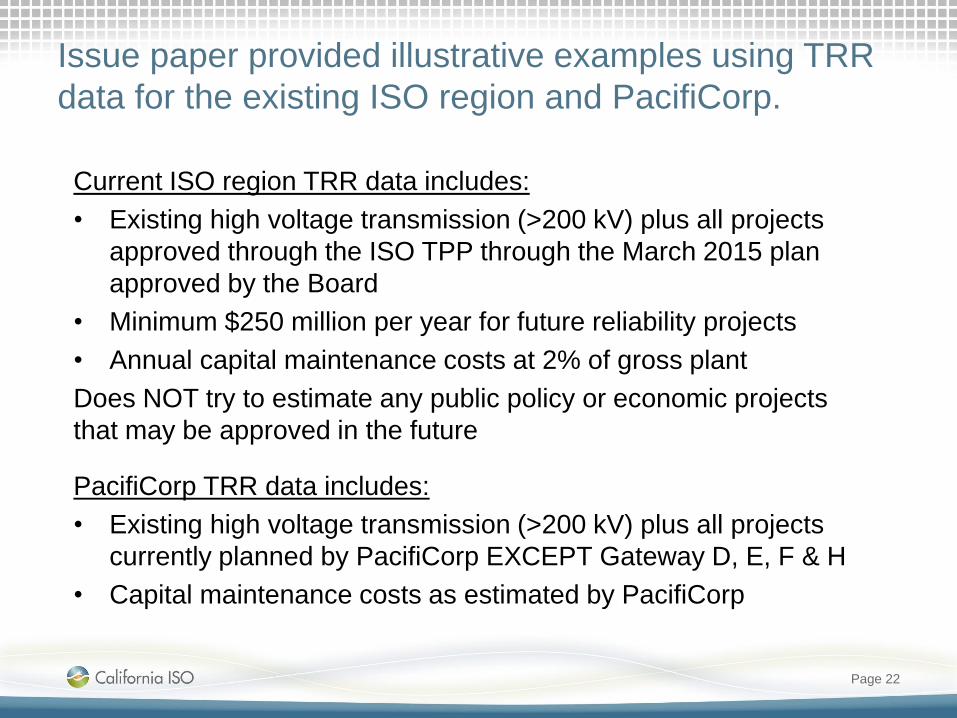
Issue paper provided illustrative examples using TRR
data for the existing ISO region and PacifiCorp.
Current ISO region TRR data includes:
• Existing high voltage transmission (>200 kV) plus all projects
approved through the ISO TPP through the March 2015 plan
approved by the Board
• Minimum $250 million per year for future reliability projects
• Annual capital maintenance costs at 2% of gross plant
Does NOT try to estimate any public policy or economic projects
that may be approved in the future
PacifiCorp TRR data includes:
• Existing high voltage transmission (>200 kV) plus all projects
currently planned by PacifiCorp EXCEPT Gateway D, E, F & H
• Capital maintenance costs as estimated by PacifiCorp
Page 22

Illustrative examples, based on PacifiCorp joining ISO
effective 1/1/2019.
• Baseline 1: Maintain separate sub-regional rates for
PacifiCorp and current ISO footprint
• Baseline 2: Immediately combine > 200 kV facilities into
a single postage stamp rate for the expanded BAA
• Alternative 1: Create postage stamp rate for > 300 kV
(i.e., 345 kV and 500 kV facilities), with separate sub-
regional rates for facilities between 200 and 300 kV
• Alternative 2: Use a 5-year phase-in period to go from
separate rates (Baseline 1) to Alternative 1 structure
Page 23
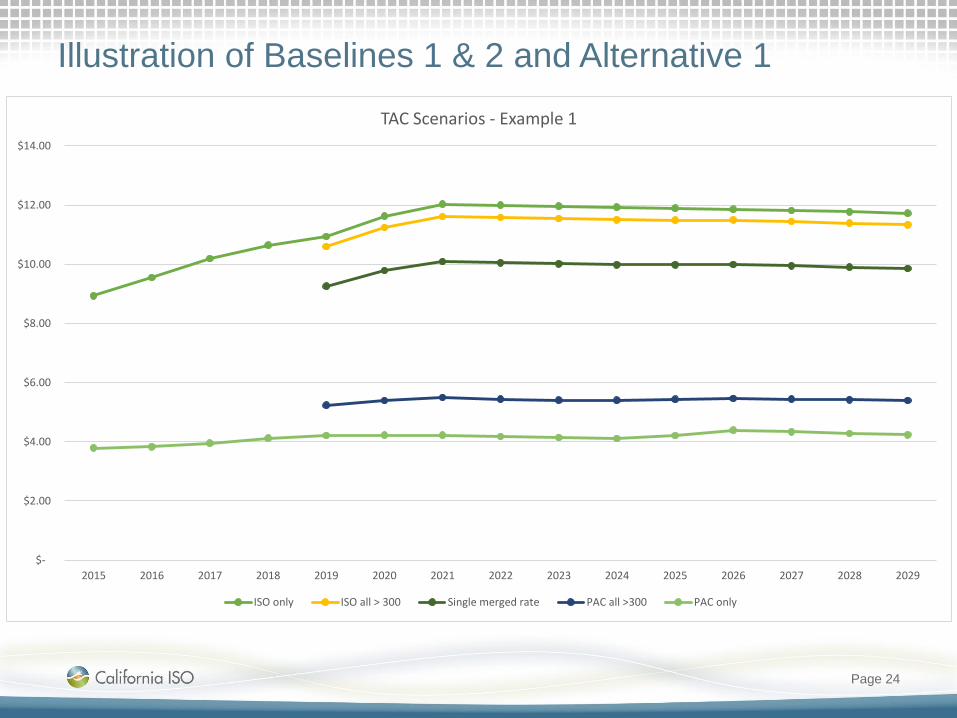
Illustration of Baselines 1 & 2 and Alternative 1
Page 24
$-
$2.00
$4.00
$6.00
$8.00
$10.00
$12.00
$14.00
2015 2016 2017 2018 2019 2020 2021 2022 2023 2024 2025 2026 2027 2028 2029
TAC Scenarios - Example 1
ISO only ISO all > 300 Single merged rate PAC all >300 PAC only

Previous slide, plus Alternative 2
Page 25
$-
$2.00
$4.00
$6.00
$8.00
$10.00
$12.00
$14.00
2015 2016 2017 2018 2019 2020 2021 2022 2023 2024 2025 2026 2027 2028 2029
TAC Scenarios - Example 2
ISO only ISO all > 300 Single merged rate PAC all >300 PAC only PAC transition ISO transition

How a multi-tiered TAC rate works
• Consider example of Alternative 1 above
• TAC charge to load is based on voltage level of load
take-out point on the ISO controlled grid
– Load connected at >300 kV pays only >300 region-wide TAC
– Load connected at 230 kV pays sub-regional 230 kV TAC plus
>300 region-wide rate
– Load connected at <200 kV but still ISO controlled grid pays
local PTO-specific TAC plus sub-regional 230 kV TAC plus
>300 region-wide rate
• The load-serving entity’s choice of supply resources
has no effect on its TAC payment
• There are no imports or exports within the expanded
BAAPage 26

Impacts of potential future transmission upgrades
• ISO is preparing a spreadsheet for parties to use to
estimate impacts of future transmission upgrades
• Spreadsheet will contain the aggregated data used to
calculate examples in Issue Paper
– Projected high-voltage TRR for current ISO BAA and PacifiCorp
in 200-300 kV category and >300 kV category
– Projected MWh billing determinant (internal load & exports)
• Brief user guide will offer guidelines for incorporating
new projects – e.g., converting capital cost to annual
revenue requirements
• Spreadsheet will be posted later in January
Page 27
Discussion of issues raised in
submitted comments
Page 28

1. Importance of aligning transmission cost allocation
with the distribution of benefits
Partial list of submitted comments
• It is crucial to identify project costs and allocate those
costs to beneficiaries
• Benefits must be measured quantitatively
• Concern over cost shifting due to blending costs of
existing facilities
• Voltage-based TAC structure provides good alignment of
costs and benefits and meets all Order 1000 criteria
• Need to specify scope of benefits to be considered:
– Does a project driven by one state’s policy benefit only that
state’s customers?
Page 29
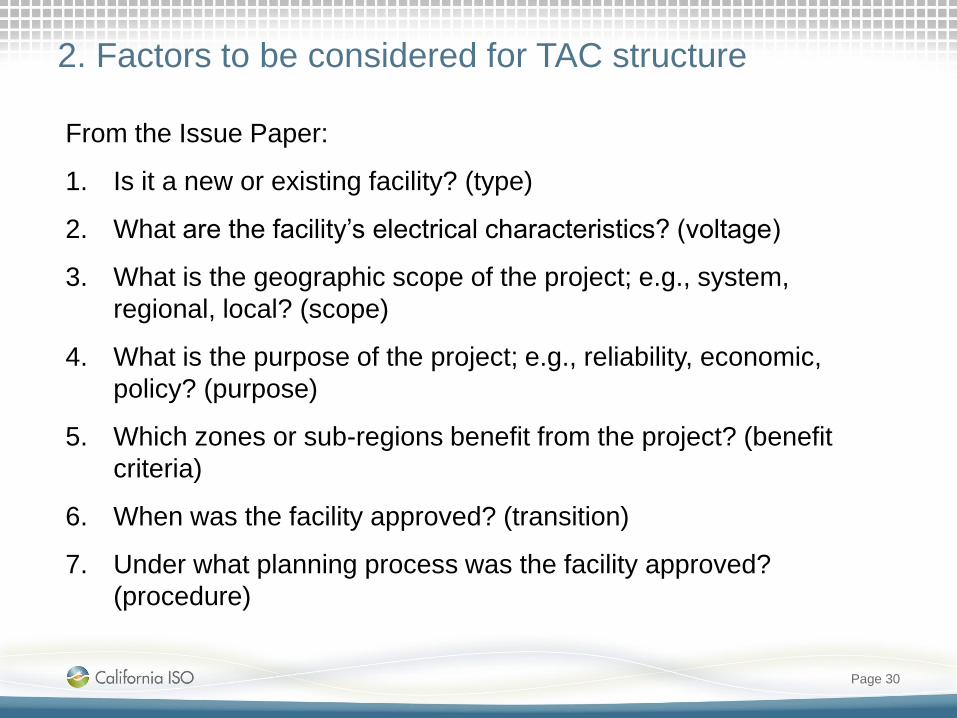
2. Factors to be considered for TAC structure
From the Issue Paper:
1. Is it a new or existing facility? (type)
2. What are the facility’s electrical characteristics? (voltage)
3. What is the geographic scope of the project; e.g., system,
regional, local? (scope)
4. What is the purpose of the project; e.g., reliability, economic,
policy? (purpose)
5. Which zones or sub-regions benefit from the project? (benefit
criteria)
6. When was the facility approved? (transition)
7. Under what planning process was the facility approved?
(procedure)
Page 30

Almost all factors were identified by some
stakeholders as high priority.
• Most important factors
– cost assignment of existing facilities
– facility approval process
– identifying beneficiaries
– identifying the purpose of a transmission project
– electrical characteristics of a facility
– geographical scope of the transmission project
Page 31

3. Voltage-level as cost allocation criterion
• Many commenters supported the use of a voltage
criterion.
• Many said that voltage-level should only be one of
several factors in cost allocation.
• Non-supporters believe that a high voltage split does not
accurately allocate costs to beneficiaries.
• Some commenters requested more data in order to
determine if the criterion would correctly allocate costs.
Page 32
4. Type of transmission facility – reliability, economic,
policy – as a cost-allocation criterion
• A majority of commenters did not support using facility
type for cost allocation.
• The main reason given was the difficulty of placing all
benefits of a facility into one category.
• Those who support the criterion believe that it would
add transparency to identifying and aligning benefits
with costs.
Page 33

5. In-service date as a cost allocation criterion
• Cost allocation might differ based on three categories:
– Pre-existing facilities prior to opening negotiations to join the ISO
– New facilities placed in service while in negotiations
– New facilities placed in service after the new PTO joins the ISO
• Commenters expressed mixed views on the use of in-
service date for cost allocation
• Main argument was that all facilities should be examined
under the same assessment regardless of timing of the
development, construction, and operation.
Page 34

6. Planning process in which facility was approved as
a cost allocation criterion
• Facilities approved under different planning processes:
– Approved under separate planning processes conducted by
prospective PTO and existing ISO PTOs
– Approved under a comprehensive planning process that includes
ISO PTOs along with a new PTO
• No prevalent position on this question
• Most commenters said the ISO should perform its
approved planning process, especially if the project is
above a certain economic threshold.
Page 35

7. Use of “sub-regional” TAC rates as in Alternative 1
in the issue paper
• This criterion gained the most interest from commenters.
• Many commenters asked for more details on how this
approach might work.
Page 36

Next Steps
Policy Development Leads:
• Lorenzo Kristov ([email protected])
• Eric Kim ([email protected])
Page 37
Additional questions or comments can be directed to
Materials related to this initiative are available on the ISO website athttp://www.caiso.com/informed/Pages/StakeholderProcesses/TransmissionAccessChargeOptions.aspx
Item Date
Publish straw proposal February 8
Stakeholder meeting on straw proposal (Folsom) February 26
Stakeholder comments due on straw proposal March 10