Transcriptome profiling of developmental and xenobiotic responses in a keystone soil animal, the...
21
BioMed Central Page 1 of 21 (page number not for citation purposes) BMC Genomics Open Access Research article Transcriptome profiling of developmental and xenobiotic responses in a keystone soil animal, the oligochaete annelid Lumbricus rubellus Jennifer Owen †1 , B Ann Hedley †2 , Claus Svendsen 3 , Jodie Wren 1,3 , Martijs J Jonker 4 , Peter K Hankard 3 , Linsey J Lister 3 , Stephen R Stürzenbaum 5 , A John Morgan 1 , David J Spurgeon 3 , Mark L Blaxter* 2 and Peter Kille 1 Address: 1 Cardiff School of Biosciences, BIOSI 1, University of Cardiff, P.O. Box 915, Cardiff, CF10 3TL, UK, 2 Institute of Evolutionary Biology, University of Edinburgh, King's Buildings, Edinburgh, EH9 3JT, UK, 3 Centre for Ecology and Hydrology, Monks Wood, Abbots Ripton, Huntingdon, Cambridgeshire, PE28 2LS, UK, 4 Microarray Department and Integrative Bioinformatics Unit, Faculty of Science, University of Amsterdam, Kruislaan 318, Building I, Room 105C, 1098 SM Amsterdam, The Netherlands and 5 School of Biomedical and Health Sciences, Pharmaceutical Sciences Division, Franklin Wilkins Building 150, Stamford St., London, SE1 9NH, UK Email: Jennifer Owen - [email protected]; B Ann Hedley - [email protected]; Claus Svendsen - [email protected]; Jodie Wren - [email protected]; Martijs J Jonker - [email protected]; Peter K Hankard - [email protected]; Linsey J Lister - [email protected]; Stephen R Stürzenbaum - [email protected]; A John Morgan - [email protected]; David J Spurgeon - [email protected]; Mark L Blaxter* - [email protected]; Peter Kille - [email protected] * Corresponding author †Equal contributors Abstract Background: Natural contamination and anthropogenic pollution of soils are likely to be major determinants of functioning and survival of keystone invertebrate taxa. Soil animals will have both evolutionary adaptation and genetically programmed responses to these toxic chemicals, but mechanistic understanding of such is sparse. The clitellate annelid Lumbricus rubellus is a model organism for soil health testing, but genetic data have been lacking. Results: We generated a 17,000 sequence expressed sequence tag dataset, defining ~8,100 different putative genes, and built an 8,000-element transcriptome microarray for L. rubellus. Strikingly, less than half the putative genes (43%) were assigned annotations from the gene ontology (GO) system; this reflects the phylogenetic uniqueness of earthworms compared to the well- annotated model animals. The microarray was used to identify adult- and juvenile-specific transcript profiles in untreated animals and to determine dose-response transcription profiles following exposure to three xenobiotics from different chemical classes: inorganic (the metal cadmium), organic (the polycyclic aromatic hydrocarbon fluoranthene), and agrochemical (the herbicide atrazine). Analysis of these profiles revealed compound-specific fingerprints which identify the molecular responses of this annelid to each contaminant. The data and analyses are available in an integrated database, LumbriBASE. Conclusion: L. rubellus has a complex response to contaminant exposure, but this can be efficiently analysed using molecular methods, revealing unique response profiles for different classes of effector. These profiles may assist in the development of novel monitoring or bioremediation protocols, as well as in understanding the ecosystem effects of exposure. Published: 3 June 2008 BMC Genomics 2008, 9:266 doi:10.1186/1471-2164-9-266 Received: 16 October 2007 Accepted: 3 June 2008 This article is available from: http://www.biomedcentral.com/1471-2164/9/266 © 2008 Owen et al; licensee BioMed Central Ltd. This is an Open Access article distributed under the terms of the Creative Commons Attribution License (http://creativecommons.org/licenses/by/2.0 ), which permits unrestricted use, distribution, and reproduction in any medium, provided the original work is properly cited.
-
Upload
jennifer-owen -
Category
Documents
-
view
213 -
download
1
Transcript of Transcriptome profiling of developmental and xenobiotic responses in a keystone soil animal, the...
BioMed CentralBMC Genomics
ss
Open AcceResearch articleTranscriptome profiling of developmental and xenobiotic responses in a keystone soil animal, the oligochaete annelid Lumbricus rubellusJennifer Owen†1, B Ann Hedley†2, Claus Svendsen3, Jodie Wren1,3, Martijs J Jonker4, Peter K Hankard3, Linsey J Lister3, Stephen R Stürzenbaum5, A John Morgan1, David J Spurgeon3, Mark L Blaxter*2 and Peter Kille1Address: 1Cardiff School of Biosciences, BIOSI 1, University of Cardiff, P.O. Box 915, Cardiff, CF10 3TL, UK, 2Institute of Evolutionary Biology, University of Edinburgh, King's Buildings, Edinburgh, EH9 3JT, UK, 3Centre for Ecology and Hydrology, Monks Wood, Abbots Ripton, Huntingdon, Cambridgeshire, PE28 2LS, UK, 4Microarray Department and Integrative Bioinformatics Unit, Faculty of Science, University of Amsterdam, Kruislaan 318, Building I, Room 105C, 1098 SM Amsterdam, The Netherlands and 5School of Biomedical and Health Sciences, Pharmaceutical Sciences Division, Franklin Wilkins Building 150, Stamford St., London, SE1 9NH, UK
Email: Jennifer Owen - [email protected]; B Ann Hedley - [email protected]; Claus Svendsen - [email protected]; Jodie Wren - [email protected]; Martijs J Jonker - [email protected]; Peter K Hankard - [email protected]; Linsey J Lister - [email protected]; Stephen R Stürzenbaum - [email protected]; A John Morgan - [email protected]; David J Spurgeon - [email protected]; Mark L Blaxter* - [email protected]; Peter Kille - [email protected]
* Corresponding author †Equal contributors
AbstractBackground: Natural contamination and anthropogenic pollution of soils are likely to be majordeterminants of functioning and survival of keystone invertebrate taxa. Soil animals will have bothevolutionary adaptation and genetically programmed responses to these toxic chemicals, butmechanistic understanding of such is sparse. The clitellate annelid Lumbricus rubellus is a modelorganism for soil health testing, but genetic data have been lacking.
Results: We generated a 17,000 sequence expressed sequence tag dataset, defining ~8,100different putative genes, and built an 8,000-element transcriptome microarray for L. rubellus.Strikingly, less than half the putative genes (43%) were assigned annotations from the gene ontology(GO) system; this reflects the phylogenetic uniqueness of earthworms compared to the well-annotated model animals. The microarray was used to identify adult- and juvenile-specific transcriptprofiles in untreated animals and to determine dose-response transcription profiles followingexposure to three xenobiotics from different chemical classes: inorganic (the metal cadmium),organic (the polycyclic aromatic hydrocarbon fluoranthene), and agrochemical (the herbicideatrazine). Analysis of these profiles revealed compound-specific fingerprints which identify themolecular responses of this annelid to each contaminant. The data and analyses are available in anintegrated database, LumbriBASE.
Conclusion: L. rubellus has a complex response to contaminant exposure, but this can be efficientlyanalysed using molecular methods, revealing unique response profiles for different classes ofeffector. These profiles may assist in the development of novel monitoring or bioremediationprotocols, as well as in understanding the ecosystem effects of exposure.
Published: 3 June 2008
BMC Genomics 2008, 9:266 doi:10.1186/1471-2164-9-266
Received: 16 October 2007Accepted: 3 June 2008
This article is available from: http://www.biomedcentral.com/1471-2164/9/266
© 2008 Owen et al; licensee BioMed Central Ltd. This is an Open Access article distributed under the terms of the Creative Commons Attribution License (http://creativecommons.org/licenses/by/2.0), which permits unrestricted use, distribution, and reproduction in any medium, provided the original work is properly cited.
Page 1 of 21(page number not for citation purposes)

BMC Genomics 2008, 9:266 http://www.biomedcentral.com/1471-2164/9/266
BackgroundEver since Charles Darwin's classic work [1], earthworms(Phylum Annelida, Class Oligochaeta) have beenrenowned as 'ecosystem engineers' in recognition of thedirect and indirect effects they have on water, nutrient andcarbon cycling in temperate and tropical soils [2]. Earth-worms have therefore been widely adopted by interna-tional and national agencies for the diagnosis of soilecosystem health, and for predicting the potential envi-ronmental impact of xenobiotics, such as industrial chem-icals, pesticides and medicines, from anthropogenicsources [3]. Quantification of chemical toxicity to earth-worms currently relies on measuring the effects of expo-sure on key life-history traits (survival, growth, andreproduction) in standardised laboratory bioassays con-ducted with certain test species (Eisenia fetida, Eiseniaandrei and Lumbricus rubellus). These bioassays can pro-duce sensitive estimates of population effects, but are notsuited to elucidation of mechanisms of action, and thusmay be difficult to generalise from. For example, xenobi-otic exposure may affect individual physiology, cocoon-lay rates, cocoon viability and juvenile growth rates in aspecific manner, resulting in different outcomes for popu-lation growth rate and age structure.
Complementing measurements of gross toxicity withmolecular profiling and genomic studies can make plainthe modes of action of specific xenobiotics and identifythe generality of biological process affected as well as themolecular response pathways invoked [4-8]. Taking a spe-cific example, it has been observed that L. rubellus is ableto colonise highly metal-contaminated environments[8,9]. Detailed work identified that the primary moleculesresponsible for this metal tolerance were earthworm met-allothioneins [10-15]. Though successful, the progress ofthese mechanistic studies has been handicapped by thelack of available sequence data for earthworms in publicdatabases and the finding that very few (<30%) of the fewavailable earthworm gene fragments could be identifiedby sequence similarity to previously sequenced genes.
To help bridge this gap in available sequence information,a previously described small-scale (600 sequences)expressed sequence tag (EST) dataset for L. rubellus wasgenerated [16]. This has prompted the extended survey ofthe L. rubellus transcribed genome through extensive sam-pling of additional cDNA libraries from earthworms atdefined lifecycle stages (late embryo, juvenile, adult), spe-cific tissues (anterior segments and reproductive organs)and following acute exposure to model chemicals repre-senting three different contaminant classes: inorganic (thenonessential heavy metal cadmium [Cd] and the essentialmetal copper [Cu]), organic (the polycyclic aromatichydrocarbon [PAH], fluoranthene [FLA]), and agrochem-ical (the herbicide atrazine [ATZ]) that is reported here.
From this transcriptome resource, we defined ~8100genes, and have fabricated a cDNA microarray to investi-gate the transcriptome responses of L. rubellus throughnormal growth and following sub-lethal exposure to aseries of sub-lethal concentrations of Cd, FLA, and ATZ.From the derived transcript profiles we identify the keymolecular responses and biochemical pathways associ-ated with each life-stage treatment, and propose mecha-nisms of action for the three chemicals.
Results and DiscussionGeneration of ESTs from cDNA libraries spanning the L. rubellus lifecycle and following exposure to target chemicalsWe generated 17,225 high-quality ESTs from nine differ-ent cDNA libraries constructed from L. rubellus raisedunder defined conditions (Table 1 and Additional File 1;all sequences are available in EMBL/GenBank/DDBJ andin the project database LumbriBASE [see below]). Wemaximised the gene discovery rate by screening out, fromsome libraries, a small number of highly-expressedmRNAs (identified as clusters with many members afterinitial sequencing of ~4,000 ESTs). The ESTs were clus-tered using the PartiGene suite of tools [17] and 8,129clusters (different putative genes, named using permanentidentifiers of the form 'LRC#####') were defined. Thisnumber of putative genes is likely to be an overestimatebecause (1) alternative splice forms may be assembledinto different clusters, (2) the partial nature of ESTs mayresult in non-overlap between sequences from the samemRNA, and (3) our earthworms were drawn from an out-bred source and allelic variation is likely. Within-datasetanalyses suggested that the effects of these factors areminor, and that the true diversity in the dataset is ~8,000different loci. If, like other non-vertebrates, L. rubellus hasbetween 15,000 and 20,000 protein-coding genes, thesequencing effort has generated sequence tags for ~40–50% of all genes in this key species.
Clusters (putative genes) with one EST member accountedfor 53% (5361) of all clusters (Figure 1). There were 7913clusters containing ten or fewer ESTs (97% of the total),and only 20 clusters had over 50 ESTs. Of the clusters withmore than one EST, approximately 50% were library-spe-cific. Such specificity may simply reflect the low density ofsampling rather than real expression differences betweenlibraries. For each cluster, we derived a consensus cDNAsequence, and from this derived a putative protein trans-lation using prot4EST [18]. Some clusters (281) yieldedmore than one consensus, possibly due to alternativesplice forms or divergent alleles. Across all the L. rubelluslibraries, the 8,129 consensus sequences had a meanlength of 611 bases (± 243) (Table 1). The mean length ofL. rubellus putative proteins was 107 amino acids (i.e. 53%of the mean consensus length). Variation in mean protein
Page 2 of 21(page number not for citation purposes)

BMC Genomics 2008, 9:266 http://www.biomedcentral.com/1471-2164/9/266
length between libraries was directly related to the varia-tion in consensus length.
The sequence and annotation data (including clustering,consensus sequences, predicted protein sequences, andfunctional categorisations) are available in a relationaldatabase, LumbriBASE. The database has been used as aworkbench for our analyses (including microarray experi-ment annotation and visualisation; see below), and is pre-sented on the web through a PHP-scripted interface [19].
Functional annotation of the L. rubellus gene setGene ontology (GO) terms [20] were assigned to L. rubel-lus predicted proteins using GOtcha [21] and the analysissummarised by assessing representation of higher-level(GOSlim) terms (Figure 2). Less than half (3460; 43%) ofthe putative protein translations were assigned a GO termat a confidence greater than 50. This apparently high pro-portion of unannotated genes in L. rubellus can be
explained by our application of the conservative GOtchaalgorithm and by the paucity of genomic informationfrom other annelid species. For those GOSlim "Function"and "Process" categories with a mean representationacross all libraries of ≥ 1, we examined under- and over-representation in each library (Figure 2). The developingcocoon library had the highest representation of nucleicacid binding, nucleotide binding, chaperone, and proteinbinding, likely derived from the presence of actively devel-oping embryos in these animals, while the juvenile libraryhad an over representation of lipid-binding annotations(Figure 2A). As expected, the control adult library waslacking in terms associated with heavy metal bindingcompared to libraries derived from Cu- or Cd-treatedearthworms. However, unexpectedly, the library fromFLA-exposed animals also had increased representation ofthis annotation. The FLA library also exhibited overrepre-sentation of carbohydrate-binding and FK506-sensitivepeptidyl-prolyl isomerase annotations. In the library from
Table 1: The Lumbricus rubellus Expressed Sequence Tag dataset.
Library Earthworm treatment regime1 Number of ESTs
Mean EST length (bp) ESTs ± SD
No. of clusters (putative genes)2
Mean consensus length (bp)
Mean translation length (aa)
Redundancy (ESTs/gene)
1 Adult worms collected from a control field site and acclimatised to test condition in the laboratory
1173 550.4 (± 132.7) 718 759.9 (± 350.7_
195.5 (± 103.5)
1.634
2 Late developmental stage (~5 weeks post laying) embryonic tissue dissected from cocoons laid by paired unexposed adult worms
2728 622.6 (± 85.9) 1314 772.4 (± 291.6)
148.7 (± 95.4) 2.076
3 ~40 day post hatch juveniles (at mid log growth phase = approximately 300 mg) reared from hatchling emerging from cocoons laid by paired unexposed adult worms
2859 405.8 (± 125.9) 1757 598.0 (± 328.0)
106.5 (± 84.7) 1.627
4 Head enriched (anterior segments 1–33) from acclimatised adult worms
2569 537.5 (± 173.0) 1357 655.6 (± 301.8)
114.4 (± 89.6) 1.893
5 Mix of tissue from acclimatised adult worms exposed to either 50, 200 or 600 mg Cd/kg dry soil
2230 405.8 (± 125.9) 1548 710.9 (± 291.6)
113.7 (± 84.2) 1.441
6 Mix of tissue from acclimatised adult worms exposed to either 62, 140, 316, 711 and 1066 mg FLA/kg dry soil
2336 566.7 (± 133.1) 1625 732.3 (± 307.6)
145.9 (± 96.8) 1.438
7 Mix of tissue from acclimatised adult worms exposed to either 12 and 35 mg ATZ/kg dry soil
1739 568.2 (± 169.1) 1386 706.0 (± 299.5)
124.5 (± 91.7) 1.255
8 Mix of tissue from acclimatised adult worms exposed to either 40, 160, 460 and 480 mg Cu/kg dry soil
1518 544.0 (± 176.9) 1084 662.0 (± 283.1)
122.3 (± 85.7) 1.400
9 Reproductive organs (following a subtractive hybridisation protocol)
73 321.2 (± 94.9) 66 372.7 (± 212.2)
87.3 (± 58.3) 1.106
Total 17225 539.7 (± 155.0) 8129 611.0 (± 243.0)
107.4 (± 74.9) 2.119
1. See Additional File 1 for more detailed descriptions of the libraries used.2. A cluster is counted as derived from a library if it contains at least one EST from that library. Thus the longest cluster (LRC00201, encoding paramyosin) contains ESTs from five of the nine libraries and counts as a member of all five.
Page 3 of 21(page number not for citation purposes)

BMC Genomics 2008, 9:266 http://www.biomedcentral.com/1471-2164/9/266
Cd-treated animals both receptor signalling and globinclasses were abundant compared to other libraries, per-haps reflecting the interference of Cd with the functions ofother, essential metals. In the less-closely defined "proc-ess" categories, Cd-treated and juvenile worm-derivedlibraries had more annotations of 'cell death' than otherlibraries (Figure 2B). Many of these general observationswere confirmed through the use of microarrays (seebelow).
The only other "soil" animal for which extensive geneannotation data exist is the rhabditid nematodeCaenorhabditis elegans, though ecotoxicology analysesfocussed on this species are limited [22]. Identification ofpossible orthologues between L. rubellus and C. elegansusing BLAST similarity identified 1009 (12%) L. rubellussequences with a BLAST hit in the C. elegans proteome(Wormpep 145) with an e-value of less than 1e-25, 569 ofwhich were reciprocal top hits between the species (iden-tified on the protein report pages of LumbriBASE). Ofthese, 158 had annotations relating to C. elegans RNAiexperiments (as represented in WormBase [23]) but thesewere largely uninformative as to biological function.
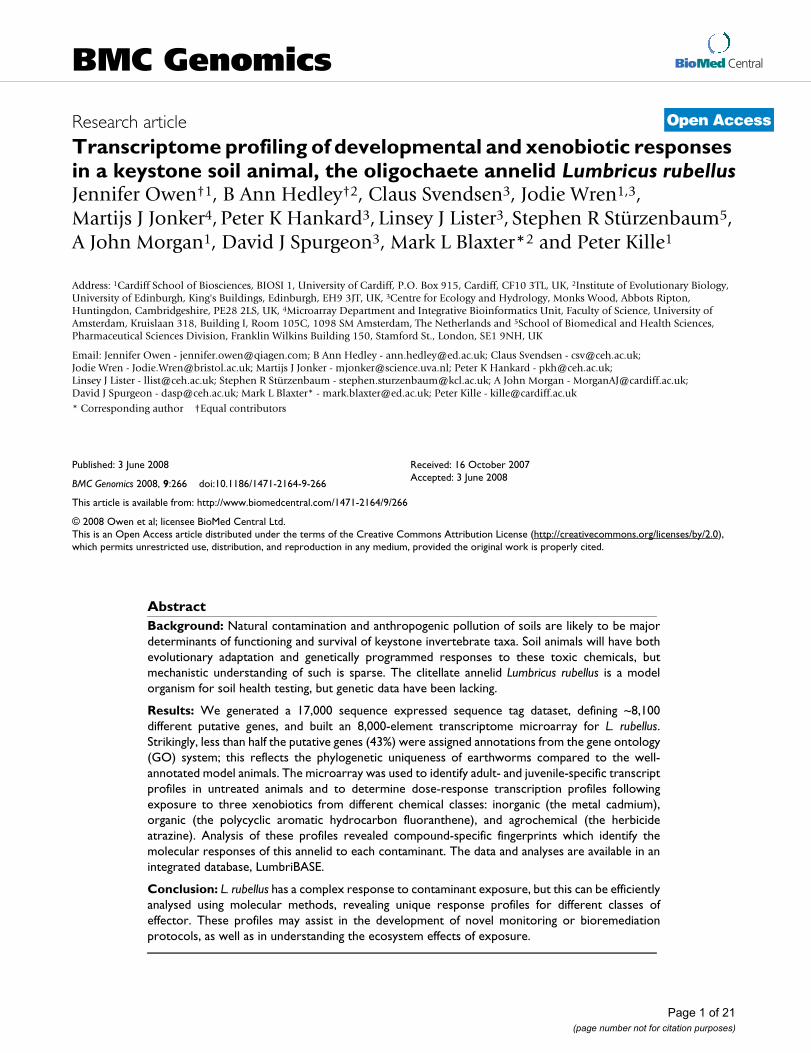
Fabrication and validation of a L. rubellus cDNA microarrayTo profile life-cycle and xenobiotic transcriptomeresponses, a custom cDNA microarray was fabricatedusing representative reporters from each cluster. Eachspotted cDNA originated from a clone processed forsequencing. The hybridisation was performed using anested reference design. In detail, the reference sample(labelled with Cy5) was derived from two 65–70-mer oli-gonucleotides designed against vector sequence betweenthe amplification primer and the inserted cDNA and co-amplified during insert preparation (Additional File 2).Probes derived from mRNA preparations were labelledwith Cy3. This nested reference design permitted directcomparison between samples both within and betweenexperiments. Four experiments were undertaken, compar-ing juvenile and adult stages and comparing transcrip-tional responses following exposure to Cd, FLA and ATZ.All exposures were generated using a common experimen-tal set-up designed to generate a set of biologically repli-cated samples for a series of exposure concentrations(Figure 3).
Proportional representation of ESTs within clusters for sequences determined from each L. rubellus cDNA libraryFigure 1Proportional representation of ESTs within clusters for sequences determined from each L. rubellus cDNA library. The figure illustrates the proportion of the ESTs generated from each library which are associated within clusters con-taining a total of 1 (singletons, Black bars), 2–9 (grey bars) and 10 or more ESTs (Clear bars).
0
20
40
60
80
100
Contro
l
Adult Late
Cocoo
n
Juve
nile
Anterio
r
(pre-
clitel
lum)
Cadmium
Fluoran
thene
Atrazin
e
Coppe
r
Repro
ducti
ve
subtr
activ
e
Pro
port
iona
l rep
rese
ntat
ion
(%)
Page 4 of 21(page number not for citation purposes)

BMC Genomics 2008, 9:266 http://www.biomedcentral.com/1471-2164/9/266
Page 5 of 21(page number not for citation purposes)
GO-Slim analysis of annotated ESTsFigure 2GO-Slim analysis of annotated ESTs. The clustered EST data were annotated with terms from the GOSlim subset of the Gene Ontology system. For each term with more than eight clusters annotated across all libraries, we calculated the mean presence of that term per library, and the fold difference, compared to this mean, of the presence in each library. Panel A: GOSlim Function terms. Panel B: GOSlim Process terms. The acronyms for the cDNA libraries are: Ade, control adult earth-worms; Lc, control late cocoon stage earthworms; Jv, control juvenile earthworms; Che, control adult earthworms, anterior segments; Cd, cadmium-exposed earthworms; Cu, copper-exposed earthworms; FLA, fluoranthene-exposed earthworms; ATZ, atrazine-exposed earthworms (for details, see Materials and Methods). For each GOslim term, the mean number of terms observed across all libraries is given in brackets. Some libraries had no annotations for particular GOslim terms (grouped as 'no annotations' on the figure).
BMC Genomics 2008, 9:266 http://www.biomedcentral.com/1471-2164/9/266
After hybridisation, array scanning, and pre-processing,the initial technical validation included visual inspectionof images to identify gross abnormalities or background.Prior to normalisation the sensitivity of the array and rela-tionship between RNA concentration and fluorescent sig-nal was assessed by calculating the signal intensitygenerated by reporters complementary to 10 "alien" RNAspikes introduced at known concentrations, from 1 pmoleto 30 nmole, prior to labelling (exemplar plots are pro-vided in Additional File 3). Following normalisation thedistribution of data responses was examined and any sam-ples showing abnormal distribution were discarded fromthe analysis (see Additional File 4). Array data were fur-ther validated by generating MA-plots, graphical represen-tations of log ratio of the average normalised data fromcontrol samples compared to xenobiotic-exposed coun-
terparts against the fluorescence intensity [24] (see Addi-tional File 5). The control samples were of high quality bythis measure. For example, when compared to the Cdexposure controls, >99% of the genes exhibiting anacceptable signal had <1.8-fold variance in expression(and >97.5% showed a <1.4-fold variance). In contrast,for hybridisations involving mRNA from animals exposedto 500 μg/kg Cd, ~5% of genes showed an expressionchange >1.8-fold with respect to the controls (with 15%changing >1.4-fold) (Additional File 5). Further, a groupof reporters showed very significant up-regulation inresponse to Cd. Annotations for these reporters indicatedthat they included clusters encoding various metal-lothionein isoforms, a gene set previously shown to behighly Cd responsive (Additional File 5) [13-15].
Schematic representation of the experimental design for xenobiotic exposureFigure 3Schematic representation of the experimental design for xenobiotic exposure. The figure depicts the 5 doses used for each chemical exposure, together with the number of true (independent) biological replicates, each replicate consisting of 8 (pooled) individual earthworms that have been independently exposed to the relevant treatment condition. Control groups contained 8 replicates, and each of the treatment conditions (i.e. chemical and dose) contained 5 replicates. The design of the array experiment shows the labelling, hybridisation and analysis steps for each biological replication.
Page 6 of 21(page number not for citation purposes)

BMC Genomics 2008, 9:266 http://www.biomedcentral.com/1471-2164/9/266
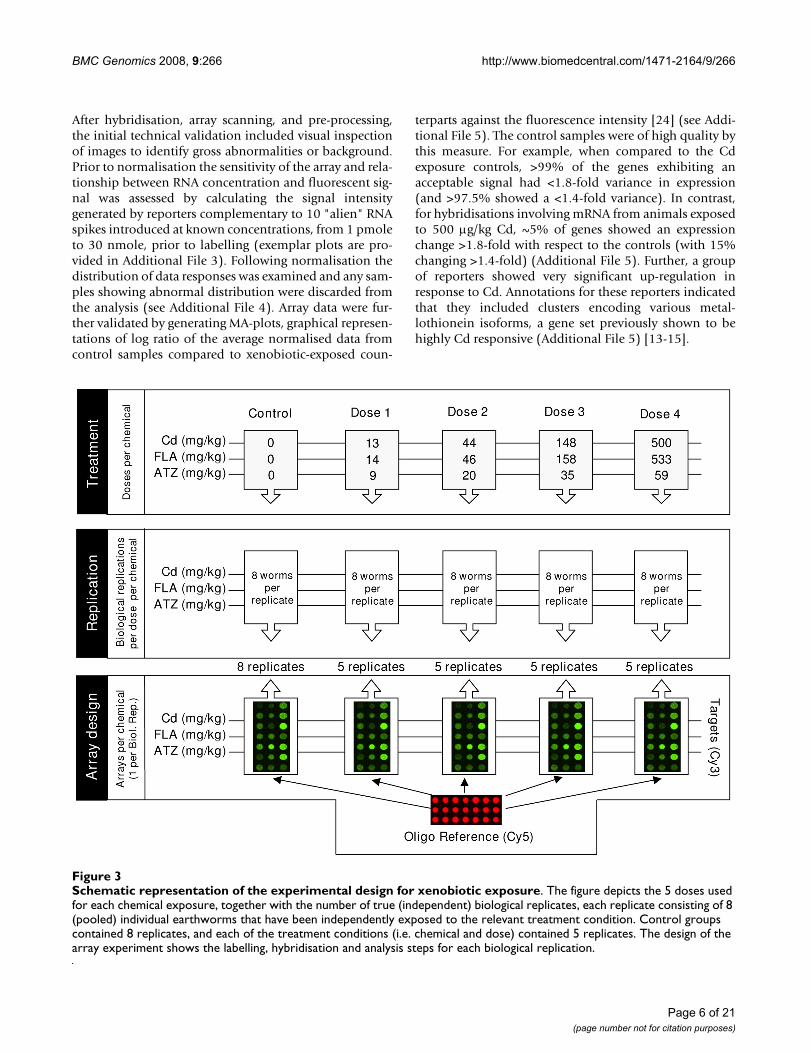
Gene expression changes through the L. rubellus lifecycleTranscript profiles were compared for 14 control groupsof juveniles and biological replicate groups of adults (16groups). These groups were derived from a common stockand selected to minimise the possible confounding effectsof seasonal variation (details of experimental conditionsand treatment metadata for each array have been submit-ted with the array data; for details see ArrayExpress: E-MAXD-36). After initial pre-processing of the data, includ-ing normalisation relative to the median gene expressionin juveniles and adults combined, both principal compo-nent analysis and hierarchical condition clustering (HCC)indicated a primary separation of samples based on devel-opmental stage. Intriguingly, a further separation wasobserved within the adult samples. This separated thesamples into two groups that accorded with the time ofyear the adults were harvested from culture for experimen-tal use in the laboratory experiment (Figure 4). Earth-worms for two experiments (with Cd and FLA) wereharvested in November and those for the third (with ATZ)were harvested in late December. Transcript profiling maytherefore also be able to provide molecular signaturesrelating to seasonally-responsive biology and behaviour.
Substantive differences were evident between the juvenileand adult groups, with ~45% of the reporters that consist-ently generated features passing automated and manualquality criteria yielding measurements showing >1.4-foldexpression change between the two conditions. A t-testidentified 747 genes with significantly altered transcriptlevels (p < 0.01 following Bonferroni multiple sample cor-rection; a full list is provided in Additional File 5). Usingonly these significantly changed genes, HCC separated allsamples by developmental stage (Figure 4). Annotation ofgenes with changed expression levels between juvenilesand adults indicated that transcripts associated with mac-romolecular biosynthesis, energy production, and con-nective tissue synthesis (all processes associated withrapid growth rate) were over-expressed in juveniles (Addi-tional file 6). Also over-expressed in juveniles was aninvertebrate oxygen-carrier, erythrocruorin, whichshowed up to 5-fold bias. Genes with higher expression inadults reflected activities associated with turnover of cellu-lar components, including biopolymer metabolism,catabolism, and hydrolase activities. Multiple isoforms offerritin heavy chain (FTH1) were over-expressed 50- to100-fold in adults. Although a library was constructedfrom the anterior segments (segments 1–33) to samplefrom reproductive tissues (clitellum, spermathecae andovaries; Table 1: Library 4) we were not able to identifymany transcripts associated with the biological process ofsexual reproduction. A notable and intriguing exception isan homologue of the estrogen receptor co-activator(LRC06848) which, although originally identified fromthe juvenile library (Table 1: Library 3), did show a mean
>3-fold, and statistically significant, increase in expressionlevel in the adult samples.
While assessment of GOSlim annotations of individualclusters by library yielded similar patterns of inference asto biology (see Figure 2), the granularity of the EST datasetmade it a far less sensitive probe of animal physiologythan the microarray analyses. Importantly, the microar-rays permitted assessment of expression of genes sampledonly a few times in the EST strategy.
Transcript responses of L. rubellus to xenobiotic exposureDose-response transcription profiles were determined forthree xenobiotics from different chemical classes: inor-ganic (cadmium), organic (fluoranthene), and agrochem-ical (atrazine) (details of experimental conditions anddesign are available in ArrayExpress accessions E-MAXD-34, -31 & -36 respectively). Those data passing qualitycontrol criteria were analysed as independent compoundexposures employing a standard normalisation, followedby filtering to select those reporters that passed automatedand manual quality criteria and showed a >1.4-foldexpression change in all conditions. This dataset was scru-tinised further to identify statistically significant expres-sion changes. Gene lists for each compound exposure aregiven in Additional Files 7, 8 and 9. The resultant tran-script profiles for replicate samples for each exposure con-centration for each compound were hierarchicallyclustered (Figures 5, 6, 7, Panels A), the average transcriptprofiles computed for each exposure condition (Figures 5,6, 7, Panels B), and key genes providing functionalinsights into the response profile identified (Figures 5, 6,7, Panels C) (see Additional files 10, 11 &12).
For each compound, samples from the same exposurecondition were more closely related to each other than toother doses (Figures 5, 6, 7, Panels A). The only exceptionwas seen in FLA, where the groups exposed to the twohighest concentrations (158 and 533 ppm) are inter-mixed, but clustered separately from the remaining expo-sure conditions (Figure 6, Panel A). For all compounds,HCC analysis indicated a second tier of clustering, sepa-rating controls from the two lower doses and both of thesegroups from all replicates for the two higher doses. Sinceall exposure experiments were designed with a logarith-mic dose series across the full sub-lethal exposure range(see Figure 3), this similarity in clustering pattern mayreflect similar patterns in transcript change associatedwith the extent of toxic effects.
Molecular insights into xenobiotic response pathwaysIn our study, earthworms were maintained in the presenceof each chemical for a relatively long period (28 days)compared to more standard, acute assays (usually 48hours on filter paper or 14 days in soil). This extended
Page 7 of 21(page number not for citation purposes)
BMC Genomics 2008, 9:266 http://www.biomedcentral.com/1471-2164/9/266
exposure was intended to permit the measurement oftranscriptome responses at a physiological acclimated pla-teau rather than in a dynamic flux state associated with theinitial exposure stress. We have mined these transcrip-tional changes to provide insights, some established andsome novel, into the mode of action of each xenobiotic.Since our array only reports on a subset of the complete L.rubellus transcriptome, and does not address alternativesplicing or posttranscriptional modifications, the insights
derived are by default fragmented. Inevitably, our analysisexploits primarily a small proportion of well annotatedgenes, including invariant controls (Figure 8, Panels A andB) and compound responsive transcripts (Figure 8, PanelsC and D). However, the majority of genes that show sta-tistically significant relationships between xenobioticdose and transcript levels do not have informative similar-ity to known proteins (Figure 8, Panels E and H). Whilewe can annotate these genes as 'regulated by xenobiotic
Analysis of differential transcription between adult and juvenile earthwormsFigure 4Analysis of differential transcription between adult and juvenile earthworms. Panel A presents a Principal Compo-nent Analysis of transcript profiles from adult and juvenile earthworms. The array data used for this analysis were normalised using per chip and per gene median polishing, and data from poor quantity spots were removed; no additional filtering was per-formed. Panel B displays hierarchical clustering (using a distance algorithm for both conditions and genes) for genes showing significant (p < 0.01) differential expression using a t-test with Benjamini and Hochberg False Discovery. Juvenile data are rep-resented as yellow spheres and adult data are shown as triangles (red indicate those organisms sampled in November and green for those harvested in December).
PCA component 1 (22.88% variance)
PC
A c
ompo
nent
2 (
12.4
2% v
aria
nce)
-0.2-0.4-0.6 0.2 0.4 0.60
-0.2
-0.4
-0.6
0.2
0.4
0.6
0Adults
Juveniles
November
December
Juvenile Adult (Nov)
Adult (Dec)
A. B.
Page 8 of 21(page number not for citation purposes)

BMC Genomics 2008, 9:266 http://www.biomedcentral.com/1471-2164/9/266
exposure', we are obliged to leave assignment of theirmolecular functions and relationships as key avenues forfuture work on the molecular physiology of L. rubellus.
Cadmium: a response to inorganic exposureCadmium is a recognised carcinogen with a well describedunderlying molecular aetiology (for reviews see [25-27]).It has been shown to induce oxidative damage, modulateDNA repair and interfere with metabolism of essentialmetal ions, including Fe, Ca, and Zn, in yeast and culturedcells. For L. rubellus the annotated cDNA microarray iden-tified dose dependent transcript profiles congruent withthese molecular mechanisms, together with tantalisingnovel insights into the secondary impacts of chronic Cdexposure on the earthworm.
The cluster of transcripts exhibiting the most significantdose dependent induction in response to cadmium weremembers of the key protective and detoxification pathwayfor Cd, namely, isoforms of the small, cysteine-rich,metal-binding protein, metallothionein (Figure 5, PanelC). The role of transcriptional up-regulation of metal-lothionein isoforms in cellular detoxification of cadmiumin earthworms has been well characterised [9,13,15]. Theinduction profile was confirmed by QPCR analysis onindependently transcribed samples of the total RNA usedfor microarray analysis (Figure 9). The highly significantcorrelation (R = 0.965 p < 0.005) of the microarray andQPCR data within the experiment, and the agreementwith the previous independent studies cited above, pro-vides confirmation of the validity of our microarray find-ings.
Transcriptional responses of adult L. rubellus exposed to a series of concentrations of CadmiumFigure 5Transcriptional responses of adult L. rubellus exposed to a series of concentrations of Cadmium. The array data used for this analysis were normalised per chip and per gene median polishing, expressed relative to the control samples; data from poor quantity spots were removed, and genes showing significant (p < 0.05) differential expression in response to Cad-mium identified using ANOVA analysis with Benjamini and Hochberg False Discovery. Hierarchical clustering was performed using a distance algorithm for both conditions and genes. Panel A shows hierarchical clustering of the individual samples, whilst Panel B provides that hierarchical clustering of average expression generated by treatments. Panel C displays the average expression of a series of important functional groups pertinent to Cadmium toxicosis. Full details of the provenance of these reporters are provided in Additional File 10.
0 13 44 148 500 Cadmium
Detoxification
Lr_Cd2CF_20E01 Metallothionein 2B
Lr_Cd2CF_01C10 Metallothionein 2B
Lr_Cd2CF_62B09 Metallothionein 2C
Lr_AT1CF_09F05 Metallothionein 2A
Lr_Cd2CF_19A04 Metallothionein 2A
Electron Transport Disruption
Lr_AT1CF_16B12 NADH-ubiquinone oxidoreductase II
Lr_Cu2CF_34C07 Cytochrome c oxidase III
Lr_AT1CF_11E06 Cytochrome bResponse to ROS
Lr_Cd2CF_08H04 Cytochrome P450
Lr_Cd2CF_15H02 Glutathione-S transferase
Lr_Cd2CF_01C12 Ubiquitin specific protease
Inhibition of DNA RepairLr_PAHCF_70B12 RAD51Lr_adE_02E08 XPA
Metal Mimicry - Fe
Metal Mimicry - Ca
Lr_PAHCF_23A06 Ferritin H-Chain
Lr_AT1CF_41E05 Ferritin H-Chain
Lr_Cu2CF_03B07 Ferritin H-Chain
Lr_Cu2CF_03E05 Ferritin H-Chain
Lr_LC1ED_26C05 Calexcitin
Lr_CHECF_28A04 SCBP2
Lr_CHECF_10E12 Calcineurin B
Lr_LC1CF_03A10 Tropomyosin 2
A. B. C.
CadmiumCadmium [mgkg-1]
5.0
4.0
3.0
2.0
1.2
1.0
0.8
0.6
0.4
0.2
0.0
Exp
ress
ion
(rel
ativ
e to
mea
n co
ntro
l val
ues)
Page 9 of 21(page number not for citation purposes)

BMC Genomics 2008, 9:266 http://www.biomedcentral.com/1471-2164/9/266
Cd also inhibits the electron transport chain, and causesthe generation of reactive oxygen species (ROS). It hasbeen proposed that the specific sites of impact of Cd arein complexes II (ubiquinone oxidoreductase) and III(cytochrome c), with the majority of ROS productionbeing associated with the inhibition of complex III [28].The array results supported this model, showing a signifi-cant dose-dependent reduction of a cytochrome c oxidasefrom complex III, and a modulation of the expression ofNADH-ubiquinone oxidoreductase II and cytochrome b(although the latter effects are dose specific) (Figure 5,Panel C). The observed inductions of a cytochrome P450and glutathione-S transferase (GST) alpha by Cd (Figure5, Panel C) are perhaps a response to ROS-induced dam-age, and have previously been observed in yeast and ratliver, respectively [29,30]. Intriguingly, the induction ofthe cellular response cascade to Cd-induced oxidativedamage has been linked to increased levels of the tran-scription factor Nrf2 through direct Cd interference with
ubiquitin-mediated proteolysis [31]. The earthworm arrayindicates a transcriptional down-regulation of an ubiqui-tin specific protease (Figure 5, Panel C), and it will beimportant to establish whether this inhibition is linked tomodulation of Nrf2 degradation.
Although at high concentrations Cd may impact on DNAdirectly, causing DNA conformational alterations, atlower levels it causes cytotoxic effects through inhibitionof DNA repair [32]. Cd affects both early and late steps ofnucleotide excision repair, and also inhibits repair of DNAstrand breaks and post-replication mismatch repair. How-ever, the exact mechanisms underlying these effects havenot been described. Our data may provide a novel insightinto this process, as L. rubellus genes with significant sim-ilarity to RAD51 [33] and XPA [34], key components ofrepair pathways for double stranded DNA breaks and exci-sion repair respectively, are down-regulated in response toCd (Figure 5, Panel C). Since both RAD51 and XPA asso-
Transcriptional responses of adult L. rubellus exposed to a series of concentrations of FluorantheneFigure 6Transcriptional responses of adult L. rubellus exposed to a series of concentrations of Fluoranthene. The array data used for this analysis were normalised per chip and per gene median polishing, expressed relative to the control samples; data from poor quantity spots were removed, and genes showing significant (p < 0.05) differential expression in response to Fluoranthene identified using ANOVA analysis with Benjamini and Hochberg False Discovery. Hierarchical clustering was per-formed using a distance algorithm for both conditions and genes. Panel A shows hierarchical clustering of the individual samples whilst Panel B provides that hierarchical clustering of average expression generated by treatments. Panel C displays the average expression of a series of important functional groups pertinent to Fluoranthene toxicosis. Full details of the provenance of these reporters are provided in Additional File 11.
0 14 47 158553
Detoxification/Metabolism
Electron Transport Disruption
DNA Repair and Carcinogenicity
A. B. C.
Fluoranthene
Lr_AT1CF_37E11 Putative FK506-binding protein
Lr_Cd2CF_04F03 Glutathione S-transferase pi
Lr_Cd2CF_06G03 26S proteasome regulatory subunit p28
Lr_LC1ED_08E08 Proteasome 26S subunit, ATPase 1
Lr_CHECF_49H07 Cytochrome c oxidase subunit II
Lr_JV2CF_03D02 Cytochrome c oxidase subunit II
Lr_PAHCF_24B07 NADH dehydrogenase subunit 2
Lr_PAHCF_72E08 NADH dehydrogenase subunit 4
Lr_Cu2CF_02G12 NADH dehydrogenase subunit 1
Lr_CHECF_57E03 Cytochrome b
Lr_PAHCF_72C10 BTBD3 protein
Lr_JV2CF_36H04 FLJ10140
Lr_LC1ED_18F11 Multifunctional DNA repair enzyme (APEX 1)
Lr_JV2CF_14E02 RAB1A
MicrosomalLr_LC1ED_41E05 Microsomal glutathione S-transferase 3
Lr_JV2CF_24H07 Microsomal glutathione S-transferase 1
Transcriptional/Signalling CascadesLr_PAHCF_66E03 Churchill protein
Lr_PAHCF_56H02 CGI-13 protein (Putative NFkB activating protein)
Lr_JV2CF_10F04 MED18 protein
Lr_CHECF_61E09 Proteasome subunit beta type 3
Lr_Cd2CF_04H02 Basal transcriptional activator hABT1
FluorantheneFluoranthene [mgkg-1]
5.0
4.0
3.0
2.0
1.2
1.0
0.8
0.6
0.4
0.2
0.0
Exp
ress
ion
(rel
ativ
e to
mea
n co
ntro
l val
ues)
Page 10 of 21(page number not for citation purposes)
BMC Genomics 2008, 9:266 http://www.biomedcentral.com/1471-2164/9/266
ciate with Zn it is conceivable that Cd may disrupt orinhibit these key components of the DNA repair pathwaythrough molecular mimicry. It will be important to con-firm these observations within other species.
As established in model species, molecular mimicry argu-ably provides the most wide-ranging vehicle throughwhich Cd can elicit toxic effects on a biological system.Ca, Zn and Fe are all employed as key cofactors in proteinsthat function as structural components, second messen-gers, transcriptional regulators and redox centres. Thebinding of Cd to these metallo-proteins will have wide-ranging effects. The established link between Cd toxicityand disruption of Fe metabolism leading to anaemia wasreflected within the array data through the significantdown-regulation of heavy chain ferritin (Figure 5, PanelC). Whether this is a direct effect of Cd or a result of dis-ruption of general Fe homeostatic sensing (through theknown interaction of Cd with the iron regulatory protein
[35]) is unclear. The impact of Cd on Ca metabolism wasevident on the arrays as a negative transcriptional influ-ence on the Ca-binding proteins calcineurin, calexcitinand sarcoplasmic Ca-binding protein (SCBP2) (Figure 5,Panel C). Furthermore, the long-term effects of Cd on thecytoskeleton [36] were also reflected in the Cd-specific up-regulation of tropomyosin 2 (Figure 5, Panel C).
Fluoranthene: a representative polycyclic aromatic hydrocarbon toxinPAHs are lipophilic and so can incorporate into and dis-rupt the functions of biological membranes [37]. Low-level exposure to PAH has been linked to several adverseeffects, including carcinogenesis [38], teratogenesis [39],and induction of cardiovascular disease [40,41]. In mam-mals the molecular trigger coordinating cellular responsesto certain PAHs is the upregulation of aryl hydrocarbonreceptor (AhR) activity. This activation is not mediatedtranscriptionally, but results from reduction of the prote-
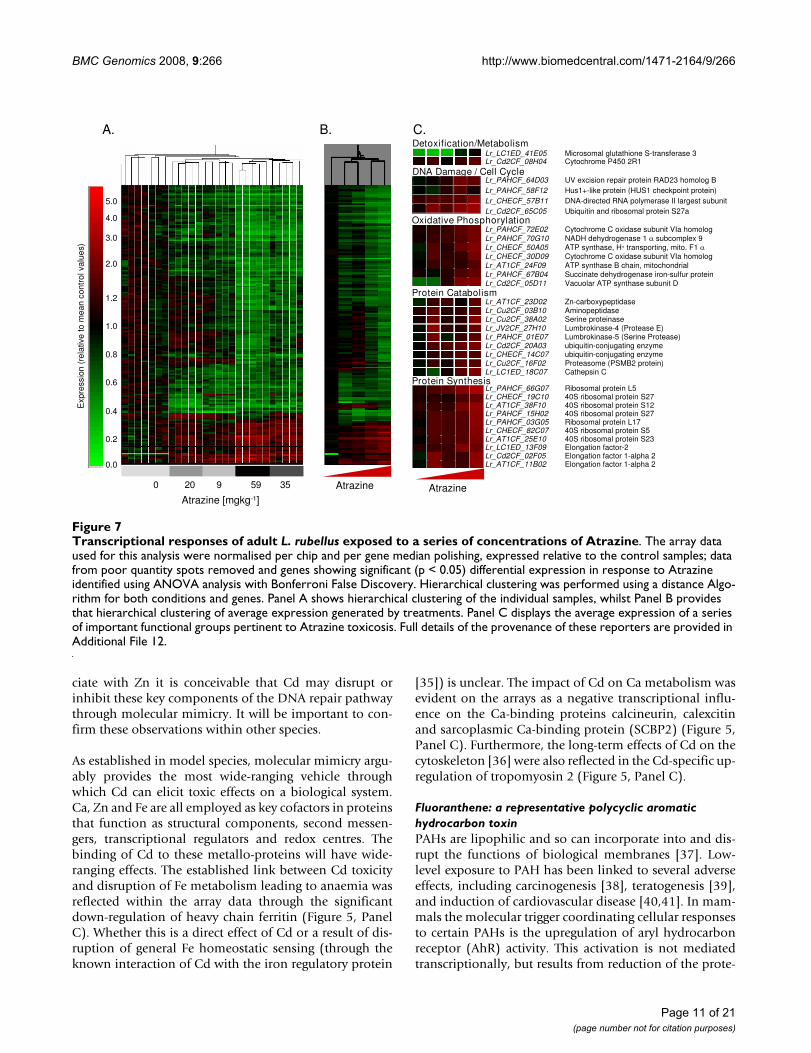
Transcriptional responses of adult L. rubellus exposed to a series of concentrations of AtrazineFigure 7Transcriptional responses of adult L. rubellus exposed to a series of concentrations of Atrazine. The array data used for this analysis were normalised per chip and per gene median polishing, expressed relative to the control samples; data from poor quantity spots removed and genes showing significant (p < 0.05) differential expression in response to Atrazine identified using ANOVA analysis with Bonferroni False Discovery. Hierarchical clustering was performed using a distance Algo-rithm for both conditions and genes. Panel A shows hierarchical clustering of the individual samples, whilst Panel B provides that hierarchical clustering of average expression generated by treatments. Panel C displays the average expression of a series of important functional groups pertinent to Atrazine toxicosis. Full details of the provenance of these reporters are provided in Additional File 12.
Lr_PAHCF_01E07 Lumbrokinase-5 (Serine Protease)
Lr_PAHCF_64D03 UV excision repair protein RAD23 homolog B
0 20 9 59 35
A. B. C.
Atrazine
Detoxification/MetabolismLr_LC1ED_41E05 Microsomal glutathione S-transferase 3
Lr_PAHCF_58F12 Hus1+-like protein (HUS1 checkpoint protein)
Lr_Cd2CF_08H04 Cytochrome P450 2R1DNA Damage / Cell Cycle
Lr_CHECF_57B11 DNA-directed RNA polymerase II largest subunitLr_Cd2CF_65C05 Ubiquitin and ribosomal protein S27a
Oxidative Phosphorylation
Lr_PAHCF_70G10 NADH dehydrogenase 1 subcomplex 9 Lr_PAHCF_72E02 Cytochrome C oxidase subunit VIa homolog
Lr_CHECF_50A05 ATP synthase, H+ transporting, mito. F1 Lr_CHECF_30D09 Cytochrome C oxidase subunit VIa homolog
Lr_PAHCF_67B04 Succinate dehydrogenase iron-sulfur proteinLr_AT1CF_24F09 ATP synthase B chain, mitochondrial
Lr_Cd2CF_05D11 Vacuolar ATP synthase subunit D
Lr_AT1CF_23D02 Zn-carboxypeptidaseProtein Catabolism
Lr_Cu2CF_03B10 Aminopeptidase Lr_Cu2CF_38A02 Serine proteinaseLr_JV2CF_27H10 Lumbrokinase-4 (Protease E)
Lr_Cd2CF_20A03 ubiquitin-conjugating enzymeLr_CHECF_14C07 ubiquitin-conjugating enzymeLr_Cu2CF_16F02 Proteasome (PSMB2 protein)Lr_LC1ED_18C07 Cathepsin C
Protein Synthesis
Lr_CHECF_19C10 40S ribosomal protein S27 Lr_AT1CF_38F10 40S ribosomal protein S12Lr_PAHCF_15H02 40S ribosomal protein S27
Lr_AT1CF_25E10 40S ribosomal protein S23Lr_LC1ED_13F09 Elongation factor-2Lr_Cd2CF_02F05 Elongation factor 1-alpha 2Lr_AT1CF_11B02 Elongation factor 1-alpha 2
Lr_PAHCF_03G05 Ribosomal protein L17
AtrazineAtrazine [mgkg-1]
Lr_PAHCF_66G07 Ribosomal protein L5
Lr_CHECF_82C07 40S ribosomal protein S5
5.0
4.0
3.0
2.0
1.2
1.0
0.8
0.6
0.4
0.2
0.0
Exp
ress
ion
(rel
ativ
e to
mea
n co
ntro
l val
ues)
Page 11 of 21(page number not for citation purposes)

BMC Genomics 2008, 9:266 http://www.biomedcentral.com/1471-2164/9/266
olytic turnover of AhR by the ubiquitin-26S proteasomepathway [42]. In L. rubellus, exposure to our model PAH,FLA, caused the down-regulation of two members of thisproteolytic pathway, proteasome 26S sub-unit ATPase 1and 26S proteasome regulatory sub-unit P28 (Figure 6,Panel C). A second regulatory mechanism is moderationof an AhR – heat shock protein 90 complex by FK506-binding proteins (FKBP) [42]. In L. rubellus, FLA exposurecaused a >30-fold down-regulation of one FKBP isoform(Figure 6, Panel C). These observations suggest that L.rubellus orchestrates its response to FLA through theseestablished mechanisms.
AhR is a transcriptional regulator. Specific inhibition ofdegradation increases the cellular concentration of AhR,and thus causes transcriptional up-regulation of a set of
target metabolic and detoxification mechanisms. Classi-cally these responses have been associated by the induc-tion of cytochrome P450 reductases, but recentlyalternative metabolic pathways have been identified,including GSTs and NAD(P)H:quinone oxidoreductases[43]. In L. rubellus exposed to FLA, this detoxificationresponse is exemplified by the up-regulation of a homo-logue to a Pi class GST, a cytosolic isoform that has previ-ously been linked to PAH metabolism [44] (Figure 6,Panel C). AhR independent pathways activated by PAHinclude those involving early growth response factor 1and peroxisome proliferation-activated receptor alpha[45,46].
Biotransformation of PAH leads to the generation of reac-tive oxygenated metabolites (ROM) and ROM-mediated
Transcript profiles for individual gene responses to xenobiotic exposureFigure 8Transcript profiles for individual gene responses to xenobiotic exposure. The expression profiles of eight specific reporters are provided to illustrate changes in expression during xenobiotic exposure relative to that observed in control organisms. Transcript changes are shown in response to; Cadmium (exposures 0, 13, 44, 148 and 500 mg/kg) represented by open circles connected by solid lines; Fluoranthene (exposures 0, 14, 47, 158 and 553 mg/kg) designated by open squares and doted line and Atrazine (exposures 0, 9, 20, 35 and 59 mg/kg) represented by open triangles connected by dashed lines. Panels A & B show the profiles of two invariant control genes [73] GAPHD (Lr_Cd2CF_65D0; GenBank accession: DR077591, Clus-ter:LRC04105_1) and EF1α (Lr_AT1CF_14E04; GenBank: CO047675, Cluster: LRC04881_1). Panel C and D depict the expression profiles for Metallothionein 2B (Lr_Cd2CF_20E01; GenBank: CF611058 Cluster:LRC01607_2) and Laminin (Lr_LC1ED_11A01 GenBank: CF416412 Cluster:LRC01132_1), genes that exhibit compound-specific up- and down-regula-tion, respectively, in response to cadmium. Panels E & G show reporters Lr_PAHCF_72C10 (GenBank: CO048307, Clus-ter:LRC05297_1) and Lr_Cu2CF_15B05 (GenBank: DR008743, Cluster:LRC08839_1) specifically induced by Fluoranthene and Atrazine, respectively. Panels F & H show reporters Lr_AT1CF_27G09 (GenBank: CO046812, Cluster:LRC04302_1) and Lr_AT1CF_15E02 (GenBank: CO047812, Cluster:LRC04973_1) exhibiting reciprocal repression by exposure to the PAH and herbicide, respectively.
A. GAPDH Lr_Cd2CF_65D05
B. EF1 alpha Lr_AT1CF_14E04 D. Lr_LC1ED_11A01
E. Lr_PAHCF_72C10
F. Lr_AT1CF_27G09
G. Lr_Cu2CF_15B05
H. Lr_AT1CF_15E02
Treatment Group (‘Dose’)
Fo
ld C
han
ge
(Lo
g2
Sca
le)
/4
/2
x2
x4
x1
/4
/2
x2
x4
x1
/4
x4
x8
x1
/32
/8
x1
x4
/4
/16
/4
x1
x4
x16
/4
x1
x2
x4
/2
/8
/4
/2
x2
x4
x1
/16
x1
x4
/4
Cont 1 2 3 4 Cont 1 2 3 4 Cont 1 2 3 4 Cont 1 2 3 4
C. Lr_Cd2CF_20E01
Page 12 of 21(page number not for citation purposes)

BMC Genomics 2008, 9:266 http://www.biomedcentral.com/1471-2164/9/266
oxidative stress [43]. This process activates a broad spec-trum of pathways associated with inflammation andhypoxia. This is reflected through the up-regulation of fac-tors involved in the positive regulation of global transcrip-tion, including homologues of hABT1, Churchill proteinand CGI-13 (Figure 6, Panel C). A specific link has beenestablished between the activation of hypoxia-inducibleerythropoietin and the activation pathways under thecontrol of NFkB [42,47]. NFkB serves as a second messen-ger to induce a series of cellular cytokines in the responseto cellular damage invoked by, amongst others, reactiveoxygen species generated by PAH exposure. The observedup-regulation of a CGI-13 protein homolog, a putativeNFkB activating protein, in response to FLA exposure sup-ports the assertion that the earthworm is responding toROM-induced stress (Figure 6, Panel C).
The direct cellular impacts of PAHs have been associatedwith: (1) mitochondrial dysfunction or decay leading tothe uncoupling of mitochondrial respiration, and inhibit-ing electron transport; (2) direct genotoxic damagethrough DNA adduct formation; and, (3) hypoxia and
ROS and ROM generation [42,43]. All three processes areclearly evident in the earthworm transcript response pro-files. The mitochondrial-encoded genes NADH dehydro-genase subunits 1,2 & 4, cytochrome b, and cytochrome coxidase subunit II, showed significant down-regulation,with those involved in DNA damage repair, such asBTBD3 protein and APEX nuclease (multifunctional DNArepair enzyme) 1, were significantly up-regulated (Figure6, Panel C).
Overwhelmingly, the responses observed within theearthworm are comparable with studies performed inmammalian systems. However, one area where theseannelids show a distinct difference is in the down-regula-tion of microsomal-based metabolic machinery, includ-ing phase I (cytochrome P450 mixed function oxygenase(MFO) enzymes) and phase II (including GST) detoxifica-tion reactions. Significantly, homologues of two micro-somal GSTs show significant down-regulation (Figure 6,Panel C). Furthermore, no homologue of cytochromeP450 isoform 1A (CYP1A) has so far been identified in L.rubellus. This finding is supported by a number of studies
Relative correlation between microarray and qPCR data for Metallothionein-2 expression in L. rubellusFigure 9Relative correlation between microarray and qPCR data for Metallothionein-2 expression in L. rubellus. The rel-ative expression profiles for Metallothionein-2 following sublethal cadmium exposures measured either using microarray analy-sis (solid squares) or with real-time qPCR analysis (open squares, data expressed relative β-actin). Data points represent mean fold change values ± SE.
0.0625
0.125
0.25
0.5
1
2
4
8
16
32
64
0.0625
0.25
1
4
16
64
0 100 200 300 400 5000 100 200 300 400 500
Cadmium [mg/kg]
Exp
ress
ion
(f
old
ch
ang
e)
Page 13 of 21(page number not for citation purposes)

BMC Genomics 2008, 9:266 http://www.biomedcentral.com/1471-2164/9/266
in earthworms [48,49] which did not observe an increasein enzyme activity using assays which target microsomalcytochrome P450 enzymes involved in biotransformationof organic xenobiotics (CYP1A activity, measured usingthe EROD assay). However, other studies have showninduction of CYP1A (through measuring CYP1A immu-nopositive protein) in invertebrates, such as molluscs, fol-lowing exposure to organic chemicals [50,51]. While therole of the cytochrome P450 MFO system is well under-stood in vertebrates, the data presented here suggest thatthere is a subtly distinct, hitherto undescribed variantmechanism active in L. rubellus.
Atrazine: an S-triazine-ring herbicideCompared to the significant body of research relating tothe gross toxicology of ATZ (see PAN Pesticides Database[52] for literature review of toxicity and ecotoxicity data),very little is known of the molecular pathways underlyingthese physiological effects. It has been proposed that ATZbreakdown is linked to standard organic phase I andphase II metabolic pathways, implying that cytochromeP450 reductases and GST may be invoked as the primarydetoxification mechanisms. This proposition is supportedby the L. rubellus data, which indicated transcriptional up-regulation of representative P450 and GST isoforms (Fig-ure 7, Panel C).
ATZ is classed as a potential carcinogen with teratogenicactivity [53]. On exposure to ATZ, L. rubellus showed up-regulation of a number of genes that are associated withDNA damage, such as UV excision repair protein RAD23homologue B and HUS1 like protein (HUS1 checkpointprotein). Furthermore, enzymes directly involved specifi-cally in UV-responsive excision repair are also up-regu-lated, along with genes involved with chromatinremodelling (Figure 7, Panel C). An impact on the tran-script levels of genes involved in controlling the cell cyclewas also observed. This may indicate a link to mecha-nisms that control cell cycle progression in response togenetic integrity of the cell (Figure 7, Panel C).
As an herbicide, the mode of action of ATZ is the disrup-tion of electron transport by targeting chloroplast photo-system II. Inhibition occurs at the level of protein-boundplastoquinone B [54]. The response of L. rubellus to ATZmeasured on the arrays indicated a significant up-regula-tion of several members of the oxidative phosphorylationpathway and of the tricarboxylic acid cycle (Figure 7,Panel C). This may indicate that, at high doses, ATZ ele-vates mitochondrial electron transport and alternativeroutes of ATP generation to compensate for a partialuncoupling of oxidative phosphorylation.
However, in the L. rubellus response to ATZ, the largestand most significantly overrepresented group of genes
were associated with protein synthesis and catabolism(Figure 7, Panel C). The up-regulation by ATZ of the ubiq-uitin-conjugating enzyme E2 which is central for the tar-geting of protein for degradation in concert withubiquitin-protein ligases (E3s) via the HECT pathway isindicative of this raised catabolic state [55]. This wascounterbalanced by observation of increases in a largenumber of genes associated with up-regulated proteinsynthesis such as ribosomal proteins and amino acidtransporters. A possible explanation for these observa-tions might be an increase in the generation of incorrectlyfolded proteins. Degradation of these non-functional pro-teins and their re-synthesis would account for the tran-script changes observed.
ConclusionA thirty-fold accretion in the genetic knowledge-base forany species belonging to an acknowledged keystone taxonthat has been previously neglected in sequencing studiesmight reasonably be expected to yield general and specificinsights into individual species and group systematics.Indeed, a recent phylogenetic revision of the animal king-dom, partly based on the L. rubellus ESTs, defining 8,129gene objects generated as a component of this work,clearly grouped earthworms with flatworms and molluscsin a superphylum, the Lophotrochozoa, alongside thesuperphylum Ecdysozoa, to form one of the two majoranimal divisions, the Protostomia [56,57]. The sequenc-ing work described here has, thus, already made a valuedcontribution to understanding the evolutionary relation-ships between animal phyla.
The availability and functional annotation of the ESTresource, and the subsequent clustering to identify a set ofgene objects has allowed the first high density microarrayfor L. rubellus to be fabricated. The development of this8,000-feature array provides a valuable resource to theearthworm community for future studies in areas such astissue regeneration and immune system function, forwhich earthworms are already in use as model systems[58,59]. Through experimental studies, we have clearlydemonstrated the capacity of the microarray to providenovel insights by investigating the molecular basis of theresponses of the species to environmental perturbations.All our data and analyses have been collated and pre-sented on a web-available database, LumbriBASE [19],that permits querying of sequence, annotation and micro-array data through an easy-to navigate interface. Theseanalyses promise radical changes in the use of earthwormsfor the biological assessment of soil contamination. Thus,not only have we revealed differences in the qualitativeand quantitative expression patterns of a high proportion(~40 to 50%) of all L. rubellus genes following exposure tothree chemicals of contrasting modes of action, but it hasalso provided novel molecular insights that complement
Page 14 of 21(page number not for citation purposes)
BMC Genomics 2008, 9:266 http://www.biomedcentral.com/1471-2164/9/266
the outcomes of previous, targeted functional biochemi-cal and metabolomics studies on this species [5,13]. Withthis expanding set of tools now available, it can only beassumed that L. rubellus will increasingly be viewed as apowerful tool through which to probe, with an evolution-ary perspective, the biochemical, physiological and evolu-tionary responses of a 'soil engineering' species toenvironmental perturbations and changes.
MethodsL. rubellus sourcing, culturing and xenobiotic exposureL. rubellus used for library construction and all exposurework were acquired from an uncontaminated field site bya commercial supplier (Neptune Ecology, Ipswich, UK),with the exception of the worms used for constructing theCd library which were collected from a control field site atDinas Powys, South Wales (Ordnance Survey Grid Refer-ence ST146723). After collection, all worms were kept ona 1:1:1 mix of loam soil:peat:composted bark for a mini-mum of 4 weeks. Two weeks before the start of each exper-iment, all required worms were transferred to a standardloam soil (pH 7.1, 5% organic matter) (BroughtonLoams, Kettering, UK) with 3% composted bark (LBSHorticultural, Colne, UK) added and maintained at 15–20°C under a 16:8 light:dark regime to allow them toacclimatise to the test soil and conditions.
Worms used for generation of the control library andbody section libraries were selected following acclimatisa-tion without further treatment. These were keyed out toconfirm species identification and a set of healthy individ-uals dissected if required and then processed for total RNAextractions. Breeding pairs of adults were assembled andplaced on clean soil and checked every four weeks andlaid cocoons collected. A random selection of thesecocoons were incubated for a further five weeks beforebeing dissected and the embryonic tissue collected for usein constructing the late cocoon library. The remainingcocoons were hatched and the worms grown for ~40 daysto yield a juvenile cohort for library construction. Librar-ies made using exposed worm tissue were made from pre-acclimatised adults kept in cadmium (Cd; 50, 200 and600 ppm), fluoranthene (FLA; 62, 140, 316, 711 and1066 ppm), atrazine (ATZ; 12 and 35 ppm) and copper(Cu; 40, 160, 460 and 480 ppm) spiked, bark-amendedloam soil for 28 days.
The same amended loam soil was used to generate samplefor all microarray experiments. Juvenile samples wereobtained from worms grown individually from hatching[60]. These were monitored until each reached approxi-mately 300 mg weight at which time they were snap fro-zen at a designated diurnal time and then processed formicroarray analysis.
Adult worms were exposed to cadmium, fluoranthene andatrazine in separate exposures designed from publishedand range-finder test data to represent a series of soil con-centrations ranging from unexposed (controls) to justbelow the lethal level. The exposure concentrations (inmg/kg soil) used were:
Cd: 0, 13, 43, 148, 500
FA: 0, 13.8, 46, 158, 533
AZ: 0, 9.4, 20.7, 35, 59.
Eight replicate of controls and five replicates of spikedtreatments were used for each experiment. Cd was spikedinto soil in the water that was required to raise the soilmoisture content to the required level (33% wet weight =approximately 60% of water holding capacity), fluoran-thene and atrazine were spiked as solutions in acetoneand ethanol, respectively. Each soil, including treatmentcontrols, was amended with the required amount of"make-up" solvent to ensure that all soils received thesame volume of solvent as the highest concentration.After dosing, all soils were vented for at 72 hours to allowevaporation of the carrier. Soil were then wetted to thesame moisture level used in the Cd test.
The adult test was conducted according to a 28 day proto-col [60] using the design outlined in Figure 3. For logisticreasons (principally the need for time-synchronised sam-pling), the experiments for each compound were run inseries rather than parallel, and thus the tests were con-ducted at different times of the year. Exposures of batchesof 8 worms per treatment replicate were conducted for 28days at 15°C under a 16 hr light: 8 hr dark regime. Eachbatch of worms was fed at 0 and 14 days with 5 g (dryweight) of horse manure spiked to the same concentra-tion as the test soil. After 28 days, at an identical desig-nated diurnal time (midday ± 30 min), worms wereretrieved from the soil, immediately snap frozen in liquidnitrogen, and stored at -80°C. During processing eachworm was visually inspected for phenotypic characters(presence of skin lesions, scarring of the clitellum, pres-ence of body constrictions, loss of torpor, and reducedvigour) and given a "condition index" score ranging from1 (pristine) to 5 (very poor for many characters). Percentsurvival of the experimental cohort was recorded and thesoils sieved to collect cocoons in order to determine repro-ductive rate. For each experimental replicate, three wormswere pooled to give a single biological sample for arrayanalysis. The worms chosen were the three that had thehighest condition score at the end of the test. Althoughthis selection may have favoured the inclusion of moretolerant genotypes, it avoided the inclusion of worms that
Page 15 of 21(page number not for citation purposes)

BMC Genomics 2008, 9:266 http://www.biomedcentral.com/1471-2164/9/266
had lost condition for non-treatment reasons (such as dis-ease or parasitism) during exposure.
Total RNA extractionsAll fresh tissue was immediately homogenized in Tri-rea-gent (Sigma-Aldrich) and stored at -80°C before process-ing. Stored tissue was crushed to fine powder under liquidnitrogen and homogenised in Tri-reagent at 50 mg per ml(Sigma Chemicals, Poole, UK) for 2 minutes at high speedusing an Ultra-Turret® T18 homogeniser (IKA, Stauffer,Germany). Total RNA was extracted using standard proto-cols [61,62] followed by additional purification withRNAeasy kits (Qiagen), and quantification by spectropho-tometry.
Library construction and screeningNine cDNA libraries were constructed from control (unex-posed) and exposed animals (Table 1 and Additional File1). Library 1 was constructed from healthy control adults.Library 2 was constructed from embryonic material col-lected from pair breed cocoons (see above), and Library 3from juveniles, each obtained from hatchlings rearedfrom laid cocoons. A separate cDNA library (Library 4)was constructed from the anterior (pre-clitellum) portionof healthy adults. Representative, healthy individualsfrom each concentration of each xenobiotic exposurewere processed to generate total RNA. Xenobiotic com-pound-specific RNA pools were then constructed by com-bining an equal mass of RNA from each dose. These poolswere then used to construct additional cDNA libraries: CdLibrary 5, FA Library 6, AZ Library 7 and Cu Library 8.mRNA for these libraries was purified using oligo d(T) cel-lulose columns (Amersham Life Sciences). Libraries in theplasmid vector pBluescript II (Libraries 2–8), were gener-ated using the pBluescript II XR cDNA library kit (Strata-gene). Library 1 was generated in the phagemidpBluescript II SK+ (Stratagene), and subsequently recov-ered as plasmid (pBluescript II SK+) by mass excision. Asuppression subtractive hybridisation library (Library 9)was also generated (using the Clontech PCR-Select cDNAsubtraction method) to enrich for genes involved inreproduction with driver cDNA generated from posteriorsegments and tester cDNA from the segments containingthe clitellum and seminal vesicles. The population ofamplified enriched fragments was ligated into pGEM-T(Promega).
EST sequencingPlasmid clones were picked, cultured and cDNA insertsamplified by PCR using vector primers in a final volumeof 100 μl following standard methods [63]. Products werepurified, and the sample concentrated to 20 μl, usingMontage Multiscreen PCR Cleanup Plates (Millipore).The PCR products were sequenced from the 5' end of thecDNA insert using a T7 primer and BigDye and Dyenami-
cET sequencing reagents, and analysed on an ABI 3730sequencer by the Edinburgh School of Biological SciencesSequencing Service.
To improve the yield of novel sequences, a screen wasintroduced to remove unsuccessful insert cDNA amplifi-cations and highly abundant transcripts. The success ofeach amplification was first verified by visualisation on 96well 2% E-gels (Invitrogen) and subsequently an aliquotof each amplicon was printed on an array and hybridised(as described below) to a fluorescently labelled mixturerepresenting the 50 most abundant transcripts identifiedin the first 3966 L. rubellus ESTs. The longest EST repre-sentative of the 50 clusters containing the greatest numberof ESTs was selected and insert cDNAs labelled in 10batches. For each mix of 5 probes, 0.2 μl of a 1/100 dilu-tion of each probe insert was PCR amplified using primersdesigned to the vector/adaptor interface. In this labellingPCR mix, added dTTP was reduced to 0.3 nmoles and 1 μlof Cy5-dUTP (Amersham) was added. Unincorporateddye was removed using GFX columns (Amersham) andthe products eluted in 60 μl. A mixture (1 μl of eachbatch) of the abundant transcript probes was hybridisedto the arrayed PCR products in the presence of the ampli-fication primers to reduce cross hybridisation. cDNAinserts that had good amplification but did not hybridiseto the abundant transcript probes were picked roboticallyto new microtitre plates (Multiprobe II HT EX liquid han-dling system, Parkard) and processed for sequencing (seeabove). The 100 μl volume PCR amplifications yieldedsufficient product for quality assurance and sequencing(~15 μl) and a large stock for subsequent microarray fab-rication.
EST processing and annotationPrimary chromatograms were processed usingtrace2dbEST, a perl pipeline script that uses Phil Green'sphred and user-supplied cut-off information to base calland trim sequences, formatting them for submission toGenBank dbEST. All 17,225 ESTs have been submitted.The ESTs were then clustered and annotated using Parti-Gene [17]. PartiGene first groups ESTs into clusters thatputatively derive from one transcript using CLOBB [64],and then derives a consensus sequence for each clusterwith Phil Green's phrap. The EST translation toolprot4EST [18] was used to predict putative protein trans-lations for each consensus sequence. Each consensus wascompared to the UniProt protein database [65], and tocustom databases of other annelid and model organismsequences, using BLAST [66]. Further annotations werederived using GOtcha, which provides gene ontologyannotation with robust quality scoring [21], and modulesin the annot8r series (Ralf Schmid and M. Blaxter, inpress) that provide annotations referring to proteindomains and families (via Pfam and Interpro) [67],
Page 16 of 21(page number not for citation purposes)
BMC Genomics 2008, 9:266 http://www.biomedcentral.com/1471-2164/9/266
enzyme commission (EC) identifiers, the KEGG meta-bolic pathways database, putative cellular location (viaPSort and SigP) [68,69], physical properties (via ExPasy)[70], and secondary structural predictions (using e.g.TmHMM).
A unified database: LumbriBASEAll the sequence data and associated annotations werecollated in a PostgreSQL relational database called Lum-briBASE [19]. The database was also populated with post-primary analysis microarray expression data (see below),and was used in intensive data exploration. Public accessto the database is provided through a scripted internet-accesible interface using PHP, CGI and java scripts. Lum-briBASE also houses analyses of EST data from other anne-lids derived from submissions to GenBank dbEST: theearthworm Eisenia andrei (1108 ESTs), the polychaeteNereis virens (6978) (Olive and Blaxter, unpublisheddata), and the leech Haementeria depressa (891 ESTs).
Microarray experimental designA reference design was employed for profiling L. rubellustranscript expression levels. The reference sample con-sisted of 65–70 base-long oligonucleotides designedagainst vector sequences found between the amplificationprimer and the inserted cDNA. The sequences of theseprimers are given in Additional File 2. An equimolarquantity of two oligonucleotides was used in order to rep-resent the three different vectors exploited for library con-struction. Use of this reference meant that essentially allreporter spots could be called as positively hybridising inthe reference, extending the ability of the array to reporton even low hybridisation signals in the experimentalsamples. In addition, as this reference could be easilychemically synthesised and therefore replicated, thisdesign permitted comparison of all samples against acommon reference within the present experiment, andcan be extended for future work. The hybridisation probeincluded ~30 pmol of Cy3 labelled target RNA and 1pmol of each oligonucleotide.
Microarray fabricationA representative EST (usually the one inferred to be thelongest) was selected from each of the 8,029 clustersassembled from EST sequence data. Aliquots (5 μl) of theamplified and concentrated products were transferred to384 well plates and mixed with an equal volume ofDMSO. These composite plates were then used to printonto Ultra-GAP glass slides (Corning) using 48 SMP3 pins(Telecham) mounted in a Spotarray 72 (Perkin-Elmer).This printing regime yield spots of approximately 120 μmin diameter. Landmarks were introduced at the left hadcorner of each sub-array (and thus evenly spaced acrossthe whole array) by the introduction of 5 replicates of theLucida Scorecard (Amersham). The Lucida Scorecard is a
selection of heterologous gene reporters which show nocross reactivity to earthworm transcripts (data notshown). Reporters were cross-linked to the surface by bak-ing at 80°C for 2 hours, and UV cross linking. Slides werestored in the dark and under a vacuum until required.
Microarray probe preparationThe Lucida Scorecard test spike (Amersham Life Sciences)was added to 10 μg of total sample RNA prior to oligo-d(T) reverse transcription and coupling to Cy3 using anindirect amino amyl procedure [71]. Labelled targets wereseparated from unincorporated dye by precipitation andseparation on a GFX column (Amersham Life Sciences).Yields of cDNA and incorporated dye were calculated bymeasuring absorption at 260 and 550 nM. The quality ofthe labelled targets was assessed subjectively by separationon a 2% agarose gel poured on a microscope slide and vis-ualised using a LSIV laser scanner. Only labels that dem-onstrated fluorescent incorporation in a wide size range ofcDNAs and where incorporation efficacy exceeded 20pmole CyDye/μg cDNA were used for hybridisation [71].
Microarray hybridisation and quality controlSlides were pre-treated by immersion at 42°C in blockbuffer (5 × SSC, 0.1% SDS and 1% BSA) for 45 min. Slideswere then washed in 0.2 μm filter-sterilised water anddried using compressed air. Labelled target (representing30 pmole of Cy3) was mixed with the common reference(representing 30 pmole of Cy5) and 0.1 nmoles of oligod(T)17 before denaturation at 95°C for 3 min. This wasimmediately introduced onto the slide surface in the pres-ence of 50% formamide, 10 × SSC and 0.2% SDS in a totalvolume of 40 μl. A second slide was applied to the surfaceof the array in such a way as to exclude air bubbles and thehybridisation completed in a humidity chamber at 42°Covernight (18 hr). Slides were separated in 1 × SSC, 0.2%SDS at room temperature and washed in the same bufferfor 10 min at 55°C. They were subsequently washed twicein 0.1 × SSC, 1% SDS at 55°C prior to a final room-tem-perature rinse in 0.1 × SSC. Slides were dried with com-pressed air and an array image acquired using a ScanArrayExpress (Perkin-Elmer).
Analysis of calibrators exploited 10 "alien" RNA spikes(components of the Amersham Lucidea Scorecard) intro-duced at known concentrations, between 1 pmole and 30nmole, prior to labelling and each hybridizing to 10 rep-licate reporter spots on the array. Image analysis of the sig-nals generated by these reporters was performed for eacharray to determine the sensitivity and relationshipbetween RNA concentration and fluorescent signal.Hybridisations showing non-linear response, or wherethe detection limit was below the 10 pmole Lucidea Score-Card calibrator, were removed from subsequent analysis
Page 17 of 21(page number not for citation purposes)
BMC Genomics 2008, 9:266 http://www.biomedcentral.com/1471-2164/9/266
(For representative calibrator analysis, see Additional File3).
Statistical analysis of microarray dataArray images were subjectively quality controlled for arte-facts that would compromise quantification such as back-ground effects and spot morphology. Subsequently, thecalibration standards from the Lucida Scorecard were ana-lysed to objectively assess the sensitivity range and todefine both saturation and background readings. Theimages were analysed using Imagene (Biodiscovery),using the default flagging and segmentation settings, andsubsequently checked by eye. All subsequent analysis wasperformed in GeneSpring 7.3 (Agilent Technologies, PaloAlto, CA). Array data passing these quality standards wereprocessed by background subtraction and generation ofCy3/Cy5 ratio. Data was then normalised within an exper-iment using median polishing (per gene and per chip)normalization implemented using the default methodwithin GeneSpring Software (Agilent Technologies, PaloAlto, CA) incorporating only data where Imagene hadflagged the spot good (0 flag) and the background-sub-tracted data exceeded 100 relative light units. Whereappropriate, data was also normalised by dividing by dataderived from the relevant biological controls. The proc-essed data distributions were visualised using a box plot toestablish whether each chip's data distribution exhibitedcomparable median and quartile ranges, and data notcomplying was further reviewed for the quality for the rawdata. Any data compromised by experimental artefactswas removed from the analysis (Box plots for each exper-iment are given in Additional File 4).
All statistical analyses within an experiment were per-formed on subsets of genes where the data was flagged asgood in a number of arrays representing at least the mini-mum biological replicate size. In this way, poor data wasremoved without thereby removing genes that were onlysignificantly expressed in one experimental condition.Further filtering was performed prior to statistical analysisto remove genes that displayed less than a 1.4 fold changeto any condition within the experiment to minimise falsediscovery. Statistical tests used and their parameters arepresented with the relevant data. Annotation used foranalysis was generated from LumbriBASE (see above).Relevant abstractions of the annotation is provided for allgenes exhibiting significant transcript changes betweengiven biological conditions within Additional Files 5 and6. These tables list most the significant homologue identi-fied within the set of human proteins (from SwissProt),the global protein database (UniProt) and the globalnucleotide database (EMBL) using BLASTX or BLASTN, asappropriate, with an E-value cut-off for BLASTX of 1e-05,and of 1e-65 for BLASTN. A brief description of the match,its accession number and the BLAST score and E-value are
provided. Ontological bias analysis performed when ana-lysing the developmental transcript changes exploited theSwissProt accession numbers of those genes assigned ahuman homologue genes within the Database for Anno-tation, Visualization and Integrated Discovery (DAVID)environment [72].
PCR validation of individual gene expression profilesValidation of array results focused on a confirmation ofexpression patterns by real time quantitative reverse tran-scriptase PCR (Q-RT-PCR). Analysis by Q-RT-PCR wasconducted for two well characterised earthworms gene,metallothionein-2 and β-actin, for which Q-RT-PCR prim-ers were developed and fully validated in previous work[62]. All quantifications were conducted using a cDNAtemplate generated from the sample extract of total RNAused for the microarray hybridisation. Reverse transcrip-tion of a 2 μg sample of collected total RNA was con-ducted at 42°C, anchored by oligo (dT17) primer andrandom hexamers (N6) and using Moloney-Murine Leu-kaemia Virus reverse transcriptase for second strand syn-thesis.
Q-RT-PCR quantification were conducted using customdesigned primers and the universal SYBR® Green Supermix(BIO-RAD, UK). All reactions were optimised to yield anexponential amplification of the target gene. Q-RT-PCRquantification was conducted over 45 cycles off 30 sec at95°C, 30 seconds at the primer specific annealing temper-ature (metallothionein-2 = 58°C and β-actin = 55°C) andconcluded by melting curve analysis to ensure to ensurethe presence of a single major amplification product.Dilution of purified plasmid stocks were used as stand-ards for quantification. Analysis of all samples was con-ducted in triplicate to provide a technical validation forthe quantification. Data were compared with expressionlevels for the same genes measured through microarrayanalysis. Within experiments, treatments were comparedfor significant differences using Student's t-test.
AbbreviationsEST: expressed sequence tag; Cd: Cadmium; Cu: Copper;Zn: Zinc; Fe: Iron; PAH: polycyclic aromatic hydrocarbon;FLA: fluoranthene; ATZ: atrazine; AhR: Aryl hydrocarbonreceptor; GO: Gene ontology; HCC: hierarchal conditionclustering; PCA: principal component analysis; ROM:reactive oxygen metabolite; ROS: reactive oxygen species;GST: glutathione-S transferase; Q-RT-PCR: quantitativereverse transcriptase PCR.
Authors' contributionsJO and SRS constructed earthworm cDNA libraries andsequenced ESTs, JO fabricated and hybridised the micro-arrays. BAH performed EST sequence analysis, establishedand maintained LumbriBASE. CS, PKH, MJJ and DJS gen-
Page 18 of 21(page number not for citation purposes)

BMC Genomics 2008, 9:266 http://www.biomedcentral.com/1471-2164/9/266
erated the earthworm samples with accompanying full lifehistory metadata and population modelling. LJL per-formed inorganic residue analysis. JW aided with microar-ray experimentation. PK was responsible for analysis ofmicroarray data and mode of action analysis of the tran-script data. DJS, CS, SRS, AJM, PK and MLB participated inconception, design and interpretation of the study. PKand MLB drafted the manuscript and together with DJS,AJM, CS, SRS, contributed to the iterative refinement ofthe article. All authors have read and approved the sub-mitted version.
Additional material
Additional File 1Table showing cDNA libraries sampled for expressed sequence tags. A summary of the cDNA libraries constructed and sampled for the project.Click here for file[http://www.biomedcentral.com/content/supplementary/1471-2164-9-266-S1.doc]
Additional File 2Sequences of oligonucleotides forming the reference probe. This table gives the sequences of the oligonucleotides used as a reference probe for the microarray hybridisation experiments.Click here for file[http://www.biomedcentral.com/content/supplementary/1471-2164-9-266-S2.doc]
Additional File 3Assessment of micro-array sensitivity and signal linearity. Representative analysis of the fluorescent signal generated by 10 RNAs introduced at known concentrations prior to labelling and detected by complementary reporter (10 replicates of each reporter spotted on the array). Panel A are data generated from Cadmium control array replicate 4, panel B is from Fluoranthene control replicate 7 and panel C is from Atrazine control rep-licate 1. The average signal is indicted by closed circles with technical error bars representing the standard error of the measurements. A fitted regres-sion line is shown for the linear portion of the response together with the R2 value for the fitted line.Click here for file[http://www.biomedcentral.com/content/supplementary/1471-2164-9-266-S3.ppt]
Additional File 4Distribution of array micro-array data post normalisation. The distribu-tion of the normalised data is shown for samples employed for analysing transcript changes in response to developmental stage (Panel A), together with Cadmium (Panel B) fluoranthene (Panel C), and Atrazine (Panel D) exposure. Boxes are waisted at the distribution median and encompass the interquartile range, with whiskers indicating a further 1.5× the inter-quartile distance.Click here for file[http://www.biomedcentral.com/content/supplementary/1471-2164-9-266-S4.ppt]
Additional File 5Graphical representations of relative gene expression against fluorescence intensity from control and xenobiotic-exposed samples. Array data were normalised and filtered (as described in Materials and Methods) and the log2 of the average fold change (M) plotted against the log2 of the average mean signal intensity (A). Panel A shows a MA plot for control earth-worms from the Cadmium exposure experiment whilst Panel B displays data from organisms exposed to 500 ppm Cadmium. Metallothionein ESTs are highlighted within the dashed circle.Click here for file[http://www.biomedcentral.com/content/supplementary/1471-2164-9-266-S5.ppt]
Additional File 6Transcripts significantly changed between adult and juvenile earthworms. A table showing all transcripts identified as changing significantly between adult and juvenile earthworms (T-test, p < 0.01, Bonferroni False Discovery Rate)Click here for file[http://www.biomedcentral.com/content/supplementary/1471-2164-9-266-S6.xls]
Additional File 7Transcripts significantly changed in adult earthworms exposed to cad-mium. A table showing all transcripts identified as changing significantly in adult earthworms exposed to cadmium (ANOVA, p < 0.05, Benjamini and Hochberg False Discovery Rate)Click here for file[http://www.biomedcentral.com/content/supplementary/1471-2164-9-266-S7.xls]
Additional File 8Transcripts significantly changed in adult earthworms exposed to fluoran-thene. A table showing all transcripts identified as changing significantly in adult earthworms exposed to fluoranthene (ANOVA, p < 0.05, Ben-jamini and Hochberg False Discovery Rate)Click here for file[http://www.biomedcentral.com/content/supplementary/1471-2164-9-266-S8.xls]
Additional File 9Transcripts significantly changed in adult earthworms exposed to atrazine. A table showing all transcripts identified as changing significantly in adult earthworms exposed to atrazine (ANOVA, p < 0.05, Benjamini and Hochberg False Discovery Rate)Click here for file[http://www.biomedcentral.com/content/supplementary/1471-2164-9-266-S9.xls]
Additional File 10Functional Transcript Clusters Significantly (p < 0.05) Changed During Cadmium Exposure of Adult Earthworms. A table showing the functional identifications of transcripts showing altered abundance following cad-mium exposure.Click here for file[http://www.biomedcentral.com/content/supplementary/1471-2164-9-266-S10.xls]
Page 19 of 21(page number not for citation purposes)

BMC Genomics 2008, 9:266 http://www.biomedcentral.com/1471-2164/9/266
AcknowledgementsThis work was supported by a research grant from the UK Natural Envi-ronmental Research Council (NER/T/S/2001/00021) with additional sup-port from the Brixham Environmental Laboratory (AstraZeneca). We would like to acknowledge the contribution to the construction and clone preparation of individual libraries of Dr H. Ricketts and Ms S. Baldwin. Sequencing was performed by Jill Lovell, Andrew Gillies, Anna Montazam and Jenna Nicholls of the School of Biological Sciences Sequencing Service, Edinburgh. Staff at the NERC Environmental Bioinformatics Centre assisted with ArrayExpress data submission. We would also like to specifically rec-ognise the valued contributions of Dr John Parkinson (Department of Bio-chemistry, University of Toronto, Canada), and Dr O. Georgiev (Institute of Molecular Biology, University of Zurich, Switzerland) in the early stages of the project.
References1. Darwin C: The formation of vegtable Mould through the
action of Worms with observations on their habitats. Lon-don: John Murray; 1883.
2. Lavelle P, Spain A: Soil Ecology. 1st edition. Amsterdam: KluwerAcademic Publishers; 2001.
3. Spurgeon DJ, Weeks JM, Van Gestel CAM: A summary of elevenyears progress in earthworm ecotoxicology. Pedobiologia 2003,47(5–6):588-606.
4. Bundy JG, Osborn D, Weeks JM, Lindon JC, Nicholson JK: An NMR-based metabonomic approach to the investigation of coe-lomic fluid biochemistry in earthworms under toxic stress.Febs Letters 2001, 500(1–2):31-35.
5. Bundy JG, Spurgeon DJ, Svendsen C, Hankard PK, Weeks JM, OsbornD, Lindon JC, Nicholson JK: Environmental metabonomics:Applying combination biomarker analysis in earthworms ata metal contaminated site. Ecotoxicology 2004, 13(8):797-806.
6. Harper GL, Cesarini S, Casey SP, Morgan AJ, Kille P, Bruford MW:Microsatellite markers for the earthworm Lumbricus rubel-lus. Molecular Ecology Notes 2006, 6(2):325-327.
7. Kille P, Sturzenbaum SR, Galay M, Winters C, Morgan AJ: Moleculardiagnosis of pollution impact in earthworms – Towards inte-grated biomonitoring. Pedobiologia 1999, 43(6):602-607.
8. Morgan AJ, Sturzenbaum SR, Kille P: A short overview of molec-ular biomarker strategies with particular regard to recentdevelopments in earthworms. Pedobiologia 1999, 43(6):574-584.
9. Morgan AJ, Sturzenbaum SR, Winters C, Kille P: Cellular andmolecular aspects of metal sequestration and toxicity inearthworms. Invertebrate Reproduction & Development 1999, 36(1–3):17-24.
10. Sturzenbaum SR, Kille P, Morgan AJ: Heavy metal-induced molec-ular responses in the earthworm, Lumbricus rubellus genetic
fingerprinting by directed differential display. Applied Soil Ecol-ogy 1998, 9(1–3):495-500.
11. Sturzenbaum SR, Cater S, Morgan AJ, Kille P: Earthworm pre-pro-carboxypeptidase: a copper responsive enzyme. Biometals2001, 14(1):85-94.
12. Sturzenbaum SR, Kille P, Morgan AJ: Identification of heavy metalinduced changes in the expression patterns of the transla-tionally controlled tumour protein (TCTP) in the earth-worm Lumbricus rubellus. Biochimica et Biophysica Acta GeneStructure and Expression 1998, 1398(3):294-304.
13. Sturzenbaum SR, Georgiev O, Morgan AJ, Kille P: Cadmiumdetoxification in earthworms: From genes to cells. Environ-mental Science & Technology 2004, 38(23):6283-6289.
14. Sturzenbaum SR, Kille P, Morgan AJ: The identification, cloningand characterization of earthworm metallothionein. Febs Let-ters 1998, 431(3):437-442.
15. Sturzenbaum SR, Winters C, Galay M, Morgan AJ, Kille P: Metal iontrafficking in earthworms – Identification of a cadmium-spe-cific metallothionein. Journal of Biological Chemistry 2001,276(36):34013-34018.
16. Sturzenbaum SR, Parkinson J, Blaxter M, Morgan AJ, Kille P, GeorgievO: The earthworm Expressed Sequence Tag project. Pedobi-ologia 2003, 47(5–6):447-451.
17. Parkinson J, Anthony A, Wasmuth J, Schmid R, Hedley A, Blaxter M:PartiGene – constructing partial genomes. Bioinformatics 2004,20(9):1398-1404.
18. Wasmuth JD, Blaxter ML: Prot4EST: Translating ExpressedSequence Tags from neglected genomes. Bmc Bioinformatics2004, 5:.
19. Earthworms.org: home of the Lumbricus rubellus genomeproject [http://www.earthworms.org]
20. Ashburner M, Ball CA, Blake JA, Botstein D, Butler H, Cherry JM,Davis AP, Dolinski K, Dwight SS, Eppig JT, et al.: Gene Ontology:tool for the unification of biology. Nature Genetics 2000,25(1):25-29.
21. Martin DM, Berriman M, Barton GJ: GOtcha: a new method forprediction of protein function assessed by the annotation ofseven genomes. BMC Bioinformatics 2004, 5:178.
22. Sochova I, Hofman J, Holoubek I: Using nematodes in soil ecotox-icology. Environment International 2006, 32(3):374-383.
23. Harris TW, Chen N, Cunningham F, Tello-Ruiz M, Antoshechkin I,Bastiani C, Bieri T, Blasiar D, Bradnam K, Chan J, et al.: WormBase:a multi-species resource for nematode biology and genom-ics. Nucleic Acids Res 2004:D411-417.
24. Dudoit S, Yang YH, Callow MJ, Speed TP: Statistical methods foridentifying differentially expressed genes in replicated cDNAmicroarray experiments. Statistica Sinica 2002, 12(1):111-139.
25. Beyersmann D, Hechtenberg S: Cadmium, gene regulation, andcellular signalling in mammalian cells. Toxicology and AppliedPharmacology 1997, 144(2):247-261.
26. Waisberg M, Joseph P, Hale B, Beyersmann D: Molecular and cel-lular mechanisms of cadmium carcinogenesis. Toxicology 2003,192(2–3):95-117.
27. Giaginis C, Gatzidou E, Theocharis S: DNA repair systems as tar-gets of cadmium toxicity. Toxicology and Applied Pharmacology2006, 213(3):282-290.
28. Wang YD, Fang J, Leonard S, Demchuk E, Rao KMK: Cadmiuminhibits the activity of Complexes II and III of respiratorychain and induces ROS production in mitochondria. FasebJournal 2004, 18(5):A1196-A1196.
29. Wiseman A: Avoidance of oxidative-stress perturbation inyeast bioprocesses by proteomic and genomic biostrategies.Letters in Applied Microbiology 2005, 40(1):37-43.
30. Casalino E, Sblano C, Calzaretti G, Landriscina C: Acute cadmiumintoxication induces alpha-class glutathione S-transferaseprotein synthesis and enzyme activity in rat liver. Toxicology2006, 217(2–3):240-245.
31. Stewart D, Killeen E, Naquin R, Alam S, Alam J: Degradation oftranscription factor Nrf2 via the ubiquitin-proteasome path-way and stabilization by cadmium. Journal of Biological Chemistry2003, 278(4):2396-2402.
32. Filipic M, Fatur T, Vudrag M: Molecular mechanisms of cadmiuminduced mutagenicity. Human & Experimental Toxicology 2006,25(2):67-77.
Additional File 11Functional Transcript Clusters Significantly (p < 0.05) Changed During Fluoranthene Exposure of Adult Earthworms. A table showing the func-tional identifications of transcripts showing altered abundance following fluoranthene exposure.Click here for file[http://www.biomedcentral.com/content/supplementary/1471-2164-9-266-S11.xls]
Additional File 12Functional Transcript Clusters Significantly (p < 0.05) Changed During Atrazine Exposure of Adult Earthworms. A table showing the functional identifications of transcripts showing altered abundance following atra-zine exposureClick here for file[http://www.biomedcentral.com/content/supplementary/1471-2164-9-266-S12.xls]
Page 20 of 21(page number not for citation purposes)
http://www.ncbi.nlm.nih.gov/entrez/query.fcgi?cmd=Retrieve&db=PubMed&dopt=Abstract&list_uids=9655922
http://www.ncbi.nlm.nih.gov/entrez/query.fcgi?cmd=Retrieve&db=PubMed&dopt=Abstract&list_uids=9714559

BMC Genomics 2008, 9:266 http://www.biomedcentral.com/1471-2164/9/266
33. Mladenov E, Anachkova B, Tsaneva I: Sub-nuclear localization ofRad51 in response to DNA damage. Genes to Cells 2006,11(5):513-524.
34. Yang ZG, Liu Y, Mao LY, Zhang JT, Zou Y: Dimerization of humanXPA and formation of XPA(2)-RPA protein complex. Bio-chemistry 2002, 41(43):13012-13020.
35. Martelli A, Moulis JM: Zinc and cadmium specifically interferewith RNA-binding activity of human iron regulatory protein1. Journal of Inorganic Biochemistry 2004, 98(8):1413-1420.
36. Sabolic I, Herak-Kramberger CM, Brown D: Subchronic cadmiumtreatment affects the abundance and arrangement ofcytoskeletal proteins in rat renal proximal tubule cells. Toxi-cology 2001, 165(2–3):205-216.
37. Walker CH: Organic Pollutants: An Ecotoxicological Perspec-tive. London Taylor and Francis; 2001.
38. Rubin H: Synergistic mechanisms in carcinogenesis by polycy-clic aromatic hydrocarbons and by tobacco smoke: a bio-his-torical perspective with updates. Carcinogenesis 2001,22(12):1903-1930.
39. Miller KP, Ramos KS: Impact of cellular metabolism on the bio-logical effects of benzo[a]pyrene and related hydrocarbons.Drug Metabolism Reviews 2001, 33(1):1-35.
40. Burstyn I, Kromhout H, Partanen T, Svane O, Langard S, Ahrens W,Kauppinen T, Stucker I, Shaham J, Heederik D, et al.: Polycyclic aro-matic hydrocarbons and fatal ischemic heart disease. Epide-miology 2005, 16(6):744-750.
41. Hennig B, Oesterling E, Toborek M: Environmental toxicity,nutrition, and gene interactions in the development ofatherosclerosis. Nutrition Metabolism and Cardiovascular Diseases2007, 17(2):162-169.
42. Ma Q: Induction of CYP1A1. The AhR/DRE paradigm: Tran-scription, receptor regulation, and expanding biologicalroles. Current Drug Metabolism 2001, 2(2):149-164.
43. Nebert DW, Roe AL, Dieter MZ, Solis WA, Yang Y, Dalton TP: Roleof the aromatic hydrocarbon receptor and [Ah] gene bat-tery in the oxidative stress response, cell cycle control, andapoptosis. Biochemical Pharmacology 2000, 59(1):65-85.
44. AliOsman F, Akande O, Antoun G, Mao JX, Buolamwini J: Molecularcloning, characterization, and expression in Escherichia coliof full-length cDNAs of three human glutathione S-trans-ferase Pi gene variants – Evidence for differential catalyticactivity of the encoded proteins. Journal of Biological Chemistry1997, 272(15):10004-10012.
45. Martinez JM, Baek SJ, Mays DM, Tithof PK, Eling TE, Walker NJ:EGR1 is a novel target for AhR agonists in human lung epi-thelial cells. Toxicological Sciences 2004, 82(2):429-435.
46. Kim JH, Yamaguchi K, Lee SH, Tithof PK, Sayler GS, Yoon JH, Baek SJ:Evaluation of polycyclic aromatic hydrocarbons in the activa-tion of early growth response-1 and peroxisome proliferatoractivated receptors. Toxicological Sciences 2005, 85(1):585-593.
47. Leonard SS, Wang SW, Shi XL, Jordan BS, Castranova V, Dubick MA:Wood smoke particles generate free radicals and cause lipidperoxidation, DNA damage, NF kappa B activation andTNF-alpha release in macrophages. Toxicology 2000, 150(1–3):147-157.
48. Achazi RK, Flenner C, Livingstone DR, Peters LD, Schaub K, ScheiweE: Cytochrome P450 and dependent activities in unexposedand PAH-exposed terrestrial annelids. Comparative Biochemistryand Physiology C-Pharmacology Toxicology & Endocrinology 1998, 121(1–3):339-350.
49. Brown PJ, Long SM, Spurgeon DJ, Svendsen C, Hankard PK: Toxico-logical and biochemical responses of the earthworm Lumbri-cus rubellus to pyrene, a non-carcinogenic polycyclicaromatic hydrocarbon. Chemosphere 2004, 57(11):1675-1681.
50. Livingstone DR, Lemaire P, Matthews A, Peters LD, Porte C, Fitz-patrick PJ, Forlin L, Nasci C, Fossato V, Wootton N, et al.: Assess-ment of the impact of organic pollutants on Goby(Zosterisessor ophiocephalus) and Mussel (Mytilus galloprovin-cialis) from the Venice lagoon, Italy – biochemical studies.Marine Environmental Research 1995, 39(1–4):235-240.
51. Peters LD, Shaw JP, Nott M, O'Hara SCM, Livingstone DR: Develop-ment of cytochrome P450 as a biomarker of organic pollu-tion in Mytilus sp.: field studies in United Kingdom ('SeaEmpress' oil spill) and the Mediterranean Sea. Biomarkers1999, 4(6):425-441.
52. PAN Pesticides Database [http://www.pesticideinfo.org]
53. Morgan MK, Scheuerman PR, Bishop CS, Pyles RA: Teratogenicpotential of atrazine and 2,4-D using FETAX. Journal of Toxicol-ogy and Environmental Health 1996, 48(2):151-168.
54. Pfister K, Steinback KE, Gardner G, Arntzen CJ: Photoaffinity-labe-ling of an herbicide receptor protein in chloroplast mem-branes. Proceedings of the National Academy of Sciences of the UnitedStates of America-Biological Sciences 1981, 78(2):981-985.
55. Kee Y, Huibregtse JM: Regulation of catalytic activities of HECTubiquitin ligases. Biochemical and Biophysical Research Communica-tions 2007, 354(2):329-333.
56. Philippe H, Lartillot N, Brinkmann H: Multigene analyses of bilat-erian animals corroborate the monophyly of Ecdysozoa,Lophotrochozoa, and Protostomia. Molecular Biology and Evolu-tion 2005, 22(5):1246-1253.
57. Jones M, Blaxter M: Evolutionary biology – Animal roots andshoots. Nature 2005, 434(7037):1076-1077.
58. Cho SJ, Cho PY, Lee MS, Na Y, Lee JH, Koh KS, Choo JK, Park SC:Up-regulation of multiple serine proteinases during earth-worm tail regeneration. Invertebrate Reproduction & Development2001, 40(2–3):103-108.
59. Cooper EL, Kauschke E, Cossarizza A: Digging for innate immu-nity since Darwin and Metchnikoff. Bioessays 2002,24(4):319-333.
60. Spurgeon DJ, Svendsen C, Weeks JM, Hankard PK, Stubberud HE,Kammenga JE: Quantifying copper and cadmium impacts onintrinsic rate of population increase in the terrestrial oligo-chaete Lumbricus rubellus. Environmental Toxicology and Chemistry2003, 22(7):1465-1472.
61. Chomczynski P, Sacchi N: Single-step method of RNA isolationby acid guanidinium thiocyanate phenol chloroform extrac-tion. Analytical Biochemistry 1987, 162(1):156-159.
62. Galay-Burgos M, Spurgeon DJ, Weeks JM, Sturzenbaum SR, MorganAJ, Kille P: Developing a new method for soil pollution moni-toring using molecular genetic biomarkers. Biomarkers 2003,8(3–4):229-239.
63. Whitton C, Daub J, Thompson M, Blaxter M: Expressed sequencetags: medium-throughput protocols. Methods Mol Biol 2004,270:75-92.
64. Parkinson J, Guiliano DB, Blaxter M: Making sense of ESTsequences by CLOBBing them. Bmc Bioinformatics 2002, 3:.
65. Wu CH, Apweiler R, Bairoch A, Natale DA, Barker WC, BoeckmannB, Ferro S, Gasteiger E, Huang H, Lopez R, et al.: The UniversalProtein Resource (UniProt): an expanding universe of pro-tein information. Nucleic Acids Res 2006:D187-191.
66. Altschul SF, Gish W, Miller W, Myers EW, Lipman DJ: Basic LocalAlignment Search Tool. Journal of Molecular Biology 1990,215(3):403-410.
67. Quevillon E, Silventoinen V, Pillai S, Harte N, Mulder N, Apweiler R,Lopez R: InterProScan: protein domains identifier. NucleicAcids Research 2005, 33:W116-W120.
68. Horton P, Nakai K: Better prediction of protein cellular locali-zation sites with the k nearest neighbors classifier. ProceedingsInternational Conference on Intelligent Systems for Molecular Biology 1997,5:147-152.
69. Bendtsen JD, Nielsen H, von Heijne G, Brunak S: Improved predic-tion of signal peptides: SignalP 3.0. Journal of Molecular Biology2004, 340(4):783-795.
70. Gasteiger E, Gattiker A, Hoogland C, Ivanyi I, Appel RD, Bairoch A:ExPASy: the proteomics server for in-depth protein knowl-edge and analysis. Nucleic Acids Research 2003, 31(13):3784-3788.
71. Ausubel F, Brent R, Kingston R, Moore D, Seidman J, Smith J, StruhlK: Nucleic Acid Arrays. Wiley; 2000.
72. Dennis G, Sherman BT, Hosack DA, Yang J, Gao W, Lane HC, Lem-picki RA: DAVID: Database for annotation, visualization, andintegrated discovery. Genome Biology 2003, 4(9):3.
73. Sturzenbaum SR, Kille P: Control genes in quantitative molecu-lar biological techniques: the variability of invariance. Com-parative Biochemistry and Physiology B-Biochemistry & Molecular Biology2001, 130(3):281-289.
Page 21 of 21(page number not for citation purposes)
http://www.ncbi.nlm.nih.gov/entrez/query.fcgi?cmd=Retrieve&db=PubMed&dopt=Abstract&list_uids=9092542
http://www.ncbi.nlm.nih.gov/entrez/query.fcgi?cmd=Retrieve&db=PubMed&dopt=Abstract&list_uids=9092542
http://www.ncbi.nlm.nih.gov/entrez/query.fcgi?cmd=Retrieve&db=PubMed&dopt=Abstract&list_uids=9092542
http://www.ncbi.nlm.nih.gov/entrez/query.fcgi?cmd=Retrieve&db=PubMed&dopt=Abstract&list_uids=9972476
http://www.ncbi.nlm.nih.gov/entrez/query.fcgi?cmd=Retrieve&db=PubMed&dopt=Abstract&list_uids=9972476
http://www.ncbi.nlm.nih.gov/entrez/query.fcgi?cmd=Retrieve&db=PubMed&dopt=Abstract&list_uids=8642623
http://www.ncbi.nlm.nih.gov/entrez/query.fcgi?cmd=Retrieve&db=PubMed&dopt=Abstract&list_uids=8642623
http://www.ncbi.nlm.nih.gov/entrez/query.fcgi?cmd=Retrieve&db=PubMed&dopt=Abstract&list_uids=2440339
http://www.ncbi.nlm.nih.gov/entrez/query.fcgi?cmd=Retrieve&db=PubMed&dopt=Abstract&list_uids=2440339
http://www.ncbi.nlm.nih.gov/entrez/query.fcgi?cmd=Retrieve&db=PubMed&dopt=Abstract&list_uids=2440339
http://www.ncbi.nlm.nih.gov/entrez/query.fcgi?cmd=Retrieve&db=PubMed&dopt=Abstract&list_uids=2231712