Identification and Characterisation of Endophytic Bacteria ...

Transcription start site identification in
bacteria
Marko Djordjevic
Faculty of Biology, University of Belgrade

How is
transcription
initiated?
How to predict How to predict
transcription
start sites?

RNA polymerase
Basic idea behind transcription is
complementarity.
Synthesis of RNA from DNA template is
called transcription.
Molecular machine that exhibits
transcription is RNA polymerase.
RNA polymerase is essential for life
and is found in all living organisms.
2006 Nobel prize in Chemistry for RNA Polymerase awarded to Roger Kornberg.
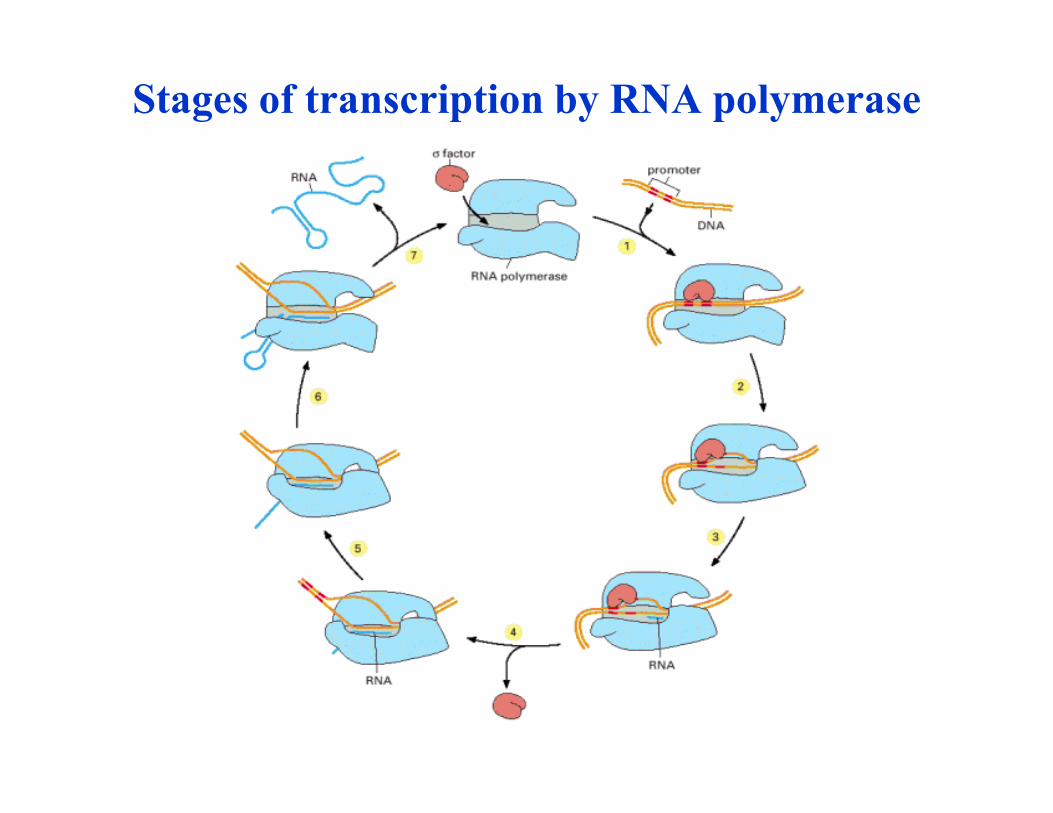
Stages of transcription by RNA polymerase

Control of Gene Expression by Transcription
Factors
Alberts et al, Molecular Biology of the cell.

Transcription start sites (TSS)
A starting point to understand transcription regulation
Necessary for gene and operon prediction
TSS detection in genome
Classical bioinformatic problemClassical bioinformatic problem
Existing methods show poor accuracy
(a huge number of false positives)

Bacterial promoter structure
promoterxxxstrand -35 spacer -15 short -10
'accApxxxforward' 'TTGCTA' [17] 'AGGC' 'AAATT'
'accBpxxxforward' 'TTGATT' [17] 'GACC' 'AGTAT'
'accDpxxxreverse' 'TATCCA' [19] 'TGTT' 'TTAAT'
'aceBpxxxforward' 'TTGATT' [16] 'GAGT' 'AGTCT'
'acnAp1xxxforward' 'CTAACA' [15] 'GCCT' 'TTATA'
'acnAp2xxxforward' 'TCAAAT' [19] 'TGTT' 'ATCTT'
'acnBxxxforward' 'TTAACA' [17] 'TGCT' 'ATTCT'
'adhEp1xxxreverse' 'CTAATG' [17] 'TACT' 'ACAAT''adhEp1xxxreverse' 'CTAATG' [17] 'TACT' 'ACAAT'
Basic difficulty: motifs that bacterial promoter are highly degenerated
CAAATT
CAGTAT
TTTAAT
TTTATA
TATCTT
TATAAT consensus sequence
-38 19 1 12 10 -48
-15 -38 -8 -10 -3 -32
-13 -48 -6 -7 -10 -48
17 -32 8 -9 -6 19
A
C
G
T
Weight matrix

What are possible problems?
Kinetic effects are important?
Poised promoters: Sites where RNAP binds with high
affnity, but opens the two DNA strands too slowly for
functional transcription.functional transcription.
What kinetic parameters are relevant for promoter
recognition?
Alignment is not acurate?
Additional motifs determine specificity?

Talk Overview
PART I
A biophysical model of transcription initiation in bacteria(Biophys J. 2008;94(11):4233)
PART II
Estimate importance of kinetic effectsEstimate importance of kinetic effects(Integrative Biol. 2013; 5(5):796)
PART III
More accurate alignment of promoter elements(J Bacteriol. 2011;193(22):6305)
Beginning of an algorithm(J Mol Biol. 2012;416(3):389)

PART I
A biophysical model of transcription initiation A biophysical model of transcription initiation

The open complex
formation is the first step in
transcription initiation.
Stages of transcription by RNA polymerase
transcription initiation.
RNAP opens two strands of
DNA, so that a transcription
bubble of ~15bps is formed.

Recent findings
Bioinformatic study shows that region of
~15bps immediately upstream of
transcription start site is prone for melting.
-10
+1
prone to melting
Single molecule experiments show that
promoter region is melted in one step at least
at the time resolution of 1s.
Since only short living intermediates (if any)
exist, it is hard to directly experimentally test
different hypothesis.
prone to melting

RNAP
RNAP
Bubble is formed in one step, through thermal fluctuations which
transiently break bonds in dsDNA (DNA breathing).
thermal fluctuations
M. Djordjevic and R. Bundschuh, Biophys. J 94 (11): 4223 (2008)
Transiently formed ~15bp bubble is than stabilized by RNAP
In this simple model, the bubble formation is independent from RNAP,
i.e. the role of RNAP is only to stabilize the final bubble.

( ) ( ) ( )ln 1m mG S c l G Sγ∆ = + + + ∆ ɶ
Biophysics of bubble formation in dsDNA
Energy required to melt a bubble in DNA
Due to high initiation energy, bubble is formed cooperatively, i.e. as a zipper.
Kinetics of bubble formation: ( ) ( ) ( ) ( ) ( )1 1
l
l l l
dp tk p t k p t k k p t− + + − + −= + − + Kinetics of bubble formation:
The rate of bubble opening
Between five and eight orders of magnitude
larger compared to experimentally measured
rates of bubble formation.
( ) ( ) ( ) ( )1 1l l lk p t k p t k k p tdt
− + + − + −= + − +
( )( ) 8 11
0
exp ~ 10 10 1o m B
kk G S k T s
l
− −−= ∆ −
Poor agreement with the
experiment!

Why is the entire ~15bp region prone to melting?
+1
B C
A
-10M. Djordjevic and R. Bundschuh,
Biophys. J 94 (11): 4223 (2008)
Reported melting destabilization of entire ~15bp transcription bubble is an
artificial consequence of the fact that only -10 region is prone to melting!

RNAP
DNA
+
DNA
RNAP RNAP
DNA DNA
RNAP
RNAP bounds to
dsDNA
~5bp of DNA is
melted
The melted region
is extended.
In the first step, only -10 region is melted through thermal
fluctuations facilitated by RNAP-ssDNA interactions.
First step has to be rate limiting (from the single-molecule experiment).
The hypothesis is consistent with recent structural data, indicating that aromatic
residues of RNAP sigma subunit are ideally positioned to interact with transiently
exposed -10 element single-stranded bases.
In the second step, the bubble extends
towards the transcription start site.
M. Djordjevic and R. Bundschuh,
Biophys J 94 (11): 4223 (2008)

The rate of transition from closed to open complex
( ) ( ) ( )( ) ( )( ) ( )( )* * *G S G S G S ∆ +∆ −∆
Melting of -10 region
is rate determining
[ ] [ ] [ ] [ ] [ ]1 2
1
on
off
k f f
c o ok
k kRNAP DNA RNAP DNA RNAP DNA RNAP DNA→+ − → − → −←
energy to melt
-10 region
interaction
with dsDNA
interaction
with ssDNA
( )( ) ( )( ) ( )( ) ( )( ) ( )( )10 10 10
110 10exp
m ds ss
f f
B
G S G S G Sk S k S
k T
− − −
− −
∆ +∆ −∆ ≈
∼
( )( )*
10ssG S −∆
DNA melting energy
parameters extensively
measured (Santa Lucia)
( )( )*
10dsG S −∆
Measured at lower
temperature to
prevent DNA melting
Measured with DNA
construct mimicking
open complex
( )( )*
10mG S −∆
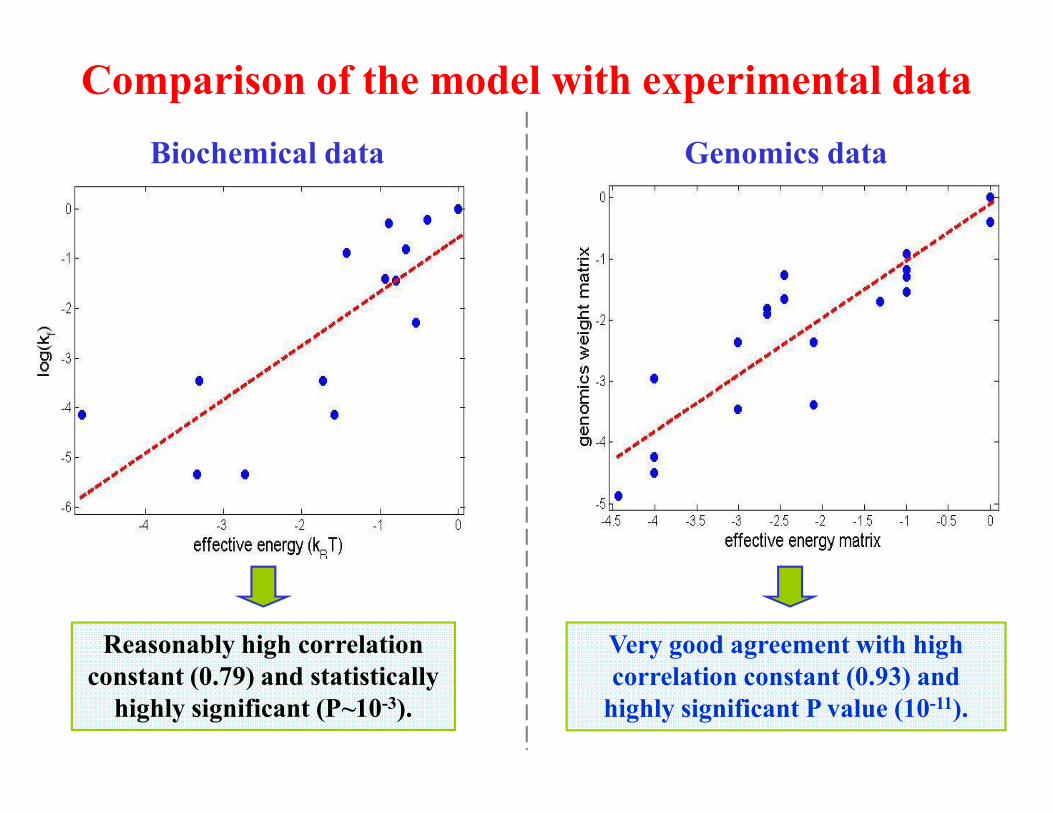
Comparison of the model with experimental data
Biochemical data Genomics data
Reasonably high correlation
constant (0.79) and statistically
highly significant (P~10-3).
Very good agreement with high
correlation constant (0.93) and
highly significant P value (10-11).

Conclusion I
• The results strongly support qualitative hypothesis, by which
the open complex is formed as a two step process, where the
first rate-limiting step consists of melting the upstream part of
the transcription bubble through DNA breathing facilitated by
RNAP-DNA interactions.
•We derived an explicit (simple) relationship connecting
transcription initiation rate with measured physical properties
of promoter-DNA and RNAP-DNA interactions (DNA melting
energy and RNAP-DNA interaction energy in closed and open
complex).
• Bioinformatic applications: allow efficient analysis of kinetic
properties of DNA sequences on the whole genome scale.
M Djordjevic and R Bundschuh, Biophys. J 94 (11): 4223 (2008)

PART II
Estimating kinetic effectsEstimating kinetic effects

Kinetics of transcription initiation
Is RNA polymerase kinetically poised at
many locations in genome?
Poised promoters - Locations in genome where RNAP binds with high
affinity, but has a low rate of transcription initiation.
If yes, taking into account kinetic effects is likely
necessary for accurate transcription start site detection
many locations in genome?
M Djordjevic, Integrative Biol. 2013; 5(5):796

Rate of transcription initiation Binding affinity
Depends on interaction energy of RNAP
with ssDNA, and on DNA melting energy.
Depends on interaction energy
of RNAP with dsDNA.
Poised promoters are determined by high binding affinity and
low transcription initiation rate.
There is no a-priori reason for why binding affinity and the
rate of transcription initiation should be related to each other.

2 0.86R =
For every sequence in E. coli intergenic regions we calculate transcription activity and binding affinity
M Djordjevic, Integrative Biol. 2013; 5(5):796
As we go to higher binding affinities, most (or all) of these strong binders correspond
to functional promoters (i.e. to detectable levels of transcription).

What are the causes of good correlation between the binding affinity
and the rate of transcription initiation?If DNA sequence in intergenic regions
is randomized
If interaction energies of RNAP binding
domains are randomly permuted
R2=0.84
Negligible decrease of correlation
Good correlation is not
due to genome sequence!
Correlation is completely lost
Good correlation is entirely on the
level of RNAP protein domains.

Is the good correlation due to some generic property of
DNA binding domains?
Substitute specificities binding domains 2.3 (ssDNA interactions) and 2.4 (dsDNA
interactions), with those of different E coli DNA binding proteins.
Correlation constant corresponding
to actual RNAP binding domains is
larger compared to the correlation
constants for other E Coli DNA constants for other E Coli DNA
binding domains.
Interaction domains of RNAP are
`hardwired’ so as to ensure
evading poised promoters
M Djordjevic, Integrative Biol. 2013; 5(5):796

Conclusion II
RNAP DNA binding domains are disigned so as to
reduce the extent of RNAP poising in genome.
There is still a substantial number of poised
promoters in genome.
Kinetic effects should be taken into account in both
experimental and bioinformatics searches of TSS
(M. D. and M. Djordjevic, in preparation).

PART III
Redefining promoter sequence specificityRedefining promoter sequence specificity

Alignment of promoter elements
• Align promoter elements of ~300 experimentally
detected TSS
• First align -10 elements through Gibbs search• First align -10 elements through Gibbs search
• Use them as anchor to align -35 elements
• Perform iterative supervised search to improve
the alignment
Djordjevic M. J Bacteriol. 2011;193(22):6305

Specificity of promoter elements
Qualitative differences with
previously published
alignments
A careful alignment allows
detecting and constructing
weight matrices for sequences
outside of -10 and -35 element.
Djordjevic M. J Bacteriol. 2011;193(22):6305

Element strength correlation
-15 element and -35 element interact with RNAP
in dsDNA form
-10 element interacts with RNAP in ssDNA form
Surprisingly, -15 element exhibits a significantly
stronger negative correlation with total promoter
strength than with -35 element.strength than with -35 element.
Total promoter strength rather than
binding affinity of RNAP to dsDNA
determines functional promoter.
Djordjevic M. J Bacteriol. 2011;193(22):6305

Predictions with new alignment
Standard weight-matrix algorithm with new alignment
can detect all experimentally found promoters in E. coli
bacteriophage phiEco32. bacteriophage phiEco32. (Pavlova O, et al., J Mol Biol. 2012,416(3):389)
Note: Bacteriophages have short genome sequence and
strong promoters – relatively easy problem.

Conclusion and outlook
Explicit biophysical modeling is likely a proper
framework for accurate TSS prediction.
Kinetic effects have to be taken into accountKinetic effects have to be taken into account
More careful alignments should increase search
specificity.
Challenge: how to accurately parametrize the
biophysical models

Acknowledgements
Ministry of Science and
Education of Serbia
FP7 Marie Curie International
Reintegration grant