TRANSACTIONS OF POWDER METALLURGY ASSOCIATION OF INDIA
61
ISSN 0377-9416 Chief Editor - P. Ramakrishnan www.pmai.in TRANSACTIONSOF POWDERMETALLURGY ASSOCIATIONOFINDIA Vol. 44 No.2, December 2018
Transcript of TRANSACTIONS OF POWDER METALLURGY ASSOCIATION OF INDIA

ISSN 0377-9416
Chief Editor - P. Ramakrishnan
www.pmai.in
TRANSACTIONS�OFPOWDER�METALLURGYASSOCIATION�OF�INDIA
Vol. 44 No.2, December 2018
Chief Editor - P. Ramakrishnan
TRANSACTIONS�OFPOWDER�METALLURGYASSOCIATION�OF�INDIA
ISSN 0377-9416
www.pmai.in
Vol. 44 No.2, December 2018

Powder Metallurgy Association of India
President Shri N. Gopinath
Vice President Shri Aniket Gore Shri Deepak Grover Prof. Narendra Dhokey Shri Rajendra Sethiya General Secretary Dr. Deep Prakash
Treasurer Dr. Murli Gopal Krishnamoorty
Joint Secretary Shri Sidharth Singhal Shri Deepak Pattanayak
Office Bearers
Price Rs. 500/-

Trans.PMAI., is being upgraded to the modern requirements and with a new cover design. This has resulted in some delay in uploading Trans. PMAI. Vol. 44(1) & Vol.44(2) 2018 in this section of the Web.
The current issue Vol.44(2) is starting with a paper on Improved thermal stability of high energy ball milled nanocrystallineCu-Al alloy, dealing with milling under cryogenic condition. The superior thermal stability of the alloy is attributed
to Hall- Petch strengthening by grain boundary pinning by nanoscale intermetallic particles. Lithium Zirconate is a potential candidate for solid blanket material, for tritium breading in Fusion Nuclear Reactor. Single phase nanocrystallineLi2ZrO3 powder has been synthesized through facile solution combustion route using glycine as fuel and corresponding nitrates as oxidants. The crystalline size and morphology of Li2ZrO3 powder can be controlled by adjusting the various fuel to oxidizer ratios is the subject matter of this paper. To study the dimensional change of a part, microstructural& dilatometric studies have been carried out on sinter-hard enable PM steel containing pre alloyed manganese, nickel, molybdenum and mixed copper & graphite. The lot to lot dimensional variations can be minimized by giving more time to diffuse carbon completely before the copper melting. Next paper is on the effect of cobalt in the microstructure and tensile properties of tungsten heavy alloys. Alloys containing W-Ni-Fe and W-Ni-Fe- Co with 92% tungsten have been processed by liquid phase sintering followed by vacuum heat treatment. This is followed by a paper on Copper- tungsten- nanographene materials, fabricated by sintering in argon. Microstructure, electrical conductivity and microhardness were evaluated along with the discussion of the results.
Next paper is on the sintering characteristics and electrical conductivity of yttria stabilized zirconia containing 10-30% yttria, synthesized by co-precipitation route. Ionic conductivity of Ceramics containing 20 and more % of yttria were significantly lower than those containing lower concentration of yttria. ZrB2-SiC composite powders were prepared by two different approaches and vacuum hotpressed to produce composites. Thermophysical properties of these composites have been evaluated along with microstructural investigations. The final paper is on the high kinetic processing by simoloyer, highlighting the advantages and efficiency of the high relative velocity combined with the effect of collision of grinding media and the energy transfer to the powder materials as well as the related process engineering. Some examples and applications are also provided.
P. Ramakrishnan
EditorialChief EditorProf. Ramakrishnan P.
Editorial Advisory Board Dr. Ashok S.Mr. Chandrachud N.L.Dr. Rama Mohan T. R.
Editorial BoardDr. Appa Rao G. Dr. Bhargava ParagDr. Dabhade VikramDr. Deep PrakashDr. Dhokey N.B.Dr. Kumar Y.V.S.Dr. Malobika KaranjaiDr. Murli Gopal K.Dr. Panigrahi B.B.Dr. Sastry I.S.R.Dr. Tarasankar Mahata
Published by :Powder Metallurgy Association of India (PMAI)1002, B-Wing, Kingston, High Street, Hiranandani Complex,Powai, Mumbai - 4000076.Tel. : +9122 25704588E-mail : [email protected] the Powder Metallurgy Association of India nor the editor assumes responsibility of opinions expressed by the authors of the papers published in this transaction.

TRANSACTIONS OFPOWDER METALLURGY ASSOCIATION OF INDIA
Vol. 44 No.2, December 2018
CONTENTS
1 EffectofCobaltontheMicrostructureandTensilePropertiesofTungstenHeavyAlloys 1-7 Prakash Tiwari1, Ashutosh Panchal2, G.Prabhu2, P. Ghosal2, and A. Khanra1
1NIT, Warangal, 2 Defence Metallurgical Research Laboratory, Hyderabad
2 HighKineticProcessingbySimoloyer® 8-13 H.-U. Benz1, B. Funk1, H. Zoz1,2,3
1Zoz GmbH, D-57482 Wenden, Germany 2CIITEC-IPN, Instituto Politecnico Nacional, Mexico City, C.P. 02250 México, D.F 3Ritsumeikan University, Kusatsu, Shiga 525-8577, Japan
3 SinteringandPropertyEvaluationofTungstenandGrapheneAddedCopper 14-22 BasedComposites Sri Ram Vikas K1, Ch. Vidya1, Ch. Kishore Reddy1, P. Gopalakrishnaiah1, V.M. Kishan.Ivatury2,Venkata Ramana VSN3 1Department of Mechanical Engineering, Prasad V. Potluri Siddhartha Institute of Technology, Vijayawada, Andhra Pradesh, India. 2Department of IndustrialEngineering, Institute of Technology,Ambo University, Ethiopia. 3Department of Mechanical Engineering, GITAM DeemedUniversity, Visakhapatnam, Andhra Pradesh,India.
4 ImprovedThermalStabilityofHighEnergyBallMilledNanocrystallineCu-AlAlloy 23-28 Vaibhav Mishra, Koushik Sikdar, Debdas Roy Materials and Metallurgical Engineering Department, NIFFT, Hatia, Ranchi, India.
5 ADetailedStudyoftheMicrostructureandDimensionalChangeofPre-alloyed 29-35 SinterhardenablePMSteelUsingDilatometricTechniques Saba Mousavinasab1, Vincent Paris 1, Vladimir Paserin1, Prakash Khole 2 1 Rio Tinto Metal Powders, Tracy, Quebec, Canada. 2Rio Tinto India Pvt. Ltd, India.
6 PreparationofZrB2-SiCCompositeanditsMicrostructuralStudy 36-41 JyoJyothi Sharma*, Abhijeet Kalaskar, P.K Patro, T Mahata, Deep Prakash and P.K. Sinha Powder Metallurgy Division, Bhabha Atomic Research Centre, Vashi Complex, Navi Mumbai – 400703

7 AStudyonSinteringCharacteristicsandElectricalConductivityofYttriaStabilized 42-50 ZirconiaCeramicsSynthesizedbyCo-PrecipitationRoute Kaustubh Kambale*1, Umesh Kedar1, Amruta Vairagade1, Sandeep Butee1 1 Department of Metallurgy and Materials Science, College of Engineering Pune (An Autonomous Institute of Government of Maharashtra), Wellesley Road, Shivaji Nagar, Pune - 411005
8 CombustionSynthesisofNanocrystallineLithiumZirconate 51-55 Biranchi Tripathi 1,3, Deep Prakash 1,3, Avesh Kumar Tyagi 2,3, Pankaj Kumar Sinha 1
1 Powder Metallurgy Division, Bhabha Atomic Research Centre, Vashi Complex, Navi Mumbai, INDIA. 2 Chemistry Division, Bhabha Atomic Research Centre,Trombay, Mumbai-400085, INDIA. 3 Homi Bhabha National Institute, Anushaktinagar, Mumbai-400094, INDIA.

TRANSACTIONS OF PMAI, VOL. 44 (2), DECEMBER 2018 1
EffEct of cobalt on thE microstructurE and tEnsilE propErtiEs of tungstEn hEavy alloys
prakash tiwari1, ashutosh panchal2, g.prabhu2, p. ghosal2, and a. Khanra1
1NIT, Warangal,2 Defence Metallurgical Research Laboratory, Hyderabad
1. introduction
Tungsten heavy alloys are considered as two phase composites wherein nearly-spherical tungsten particles are interspersed in a ductile matrix phase that is made of low melting elements such as nickel, iron, copper and cobalt [1]. Tungsten heavy alloys are preferred materials for the application in kinetic energy penetrators since these alloys possess a combination of high density (16-18 g/cm3), high strength (1000-1700 MPa) and high ductility (10-30%) along with excellent machinability [1]. As the quality of the armor that protects the battle tanks has taken a quantum leap in recent times, there has been a great demand for tungsten heavy alloy penetrators with enhanced ballistic performance, in order to defeat such armor systems. Improved ballistic performance demands superior mechanical properties in the heavy alloy penetrators in order to withstand the stresses developed during the launch [2]. To improve the mechanical properties of tungsten heavy alloys, several investigations have strongly
Abstract - W-Ni-Fe and W-Ni-Fe-Co alloys with 92 wt. % tungsten were prepared by liquid phase sintering with subsequent vacuum heat treatment. To understand the effects of cobalt addition on the microstructure, quantitative estimation of microstructural parameters such as tungsten particle size, contiguity of tungsten grains and volume fraction of the matrix phase was carried out for both the alloys. Cobalt containing W-Ni-Fe-Co alloy showed finer tungsten particle size, higher matrix volume fraction and lower contiguity compared to W-Ni-Fe alloy.
In terms of the tensile properties, the presence of cobalt in W-Ni-Fe-Co alloy resulted in substantial improvement in both tensile strength and elongation to failure compared to W-Ni-Fe alloy. This substantial improvement could be attributed to several reasons such as solid solution strengthening of the matrix phase, increase in the volume fraction of the matrix, decrease in contiguity of tungsten grains and enhancement of tungsten-matrix interfacial strength. The present study is thus focused on the comparison of microstructure and mechanical properties of both W-Ni-Fe-Co and W-Ni-Fe alloys and brings out a correlation between the microstructural features and the mechanical properties.
Keywords: tungsten heavy alloy, cobalt addition, tungsten grain size, contiguity.
emphasized that microstructural factors such as tungsten particle size, matrix volume fraction, tungsten-tungsten contiguity and tungsten-matrix interfacial strength are controlled [3-5].
Various methods attempted to control the microstructure and thereby improve the mechanical properties of heavy alloys, include alloying additions like Co, Re, Cr and Mo, cyclic heat treatments to decrease contiguity, short sintering cycles to reduce grain growth and rare earth additions to refine grain size [6-8]. Among all these methods, the addition of cobalt gained significant importance because of its role in solid solution strengthening of the matrix (Ni-Fe-Co or Ni-Co). It has also been reported that cobalt addition results in an increase in the matrix volume fraction, decrease in contiguity of tungsten grains and enhancement of tungsten-matrix interfacial strength [9]. Addition of cobalt to a W-Ni-Fe alloy is a well-established approach used for enhancing both strength and ductility [10]. Penrice et al. [10] have compared W-Ni-Fe

TRANSACTIONS OF PMAI, VOL. 44 (2), DECEMBER 20182
EffEct of cobalt on thE microstructurE and tEnsilE propErtiEs of tungstEn hEavy alloys
and W-Ni-Fe-Co alloys and reported that the alloy with cobalt addition has superior tensile properties (as shown in Fig.1) compared to the alloy without cobalt content [10]. Significant improvement in impact toughness of W-Ni-Fe-Co alloys with 2 wt% cobalt content has also been reported by Spencer et al.[11]. Cury et al. [12] have reported that cobalt additions up to 3 wt% are fully soluble in the matrix and the presence of cobalt increases the solubility of tungsten in the matrix thereby enhancing the solid solution strengthening of the matrix phase.
Fig.1.Comparison of tensile properties between W-Ni-Fe and W-Ni-Fe-Co alloys as reported in literature
[10].
Table 1: Characteristics of the elemental powders used in the present study.
Table 2: Chemical composition of tungsten heavy alloys selected for the present study.
The present investigation is carried out to study the effect of cobalt addition in heavy alloys with 92 wt% tungsten content. A detailed comparison of microstructure and mechanical properties is carried out and a rationale for improvement in mechanical properties is provided in terms of microstructural features. The dependence of tensile properties on the microstructural parameters is in agreement with the reported investigations.
2. Experimental work
Commercially available elemental tungsten, nickel, iron and cobalt powders, with their purity and average particle size listed in Table 1, were used to process both W-Ni-Fe-Co and W-Ni-Fe
alloys. Chemical composition of both W-Ni-Fe-Co and W-Ni-Fe alloys used in the present study are given in Table 2. Mixing of elemental powders was carried out in a ball mill for a duration of 48 hrs using stainless steel balls as the mixing medium and ball to powder ration (BPR) of 1:1. The powder mix was then reduced at 700˚C in hydrogen atmosphere for 75 min and subsequently cold isostatically pressed (Make: National Forge, Belgium) at 200 MPa pressure with holding time of 20 minutes, to obtain cylindrical rods of 55 mm diameter and 350 mm length. The green compacts were subjected to pre-sintering at 1300°C for 120 min followed by liquid phase sintering in a hydrogen sintering furnace (Make: FHD Furnace, England) at 1485° C for 75 min. Sintered tungsten heavy alloy blanks were then subjected to a vacuum heat treatment at 1150°C for 4 hrs (with a vacuum level of min. 10-4 mbar) followed by oil quench.
Powder W Ni Fe Co
Purity, wt. % 99.9 99.6 99.6 99.6
Average particle size, µm 8 6 5 4
Major impurities, (wt. %)
C 0.01 <0.5 <0.05 <0.02
O <0.1 <0.05 <0.1 <0.05
P <0.002 <0.004 <0.002 <0.006
Alloys W Ni Fe Co Ni/Fe ratio W-Ni-Fe-Co 92 4.71 0.79 2.5 5.96
W-Ni-Fe 92 6.4 1.6 0 4
Microstructural characterization and evaluation of mechanical properties were carried out after vacuum heat treatment. Samples for microstructural evaluation were prepared by standard metallographic procedures involving cutting, mounting, grinding and polishing. Microstructural features of both the alloys were studied using scanning electron microscope (Make: FEI Quanta 400 ESEM). Microstructural characterization included determination of grain

TRANSACTIONS OF PMAI, VOL. 44 (2), DECEMBER 2018 3
EffEct of cobalt on thE microstructurE and tEnsilE propErtiEs of tungstEn hEavy alloys
Fig.2. Drawing of the tensile specimen used in the present study
Fig.3. SEM images of (a) W-Ni-Fe-Co and (b)W-Ni-Fe alloys in heat treated condition
Table 4: Microstructural parameters of W-Ni-Fe-Co and W-Ni-Fe alloys in the heat treated condition.
Table 3: Chemical composition of the tungsten grain and the matrix phase as determined using EPMA.
size, contiguity and matrix volume fraction. Grain size and matrix volume fraction measurements were made using Image analysis (Make: Image J). Contiguity was calculated using the formula
[2NWW / (2NWW + NWM)]…………………(1)
wherein NWW is the number of tungsten-tungsten contacts and NWM is the number of tungsten-matrix contacts. NWW and NWM were determined using the line intercept method wherein grid lines were drawn on the microstructural image and the number of contact points was counted. 100 measurements were made using the line intercept method to determine contiguity. Elemental mapping was carried out using Electron Probe Micro Analysis (EPMA) (Make: SX-100, Cameca, France) to determine the weight percent of tungsten dissolved in the matrix.
Tensile specimens (Fig.2) were prepared as per ASTM standard E8M-04 [13] and tested at room temperature using universal tensile testing machine (Make: Instron 5500R, UK). Three specimens for each treatment cycle were tested at a cross head speed of 1 mm/min which results in a strain rate of 6.6 x 10⁻⁴ s-1. Fractography of the failed tensile pieces was carried out using scanning electron microscope (Make: FEI, Quanta-400, Netherlands).
3. results and discussion
Microstructures of W-Ni-Fe-Co and W-Ni-Fe alloys are shown in Fig.3a and 3b respectively. While the tungsten grains appear bright, the matrix phase is relatively darker. Rounded as well as angular tungsten grains which are typical of liquid phase sintered heavy alloys are observed in Fig.3a and 3b. Final stage of liquid phase sintering which includes grain coarsening
(a) (b)
and grain shape accommodation explains the presence of angular shaped grains and also round tungsten grains (30-40mm), which are significantly coarser than the initial powder particles of 5-8mm.
Average grain size of tungsten grains obtained after vacuum heat treatment is listed in Table 4. The size of tungsten grains depends on the time-temperature window employed during sintering and hence significant changes are not expected after heat treatment, which is carried out at a substantially lower temperature of 1150˚C compared to the sintering temperature of 1485˚C.
Alloys Matrix phase Tungsten grain
Ni (wt%) Fe (wt%) Co (wt%) W (wt%) W (wt%)
W-Ni-Fe-Co 39.7
6.4
21.6
34.3
99.99
W-Ni-Fe 60.6 14.6 - 25.9 100
Alloys Grain size (µm)
Matrix Vol. Fraction (%)
Contiguity Dissolved W in matrix phase(wt. %)
W-Ni-Fe-Co 32.9±10 19.7 0.31 34.28
W-Ni-Fe 35.11±12 17.5 0.33 25.86
Tungsten grain size, as listed in Table 4, is not significantly different between W-Ni-Fe-Co and W-Ni-Fe alloys. This observation is contrary

TRANSACTIONS OF PMAI, VOL. 44 (2), DECEMBER 20184
EffEct of cobalt on thE microstructurE and tEnsilE propErtiEs of tungstEn hEavy alloys
to what is expected from two alloys that have different amount of dissolved tungsten. German and Bose[14] have reported that higher amount of dissolved tungsten in the liquid phase leads to accelerated diffusion resulting in rapid coarsening of the tungsten grains. In the present study, as listed in Table 3, W-Ni-Fe-Co alloy has higher amount of dissolved tungsten compared to W-Ni-Fe alloy but both the alloys exhibit similar tungsten grain size.
Other key microstructural features such as matrix volume fraction and contiguity are also listed in Table 4. Matrix volume fraction is higher in W-Ni-Fe-Co alloy compared to W-Ni-Fe alloy and this can be attributed to the higher solid solubility of W in the matrix phase of W-Ni-Fe-Co alloy. Cobalt addition in tungsten heavy alloy has been reported to increase the solid solubility of tungsten in the matrix phase. Ravi Kiran et al. [15] and Prabhu et al. [16] have reported the effect of cobalt addition on the solubility of tungsten in the matrix phase of heavy alloys that contain 90 wt. % W. The amount of dissolved tungsten content reported varies between 21 and 22 wt. %. However, in the present study, the alloys investigated have relatively higher bulk tungsten (91.8 wt% as against 90 wt %), higher Ni/Fe ratio and hence the amount of dissolved tungsten (as listed in Table 3) is significantly higher. Solubility of tungsten increases with increasing Ni/Fe ratio and as per the W-Ni binary phase diagram, the maximum solubility of tungsten in nickel alone is 40 wt.% [17].
Contiguity, as reported by German [18], is the quantitative measurement of inter-phase contact. In the case of tungsten heavy alloys, the number fraction of contact points between tungsten-tungsten grains are measured and defined as contiguity. In the present study, W-Ni-Fe-Co alloy has marginally lower contiguity compared to W-Ni-Fe alloy (Table 4). With higher solid solubility in the liquid, the dihedral angle between the grains decreases resulting in enhanced matrix penetration between the grains (or less contiguous grains). As discussed earlier, W in W-Ni-Fe-Co alloy has higher solid solubility in the liquid and hence the lower contiguity can be ascribed to the relatively higher dissolution of tungsten in the matrix compared to W-Ni-Fe alloy. In addition, it has also been reported [18] that contiguity decreases as the matrix volume fraction increases and this trend is observed in the present case with W-Ni-Fe-Co alloy exhibiting higher matrix volume fraction and hence lower contiguity compared to W-Ni-Fe alloy.
Engineering stress-strain and true stress-strain curves of both the alloys are shown in Fig.5 and 6. Tensile properties of both W-Ni-Fe-Co and W-Ni-Fe alloys are listed in Table 5. W-Ni-Fe-Co alloy has higher yield strength, ultimate tensile strength and % elongation to failure.
Fig.4. Tungsten-Nickel binary phase diagram[17]Fig.5. Engineering stress-strain curve of W-Ni-Fe-Co
(T1)and W-Ni-Fe (T5)alloys

TRANSACTIONS OF PMAI, VOL. 44 (2), DECEMBER 2018 5
EffEct of cobalt on thE microstructurE and tEnsilE propErtiEs of tungstEn hEavy alloys
Fig.6. True stress-strain curve of W-Ni-Fe-Co (T1)and W-Ni-Fe (T5)alloys
Table 5: Tensile properties of W-Ni-Fe-Co and W-Ni-Fe alloys in the heat treated condition.
Fig.7. Fractographs of failed tensile specimens of(a) W-Ni-Fe-Co and (b)W-Ni-Fe alloys
Fig.8. Relative percentage of tensile fracture surfaces inW-Ni-Fe-Co (T1) and W-Ni-Fe (T5)alloys Fractographs of failed tensile specimens of both
the alloys are shown in Fig.7a and 7b. The failure is predominantly, intergranular and the features of intergranular failure such as (i) tungsten-tungsten debonding, (ii) tungsten-matrix decohesion and instances of isolated matrix rupture are observed in the fractographs of both the alloys.Tungsten-tungsten debonding and tungsten-matrix decohesion leave the tungsten grains intact, which is also clearly evident in the tensile fractographs. Quantitative analysis of the fractographs, as plotted in Fig.8, shows that in the case of both the alloys, about 55% of the failure features represent tungsten-tungsten debonding and 20% represent tungsten-matrix decohesion. On contrary, features of transgranular failure such as tungsten cleavage and matrix rupture are considerably less; about 10 and 15% respectively. Thus, it is observed that heat treated alloys fail predominantly by intergranular mode, an observation which is consistent with the work of Anjali et al.[19].
Alloys 0.2% YS (MPa)
UTS (MPa)
%. Elongation
W-Ni-Fe-Co 652 968 20.1
W-Ni-Fe 638 914 14.9
Though the fractographic features do not bring out obvious differences in both the alloys, the effect of cobalt in enhancing the tensile properties is clearly brought in the present work. This observation is consistent with the earlier investigations reported by several researchers [2-4]. While the microstructure (Fig.3a and 3b) appears to provide a rationale for this trend as the volume fraction of the softer matrix is higher and tungsten-tungsten contiguity is lower in W-Ni-Fe-Co alloy, these features are not manifested in the fractograph (Fig.7a and 7b) in terms of relative fraction of matrix rupture and tungsten-tungsten decohesion. Therefore an alternative explanation is provided in this work. Microprobe results, as listed in Table 3, show that dissolved tungsten is higher in the matrix phase of the W-Ni-Fe-Co alloy. This leads to solid solution strengthening of the matrix and hence W-Ni-Fe-Co alloy shows higher yield strength. The assumption that softer

TRANSACTIONS OF PMAI, VOL. 44 (2), DECEMBER 20186
EffEct of cobalt on thE microstructurE and tEnsilE propErtiEs of tungstEn hEavy alloys
matrix phase will deform first during tensile test is implicit here. A stronger matrix will imply lesser mismatch between the plastic strain of the matrix and tungsten phase as the two phase aggregate undergoes deformation. This will result in mitigating the stress concentration at the interface thereby delaying failure and improving ductility. Thus higher ductility of the W-Ni-Fe-Co alloy can be attributed to the stronger matrix.
Two different deformation regimes are seen in the strain hardening plots shown in Fig.9. The lower slope may correspond to the deformation of the softer matrix phase. At higher plastic strain, there may be load transfer to tungsten particles. As the two phase aggregate deforms, the rate of work hardening increases because of geometrical constraints that impede free glide of dislocations. This observation is consistent with the work of Anjali et al.[19] and Das et al. [20]. Das et al. [20] have shown by slip line analysis that initial deformation is confined to the matrix phase and in the later stages, there are ample instances of slip transfer from matrix to tungsten phase.
Fig.9.Log-log plot of true stress v/s true plastic strain of W-Ni-Fe-Co (T1) and W-Ni-Fe (T5) alloys
Table 6:Work hardening exponent (n) calculated from tensile stress-strain curves
A comparison between the work hardening coefficients of different heavy alloy is shown in Table 6. The work hardening coefficients obtained in the present study are similar to those reported in literature (Table 6). However, more
detailed analysis involving transmission electron microscopy needs to be carried out to understand this behavior.
4. conclusions
Effect of cobalt on microstructure and mechanical properties of tungsten heavy alloys containing 92 wt% W has been studied. The salient observations of the present study are as follows;1. W-Ni-Fe-Co alloy shows higher matrix
volume fraction and lower contiguity as compared to W-Ni-Fe alloy. However, the tungsten grain size in both the alloys does not show a significant variation.
2. The tensile properties of the cobalt containing alloy evaluated in the heat treated condition are found to be superior to those of the W-Ni-Fe alloy.
3. The fractographic features of the failed tensile specimens are predominantly intergranular for both the alloys showing no discernible trend with alloying addition.
4. Two different deformation regimes are observed in the work hardening plots of both the alloys and the work hardening coefficients are similar to those reported in literature.
5. acknowledgementsThe authors would like to thank Defence Research and Development Organization for sponsoring the activity through a research project. Authors
Alloys Processing conditions Work hardening
exponent, n
References
92W- 4.71 Ni- 0.79Fe-2.5Co
Heat treated 0.014, 0.178 Present study
92W- 6.4 Ni-1.6Fe Heat Treated 0.042, 0.118 90.5W-7.1Ni-1.65Fe-
0.50Co-0.25Mo Heat treated 0.052, 0.203 Jiten et al.
[16] 20% swaged and annealed (20SWAHT)
0.028, 0.109
40% swaged and annealed (40SWAHT)
0.036, 0.141
10% Swaged (10SWA) 0.017 20% Swaged (20SWA) 0.018 40% Swaged (40SWA) 0.011, 0.031
89.6W-6.2Ni-1.8Fe-2.8Co HT at 1100oC/Argon quenched 0.01, 0.09 Anjali et al. [13] HT at 1200 oC/Argon quenched 0.01, 0.10
HT at 1250 oC/Argon quenched 0.04, 0.12 HT at 1100oC/Water quenched 0.03, 0.22 HT at 1200oC/ Water quenched 0.03, 0.20 HT at 1250oC/ Water quenched 0.02, 0.21

TRANSACTIONS OF PMAI, VOL. 44 (2), DECEMBER 2018 7
EffEct of cobalt on thE microstructurE and tEnsilE propErtiEs of tungstEn hEavy alloys
are thankful to the Director, DMRL for his encouragement and valuable guidance. Thanks are also due to all the technical staff of DMRL, in particular those from Powder Metallurgy Group for their valuable technical support.
6. references1. Y. Sahin, Journal of Powder Technology, Vol. 2014
(2014), 22. 2. W. Lanz, W. Odermatt and G. Weihrauch, 9th
International Symposium of Ballistics, 2001, 1191-1197.
3. D.K. Kim et.al, Met.and Mat. Trans. A, Vol 31A (2000) 2475-89
4. X. Gong et.al, Mat. Sci. and Engg.A, 527 (2010) 7565–7570
5. H.S. Song et.al, Met.and Mat. Trans. A, Vol 28A (1997) 485-89
6. Kim, Hong, Baek and Moon, Metall. Trans. A 30(1999) 627-633.
7. T.Kaneko, Powder and Powder Met., J.Japan Soc., 38 (1991) 864-871
8. Hee-Dong Park, Woon-Hyung Balk, Suk-Joong L. Kang and Duk-Yong Yoon, Metall.Trans. A 27(1996), 3120-3127.
9. James A. Mullendore and Susan M. Pegher, US Patent No.5064462,1991,1-3.
10. Thomas W. Penrice and James Bost, US Patent No.4762559,1988,1-13
11. Spencer and Mullendore,US Patent No.245649,1991,1-223.
12. R. Cury, F. Issartel, J.M. Joubert & H.Couque, Journal of Powder Metallurgy, Vol.56(2013).
13. ASTM E8-04, Test method for Tension Testing of Metallic Materials (2004).
14. R. M. German, A. Bose, Materials Science and Engineering A, vol. 107(1989) 107-116.
15. U.Ravi Kiran, S.Venkat, B.Rishikesh , V.K.Iyer , M.Sankaranarayana, T.K.Nandy, Materials Science & Engineering A582 (2013) 389-396.
16. G. Prabhu, N. Arvind Kumar, M. Sankaranarayana, T.K. Nandy, Materials Science & Engineering A 607 (2014) 63-70.
17. Ni-W phase diagram, J. of phase equilibria, 12(6), (1991).
18. R. M. German, Metall.Trans.A.16A (1985) 1247-1252
19. Anjali Kumari, , G. Prabhu, M. Sankaranarayana, T.K. Nandy, Materials Science & Engineering A, (Accepted, 2017)
20. Jiten Das, G. Appa Rao, S.K. Pabi, M. Sankaranarayana, T.K. Nandy, Materials Science & Engineering A 613 (2014) 48–59.

TRANSACTIONS OF PMAI, VOL. 44 (2), DECEMBER 20188
high KinEtic procEssing by simoloyEr®
h.-u. benz1, b. funk1, h. Zoz1,2,3
1Zoz GmbH, D-57482 Wenden, Germany2CIITEC-IPN, Instituto Politecnico Nacional, Mexico City, C.P. 02250 México, D.F
3Ritsumeikan University, Kusatsu, Shiga 525-8577, Japan
1 introduction
Grinding techniques are as old as humanity itself. The Stone Age men used stones to grind bones and berries, later mortars and pistils have been applied for mixing, refinement and particle size reduction. Water mills and mule driven mills have been the first “automated” grinding devices. The first mechanical mill has been developed by Oliver Evans in the 18th century. Nowadays there are electrical driven mills with different techniques still used for mixing, refinement and particle size reduction. But there are more applications which are of great interest like the Mechanical Alloying (MA), the High Energy Milling (HEM) and the Reactive Milling (RM) which are all modes of High Kinetic Processing (HKP).
2 principle of the simoloyer®
Simoloyer® is a tool for HKP of a wide range of various powder materials, compounds and mixtures for a large variety of applications. Its efficiency is based on supply of a high share of
energy for transferring energy from the driving power to the grinding-media, the principle of collision and the horizontal arrangement (low gravity effect). It is used in industrial scale as well as for laboratory purposes and provides the possibility for up-scaling in industrial R&D-applications.Even if the Simoloyer® can perform in wet-milling conditions in some cases, its highest efficiency is achieved mainly in dry milling, where – depending on the application - undesirable effects of liquids like damping, lubricating or aquaplaning, are excluded.In applications of MA, RM, activation or generation of nano-structures the principle of HKP enables quite new options in materials development or powder processing routes and also processing times might be reduced for renewing economical or technical views. Very fast processes even allow a continuous production route. The Simoloyer® has been developed in the late 1990s as a tool for MA, later it has been
Abstract - New and improved products in fields of additive manufacturing, construction, chemistry and affiliated areas require novel materials and compounds which can be applied in currently present, enhanced or innovative technologies. Therefore powder technology can be a suitable method in development and improvement of high performance alloys, chemicals and pharmaceuticals, pigments and compounds or nano-structures.
Here the Simoloyer®-Technology shall be described as a versatile tool for High Kinetic Processing (HKP) which includes principles of Mechanical Alloying (MA), Reactive Milling (RM) and High Energy Milling (HEM) in lab and industrial applications. The advantages and efficiency of the high Maximum Relative Velocity (MRV) combined with the effect of collision of grinding-media and the energy transfer to the powder materials as well as the related Mechanical Process Engineering will be highlighted in some examples and applications.
Keywords – Simoloyer®, High Kinetic Processing, Mechanical Alloying, Reactive Milling, High Energy Milling, up-scaling, powder metallurgy, powder technology, nano-structures

TRANSACTIONS OF PMAI, VOL. 44 (2), DECEMBER 2018 9
high KinEtic procEssing by simoloyEr®
applied for HEM and RM as well. Its technology distinguishes from other mills due to its horizontally rotary born system. For the high kinetic processing techniques a various number of milling devices have been applied during the last years. The well-known planetary ball mill, the shaker mill or the vertical Attritor™ are based on mainly vertical and / or gravimetric supported systems and are often used devices to produce e.g. mechanical alloyed powders for laboratory purposes. The horizontal assembly of the Simoloyer® leads to high kinetics because of the maximum relative velocity (MRV) of the free flying grinding media [1-3]. This has already be related and shown in the equation for the kinetic energy of a system (Eq. 1).
Taking these effects into account and the fact that the grinding media in the Simoloyer® reaches an MRV of 16 m/s, which is more than three times faster than other mills, it is clear that High Kinetic Processing (HKP) is a valuable tool for creation of novel materials, composites, chemicals and nanostructures and succeeds conventional milling techniques [4-7]. Accompanying these points the Simoloyer® is easily up-scalable from laboratory scale to technical and industrial scale without loss of efficiency or energy. Tab. 1 shows the main advantages of the Simoloyer® technology.
Another point related to the high energy is the succession of thermodynamic barriers. There are structures and compounds which cannot be formed by conventional techniques due to their high activation energy level. Application of HKP supports overcoming these barriers and leads to new structures. This effect is specially shown by the creation of new alloys or by the possibility of performing chemical reaction at solid-state without application of solvents e.g. [8].
3 overall target - powder materials and its application
The overall target is the generation and production of powder material, either new, or already existing with the ability of creating new or extended properties or only theoretical considerations.
Mechanical Alloying is well known since decades, but it is should be explained here again, since some effects are valid for other applications as well (e. g. RM, nano-structures, activation). It is described by the principle of “deformation-fracture-welding” of powder particles.
Within every milling system kinetic energy is transferred into the powder material. The amount of transferred energy depends on two phenomena, the kind of stress of the grinding media on the powder and the velocity of the balls. Looking at the mode of stress which can be induced on the powder there are two main events: shear and friction on the one hand and collision on the other hand. Both effects are also depending on the velocity of the grinding media as shear and friction appears at low kinetics and collision mostly at high kinetics, like in the Simoloyer® (Fig. 1).
Eq. 1
Fig. 1: Rollermill RM1 with transparent vessel RBG02 (left), Simoloyer® CM01 with transparent vessel W01-2lm (right), different velocities and systems resulting
in different modes of stress
Tab. 1: comparison of different milling devices focused on MRV and volume of processing chamber
Ekin=1
2mv2
Simoloyer
®
Shakermill (Spex)
Planetary Ball Mill
Attritor™ Drum(ball)mill
max. diameter [m] 1.1 0.08 0.2 1 3 max. total volume [l] 900 0.2 8 1,000 20,000 max. rel. velocity [m/s]
16
4-5 (4.2) 5
4.5-5.1 < 5 spezific energy [kW/l] 1.1 (-3) - - 0.1 (-0.75) 0.01 – 0.03
Graphic

TRANSACTIONS OF PMAI, VOL. 44 (2), DECEMBER 201810
high KinEtic procEssing by simoloyEr®
Tab.2: High Kinetic Processing, applications and products of Mechanical Alloying, High Energy Milling
and Reactive Milling
Macroscopic it is like a blacksmith producing a Damascene blade by using a hammer, which is nothing else than collision, which means pressure stress on the material. This is very similar to the micro-/nanoscopic view on collision of grinding-media to powder particles, collision causes deforming, breaking and rewelding of particles. Having a look on the nano-scale (powder-particle and its grains) some more driving-forces as thermodynamic, physical or mechanical processes are to be considered (diffusion, inner energy, activation energy, potential differences etc.). So new phases, alloys or materials can be formed, which are not yet existing or not possible to be obtained by conventional processing routes (e. g. in liquid phase).
Activation of materials is based mainly on thermodynamic processes (increase of inner energy of the material), even if it is often accompanied by mechanical influences like particle reduction or agglomeration because of side-effects of the surface energy.
RM and mechanochemistry are topic in current research because solid-state synthesis by mechanochemistry is a clean and short process at nearly quantitative yield. The collision of the grinding media with the powder forces the formation of new compounds and products due to the energy transferred into the raw materials either by thermodynamic effects or by diffusion processes. Combination of the RM with tribochemical material creates local plasma on the surface of materials which induces the reaction of compounds or their decomposition, e.g. within dioxins [9]. The effects of flintstones are based on a similar phenomenon, a solid-solid-gas reaction by collisional forces.
All of the three modes of HKP can be distinguished by their effects on the powder material during the process (Tab. 2).
4 properties & features of the simoloyer® technology
Development of novel materials needs also Mechanical Process Engineering. There are certain demands on the process which have to be considered. At the first stage processes are tested and optimised at laboratory scale from 0.5 litres to 2 litres in a Simoloyer® CM01 (Fig. 3).
Here the main criterion is a successful process where small quantities of products can be obtained. This can be achieved by mainly controlled conditions depending on process temperature, cooling, atmosphere and pressure. These conditions can be monitored by sensors adapted at the Simoloyer® device and manipulated by valves, cooling blocks and processing techniques like cycle operation.
The level of contamination is of major importance. With respect to the fact that any kind of processing without impurities from the grinding media or tools is not possible, the contamination must be acceptable either by quality or by quantity. Since
High Energy Milling
Mechanical Alloying
Reactive Milling
surface, shape, particle size (geometry)
alloy (pseudo) + chemical reaction
Flakes (Particle Deformed Powder)
Nanocrystalline Materials
Contact Material
Particle Coating (LPS, S)
Amorphous Materials
Nanocrystalline Materials
Nanocrystalline Materials
Oxide Dispersion Strengthened
Alloys
Mechanochemistry
Highly Dispersed Phased Materials
Iron and Oxide based Magnetic
Materials
Solid state synthesis
Soft Magnetics Bearing Materials containing Solid
Lubricants
Hydride-Dehydride
Particle size reduction
(e.g. enamel)
Ceramic Metal Composites (MMC, CMC, MMC, CCC)
Activation(Catalysts)

TRANSACTIONS OF PMAI, VOL. 44 (2), DECEMBER 2018 11
high KinEtic procEssing by simoloyEr®
the demands in pureness on powder materials products are often in a high level there are several types and modification of the milling tools for the Simoloyer® available. Not only metal based, but also ceramic or hard-metal based functional components are applied and might be adapted to the application (Fig. 2).
For preventing the powder materials and the environment for interactions with air, the system is designed for processing under controlled atmosphere, usually inert-gas, vacuum - system is vacuum tight - or combinations. Using the comprehensive range of accessories, powder materials can be charged and discharged under
Fig. 2: a) Ceramic lining of W01-2lm-Si3N4 (Simoloyer® CM01) and b) hard metal lining of
W08-8lm-THM (Simoloyer® CM08)
Fig. 3: Simoloyer® CM01 with air-lock valves and containers under inert conditions
controlled atmosphere as well. Even sampling is possible under such conditions (Fig. 3).
HKP is usually also related to increase of temperature inside the processing chamber. So the grinding-units are equipped with two or more cooling circuits, which also are able to be used for extended cooling to the sub-zero-temperatures as well heating-up the system if required.
Using the Maltoz® Simoloyer Operating Program the process control applied in constant but also often in discontinuous mode (cycle-operation) with recording process parameter and measurement data as possible. Connection of specific sensor-technology (online-measurement) is possible depending on its active principle.
5 mechanical process Engineering & simoloyer®
All described criteria have to be considered at the industrial scale as well but there are also other points which have to be taken into account. The process has to be reproducible and scalable in order to achieve a homogeneous product with constant high-level quality. From an economical point of view the process must be short and should be performed at low cost (Tab. 3).

TRANSACTIONS OF PMAI, VOL. 44 (2), DECEMBER 201812
high KinEtic procEssing by simoloyEr®
Fig. 4: Simoloyer® CM 20 at semi-continuous mode Fig. 5: MA/RM/HEM - Simoloyer® and related products
Tab. 3: Demands for a successful processing and an economical production
The entire processing route must be considered as well for industrial scale purposes, where integration of HKP in already available or new production lines is required and necessary. The Simoloyer®-Technology provides possibilities for getting the processed powder materials in requested handling condition. It might be arranged, that it is directly available at a subsequent processing step. Furthermore the extensibility to an automated batch-process (auto-batch) or the (semi-)continuous (Fig. 4) process allows an increased production output with reduced labour input and due to its low space-requirements.
6 application of the simoloyer® - examplesDue to requests from the market and actual R&D-achievements, ODS-alloys are on the upswing again. As a result a new generation of ODS, the NFA (nanostructured-ferritic alloys) has been developed as a typical but high advanced MA-application.The rapid progress in AM-technology (electrobeam melting (EBM), selective laser melting (SLM), laser-cladding et al.) requires new materials, which can be provided in parts by conventional and adapted powder processing routes. For special applications HKP and usually here MA can deliver new powder materials. Beside the requirements to pureness additionally a low the particle size of the materials is demanded. Recent achieved R&D activities show prospective results in Fe-, Ni-, Ti-based powder material alloys.As examples for HEM ductile metal flakes for coating purposes have been formed in a one step dry process, as well as ground granulated blastfurnace slag has been activated up to a reactivity level comparable to cements. There have been also successful attempts in manufacturing of carbon nanotube reinforced wood-polymer-composites, resulting in CarboWood®.Having a look on RM, food additives, chemical complex compounds and pharmaceuticals have already been synthesized and it could be shown that RM is a valuable tool for recycling of resources from EAF dust [10] and for decomposition of dioxins [9].
Demands for a successful processing
Additional demands for an economical production
high and homogeneous kinetic energy of ball impacts
reproducibility
homogeneous product
controlled atmosphereno dead zones
direct up-scaling
controlled temperature
charging and discharging under controlled condition
and automatically
good relation of operation and maintenance
acceptable contamination:quality and quantity
low costs (investment and operation)
safe process: protection of human, environment,
equipment and product

TRANSACTIONS OF PMAI, VOL. 44 (2), DECEMBER 2018 13
7 conclusion
Due to the often high demands on the powder materials, the demands on the powder processing tools are correspondingly high as well. The Simoloyer® provides advantages due to the principle of collision and its design as well.
Beside reducing or avoiding influences from undesirable environmental atmosphere the contamination of powder materials caused by tools of the system, mainly the rotor, the grinding-media and the vessel of the grinding-unit is usually in a surprisingly low level. Reason is the principle of collision, where only a low share of shear and friction occurs, which could be described as a kind of sand-paper grinding. Additionally the self-lubricating effect of the grinding-media and the often observed short processing times of the Simoloyer®-Technology contribute to a (very) low contamination level or contamination can be even avoided.
Furthermore the system is able to be equipped with suitable materials of the milling-tools as mentioned above.
Due to the feature of the quick-changeable grinding-unit, different materials may be processed using one base unit by keeping its designated grinding-vessel.
8 references[1] J. S. Benjamin, Metall. Trans., 1, 2943 1970[2] J. S. Benjamin, T. E. Volin, Metall. Trans. 5, 1929,
1974[3] H. Zoz, H.U. Benz, K. Hüttebräucker, L. Furken,
H. Ren, R. Reichardt, Stellite® bearings for liquid Zn-/Al-Systems with advanced chemical and physical properties by Mechanical Alloying and Standard-PM-Route, Part I, Metall 54(11), 650-659, 2000
[4] H. Zoz: Performance of the Simoloyer®, 4th International Conference on Powder Metallurgy in Aerospace, Defense and Demanding Applications, eds. P.S. Goodwin, R.B. Schwarz, in Anaheim, Los Angeles, USA, May 08-10, 1995
[5] H. Zoz, D. Ernst, R. Reichardt, High Energy Milling/ Mechanical Alloying / Reactive Milling,
high KinEtic procEssing by simoloyEr®
3rd International Symposium of the school of chemical engineering, University of Mexico City, May 1998
[6] R.M. Davis, B. McDermott, C.C. Koch, Mechanical Alloying of Brittle Materials, Metall. Trans. 19a, 2867 (1988)
[7] N. Burgio, A. Iasonna, M. Magini, S. Martelli, F. Padella, IL NUOVO CIMENTO, 13(4), 1991
[8] G. Kaupp, J. Schmeyers, M. R. Naimi-Jamal, H. Ren, H. Zoz, Reactive milling with the Simoloyer®: environmentally benign quantitative reactions without solvents and wastes, Chemical Engineering Science, 57(5), 2002, 763-765
[9] G. Kaupp, H. Zoz, Mechanical method for decontamination or detoxification of environmental poisons, e.g. poly-halogenated or organo-chlorine compounds, by use of high speed kinetic fragmentation using particles to provide impact and shear forces, German Patent DE10261204 A1, 2002
[10] H. Zoz, G. Kaupp, H. Ren, K. Goepel, M. R. Naimi-Jamal, Recycling of EAF dust by semi-continuous high kinetic process, Metall, 59(5), 2005, 200-203

TRANSACTIONS OF PMAI, VOL. 44 (2), DECEMBER 201814
sintEring and propErty Evaluation of tungstEn and graphEnE addEd coppEr basEd compositEs
sri ram vikas K1, ch. vidya1, ch. Kishore reddy1, p. gopalakrishnaiah1, v.m. Kishan.ivatury2,venkata ramana vsn3
1Department of Mechanical Engineering, Prasad V. Potluri Siddhartha Institute of Technology, Vijayawada, Andhra Pradesh, India.
2Department of IndustrialEngineering, Institute of Technology,Ambo University, Ethiopia.3Department of Mechanical Engineering, GITAM DeemedUniversity, Visakhapatnam, Andhra
Pradesh,India.
1. introduction:
Powder metallurgy(PM) plays a vital role in metalworking industry due its various advantages like reducing machining costs and producing complex geometries [1]. A wide variety of materials like ceramic and MMCs can be processed through PM route and detailed routes and properties of different advanced
Abstract - High hardness and high temperature melting of tungsten is best utilized in the manufacture of electrode materials where high erosion due to discharge in high current carrying conductors. Usually, copper is added in the range of 20-45 % by weight and prepared by powder metallurgy methods. Similarly, copper based electrical contacts are also prepared with varying amounts of graphite in the electrical industry. Materials for electrical discharge machines require compositions that do not compromise with electrical conductivity of the material, at the same time with improved mechanical properties. Recently, copper with 5 -15 wt.% tungsten composites have been made by powder metallurgy methods that showed promising results and were found to be candidate materials with good wear resistance after sintering and subsequent extrusion with reduced conductivity. The present work is aimed at improved conductivity by the addition of graphene in different amounts to the copper based composites with 5 wt.% tungsten by powder metallurgy methods and their characterization. Typically, copper powders (of 44 µm size, dendritic powders of 99.8% pure) were mixed with 5 wt.% tungsten powders (5 µm size, irregular powders of 99.8% pure) and varying amounts (0.5, 1.5 and 2.5 wt.%) Nano graphene plates (10-15 nm thickness, flakes of 98 % pure) in a planetary ball mill for 1 hour at a speed of 250 rpm. During milling, process control agents such as toluene and stearic acid also were used. After milling powders were dried and hand mixed and compacted in to cylindrical pellets of nearly 10 mm thick. The samples were sintered in argon atmosphere for one hour at 900oC with an intermediate dwell at 500oC for 30 minutes. Sintered densities in the range of 81-86% of theoretical were observed by Archimedes method. Highest density was observed (86% theoretical) for composites with 0.5 wt.% graphene. Micro hardness measurements were observed to be highest (89 VHN) for pure copper and around 60 VHN for all the composites with graphene. Electrical conductivity measurements were also reported and compared with high dense copper samples. All the observed results are correlated with microstructural features as evidenced by scanning electron microscopy.
Key words: Nano Graphene Plates, Powder Metallurgy, sintering, composites.
ceramics and MMCs were explained by Rosso [2]. In PM route pre-alloyed powders and different elemental powders can be used to produce wide variety of composites, which are generally blended. Moreover, high energy ballmilling contributes to produce powders of different materials like amorphous alloys, inter metallics, Nano crystalline materials apart from composites

TRANSACTIONS OF PMAI, VOL. 44 (2), DECEMBER 2018 15
sintEring and propErty Evaluation of tungstEn and graphEnE addEd coppEr basEd compositEs
and Nano powders [3]. Porosity is one of the important aspect in PM. Steels produced through PM route lose their stability and ultimately leads to minimized incubation time for transformation due to presence of porosity [4]. Homogeneous porosity is desirable rather than heterogeneous because the heterogeneity impacts negatively on mechanical properties of components produced through PM [4,5]. Although porosity exists in materials when it is processed by P/M technique, components can be made without pores also that have achieved by employing hot pressing of particulate powders for consolidation [6].Copper is widely used in many applications because of its excellent electrical and thermal conductivity. It possesses great corrosion resistance with exceptional good strength and fatigue resistance and it can be easily fabricated [7]. Many researchers worked on addition of ceramic particles to copper for better tribological properties. It is a well-known that adding ceramic particles results in decrease in thermal and electrical properties. Tungsten metal has high potential which can be used for enhancing the wear resistance of copper without significant loss of electrical and thermal conductivities. Apart from Cu-W there are different materials which are capable of similar applications namely Cu– Mo, Cu–Al2O3, Ag–Mo, Ag–W, Cu-SiC, Cu-TiC and Ag–CdO. These combinations were investigated by Y ZWan et. al. [8].Generally based on end application, different inoculants can beadded to the parent material. Wang [9] described the working behaviour of W-Cu alloy electrodes during electric discharge machining. P/M method is widely used for manufacturing Cu-W composites and moreover due to the high melting point of W, its solubility is very less, these aspects are very well explained by Mordike et. al. [10]. It is well known that electrical conductivity decreases with increase in strength of a material and cold working has minimal effect on electrical conductivity in certain copper alloys [11]. But in case of pure copper cold working lowers the electrical conductivity [12].S.C. Vettivel et. al. [13,14] investigated the Mechanical and tribological behaviour of Cu-
5%W and found significant improvement in density and load bearing capacity for lower aspect ratio preforms and decrease in steady state coefficient of friction with load inrage of 5-15N. Increase in W percentage leads to rise in electrical resistivity even though strength of the composite increases, hence the amount of W is restricted. From literature it is evident that 5wt.% of W addition has minimal effect in increasing the electrical resistivity, moreover porosity is also an important parameter for electrical conductivity which acts as insulating medium[15].Many researchers are now concentrating on graphene because of its two-dimensional structure of Sp2 bonding of carbon with excellent physical and mechanical properties[16,17]. Graphene has extraordinary characteristics like very high thermal conductivity, excellent electron mobility which made researchers working on development of new composites with graphene reinforcement in polymer and metals for superior mechanical, thermal and electrical properties [18-31]. Copper-graphene composites possess outstanding properties like excellent tensile and compressive strengths, high hardness and good electrical conductivity[32].
2. Experimental procedure:In the present work copper and tungsten were chosen as matrix materials. The average particle size, shape and purity of powders choosen given in the Table 1.Proper amounts of Cu, W, graphene were weighed by precision balance that has ±0.001g accuracy (IN101L, infra instruments Pvt. Ltd, Chennai, India). Fig.1 shows the Scanning electron micro graphs of as received a) copper powder b) tungsten powder c) graphene powder and schematic Process for producing Cu/W composites reinforced with GNPs through Powder Metallurgy Technique is shown in Fig.2.
Table 1: powder characteristics of as received powders
Elemental Powder Average Particle size Shape Purity
Copper 44 µm Dendritic 99.8
Tungsten 5µm Irregular 99.8
Graphene 10-15 nm thickness Flaky 98

TRANSACTIONS OF PMAI, VOL. 44 (2), DECEMBER 201816
sintEring and propErty Evaluation of tungstEn and graphEnE addEd coppEr basEd compositEs
In this investigation tungsten content was fixed at 5 wt.% whereas copper and Nano graphene plates amounts were varied and the details are indicated in Table 2. Mixing of these elemental powders was done in planetary ball mill at speed of 250rpm for 1hr. Process reagent toluene, stearic acid mixture was used for ball milling. Mixed powders were taken out and agitated for 30 minutes followed by 30 minutes drying Fig 3 and Fig 4 shows the scanning electron micro graph and EDS of ball milled powders. Dried powers were compacted by hydraulic press at 5 tonnes load for 30 seconds. The compacted samples
Fig.1: Scanning electron micro graphs of as received a) copper powder b) tungsten powder c) graphene
powder.
Table 2: Compositions of composites investigated in this study
Fig.3: Scanning electron micro graph of: a) 94.5 Cu 5W 0.5 GNP b) 93.5 Cu 5W 1.5 GNP c) 92.5 Cu 5W 2.5
GNP powder Ball milled at 250rpm for 1 hour.
Fig.4:EDS of ball milled powders: a) 94.5 Cu 5W 0.5 GNP powder Ball milled at 250rpm for 1-hour b) 93.5
Cu 5W 1.5 GNP powder Ball milled at 250rpm for 1-hour c) 92.5 Cu 5W 2.5 GNP powder Ball milled at
250rpm for 1-hour.
Fig.2: Schematic Process for producing Cu/W composites reinforced with GNPs through Powder
Metallurgy Technique.
were then sintered at 9000C for 60min followed by intermediate dwell for 30 minat a heating rate of 50C/min (Fig.5). Sintering was performed in a horizontal tube furnace under argon atmosphere at a flow rate 0.03ml/sec. Additionally activated charcoal of 10 grams was kept in furnace to prevent oxidation. After sintering is completed samples were cooled in furnace itself at a Cooling rate of 50C/min. Fig.5. shows the green compact and sintered samples.
Sample Code Cu (Wt.%) W (wt.%) Nano Graphene Plates (Wt.%)
C1 94.5 5 0.5
C2 93.5 5 1.5
C3 92.5 5 2.5
Element Weight% Atomic%
C K 8.62 31.87
O K 2.22 6.16
Cu L 88.39 61.78
W M 0.77 0.19
Totals 100.00
Element Weight% Atomic%
C K 8.16 30.21
O K 2.68 7.45
Cu L 89.13 62.34
W M 0.02 0.00
Totals 100.00
Element Weight% Atomic%
C K 82.32 93.08
O K 4.98 4.23
Cu L 12.55 2.68
W M 0.15 0.01
Totals 100.00

TRANSACTIONS OF PMAI, VOL. 44 (2), DECEMBER 2018 17
sintEring and propErty Evaluation of tungstEn and graphEnE addEd coppEr basEd compositEs
Fig. 5: a) Sintering Cycle of Pure Cu and Cu/W/Graphene Composites sintered at 9000C for 1hour.
b) Green and sintered samples of Copper and Cu/W/Graphene Composites.
Table 3:Actualdensity, theoretical density and relative densities of materials used in this
investigation
Fig.6: The actual, theoretical, green, relative densities of pure copper, 94.5Cu5W0.5 graphene,93.5Cu 5W
1.5 graphene, 92.5Cu 5W 2.5 graphene in Wt.% respectively.
3. results and discussionSintered composites were tested for physical, microstructural and mechanical properties such as density, porosity,shrinkage, hardness.3.1 density calculationDensities of all samples were determined by Archimedes principle. The measured density (ρ), theoretical density(ρth), and relative density (DR) of pure copper and composites C1,C2, C3 were calculated using equations (1),(2) and (3) respectively.
Where ρ is the measured density of the samples,ρH2Ois thedensity of distilled water at temperature 300C (ρH2O=0.9956 g/cm3), m1, m2 are the measured masses of samples in air and distilled water.
Where ρcopper, ρtungsten and ρgraphene are the theoretical densities of copper, tungsten and graphene respectively [33-35]
Where DR, ρ, ρth are the relative density, actual density(sintered) and theoretical densities of samples respectively. For pure copper specimen relative density of 82.36% is obtained and when 5 wt.% tungsten and 0.5 wt.% graphene were
ρ= H2O . m1
1− 2 (1) ρ
m m
ρth =m + +
+ + (2)
copper tungsten grapheneρ ρ ρ
m mcopper tungsten graphene
m m mcopper graphene
DR =ρ
ρth (3)
added there is significant increase in relative density which is 85.22% but further increase in graphene content reduced the relative density of composite, Table 3, (Fig.6) shows the variation of theoretical, actual, green and relative densities of materials.
3.2 shrinkage in sinteringShrinkage depends on the particle size and shape of the powder, type and ratio of binder, density of green compact, sintering time and temperature, generally this can be controlled by careful design of sintering cycle. Many researchers have studied the theoretical calculation shrinkage in the powder sintering process[36-37].
Specimens were carefully measured to determine the percentage shrinkage after sintering is completed. Shrinkage is calculated using following expression [38].
S.no Material Green Density(g/cm
3)
Theoretical Density(g/cm
3)
Actual Density(g/cm
3)
(Sintered)
Relative Density
1. Pure copper 6.63 8.96 7.38 82.36
2. C1 6.70 9.07 7.73 85.22
3. C2 6.59 8.79 7.29 82.93
4.
C3
6.48
8.54
6.97
81.61

TRANSACTIONS OF PMAI, VOL. 44 (2), DECEMBER 201818
sintEring and propErty Evaluation of tungstEn and graphEnE addEd coppEr basEd compositEs
Table 4: Linear dimension of sample before and after sintering, shrinkage and Percentage shrinkage
Fig.8: Porosity of sintered specimens.
Fig.7: Percentage shrinkage of sintered specimens.
Table 5: Porosity of the of pure copper and different composites.
Where λ is the Shrinkage, L0 and L are the lengths before and after sintering (Table 5). It is clear that shrinkage is maximum on 94.5 Cu-5 W-0.5 GNP composite. There is decrease in percentage shrinkage as the graphene content is increased it can be seen in Fig.7.
3.4 micro structural characterization:The microstructures of different composites are shown in (Fig.9.) It is noticed from the micrograph that the W particles are segregated in the copper, the white areas in the micrograph are tungsten particles and grey area is copper content. Porosity is increased due to increase in graphene content. To decrease porosity in the composite extrusion technique can be used [39]. From Energy Dispersive X ray spectroscopy (Fig.10.)it is understood that the white areas are W with low peaks and grey areas are copper showing highest peak in the graph and remaining low peaks such as carbon, oxygen and aluminium. In SEM study graphene is not identified, to reveal the graphene content in the composite, TEM studies have to carried.
3.3 porosity: The pores in the powder metallurgy part are expressed in percentage of total volume of the that part. Its influences mechanical properties. Porosity is calculated form relative density of the composite is calculated by following equation
Shrinkage (λ) =L−L0
L0 (5)
Linear Dimension of sample
after sintering (L)
Linear Dimension of sample
before sintering (L )0
Shrinkage(λ) Percentage
Shrinkage
Pure copper 10.48 10.51 -0.00285 -0.285
C1 10.74 11.37 -0.0554 -5.54
C2 10.24 10.73 -0.0456 -4.56
C3 10.89 10.97 -0.0072 -0.72
Porosity (%) = [1 -DR] ×100 (6)
S.no Material Porosity (%)
1. Pure copper 17.63
2. C1 14.77
3. C2 17.06
4. C3 18.38

TRANSACTIONS OF PMAI, VOL. 44 (2), DECEMBER 2018 19
sintEring and propErty Evaluation of tungstEn and graphEnE addEd coppEr basEd compositEs
Fig.9: Scanning electron micro graph of: a) 94.5 Cu 5W 0.5 GNP, b) 93.5 Cu 5W 2.5 GNP, c) 92.5 Cu 5W 2.5
GNP, sintered at 900oC for 1 hr.
Fig.10:EDS of: 94.5 Cu 5W 0.5 GNP sintered at 900oC for 1-hour b) 93.5 Cu 5W 1.5 GNP sintered at 900oC
for 1-hour c) 92.5 Cu 5W 2.5 GNP sintered at 900oC for 1-hour d) 92.5 Cu 5W 2.5 GNP sintered at 900oC for
1-hour (spectrum 2).
Element Weight% Atomic%
C K 4.33 18.23
O K 1.94 6.13
Al K 0.91 1.71
Cu L 92.82 73.93
Totals 100.00
Element Weight% Atomic%
C K 3.40 14.93
O K 1.71 5.64
Al K 0.79 1.54
Cu L 93.80 77.81
W M 0.30 0.08
Totals 100.00
Element Weight% Atomic%
Cu L 0.84 2.39
W M 99.16 97.61
Totals 100.00
Element Weight% Atomic%
C K 2.43 11.64
Cu L 97.57 88.36
Totals 100.00
hardness and electrical conductivity of pure cu and cu/W/graphene composites.
Vickers hardness values of all sintered samples were measured by using micro Vickers hardness tester under load 0.1 kg and 5 seconds dwell time. The variation in hardness and electrical conductivity with tungsten and graphene reinforcements in copper is shown in table 6. It confirms that the hardness values and electrical conductivity is decreased by increasing in graphene, this is due to the soft nature of graphene and enhancement of porosity, the maximum micro Vickers hardness for pure copper is achieved is 90.6 VHN, the hardness value of 94.5 Cu-5 W-0.5 GNP composite is 58.2 VHN, for 93.5 Cu-5 W-1.5 GNP composite hardness value is 55.9VHN and for 92.5 Cu-5 W-2.5 GNP composite is 57.9 VHN (Table6).
Electrical conductivity of the composites was measured by a device called Sigmatest 2.069, which measures the electrical conductivity of non-ferromagnetic metals by measuring the eddy current based on the complex impedance of the sample. When unknown test pieces are measured, this instrument converts the complex impedance value to an electrical conductivity value. The electrical conductivity is measured in percent of the International Annealed Copper Standard: % IACS (Table 6) (Fig.11).
In powder metallurgy, it is difficult to achieve 100% density of the theoretical density. There will be a certain amount of porosity inside the composite. These porosities are in fact the insulation sites which reduce the conductivity of the composites.Addition of graphene content decreased the electrical conductivity of the composite, because porosity level increased by increasing graphene content, and also due to tungsten particles segregation.Moreover, tungsten is found in the pores of the composite and acted as additional insulating site.
% IACS = 0.017241
r×100%(7) Where r is resistivity.

TRANSACTIONS OF PMAI, VOL. 44 (2), DECEMBER 201820
sintEring and propErty Evaluation of tungstEn and graphEnE addEd coppEr basEd compositEs
Table 6: Hardness and electrical conductivity of the of pure copper and different composites.
Fig.11: Electrical Conductivity of sintered specimens.
conclusions:In the present work Copper-Tungsten-Nano Graphene composite materials were fabricated by the powder metallurgy route. The microstructures and properties of these composite materials were investigated. The following conclusion can be drawn from the present work:(1) Composites were fabricated by powder
metallurgical route by sintering at 900oC for 60 min in argon atmosphere.
(2) The relative density of composite decreases with increase in graphene content and a maximum relative density of 85.22% was achieved for 94.5Cu 5W 0.5GNP composite.
(3) Percentage shrinkage is more on 94.5Cu 5W 0.5GNP composite i.e., 5.54% and shrinkage decreases with increase in graphene content, a minimum shrinkage of 0.72% occurred at 93.5 Cu 5 W 2.5GNP.
(4) From microstructure and EDS it reveals that the tungsten particles were not uniformly distributed in the copper matrix, tungsten
SAMPLE VICKERS HARDNESS (HV) Conductivity (% IACS)
PURE COPPER 89.8-90.6 HV 83.72
94.5Cu 5W0.5GNP 56.2-60.3 HV 71.70
93.5Cu 5W1.5GNP 54.9-57 HV 65.22
92.5Cu 5W2.5GNP 54.5-61.3 HV 59.13
particles were segregated and agglomerations were formed, this is likely due to improper mixing, and graphene acted as lubricant while milling.
(5) Electrical conductivity of the composites was measured, which shows that for pure copper 83.72% IACS was obtained this is because of the porosity which generally acts as insulating medium, and among the different composites 94.5Cu 5W 0.5GNP achieved 71.70 % IACS which is near to the Cu5W composite in the literature.
(6) Micro Vickers hardness has been measured and a maximum hardness around 89.8 to 90.6 HV is achieved for pure copper and for the remaining around 60VHN for all the composites with graphene content, the main reason is because of soft nature of graphene which is present at the top surface of the composite and rolling of tungsten particles in the pores of the composite.
acknowledgements:Authors gratefully acknowledge the discussions and various support provided by Dr. T. R. Rama Mohan Formerly, Professor (Powder Metallurgy and Particulate Materials) Department of Metallurgical Engineering & Materials Science, Indian Institute of Technology, Bombay, Dr I.S.R. Sasrty, Associate Professor Department of Metallurgical and Materials Engineering, Rajiv Gandhi University of knowledge Technologies, Basar.
references:[1] German, Randall M. Powder metallurgy and
particulate materials processing: the processes, materials, products, properties, and applications. Princeton, NJ, USA: Metal powder industries federation, 2005.
[2] Rosso, Mario. “Ceramic and metal matrix composites: Routes and properties.” Journal of Materials Processing Technology 175.1 (2006): 364-375.
[3] Zhang, D. L. “Processing of advanced materials using high-energy mechanical milling.” Progress in Materials Science 49.3 (2004): 537-560

TRANSACTIONS OF PMAI, VOL. 44 (2), DECEMBER 2018 21
[4] Warke, Virendra S., Richard D. Sisson, and Makhlouf M. Makhlouf. “The effect of porosity on the austenite to ferrite transformation in powder metallurgy steels.” Materials Science and Engineering: A 528.10 (2011): 3533-3538.
[5] Sharma, Deepika, Kamlesh Chandra, and Prabhu Shanker Misra. “Design and development of powder processed Fe–P based alloys.” Materials & Design 32.6 (2011): 3198-3204.
[6] Bedir, Fevzi. “Characteristic properties of Al–Cu–SiC p and Al–Cu–B 4 C p composites produced by hot pressing method under nitrogen atmosphere.” Materials & design 28.4 (2007): 1238-1244.
[7] Davis, Joseph R., and American Society for Metals. ASM handbook. 2. Properties and selection: nonferrous alloys and special-purpose materials. ASM international, 1998.
[8] Wan, Y. Z., et al. “Effects of processing parameters, particle characteristics, and metallic coatings on properties of Al2O3 copper alloy matrix composites.” Powder metallurgy 41.1 (1998): 59-63.
[9] Wang, W-F. “Effect of tungsten particle size and copper content on working behaviour of W–Cu alloy electrodes during electrodischarge machining.” Powder metallurgy 40.4 (1997): 295-300.
[10] Mordike, B. L., et al. “Effect of tungsten content on the properties and structure of cold extruded Cu-W composite materials.” PMI. Powder metallurgy international 23.2 (1991): 91-95.
[11] Rontó, Viktória, et al. “Developing mechanical properties and electrical conductivity of Cu alloys by Jominy end-quench test.” Materials science forum. Vol. 537. Trans Tech Publications, 2007.
[12] Çetinarslan, Cem S. “Effect of cold plastic deformation on electrical conductivity of various materials.” Materials & design30.3 (2009): 671-673.
[13] Vettivel, S. C., N. Selvakumar, and P. Vijay Ponraj. “Mechanical behaviour of sintered Cu-5% W nano powder composite.” Procedia Engineering 38 (2012): 2874-2880.
[14] Vettivel, S. C., N. Selvakumar, and N. Vijay Ponraj. “Tribological Behaviour of Cu-5W Sintered Powder Composite.” Advanced Materials Research. Vol. 622. Trans Tech Publications, 2013.
[15] Selvakumar, N., and S. C. Vettivel. “Thermal, electrical and wear behavior of sintered Cu–W
sintEring and propErty Evaluation of tungstEn and graphEnE addEd coppEr basEd compositEs
nanocomposite.” Materials & Design 46 (2013): 16-25.
[16] Frank, I. W., et al. “Mechanical properties of suspended graphene sheets.” Journal of Vacuum Science & Technology B: Microelectronics and Nanometer Structures Processing, Measurement, and Phenomena 25.6 (2007): 2558-2561.
[17] Lee, Changgu, et al. “Measurement of the elastic properties and intrinsic strength of monolayer graphene.” science321.5887 (2008): 385-388.
[18] Stankovich, Sasha, et al. “Graphene-based composite materials.” nature 442.7100 (2006): 282-286.
[19] Rafiee, Mohammad A., et al. “Enhanced mechanical properties of nanocomposites at low graphene content.” ACS nano 3.12 (2009): 3884-3890.
[20] Ramanathan, T., et al. “Functionalized graphene sheets for polymer nanocomposites.” Nature nanotechnology 3.6 (2008): 327-331.
[21] Lee, Dongju, et al. “Enhanced mechanical properties of epoxy nanocomposites by mixing noncovalently functionalized boron nitride nanoflakes.” Small 9.15 (2013): 2602-2610.
[22] Song, Sung Ho, et al. “Enhanced Thermal Conductivity of Epoxy–Graphene Composites by Using Non-Oxidized Graphene Flakes with Non-Covalent Functionalization.” Advanced Materials 25.5 (2013): 732-737.
[23] Lim, Min-Young, et al. “Improved strength and toughness of polyketone composites using extremely small amount of polyamide 6 grafted graphene oxides.” Carbon 77 (2014): 366-378.
[24] Wan, Yan-Jun, et al. “Grafting of epoxy chains onto graphene oxide for epoxy composites with improved mechanical and thermal properties.” Carbon 69 (2014): 467-480.
[25] Chen, Lian-Yi, et al. “Novel nanoprocessing route for bulk graphene nanoplatelets reinforced metal matrix nanocomposites.” Scripta Materialia 67.1 (2012): 29-32.
[26] Bartolucci, Stephen F., et al. “Graphene–aluminum nanocomposites.” Materials Science and Engineering: A528.27 (2011): 7933-7937.
[27] Koltsova, Tatyana S., et al. “New hybrid copper composite materials based on carbon nanostructures.” Journal of Materials Science and Engineering B 2.4 (2012): 240-246.

TRANSACTIONS OF PMAI, VOL. 44 (2), DECEMBER 201822
sintEring and propErty Evaluation of tungstEn and graphEnE addEd coppEr basEd compositEs
[28] Wang, Jingyue, et al. “Reinforcement with graphene nanosheets in aluminum matrix composites.” Scripta Materialia 66.8 (2012): 594-597.
[29] Mo, Chan B., et al. “Fabrication of carbon nanotube reinforced alumina matrix nanocomposite by sol–gel process.” Materials Science and Engineering: A 395.1 (2005): 124-128.
[30] Hai-Yang, Song, and Zha Xin-Wei. “Mechanical properties of Ni-coated single graphene sheet and their embedded aluminum matrix composites.” Communications in Theoretical Physics 54.1 (2010): 143.
[31] Chu, Ke, and Chengchang Jia. “Enhanced strength in bulk graphene–copper composites.” physica status solidi (a) 211.1 (2014): 184-190.
[32] Cha, Seung I., et al. “Strengthening and toughening of carbon nanotube reinforced alumina nanocomposite fabricated by molecular level mixing process.” Scripta Materialia 53.7 (2005): 793-797.
[33] Wang, Lidong, et al. “Graphene-copper composite with micro-layered grains and ultrahigh strength.” Scientific Reports 7 (2017): 41896.
[34] Davis, Joseph R., ed. Copper and copper alloys. ASM international, 2001. Page 446
[35] Ashby, Michael F., et al. Engineering materials and processes desk reference. Butterworth-Heinemann, 2009. page 355
[36] Chu, Ke, and Chengchang Jia. “Enhanced strength in bulk graphene–coppercomposites.” physica status solidi (a) 211.1 (2014): 184-190.
[37] Zhou, Jack G., and Zongyan He. “Rapid pattern based powder sintering technique and related shrinkage control.” Materials & design 19.5 (1998): 241-248.
[38] Sierra, C. M., and D. Lee. “Modeling of Shrinkage During Sintering of Injection Molded Powder Metal Compacts.” Powder Metall. Int. 20.5 (1988): 28.
[39] Song, J., et al. “Experimental and numerical analysis on sintering behaviours of injection moulded components in 316L stainless steel powder.” Powder Metallurgy 53.4 (2010): 295-304.
[40] Vettivel, S. C., N. Selvakumar, and N. Leema. “Experimental and prediction of sintered Cu–W composite by using artificial neural networks.” Materials & Design 45 (2013): 323-335.

TRANSACTIONS OF PMAI, VOL. 44 (2), DECEMBER 2018 23
improvEd thErmal stability of high EnErgy ball millEd nanocrystallinE cu-al alloy
vaibhav mishra, Koushik sikdar, debdas royMaterials and Metallurgical Engineering Department, NIFFT, Hatia, Ranchi 834003, India
1. introductionNanocrystalline metal and alloys show anincrease in strength ~10 times in comparison to their conventional coarse-grained counterpart [1]. Development on Cu based nanostructured materials has drawn attention due to the impressive electrical and thermal properties [2]. Mechanical attrition is an efficient and versatile technique for synthesizing nano-structured materials. However, consolidation of the milled powder is difficult due to the inherent coarsening tendency of it. It has been reported that pure nano-scale copper undergoes coarsening even at room temperature [3]. The grain boundary mobility can be mitigated either by reducing intrinsic grain boundary energy or by pinning it down. Addition of elemental like W [4] is helpful in grain boundary pinning. Addition of 10 at. % W ceases a grain size ~110 nm after annealing 1073K (800ºC). On the other hand, theaddition of large-sized atom saysZr [5], Ta [6] etc. reduces grain boundaryenergy upon segregation. Addition of 1 at. %Zrand 10 at. % Ta yields grain size 54 nm and 111nm respectively after annealing at 1173 K (900 ºC). Cu-Al equilibrium diagram shows numerous intermetallic phases, therefore chosen for study. Moreover, these alloys constitute a
Abstract - Nanocrystalline Cu-Al alloys were prepared by high energy ball milling under cryogenic condition. Thermal stability of the alloys were investigated up to 1173 K (900ºC). Phase and microstructural evaluation of both as milled and annealed alloys were done by X-ray line broadening, transmission electron microscopy and focused ion beam channelling contrast microscopy. The mechanical property was evaluated by microhardness testing. It was found that at elevated temperatures grain growth of Cu-Al alloys is much less than pure Cu prepared under similar milling condition. The decrease in microhardness values isalso much lower than pure Cu. Superior thermal stability of the alloy was attributed to the grain boundary pinning by nano-scale intermetallic particles. Kinetically stabilized grain size and hardness lies very close the theoretically approximated values; supports kinetic stabilization at thehigh annealing temperature.
Key words: Cryomilling, Nanocrystalline, Thermal stabilization, Cu-Al alloys, Intermetallics.
broad category engineering materials.Al has good room temperature solubility in Cu (~20 at. % [7]) and also lower elastic misfit (17.4 kJ/mol. [7]) hence much easier to synthesize. High-temperature thermal stability of cryogenic ball milled Cu-Al has been studied and experimentally obtained hardness shows good correlation with theoretically obtained one.
2. materials and methodologyStarting materials for the experiment was elemental powders of pure Cu (Alfa Aesar, 99.9%) and Al (Cerac, 99.95%). The powders were mixed in appropriate quantity to get the bulk composition of Cu86Al14 and Cu88Al12. Then the powder blends were loaded into 440 stainless steel container (Spex Sample Prep, Metuchen, NJ). The entire weighing and loading operation was done inside the argon atmosphere (O2< 1 ppm) of glove box. Mechanical alloying was carried out with Grade 25, 440 stainless steel balls (Salem Specialty Ball). The ball to powder ratio was maintained 10:1. Mechanical alloying was carried out under liquid nitrogen temperature 77 K (−196 °C) in a modified Spex 8000 M mill/mixer for 8 hours. The cryogenic temperature prevents agglomeration of ductile powder mixture and

TRANSACTIONS OF PMAI, VOL. 44 (2), DECEMBER 201824
improvEd thErmal stability of high EnErgy ball millEd nanocrystallinE cu-al alloy
enables rapid grain refinement. A nylon vial holder was used for continuous flow of liquid nitrogen around the vial. The cryomilled alloy powder was then annealed at 873, 973, 1073 and 1173K (600, 700, 800 and 900°C) for 1 h under Ar atmosphere. To compare its performance against pure Cu, elemental Cu (99.9% pure) was milled and annealed under the same condition.Phase analysis of both milled and annealed Cu-Al alloy powders wasdone by X-ray diffraction (XRD). The XRD was carried out by RigakuDMax/A X-ray diffractometer with Cu Kα radiation (λ = 0.15405 nm) with scanning range (2θ) from 30 to 100°. The background noise reduction and Kα2 peaks removal were done by XRD software. The grain sizewas calculated from XRD peak broadening by applying Scherrer equation. Lattice parameter (aCu) was calculated from peak maxima positions. For calculating precise value of lattice parameter, obtained values of aCu was plotted against cos2 θ ⁄sinθ and extrapolated up to cosθ=0 [8].The microstructures of both as-milled and annealed (at 1173 K) sample was investigated by transmission electron microscopy (TEM, JEOL JEM 2000FX). TEM samples were prepared by uniaxially pressing the powders (<500 MPa pressure) at room temperature. The powder compacts were then mechanically thinned and electropolished by 30 vol% nitric acid and methanol at 253 K (−20 °C) by Tenupol-2 electropolisher. The focused ion beam channelling contrast imaging (FIBCCI) was done by FEI Quanta 200 FIB system.Microhardness was measured (Buehler Micromet II hardness tester) for each annealing condition as well as for milled powder under 25 g load with 12 s dwell time. 10-12 hardness values were recorded for each condition. The obtained values from each test condition were averaged out and the corresponding standard deviation was recorded for comparison.
3. results and discussionFig. 1(a) and (b) the XRD profiles of the as-milled and annealed Cu with 12 and 14 at. % Al alloy.
It consists of primary reflections corresponding to FCC structure. In as-milled condition peaks of both alloys are broad; might be attributed to fine crystallite size and lattice strain. In annealed condition (at 1173 K (900°C) the width of the representative (111) peak decreases and intensity increases. It might be attributed to the decreases in lattice strain and increases in crystallite size. The average grain sizes of milled alloys are almost similar (~12 nm).
The variation of Scherrer grain size with respect to the annealing temperature is shown in Fig.2 (a). With the increase in annealing temperature, pure Cu undergoes rapid coarsening. It has been reported that the grain size calculated from X-ray line broadening is an estimation; valid as long as thegrain size is less than 30-40 nm [9]. Considering it, the grain size of the Cu86Al14 alloy can be considerednano-scale even after annealing at 1173 K (900°C). The TEM investigation provides much accurate grain size measurement. The grain size obtained from microscopy was plotted against the value obtained from XRD investigation (Fig.2 (b).
Fig.3 shows the variation of hardness with respect to the annealing temperature. With the increase in annealing temperature hardness of pure Cu decreases sharply. Incontrary, the Cu-Al alloys show amuch lower decrease in hardness as compared to its as-milled value and maintain a higher hardness throughout.
The TEM investigation carried out was carried out under bright field (BF), dark field (DF) and corresponding selected area diffraction (SAED) pattern were taken.The BFTEM micrograph of the as-milledCu86Al14 alloy (Fig.4a) shows equiaxed grain. The ill-defined boundaries can be attributed to severe lattice distortion of the powder particles [9]. The estimated grain size in theas-milled state is ~20 nm. The SAED pattern (Fig.4a inset) shows rings corresponding to Cu only; support the formation of acomplete solid solution. No secondary phase was traced in theas-milled alloy.

TRANSACTIONS OF PMAI, VOL. 44 (2), DECEMBER 2018 25
Fig.1 XRD patterns of (a) Cu88Al12 and (b) Cu86Al14 alloy in as-milled condition and after annealing at
1173K (900ºC).
Fig.3. (a) Hardness variation with respect to the annealing temperature, (b) relative contributions of
strengthening mechanisms. The hardness of the Cu-Al alloys are much stable than pure Cu.
Fig.2. (a) The variation of Scherrer grain size with respect to the annealing temperature and (b)
comparison of grain size of theCu86Al14 alloy obtained from XRD line broadening and microscopy.
improvEd thErmal stability of high EnErgy ball millEd nanocrystallinE cu-al alloy
Fig. 5 a the BFTEM micrograph of the 900ºC annealed sample shows grain boundaries are well defined. The DFTEM micrograph (Fig.5b) and grain size distribution (Fig.5b inset) shows nanocrystalline microstructure retains even after annealing under 0.87 Tm (Tm is the melting temperature in K).The corresponding SAED pattern (Fig.5a inset) shows faint rings of intermetallic CuAl2 along with primary FCC rings. It might be attributed to the dissociation of solid solution during annealing. Formation of the secondary phase ceases possibility of grain size stabilization I thermodynamically controlled mode. Hence, the improved thermal stability attributed to grain boundary pinning of these nano-scale intermetallic particles.

TRANSACTIONS OF PMAI, VOL. 44 (2), DECEMBER 201826
Fig.4. As-milled TEM micrographs of Cu86Al14 alloy (a) bright field with SAED inset bottom right and (b)
dark field image.
Fig.5. TEM micrographs of 1173K (900ºC) annealed Cu86Al14 alloy (a) bright field with SAED inset bottom
right and (b) dark field image.
Fig.6. (a) The FIB-CCI micrograph of Cu86Al14 alloy annealed at 1173K (900°C) for 1h (at low mag.) and
(b) high mag. images. It is clear that grains are mostly equiaxed.
improvEd thErmal stability of high EnErgy ball millEd nanocrystallinE cu-al alloy
The FIBCCI micrographs (Fig.6) enables grain size observation in the much larger area than TEM. It shows most of the grains are below 100 nm, although limited resolution restricts us from estimating grain size distribution out of these micrographs. Based on the sources hardness of the alloy can be given by Hall-Petch (HHP), Orowan (HOro) and solid solution strengthening (HOther) as:
H=HHP+HOro+HOther (1)
Considering Tabor’s relationship between hardness and yield strength (H=3σ0.2) the Hall-Petch strengthening can be calculated as [4,9]:
Where σo is the frictional stress (25.5 MPa), k is the Hall-Petch slope (0.11MN/m3/2[5]) and DTEM is the average grain size obtained from TEM investigation. The HOro can be calculated as [9]:
Where G is the shear modulus of Cu (42 GPa),b is the Burger’s vector (0.255 nm), r0 is the dislocation core radius (r0=4b [9]) and λ is the inter-particle spacing. Inter particle spacing (λ) can be calculated from the following equation [9]:
The aforementioned calculation yields HHP and HOro contributions for Cu86Al14 alloy annealed at 1173 K (900ºC) are 1.37GPa and 0.96 GPa respectively; elicits grain size provides the major portion of strength. Fig.3 (b) shows relative hardness contributions. HOther is mainly contributed from solid solution strengthening in as-milled condition. As annealing temperature increases, solute atom leaves parent lattice; consequently the solid solution strengthening contribution decreases.
The precipitate volume fraction can be calculated as [9]:
Solid solution strengthening (HSS) can be calculated as:
HOther=H-(HHP+HOro) (6)
HHP k o DTEM (2)
HOro 3 3Gb In ro
2 ro
dpro
In
In(3)
3
(4)dp4f
1
21
(5)fDTEM
rP0.2

TRANSACTIONS OF PMAI, VOL. 44 (2), DECEMBER 2018 27
improvEd thErmal stability of high EnErgy ball millEd nanocrystallinE cu-al alloy
Fig.7. Comparison of microhardness variation of nanostructured Cu-Al alloys with annealing
temperature to that alloyed with W, and Zr.
Fig.7 shows the microhardness alteration of nanostructured Cu “alloyed” with different alloying elements. All of them were prepared by similar processing technique and also annealed under similar condition. It is clear that addition of Al retains a higher strength level even after annealing at 1173K (900°C). For instance, hardness drop of the binary Cu86Al14 alloy is ~17 %. It is much less than the reported hardness drop for Cu90W10 alloy (hardness drops ~24%) after annealing at 1073K (800ºC) [4] and comparable with Cu99Zr1 alloy (showshardness drop ~12% after annealing at 1173K (900 °C)[5]). The maximum solubility of W in Cu 0.97 at. % [11] and 2.05 at. % [12] respectively.The addition of large-sized atoms improves thermal stability. However, due to high elastic misfit, their solubility in parent lattice is limited. Extending their solubility limit; it isnecessary to energize the material to high energy state; requires novel processing route [11]. Present work demonstrates an alternate path for designing a stable nanocrystalline material with theaddition of an element having lower elastic misfit.
4. summary and conclusions
The salient conclusions of the present work are as follows:
i. Single phase nanocrystalline Cu-Al alloys synthesized by cryogenic milling shows excellent stability against coarsening up to 1173K (~0.87 Tm).
ii. Nano-scale intermetallic particles formed during annealing pins down the grain boundaries; was attributed to thereason for the superior thermal stability of the alloy.
iii. The major strengthening mechanisms say HHP and HOro contributes ~50% and 35% respectively; shows Hall-Petch strengthening is dominant contributor.
acknowledgementAuthors are grateful to Professor C.C. Koch, NCSU, Raleigh for providing needful research facilities and valuable suggestions.
competing interestsThe authors declare that they have no competing interests.
references1. C.C. Koch, K.M. Youssef, R.O. Scattergood,
K.L.Murty, Breakthroughs in optimization of mechanical properties of nanostructured metals and alloys, Advanced Engineering Materials 7 (2005) 787-794.
2. A. Fathy, O.E. Kady, Thermal expansion and thermal conductivity characteristics of Cu-Al2O3 nanocomposites, Materials and Design 46 (2013) 355-359.
3. V.Y. Gertsman, R. Birringer. On the room-temperature grain growth in nanocrystalline copper. Scr Metall Mater, 30 (1994) 577–581
4. M. A. Atwater, D. Roy, K.A.Darling, B.G.Butler, R.O.Scattergood, C.C.Koch, The thermal stability of nanocrystalline copper cryogenically milled with tungsten, Materials Science and Engineering A 558(2012)226–233
5. M. A. Atwater, R. O. Scattergood, C. C.Koch, The stabilization of nanocrystalline copper by zirconium, Materials Science & Engineering A 559(2013) 250–256
6. K.A. Darling, A.J. Roberts, Y. Mishin, S.N. Mathaudhu, L.J. Kecskes, Grain size stabilization

TRANSACTIONS OF PMAI, VOL. 44 (2), DECEMBER 201828
improvEd thErmal stability of high EnErgy ball millEd nanocrystallinE cu-al alloy
of nanocrystalline copper at high temperatures, Journal of Alloys and Compounds 573 (2013) 142–150
7. D. Roy, B.V.Mahesh, M.A.Atwater, T.E.Chan, R.O.Scattergood, C.C.Koch, Grain size stability and hardness in nanocrystalline Cu–Al–Zr and Cu–Al–Y alloys, Materials Science & Engineering A598(2014)217–223
8. J.B. Nelson, D.P. Riley, An experimental investigation of extrapolation methods in the derivation of accurate unit-cell dimensions of crystals, Proc. Phys. Soc.57 (1945) 160-177.
9. K.Sikdar, S.Chakravarty, D. Roy, R. O. Scattergood, C. C. Koch, Synthesis and characterization of an in situ consolidated nanocrystalline Cu88Al11.5Y0.5 alloy, Journal of Alloys and Compounds 717 (2017) 219-225
10. S.Chakravarty, K.Sikdar, S.S. Singh, Debdas Roy, C. C. Koch, Grain size stabilization and strengthening of cryomilled nanostructured Cu 12 at% Al alloy, Journal of Alloys and Compounds 716 (2017) 197-203
11. C.Suryanarayana, Mechanical alloying and milling, Progress in Materials Science, 46 (2001) 1-184
12. M. J. Tenwick, H. A. Davies, Enhanced Strength in High Conductivity Copper Alloys, Materials Science and Engineering, 98 (1988) 543-546

TRANSACTIONS OF PMAI, VOL. 44 (2), DECEMBER 2018 29
a dEtailEd study of thE microstructurE and dimEnsional changE of prE-alloyEd sintEr-
hardEnablE pm stEEl using dilatomEtric tEchniquEs
saba mousavinasab1, vincent paris 1, vladimir paserin1, prakash Khole 2
1 Rio Tinto Metal Powders, Tracy, Quebec, Canada2Rio Tinto India Pvt. Ltd, India
1 introduction
The mechanical properties of PM steels are directly related to their density and microstructure. At a given density, their performance can be increased through post-sintering heat-treatments. The additional heat-treatment step such as oil-quenching can be avoided in sinter-hardening procedure.In sinter-hardening the parts are directly cooled from the sintering temperature in the cooling zone of the sintering furnace. Sufficient hardenability, which can be achieved through proper choice of alloying elementsand their amounts, is needed in order to be able to develop hardmicrostructures such as bainite and martensite. Therefore, sinter-hardening grades contain alloying elements such asnickel, copper, chromium and molybdenum that can provide the required hardenability. Chromium and molybdenum are typically pre-
Abstract - Post-sintering heat-treatments can increase the performance of PM steels at a givendensity. Sinter-hardening is an attractive manufacturing method that combines sintering and heat treatment in one step.Sinter-hardening grades should contain alloying elements that could provide sufficienthardenability. ATOMET 4601 was chosen for this study as the sinter-hardenable grade. This fully pre-alloyed grade contains pre-alloyed manganese,nickel and molybdenum.Admixed copper was also added to increasethe hardenability. A comprehensive dilatometric study was done on the mentioned PMsteel in order to acquire its hardenability response through obtaining the CCT curves.The effects of carbon and copper addition and sintering conditionon the dimensional change stability were also studied. It was found that the critical cooling rate where the only transformation product is martensite, is slightly above 3.75 ºC/s and that there is no sign of martensite for cooling rates below 0.45ºC/s. Both copper and graphite have asignificant effect on the dimensional change and copper growth can be reduced by acomplete diffusion of carbon before copper melting, which can be achieved either byusing a finer graphite or by modifying the sintering profile of the furnace.
Keywords: Sinter-hardening, Dilatometry, Dimensional change, Microstructure
alloyed in the base powder whereas copper is usually added through admixing or diffusion alloying techniques [1, 2].
The main benefits of sinter-hardening procedure are the lower distortion of complex shaped parts, elimination of the oil removal process and lower production costs.However, due to the hardened microstructure produced during the sinter-hardening, secondary sizing operationsare very difficult which implies that the dimensional stability is important [3]. Consequently, studying the hardenability and dimensional change stability of the sinter-hardenable PM steels is of great importance.In order to study the hardenability of PM steel,the effect of alloying elements on the microstructural constituents under non-equilibrium conditions should be understood. Phase diagrams can provide these microstructural information only when a steel

TRANSACTIONS OF PMAI, VOL. 44 (2), DECEMBER 201830
a dEtailEd study of thE microstructurE and dimEnsional changE of prE-alloyEd sintEr-hardEnablE pm stEEl using dilatomEtric
tEchniquEs
is cooled under equilibrium conditions and do not reflect its behavior upon rapid cooling which is the case for sinter-hardening PM steels.Continuous - cooling - transformation (CCT) diagrams provide this kind of information under non-isothermal andnon-equilibrium conditions and can be used to study the hardenability.Dilatometry,through which CCT curves can be obtained,is a popular approach to understand the phase transformationsdimensional change behavior of PM steels [4-7].
A fully pre-alloyed grade, ATOMET 4601, that contains pre-alloyed manganese, nickel and molybdenum was chosen for this study. Admixed copper was also added to the premix to increase its hardenability. A comprehensive dilatometric study was done on the mentioned PM steel in order to acquire its hardenability response through obtaining the CCT curves. Moreover, the effect of carbon and copper addition, graphite type and sintering condition on its dimensional change stability were also studied.
2 Experimental procedure
Premixeswith ATOMET 4601 (Fe-0.2Mn-0.55 Mo-1.8Ni), 0.6 wt.% graphite and 2 wt.% copper were prepared and pressed into cylindrical samples(6mm in diameter and 10 mm height). The cylindrical samples were then sintered in a dilatometer at 1120°C for 15 minutes under an argon atmosphere and were cooled using different cooling rate ranging from 0.8 to 34°C/s. The samples were previously pre-sintered for 15 minutes in another furnace in order to prevent the copper from dripping in the dilatometer chamber. The dilatometry results were combined with metallographic observations and microhardness measurements to obtain the CCT curves of the tested PM steel. In order to better understand the microstructural evolution during sintering, two interrupted sintering cycles were also performed in which the samples were heated to 1076°C and 1090°C followed by an immediate cooling at a rate of 0.17°C/s.
The effect of graphite and copper as well as the sintering condition on the dimensional change of the sintered parts were evaluated using another set of premixes of ATOMET 4601 with different amounts of copper and graphite. Two types of graphite, natural and synthetic, with different carbon concentration and particle size were used. Table 1 shows the D90 and carbon concentration of the graphite types that were used in this study.In order to obtain the dilatometry curve and study the effect of each parameter on it, one inch long bars werepressed and sintered in a dilatometer at 1120°C for 25 minutes under argon and 5% H2 atmosphere using two heating rates of 10 and 20°C/min. Two heating rates were used to investigate the effect of different sintering profiles on the dimensional change stability.
3 results and discussion
3.1 hardenability
The CCT curves of theAT-4601 steel grade (Fe-0.2Mn-0.55Mo-1.8Ni) with 2 wt.% copper and 0.6 wt.% carbon are shown inFigure 1.The corresponding apparent hardness values (expressed in HV30) are shown at the bottom of each curve. The microstructures of the studied PM steel that has been sintered at 1120°C for 15 minutes but cooled with different cooling rates are also presented in Figure 2. According to these two figures, it can be seen that there is no sign of martensite at cooling rates below 0.45°C/s, which means that the amounts of the alloying elements were insufficient to result in a hardened microstructure at low cooling rates.At cooling rates between 0.45ºC/s and 3.75ºC/s the transformation of austenite will result in a mixture of bainite and martensite. As the cooling rate is increased, the amount of martensite and
Table 1- The characteristics of different graphite types used in the study.
Graphite type/ Characteristic
D90 (µm) Carbon concentration (%)
Natural 25 96-97
Synthetic 15 99

TRANSACTIONS OF PMAI, VOL. 44 (2), DECEMBER 2018 31
consequently the hardness is increased. The critical cooling rate which results in a fully martensitic microstructure is slightly above 3.75°C/s. Figure 3,which shows the progressive formation of martensite with increasing cooling rate, is also in agreement with the previously mentioned results. At high cooling rates the microstructure is fully martensitic, while at the low cooling rate the steel is mainly bainitic. The interrupted sintering cycles from two different sintering temperatures were also done to better understand the microstructural evolution and to support the previous statements[8]. Figure 4shows the obtained microstructures of the cylindrical samples that were sintered at 1076°C, 1090°C and 1120°C and cooled with the cooling rate of 0.17°C/s.
The microstructure of the AT-4601+0.6C+2Cu PM steel that was sintered at 1076°C and cooled at0.17°C/s is mainly bainitic as shown in Figure 4-a, which is in agreement with the corresponding CCT curve. Small ferritic regions can also be seen in this microstructure (Figure 4-a) which implies that carbon diffusion was notcompletedat this temperature.The original copper particles are
a dEtailEd study of thE microstructurE and dimEnsional changE of prE-alloyEd sintEr-hardEnablE pm stEEl using dilatomEtric
tEchniquEs
Fig. 1- CCT curves of a fully pre-alloyed 4601 steel grade (Fe-0.2Mn-0.55Mo-1.8Ni) with 2 wt.% copper
and 0.6 wt.% carbon.
Fig. 3- Phase quantification as a function of cooling rate for the pre-alloyed 4601 steel grade (Fe-0.2Mn-
0.55Mo-1.8Ni) with 2 wt.% copper and 0.6 wt.% carbon.
Fig. 4- Microstructural evolution for the AT-4601+0.6C+2Cu, as revealed by interrupted sintering
at: a) 1076°C, b) 1090ºC and c) 1120 °Cfollowed by cooling at ~0.17ºC/s.
Fig. 2- Microstructures of the pre-alloyed 4601 steel grade (Fe-0.2Mn-0.55Mo-1.8Ni) with 2 wt.% copper and 0.6 wt.% carbon sintered at 1120 °C for 15 min
and cooled with a) 0.45 °C/s, b) 1 °C/s, c) 2.5 °C/s and d) 3.75 °C/s.

TRANSACTIONS OF PMAI, VOL. 44 (2), DECEMBER 201832
3.2.1 the effect of graphiteand copper
Figure 6 shows the effect of the graphiteamount on the dimensional change of the studied PM steel. As previously mentioned, there is growth associated with the diffusion of carbon into the matrix. This growth is not present in the case of the sample containing no graphite (Curve A). However, by adding 0.6% graphite, the swelling of the sample between 925°C and 975°C, which is due the carbon growth,is observed on the dilatometry curve.Moreover, it can also be seen that the higher quantity of graphite (0.9% instead of 0.6%) caused even higher carbon growth and swelling (Curve B and C) [9].
a dEtailEd study of thE microstructurE and dimEnsional changE of prE-alloyEd sintEr-hardEnablE pm stEEl using dilatomEtric
tEchniquEs
Fig. 5- Typical dilatometry curve and the associated metallurgical transformation during sintering.
Fig. 6- Dilatometry curves of the pre-alloyed AT-4601 with different amounts of graphite.
not melted at this temperature and can be clearly seen in this micrograph. No sign of these solid copper particles are seen when the sintering temperature is increased to 1090ºC (Figure 4-b). However, at this stage, the copper rims are spread around the steel particle surfaces and through the austenite grain boundaries, which conveys that presence of carbon has not reduced the wettability of the iron particlesby liquid copper.Figure 4-c shows that a chemical homogenization has occurred when the PM steel was sintered at the conventional sintering temperature (1120ºC). This homogenization is accelerated by the fragmentation of the steel particles, which itself is a result of copper diffusion to grain boundaries. Lower diffusion distance is the main benefit of this phenomenon.
3.2 dimensional change stability The effect of graphite type and amount, copper quantityand the sintering condition on the dimensional change stability of the AT-4601+XC+YCuPM steel has been studied by obtaining the dilatometry curve at different conditions. In order to better understand the effect of each parameter, a typical dilatometry curve is shown in Figure 5, which demonstrates the sequence of events that led to the final dimensional change of a sintered part. It can be seen that by increasing the temperature to 700°C, Fe-α starts transforming to Fe-γ, which causes a contraction in the matrix. By further increasing the temperature to 950°C, the diffusion of carbon into the matrix begins which consequently results in a growth that last until the carbon has fully diffused. At 1083°C (melting point of copper), liquid copper wets the surface of the iron particles and starts to diffuse into the grain boundaries, which also causes growth as well. After reaching the maximum sintering temperature, the sinter-necks are formed and pores are reduced which leads to contraction (sintering contraction). There is also another further growth during the cooling and when the transformation of Fe-γ to Fe-α takes place. The final dimensional change is the result of all the mentioned events [9-11].

TRANSACTIONS OF PMAI, VOL. 44 (2), DECEMBER 2018 33
Figure 7 shows the dilatometry curves of the samples without and with different amounts of copper. The significant swelling caused by copper addition can be clearly seen at around 1100°C, by comparing Curves C and D. This swelling is due to the diffusion of the copper melt to the grain boundaries. By comparing Curves D and E, it can be seen that the copper growth is more pronounced in the case of the sample with lower graphite amounts, although the copper quantity is the same for both samples. This is related to the fact that the carbon content changes the wetting angle and dihedral angle of liquid copper with iron. Therefore, carbon increases both angles and reduces the copper diffusion by diminishing the flow of the liquid copper along the inter-particle and/or grain boundaries. It can be concluded that copper and graphite have an important role on defining the final dimensional change of a sintered part. Accordingly one can control the dimensional change by adjusting the amount of these two elements [9].
The growth associated with copper can also be reduced by controlling its diffusion into the grain boundaries which can be achieved by saturating the matrix with carbon. In other words, the copper growth will be reduced if the graphite is completely dissolved into the matrix before the copper melts. Figure 8 shows the effect of
a dEtailEd study of thE microstructurE and dimEnsional changE of prE-alloyEd sintEr-hardEnablE pm stEEl using dilatomEtric
tEchniquEs
Fig. 7- Dilatometry curves of the pre-alloyed AT-4601 without and with different amounts of copper.
Fig. 8- Dilatometry curves showing the difference between the diffusion of synthetic and natural
graphite.
Fig. 9- Sintering profiles of the quality control furnace (RTMP), the production sintering furnace (MSC) and
the dilatometer at different heating rates
graphite type on the dimensional change. In the case of the synthetic graphite with finer particle size distribution, the diffusion of carbon into the matrix is started at lower temperatures and consequently is completely finished at around 950°C i.e. before copper melts. Therefore, when the sample reaches the copper melting temperature, the grain boundaries are already saturated with carbon and the copper growth is less pronounced [9, 12].
3.2.2 the effect of sintering condition
Figure 9 shows the sintering profiles of different furnaces that were considered in this study; the quality control laboratory furnace (RTMP), the production sintering furnace (MSC) and the dilatometer at two heating rates of 20°C/min and 25 °C/min.

TRANSACTIONS OF PMAI, VOL. 44 (2), DECEMBER 201834
a dEtailEd study of thE microstructurE and dimEnsional changE of prE-alloyEd sintEr-hardEnablE pm stEEl using dilatomEtric
tEchniquEs
Fig. 10- The total time spent between 870°C and 1080°C for different sintering profiles.
Fig. 11- Comparison of dimensional change for a selection of lots under different sintering profiles.
It can be seen that the temperature plateau is shorter in the case of the production furnace. Different sintering profiles can affect the diffusion of graphite and consequently impact the dimensional change response. According to the dilatometry experiments, graphite diffuses between 870°C and 1080°C, prior to copper melting. Therefore, in order to see the effect of the sintering profiles better, the time spent between 870°C and 1080°C for each profile is shown in Figure 10. The time spent in the mentioned temperature range i.e. the temperature range of graphite diffusion, is significantly larger in the case of the RTMP furnace. This means that graphite has more time to diffuse before copper melts and therefore there will be less growth associated with copper. However, this time is only 6 minutes for the production furnace.In order to see the effect of this time on the dimensional change, two modified sintering profiles of the production furnace (MSC furnace) were tested. Figure 11 shows the dimensional change of a selection of lots, sintered inthe laboratory furnace and in the production furnace with different profiles.
It can be seen that the dimensional change of the samples sintered in the laboratory (RTMP QC furnace), where the samples spent longer time in the graphite diffusion zone, is smaller than that of the production furnace. However, by modifying the sintering profile of the production furnace and having more time in the graphite diffusion temperature range, not only the dimensional change is reduced but also the variation from lot to lot is affected and minimized.
4 conclusion
A dilatometric study was done on asinter-hardenable PM steel that contained pre-alloyed manganese, nickel, molybdenum and admixed copper and graphite. The CCT curves were obtained through which the hardenability response of the PM steel was studied. It was found out that the critical cooling rate where the only transformation product is martensite is slightly above 3.75ºC/s and that there is no sign of martensite for cooling rates below 0.45ºC/s. Themicrostructural evolution during heating was also investigated through interrupted sintering. This investigation revealed that along with the neck formation and α to γ transformation, the diffusion of carbon in the solid state as well as the copper diffusion by liquid phase sintering (LPS) mechanism are also to be considered as important microstructural changes that take place during heating. Moreover, it was also found that the presence of carbon has not reduced the wettability of the iron particles by liquid copper.
The use of the dilatometer enabled us to better investigate how different parameters interact withone another to yield the final dimensional change of a part. It was found that both copper and graphite can cause growth in a sintered

TRANSACTIONS OF PMAI, VOL. 44 (2), DECEMBER 2018 35
a dEtailEd study of thE microstructurE and dimEnsional changE of prE-alloyEd sintEr-hardEnablE pm stEEl using dilatomEtric
tEchniquEs
part,however, their growth can overlap and affect the final dimensional change. By controlling the diffusion of carbon and managing to have graphite completely dissolved in the iron matrix before the copper melts, the copper growth can be reduced. Moreover, when natural graphite was replaced with finer synthetic graphite, carbon diffused faster and resulted in smaller dimensional change. Different sintering profileswere also investigated in this study and it was found out that by modifying the sintering profile in such a way that a sample spends more time in the graphite diffusion zone (870ºC -1080ºC),smaller dimensional change can be obtained since carbon has more time to diffuse. Moreover, the lot to lot variation was also minimized when graphite had more time to completely diffuse before the copper melting.
acknowledgement
We would like to acknowledge CEIT and AAM. This work was done in collaboration with CEIT in Spain and Metaldyne (AAM) in United States.
references[1] S. Hatami, et al., “Critical aspects of sinter-
hardening of pre-alloyed Cr-Mo steel”, Journal of Materials Processing Technology,vol. 210, pp. 1180-1189, 2010.
[2] K. S. Moghaddam, et al., “Effect of sinterhardening on microstructure and mechanical properties of Astaloy 85Mo”, Journalof Iron and Steel Research, International, vol. 19, pp. 43-46, 2012.
[3] F. Chagnon, et al.,”Dimensional control of sinter-hardened P/M components”, Advancesin Powder Metallurgy and Particulate Materials, MPIF, Princeton, NJ, USA, pp. 351-364, 2001.
[4] W.B. James, “Recent developments in ferrous powder metallurgy alloys”, International Journalof Powder Metallurgy, vol.30, no.2, pp 157-162, 1994.
[5] S.Suleyman, et al. “Effect of microstructural inhomogeneities on the mechanical properties of hybrid P/M steels”, Advances in powder metallurgy and particulate materials 10, pp 10-51, 2001.
[6] M. Nabeel, et al., “Influence of alloying elements on Ni distribution in PM steels”, Powder Metallurgy, vol. 57, no. 2, pp. 111-118, 2014.
[7] T.Jinsuke, et al.,”Effect of Oxygen in Powder on Dimensional Change”, Proceedings ofthe Powder Metallurgy Conference and Exhibition, part 4 of 6, MPIF, Princeton, NJ, USA, pp. 37-50,1991.
[8] I. Bailon-Poujol, et al.,”Dilatometric analysis of pre-alloyed high hardenability PM steels containing elemental Cu additions”, World PM 2016 congress & exhibition, Hamburg, Germany, 2016.
[9] V. Paris, et al., “Improvement of dimensional stability of sinter hardening steel powders”, Advances in powder metallurgy and particulate materials, pp 910-921, 2011.
[10] R. M. German,”Powder Metallurgy and Particulate Materials Processing”, MPIF, Princeton, New Jersey, USA, pp. 233,2005.
[11] S.St-Laurent, et al., “Behaviour of sinter hardening powders during sintering”, Advances in Powder Metallurgy and Particulate Materials, MPIF, Princeton, NJ, USA, part 10, pp. 145-159 2004.
[12] H.Danninger, et al.,”Dissolution of different graphite grades during sintering of PM steels”,Materials Chemistry and Physics, No. 67, pp 72-77, 2001.

TRANSACTIONS OF PMAI, VOL. 44 (2), DECEMBER 201836
prEparation of Zrb2-sic compositE and its microstructural study
Jyothi sharma*, abhijeet Kalaskar, p.K patro, t mahata, deep prakash and p.K. sinha
Powder Metallurgy Division, Bhabha Atomic Research CentreVashi Complex, Navi Mumbai – 400703
*Corresponding author, Email: [email protected]
introduction
Transition metal diborides are characterized with high melting temperature, high stiffness and hardness due to covalent nature of bonding. Apart from these properties the diborides have high thermal and electrical conductivity, low coefficient of thermal expansion and reasonably good corrosion resistance. Among the diborides zirconium diboride (ZrB2) based ceramics have been reported to be a potential candidate material for ultra-high temperature structural applications. [1] The oxidation resistance of ZrB2 rapidly decreases above 1300°C. [ ] Addition of SiC is reported to increase the oxidation resistance of ZrB2 along with improvement in specific strength and fracture toughness. [2] Due to large boron content ZrB2 and ZrB2 based composites are candidate material for use as neutron absorber in nuclear reactor. Diffusion is limited in these ceramics due to covalent nature of bonding and consequently conventional powder compaction –
Abstract - In this study, ZrB2-SiC composite has been prepared by vacuum hot pressing of two different types of powder mixtures. In the first case ZrB2 and SiC powder mixture was hot pressed at 1850oC using 30 MPa pressure to obtain a composite designated as ZS-M. The ZrB2 powder used in this investigation was prepared by carbothermic reduction of ZrO2 in presence of B4C. In another approach ZrO2, B4C, C and SiC powders have been mixed and heated under vacuum to allow formation of ZrB2-SiC composite powder. The composite powder was subsequently hot pressed under identical conditions to get composite designated as ZS-R. The results show that the relative densities of ZS-M and ZS-R composites are 91.3% and 98.9% of theoretical density respectively. XRD analysis has been carried out to confirm the phase stability and phase assemblage in the sintered composite. The microstructural features and distribution of phases have been investigated by SEM-EDS. In the ZS-R composite fine SiC particles are observed to be distributed homogenously in ZrB2 matrix, whereas in ZS-M composite SiC particles are distributed homogenously but remains larger in size. The distribution of SiC phase is more homogeneous in case of ZS-R composite. Thermo-physical properties of the ZrB2-SiC composites prepared by two approaches have been measured and correlated with microstructure.
sintering is not adequate for getting high density composite. [ ] Pressure assisted sintering is generally adopted for sintering these materials. Dense microstructure, fine grain size and uniform distribution of SiC phase are some of the general requirement for achieving the desirable properties in the material system. In the present study, two approaches have been adopted to fabricate ZrB2–SiC composite (30 vol% SiC) using hot pressing technique. In one case ZrB2 and SiC powders have been mixed and then hot pressed. In another approach ZrB2-SiC composite powder has been formed and then hot pressed. The composites have been characterized for microstructure and thermo-physical properties.
ExperimentalsZrB2 powder used in this study has been prepared by carbothermic reduction of ZrO2 in presence of B4C. The balanced reaction for the preparation of ZrB2 by carbothermic process is as follows:
2ZrO2+B4C+3C→2ZrB2+4CO

TRANSACTIONS OF PMAI, VOL. 44 (2), DECEMBER 2018 37
prEparation of Zrb2-sic compositE and its microstructural study
ZrO2, B4C and graphite powders were taken in 2:1:3 molar ratio and wet mixed in a planetary ball mill using zirconia balls and ethanol. The dried powder mixture was cold compacted at 100 MPa pressure and the compact mass was heated under vacuum. The reaction was found to be appreciable at around 1200 oC as indicated by the fall in vacuum during heating. The reaction was allowed to proceed at lower temperature range (1200 -1300 oC) to avoid loss of boron in the form of its oxides. As the vacuum improved to better than 10-3 mbar the temperature was raised to 1600oC and hold for 1h to complete the reaction.
The porous mass obtained after the reaction was crushed, ground and sieved through -325 mesh screen. Phase purity of the synthesized ZrB2 powder was confirmed through XRD analysis (INEL Diffractometer). XRD pattern of commercial SiC powder was also recorded. Particle size distribution of ZrB2 and SiC powders was evaluated using laser diffraction based particle size analyzer (CILAS, Model 1090L).
For the preparation of composite ZrB2 and SiC powders were taken in weight ratio 100:22.6 and mixed together by wet ball milling using silicon nitride balls and ethanol. This composition corresponds to 30 volume percent of SiC. The dried powder mixture was hot pressed at 1850oC and 30 MPa pressure for 2h under vacuum. In another approach ZrO2, B4C, C and SiC powders were mixed in a particular ratio and the mixture was heated under vacuum upto 1600 oC to allow formation of ZrB2-30 vol% SiC composite in the form of porous mass. The heating schedule was identical to that used for synthesis of ZrB2 powder. The porous mass obtained after the reaction was crushed, ground and sieved through -325 mesh screen. The powder was characterized by XRD for phase composition. The powder was subsequently hot pressed under identical conditions to get the composite. The sintered composites prepared using first and second approaches are termed as ZS-M and ZS-R respectively.
The density of the hot-pressed blocks was measured by water displacement method. XRD
analysis has been carried out to confirm the phase stability and phase assemblage in the sintered composite. The microstructural features and distribution of phases have been investigated by SEM-EDS. Thermal diffusivity was measured using laser flash method (Linseis, Model LFA1000) from RT to 600oC. Thermal conductivity was calculated using the measured thermal diffusivity data and specific heat data obtained from literature. Linear thermal expansion was measured using thermomechanical analyser instrument (Setsys Evaluation, SETARAM) upto 900 oC.
results & discussions:
The XRD pattern of synthesized ZrB2 powder is shown in Fig. 1(a). All the peaks could be assigned to ZrB2 phase of hexagonal crystal structure (space group P6/mmm).
Fig 1: XRD patterns of (a) synthesized ZrB2 powder and (b) SiC powder
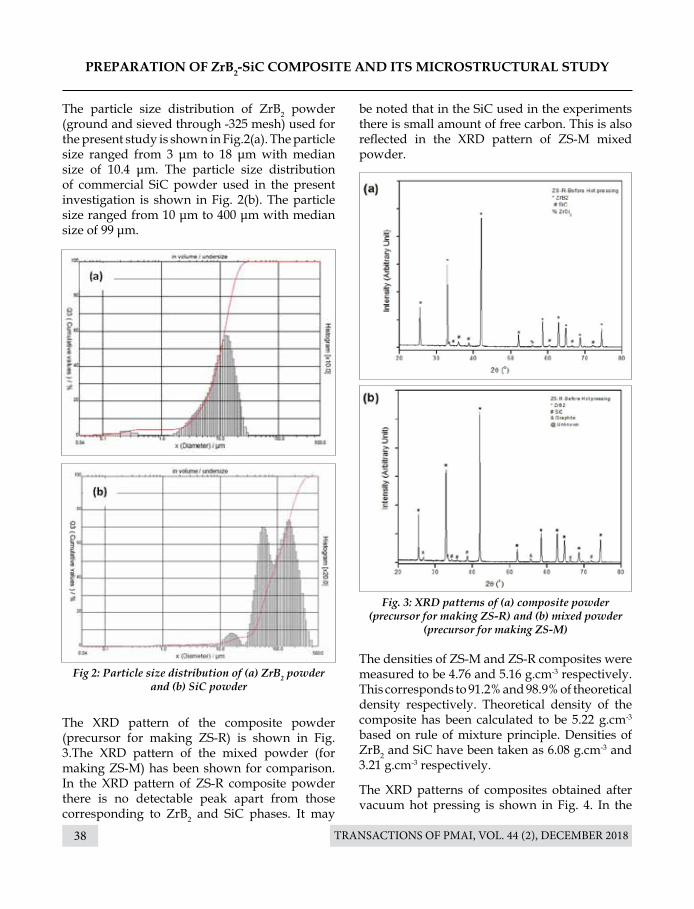
TRANSACTIONS OF PMAI, VOL. 44 (2), DECEMBER 201838
prEparation of Zrb2-sic compositE and its microstructural study
Fig 2: Particle size distribution of (a) ZrB2 powder and (b) SiC powder
Fig. 3: XRD patterns of (a) composite powder (precursor for making ZS-R) and (b) mixed powder
(precursor for making ZS-M)
The particle size distribution of ZrB2 powder (ground and sieved through -325 mesh) used for the present study is shown in Fig.2(a). The particle size ranged from 3 μm to 18 μm with median size of 10.4 μm. The particle size distribution of commercial SiC powder used in the present investigation is shown in Fig. 2(b). The particle size ranged from 10 μm to 400 μm with median size of 99 μm.
The XRD pattern of the composite powder (precursor for making ZS-R) is shown in Fig. 3.The XRD pattern of the mixed powder (for making ZS-M) has been shown for comparison. In the XRD pattern of ZS-R composite powder there is no detectable peak apart from those corresponding to ZrB2 and SiC phases. It may
be noted that in the SiC used in the experiments there is small amount of free carbon. This is also reflected in the XRD pattern of ZS-M mixed powder.
The densities of ZS-M and ZS-R composites were measured to be 4.76 and 5.16 g.cm-3 respectively. This corresponds to 91.2% and 98.9% of theoretical density respectively. Theoretical density of the composite has been calculated to be 5.22 g.cm-3 based on rule of mixture principle. Densities of ZrB2 and SiC have been taken as 6.08 g.cm-3 and 3.21 g.cm-3 respectively.
The XRD patterns of composites obtained after vacuum hot pressing is shown in Fig. 4. In the

TRANSACTIONS OF PMAI, VOL. 44 (2), DECEMBER 2018 39
prEparation of Zrb2-sic compositE and its microstructural study
ZS-M composite the peak corresponding to graphite is not present. This may be attributed to the consumption of free carbon in removal of surface oxide present in the SiC powder. Further, it is observed that intensity of SiC peak is more prominent in the sintered composite than that in the mixed powder. This indicates preferred orientation of particular planes in the composite. This may be due to rearrangement of SiC particles during hot pressing. In the ZS-R composite the peaks of SiC are not prominent as in the case of composite powder. However, small intensity graphite peak appears. This can form due to reaction between a non-stoichiometric boride phase and SiC as per the following reaction.
2ZrB + 2SiC = ZrB2 + ZrSi2 + 2C
The SEM micrographs (back scattered images) of ZrB2-SiC composites prepared by hot pressing are shown in Fig. 5. The light phase (grey phase) corresponds to ZrB2 and dark phase corresponds to SiC. Although the distribution of SiC phase is homogeneous in both the cases, in the ZS-M composite SiC particles are larger in size compared to that in ZS-R composite.
Fig. 4: XRD patterns of the hot pressed ZrB2-SiC composites (a) ZS-M and (b) ZS-R
Fig. 5: (a), (b) Back scattered image of ZS-R composites at 100× and 1000×

TRANSACTIONS OF PMAI, VOL. 44 (2), DECEMBER 201840
prEparation of Zrb2-sic compositE and its microstructural study
Thermal conductivity has been calculated from thermal diffusivity data using the relation:λ = α×cp ×ρwhere, α is the thermal diffusivity, cp is specific heat and ρ is the density of material. Specific heat data was taken from NIST data sheet.The thermal conductivity results are shown in Fig 6. Typical values at 25 and 600 oC are given in Table 1 along with the data of monolithic ZrB2 and SiC. ZS-R composite has been found to have more thermal conductivity in measured temperature range. This is primarily due to higher density of ZS-R composite. The thermal conductivity value is close to that of monolithic SiC.
Linear thermal expansion behavior of both ZS-M and ZS-R composites are shown in Fig. 7. Percent linear thermal expansion [(∆L/L0)×100) has been plotted as a function of temperature in the temperature range from 200 to 900oC. Data below 200 oC has not been shown as there was fluctuation in the measured data. Average coefficient of thermal expansion upto a certain temperature (T) can be calculated using the following relation.
where, ∆LT is the change in length (LT – L0), ∆T is the change in temperature (T-T0) and Lo is the length of the samples at ambient temperature (~25oC). Average thermal expansion coefficients have been calculated to be 7.1 × 10⁻⁶ and 7.2 × 10⁻⁶ for ZS-M and ZS-R composites respectively in the temperature range from ambient to 900oC . This reflects identical composition of composites made by two approaches.
Fig. 6: (a), (b) Back scattered image of ZS-M composites at 100× and 1000×
Table 1: Thermal conductivity data of ZS-M and ZS-R composites
Fig. 7: Thermal conductivity of ZS-M and ZS-R composites
Fig. 8: Percentage linear thermal expansion of ZS-M and ZS-R composites
Material
Thermal conductivity(W/mK)
Reference
At 25oC At 600oC
ZrB2 83.8 53 Ref
SiC 114 xxx Ref
ZS-R 114.0 77.9 Measured
ZS-M 100.7 67.1 Measured
∝ =∆LT
0. ∆TL

TRANSACTIONS OF PMAI, VOL. 44 (2), DECEMBER 2018 41
prEparation of Zrb2-sic compositE and its microstructural study
conclusions(i) Phase pure ZrB2 powder has been synthesized
by carbothermic route following a particular heating schedule to avoid / minimize loss of boron.
(ii) ZrB2-SiC composite prepared by hot pressing of reaction mixed powder at 1850oC resulted in near theoretical density.
(iii) ZrB2-SiC composite prepared using reaction mixed powders resulted in more homogeneous and fine distribution of SiC phase in host ZrB2 phase compared to composite prepared using conventionally mixed powder.
(iv) The dense ZrB2-SiC composite prepared using reaction mixed powder has high thermal conductivity. At 25oC and 600oC the thermal conductivity values are 114 and 77.9 W.m-1.K-1 respectively.
(v) Average coefficient of thermal expansion (CTE) is 7.2 × 10⁻⁶ K-1 in the temperature range from ambient to 900oC for the dense composite.
references1. Guo SQ, Journal of European ceramic society; Vol.29
(2009) 995-1011.2. Camberlain AL; Journal of American Ceramic society;
Vol.87 (2008) 1170-72.

TRANSACTIONS OF PMAI, VOL. 44 (2), DECEMBER 201842
a study on sintEring charactEristics and ElEctrical conductivity of yttria stabiliZEd
Zirconia cEramics synthEsiZEd by co-prEcipitation routE
Kaustubh Kambale*1, umesh Kedar1, amruta vairagade1, sandeep butee1
1 Department of Metallurgy and Materials Science, College of Engineering Pune (An Autonomous Institute of Government of Maharashtra), Wellesley Road, Shivaji Nagar, Pune - 411005
* Corresponding Author:- Email id: [email protected], [email protected]
introduction
Zirconium dioxide is one of the most studied ceramics. ZrO2 adopts a monoclinic crystal structure at room temperature and transitions to tetragonal and cubic at higher temperatures. The volume expansion caused by the cubic to tetragonal to monoclinic transformation induces large stresses, and these stresses cause ZrO2 to
Abstract - Yttria stabilized zirconia (YSZ) is a popular solid electrolyte for solid oxide fuel cells (SOFCs). It has been a popular belief that in order to employ YSZ as a solid electrolyte in SOFCs, full densification of YSZ is required. However, a recent study shows that even if a porous YSZ is used as an electrolyte, the output of an SOFC reduces by merely o.1 V. Taking this fact into the consideration, YSZ ceramics with yttria content varying from 10-30 wt% were synthesized by co-precipitation route and sintered at 1350 ºC so as to achieve partial densification of the ceramics. The electrical conductivity of such ceramics was studied using impedance spectroscopy and has been discussed in detail in the paper. YSZ powders were prepared by co-precipitation route using zirconium oxychloride octahydrate and yttria dissolved in water using concentrated nitric acid. Calcination temperature for the dried precipitates was decided using TG/DTA study. The calcination was carried out in the temperature range 750 - 800ºC resulting in formation of single phase cubic powder which was confirmed using X-ray diffraction (XRD) study. The calcined powders were cold compacted using polyvinyl alcohol (PVA) as a binder. Pressureless sintering of the pellets was carried out at 1350ºC for 4 hours. It was observed that density of the sintered pellets went on decreasing with increasing yttria content. SEM study of the sintered pellets also clearly revealed the presence of porosity in the samples. Electrical conductivity of the pellets was measured in the temperature range of 100 - 800ºC at an interval of 20ºC in the frequency range of 1 Hz to 1 MHz. The dc conductivity of the pellets was found out from the Jonscher plots. It was observed that total ionic conductivity of the pellets containing 20 and more wt% yttria was significantly lower than those containing lower concentration of yttria. However, it is worth noting that the YSZ ceramics with 10 and 15 wt% yttria still exhibited conductivity of the order of 1*10-3 S/cm despite being the porous ceramics. However, in order to use these ceramics for actual SOFC applications would still require evaluation and analysis of the mechanical and thermal properties apart from the knowledge of the desired level of electrical conductivity for a given SOFC.
Keywords: Co-precipitation, YSZ, Electrical Conductivity, SOFC
crack upon cooling from high temperatures. When the Zirconia is blended with some other oxides, the tetragonal and/or cubic phases are stabilized. Effective dopants include magnesium oxide (MgO), yttrium oxide (Y2O3, yttria), calcium oxide (CaO), and cerium(III) oxide (Ce2O3). Zirconium dioxide belongs to refractory, chemically resistant material and has wide application in the commercial production of technical

TRANSACTIONS OF PMAI, VOL. 44 (2), DECEMBER 2018 43
a study on sintEring charactEristics and ElEctrical conductivity of yttria stabiliZEd Zirconia cEramics synthEsiZEd by co-prEcipitation
routE
ceramics [1].The introduction of Solid Oxide Fuel Cells (SOFC) as an alternative electricity and heat generation system is contingent on the ability of the fuel cell material to consistently withstand the stresses of normal operating conditions. These include the thermal cycling that a fuel cell may undergo as well as the high temperature and high humidity that is associated with their operation. As with all engineering developments, the availability of appropriate material at the right cost and in the right quantity is an important consideration in developing viable manufacturing processes for delivering end user products. Zirconia based materials are good candidates for SOFC applications due to their ionic conductivity, stability in oxidizing and reducing atmospheres and low cost [1]. Zirconia-Yttria compositions have the ability to meet the necessary structural requirements with the potential of be mass-produced with the required quality. The processing techniques for materials of these compositions are already used to manufacture oxygen ion conducting parts and are well understood [2].
Yttria stabilized zirconia (YSZ) has been a popular choice as an electrolyte in SOFC and research articles available in the literature discuss the various methods of synthesis of YSZ powders via various routes and subsequently sintering these powders by different sintering techniques. Often these articles also correlate the electrical properties of sintered YSZ ceramics to the microstructure obtained as a result of powder processing. However, it has been a commonly observed phenomenon across the literature that the research community across the globe has always strived to obtain fully dense YSZ ceramics in order to use them as an electrolyte in SOFC[3]. However, Suzuki et al. demonstrated that even if a porous YSZ (23 ± 3 vol% open porosity) is used as an electrolyte in SOFC, the cell generated an open-circuit voltage of about 0.78 V which was only about 0.1 V lower than that observed with dense electrolyte specimens. Even though Suzuki et al. characterized the SOFC characteristics with
a great detail, their research article is silent on the electrical characterization of YSZ ceramics incorporated in SOFC. Moreover, the article has provided a little insight on the microstructural aspects of an electrolyte. However, they claimed that an SOFC designed with a porous electrolyte would open up the opportunities to design thermally and mechanically robust stacks by utilizing hydrocarbon fuels and would also allow the processing of cells at lower temperature using conventional techniques like screen printing since densification of the electrolyte would not be required. Despite being the novel idea, it has not been pursued in the scientific community for about a decade and thus, authors have fabricated porous YSZ ceramics using YSZ powders synthesized by co-precipitation route and studied the electrical properties of the porous YSZ ceramics [4].Since, it is a well-known phenomenon for YSZ ceramics that with the increase in Y2O3 content in ZrO2, the porosity of the ceramics increases; the Y2O3 content was increased from 10 to 30 mol% and the effect of it was studied on the electrical conductivity of YSZ ceramics. To the best of knowledge of authors, the study presented in this paper regarding the fabrication of porous YSZ ceramics and studying their electrical properties is quite unique and no such study has been reported earlier.
Experiment
Zirconium oxychloride octahydrate (ZrOCl2.8H2O: Sigma Aldrich) and yttria (Y2O3: Indian Rare Earths) were used as raw materials for the synthesis of YSZ powders.As discussed earlier the mol% of Y2O3 was varied from 10 mol% and 30 mol%. Nomenclature of the compositions is shown in Table 1. Fig. 1 shows the flow chart for the synthesis of YSZ powders by co - precipitation route. In order to decide the calcination temperature of the dried precipitate, simultaneous thermogravimetric analysis - differential thermal analysis was carried out. Fig. 2 shows the TGA curves for the various YSZ precipitates. It can be seen from the Fig. 2

TRANSACTIONS OF PMAI, VOL. 44 (2), DECEMBER 201844
a study on sintEring charactEristics and ElEctrical conductivity of yttria stabiliZEd Zirconia cEramics synthEsiZEd by co-prEcipitation
routE
that for each composition change in wt% of the precipitate became constant at around 700°C indicating complete removal of all the residual/volatile species from the precipitate. A sharp change in wt% in each of the precipitates around 250°C is attributed to removal of NH3 gas from the precipitate which was experienced by the authors at these temperatures due to characteristic pungent odor associated with NH3. Fig. 3 shows the DTA curves for the YSZ precipitates. It can be seen that for all the compositions DTA signals showed a characteristic hump at around 750°C which indicated the formation of a stable phase in the system. The TGA - DTA study formed the basis for deciding the calcination temperature of the YSZ precipitates which were calcined in a muffle furnace in the temperature range 750 - 800°C for 4 hours.
The calcined powder was weighted & mixed with few drops of 3% Poly-Vinyl Alcohol (PVA) in an agate mortar. Then green pellet was formed, with a diameter of 14 mm and about 2 mm thick, by uniaxial die compaction at a pressure of 3tons with dwell time 120secs to ensure relative uniform green density. The pellets were then sintered in a muffle furnace at temperatures 1250 - 1350°C for 4 hours.To identify the phase formed in the calcined powder, X- Ray Diffraction was carried out using X-Ray Diffractometer (PANalytical X-Ray Diffractometer) in the 2θ range of 10-90º. X-ray source was Cu- kα with the wavelength of 1.54 angstrom. Generator voltage and tube current were 40 kV and 40 mA respectively. Room temperature XRD data was collected with a step size of 0.099 and 176.25 second time per
Table 1 Nomenclature of YSZ powders synthesized by co - precipitation route
Fig. 1 Flow chart illustrating the synthesis of YSZ powders by co - precipitation route
Fig. 2 TGA curves for YSZ precipitates
Fig. 3 DTA curves for YSZ precipitates
Mol% Y2O3 Nomenclature
10 10 YSZ
15 15 YSZ
20 20 YSZ
25 25 YSZ
30 30 YSZ
1 molar solution of ZrOCl2.8H2O Dissolve Y2O3 in water using concentrated HNO3
Mixing the solutions by stirring for five minutes
Drop wise addition of ammonia solution with continuous stirring
ensuring that pH of 9 is maintained
Leaving the solution to precipitate
Decanting the solution to obtain the precipitate
Calcination at 750 - 800 °C
Repeating the process till the pH of solution becomes 7

TRANSACTIONS OF PMAI, VOL. 44 (2), DECEMBER 2018 45
a study on sintEring charactEristics and ElEctrical conductivity of yttria stabiliZEd Zirconia cEramics synthEsiZEd by co-prEcipitation
routE
step. X- Ray Diffraction data was also collected for sintered pellets to confirm that cubic phase is present in sintered pellets also. The bulk density of the sintered pellets was measured using Archimedes’ principle. The microstructure of the sintered pellets was studied using Scanning electron microscopy (SEM: Carl Zeiss, Sigma model) and the local elemental composition was studied using energy dispersive spectroscopy (EDS) attachment with SEM (Bruker detector). The electrical properties of the sintered pellets were studied using impedance spectroscopy (Novocontrol Alpha Dielectric Analyzer) in the frequency range of 1 Hz to 1 MHz and in the temperature range of 100 to 800°C at an interval of 20°C. The samples were electroded using Pt paste before they were they were put in the impedance spectroscope.
results and discussionStructural identification was carried out using X - Ray diffraction study. It was observed that for all the YSZ composition calcination in the temperature range 750 - 800°C resulted in the formation of cubic zirconia which was the desired phase from the electrical application point of view. Fig. 4 shows the XRD patterns of 10 YSZ powders calcined in the temperature range of 500 - 750°C for 4 hours. Cubic phase got formed in the powder which was recalcined at 750°C. Similar XRD study was carried out on the remaining samples. Table 2 shows the comparison of lattice parameters of synthesized YSZ powders with those of the theoretical lattice parameters. It can be seen that the lattice parameters of the synthesized powders were in good agreement with those of the theoretical lattice parameters. However, it is worth noting that for the compositions 20 - 30 YSZ, there was a lattice mismatch of about 2 -3 % in terms of lattice volume.The theoretical lattice parameters of various YSZ compositions were calculated as per the method devised by Ingel et al., who correlated the lattice parameter of YSZ to the mol% Y2O3 in unit cell. Following equation was used to calculate the lattice parameters [5].
Where, M represents mol fraction of Y2O3 and lattice parameter is in micro meter.
a = 0.2394 (0.221+0.018M)
100+M......Equation 1
Fig. 4 XRD patterns for 10 YSZ powders calcined at different temperatures
Table 2 Comparison of lattice parameters of calcined YSZ powder with standard values of lattice
parameters of YSZ powders
Composition Standard Actual % Change
10YSZ
a = 5.1402 Å 5.1059 Å 0.66
b = 5.1402 Å 5.1059 Å 0.66
c = 5.1402 Å 5.1059 Å 0.66
α = β = γ = 90º 89.364 º 0.70
V = 135.8126 Å 133.1119 Å 1.98
15YSZ
a = 5.1584 Å 5.1748 Å 0.31
b = 5.1584 Å 5.1748 Å 0.31
c = 5.1584 Å 5.1748 Å 0.31
α = β = γ = 90º 89.798º 0.22
V = 137.2603 Å 138.5736 0.95
20YSZ
a = 5.1766 Å 5.1290 Å 0.91
b = 5.1766 Å 5.1290 Å 0.91
c = 5.1766 Å 5.1290 Å 0.91
α = β = γ = 90º 89.401 º 0.66
V = 138.7183Å 134.9267 Å 2.73
25YSZ
a = 5.1947 Å 5.1467 Å 0.92
b = 5.1947 Å 5.1467 Å 0.92
c = 5.1947 Å 5.1467 Å 0.92
α = β = γ = 90º 92.047º 2.27
V = 140.1785 Å 136.3284 Å 2.74
30YSZ
a = 5.2128 Å 5.1665 Å 0.88
b = 5.2128 Å 5.1665 Å 0.88
c = 5.2128 Å 5.1665 Å 0.88
α = β = γ = 90º 89.567º 0.48
V = 141.6488 Å 137.9079 Å 2.64

TRANSACTIONS OF PMAI, VOL. 44 (2), DECEMBER 201846
a study on sintEring charactEristics and ElEctrical conductivity of yttria stabiliZEd Zirconia cEramics synthEsiZEd by co-prEcipitation
routE
Relative density of the pellets was measured using Archimedes’ principle. In order to calculate the theoretical density of the pellet, following formula devised by Ingel et al. was used.
Fig. 6 (a) – (e) shows SEM images of fractured surfaces of YSZ ceramics sintered at 1350°C for 4 hours. Porosity is clearly visible in all the pellets indicating partial sintering of these pellets. In order to study the local elemental composition of sintered YSZ ceramics, energy dispersive spectroscopy was carried out using EDS attachment as mentioned earlier. A typical energy dispersion spectrum is shown in Fig. 7 depicting the elemental spectrum for 10 YSZ composition. Table 3 shows observed elemental composition of sintered YSZ ceramics. This table also shows the theoretical elemental composition of each ceramic deduced from the formula unit. It can be seen that the theoretical mol percentage and observed mol percentage of different elements of YSZ pellets are nearly same. This can be attributed to co-precipitation method which is most suitable method for obtaining the homogeneity in composition which cannot be obtained by any other method easily.
Where, a is a lattice parameter and M is the mole fraction of Y2O3.Fig. 5 shows the graph of relative density of YSZ ceramics sintered at 1350°C as a function of Y2O3 content. It can be seen that the relative density of the pellets decreased as a function of Y2O3 content. Such kind of dependence of relative density on Y2O3 would be expected since with increase in Y2O3 concentration there is an increase in vacancy concentration owing to difference in the valence states between Zr4+ and Y3+ ions and would cause change in the packing of ions as proposed by Aleksondrov et al [6].Since, Suzuki et al. had maintained the porosity of the order of 23 ± 3 vol% in the solid electrolytes in their experiment it was attempted to maintain the porosity in the similar range in our experiment as well especially in case of 20, 25 and 30 YSZ ceramics. In order to improve the densification of these ceramics they were sintered at 1350°C for 6 hours which resulted in increase in their relative density to 74.30, 73.61 and 71.27% respectively bringing them in the comparable densification limit mentioned by Suzuki et al.
Fig. 5 Relative density of sintered YSZ ceramics as a function of Y2O3 concentration
Fig. 6 SEM images of fractured surfaces of (a) 10 YSZ (b) 15 YSZ (c) 20 YSZ (d) 25 YSZ (e) 30 YSZ sintered at
1350 °C for 4 hours
ρ = (818.435 - 137.023M
100+M)(
1
a 3)...... Equation 2

TRANSACTIONS OF PMAI, VOL. 44 (2), DECEMBER 2018 47
a study on sintEring charactEristics and ElEctrical conductivity of yttria stabiliZEd Zirconia cEramics synthEsiZEd by co-prEcipitation
routE
Fig. 7 A typical energy dispersion spectrum for 10 YSZ ceramic
Table 3 Comparison of elemental composition of 10 – 30 YSZ ceramics detected through EDS study
Fig. 8 Electrical (ionic) conductivity of 10 YSZ ceramics as a function of temperature at various
frequencies
Sr. No. Composition Atom%
Element
Zr Y O
1 10YSZTheoretical 28.13 6.25 65.25
Observed 29.69 6.29 64.02
2 15YSZ25.75 9.9 65.15
26.19 13.28 60.53
3 20YSZ23.53 11.77 64.70
23.83 9.84 66.33
4 25YSZ21.43 21.43 57.14
23.15 15.77 61.07
5 30YSZ19.49 16.67 63.84
18.41 15.55 66.04
Theoretical
Observed
Theoretical
Observed
Theoretical
Observed
Theoretical
Observed
The electrical conductivity of sintered YSZ ceramics was obtained by carrying out impedance spectroscopy analysis. Fig. 8 shows the electrical conductivity (ionic conductivity) of 10 YSZ ceramics as a function of temperature at various frequencies. It is very clear that at all frequencies the ionic conductivity increased as a function of temperature which can be attributed to formation of more oxygen vacancies with increase in temperature. In order to use the
material as a solid electrolyte it is indeed needed to understand the dc conductivity of it. In order to obtain the dc conductivity of 10 YSZ ceramics, ac electrical conductivity was plotted as a function of frequency at different temperatures. The conductivity was fitted using Jonscher’s universal power law given as follows.
Here, σ0 represents the dc electrical conductivity, ω represents the angular frequency of the electric field, A is pre-exponential constant and n is the power law exponent. In this way, dc electrical conductivity at various temperatures was obtained. A representative curve of electrical conductivity as a function of frequency at 400°C is shown in Fig. 9. It can be seen that up to the frequency of about 103 Hz the electrical conductivity is almost independent of the frequency of the applied electric field which represents the dc part of the conduction whereas beyond the frequency of 103Hz electrical conductivity increased as a function of frequency due to hopping of ions. Table 4 shows the values of dc conductivity calculated in the manner explained above over a temperature range of 300 - 800 °C.
σ = σ0 + Aωn ......Equation 3

TRANSACTIONS OF PMAI, VOL. 44 (2), DECEMBER 201848
a study on sintEring charactEristics and ElEctrical conductivity of yttria stabiliZEd Zirconia cEramics synthEsiZEd by co-prEcipitation
routE
Fig. 9 Electrical (Ionic) Conductivity of 10 YSZ ceramics as a function of frequency fitted using
Jonscher’s universal power law
Table 4 DC conductivity and parameters needed for calculation of activation energy of 10 YSZ ceramics
It can be seen from the above table that various parameters like σT, ln (σT) and 1000/T have been listed. These parameters were useful in determining the activation energy for conduction in YSZ ceramics by Arrhenius equation as given below.
Where, σ = Conductivity (S/cm)T = Temperature (K)Ea = Activation energy (ev)
Temperature (⁰C)
Temperature (K)
DC conductivity (S/cm)
σT (Scm -1K) ln (σT) 1000/T (1/K)
300
360
400
460
500
560
600
650
700
750
800
573
623
673
723
773
823
873
923
973
1023
1073
7.40380E-08
5.80522E-07
1.93425E-06
1.01647E-05
2.60891E-05
7.78733E-05
3.10574E-04
4.57E-04
7.13E-04
9.17E-04
1.12E-03
4.24238E-05
0.000361665
0.00130175
0.007349078
0.020166874
0.064089726
0.271131102
0.421811
0.693749
0.938091
1.20176
-10.067
-7.924
-6.644
-4.913
-3.903
-2.747
-1.305
-0.863
-0.365
-0.0639
0.183
1.745201
1.605136
1.485884
1.383126
1.293661
1.215067
1.145475
1.083424
1.027749
0.977517
0.931966
σ = (σ0/T) exp (-Ea/kBT) ...... Equation 4
kB = Boltzmann constantFig. 10 shows Arrhenius plot for determining the activation energy of conduction of 10 YSZ ceramics. The slope of the plot was calculated using Origin Pro8 software and then using the equation 4, the slope = (Ea/0.0862). This calculation yielded the activation energy of 1.26 ev for 10 YSZ ceramics. Similar exercise was repeated for 15 YSZ ceramic resulting in the activation energy of 1.22 eV. However, for the remaining compositions, Arrhenius equation could not be fitted owing to large divergence in dc conductivity values over a range of temperature. This can be attributed to the formation of (Y’ZrVÖ) and (2Y’ZrVÖ)x species with increase in Y2O3 concentration which act as the trapping centres for oxygen vacancies resulting in a fraction of oxygen species contributing to overall conduction process [5].Fig. 11 shows the dc conductivity of YSZ ceramics at 800°C, the temperature at which typically SOFCs are operated, as a function of Y2O3 concentration. It was observed that 10 and 15 YSZ ceramics exhibited the electrical conductivity values of the order of 1.2*10-3 S/cm. However, further increase in Y2O3 concentration resulted in decrease in the dc conductivity which again can be attributed to formation of (Y’ZrVÖ) and (2Y’ZrVÖ)x [5].While comparing the electrical conductivity values obtained in this research with the values reported in the literature it was observed that the electrical conductivity values reported even for 10 and 15 YSZ ceramics were lesser than those reported in the literature which can be attributed to lesser extent of densification of YSZ ceramics in this research [7-11].However, it was also observed that in many research articles found out in the literature the electrical conductivity has been measured over a limited range of temperature, generally less than 500°C and thus, electrical conductivity values could not be compared meaningfully [12-14].

TRANSACTIONS OF PMAI, VOL. 44 (2), DECEMBER 2018 49
Fig. 10 Arrhenius plot for determining the activation energy of conduction of 10 YSZ ceramics
Fig. 11 DC conductivity of YSZ ceramics at 800°C as a function of Y2O3 concentration
a study on sintEring charactEristics and ElEctrical conductivity of yttria stabiliZEd Zirconia cEramics synthEsiZEd by co-prEcipitation
routE
conclusionsThis work was inspired by the work of Suzuki et al. reported in the literature wherein they had reported that the open circuit voltage of SOFC employing partially sintered YSZ electrolytes was just 0.1 V lesser than that observed with fully dense electrolytes. Since, the idea of fabricating partially sintered electrolytes has not been well researched, partially sintered YSZ ceramics with
mol% of Y2O3 varying between 10 to 30 were fabricated and their electrical conductivity was studied. YSZ powders were prepared using co - precipitation route using zirconium oxychloride octahydrate (ZrOCl2.8H2O) and yttria as starting materials. The calcination of the precipitates was carried out in between 750 - 800°C based on extensive TGA and DTA study which resulted in formation of cubic phase in each of the compositions. Since, sintering was carried out at 1350°C for 4 - 6 hours, only 73 - 76% of densification could be achieved which was almost matching the densification level maintained by Suzuki et al. in their work. Scanning electron microscopy confirmed the presence of significant porosity in the sintered ceramics. EDS attachment on SEM was used to detect the local elemental composition of YSZ ceramics which was in good agreement with the theoretical concentration of each of the elements in YSZ compositions which can be attributed to a good atomic control achievable through co - precipitation route. The dc electrical conductivity of YSZ ceramics was found from impedance spectroscopy data wherein the electrical conductivity was plotted as a function of frequency at different temperatures using Jonscher’s universal power law. It was observed that 10 and 15 YSZ ceramics exhibited the electrical conductivity values of the order of 1.2*10-3 S/cm. However, further increase in Y2O3 concentration resulted in decrease in the dc conductivity which again can be attributed to formation of (Y’ZrVÖ) and (2Y’ZrVÖ)x concentration which act as the trapping centres for oxygen vacancies resulting in a fraction of oxygen species contributing to overall conduction process. Since, 10 and 15 YSZ ceramics exhibited the conductivity of the order of 1.2*10-3 S/cm at 800°C, they still can be considered as ionic conductors with lower than the normal density. It is claimed that an SOFC designed with a porous electrolyte would open up the opportunities to design thermally and mechanically robust stacks by utilizing hydrocarbon fuels and would also allow the processing of cells at lower temperature using conventional techniques like screen printing

TRANSACTIONS OF PMAI, VOL. 44 (2), DECEMBER 201850
a study on sintEring charactEristics and ElEctrical conductivity of yttria stabiliZEd Zirconia cEramics synthEsiZEd by co-prEcipitation
routE
since densification of the electrolyte would not be required. However, it is required to be understand that whether the sintering techniques like slip casting, extrusion, dry pressing, gel casting etc. which can also be used for fabricating partially sintered ceramics would be useful in making these solid electrolytes. Moreover, the effect of porous structure of solid electrolytes on the thermal, mechanical and more importantly on the overall cell characteristics need to be understood thoroughly before such porous solid electrolytes are put into the application.acknowledgementAuthors acknowledge Prof. A.R. Kulkarni, Department of Metallurgical Engineering and Materials Science, Indian Institute of Technology Bombay for providing the impedance spectroscopy facility.references:1. G.R. Karagedov, E.G. Avvakumov; Low temperature
synthesis of ZrO2-8 mol.% Y2O3 nanopellet with high sinterability; Science of Sintering (2010); vol.42; pp.239-245.
2. A.G. Mawson, G.A. Carter, R.D. Hart, N.M. Kirby, A.C. Nachmann; Mechanical properties of 8 mole% yttria stabilized zirconia for solid oxide fuel cells; Materials Forum (2006); vol.30.
3. H. G. Scott; Phase relationships in the zirconia-yttria system; Journal of Material Science (1975); vol.10; pp.1527-1535.
4. Toshio Suzuki, Piotr Jasinski, Vladimir Petrovsky, Harlan U. Anderson, Fatih Dogan; Performance of a Porous Electrolyte in Single-Chamber SOFCs; Journal of The Electrochemical Society (2005), pp.527-531
5. R.P. Ingel, D. Lewis III; Lattice Parameters and Density for Y203- Stabilized Zr02; J. Am. Cerarn. Soc. (1986), 69 [4] pp. 325-32.
6. I4V. I. Aleksandrov, V. F. Kitaeva, V. V. Osiko, N. N. Sobolev, V. M. Tatrintsev,and I. L. Chistyi, “Dependence of the Properties of a Single Crystal of the Solid Solution Zr02-Y20, on the Y20, Concentration,” Kratk. Soobsh. Fiz.(1975), [3] pp 21-27.
7. Jianghong Gonga, Ying Li, Zilong Tang, Yusheng Xie, Zhongtai Zhang; Temperature-dependence of the lattice conductivity of mixed calcia/yttria-stabilized
zirconia; Materials Chemistry and Physics 76 (2002), pp. 212–216.
8. Fang Zhao, Ying Li, Jianghong Gong, Mingshuai Liu, Yunfa Chen; Effect of CaF2 on the electrical properties of yttria-stabilized zirconia; Materials Letters 58 (2004), pp. 394– 396.
9. Zhengang L, Ruisong Guo, Pei Yao, Fengying Da; Effects of Al2O3 and/or CaO on properties of yttria stabilized zirconia electrolyte doped with multi-elements; Materials and Design 28 (2007), pp. 1399–1403.
10. Ya-Zhe Xing, Cheng-Xin Li, Chang-Jiu Li, Hui-Guo Long, Ying-Xin Xie; Microstructure development of plasma-sprayed yttria-stabilized zirconia and its effect on electrical conductivity; Solid State Ionics 179 (2008), pp. 1483–1485.
11. Prasanta K. Ojha, S.K. Rath, T.K. Chongdar, A.R. Kulkarni; Nanocrystalline yttria stabilized zirconia by metal–PVA complexation; Ceramics International 36 (2010), pp. 561–566.
12. X.J. Chen, K.A. Khor, S.H. Chan, L.G. Yu; Influence of microstructure on the ionic conductivity of yttria-stabilized zirconia electrolyte; Materials Science and Engineering (2002); pp. 246–252.
13. Vladimir V. Srdic, Radovan P. Omorjan; Electrical conductivity of sol–gel derived yttria-stabilized zirconia; Ceramics International 27 (2001); pp. 859–863.
14. J. Khare, M.P.Joshi, S.Satapathy, H.Srivastava, L.M.Kukreja; Impedance spectroscopy of pellets made from yttria stabilized zirconia nanoparticles generated via CW and pulsed mode of laser vaporization method; Ceramics International; Article in Press (DOI:

TRANSACTIONS OF PMAI, VOL. 44 (2), DECEMBER 2018 51
combustion synthEsis of nanocrystallinE lithium ZirconatE
biranchi tripathi 1,3, deep prakash 1,3, avesh Kumar tyagi 2,3, pankaj Kumar sinha 1
1 Powder Metallurgy Division, Bhabha Atomic Research Centre, Vashi Complex, Navi Mumbai, INDIA2 Chemistry Division, Bhabha Atomic Research Centre,Trombay, Mumbai-400085, INDIA
3 Homi Bhabha National Institute, Anushaktinagar, Mumbai-400094, INDIA
1. introduction:
Lithium containing ceramics such as Li2O, Li4SiO4, LiAlO2, Li2ZrO3 and Li2TiO3 have been considered as candidate solid blanket materials for tritium breeding in nuclear fusion reactor. Among them, Li2ZrO3 is one of the promising materials for tritium breeding. Breeder materials are used in the form of small sintered pebbles having density ~90% of theoretical density and appropriate microstructure for facile release of tritium from pebbles[1–2]. Generally, nanocrystalline materials exhibit enhanced sinterabiliy than bulk counterpart due to increased grain boundary volume fraction as the particle and crystallite sizes are reduced to nanometer regime [3-4]. Therefore nanocrystalline Li2ZrO3 can be compacted and sintered to high densities at a relatively low sintering temperature and short sintering time in order to have desired microstructure.
During the last years, many efforts have been aimed at the synthesis of Li2ZrO3 powders, such
Abstract - Lithium zirconate (Li2ZrO3) is considered as candidate solid blanket material for tritium breeding in Fusion Nuclear Reactor. In the present paper, a single phase nanocrystalline Li2ZrO3 powder has been synthesized through a facile solution combustion route using glycine as fuel and corresponding nitrates as oxidants. Thermodynamic analysis of combustion reaction shows that increase in fuel-to-oxidiser ratio, results in increase of the adiabatic flame temperature during combustion. The Li2ZrO3 powder was synthesized by using various fuel to oxidizer ratios (F/O). The powders were characterized by X-ray diffraction XRD, Scanning electron microscope (SEM) and Particle size analysis. The XRD patterns of as synthesized powders exhibit the presence of tetragonal and monoclinic phases. Presence of unreacted phases was not observed at least within the detection limit of XRD. The crystallite size of Li2ZrO3 was estimated for different F/O. Particle size of Li2ZrO3 powder measured by laser diffraction. It was found that crystallite size and morphology of Li2ZrO3 powder can be controlled by adjusting F/O ratio.
Keywords: Fusion, Lithium Zirconate
as solid state reaction, sol–gel, hydrothermal and solution combustion synthesis (SCS). SCS is an attractive method to synthesize highly pure and well-crystallized oxide, mixed oxide and composite powders. Low initial temperature, a rapid heating rate, short reaction time, simple equipment and inexpensive raw materials are advantages of SCS. In SCS, the phase and morphology of products can be controlled by fuel types, fuel-to-oxidizer ratio (f) and combustion mode. The combustion modes are usually classified into volume combustion synthesis (VCS) and self-propagating high- temperature synthesis (SHS). Smolder-SHS, as one type of SHS, is characterized by slow reaction rate and essentially flame-less reaction with the lowest maximum temperature. Recently, an eruption combustion mode for the synthesis of nanoparticles was reported [5-6]. This phenomenon is very similar to the volcano eruption nature. Powders produced by this strategy have small particle size, good

TRANSACTIONS OF PMAI, VOL. 44 (2), DECEMBER 201852
combustion synthEsis of nanocrystallinE lithium ZirconatE
dispersity and high specific surface area. Glycine is a promising fuel in SCS to synthesize nanoscale oxide powders. Moreover, it also acts as a preferable complexant for metal ions in producing a transparent precursor avoiding precipitation. The broad objective of present work includes synthesis of nanocrystalline Li2ZrO3 powder, characterization and evaluation of its sintering behavior. In the present paper, effort has been made to synthesize nanocrystalline Li2ZrO3 powder by SCS using glycine as fuel. Fuel-to-oxidizer ratio was varied during synthesis to study its effect on powder characteristics. The resulting powder was characterized by different techniques.
2. Experimental:All reagents were of analytical grade and used as received without further purifications. Deionized water was used throughout the experiments. Zirconium oxynitrate (Zr(ONO3)2, 98%) and lithium nitrate (LiNO3, AR) were used as precursors for zirconium and lithium respectively. Glycine (C2H5NO2, 99%) was added as the fuel. For synthesis, stoichiometric quantity of LiNO3 and Zr(ONO3)2 was added into deionized water to obtain a clear solution. Then required amount of aqueous solution of glycine was added to the solution to form precursor solution to maintain desired fuel-to-oxidizer ratio. The transparent solution was transferred to a preheated hot plate maintained at 900C and heated. When solution becomes viscous the temperature of hot plate was increased to ~2000C. Within a few minutes, the solution boiled and was ignited to produce a self-propagating combustion, yielding fluffy Li2ZrO3 powders.Phase of Li2ZrO3 powder was characterized by X-ray diffractometer purchased from Inel, France. Particle size was measured by Laser diffraction particle size analyzer purchased from CILAS, France.
3. results and discussion3.1 thermodynamic analysis of combustion reaction
The adiabatic heat produced as well as the amount of gases generated during SCS was calculated based on combustion reaction expressed as below:
2LiNO3+ ZrO(NO3)2+ 2.22fC2H5NO2+ 5(f − 1)O2 → Li2ZrO3+ 4.44fCO2+ (2+1.11f)N2+ 5.55fH2O
In the above reaction, fuel-to-oxidizer ratio (F/O), f = 1 means that the initial mixture solution does not require atmospheric oxygen for a complete oxidation of fuel, while f > 1 (<1) implies fuel-rich (lean) condition. The excess fuel in the fuel-rich (f > 1) system is oxidized by the atmospheric oxygen. In our experiment, four fuel-to-oxidizer ratios, f = 0.25, 0.5, 0.75, 1.0, 1.25, were selected to investigate the effect of f on the phase and SCS process.
The combustion was assumed to be complete, and the combustible excess was burned by atmospheric oxygen. Heat loss by radiation or conduction was ignored. The adiabatic heat of each fuel-to-oxidizer system was approximately calculated by the procedure described elsewhere [7].
Greater adiabatic heat implies higher temperature of the reaction system. As shown in Fig. 1, adiabatic heat and therefore temperature of reaction system rises with fuel-to-oxidizer ratio. On the other hand, the gases generated in the combustion process affect the temperature
Fig. 1. Variation of adiabatic heat with fuel-to-oxidizer ratio

TRANSACTIONS OF PMAI, VOL. 44 (2), DECEMBER 2018 53
combustion synthEsis of nanocrystallinE lithium ZirconatE
Fig.2. Amount of gases released versus fuel-to-oxidizer ratio
Fig. 3. XRD pattern of Li2ZrO3 for different fuel-to-oxidizer ratio
Fig.4. Crystallite size versus fuel-to-oxidizer ratio
to a large extent, because lots of heat would be taken away by the gas flow. As shown in Fig. 2, the amounts of gases increase with the f rising. According to the above reasons, the actual temperature of the reaction system is compromise between total adiabatic heat generated and total heat carried away by the gases released which in turn affect the morphology of synthesized Li2ZrO3 powders.
3.2 powder characteristics Fig. 3 shows the XRD patterns of as-synthesized powders at different f. The XRD pattern shows peaks that are in good agreement with monoclinic and tetragonal phases of Li2ZrO3 as registered in the Joint Committee on the Powder Diffraction Strands Card (JCPDS Card No. 033-0843and 041-0324). It is evident that mixture of monoclinic and tetragonal phases of Li2ZrO3 powders were produced for all f values selected for synthesis. It may be noted that no XRD peak resembling any of the unreacted component is observed in XRD pattern of Li2ZrO3. Therefore, it may be concluded that Li2ZrO3 as synthesized is phase pure at least within the detection limit of the XRD. The average crystallite size was calculated from measured broadening expressed in terms of full width at half maximum (FWHM) of three reflections using Scherrer equation.Scherrer equation: D(nm) = (0.9 λ)/(β cosθ )
Where, D is crystallite size in nm, λ is wavelength of X-ray used, β is FWHM and θ is peak position.
The measured FWHM was corrected for contribution from instrumental broadening and strain in powder. For this, as synthesized Li2ZrO3 powder was annealed at 12000C for 12h, thereby coarsening and releasing strain of powder. Subsequently, FWHM was measured from XRD pattern of annealed sample and used for correcting instrumental broadening and strain.

TRANSACTIONS OF PMAI, VOL. 44 (2), DECEMBER 201854
combustion synthEsis of nanocrystallinE lithium ZirconatE
Fig.5. Particle size versus fuel-to-oxidizer ratio
Fig.6. SEM micrograph of Li2ZrO3 synthesized at F/O; 0.5
Fig. 4 shows that crystallite size varies with fuel-to-oxidizer ratio. This is due to variation in adiabatic temperature, gases released and mode of combustion with fuel-to-oxidizer ratio. The crystallite size can be tuned by varying fuel-to-oxidizer ratio. The variation of particle size with fuel-to-oxidizer ratio is shown in Fig. 5. It is significant to note here that particle size is larger than the crystallite size which shows agglomeration of fine Li2ZrO3 particles. Also, the degree of powder agglomeration depends on fuel-to-oxidizer ratio as shown in Fig.5.
The agglomeration of fine Li2ZrO3 particles is also evident from SEM micrograph of Li2ZrO3 synthesized at F/O equal to 0.5 as shown in Fig.6. At this juncture it is worth to mention that desired powder morphology of Li2ZrO3 can be tailored by adjusting fuel-to-oxidizer ratio and thereby enhancing the sinterability of Li2ZrO3 powder.
4. conclusion
Well crystalline, phase pure and nanosize Li2ZrO3 powders could be synthesized in a single step via solution combustion using glycine as the fuel. It is found that the fuel-to-oxidizer ratio (f) has significantly influenced the combustion mode and microstruc- ture of the synthesized powders. Thermodynamic analysis of the combustion reaction shows that as the fuel-to-oxidizer ratio increases, the amount of gases produced and adiabatic flame temperatures during combustion also increase. The actual temperature of reaction system depends on synergistic effect of adiabatic heat and cooling due to release of gases which in turn affects the powder properties. The powder of desired morphology can be obtained by adjusting fuel-to-oxidizer ratio and therefore sinterability of Li2ZrO3 powder can be enhanced. Further work is underway to study the sinterability of Li2ZrO3 powder synthesized at varying fuel-to-oxidizer ratios.
4. reference
[1] Raffray, a.R ., Akiba, M., Chuyanov, V., Giancarli, L., & Malang, S. (2002). Breeding blanket concepts for fusion and materials requirements. Journal of Nuclear Materials, 307-311, 21–30.
[2] Roux, N., Johnson, C., & Noda, K. (1992). Properties and performance of tritium breeding ceramics. Journal of Nuclear Materials, 191-194, 15–22.
[3] Novikov, V. Y. (2014). Impact of grain size on grain growth in nanomaterials. Materials Letters, 132, 45–47.
[4] Datta, M. S., Bandyopadhyay, a. K., & Chaudhuri, B. (2002). Sintering of nanocrystalline α silicon carbide by doping with boron carbide. Bulletin of Materials Science, 25(3), 181–189.

TRANSACTIONS OF PMAI, VOL. 44 (2), DECEMBER 2018 55
combustion synthEsis of nanocrystallinE lithium ZirconatE
[5] Xiao, Q., Tang, X., Liu, Y., Zhong, Y., & Zhu, W. (2011). Citrate route to prepare K-doped Li2ZrO3 sorbents with excellent CO2 capture properties. Chemical Engineering Journal, 174(1), 231–235.
[6] Purohit, R.D ., Sharma, B. P., Pillai, K.T ., & Tyagi, A.K. (2001). Ultrafine ceria powders via glycine-nitrate combustion. Materials Research Bulletin, 36 (15), 2711–2721.
[7] Zhou, Q., Mou, Y., Ma, X., Xue, L., & Yan, Y. (2014). Effect of fuel-to-oxidizer ratios on combustion mode and microstructure of Li2TiO3 nanoscale powders. Journal of the European Ceramic Society, 34 (3), 801–807.