Trans fat in Indian food supply: From production to consum ...
36
Trans fat in Indian food supply: From production to consumption -A Case study from North India Dr Suparna Ghosh-Jerath Associate Professor Indian Institute of Public Health-Delhi Public Health Foundation of India
Transcript of Trans fat in Indian food supply: From production to consum ...

Trans fat in Indian food supply: From production to consumption -A Case study from North India
Dr Suparna Ghosh-Jerath
Associate Professor
Indian Institute of Public Health-Delhi
Public Health Foundation of India

Outline
• Trans fat regulation in India
• Complexities of regulating trans fat in India
• At manufacturer level: Industry perspective
• At Retailer level : Vendor Perspective
• At consumer level: Consumption pattern of the community

Introduction • Consumption of industrially produced trans-fatty acids (trans fat) increases the
risk of cardiovascular and other non-communicable diseases (NCD)(Micha &
Mozaffarian, Prostaglandins Leukot Essent Fatty Acids 2008; Teegala et al, J AOAC Int 2009; Mozaffarian & Clarke,Eur J Clin Nutr 2009)
• The WHO recommends that trans fat intakes should be limited to less than 1% of total energy intake and has called for the elimination of trans fats from the global food supply (Uauy et al. Eur J Clin Nutr 2009;WHO 2004)
• Some high-income countries have mandated trans fat labelling, promoted public education campaigns and legislated an upper limit of trans fat in food products (Perez-Ferrer et al. Health Policy Plan 2010)
• In India, the main source of trans fat is vanaspati, a form of vegetable ghee that is a Partially Hydrogenated Vegetable Oil (PHVO). (Ghafoorunissa, Asia Pac J Clin Nutr
2008; Coombes R, BMJ 2011; LA e et al, Eur J Clin Nutr 2009)

Introduction
• Although the quantity of trans fat present in vanaspati depends on the brand, a Food Safety and Standards Authority of India (FSSAI) report suggests that levels could be as high as 50–60% of total fat content (Food Safety and Standard Authority of India (FSSAI ,2010)
• In November 2009, the FSSAI proposed a regulation that included an upper limit of 10% trans fat in PHVO such as vanaspati, to be further reduced to 5% over three years. In addition, the regulation included mandatory labelling of both saturated and trans fat
• In November 2014, the regulation further reduced upper limit to 5% trans fat in PHVOs. The same was to be enforced by August 2016

Studies conducted ….. • Downs SM, Thow AM, Ghosh-Jerath S, McNab J, Reddy KS, Leeder SR. From Denmark to Delhi: Regulating trans fat in India. Public Health Nutr
2012;16(12):2273-2280. DOI: http://dx.doi.org/10.1017/S1368980012004995 (ISSN: 1368-9800, Impact factor : 2.25)
• Downs SM, Gupta V, Ghosh-Jerath S, Lock K, Thow AM, Singh A. Reformulating partially hydrogenated vegetable oils to maximise health gains in India: is it feasible and will it meet consumer demand? BMC Public Health. 2013; 13:1139 doi:10.1186/1471-2458-13-1139 (Impact factor 2.08)
• Downs SM, Thow AM, Ghosh-Jerath S, Leeder SR , The feasi ility of multisectoral policy options aimed at reducing trans fats and encouraging its repla e e t ith healthier oils i I dia Health Policy and Planning 2014;1–11d ;doi:10.1093/heapol/czu031, Impact factor: 3.056 in 2012)
• Downs SM, Thow AM, Ghosh-Jerath S, Leeder SR. Developing Interventions to Reduce Consumption of Unhealthy Fat in the Food Retail Environment: A Case Study of India. Journal of Hunger & Environmental Nutrition, 2014;9:2,210-229, DOI:10.1080/19320248.2014.908452. (online ISSN: 1932-0256 print ISSN: 1932-0248)
• Downs SM, Thow AM, Ghosh-Jerath S, Leeder SR. Aligning food-processing policies to promote healthier fat consumption in India. Health Promotion International 2014; doi: 10.1093/heapro/dat094. (Online ISSN 1460-2245 - Print ISSN 0957-4824 Impact factor: 1.377)
• Downs SM, Singh A, Gupta V, Lock K and Ghosh-Jerath S. The need for multisectoral food chain approaches to reduce trans fat consumption in India. BMC Public Health 2015, 15:693 OI 10.1186/s12889-015-1988-7
• Singh A, Gupta V, Ghosh A, Lock K, Ghosh-Jerath S. Quantitative estimates of dietary intake with special emphasis on snacking pattern and nutritional status of free living adults in urban slums of Delhi: Impact of nutrition transition. BMC Nutrition.2015, 1:22 DOI: 10.1186/s40795-015-0018-6
• Downs SM, Thow AM, Ghosh-Jerath S, Leeder SR. Identifying the Barriers and Opportunities for Enhanced Coherence between Agriculture and Public Health Policies: Improving the Fat Supply in India, Ecology of Food and Nutrition 2015; DOI:10.1080/03670244.2015.1017759 (ISSN: 0367-0244 (Print), 1543-5237 (Online), Impact factor 0.78)
• Downs SM, Singh A, Gupta V, Lock K and Ghosh-Jerath S Unhealthy fat in street and snack foods in low socioeconomic settings in India: A case study of the food environments of rural villages and an urban slum. Accpeted for publication in Journal of Nutrition Education and Behavior

Areas of enquiry
• At manufacturer level: Complexities of regulating trans fat in India (Qualitative studies)
• The policy processes involved and the perceived implementation challenges
• The industry perspective on feasibility of reformulating PHVOs
• Policy options
• At retailer level: Ve dor s practices and perceptions, analysis of trans fat content of food samples (Quantitative study)
• Consumer level: Community consumption pattern and awareness (Quantitative studies)

At manufacturer level: Complexities of regulating trans fat in India
• Semi-structured interviews with key informants from various sectors
• Agriculture
• Trade
• Finance
• Industry manufacturing Vanaspati
• Food standards
• Non-governmental organisations (NGOs), including one organisation representing the unorganised retail sector
• Health professionals

Key areas for interviews
• Sources of trans fat in the food supply
• Existing policies that may influence trans fat
• Any perceived challenges related to the proposed trans fat regulation
• Technical and economic feasibility of reducing TFA in PHVOs and replacing it with healthier oils (i.e., PUFAs)

Analytical framework for thematic analysis, based on policy constructs for assessing complexities for regulating trans fat
Walt and Gilson 1994, Health Policy and Plan; Najam 1995,
http://www.iiasa.sc.at/Admin/PUB/Documents/WP-95-061.pdf

Key themes identified :Complexities for regulating trans fat
• Trans fat awareness
• Consumer
• Vendors
• Issue of loose food market
• Oil abuse
• Lack of label reading

Key themes: Complexities for regulating trans fat
• Identification of trans fat as a problem • Priority given to other food safety issues rather than trans fat regulation
• Large unorganized retail sector • A structural, contextual factor relating to trans fat regulation complexity
• Main source of trans fats are not packaged branded foods but the foods sold in the loose unregulated market
• Support for trans fat regulation
• Suitability of product reformulation • Challenges: Investment in new technology, identifying suitable alternatives with
similar organoleptic properties, consumer preferences, existing policies on lack of evidence to support the provisions on capping the melting point, excluding palm stearin as an edible oil and restricting blending to only two oils when producing vanaspati

What is needed…….
• Building capacity for manufacturers and vendors will be imperative as India moves forward with trans fat regulation • increasing the availability of suitable alternative oils and finding technological
solutions for product reformulation
• A significant challenges that India will face in trans fat regulation will be enforcement • Inadequate workforce and capacity of food inspectors
• Awareness and capacity of street food vendors
• Liaising with the agriculture, trade and processing sectors in a cohesive way will prove essential to moving forward with healthier replacement oils

Key themes: Feasibility of reformulating PHVOs (Industry perspective)
• Consumer preference • Hard, while granular fat
• Regulatory issues • Current cap on the melting point, the classification of palm stearin as inedible oil, and the
inability to use enzymatic and chemical interesterification.
• Replacement oils
• Technological feasibility • TFA can be reduced to 10%, given an increase in the melting point, without having to
adopt new technology (lead to decrease in TFA and an increase in SFA) • A need to invest in new equipment and research and development to bring down the TFA
to 5%, while keeping the organoleptic properties (i.e., a product that is hard) that consumers demand
• Use of full hydrogenation, interesterification, fractionation and blending of soft oils with harder fractionations are the main ways to decrease TFA in the products

What is needed………. • Reformulating PHVOs in India is technically and economically feasible;
however, challenges exist in producing a product that meets consumer demand
• A collision course exists where public health goal to replace PHVOs with PUFA are opposed to the goals of industry to produce a cheap alternative
• Decreased reliance on palm oil, investment in research and development and increased capacity for smaller manufacturers, incentivize them to comply with regulation
• Government should require PHVO manufacturers to use domestic oils, to increase uptake of PUFA use
• Continued monitoring of industry's progress
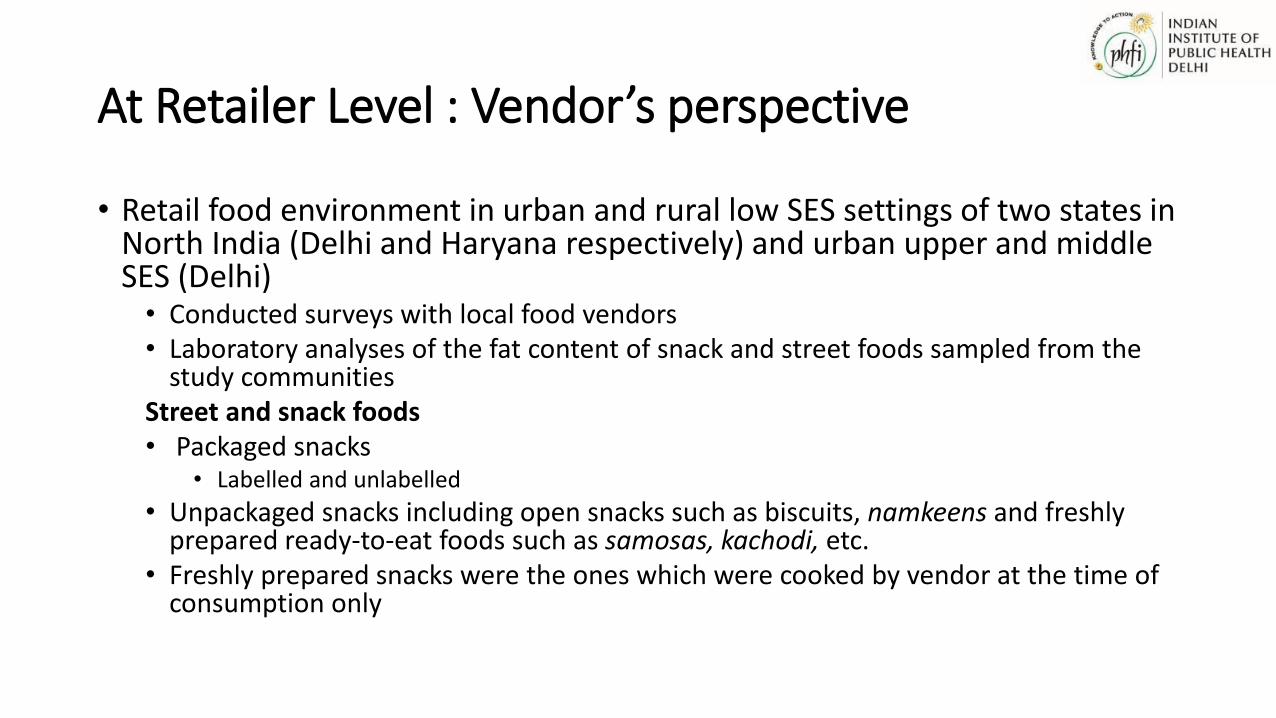
At Retailer Level : Vendor’s perspective
• Retail food environment in urban and rural low SES settings of two states in North India (Delhi and Haryana respectively) and urban upper and middle SES (Delhi) • Conducted surveys with local food vendors
• Laboratory analyses of the fat content of snack and street foods sampled from the study communities
Street and snack foods
• Packaged snacks • Labelled and unlabelled
• Unpackaged snacks including open snacks such as biscuits, namkeens and freshly prepared ready-to-eat foods such as samosas, kachodi, etc.
• Freshly prepared snacks were the ones which were cooked by vendor at the time of consumption only

Vendor survey
• Village vendors (n=40), urban slum (n=29)
• A structured questionnaire (17-question list) with questions on • Types of snack foods they sold • How they prepared them • Use of cooking oils • Why they used a specific oil • Where they purchased the oils • Quantity and cost of oil purchased • Length of time they used the oil • How they discarded it • Any oil preferences • Awareness of trans fat • Views about the overall healthiness of oils

Vendor survey
• One third of the snacks in both rural and urban areas were sold unlabelled in transparent packages
• A other o e third ere sold ope i glass jars
• Oils and fats used for preparation
• Soyabean oil
• Non specified refined oil
• Vanaspati
• Local brands used, bought in bulk form local market or nearby town (rural)
For frying : Oils
Shortening : Vanaspati

Awareness
• Overall, trans fat awareness was low with only 7% (n=3/ 44) of vendors aware of trans fat
• Overall, illage e dors i di ated that they = 5 either did t k o which oils could be considered better or worse for health or that mustard oil was healthy (n= 8)
• Majority (n= 10) of the urban vendors indicated that refined oils (including soybean, mustard, and saffola) were healthy

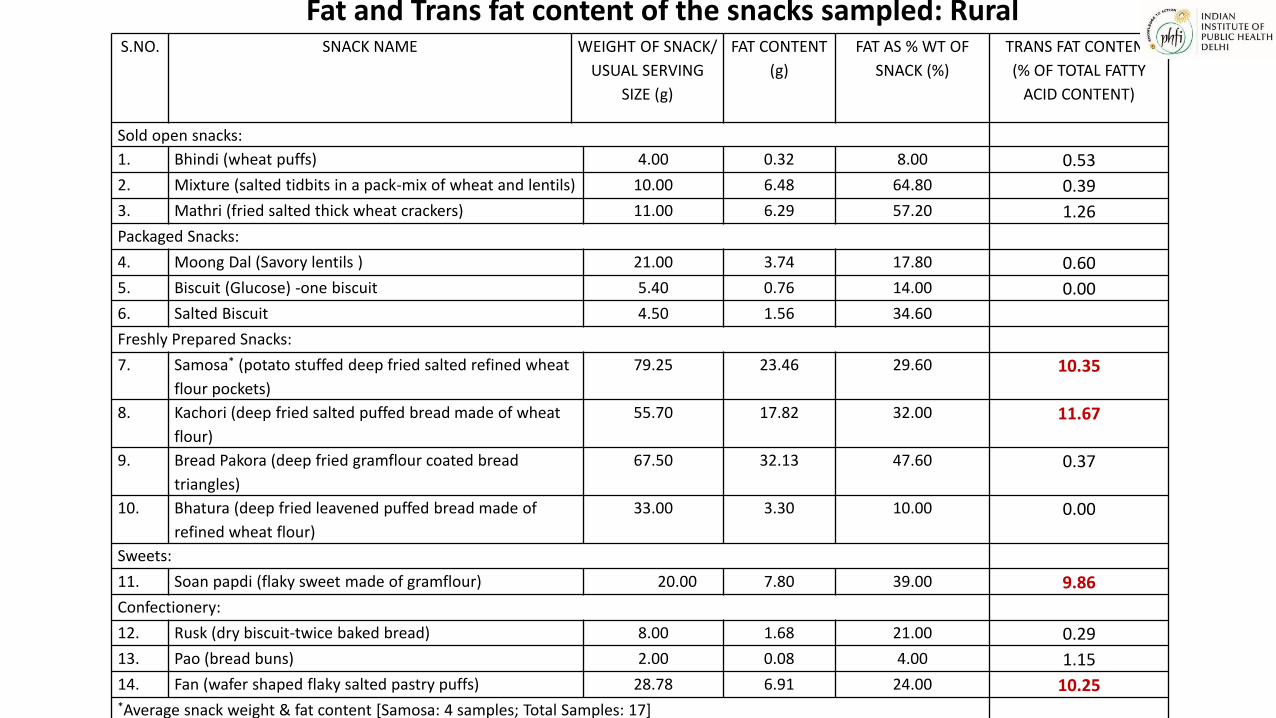
Snacks sampled and analysed
• A total of 17 snack samples from the villages and 32 from the slums were sampled and analysed
• Mean fat content was 28.8g/100g serving in rural and 29.6g/100g in snacks in urban settings
• Sampled oils contained high levels of saturated (25-69% of total fatty acids) and trans (0.1-30% of total fatty acids) fat
S.NO. SNACK NAME WEIGHT OF SNACK/
USUAL SERVING
SIZE (g)
FAT CONTENT
(g)
FAT AS % WT OF
SNACK (%)
TRANS FAT CONTENT
(% OF TOTAL FATTY
ACID CONTENT)
Sold open snacks:
1. Bhindi (wheat puffs) 4.00 0.32 8.00 0.53
2. Mixture (salted tidbits in a pack-mix of wheat and lentils) 10.00 6.48 64.80 0.39
3. Mathri (fried salted thick wheat crackers) 11.00 6.29 57.20 1.26
Packaged Snacks:
4. Moong Dal (Savory lentils ) 21.00 3.74 17.80 0.60
5. Biscuit (Glucose) -one biscuit 5.40 0.76 14.00 0.00
6. Salted Biscuit 4.50 1.56 34.60
Freshly Prepared Snacks:
7. Samosa* (potato stuffed deep fried salted refined wheat
flour pockets)
79.25 23.46 29.60 10.35
8. Kachori (deep fried salted puffed bread made of wheat
flour)
55.70 17.82 32.00 11.67
9. Bread Pakora (deep fried gramflour coated bread
triangles)
67.50 32.13 47.60 0.37
10. Bhatura (deep fried leavened puffed bread made of
refined wheat flour)
33.00 3.30 10.00 0.00
Sweets:
11. Soan papdi (flaky sweet made of gramflour) 20.00 7.80 39.00 9.86
Confectionery:
12. Rusk (dry biscuit-twice baked bread) 8.00 1.68 21.00 0.29
13. Pao (bread buns) 2.00 0.08 4.00 1.15
14. Fan (wafer shaped flaky salted pastry puffs) 28.78 6.91 24.00 10.25 *Average snack weight & fat content [Samosa: 4 samples; Total Samples: 17]
Fat and Trans fat content of the snacks sampled: Rural

S.NO SNACK NAME WEIGHT OF
SNACK(USUAL
SERVING SIZE
(gm)
FAT
CONTENT
(gm)
FAT AS %
WT OF
SNACK (%)
TRANS FAT CONTENT (%
OF TOTAL FATTY ACIDS
CONTENT)
Sold open snacks:
1. Mathri* 21.35 8.22 38.50 4.43
2. Biscuits (unpackaged)- 4 biscuits 20.26 8.27 40.80 0.35
3. Chakri (deep fried spiral wheat crackers) 21.42 7.88 36.80 0.97
4. Kachri (rice puffs) 9.06 3.22 35.60 0.33
5. Besan papdi (1) 32.80 16.53 50.40
6. Besan Papdi (with groundnuts) 30.13 17.47 58.00
7. Bhujia (fried salted snack made of gramflour and
shredded)
31.96 12.66 39.60 0.46
Packaged Snacks:
8. Moong dal 18.29 5.01 27.40 1.26
9. Fun Pop (rice puffs, chips) 3.89 0.61 15.60 0.42
10. Jo s o io ri gs hips 14.65 6.62 45.20 0.45
Freshly Prepared Snacks:
11. Bhatura 52.04 10.20 19.60 0.44
12. Kachodi 53.83 25.09 46.60 11.77
13. Bread Pakora 90.10 23.79 26.40 1.06
14. Namakpara (fried salted wheat flour cubes) 64.12 22.44 35.00 12.81
15. Samosa 46.66 13.62 29.20 0.29
16. Pakoras 54.16 16.57 30.60 0.34
17. Aloo tikki 45.24 12.40 27.40 0.38
Fat and Trans fat content of the snacks sampled: URBAN SLUM

S.NO SNACK NAME WEIGHT OF
SNACK(USUAL
SERVING SIZE
(gm)
FAT
CONTENT
(gm)
FAT AS %
WT OF
SNACK (%)
TRANS FAT
CONTENT (% OF
TOTAL FATTY
ACIDS
CONTENT)
18. Boondi Ladoo (ball shaped sweet made of fried
gramflour granules dipped in sugar syrup)
87.84 12.82 14.60 0.44
19. Besan ladoo (ball shaped sweet made of fried
gramflour
33.33 7.93 23.80 0.37
20. Besan barfi (sweet gramflour squares) 49.10 10.51 21.40 22.96
21. Maida barfi (sweet flour and condensed milk
triangles)
44.52 2.58 5.80 0.00
22. Soan Papdi (flaky sweet made of gramflour) 49.01 9.90 20.20 0.29
Confectionery:
23. Bun (2 in no.) 78.20 3.28 4.20
24. Cream Roll 58.00 18.44 31.80 2.88
25. Pastry 32.53 6.90 21.20 0.26
26. Patty 89.34 26.09 29.20 0.00
27. Fan* 23.67 7.77 32.82 4.98
28. Rusk 23.94 3.16 13.20 0.53
29. Muffin 21.87 8.40 38.40 0.37
*Average snack weight & fat content [Mathri: 3 samples; Fan: 2 samples; Total samples: 32]
Fat and Trans fat content of the snacks sampled: Urban Slum

ID SNACK
SFA (%) RANGE
MUFA
TRANS
% (n) RANGE
PUFA
TRANS
% (n) RANGE
TOTAL
TRANS
1 ALOO TIKKI
35.5 29-75 0.5(3) 0.5-1.5 0.42(4) .3-.72 0.92
2 BHATURA
51.10 20-55 0.25 (2) .24-.3 0.61(all) .46-1.0 0.86
3
BREAD
PAKORA
43.00 18-64
0.21
(13) 0.2-2.9 .66 (19) .2-2.3 0.87
4 GOLGAPPA
65.30 60, 71
1.75
(all) 1.2-2.2 0.67 .24;1.1 2.42
5 KACHORI
47.20 31-81 1.4 (6) 1.8-3.6 .61(7) .3-1.0 2.1
6
PANEER
PAKORA
34.00 30,37 0.00 0.00 0.27 .25, .3 0.27
7 SAMOSA
52.30 20-69
1.96(14
) 2-11.7 0.65(22) .1-1.5 2.61
8 VADA 37.20 35,39 .31 (1) NA 2.70 .49, 4.91 3
9
DAHI
BHALLA*
37.71 NA 0.93 NA 0.34 NA 1.27
* one
sample each
Fat and Trans fat content of the snacks sampled: URBAN

At consumer level : Community survey
• Household dietary practices related to fat intake with specific emphasis on consumption and awareness about fats and oils
• Estimate the proportion of daily energy intake contributed by trans fat in urban upper, middle and low SES and rural low SES community

Study description
•Urban: : High and Middle income households in South District of Delhi , slum in north-east district, Gandhi Nagar Assembly (Chanderpuri)
•Rural: Villages in district Mewat, Haryana
Study sites
• June 2011-March 2013 Study duration
• Cross-sectional Type of study
• Household members Study
participants

Study methodology
Sample size: Number of households
• Urban: 202 households Middle SES and 260: Low SES
• Rural: 260 households
Household consumption patterns: Pilot tested interviewer administered questionnaire (urban middle/high SES) including a HH FFQ, inventory and 2-day dietary recall (rural and urban low SES)
Study participants: respondents were adult members of the households (HHs) involved in the cooking /purchasing of the food

Results Low SES (rural and urban)
• The average family size :6 members
• Average no. working members in the family in majority: 2
• The literacy status of the respondents was up to school level in majority: 55.8% rural
and 42.5% urban slums
• Average monthly HH income : 3000-10,000 INR : 63 % rural and 78 % urban slums
High and middle SES (Urban)
• Mean family size:4.07± 1.9
• Working family members: > 2 in 50% of families
• Literacy status: 82 % of respondents had graduate or higher degrees
• Family income: ~ 55 % of families reported monthly income > 50,000/-INR

Results : low SES (rural and urban) contd.
• A median intake of 18.7 g/CU /day of visible oil (used as cooking medium) and 26.9 g/CU/day were reported in villages and slums respectively
• Mustard oil and soybean oil were the most commonly consumed oils
• Higher consumption of ghee/butter in rural HHs (87.3% desi ghee; 47.7% butter); than urban (30.7% desi ghee; 33% HHs butter)
• 89% and 56% HHs in villages and slums respectively reported using more than 2 cooking mediums
• Vanaspati (PHVO source) was being used in a very small number of households at either site (rural: 11% vs. urban: 15%) as cooking medium

Results: low SES (rural and urban) contd.
• More than 95% of HHs reported consuming snacks (of any type)
• Consumption of home-made snacks* were reported in 67.3% rural HHs and 18.4% slums; about 86%(rural) and 66%(urban) HHs reported consuming packaged snacks
• Biscuits were the most commonly consumed packaged snack (78.5% rural, 39.8% slums); freshly prepared market snacks** like samosa, kachodi, were reportedly consumed in 55% (rural) and 38% (urban slums) HHs
• The median fat consumed from snacks per CU per day was 1g (0- 58.5g) in villages and 10.8g (0- 90.2g) in slums
• About 2% (5) HHs and 1% (3) HHs in rural and urban settings consumed more than 2.5% energy from TFA from snacks in their diet(from snacks sampled by us) daily

Results : Urban Upper and Middle SES
Consumption patterns
• Monthly HH consumption of oil in a month was 2667ml
• Monthly HH consumption of fat in a month was 1000 g
• Majority were using 2 or more oils in cooking
• 82% individuals had fat intake >10%en from visible fat
• Median visible fat intake :41.7 g
• Household consumption (through cooking mediums) of trans fatty acids was
low

Results : Urban Upper and Middle SES contd.
• A large number of HHs (74%) were using variety of oils
• Frequency: Desi ghee(87%)>Butter(81%)>Mustard oil (64%)>Sunflower
oil(55%) >Olive oil (33%)>Soy bean oil(30%)>Safflower oil(3%)> Vanaspati
(2%)
• Quantity (g/CU/day):Safflower oil >Soy bean oil > Sunflower oil > Mustard
oil >Desi ghee > Butter>olive oil
• Snacks chiefly consumed (87% consumption) : Fruit juices,
sprouts(n=152;86.9%), bakery/confectionery (n=139;79.4%);milk products
like ice creams, mithais (n=137;78.3%); packaged labelled snacks like
namkeen, mathri (n=135;77.1%) and instant noodles (n=118;67.4%)

Reason for selection of cooking oil/fat
• Health
• Taste
• Availability
• Sensory quality
85 % households were reusing the used oil for further cooking purpose
• While 72% participants had awareness of the relation of fat/oil consumption on
heart disease risk, 47% were not aware of the health implications of trans fats
Results : Urban Upper and Middle SES

Summary
• The study shows majority of the population is consuming less than 1% of energy from TFA with about 4% (10) HHs and 13% (33) HHs in low SES rural and urban settings consuming more than 1% en from TFA
• Analysed snacks had a high saturated fatty acid content
• Snacks are a major source of saturated fat and TFA intake in the diet of surveyed communities and thus contribute to high energy intake but poor micronutrient intake

Inferences and implications: Community Surveys
• TFA intake through household cooking mediums is low in the communities studied
• Awareness of implications of trans fat intake needs to be raised through appropriate IEC programs
• Elimination of TFA intake would be most likely achieved through modification of oils available in the food supply chain to improve snack quality
• Improving the quality and transparency of the contents of the snack foods that are available is vital

Collaborators and study team Dr Archna Singh (All India Institute of Medical Sciences, New Delhi)
Dr. Shauna Downs (Columbia University), Dr. Karen Lock (LSHTM), Prof. R.
Lakshmy (AIIMS, New Delhi), Dr. Ruby Gupta (PHFI)
Ms. Vidhu Gupta, Ms. Anita Singh, Ms. Aarti Srivastava (IIPH-Delhi, PHFI)
Funding Wellcome trust-PHFI capacity building consortium
Department of Science and Technology, India

Thank you!