LANDSCAPE ANALYSIS FOR TRANS FAT LIMITS FOR SRI …
88
LANDSCAPE ANALYSIS FOR TRANS FAT LIMITS FOR SRI LANKA: A SYNTHESIS REPORT
Transcript of LANDSCAPE ANALYSIS FOR TRANS FAT LIMITS FOR SRI …
LANDSCAPE ANALYSIS F OR TRANS
FAT LIMITS FOR SRI LANKA:
A SYNTHESIS REPORT
2
Landscape analysis for trans fat limits for Sri Lanka: a synthesis report
ISBN: 978-92-9022-816-5
© World Health Organization 2020
Some rights reserved. This work is available under the Creative Commons Attribution-NonCommercial-ShareAlike 3.0 IGO licence (CC BY-NC-SA 3.0 IGO; https://creativecommons.org/licenses/by-nc-sa/3.0/igo).
Under the terms of this licence, you may copy, redistribute and adapt the work for non-commercial purposes, provided the work is appropriately cited, as indicated below. In any use of this work, there should be no suggestion that WHO endorses any specific organization, products or services. The use of the WHO logo is not permitted. If you adapt the work, then you must license your work under the same or equivalent Creative Commons licence. If you create a translation of this work, you should add the following disclaimer along with the suggested citation: “This translation was not created by the World Health Organization (WHO). WHO is not responsible for the content or accuracy of this translation. The original English edition shall be the binding and authentic edition”.
Any mediation relating to disputes arising under the licence shall be conducted in accordance with the mediation rules of the World Intellectual Property Organization.
Suggested citation. Landscape analysis for trans fat limits for Sri Lanka: a synthesis report. Colombo: World Health Organization, Country Office for Sri Lanka; 2020. Licence: CC BY-NC-SA 3.0 IGO.
Cataloguing-in-Publication (CIP) data. CIP data are available at http://apps.who.int/iris.
Sales, rights and licensing. To purchase WHO publications, see http://apps.who.int/bookorders. To submit requests for commercial use and queries on rights and licensing, see http://www.whoint/about/licensing.
Third-party materials. If you wish to reuse material from this work that is attributed to a third party, such as tables, figures or images, it is your responsibility to determine whether permission is needed for that reuse and to obtain permission from the copyright holder. The risk of claims resulting from infringement of any third-party-owned component in the work rests solely with the user.
General disclaimers. The designations employed and the presentation of the material in this publication do not imply the expression of any opinion whatsoever on the part of WHO concerning the legal status of any country, territory, city or area or of its authorities, or concerning the delimitation of its frontiers or boundaries. Dotted and dashed lines on maps represent approximate border lines for which there may not yet be full agreement.
The mention of specific companies or of certain manufacturers’ products does not imply that they are endorsed or recommended by WHO in preference to others of a similar nature that are not mentioned. Errors and omissions excepted, the names of proprietary products are distinguished by initial capital letters.
All reasonable precautions have been taken by WHO to verify the information contained in this publication. However, the published material is being distributed without warranty of any kind, either expressed or implied. The responsibility for the interpretation and use of the material lies with the reader. In no event shall WHO be liable for damages arising from its use.
Printed in Sri Lanka

3
ACKNOWLEDGEMENTS
The synthesis report on the landscape analysis was prepared for WHO Country Office Sri
Lanka, by Professor Pulani Lanerolle and Dr Maduka de Lanerolle-Dias, from the Department
of Biochemistry and Molecular Biology, Faculty of Medicine, University of Colombo,
following a desk review and using the findings of the following background studies.
Professor Terrence Madhujith (Lead) and Professor D.C.K. Illeperuma, from the University of
Peradeniya, Dr Weerasinghe, from the Veterinary Research Institute, Gannoruwa, Prof L.H.P.
Gunaratne, Director, Agribusiness Center, University of Peradeniya, Ms Subajiny
Sivakanthan, University of Jaffna and Ms Dilini Wasana, Postgraduate Institute of Agriculture
(Research Assistant) carried out the analysis of fatty acid profiles of oils, fats and foods by Gas
Chromatography-Mass Spectrometry.
Professor Sagarika Ekanayake (Lead), Professor Rasika Perera, Professor Usha Hettiaratchi
and Dr Sanath Mahavithanage from the University of Sri Jayewardenepura carried out the
household survey, the adolescent survey and the market survey. Professor Shamini Prathapan
and Professor Sagarika Ekanayake of the University of Sri Jayewardenepura contributed to the
policy review work.
Photo Credits: Dr Indu Waidyatilaka, Dr Maduka de Lanerolle Dias, Christopher Black,
Sergey Volkov, Conor Ashleigh

4
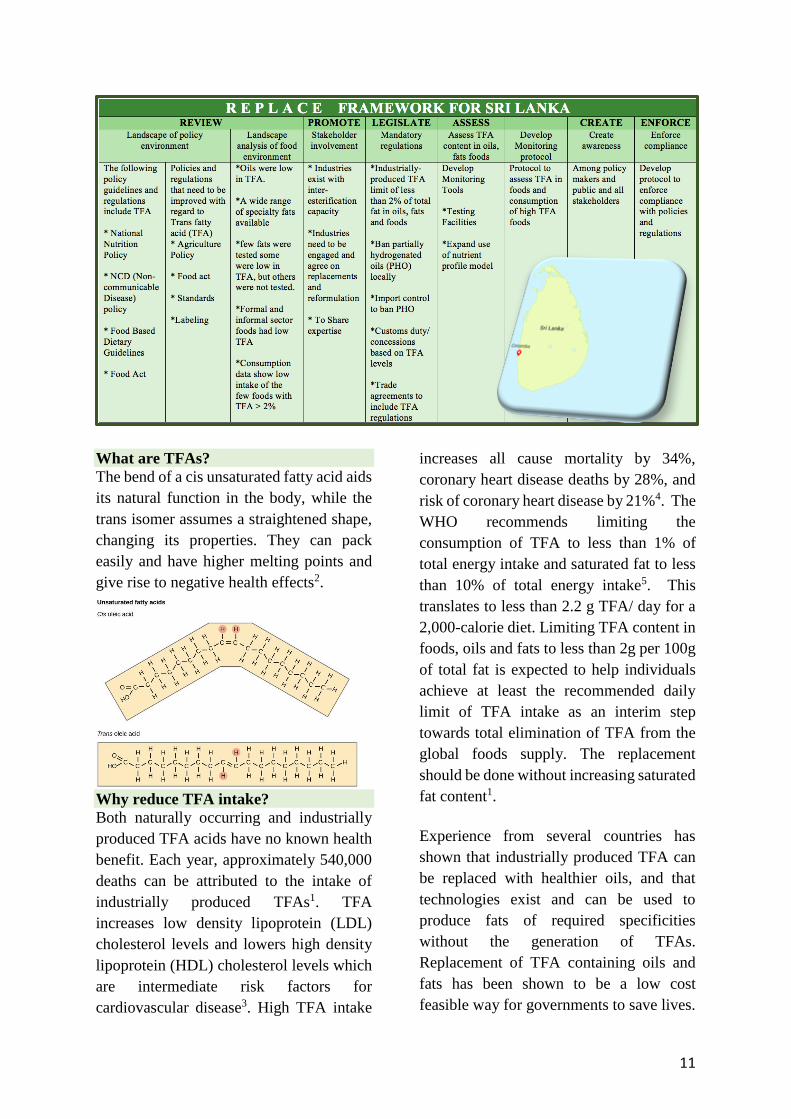
R E P L A C E FRAMEWORK FOR SRI LANKA REVIEW PROMOTE LEGISLATE ASSESS CREATE ENFORCE
Landscape of policy
environment
Landscape
analysis of food
environment
Stakeholder
involvement
Mandatory
regulations
Assess TFA
content in oils,
fats foods
Develop
Monitoring
protocol
Create
awareness
Enforce
compliance
The following
policy
guidelines and
regulations
include TFA
* National
Nutrition
Policy
* NCD (Non-
communicable
Disease)
policy
* Food Based
Dietary
Guidelines
* Food Act
Policies and
regulations
that need to be
improved with
regard to
Trans fatty
acid (TFA)
* Agriculture
Policy
* Food act
* Standards
*Labeling
*Oils were low
in TFA.
*A wide range
of specialty fats
available
*few fats were
tested some
were low in
TFA, but others
were not tested.
*Formal and
informal sector
foods had low
TFA
*Consumption
data show low
intake of the
few foods with
TFA > 2%
* Industries
exist with
inter-
esterification
capacity
*Industries
need to be
engaged and
agree on
replacements
and
reformulation
* To Share
expertise
*Industrially-
produced TFA
limit of less
than 2% of total
fat in oils, fats
and foods
*Ban partially
hydrogenated
oils (PHO)
locally
*Import control
to ban PHO
*Customs duty/
concessions
based on TFA
levels
*Trade
agreements to
include TFA
regulations
Develop
Monitoring
Tools
*Testing
Facilities
*Expand use
of nutrient
profile model
Protocol to
assess TFA in
foods and
consumption
of high TFA
foods
Among policy
makers and
public and all
stakeholders
Develop
protocol to
enforce
compliance
with policies
and
regulations
5
Table of Contents Abbreviations ................................................................................................................................. 6 List of tables: .................................................................................................................................. 6 List of Figures ................................................................................................................................ 7
EXECUTIVE SUMMARY ........................................................................................................................ 8 BACKGROUND ................................................................................................................................... 10 IMPLEMENTING REPLACE .............................................................................................................. 16
REVIEW ....................................................................................................................................... 16 METHODOLOGY ........................................................................................................................... 16
1) Policy analysis ..................................................................................................................... 16 2) Household survey and Adolescent survey: .......................................................................... 17 3) Market survey: Methodology ............................................................................................... 19 4) Laboratory analysis of oils, fats and foods .......................................................................... 19
POLICY AND LEGISLATIVE ENVIRONMENT IN SRI LANKA ............................................... 20 Policy documents that are relavant to fats and TFAs .................................................................. 20 Policy and Regulations on Imports and health certificates .......................................................... 21 Guidelines and technical documents that make reference to fats and TFAs ................................ 24 Legal/legislative acts and instituttions that reference oils and fats ............................................. 24 Regulations on standards under the Food Act ............................................................................. 26 Regulations on labelling and advertising of oils and fats UNDER THE FOOD ACT ................. 26 Labelling and claims .................................................................................................................... 27 Circulars to safeguard consumers from unhealthy oils and fats .................................................. 28
DISCUSSION OF FINDINGS ......................................................................................................... 29 Baseline characteristics of the household and adolescent surveys .............................................. 29 Edible oil production, import/export environment, mean cost of oils and oil sales from
supermarkets. ............................................................................................................................... 32 TFA levels in oils fats and food .................................................................................................... 37 Supermarket or Grocery foods/ Ingredients that are pre packaged (national data) .................... 39 Total % TFA in common oils and fats from small enterprises and street vendors in 6 districts .. 40 Total TFA in street foods .............................................................................................................. 43 Restaurant and bakery foods and ingredients .............................................................................. 52 Fatty acid profile of oils and fats ................................................................................................. 59
CONCLUSIONS:. ............................................................................................................................ 63 Policy and regulations ................................................................................................................. 63 Food consumption patterns .......................................................................................................... 64 Informal sector ............................................................................................................................. 65 Packaged foods formal and informal sector ................................................................................ 66 formal sector regulation,innovation and technology ................................................................... 66 Assessment and monitoring .......................................................................................................... 67 Create awareness ......................................................................................................................... 67 Voluntary actions by industry to reformulate products to reduce TFAs ...................................... 67 Recommendation .......................................................................................................................... 68
REFERENCES ..................................................................................................................................... 69 Annexure 1 ................................................................................................................................... 72 Annexure 2 ................................................................................................................................... 74 Annexure 3 ................................................................................................................................... 82 Annexure 4 ................................................................................................................................... 86 Annexure 5 ................................................................................................................................... 87

6
ABBREVIATIONS
NCD Non-communicable Disease
TFA Trans Fatty Acids
PHO Partially Hydrogenated Oils
WHO World Health Organization
LDL Low density lipoprotein
HDL High density lipoprotein
TAG Triacylglycerol
SFA Saturated fatty acid
CVD Cardiovascular disease
IE Inter-esterified
SPSS Statistical Package for Social Sciences
GCMS Gas chromatography-mass spectrometry
FAME Fatty acid methyl ester
FCAU Food Control Administration Unit
FAC Food advisory committee
SLSI Sri Lanka Standards Institution
LIST OF TABLES:
Table 1: A comparison of the advantages and disadvantages of natural and modified fats and oils ... 15
Table 2: Import quantity (1000 Mt) of edible oils and fats by year (2015 – 2019) ………..………...34
Table 3: TFA per 100g of total fat, in oils fats and food items………………………………..…….. 37
7
LIST OF FIGURES
Figure 1: Distribution of ethnicity: Household survey and adolescent survey ..................................... 30
Figure 2: Characteristics of adolescents, who participated in the adolescent study.............................. 31
Figure 3: Domestic supply of oil crops ................................................................................................. 33
Figure 4: Total imports of edible fats and oils ...................................................................................... 33
Figure 5: Mean cost of the different oils available in 6 districts ........................................................... 35
Figure 6: Oil sales as a % of total oil sold per month, in 6 districts ..................................................... 35
Figure 7: Distribution of household income in 6 districts ..................................................................... 36
Figure 8: Volume of oil sold by district ................................................................................................ 36
Figure 9: %TFA of prepackaged food. ................................................................................................. 39
Figure 10: % TFA in fats and oils consumed in 6 districts .................................................................. 42
Figure 11: Consumption of Street food in the Colombo District .......................................................... 43
Figure 12: Consumption of Street food in the Kandy District .............................................................. 45
Figure 13: Consumption of Street food in the Galle District ................................................................ 46
Figure 14: Consumption of Street food in the Anuradhapura District .................................................. 47
Figure 15: Consumption of Street food in the Jaffna District ............................................................... 49
Figure 16:Consumption of Street food in the Batticaloa District ......................................................... 50
Figure 17: Consumption of restaurant and bakery ingredients in the Colombo District ...................... 53
Figure 18: Consumption of restaurant and bakery ingredients in the Kandy District ........................... 54
Figure 19: Consumption of restaurant and bakery ingredients in the Galle District ............................. 54
Figure 20: Consumption of restaurant and bakery ingredients in the Anuradhapura District .............. 56
Figure 21: Consumption of restaurant and bakery ingredients in the Jaffna District ........................... 57
Figure 22: Consumption of restaurant and bakery ingredients in the Batticaloa District ..................... 58
Figure 23: Fatty acid profile: oils and fats in the Colombo District ..................................................... 59
Figure 24: Fatty acid profile: oils and fats in the Kandy District .......................................................... 60
Figure 25: Fatty acid profile: oils and fats in the Galle District ............................................................ 60
Figure 26: Fatty acid profile: oils and fats in the Anuradhapura District ............................................. 61
Figure 27: Fatty acid profile: oils and fats in the Jaffna District .......................................................... 61
Figure 28: Fatty acid profile: oils and fats in the Batticaloa District .................................................... 62

8
EXECUTIVE SUMMARY
Edible oils and fats produced from a variety of oil crops have vastly differing fatty acid
compositions with regard to saturated, poly unsaturated and mono unsaturated fats. In the
natural state unsaturated fats in plant oils exist predominantly in the cis configuration but are
converted to their trans isomers during cooking and during industrial food processing such as
the partial hydrogenation of oils (PHO). PHO is a process used to produce margarines,
shortening and specialty fats for the formal and informal food industry. Both naturally
occurring (ruminant) and industrially produced trans fatty acids (TFA) have no known health
benefit. While ruminant TFAs add to total TFA intake, usual amounts are less than from
industrially produced TFA, with industrially produced TFA being the greater concern. Trans
fats increase LDL cholesterol and lower HDL cholesterol in the blood and account for a
significant proportion of deaths due to cardiovascular disease globally. Hence the WHO
recommends that TFA intake should be less than 1% of total energy intake. In order to achieve
this, TFAs need to be reduced to less than 2% of total fat in oils, fats and foods while not
increasing saturated fats, through replacement with healthier oils and reformulation of foods.
The WHO has developed a road map in the form of a 6-step action package, REPLACE, to
catalyze the process.
A landscape analysis of the policy environment, TFA levels in foods and consumption patterns
in a nationally representative sample was carried out to identify the current state with regard to
TFAs in the Sri Lankan food chain and to assess the feasibility of enacting mandatory TFA
regulations.
Findings of the landscape analysis
• Sri Lanka has a suitable policy environment towards adopting a mandatory TFA policy of
industrially-produced TFAs less than 2% of total fat in oils, fats and foods and a ban on
partially hydrogenated oils, with mandatory TFA and saturated fatty acid (SFA) labelling
regulations already being drafted.
• Supportive changes that are required from the agriculture sector include, encouraging
under- utilized oil seeds with higher poly unsaturated fatty acid content and moving
towards trait-enhanced oils in the future. The food standards document needs to be updated
to include standards for TFAs and SFAs in oils, fats and foods.
• Domestic production of oils and fats are significant and import figures are rising for palm
oil and fats including margarine and may include shortening and specialty fats. A wide
variety of specialty fats are imported as well as produced locally.
• The laboratory analysis of oils, fats and foods from both the formal and informal sectors
have shown that total TFA content is lower than 2% of total fat in most products, with only
two exceptions of note, that too not more than 5%.
• Oils used by the informal sector too did not have high values and deep fried foods were not
particularly high in TFA. There were a few varieties of fats in the informal sector and most
of these were low or had zero TFA. However, a large range of specialty fats are sold online
or wholesale to food producers and only a few of these were analysed. One such specialty

9
fat contained 3.73% TFA of total fat indicating that other fats in the market need to be
tested.
• The consumption data identified that at both household level and individual (adolescents
only) level, foods higher in TFAs (though most were less than 2% of total fat) were not
consumed daily. At worst consumption frequency was 3 -4 times per week by a fifth of the
population studied. Cumulative intakes of TFAs were not likely to be high in the studied
population.
• Two problems were observed. Firstly, although TFA intake was low, saturated fat intake
was likely to be high as most fried foods had levels higher than 30% saturated fat per total
fat. Although most foods studied had low fat content per 100g of food, there were a notable
number of deep fried foods. Secondly, the working population though not sampled here are
likely to have higher consumption frequencies of street foods.
• It is essential that subsequent to policy enactment, guidance on TFA replacement and
regular monitoring ensures that saturated fats do not increase.
Global data show that reducing and subsequently eliminating TFA from the food supply is
politically and technically feasible. In countries where the food supply has very high levels of
TFA a step wise reduction is required but in countries with lower TFA levels similar to Sri
Lanka mandatory policy less than 2% TFAs of total fat in oils, fats and foods has been practical.
Multinational companies have already reformulated their products in countries where TFA
policies exist. They also have the technology to do so even in countries without policies. This
is evident in Sri Lanka where zero trans products are currently voluntarily produced by some
multinational companies. Yet, it has been shown globally that mandatory policy is necessary
to ensure reformulation by all companies and in all foods, in order to systematically eliminate
TFA in the future. Currently mandatory TFA policies have been enacted by 56 countries and
the number is growing. As more countries ban TFA, countries with unregulated markets will
find increasing levels of TFA in their food supply due to “dumping” of products with high
TFA. For example, multinational food companies who made TFA-free versions of their
products for countries with TFA policies, sold products that contained TFA in Thailand.
Recommendation
It is essential that Sri Lanka adopts mandatory limits that restrict industrially-produced
TFAs in oils, fats and foods to less than 2% of total fat, together with a complete ban on
partially hydrogenated oils and fats. The positive features observed in Sri Lanka are that the
levels of TFAs in the food supply are currently low which makes it feasible for industry to
reformulate to less than 2% and also to achieve zero trans in the near future through a voluntary
basis. The fact that some companies already carry out voluntary reduction and the fact that the
food supply currently has low TFA levels highlights that the technology exists, the environment
is conducive, and that it is essential to act soon to prevent “dumping” in Sri Lanka.

10
BACKGROUND
What is REPLACE
REPLACE is a practical, 6-step action
package to eliminate TFAs from the food
supply, developed by the World Health
Organization (WHO). It is expected to
function as a road map which countries can
tailor to suit their needs in order to work
towards elimination of TFAs by 2023. It
calls for the promotion of use and
consumption of healthier fats and oils, the
elimination of industrially-produced TFAs,
to be achieved through regulatory actions,
while establishing solid monitoring systems
and creating awareness among policy-
makers, producers, suppliers, and the
public1
.
This synthesis report discusses the first of
these 6 steps, review, through a landscape
analysis of existing policy, TFA levels in
foods and consumption of TFA rich foods.
It also discusses the immediate
next steps and way forward to accomplish
the next 5 steps of the road map within the
specific context of Sri Lanka and is
informed by the landscape analysis.
11
What are TFAs?
The bend of a cis unsaturated fatty acid aids
its natural function in the body, while the
trans isomer assumes a straightened shape,
changing its properties. They can pack
easily and have higher melting points and
give rise to negative health effects2.
Why reduce TFA intake?
Both naturally occurring and industrially
produced TFA acids have no known health
benefit. Each year, approximately 540,000
deaths can be attributed to the intake of
industrially produced TFAs1. TFA
increases low density lipoprotein (LDL)
cholesterol levels and lowers high density
lipoprotein (HDL) cholesterol levels which
are intermediate risk factors for
cardiovascular disease3. High TFA intake
increases all cause mortality by 34%,
coronary heart disease deaths by 28%, and
risk of coronary heart disease by 21%4. The
WHO recommends limiting the
consumption of TFA to less than 1% of
total energy intake and saturated fat to less
than 10% of total energy intake5. This
translates to less than 2.2 g TFA/ day for a
2,000-calorie diet. Limiting TFA content in
foods, oils and fats to less than 2g per 100g
of total fat is expected to help individuals
achieve at least the recommended daily
limit of TFA intake as an interim step
towards total elimination of TFA from the
global foods supply. The replacement
should be done without increasing saturated
fat content1.
Experience from several countries has
shown that industrially produced TFA can
be replaced with healthier oils, and that
technologies exist and can be used to
produce fats of required specificities
without the generation of TFAs.
Replacement of TFA containing oils and
fats has been shown to be a low cost
feasible way for governments to save lives.
12
WHO recommends TFA elimination as a
cost-effective intervention for low- and
middle- income countries1.
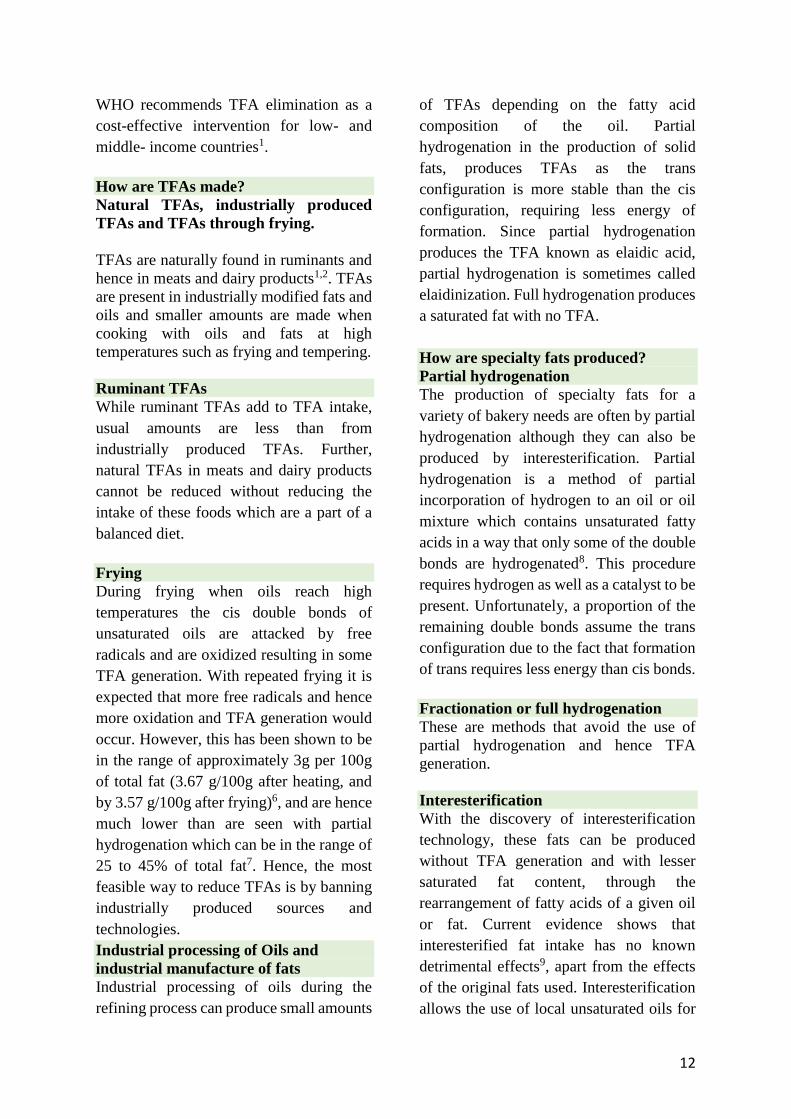
How are TFAs made?
Natural TFAs, industrially produced
TFAs and TFAs through frying.
TFAs are naturally found in ruminants and
hence in meats and dairy products1,2. TFAs
are present in industrially modified fats and
oils and smaller amounts are made when
cooking with oils and fats at high
temperatures such as frying and tempering.
Ruminant TFAs
While ruminant TFAs add to TFA intake,
usual amounts are less than from
industrially produced TFAs. Further,
natural TFAs in meats and dairy products
cannot be reduced without reducing the
intake of these foods which are a part of a
balanced diet.
Frying
During frying when oils reach high
temperatures the cis double bonds of
unsaturated oils are attacked by free
radicals and are oxidized resulting in some
TFA generation. With repeated frying it is
expected that more free radicals and hence
more oxidation and TFA generation would
occur. However, this has been shown to be
in the range of approximately 3g per 100g
of total fat (3.67 g/100g after heating, and
by 3.57 g/100g after frying)6, and are hence
much lower than are seen with partial
hydrogenation which can be in the range of
25 to 45% of total fat7. Hence, the most
feasible way to reduce TFAs is by banning
industrially produced sources and
technologies.
Industrial processing of Oils and
industrial manufacture of fats
Industrial processing of oils during the
refining process can produce small amounts
of TFAs depending on the fatty acid
composition of the oil. Partial
hydrogenation in the production of solid
fats, produces TFAs as the trans
configuration is more stable than the cis
configuration, requiring less energy of
formation. Since partial hydrogenation
produces the TFA known as elaidic acid,
partial hydrogenation is sometimes called
elaidinization. Full hydrogenation produces
a saturated fat with no TFA.
How are specialty fats produced?
Partial hydrogenation
The production of specialty fats for a
variety of bakery needs are often by partial
hydrogenation although they can also be
produced by interesterification. Partial
hydrogenation is a method of partial
incorporation of hydrogen to an oil or oil
mixture which contains unsaturated fatty
acids in a way that only some of the double
bonds are hydrogenated8. This procedure
requires hydrogen as well as a catalyst to be
present. Unfortunately, a proportion of the
remaining double bonds assume the trans
configuration due to the fact that formation
of trans requires less energy than cis bonds.
Fractionation or full hydrogenation
These are methods that avoid the use of
partial hydrogenation and hence TFA
generation.
Interesterification
With the discovery of interesterification
technology, these fats can be produced
without TFA generation and with lesser
saturated fat content, through the
rearrangement of fatty acids of a given oil
or fat. Current evidence shows that
interesterified fat intake has no known
detrimental effects9, apart from the effects
of the original fats used. Interesterification
allows the use of local unsaturated oils for

13
the production of specialty fats of different
physicochemical properties.
Interesterification can be done through
chemical means or enzymatic means, both
of which rearranges the fatty acids on the
glycerol backbone of the triacylglycerol
(TAG) molecule. Approximately 95% of
dietary fats consist predominantly of TAG.
TAG consist of three fatty acids esterified
to a glycerol backbone. These fatty acids
are positioned in one of three places on the
glycerol molecule2,10. Thus the reshuffling
of fatty acids produces different TAG
molecular species. While chemical
methods have higher equipment costs, the
catalysts are cheaper and the rearrangement
is random. Enzymatic methods use lipases
which are expensive but are specific and
require cheaper equipment9.
Blending
Subsequent blending of interesterified fats
with oils which are unsaturated, can enable
the production of fats with lower saturated
fat content of different consistencies and
melting and smoke points.
eg. “a combination fat with 75%
interesterified palm oil with a liquid oil
such as rapeseed oil will have the same melt
profile as the original palm oil while
reducing the SFA content by 20%”9.
The sensory characteristics of the final fat
blend, for example the mouthfeel, are a
result of the melt profile at different
temperatures and reflects the content of
solid fat in the blend.
Blending is also possible of saturated and
unsaturated oils in order to achieve semi
solid fats8.
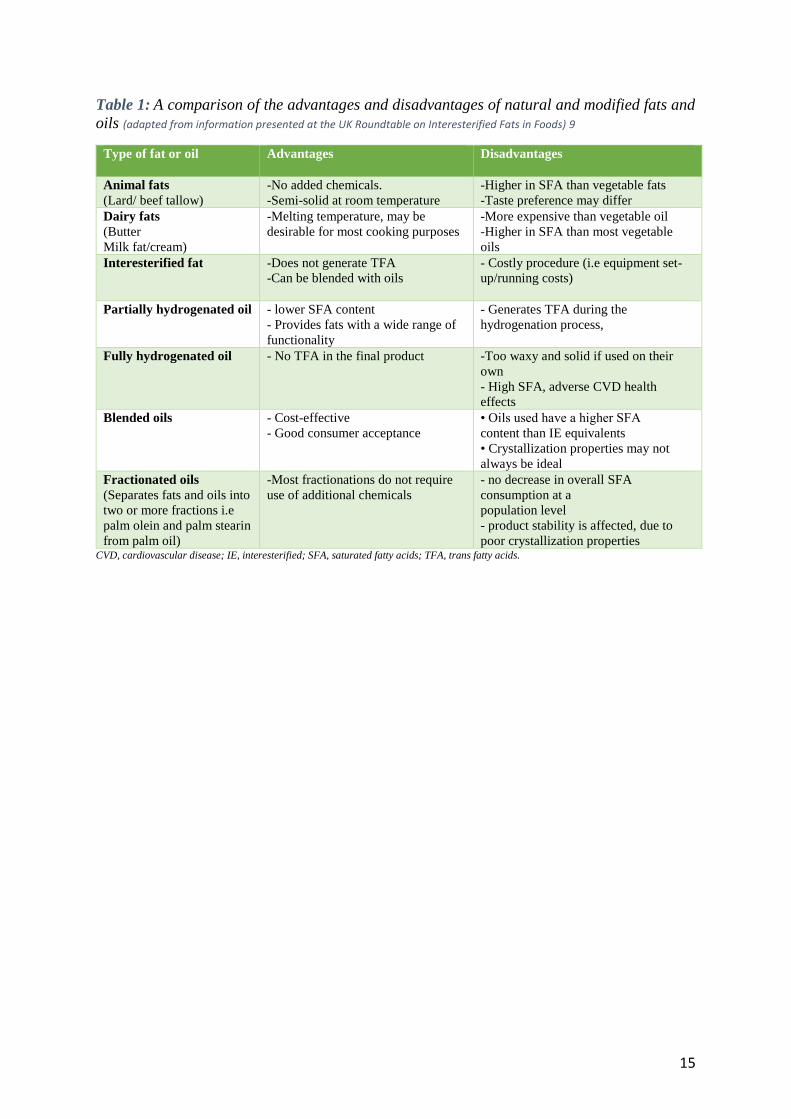
The technology in industrial processing,
advantages and disadvantages of current
methods are given in table 1 9.
Where can PHO be expected to be
found in the Sri Lankan context?
It can be expected that street foods and
restaurant foods where oil is used for frying
and where cheaper poor quality and poorly
refined oils are used, TFAs may be present.
In addition, the market is currently
abundant with unlabeled, yet branded
specialty fats which are available for frying
and baking. A majority of these fats are
available wholesale and are directly
delivered to bakeries and restaurants, with a
smaller proportion being available at retail
outlets.
Major producers, formal and informal
contexts
There are a few major producers of these
fats and some marketing of imported
products, all of which are unlabeled for
both TFAs and SFAs. It is not clear if it is
these same products that are sold in bulk
and enter the loose oil and fat trade in the
informal setting. The possibility exists that
at least some of the loose oil and fat sales
are of poorly refined cottage industry
produced oils. However, all industrial
processing of fats including partial
hydrogenation requires equipment and
technology which small producers are
unlikely to use. Hence small-scale sale is
likely to be of oils that are poorly refined
but not partially hydrogenated. Thus for Sri
Lanka addressing the formal sector
production, import and sale of partially
hydrogenated fats through a complete ban
supported by technological support for
interesterification is likely the best way
forward.

14
Importation and impact of exports on
domestic consumption
Import of oils, fats and foods need to be
tightly controlled with mandatory labelling.
Export agreements must ensure production
with the same minimum standards as
followed in Sri Lanka, to cover when export
surplus in sold for domestic consumption.
Voluntary actions by industry to
reformulate products to reduce TFAs
Globally it has been shown that reducing
and subsequently eliminating TFA from the
food supply is politically and technically
feasible1,11. In countries where the food
supply has very high levels of TFA, TFA
reduction policy has been carried out in a
step wise manner while in countries with
lower TFA levels a mandatory policy less
than 2% TFA of total fat is practical11. In
many countries such as Denmark, Slovenia,
Thailand and Chile where TFA policy has
been enacted, food companies were
supportive of TFA and PHO policy
implementation. Further, large
multinational companies have already
reformulated their products to comply with
TFA policies in countries where policies
exist. Companies also have the technology
to do so even in countries without TFA
policies11. This is evident in Sri Lanka
where voluntary actions to move towards
zero trans have been taken by some
multinational companies and retail and/or
production of zero trans margarines and
multipurpose fats are already in existence.
Hence a positive environment does exist
around voluntary TFA reduction in Sri
Lanka indicating that the technology
exists12, 13. However, it has been shown
globally that mandatory policy is necessary
to ensure reformulation by all companies
and in all foods, in order to systematically
eliminate TFA in the future11. Currently
mandatory TFA policies have been enacted
by 56 countries and territories in the WHO
regions and the number is growing1. As
more countries ban TFA, countries with
unregulated markets will find increasing
levels of TFA in their food supply due to
“dumping” of products with high TFA. It
has been documented in Thailand that
multinational food companies who made
TFA-free versions of their products for
countries with TFA policies, sold products
that contained TFAs in Thailand 11. It is
essential to act soon to prevent “dumping”
in Sri Lanka. It is also essential that
subsequent to policy enactment, guidance
on TFA replacement and regular
monitoring ensures that saturated fats do
not increase.
15
Table 1: A comparison of the advantages and disadvantages of natural and modified fats and
oils (adapted from information presented at the UK Roundtable on Interesterified Fats in Foods) 9
Type of fat or oil
Advantages Disadvantages
Animal fats
(Lard/ beef tallow)
-No added chemicals.
-Semi-solid at room temperature
-Higher in SFA than vegetable fats
-Taste preference may differ
Dairy fats
(Butter
Milk fat/cream)
-Melting temperature, may be
desirable for most cooking purposes
-More expensive than vegetable oil
-Higher in SFA than most vegetable
oils
Interesterified fat -Does not generate TFA
-Can be blended with oils
- Costly procedure (i.e equipment set-
up/running costs)
Partially hydrogenated oil
- lower SFA content
- Provides fats with a wide range of
functionality
- Generates TFA during the
hydrogenation process,
Fully hydrogenated oil
- No TFA in the final product
-Too waxy and solid if used on their
own
- High SFA, adverse CVD health
effects
Blended oils
- Cost-effective
- Good consumer acceptance
• Oils used have a higher SFA
content than IE equivalents
• Crystallization properties may not
always be ideal
Fractionated oils
(Separates fats and oils into
two or more fractions i.e
palm olein and palm stearin
from palm oil)
-Most fractionations do not require
use of additional chemicals
- no decrease in overall SFA
consumption at a
population level
- product stability is affected, due to
poor crystallization properties CVD, cardiovascular disease; IE, interesterified; SFA, saturated fatty acids; TFA, trans fatty acids.

16
IMPLEMENTING REPLACE
REVIEW
The Landscape for required policy change was analysed through a policy review to identify
how and which existing policies and regulations could be addressed. In order to identify dietary
sources of industrially produced TFA, since most foods are not labelled, TFA levels were
assessed directly in foods through laboratory analysis. Consumption patterns of foods
potentially high in TFA were separately assessed through household and adolescent surveys.
METHODOLOGY
The detailed methodology of the gas chromatographic analysis together with tables of results
can be found in the original document annexed. Summary tables generated from the original
policy analysis and market survey are also annexed. A summary of the methodology of each
of the four studies is given below.
1) POLICY ANALYSIS
A desk review was performed to collect documents related to regulations, guidelines and
policies at all Ministries handling food. Additional searching was carried out to include import,
export and food balance sheets following the initial review, as well as an update.

17
Key words including oils, fats, TFA and related terms were searched within policies, guidelines
and regulations via Google Scholar, and included both published and unpublished work. The
team hand-searched reports or bibliographies. The search was for the period of June 2019 –
June 2020. The reporting language was not restricted to only English. Any document that was
published in either Sinhalese or Tamil were also reviewed.
STUDY AREA FOR HOUSEHOLD SURVEY, ADOLESCENT SURVEY AND
COLLECTION OF OILS, FATS AND FOODS FOR LABORATORY ANALYSIS
Sampling was done in six of the nine provinces (67% of all provinces) in Sri Lanka. Among
the provinces, one district per province (06 districts) was selected, so as to cover all ethnicities
and as much dietary variation as possible, as given below.
1. Colombo district representing the Western region
2. Kandy district representing the Central region
3. Jaffna representing the Northern region
4. Galle district representing the Southern region
5. Anuradhapura district representing the North Central region
6. Batticaloa district representing Eastern region
2) HOUSEHOLD SURVEY AND ADOLESCENT SURVEY:
Study Design
The design was a descriptive study conducted as a rapid assessment response evaluation 14.
Study Population
Households were sampled and one member was interviewed on household consumption
patterns.
Sample size
The sample size was calculated based on the following formula.
S = [DEFF*Np(1-p)]/ [(d2/Z21-α/2*(N-1)+p*(1-p)]
S – Sample size for infinite population
Z21-a/2– Percentile of the standard normal distribution determined by the specified confidence
level (95% confidence level)
N = Population size – infinite population is considered.
p – Estimated proportion of population consuming foods that are likely contain TFAs (In the
absence of previous estimates of proportion of population consuming foods that are likely
contain TFAs, the sample size was calculated based on 50% to obtain the maximum required
sample).
d – Acceptable margin of error (0.05)
DEFF=Design effect (hypothetical design effect of 1.5 was considered)
With the non-respondent rate of 5%, final sample was rounded for 600.

18
Sampling technique
The required sample size was equally distributed among the six districts and was obtained
using purposive sampling. Of the 100 study units in each district, 70 households were
sampled for the household study and 30 adolescents were selected for the adolescent study
from households that were not included in the household study. Adolescents were from the
age category 12-19years with 50% males and 50% females.
The selection for the household survey was as given below.
• In each selected district the main town and two suburban areas was selected.
• In each such locality, the data collectors did a household survey commencing from a
random point and continue visiting every third house on the right-hand side of the
selected road.
• When encountering a junction, the right-hand road was selected and the procedure
continued.
• In the rare case of ending up on a previously selected road the left-hand road was
selected, instead of the right, and the above procedure continued.
• This process continued till the required number of units were recruited from each
locality
• From a selected house only one respondent was selected
• The data collection was done during Sundays or public holidays to include working
respondents for the household study and school going children for the adolescent
study
Data collection method
Data collection was done using Dooblo data collection software for mobile survey
(https://www.dooblo.net). Standard Tabs were configured with data collection sheets designed
to collect data on consumption of food and socio-demographic data.
Data collection tool
a. Collection of socio-demographic data
The socio-demographic profile of the study sample was collected by employing a standard
socio-demographic data collection sheet which was an interviewer administered questionnaire.
b. Assessment of dietary intake of TFA
Each household or adolescent was administered a semi quantitative food frequency
questionnaire by trained field survey data collectors. The standard food frequency
questionnaire was tailor-made to capture the intake of foods that are likely to contain TFA and
was judgmentally validated before the process and was pretested before the survey in order to
capture TFA consumption more accurately. Each household respondent was asked for
household consumption, and each adolescent was asked for individual consumption of given
food items and frequency as indicated in the questionnaire. In addition, information on whether
the food was homemade or bought from restaurant/grocery was obtained.
19
Data processing, analysis and presentation
Data were doubled checked, cleaned and statistical analysis was done using statistical
package for social sciences (SPSS), version 25. Aggregated data and data disaggregated by
district, for dietary behavior related to foods that are likely to contain TFA, were presented as
percentage of households or adolescents.
A total of 456 households and 181 adolescents who were invited to participate responded.
3) MARKET SURVEY: METHODOLOGY
Study setting was as for the other two surveys described above conducted in 6 districts of the
country.
The supermarkets to be surveyed in each district were selected to represent the variation of
different chains of supermarkets that were in operation in the district. The numbers of
supermarkets surveyed in each district were approximately proportionate to the number of
supermarkets in operation in the district. The data of monthly sale of the oils (L) available in
the supermarkets and butter and fat spreads (as total) (kg) were obtained from the supermarkets
of each district (Annexure 1).
4) LABORATORY ANALYSIS OF OILS, FATS AND FOODS
Analysis of fatty acid profile was carried out by gas chromatography-mass spectrometry
(GCMS). Fatty acid profile including total TFA is presented in g per 100g of fat. Details of
preparation of a composite sample, extraction, methylation of extracted fat, and final analysis
by the gas chromatographic method is annexed (Annexure 2). Use of Fatty acid methyl ester
(FAME) standards together with published FAME GC profiles, performance checks and
standard quality control procedure including external quality control was followed.
Collection of samples
A total of 278 samples of foods which are commonly consumed by Sri Lankans were
analyzed. The number of samples was decided based on the number required to capture the
expected variation of the foods in Sri Lanka and the feasibility of laboratory analysis and
related costs assuming that there are 1000 types of fat containing food with the precision
level of 95%, the required sample size was determined to be 278.
The food samples used for the study belonged to the following categories aiming at including
the range of foods that are likely to contain TFA in the country as well as to assess the
variation of such foods in the selected districts.
1. Packaged foods and food ingredients
2. Ready to eat foods including street foods
3. Branded and non-branded/non-packaged fats and oils available to consumers and
commercial food producers

20
The composite analysis of all four studies together with limitations are is discussed below,
leading to the final proposed strategy for the way forward in developing a TFA policy in line
with WHO REPLACE.
POLICY AND LEGISLATIVE ENVIRONMENT IN SRI LANKA
A table outlining details of policy documents, guidelines, legislative acts, regulations and
standards in relation to TFAs is annexed (Annexure 3).
POLICY DOCUMENTS THAT ARE RELAVANT TO FATS AND TFAS
Policy commitment to address TFA exists. However, a specific policy needs to be
developed that defines TFA limits and bans. Overarching policy coordination is required
to ensure multisector inclusivity.
▪ The National Nutrition Policy15. includes fats and TFA in some areas. The nutrition
policy states that nutrition assessment needs to be done. The policy also states that
health and nutrition should be promoted through a range of activities such as: the food
based dietary guidelines, promoting a healthy workplace guidelines, capacity building
for behaviour change, addressing school’s youth, corporate sector partnerships for good
nutrition, media surveillance for ethical advertising, supporting related policies such as
agriculture, food safety policy, food production and importation. Although fats and
TFA are explicitly referred to only in some places, in doing so the policy has recognised
the need for it to be addressed more fully and creates potential space for addressing fats
and TFA through more direct specific policy development.
▪ The National Policy and Strategic Framework
for the prevention and control of chronic non-
communicable diseases (NCDs)16.
TFA is stated as an unhealthy component of the
diet and a commitment to strengthen policy,
regulatory and service delivery measures to
reduce risk factors including unhealthy diet in
line with both the national nutrition policy and
the WHO global strategy on diet and physical
activity is stated. A commitment to close
coordination with other sectors and the
implementation and strengthening of the Food
Act with reference to labelling, ethical
advertising, health claims and responsible
marketing is stated. Empowering the
community for promotion of healthy lifestyles
is expected to be achieved through public
21
education and community-based surveillance to monitor risk factors. Incorporation of
NCD related health aspects into other ministries is identified as important. The NCD
prevention and control unit of the ministry of healthcare and nutrition will serve as the
operational and coordination body to implement the policy under the national steering
committee for NCD and the national health council. The relevant units under the
provincial director of health services and the regional director of health services will
coordinate at provincial and district level.
▪ Sri Lanka National Agriculture Policy17
This policy aims to increase local food supply and food security, employment
opportunities, and agricultural exports by focussing on cultivation of rice and other field
crops, horticultural crops roots and tuberous crops, export agricultural crops, herbal
crops, other underutilized crops and bee-keeping as well as sugar cane, cashew and
coconut. While food security is only one component of a group of other aims, there is
no focus on nutritionally relevant agriculture. Coconut is promoted with no reference
to other oils or TFA and SFA in oils. There is an urgent need to collaborate with the
Ministry regarding the role of agriculture in shaping the oils and fats available in the
future. In the context of ensuring nutrition security a policy analysis by Institute of
policy studies shows the need for an integrated food security and nutrition policy since
healthy eating from a consumer point of view is shaped by the food environment. In
order to provide a healthy food environment, multisectoral commitment is required.
• Sri Lanka Overarching Agricultural Policy 2017 (draft) 18
Under this policy 10 thematic areas are discussed which include food security as well
as broader trade measures including the regulation of imports. The important concept
of linking the relevant policies for the overall improvement of agriculture is an
important forward step in the right direction towards multisector actions. This policy
provides a suitable environment to incorporate health sector policies that are related to
agriculture such as promoting oil seeds with desirable fatty acid patterns and production
of trait- enhanced oil varieties in the future. This has potential to support replacement
by providing adequate supply of the correct oils and fats. This policy needs to be
modified to incorporate such multisector needs.
POLICY AND REGULATIONS ON IMPORTS AND HEALTH CERTIFICATES
Sri Lanka Trade Policy
Sri Lanka has a three-band tariff structure ranging from zero to 30%, with preferential tariff
benefits under specific trade agreements covering a range of products. However, in an analysis
done by the Institute of Policy Studies, it was observed that ad-hoc changes to tariff rates in
the past has resulted in the common practice of adding adulterants to coconut oil, such as cheap
edible oils or using by-products of the coconut industry19.

22
There is no requirement for prior permission for import for oils and fats other than
butter. This is a missed opportunity with regard to implementing control and scrutiny of
products for fat and TFA content.
The food items meant for “direct human consumption requiring load port survey certificates/
Health Certificates/Certificates of Analysis” requires only “Butter” to be certified or be
analyzed. However, the word ‘butter’ has not been defined and there is no mention of
margarine, or other types of oils and fats or butter products.
Prior permission for import
Although food import control procedure is implemented by the Food Control Administration
Unit (FCAU) of Ministry of Health to ensure that the food imported is safe for human
consumption, food such as vegetable oil, vegetable fat currently need not obtain prior
permission, and the parameters to be tested have not been specified upon.
▪ Customs Regulations (June 2020) Import duties or Tax
The tax structures that prevail for oils and fats as well as special commodity taxes that
maybe imposed for short durations in place of the general taxes are currently based on
trade rationale alone and does not incorporate any health-related justification. Hence a
tax structure that incorporates TFA content of fats will need to also address trade
concerns. The import duty and tax structure for oils and fats need to be created including
the TFA content of oils and fats with possible exemption for those with zero TFA content
and acceptable SFA content. Those that contain TFA greater than 2% of total fat should
be banned and refused entry at the port with a complete import ban on PHO (elaidinzed
fats).
Current taxes
The detailed breakdown of the tax structure for animal or vegetable fats and oils and their
cleavage products is available online20. Specified oils are soya-bean oil, ground-nut oil, olive
oil, palm oil sunflower seed, safflower or cotton-seed oil, coconut (copra), palm kernel or
babassu oil. Virgin coconut oil, is taxed at a higher rate than other oils possibly to support local
farmers, as coconut is the most important oil crop for domestic use and since it is the most
important export crop21. Export earnings from Hydrogenated oil, stearic acid, margarine and
palm oil fluctuate with demand from India, however from time to time Sri Lanka has been able
to maintain hydrogenated oil exports to other countries without exporting to India21. Growth
of the export market also has effects in shaping what is available in the local market.
Special Commodity Levy
With effect from 16th June 2020 the Sri Lankan Minister of Finance, Economic, and Policy
Development imposed a Special Commodity Levy of Rs. 600 on the imports of certain
vegetable fats and oils and their fractions replacing the earlier tax and being the only duty
applicable to import.
The oils and fats referred to are

23
▪ Animal or vegetable fats and oils and their fractions, partly or wholly hydrogenated,
interesterified, reesterified or elaidinised, whether or not refined, but not further
prepared.
▪ Margarine; edible mixtures or preparations of animal or vegetable fats or oils or of
fractions of different fats or oils of this Chapter, other than edible fats or oils or their
fractions of heading 15.16.
▪ This tax was imposed with a trade related rationale and is for a period of 6 months and
was subsequently reduced.
Special commodity levy reduced22.
• As of 26 June 2020 for a period of 6 months, the import tariff has been reduced from
Rs.600 per Kg to Rs. 160 per Kg for vegetable oils and fats and their fractions and to
Rs. 200 per Kg for margarine
STRATEGIES THROUGH IMPORT DUTIES
While import taxation is an important tool that can be used for the reduction of TFA,
particularly PHO, it is currently not utilized for non trade related reasons. As per current Sri
Lanka customs regulations both fats high in TFA such as PHO (elaidinized fats) as well as
interesterified fats are taxed at the same rates. While maintaining the trade rationale, a tax
structure can be devised to include TFA and SFA content, with zero TFA products being
exempt from taxes.
Trade agreements
In formulating future trade agreements, a clause for TFA and fat needs to be
incorporated with any future ban or mandatory declaration of TFA limits imposed
being applicable. This is currently not practiced.
Current trade agreements
- As an attempt to promote trade in South Asia, the India – Sri Lanka Free Trade
Agreement was first signed in December 1998. It also was India’s first bilateral free
trade agreement. Sri Lanka converted imported crude palm oil into Vanaspati and re-
exported to India. Although there are no standards on the content of TFAs for
Vanaspati in Sri Lanka, the food safety regulators in India, under the Food Safety and
Standards (Food Products Standards and Food Additives) Regulations, 2011,
hydrogenated vegetable oils (2.2.6) – amended in 2018: included the requirement for
prior Indian approval for not more than 5% TFA by weight.
- The Pakistan – Sri Lanka Free Trade Agreement was signed in 2002 and came into
implementation in 2005.
- A Singaporean company and Sri Lanka under a trade agreement produces a range of
bakery shortening, specialty fats and margarines for over 5 decades. Shortening can be
bought online. These products are currently not labelled for fat or TFA content.

24
GUIDELINES AND TECHNICAL DOCUMENTS THAT MAKE REFERENCE TO FATS
AND TFAS
Guidelines and tools for restricting TFA and SFA exist in Sri Lanka.
▪ The food based dietary guidelines for Sri Lankans (ministry of Health, 2011)23
includes specific recommendations on fats and oils. The guideline states that the intake
of TFA should be less than 1% of total daily energy intake and saturated fat intake
should be 15 – 25% of total energy intake per day. Foods that are likely to be high in
saturated fats and TFAs are indicated to be limited. The guidelines are currently under
review and will be updated.
▪ The Nutrient Profile Model for Sri Lanka was developed (WHO- South East Asian
Regional office and the Ministry of Health, 2018) for the purpose of restricting
marketing of foods and beverages to children that contains high sugar, salt and fat and
indicate in detail the thresholds for sugar salt and fat for 17 different food categories
that will be restricted. To be considered by the model foods should provide less than
1% TFA of total energy provided by a food. Hence foods high in TFA cannot be
marketed to children. The model can be used in other contexts in the future.
LEGAL/LEGISLATIVE ACTS AND INSTITUTIONS THAT REFERENCE OILS AND
FATS
▪ The Food Act No 26, of 198024, is a legal document of the Ministry of Health. There
have been two amendments to this Food Act; Food (amendment) Act No. 20 of the
199125 and the Food (amendment) Act No. 29 of the 201126. The Food Act is currently
being updated and the final draft has been prepared (2020).
Covers: regulation and control of manufacture, importation, sales and distribution of
food.
Enacted through the ministry of health and its food advisory committee:
Comprises of the following: prohibitions, administration, legal proceedings and
general relevant information.
Prohibitions: in relation to standards, sales, warranty, labelling and packaging and
licensing.
Administration:
− Functions of the food advisory committee (FAC) are defined; FAC, the apex body
in Sri Lanka, is responsible for the country’s Food Control Administration.
− The Director General of Health Services is chairman and is the Chief Food
Authority of Sri Lanka.
− FAC recommends the standards and regulations for all foods to be adopted by the
Government and the standards institution
− The Director General of the Sri Lanka Standards Institution (SLSI), or a nominee,
is a member of the FAC.

25
▪ The SLSI with the Food Control Authority: is authorized by law to formulate national
food standards under the Food Act, aligned to CODEX Alimentarius standards. This
includes oils and fats. (occasionally the commissioner of Internal Trade through a
cabinet directive may lay standards.
Provision exists for mandatory food standards to be proclaimed by the government.
(the minister, advised by the food advisory committee, or a sub-committee)
These standards prescribe the requirements and methods of sampling and testing of oil.
A standard is only a technical expression of how to make the food safe, efficient, and
compatible with others, there are no quality indicators in it from a nutritional
perspective to conform to: there are no specifications for the fatty acid content or TFA
for one particular oil. Incorporation of this can be a benchmark to be used in monitoring.
However, a monitoring protocol needs to be devised to check foods and oils against the
standards that are set.
Enforcement of the food act is through the ministry of health and its field staff.
The legal proceedings, nature of offences and punishment, protection for action taken
in good faith such as fines are also detailed in the Act.
26
REGULATIONS ON STANDARDS UNDER THE FOOD ACT
▪ Food (Standards) Regulations27
Under the Section 32 of the Food Act, No. 26 of 1980 and the regulations of 2008 which is
currently valid, and the new draft, regulations are made by the Minister of Health of Sri Lanka
in consultation with the Food Advisory Committee or a sub-committee. The detailed standards
for oils and fats are annexed (Annexure 4 and 5).
Aligning of regulations with health recommendations is required in Sri Lanka. Best practice
examples include: The American Heart Association recommends that adults reduce their intake
of TFA with the use soft margarine as a substitute for butter, and choose soft margarines (liquid
or tub varieties) over harder stick forms. Thus, the regulations need not only specify the type
of oils and fats, but also its form and percentage. The standards require significant upgrading.
REGULATIONS ON LABELLING AND ADVERTISING OF OILS AND FATS UNDER
THE FOOD ACT
▪ Food (labelling and advertising) Regulations 200528
Under the Food Act No 26 of 1980, a regulation was gazetted, named as the Food (labelling
and advertising) Regulations 2005.
It is specified that the labeling should be in accordance with the Food (Labelling and
Advertising) Regulations 2005 and specification to include on the package containing
edible oil or fat in its single form the common name of the vegetable or animal from which
the edible oil or edible fat is derived, and in mixture of edible oil or edible fat, blended
vegetable oil or blended vegetable fat or blended animal oil or blended animal fat. The
blended oil or blended fat shall have the common name of the animal fat or vegetable oil
or vegetable fat in descending order of the proportion present.
Any edible oil, whether it be a salad oil, vegetable oil or a blended vegetable oil, should
have its common name and the source of origin. These can only be labelled as such only if
they contain more than 75% of the main oil which they declare it to be. The label cannot
bear the word ‘butter’ if it contains not less than 4% by weight of butter fat.
▪ Mandatory TFA and SFA labelling regulations
The final draft of the revised (2020) labelling and advertising regulations under the Food
Act, includes the following:
Where the amount and/or type of fatty acids or the amount of cholesterol is declared, this
declaration shall follow immediately the declaration of the total fat.
The following format should be used
Total Fat in grams, of which
Saturated fatty acids in grams (g)
TFA in grams (g)
Mono unsaturated fatty acids in grams (g)
Polyunsaturated fatty acids in grams (g)
Cholesterol in milligrams (mg)
27
In a situation where the label is acceptable but where the TFA is greater than 2%, a protocol
needs to be devised giving the FCA authority to request reformulation of the products in order
to reduce TFA while either reducing or maintaining the SFA content.
Labeling of products with the method used for production of the fat would be useful to enact a
PHO ban and could be considered.
LABELLING AND CLAIMS
Once mandatory TFA regulations are in place zero TFA (TFA free) claims should ideally
not be allowed or only be allowed, provided the limits for salt, sugar and saturated fats
are met and are in accordance with the specified limits for the different food categories
in the nutrient profile model. The claim, “TFA free” is currently not approved for use
under the European Union nutrition and health claims law29. Making a product TFA free
does not confer any additional nutritional value to the food apart from making the food
safer. Foods labeled as TFA free may have trace amounts of TFA and some individuals
may consume more of these foods under the notion that they are healthy foods although
they may contain significant amounts of saturated fats, sugar or salt.
Claims: limits for specific claims on fat or oil
▪ Reduced fat as specified by the Food (Fats and Oils Standards) Regulations – 2006
- specifies greater than 30% and not more than 60%
▪ Food (labelling and advertising) Regulations 2005 specifications on limits:
− Low fat - total fat or oil content in a fat spread is not more than 30%
− Low fat - not more than 3g per 100g for solids and 1.5 g per 100ml for liquids.
− Fat free - not more than 0.5g per 100g for solids or 100ml for liquids.
− Low in saturated fat - if the saturated fat is not more than 1.5 g per 100g for solids
and 0.75g per 100ml for liquids and provides less than 10% of energy: a foot note
is added - where the “TFAs should be taken into account where applicable”. The
amount nor the content is stated
− Saturated fat free - saturated fat content is not more than 0.1g per 100g for solids or
100ml for liquids.
− Cholesterol free - not more than 0.005g per 100g for solids and 1.5 g saturated fat
per 100g for solids, and for a liquid product it would be 0.005 g per 100ml and
0.75g of saturated fat per 100ml and 10% energy of saturated fat.
− Low in cholesterol - cholesterol content is not more than 0.02g per 100g and 1.5g
saturated fat per 100g in solid and in a liquid product - not more than 0.01g per
100ml and 0.75g saturated fat per 100ml and 10% of energy of saturated fat.
Defining the extent of claims: it is specified that the claims can be made, but with the clause
that all other foods will also have similar claims. The example quoted for such claims is the
absence of cholesterol in all vegetable oils. Further the regulation specifies that claims cannot
mention that fats are protection against heart diseases or of benefit to persons suffering from
heart diseases.
28
The Nutrient Profile Model of the Ministry of Health is a guide document that helps identify
foods and non-alcoholic beverages that can/cannot be marketed to children and incorporates
TFA limits. -This is a strong tool to be used for multiple purposes
▪ Food (Colour coding for Sugar, Salt and Fat) Regulations 2019 30
These regulations came into operation in June 2019, specifies that a food product cannot be
packaged, sold or advertised unless color coded into red, orange and green. The green coding
is for food items with less than 3g of total fatty acids 100g, whereas a food product is coded
red if it has more than 17.5g of total fatty acids per 100g and all other food products will be
coded orange if the fatty acid content is in between 3g to 17.5 g per 100g.
CIRCULARS TO SAFEGUARD CONSUMERS FROM UNHEALTHY OILS AND
FATS
As per the circular No. 35/2015 (dated 2015.12.31), titled: Maintenance of Healthy Canteens
in Schools31.
- Foods containing fats and TFAs, are prohibited in school canteens.: examples given are
processed meat such as ham, sausages, brockworst, lingus, bacon or foods made with
these, pastries and puffs, deep fried foods, rolls, patties, samoza, cutlets, fried potatoes
and manioc and as the final category, processed meat, fish and their products.
- Sale of food cooked using oil: only coconut oil to be used for deep-frying and not
vegetable oils such as palm oil. Oils such as gingerly oil, olive oil, canola oil, sun-
flower oil, maize oil, and soya oil for tempering and roasting food are allowed.
Although it is specified that the sale of deep-fried items of food should be limited and
that the oil used for deep frying should not be re-used, a mechanism for monitoring or
evaluating the school canteens such as through the PHI has not been identified.

29
DISCUSSION OF FINDINGS FROM THE HOUSEHOLD
SURVEY, ADOLESCENT SURVEY, MARKET SURVEY
AND ANALYSIS OF FATTY ACIDS AND TFA IN OILS,
FATS AND FOODS.
BASELINE CHARACTERISTICS OF THE HOUSEHOLD AND ADOLESCENT
SURVEYS
The household study represented the main ethnic groups in the different districts and showed
the expected pattern as depicted in figure 1, indicating that the household survey was
adequately representative of the population in the country. However, while it documented
household consumption of food brought to the house, it did not adequately represent eating
behavior of the working population including the purchase of convenience foods while at work.
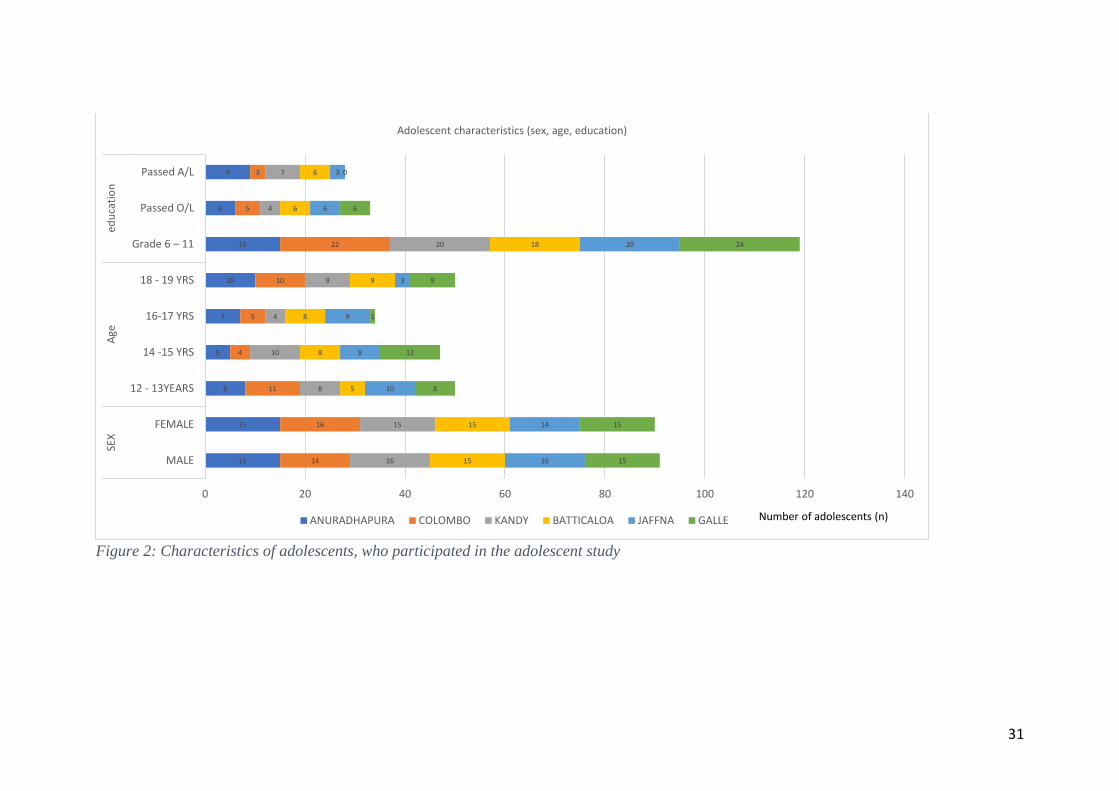
The adolescent study included girls and boys of equal proportions and represented the different
age groups and consequently the education levels adequately as depicted in figure 2.

30
Figure 1: Distribution of ethnicity: Household survey and adolescent survey
49.34 48.62
100
76.6780
93.33
63.29
67.74
0 0 0 0
49.38
53.33
28.95 29.28
0 0
18.67
6.67
26.5829.03
30.99
40
100 100
0 0
21.49 22.1
0
23.33
1.33 0
8.86
3.23
69.01
60
0 0
50.62
46.67
0
20
40
60
80
100
120
Households Adolescents Households Adolescents Households Adolescents Households Adolescents Households Adolescents Households Adolescents Households Adolescents
All Anuradhapura Colombo Kandy Batticaloa Jaffna Galle
Sinhala Tamil Muslim Malay
% of people
31
Figure 2: Characteristics of adolescents, who participated in the adolescent study
15
15
8
5
7
10
15
6
9
14
16
11
4
5
10
22
5
3
16
15
8
10
4
9
20
4
7
15
15
5
8
8
9
18
6
6
16
14
10
8
9
3
20
6
3
15
15
8
12
1
9
24
6
0
0 20 40 60 80 100 120 140
MALE
FEMALE
12 - 13YEARS
14 -15 YRS
16-17 YRS
18 - 19 YRS
Grade 6 – 11
Passed O/L
Passed A/L
SEX
Age
edu
cati
on
Adolescent characteristics (sex, age, education)
ANURADHAPURA COLOMBO KANDY BATTICALOA JAFFNA GALLE Number of adolescents (n)

32
EDIBLE OIL PRODUCTION, IMPORT/EXPORT ENVIRONMENT, MEAN COST
OF OILS AND OIL SALES FROM SUPERMARKETS.
An analysis done by the institute of policy studies in 2013 indicated that over 90% of domestic
production of oil crops are consumed within the country with only 8% of gross availability
being exported19. In 2017 domestic supply of oil crops including coconut was 2,500,000 metric
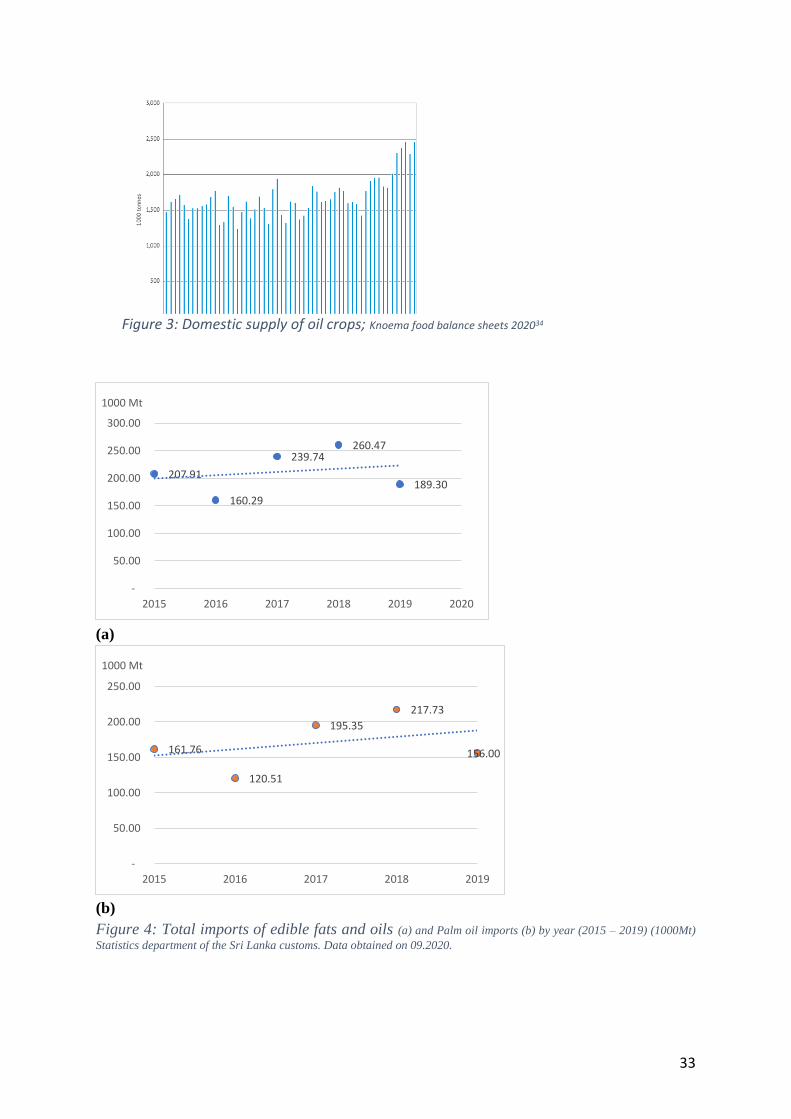
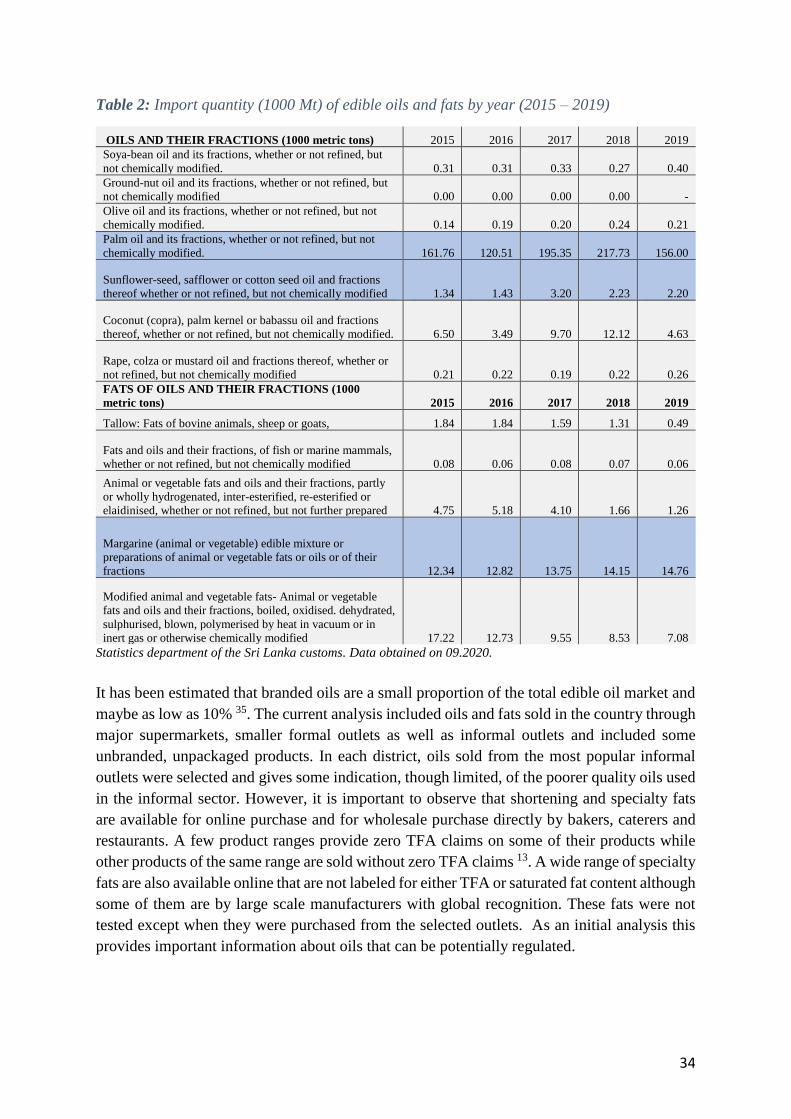
tons (figure 3). Data on import of edible oils and fats over the last 5 years as documented by
the statistics department of the Sri Lanka customs shows important trends (figure 4a, b). There
is an overall rising trend in imports of edible fats and oils and palm oil in particular. It is also
important to observe that the total amounts of palm oil are much higher when compared to
other oils and fats, with palm oil imports being 156,000 metric tons in 2019 compared to 400
metric tons for soya and 2000 metric tons for sunflower oil. Margarine imports reached 14,760
metric tons. While mixtures of both animal and vegetable fat are included in the margarine
category, a steady gradual rise in margarines can be seen (table 2). Import data suggests that a
sizable quantity of mixtures of prepared fats
are imported and likely to include specialty
fats and shortening under the category,
margarine. Whether these fats are partially
hydrogenated or interesterified is not
identified. Both unmodified and modified
animal fats have decreased steadily. Import
of chemically modified animal and vegetable
fats (using processes that minimally affect
TFA) as well as those that have been
hydrogenated or interesterified but not
further prepared have fallen. It is apparent that the grouping of oils and fats have no bearing on
their properties in relation to health, with hydrogenated and inter esterified oils being grouped
together, as well as animal and vegetable oils. If regulations via taxation policies are to be
introduced, oils and fats will need to be regrouped using new criteria. This data highlights the
importance of clearly identifying partially hydrogenated oils in order to ban them from being
imported while also identifying inter esterified oils to provide tax exemption. Sri Lanka joined
the World Trade Organization in 1995, under which, equal conditions must be applied to
imports and the domestic market32. Further, given the magnitude of the domestic supply it is
equally important to ban partially hydrogenated oils in the domestic market. Since there is no
specific test that can identify partially hydrogenated fats or oils, a mandatory regulation
ensuring TFA less than 2 % of total fat in fats and oils is required. Further commitment by
industry for voluntary interesterification to reach a final goal of zero TFA by 2023 can be
advocated. Sharing of knowledge held by the multinational companies with medium
enterprises has been advocated globally and needs to be done in Sri Lanka too33.
33
(a)
(b)
Figure 4: Total imports of edible fats and oils (a) and Palm oil imports (b) by year (2015 – 2019) (1000Mt)
Statistics department of the Sri Lanka customs. Data obtained on 09.2020.
207.91
160.29
239.74 260.47
189.30
-
50.00
100.00
150.00
200.00
250.00
300.00
2015 2016 2017 2018 2019 2020
1000 Mt
161.76
120.51
195.35
217.73
156.00
-
50.00
100.00
150.00
200.00
250.00
2015 2016 2017 2018 2019
1000 Mt
Figure 3: Domestic supply of oil crops; Knoema food balance sheets 202034
34
Table 2: Import quantity (1000 Mt) of edible oils and fats by year (2015 – 2019)
OILS AND THEIR FRACTIONS (1000 metric tons) 2015 2016 2017 2018 2019
Soya-bean oil and its fractions, whether or not refined, but
not chemically modified. 0.31 0.31 0.33 0.27 0.40
Ground-nut oil and its fractions, whether or not refined, but
not chemically modified 0.00 0.00 0.00 0.00 -
Olive oil and its fractions, whether or not refined, but not
chemically modified. 0.14 0.19 0.20 0.24 0.21
Palm oil and its fractions, whether or not refined, but not
chemically modified. 161.76 120.51 195.35 217.73 156.00
Sunflower-seed, safflower or cotton seed oil and fractions
thereof whether or not refined, but not chemically modified 1.34 1.43 3.20 2.23 2.20
Coconut (copra), palm kernel or babassu oil and fractions
thereof, whether or not refined, but not chemically modified. 6.50 3.49 9.70 12.12 4.63
Rape, colza or mustard oil and fractions thereof, whether or
not refined, but not chemically modified 0.21 0.22 0.19 0.22 0.26
FATS OF OILS AND THEIR FRACTIONS (1000
metric tons) 2015 2016 2017 2018 2019
Tallow: Fats of bovine animals, sheep or goats, 1.84 1.84 1.59 1.31 0.49
Fats and oils and their fractions, of fish or marine mammals,
whether or not refined, but not chemically modified 0.08 0.06 0.08 0.07 0.06
Animal or vegetable fats and oils and their fractions, partly
or wholly hydrogenated, inter-esterified, re-esterified or
elaidinised, whether or not refined, but not further prepared 4.75 5.18 4.10 1.66 1.26
Margarine (animal or vegetable) edible mixture or
preparations of animal or vegetable fats or oils or of their
fractions 12.34 12.82 13.75 14.15 14.76
Modified animal and vegetable fats- Animal or vegetable
fats and oils and their fractions, boiled, oxidised. dehydrated,
sulphurised, blown, polymerised by heat in vacuum or in
inert gas or otherwise chemically modified 17.22 12.73 9.55 8.53 7.08
Statistics department of the Sri Lanka customs. Data obtained on 09.2020.
It has been estimated that branded oils are a small proportion of the total edible oil market and
maybe as low as 10% 35. The current analysis included oils and fats sold in the country through
major supermarkets, smaller formal outlets as well as informal outlets and included some
unbranded, unpackaged products. In each district, oils sold from the most popular informal
outlets were selected and gives some indication, though limited, of the poorer quality oils used
in the informal sector. However, it is important to observe that shortening and specialty fats
are available for online purchase and for wholesale purchase directly by bakers, caterers and
restaurants. A few product ranges provide zero TFA claims on some of their products while
other products of the same range are sold without zero TFA claims 13. A wide range of specialty
fats are also available online that are not labeled for either TFA or saturated fat content although
some of them are by large scale manufacturers with global recognition. These fats were not
tested except when they were purchased from the selected outlets. As an initial analysis this
provides important information about oils that can be potentially regulated.
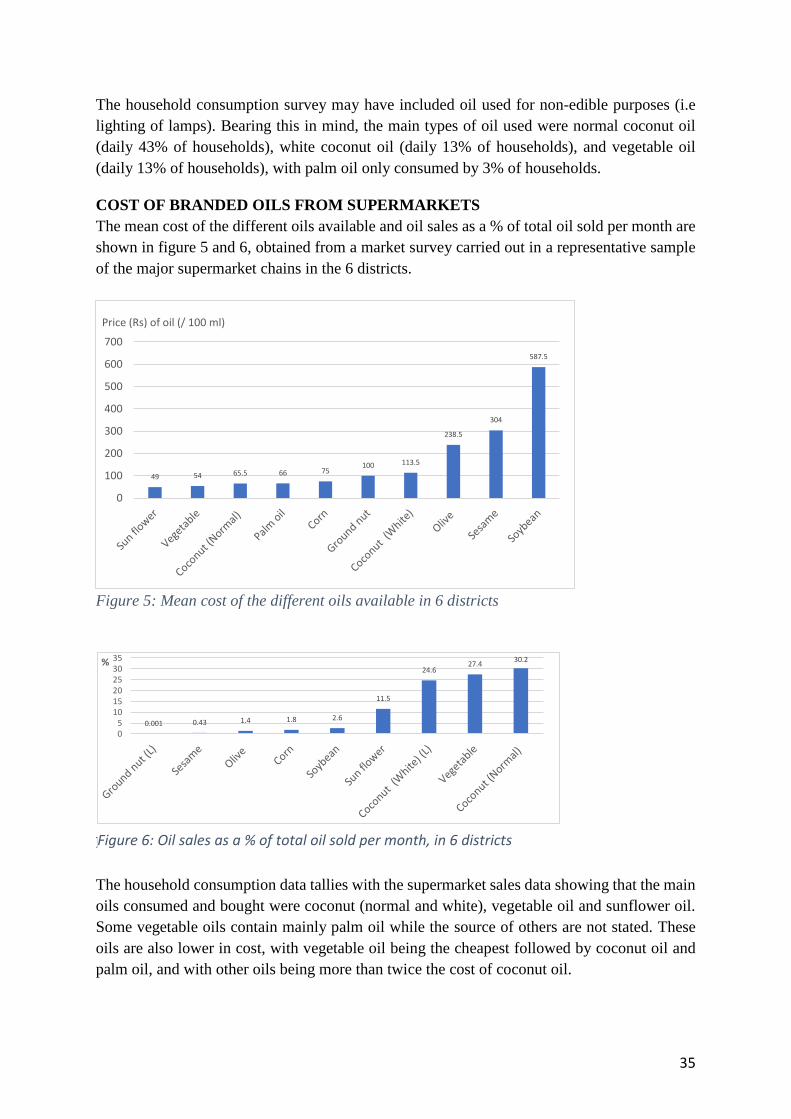
35
The household consumption survey may have included oil used for non-edible purposes (i.e
lighting of lamps). Bearing this in mind, the main types of oil used were normal coconut oil
(daily 43% of households), white coconut oil (daily 13% of households), and vegetable oil
(daily 13% of households), with palm oil only consumed by 3% of households.
COST OF BRANDED OILS FROM SUPERMARKETS
The mean cost of the different oils available and oil sales as a % of total oil sold per month are
shown in figure 5 and 6, obtained from a market survey carried out in a representative sample
of the major supermarket chains in the 6 districts.
Figure 5: Mean cost of the different oils available in 6 districts
Factors around purchase of edible oils and consumption
The household consumption data tallies with the supermarket sales data showing that the main
oils consumed and bought were coconut (normal and white), vegetable oil and sunflower oil.
Some vegetable oils contain mainly palm oil while the source of others are not stated. These
oils are also lower in cost, with vegetable oil being the cheapest followed by coconut oil and
palm oil, and with other oils being more than twice the cost of coconut oil.
49 54 65.5 66 75100 113.5
238.5
304
587.5
0
100
200
300
400
500
600
700
Price (Rs) of oil (/ 100 ml)
0.001 0.43 1.4 1.8 2.6
11.5
24.627.4
30.2
05
101520253035%
Figure 6: Oil sales as a % of total oil sold per month, in 6 districts

36
The household income of both Colombo and Kandy is skewed to the right from the mean (total)
indicating households with a higher income in these 2 areas (Figure 7). This is reflected in the
buying of oil from supermarkets, with a greater volume sold in these 2 districts. The volume
sold is comparable between districts (Figure 8) and is possibly due to an equal number of
supermarkets being sampled in each area. Making allowance for the increased population
density, higher household income may still be associated with greater oil volumes purchased.
Figure 7: Distribution of household income in 6 districts
The supermarket survey indicated that margarines and fat spreads were more popular than
butter and accounted for 75.3% of the total sales of fat. Both vegetable and animal ghee was
available in solid and semisolid form. Vegetable ghee from 100 palm oil and its fraction which
are labeled TFA free are low cost options. Both Ghee and Vanaspati is produced in households
in some areas and show lower (2.6%) sales from supermarkets.
1.32
11.62
55.04
17.549.43
2.85 1.75 0 0.441.23
11.11
66.67
11.11 8.640 1.23 0 02.67
13.33
30.6726.67
166.67
2.67 0 1.330 0
30.3839.24
20.25
7.592.53 0 00
6.67
58.67
17.3310.67
2.67 2.67 0 1.334.23
36.62
56.34
2.82 0 0 0 0 004
88
6.670 0 1.33 0 0
0
20
40
60
80
100
< 10,001 10,001 -25,000
25,001 -50,000
50,001 -75,000
75,001 -100,000
100,001 -150,000
150,001 -200,000
200,001 -250,000
>250,001
% households
Total Galle Colombo Kandy Anuradhapura Batticaloa Jaffna
1859
564251
2322
49666
5557
2455
473196
2607
36140
6132
0
1000
2000
3000
4000
5000
6000
7000
Colombo Galle Jaffna Kandy Anuradhapura Batticaloa Total volume
Volume of oil (L)
Ground nut Seseme oil Olive oil Corn Soya bean
Sunflower Coconut (white) Vegetable oil Coconut (normal)
Figure 8: Volume of oil sold by district

37
TFA LEVELS IN OILS FATS AND FOODS
A nationally representative sample of oils, fats and foods purchased from supermarkets were
analysed by GCMS for TFA content (Table 3).
Table 3: TFA per 100g of total fat, in oils fats and food items
%TFA
Range Colombo Kandy Galle Anuradhapur
a Jaffna Batticaloa
Street
Food Fried rice 0.0 - 1.6 0.00 1.60 0.50 0.00 1.60 0.62
Kottu 0.0 - 0.76 0.00 0.76 0.64 0.00 0.00 0.00
Cutlets 0.0 - 2.0 0.00 0.00 0.00 2.00 0.00 0.00
Rolls 0.0 - 1.23 0.00 1.23 0.00 0.30 0.70 0.86
dhal wade 0.0 - 0.5 0.00 0.00 0.00 0.50 0.00 0.00
Ulundu wade 0.0 - 1.02 0.00 0.00 0.00 1.20 0.70 1.02
Prawn wade 0.00 - 0.6 0.00 0.60 0.00 0.00
Samosa 0.8 - 1.8 1.36 0.83 1.36 0.80 1.80 1.36
Patties 0.7 - 2.0 1.62 0.78 1.05 0.70 2.00 1.05
Curry rotti 0.00 - 1.93 1.93 1.00 1.00 0.00 0.00 1.00
Murukku 0.0 - 1.48 0.57 0.00 0.00 0.60 0.00 1.48
Manioc chips 0.00 - 0.8 0.69 0.00 0.69 0.80 0.00 0.69
dodol 0.00 - 0.80 0.00 0.00 0.00 0.80 0.00 0.00
Unduwel 0.00 - 1.00 0.00 0.46 0.00 1.00 1.00 0.60
Kadala 0.00 - 1.2 1.01 0.45 0.45 1.20 0.00 0.00
Popcorn 0.00 - 0.89 0.89 0.00
Restaurant
& Bakery Fried Whole
chicken
0.00 - 1.63 0.45 0.69 1.59 0.00 1.00 1.63
Chicken nuggets 0.2 - 1.26 0.27 1.26 1.26 1.00 0.20 0.28
Fried whole fish 0.00 - 1.02 0.64 0.00 0.20 0.60 1.02
Chilli paste 0.00 - 3.92 3.92 1.20 1.07 0.70 0.00 0.94
French fries 0.24 - 1.6 0.24 1.60
Manioc chips 4.06 4.06
Popcorn 0.00 - 2.04 2.04 0.00 2.04 0.70 1.10
Fried rice 0.00 - 1.60 0.00 1.60 0.00 0.30 0.00 1.48
Kottu 0.00 - 1.20 0.00 0.76 0.76 0.00 1.20 0.00
Pizza 0.00 - 1.7 0.00 0.70 0.33 1.70 0.00 0.71
White bread 0.00 - 1.80 0.00 0.00 0.00 1.80 0.00 0.00
Sandwich bread 0.00 - 1.45 0.00 1.45 0.00 0.00 0.00 0.00
Parata 0.00 - 1.90 0.00 1.86 1.85 0.40 1.90 0.75
Poori 0 0.00 0.00
oils and
fats
Coconut oil-
white
0.00 - 0.46 0.23 0 0 1.1 0.46
Sunflower oil 0.00 - 0.96 0.96 0
Normal coconut
oil
0 0.00 0 0 0 0.00 0
Palm oil 0.45 - 1.21 1.21 0.74 0.74 1.1 1 0.45
Vegetable oil 0.0 - 0.91 0.91 0.91 0.50 0.00 0.00
Corn oil 0 0.00
Gingelly oil 0.00 - 0.8 0.00 0.8 0
Fat spread 0.00.- 3.72 0.00 3.72 0.00 3.72
Fat spread
(unbranded)
0 0.00
Ghee (dairy) 0.00 - 0.5 0.00 0 0.50 0.00 0.00
Pastry Margarine 0 0.00
Vegetable Ghee 0.00 - 1.3 0 1.3
Cake compound 0.00 - 0.9 0.9 0.8 0.00
Margarine 0.5 0.5

38
Pre
packaged
Milk Short cake
biscuit
0.3
Ginger biscuit 0.4
Butter cake 0.4
Marie biscuits 2.1
Bran cracker 0.0
White bread 0.0
Bun 0.0
sponge roll 0.9
Hawaian cookies 0.0
Chocolate
biscuit
0.0
Branded
oils and
fats
Vegetable
oil(branded)
0.0
corn
oil (branded)
0.0
Sunflower
oil (branded)
0.8
Soybean
oil (branded)
0.0
Margarine (brand
ed)
1.6
Rice cracker 0.5
Cream cracker 0.6
Baked Savory
Snacks
0.0
Instant noodle 0.4
Noodle oil
sachet
0.4
Lemon puff 0.0
Chocolate puff 0.0
Chocolate cake 1.7
Fried snacks
(Tipi Tip)
0.0
Chocolate chip
cookies
0.0
Kurakkan Bread 0.0
Instant soup-
chicken
0.0
Instant soup-
vegetable
0.0
Potato chips 0.0
Instant kottu 1.0
Chilli paste 5.2
Margarine (fat
spread 2)
0.0
Mayonnaise 2.6
Sausages 0.3
Chicken nuggets 1.0
Spaghetti 0.0
Muffin 1.3
donuts 0.0
Brown bread 0.0
Meat balls 0.0
Chicken fingers 0.0
Murukku 0.0
Manioc chips 0.5

39
SUPERMARKET OR GROCERY FOODS/ INGREDIENTS THAT ARE PRE-
PACKAGED (NATIONAL DATA)
Contrary to general expectations, most prepackaged foods including the branded oils and fats
sampled had total TFA less than 2% of total fat for most foods studied. Since butter has
naturally occurring TFA and it is currently labeled, it was not analysed by GC. The TFA
content of butter as stated on the labels ranges from 3.4% – 4.6% TFA of total fat. Of the foods
with TFA values higher than 2%, Marie biscuit (0.6% Elaidic acid, 1.5% Linolelaidic acid)
was the only significant food, given its popularity among children. Mayonnaise and chili paste
being foods consumed in small quantities and infrequently (Figure 9). However, this is not a
reason for complacency and needs to be viewed as an opportunity to work towards Zero TFA.
Since most multinational companies have the technology for reducing TFA, support needs to
be given to small companies and the informal food sector that produces packaged foods. The
current analysis was done on packaged foods bought from the formal sector and this maybe
one reason for the low TFA. Informal packaged foods may contain levels similar to the street
foods studied and needs to be evaluated.
Figure 9: %TFA of prepackaged food. (supermarket or grocery foods/ Ingredients - national data)
TFA % of all foods tested in different categories -nationally representative sample
Across the total sample most foods had TFA levels less than 2% of total fat. Cutlets, patties,
chilli paste, manioc chips, pop corn, fat spread and Marie biscuit (0.6% Elaidic acid, 1.5%
Linolelaidic acid) were the only foods with %TFA > 2%.
0 0 0 0 0 0 0 0 0 0 0 0 0 0 0 0 0 0 0 0 0 0 00.30.30.40.40.40.50.50.60.60.80.9 1 1
1.31.61.7
2.12.6
5.2
0
1
2
3
4
5
6
Bra
n c
rack
er
Bu
n
Ch
oco
late
bis
cuit
Ch
oco
late
ch
ip c
oo
kies
Ch
oco
late
pu
ff
corn
oil
Frie
d s
nac
ks(T
ipi T
ip)
Haw
aiia
n c
oo
kies
Ku
rakk
an B
read
Lem
on
pu
ff
Soyb
ean
oil
Veg
eta
ble
oil
Wh
ite
bre
ad
Inst
ant
sou
p-c
hic
ken
Inst
ant
sou
p-v
ege
tab
le
Po
tato
ch
ips
Mar
gari
ne
(fat
sp
read
2)
Spag
het
ti
do
nu
ts
Bro
wn
bre
ad
Mea
t b
alls
Ch
icke
n f
inge
rs
Mu
rukk
u
Milk
Sh
ort
cak
e b
iscu
it
Sau
sage
s
Bu
tte
r ca
ke
Inst
ant
no
od
le
No
od
le o
il sa
chet
Ric
e cr
acke
r
Man
ioc
chip
s
Cre
am c
rack
er
Gin
ger
bis
cuit
Sun
flo
wer
oil
spo
nge
ro
ll
Inst
ant
kott
u
Ch
icke
n n
ugg
ets
Mu
ffin
Mar
gari
ne
Ch
oco
late
cak
e
Mar
ie b
iscu
its
May
on
nai
se
Ch
illi p
aste
%TFA

40
TOTAL % TFA IN COMMON OILS AND FATS FROM SMALL ENTERPRISES
AND STREET VENDORS IN 6 DISTRICTS
Common oils purchased from the informal sector were analysed by GCMS for fatty acid
content including TFA.
The total TFA content of commonly used oils and fats in 6 districts have been shown in Figure
10. The TFA content of the more commonly consumed oils were lower than 2% of total fat
except for fat spread from Kandy and Batticaloa (3.72%). Fat spread from other districts had
zero TFA. Variation in TFA content of coconut oil and palm oil between districts is suggestive
of different purification states and may indicate varying standards. This highlights the need for
setting clear standards, testing and monitoring for oils sold in the informal sector. Normal
coconut oil was zero TFA in all districts. White coconut oil ranged from 0% in 2 districts and
0.23% in Colombo, 0.46% in Batticaloa to 1.1% in Jaffna. It is not clear if the higher TFA
containing coconut oils were adulterated with other
oils. Vegetable oil ranged from 0% to 0.91% and is
likely to be made from a mixture containing some
palm oil. The composition of vegetable oil is often
palm oil and its fractions. Palm oil contained
between 0.45% and 1.21 % TFA. Gingelly oil from
Jaffna contained 0.8 % TFA and from Colombo was
zero TFA. Of all the types of specialty fats available
to caterers only cake compound, pastry margarine,
fat spread and ghee were analysed. It is not known, if specialty fats available in Sri Lanka are
manufactured using interesterification or not but the fact that some of these fats tested had zero
TFA is suggestive that such technology is used at least by some manufacturers. Partial
hydrogenation is a method requiring expensive machinery and it is unlikely to be produced at
cottage scale. Further there are multinational companies producing fats and oils in Sri Lanka.
Mandatory labelling of oils and fats with TFA and SFA content is an important step to identify
and eliminate fats which are undesirable. As a next step, the main manufacturers who have the
technology need to be identified and encouraged to share expertise with other small scale
producers. Although Vanaspati which is a vegetable ghee has been found to have higher
amounts of TFA (from 14.2-34.3%) in India36,37. Vanaspati sold among informal vendors in
Sri Lanka did not have high TFA. Vanaspati with zero trans has been produced in Sri Lanka in
the past and export products need to meet the standards of the global market.
A variety of specialty fats available in Sri Lanka are both imported and produced locally by
both national and multinational companies. The types of fats are given below as obtained
from the websites of the main companies in production and wholesale and retail sales.

41
Specialty fats
Brand (a) Brand (b)
Super cake margarine Biscuit fat
Premium cake margarine Bread fat
Super volume margarine Bun compound
Pastry margarine Bread compound
General purpose margarine Margarine
Bread compound Pan lubricant
Bun compound Brand (e)
Bread fat Fat spread
Biscuit dough fat Bun compound
Pan lubricant Creaming fat
Brand (c) Bread pan lubricant
Dough shortening Puff pastry fat
Pastry margarine Margarine
Margarine Bread compound
Brand (d) Specialized biscuit fat
Pure vegetable fat oil All purpose fat
All purpose cake margarine
Premium margarine
Superfine Margarine

42
0 0 0 0
0.740.91
0
0.5
1
Normalcoconut oil
Fat spread PastryMargarine
VegetableGhee
Palm oil Vegetableoil
Oils and Fats : GALLETrans fat (% of the total fat) of
0 0
0.5 0.5
0.91.1
0
0.5
1
1.5
Coconut oil-white
Normalcoconut oil
Ghee Vegetableoil
Cakecompound
Palm oil
Oils and Fats : AnuradhapuraTrans fat (% of the total fat) of
0 0 0 0 0 00.23
0.91 0.961.21
0
0.5
1
1.5
Oils and Fats : COLOMBOTrans fat (% of the total fat) of
0 0
0.5
0.8 0.81 1.1
1.3
0
0.5
1
1.5
Normalcoconut oil
Vegetableoil
Margarine Cakecompound
Gingerly oil Palm oil Coconutoil-white
Vegetableghee
Oils and Fats : JaffnaTrans fat (% of the total fat) of
Figure 10: % TFA in fats and oils consumed in 6 districts
0 0 0 00.45 0.46
3.72
0
1
2
3
4
Normalcoconut oil
Vegetableoil
Cakecompound
Gingerly oil Palm oil Coconut oil-white
Fat spread
Oils and Fats : BatticaloaTrans fat (% of the total fat) of
0 0 0 0
3.72
0.74
0
1
2
3
4
Coconutoil-white
Sunfloweroil
Normalcoconut
oil
Ghee Fat spread Palm oil
Oils and Fats : KANDYTrans fat(% of the total fat) of

43
TOTAL TFA IN STREET FOODS
Figure 11 – 16 show the consumption pattern of street foods containing TFA within the districts
of Colombo, Kandy, Galle, Anuradhapura and Jaffna. Percentage of adolescents ( red bars) and
percentage of households ( blue bars) are indicated on the y axis. The foods are presented in
increasing order of %TFA along the x axis, with the dotted line indicating that all foods on the
right of it have higher TFA than the acceptable limit of 2g TFA per 100g of total fat (%TFA).
Overall, TFA levels varied between districts as did the patterns of food consumption. Fat spread
was the only oil with a TFA value of 3.72%, but none of the foods had such a high TFA level.
Most foods sampled were foods that are usually cooked using liquid oils and TFA levels are
suggestive of this. The oils sampled from informal vendors on average had lower TFA levels
than were recorded for the deep fried items which were slightly higher though still under 2%.
Colombo
Within Colombo district, all street foods that contained any TFA, had values below 1.62% TFA
per Total fat which is below the accepted limit. Daily consumption among adolescents was not
very common and was highest for rolls (0%) and samosa (1.36%). However, 1 in four
adolescents consumed fried rice and rolls and one in five consumed ulundu vadai 3-4 times per
week. Dhall vadai and murukku were consumed by 16% and 13%, 3-4 times per week. Daily
consumption of these foods were not common among the households selected, with a weekly
consumption recorded for fried rice (29%) and rolls (16%). Dhal vadai(12%) and murukku
(8.8%) were consumed by less households 3 -4 times per week. Manioc chips were consumed
by households (10.6% 3 – 4 times a week; 13% weekly) and 3.3% of adolescents (3 -4 times
per week) (Figure 11).
Figure 11: Consumption of Street food in the Colombo District
0
18.99
15.19
2.67
13.3310.67
0 0 02.67
13.33
29.33
46.67
16
1.33
129.33
1.33
9.338
0 01.33
0
8.87.5
0
10.6713.33
1.334
6.67
2.674
9.33
3.33
13.33
6.67
0
6.67 6.67
0 0 0 0
26.67
16.67
6.67
26.67
13.33
10
16.67
10
3.33
20
3.33
0 0
3.331.11
13.3
5.56
0
3.33
0
6.67
10
6.67
0
6.67 6.67
0
5
10
15
20
25
30
35
dai
ly
3 -
4 t
imes
/ w
eek
wee
kly
dai
ly
3 -
4 t
imes
/ w
eek
wee
kly
dai
ly
3 -
4 t
imes
/ w
eek
wee
kly
dai
ly
3 -
4 t
imes
/ w
eek
wee
kly
dai
ly
3 -
4 t
imes
/ w
eek
wee
kly
dai
ly
3 -
4 t
imes
/ w
eek
wee
kly
dai
ly
3 -
4 t
imes
/ w
eek
wee
kly
dai
ly
3 -
4 t
imes
/ w
eek
wee
kly
dai
ly
3 -
4 t
imes
/ w
eek
wee
kly
dai
ly
3 -
4 t
imes
/ w
eek
wee
kly
dai
ly
3 -
4 t
imes
/ w
eek
wee
kly
dai
ly
3 -
4 t
imes
/ w
eek
wee
kly
Kottu(TF% =
0.0)
Cutlets(TF% =
0.0)
Dodol(TF% =
0.0)
Friedrice (TF%
= 0.0)
Rolls(%TF:0.0)
dhalwade (TF%= 0.0)
Ulunduwade (TF%= 0.0)
Unduwel(TF %=
0.0)
Murukku(TF %=0.57)
Maniocchips (TF%= 0.69)
Samosa(TF %=1.36)
Patties(TF %=1.62)
Household Adolescent
%
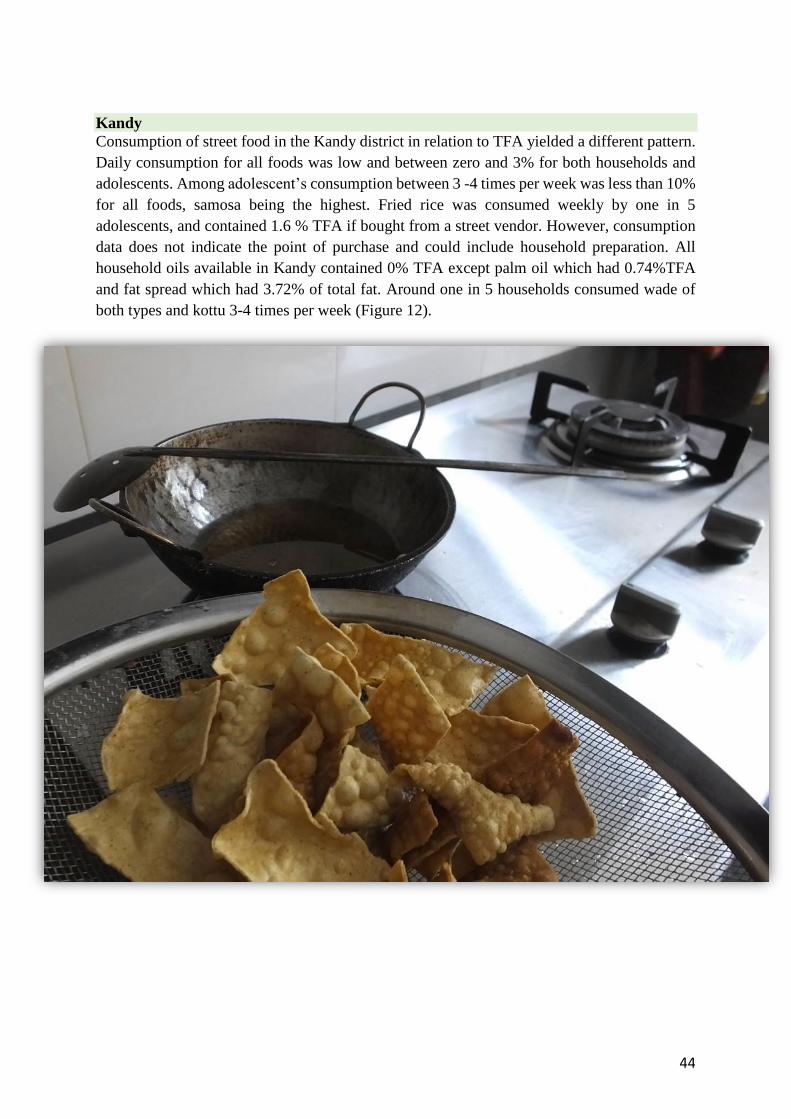
44
Kandy
Consumption of street food in the Kandy district in relation to TFA yielded a different pattern.
Daily consumption for all foods was low and between zero and 3% for both households and
adolescents. Among adolescent’s consumption between 3 -4 times per week was less than 10%
for all foods, samosa being the highest. Fried rice was consumed weekly by one in 5
adolescents, and contained 1.6 % TFA if bought from a street vendor. However, consumption
data does not indicate the point of purchase and could include household preparation. All
household oils available in Kandy contained 0% TFA except palm oil which had 0.74%TFA
and fat spread which had 3.72% of total fat. Around one in 5 households consumed wade of
both types and kottu 3-4 times per week (Figure 12).

45
Figure 12: Consumption of Street food in the Kandy District
2.53
21.52
13.92
0
7.24.6
2.53
24.05
10.13
0
15.19
7.59
02.53 3.8
0
18.99
15.19
0
10.1312.66
0
6.33 6.33
0
5.06 5.06
0
5.06
12.66
0
4
21.33
0
5
10
15
20
25
30
35
40
45
dai
ly
3 -
4 t
imes
/ w
eek
wee
kly
dai
ly
3 -
4 t
imes
/ w
eek
wee
kly
dai
ly
3 -
4 t
imes
/ w
eek
wee
kly
dai
ly
3 -
4 t
imes
/ w
eek
wee
kly
dai
ly
3 -
4 t
imes
/ w
eek
wee
kly
dai
ly
3 -
4 t
imes
/ w
eek
wee
kly
dai
ly
3 -
4 t
imes
/ w
eek
wee
kly
dai
ly
3 -
4 t
imes
/ w
eek
wee
kly
dai
ly
3 -
4 t
imes
/ w
eek
wee
kly
dai
ly
3 -
4 t
imes
/ w
eek
wee
kly
dai
ly
3 -
4 t
imes
/ w
eek
wee
kly
dai
ly
3 -
4 t
imes
/ w
eek
wee
kly
dhal wade(TF% = 0.0)
Murukku(TF% = 0.0)
Ulundu wade(TF% = 0.0)
Kadala(TF%=0.45)
Unduwel (TF%= 0.46)
Pastry (TF% =0.53)
Kottu (TF% =0.76)
Patties(TF%=0.78)
Samosa (TF%= 0.83)
Chilli paste(TF% = 1)
Rolls (TF% =1.23)
Fried rice(TF% = 1.6)
Household Adolescent
%
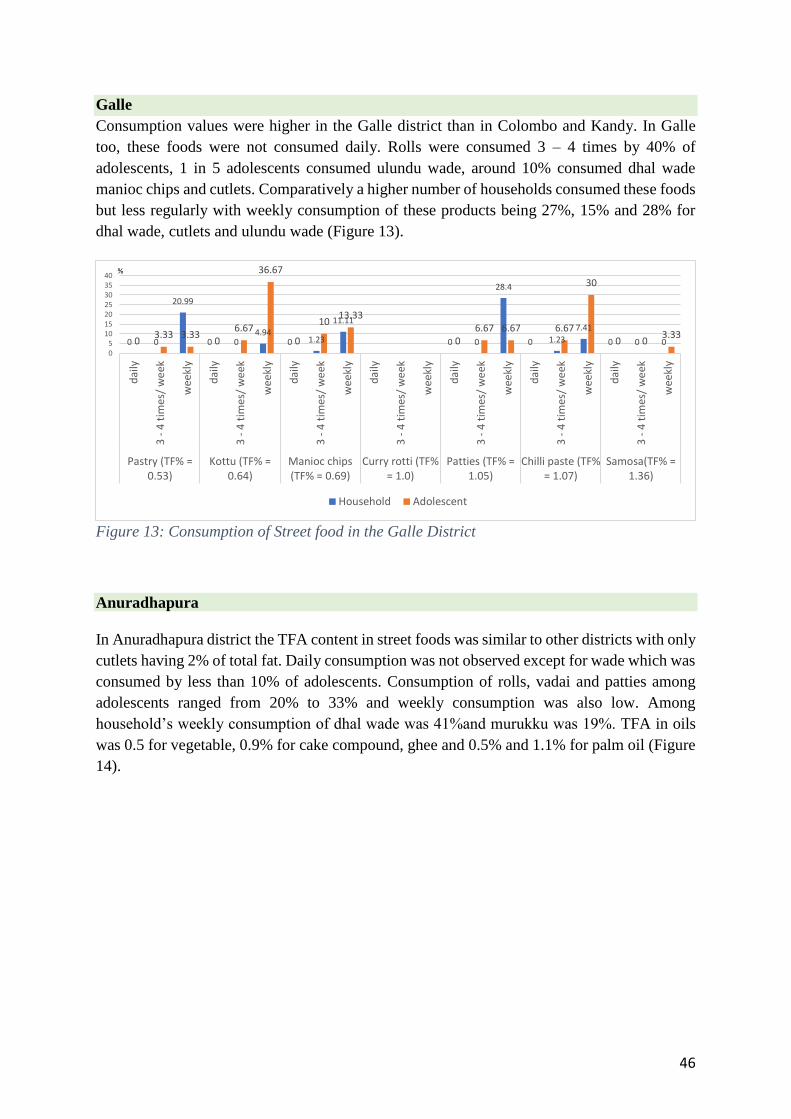
46
Galle
Consumption values were higher in the Galle district than in Colombo and Kandy. In Galle
too, these foods were not consumed daily. Rolls were consumed 3 – 4 times by 40% of
adolescents, 1 in 5 adolescents consumed ulundu wade, around 10% consumed dhal wade
manioc chips and cutlets. Comparatively a higher number of households consumed these foods
but less regularly with weekly consumption of these products being 27%, 15% and 28% for
dhal wade, cutlets and ulundu wade (Figure 13).
Figure 13: Consumption of Street food in the Galle District
Anuradhapura
In Anuradhapura district the TFA content in street foods was similar to other districts with only
cutlets having 2% of total fat. Daily consumption was not observed except for wade which was
consumed by less than 10% of adolescents. Consumption of rolls, vadai and patties among
adolescents ranged from 20% to 33% and weekly consumption was also low. Among
household’s weekly consumption of dhal wade was 41%and murukku was 19%. TFA in oils
was 0.5 for vegetable, 0.9% for cake compound, ghee and 0.5% and 1.1% for palm oil (Figure
14).
0 0
20.99
0 04.94
0 1.23
11.11
0 0
28.4
0 1.23
7.41
0 0 003.33 3.33
06.67
36.67
0
1013.33
06.67 6.67 6.67
30
0 03.33
05
10152025303540
dai
ly
3 -
4 t
imes
/ w
eek
wee
kly
dai
ly
3 -
4 t
imes
/ w
eek
wee
kly
dai
ly
3 -
4 t
imes
/ w
eek
wee
kly
dai
ly
3 -
4 t
imes
/ w
eek
wee
kly
dai
ly
3 -
4 t
imes
/ w
eek
wee
kly
dai
ly
3 -
4 t
imes
/ w
eek
wee
kly
dai
ly
3 -
4 t
imes
/ w
eek
wee
kly
Pastry (TF% =0.53)
Kottu (TF% =0.64)
Manioc chips(TF% = 0.69)
Curry rotti (TF%= 1.0)
Patties (TF% =1.05)
Chilli paste (TF%= 1.07)
Samosa(TF% =1.36)
Household Adolescent
%

47
Figure 14: Consumption of Street food in the Anuradhapura District
41.33
19.1
0
20
16.67
6.67
26.6726.67
0 0
6.67
0
5.6
11.11
0
33.33
3.33
0
13.33
10
0
10
13.33
0 0
6.67
0 0 0
3.33
20
6.67
0 0 0 0 0
6.67
0
5
10
15
20
25
30
35
40
45d
aily
3 -
4 t
imes
/ w
eek
wee
kly
dai
ly
3 -
4 t
imes
/ w
eek
wee
kly
dai
ly
3 -
4 t
imes
/ w
eek
wee
kly
dai
ly
3 -
4 t
imes
/ w
eek
wee
kly
dai
ly
3 -
4 t
imes
/ w
eek
wee
kly
dai
ly
3 -
4 t
imes
/ w
eek
wee
kly
dai
ly
3 -
4 t
imes
/ w
eek
wee
kly
dai
ly
3 -
4 t
imes
/ w
eek
wee
kly
dai
ly
3 -
4 t
imes
/ w
eek
wee
kly
dai
ly
3 -
4 t
imes
/ w
eek
wee
kly
dai
ly
3 -
4 t
imes
/ w
eek
wee
kly
dai
ly
3 -
4 t
imes
/ w
eek
wee
kly
dai
ly
3 -
4 t
imes
/ w
eek
wee
kly
dai
ly
3 -
4 t
imes
/ w
eek
wee
kly
dai
ly
3 -
4 t
imes
/ w
eek
wee
kly
dai
ly
3 -
4 t
imes
/ w
eek
wee
kly
dai
ly
3 -
4 t
imes
/ w
eek
wee
kly
Curryrotti (TF %
= 0)
Fried rice(TF % = 0)
Kottu (TF% = 0)
Rolls (TF% = 0.3)
dhal wade(TF % =
0.5)
Kevum(TF % =
0.5)
Prawnwade (TF% = 0.6)
Murukku(TF % =
0.6)
Patties(TF % =
0.7)
Samosa(TF % =
0.8)
Maniocchips (TF% = 0.8)
dodol (TF% = 0.8)
Unduwel(TF % = 1)
Ulunduwade (TF% = 1.2)
Kadala(TF% = 1.2)
Pastry (TF% = 1.3)
Cutlets(TF % = 2)
Household Adolescent
%

48
Jaffna
In the district of Jaffna, TFA in street foods other than patties (2%) was less than 2% of total
fat. 20%, 27% and 30% of adolescents ate fried rice, rolls potato chips 3 -4 times per week
with weekly consumption being as high as 40% for fried rice, 27% for potato chips and 33%
for samosa and patties. In Jaffna all oils contained less than 2% TFA and gingelly oil and cake
compound contained 0.8% TFA which was the highest (Figure 15).
Batticaloa
Except for potato chips (TFA=2.71%), all street foods had less than 2% of TFA. Daily
consumption was not significantly seen among street food types. Samosa 1.36%) was
consumed by 32.4% of households weekly. Murukku (TFA=1.48%) was consumed by 23.3%
of adolescents 3-4 times per week (Figure 16).

49
Figure 15: Consumption of Street food in the Jaffna District
0
8
18.67
02.67
12
0
1618.67
1.33
6.67
12
0
9.33
28
02.67
16
0 0 0 0
10.67
45.33
02.67
10.67
0
4
14.67
02.67
6.67
0 0 0 0
4
21.33
0
4
20
0
5.33
14.67
0
30
10
0
20 20
0
13.3
6.67
0
6.67
10
0
36.67
30
0
30
23.33
0 0
3.33
0
26.67
23.33
0
3.33
13.33
0
30
26.67
0
13.33
3.33
0 0 0
6.67
20
40
0
13.33
33.33
0
6.67
33.33
0
5
10
15
20
25
30
35
40
45
50d
aily
3 -
4 t
imes
/ w
eek
wee
kly
dai
ly
3 -
4 t
imes
/ w
eek
wee
kly
dai
ly
3 -
4 t
imes
/ w
eek
wee
kly
dai
ly
3 -
4 t
imes
/ w
eek
wee
kly
dai
ly
3 -
4 t
imes
/ w
eek
wee
kly
dai
ly
3 -
4 t
imes
/ w
eek
wee
kly
dai
ly
3 -
4 t
imes
/ w
eek
wee
kly
dai
ly
3 -
4 t
imes
/ w
eek
wee
kly
dai
ly
3 -
4 t
imes
/ w
eek
wee
kly
dai
ly
3 -
4 t
imes
/ w
eek
wee
kly
dai
ly
3 -
4 t
imes
/ w
eek
wee
kly
dai
ly
3 -
4 t
imes
/ w
eek
wee
kly
dai
ly
3 -
4 t
imes
/ w
eek
wee
kly
dai
ly
3 -
4 t
imes
/ w
eek
wee
kly
dai
ly
3 -
4 t
imes
/ w
eek
wee
kly
dai
ly
3 -
4 t
imes
/ w
eek
wee
kly
dai
ly
3 -
4 t
imes
/ w
eek
wee
kly
dai
ly
3 -
4 t
imes
/ w
eek
wee
kly
Kottu (TF%= 0)
Cutlets(TF% = 0)
dhalwade(TF%
= 0)
prawnwade (TF%
= 0)
curry roti(TF% = 0)
Murukku(TF% = 0)
Maniocchips (TF%
= 0)
dodol (TF%= 0)
kadala(TF%= 0)
Chilli paste(TF% = 0.4)
Rolls (TF%= 0.7)
Ulunduwade (TF%
= 0.7)
Potatochips (TF%
= 0.7)
Pastry(TF%= 0.8)
Unduwel(TF% = 1)
Fried rice(TF% = 1.6)
Samosa(TF% = 1.8)
Patties(TF% = 2)
Household Adolescent
%

50
Figure 16:Consumption of Street food in the Batticaloa District
2.821.41 1.32
4.175.63
1.41
5.635.63
18.31
4.235.63 5.63
14.08
1.41
15.49
32.39
1.41
11.27
5.63
0 0
6.67
0
13.33
3.333.33
20
36.67
3.33
23.33
0
3.33
10
13.33
0 0 0 0 0 0 0
23.33
16.67
0 0 0 0
23.33
0 0 0 0 0 0
3.33
0
16.67
6.67
3.33
23.33
13.33
0
23.33
6.67
3.333.33
10
0
5
10
15
20
25
30
35
40
dai
ly
3 -
4 t
imes
/ w
eek
wee
kly
dai
ly
3 -
4 t
imes
/ w
eek
wee
kly
dai
ly
3 -
4 t
imes
/ w
eek
wee
kly
dai
ly
3 -
4 t
imes
/ w
eek
wee
kly
dai
ly
3 -
4 t
imes
/ w
eek
wee
kly
dai
ly
3 -
4 t
imes
/ w
eek
wee
kly
dai
ly
3 -
4 t
imes
/ w
eek
wee
kly
dai
ly
3 -
4 t
imes
/ w
eek
wee
kly
dai
ly
3 -
4 t
imes
/ w
eek
wee
kly
dai
ly
3 -
4 t
imes
/ w
eek
wee
kly
dai
ly
3 -
4 t
imes
/ w
eek
wee
kly
dai
ly
3 -
4 t
imes
/ w
eek
wee
kly
dai
ly
3 -
4 t
imes
/ w
eek
wee
kly
dai
ly
3 -
4 t
imes
/ w
eek
wee
kly
dai
ly
3 -
4 t
imes
/ w
eek
wee
kly
dai
ly
3 -
4 t
imes
/ w
eek
wee
kly
dai
ly
3 -
4 t
imes
/ w
eek
wee
kly
dodol TF%0
RawmusketTF% 0.0
Kottu(TF% 0.00)
Cutlets(TF% 0.0)
Dhal wade(TF% 0)
Pastry(TF% 0.4)
Uduwel(TF% 0.6)
Fried rice(TF% 0.62)
Maniocchips (TF%
0.69)
Rolls (TF%0.86)
Chillipaste %TF
1.00
Curry roti(TF% 1.00)
Uluduwade
(TF% =1.02)
Patties(TF% 1.05)
samosa(TF% =1.36)
Murrukku(TF% 1.48)
Potatochips (TF%
2.71)
Household Adolescent
%

51
The fact that TFA was low in oils is an important observation as it is unlikely that the industry
will view regulations for less than 2% negatively. Sri Lanka can think of mandatory limits in
order to maintain the low levels in the future. The few types of fats that do contain TFA such
as PHO can be banned before its widespread use, enabling a TFA free environment more
effectively. Further this evidence indicates that street food consumption patterns need to be
addressed only for a few foods, and thus replacing with healthier options is likely to be a
manageable task.
Although household consumption of oil on a daily basis was low overall (<13%) with the
exception of coconut oil (43%), it was not clear whether this was for cooking or included other
household uses of oil. Since households also use multiple oils, and the fat in coconut milk was
not considered, this is not a fair representation of the frequency of incorporation of oil into
household cooking. Further since there is no indication of the method of cooking, generation
of TFA during cooking may not be represented
through the household consumption patterns
reported here. Some extrapolation maybe made
from the street food consumption patterns, also
collected at household level and from
adolescents. It is important that the amount of
household TFA would at best be what is
contained in the oils and fats used, and at worst
could be expected to be reflected in the contents
seen in street foods in each area. Hence it is
important to note firstly, that TFA content in
foods overall is likely to be low, and secondly,
the most effective way to limit the content of
TFA would be to limit it at the source of the oils
and fats. The present analysis indicated overall
low values for TFA in oils but slightly higher
values for certain fats.
Hence an understanding of the existing market
share of oils and fats that are high in TFA is important. If the fats that are high in TFA such as
PHO are replaced, it is important to know with what types of fats this should be done, and how
industry may innovate to do this within the Sri Lankan context. The likelihood of coconut
products as replacements would increase the saturated fat content and possibly the cost. Hence
feasibility studies are also required.

52
The household survey did not include consumption patterns of the working population who
buy their meals out of home. While it is important to observe that street and restaurant foods
did not contain very high levels of TFA, which are the foods that the working population are
exposed to, the only concern would be that this population would be expected to consume these
foods in greater frequency and amounts than the population surveyed here. Hence reduction of
TFA from these foods further by banning PHO use for cooking and selecting oils lower in TFA
is likely to have a positive impact overall. In the Sri Lankan context therefore, in addition to a
mandatory < 2% limit for TFA, encouraging voluntary zero TFA could potentially begin
earlier. It is prudent to plan for both these at the same time, thus minimizing the effort and
investment to do so.
RESTAURANT AND BAKERY FOODS AND INGREDIENTS
Consumption patterns of foods for which TFA levels were available were analysed. The bar
charts present disaggregated data by district for consumption of bakery and restaurant
ingredients and foods. The foods are displayed in increasing order of TFA content. Very few
foods had TFA higher than 2% in this category.
Colombo
These foods were not consumed daily. One in 5 Adolescents consume chilli paste which has a
3.92 % TFA, 3 to 4 times a week. TFA content in manioc chips was 4.06%, and 9% of
households consume manioc chips 3 -4 times per week and 28% eat it weekly, with only 3%
adolescents eating manioc chips 3-4 times per week in Colombo (Figure 17)
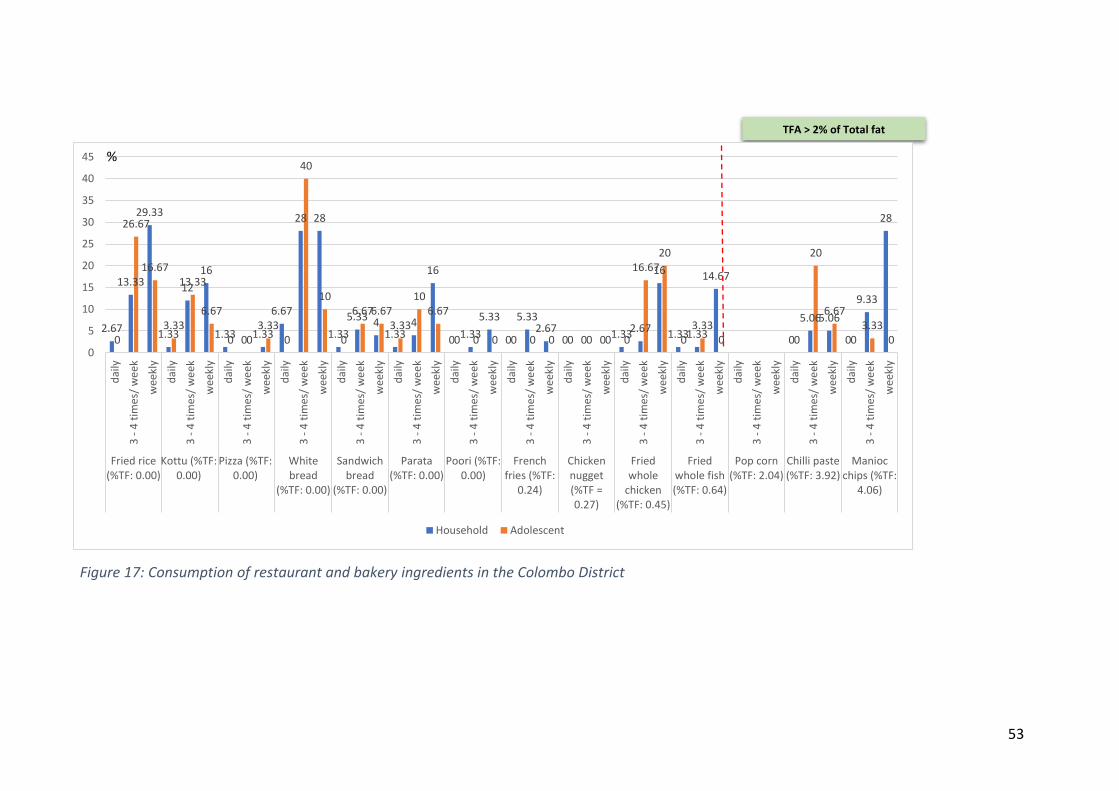
53
Figure 13: Consumption of Restaurant and bakery foods within the Colombo District
TFA > 2% of Total fat
2.67
13.33
29.33
1.33
12
16
1.33 0 1.33
6.67
28 28
1.33
5.33 41.33
4
16
0 1.33
5.33
0
5.332.67
0 0 0 1.332.67
16
1.331.33
14.67
0
5.065.06
0
9.33
28
0
26.67
16.67
3.33
13.33
6.67
0 03.33
0
40
10
0
6.676.673.33
106.67
0 0 0 0 0 0 0 0 0 0
16.6720
03.33
0 0
20
6.67
03.33
00
5
10
15
20
25
30
35
40
45
dai
ly
3 -
4 t
imes
/ w
eek
wee
kly
dai
ly
3 -
4 t
imes
/ w
eek
wee
kly
dai
ly
3 -
4 t
imes
/ w
eek
wee
kly
dai
ly
3 -
4 t
imes
/ w
eek
wee
kly
dai
ly
3 -
4 t
imes
/ w
eek
wee
kly
dai
ly
3 -
4 t
imes
/ w
eek
wee
kly
dai
ly
3 -
4 t
imes
/ w
eek
wee
kly
dai
ly
3 -
4 t
imes
/ w
eek
wee
kly
dai
ly
3 -
4 t
imes
/ w
eek
wee
kly
dai
ly
3 -
4 t
imes
/ w
eek
wee
kly
dai
ly
3 -
4 t
imes
/ w
eek
wee
kly
dai
ly
3 -
4 t
imes
/ w
eek
wee
kly
dai
ly
3 -
4 t
imes
/ w
eek
wee
kly
dai
ly
3 -
4 t
imes
/ w
eek
wee
kly
Fried rice(%TF: 0.00)
Kottu (%TF:0.00)
Pizza (%TF:0.00)
Whitebread
(%TF: 0.00)
Sandwichbread
(%TF: 0.00)
Parata(%TF: 0.00)
Poori (%TF:0.00)
Frenchfries (%TF:
0.24)
Chickennugget(%TF =0.27)
Friedwhole
chicken(%TF: 0.45)
Friedwhole fish(%TF: 0.64)
Pop corn(%TF: 2.04)
Chilli paste(%TF: 3.92)
Maniocchips (%TF:
4.06)
Household Adolescent
%
Figure 17: Consumption of restaurant and bakery ingredients in the Colombo District
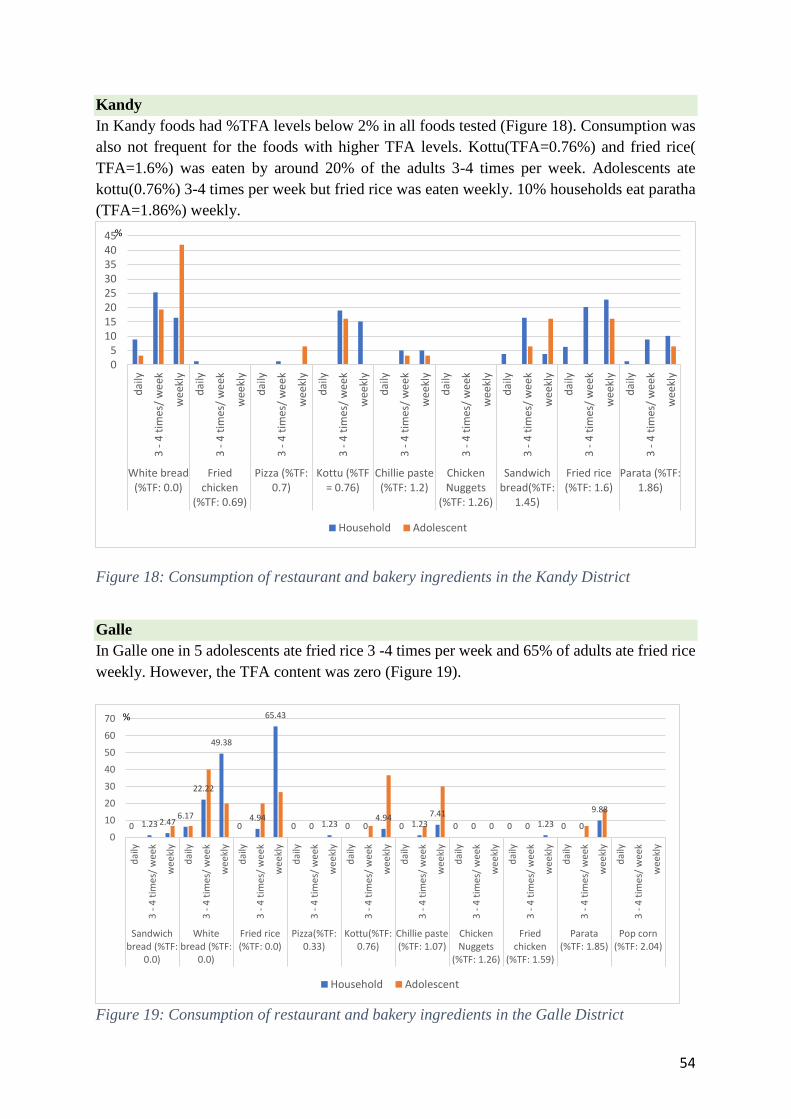
54
Kandy
In Kandy foods had %TFA levels below 2% in all foods tested (Figure 18). Consumption was
also not frequent for the foods with higher TFA levels. Kottu(TFA=0.76%) and fried rice(
TFA=1.6%) was eaten by around 20% of the adults 3-4 times per week. Adolescents ate
kottu(0.76%) 3-4 times per week but fried rice was eaten weekly. 10% households eat paratha
(TFA=1.86%) weekly.
Figure 18: Consumption of restaurant and bakery ingredients in the Kandy District
Galle
In Galle one in 5 adolescents ate fried rice 3 -4 times per week and 65% of adults ate fried rice
weekly. However, the TFA content was zero (Figure 19).
Figure 19: Consumption of restaurant and bakery ingredients in the Galle District
0 1.23 2.476.17
22.22
49.38
04.94
65.43
0 0 1.23 0 04.94
0 1.237.41
0 0 0 0 0 1.23 0 0
9.88
0
10
20
30
40
50
60
70
dai
ly
3 -
4 t
imes
/ w
eek
wee
kly
dai
ly
3 -
4 t
imes
/ w
eek
wee
kly
dai
ly
3 -
4 t
imes
/ w
eek
wee
kly
dai
ly
3 -
4 t
imes
/ w
eek
wee
kly
dai
ly
3 -
4 t
imes
/ w
eek
wee
kly
dai
ly
3 -
4 t
imes
/ w
eek
wee
kly
dai
ly
3 -
4 t
imes
/ w
eek
wee
kly
dai
ly
3 -
4 t
imes
/ w
eek
wee
kly
dai
ly
3 -
4 t
imes
/ w
eek
wee
kly
dai
ly
3 -
4 t
imes
/ w
eek
wee
kly
Sandwichbread (%TF:
0.0)
Whitebread (%TF:
0.0)
Fried rice(%TF: 0.0)
Pizza(%TF:0.33)
Kottu(%TF:0.76)
Chillie paste(%TF: 1.07)
ChickenNuggets
(%TF: 1.26)
Friedchicken
(%TF: 1.59)
Parata(%TF: 1.85)
Pop corn(%TF: 2.04)
Household Adolescent
%
05
1015202530354045
dai
ly
3 -
4 t
imes
/ w
eek
wee
kly
dai
ly
3 -
4 t
imes
/ w
eek
wee
kly
dai
ly
3 -
4 t
imes
/ w
eek
wee
kly
dai
ly
3 -
4 t
imes
/ w
eek
wee
kly
dai
ly
3 -
4 t
imes
/ w
eek
wee
kly
dai
ly
3 -
4 t
imes
/ w
eek
wee
kly
dai
ly
3 -
4 t
imes
/ w
eek
wee
kly
dai
ly
3 -
4 t
imes
/ w
eek
wee
kly
dai
ly
3 -
4 t
imes
/ w
eek
wee
kly
White bread(%TF: 0.0)
Friedchicken
(%TF: 0.69)
Pizza (%TF:0.7)
Kottu (%TF= 0.76)
Chillie paste(%TF: 1.2)
ChickenNuggets
(%TF: 1.26)
Sandwichbread(%TF:
1.45)
Fried rice(%TF: 1.6)
Parata (%TF:1.86)
Household Adolescent
%
55
Anuradhapura
In Anuradhapura TFA was observed in a slightly different range of foods with pizza and white
bread having higher TFAs though still less than 2%. Consumption patterns for these foods were
also low with only white bread (TFA=1.8%)being consumed by 40% of adults weekly (Figure
20).
Jaffna
In Jaffna 30% adolescents ate kottu (TFA=1.2%) and 15% adults ate paratha (TFA=1.9%) 3-4
times per week and 36% ate weekly. 6.67% of adolescents ate chicken burger (TFA=2%)
weekly (Figure 21).
Batticaloa
Consumption of street foods was low among both populations. 23.3% of adolescents ate fried
whole fish (TFA=1.02%) 3-4 times per week and 16% ate on a weekly basis (Figure 22).

56
Figure 20: Consumption of restaurant and bakery ingredients in the Anuradhapura District
0 0
6.67
0
4
10.67
0 01.33
01.33
6.67
0 0 0 0 0
18.67
0 0
5.33
0 0
6.67
0 0 0 0 0 0 0 0 0 0
10
40
0
3.33
16.67
0 0
23.33
0 0 0 0 0
3.33
0 0
6.67
0
16.67
43.33
0
3.33
13.33
0 0 0 0 0 02.67
5.338
0 0 0 0 0 00
5
10
15
20
25
30
35
40
45
50d
aily
3 -
4 t
imes
/ w
eek
wee
kly
dai
ly
3 -
4 t
imes
/ w
eek
wee
kly
dai
ly
3 -
4 t
imes
/ w
eek
wee
kly
dai
ly
3 -
4 t
imes
/ w
eek
wee
kly
dai
ly
3 -
4 t
imes
/ w
eek
wee
kly
dai
ly
3 -
4 t
imes
/ w
eek
wee
kly
dai
ly
3 -
4 t
imes
/ w
eek
wee
kly
dai
ly
3 -
4 t
imes
/ w
eek
wee
kly
dai
ly
3 -
4 t
imes
/ w
eek
wee
kly
dai
ly
3 -
4 t
imes
/ w
eek
wee
kly
dai
ly
3 -
4 t
imes
/ w
eek
wee
kly
dai
ly
3 -
4 t
imes
/ w
eek
wee
kly
dai
ly
3 -
4 t
imes
/ w
eek
wee
kly
dai
ly
3 -
4 t
imes
/ w
eek
wee
kly
dai
ly
3 -
4 t
imes
/ w
eek
wee
kly
butternaan (%TF:
0.0)
kottu (%TF:0.0)
Sandwichbread
(%TF: 0.0)
Friedwhole
chicken(%TF: 0.0)
Friedwhole fish(%TF: 0.2)
Tea bun(%TF: 0.2)
Fried rice(%TF: 0.3)
parata(%TF: 0.4)
Chilliepaste (%TF:
0.7)
Popcorn(%TF:
0.7)
Chickenburger
(%TF: 0.9)
ChickenNuggets
(%TF: 1.0)
Kimbulabun (%TF:
1.1)
Pizza (%TF:1.7)
Whitebread
(%TF: 1.8)
Household Adolescent
%
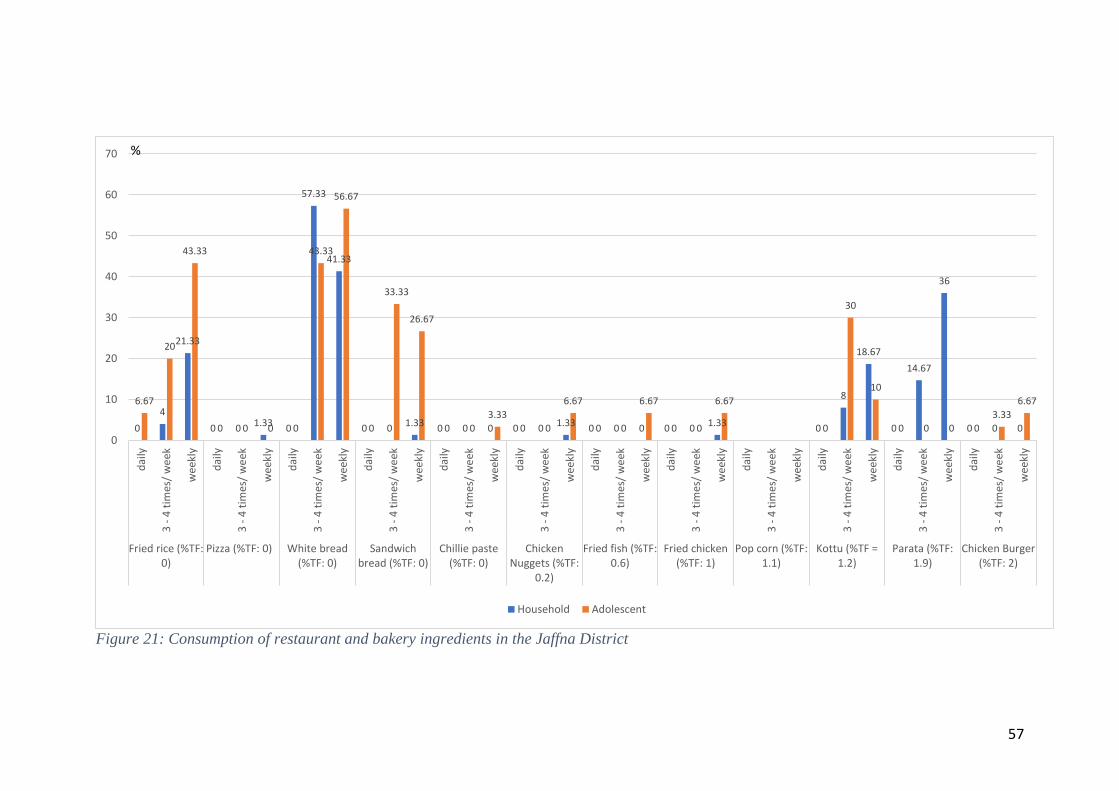
57
Figure 21: Consumption of restaurant and bakery ingredients in the Jaffna District
0
4
21.33
0 01.33
0
57.33
41.33
0 01.33
0 0 0 0 01.33
0 0 0 0 01.33
0
8
18.67
0
14.67
36
0 0 0
6.67
20
43.33
0 0 0 0
43.33
56.67
0
33.33
26.67
0 0
3.33
0 0
6.67
0 0
6.67
0 0
6.67
0
30
10
0 0 0 0
3.33
6.67
0
10
20
30
40
50
60
70d
aily
3 -
4 t
imes
/ w
eek
wee
kly
dai
ly
3 -
4 t
imes
/ w
eek
wee
kly
dai
ly
3 -
4 t
imes
/ w
eek
wee
kly
dai
ly
3 -
4 t
imes
/ w
eek
wee
kly
dai
ly
3 -
4 t
imes
/ w
eek
wee
kly
dai
ly
3 -
4 t
imes
/ w
eek
wee
kly
dai
ly
3 -
4 t
imes
/ w
eek
wee
kly
dai
ly
3 -
4 t
imes
/ w
eek
wee
kly
dai
ly
3 -
4 t
imes
/ w
eek
wee
kly
dai
ly
3 -
4 t
imes
/ w
eek
wee
kly
dai
ly
3 -
4 t
imes
/ w
eek
wee
kly
dai
ly
3 -
4 t
imes
/ w
eek
wee
kly
Fried rice (%TF:0)
Pizza (%TF: 0) White bread(%TF: 0)
Sandwichbread (%TF: 0)
Chillie paste(%TF: 0)
ChickenNuggets (%TF:
0.2)
Fried fish (%TF:0.6)
Fried chicken(%TF: 1)
Pop corn (%TF:1.1)
Kottu (%TF =1.2)
Parata (%TF:1.9)
Chicken Burger(%TF: 2)
Household Adolescent
%
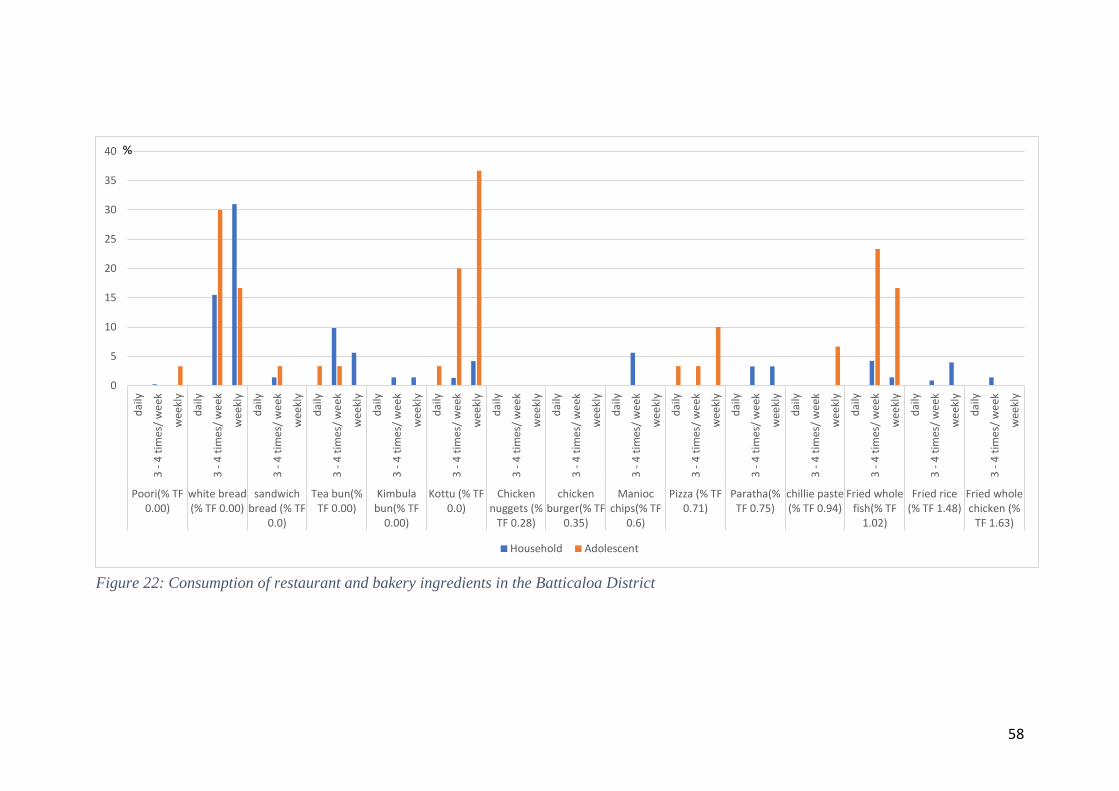
58
Figure 22: Consumption of restaurant and bakery ingredients in the Batticaloa District
0
5
10
15
20
25
30
35
40d
aily
3 -
4 t
imes
/ w
eek
wee
kly
dai
ly
3 -
4 t
imes
/ w
eek
wee
kly
dai
ly
3 -
4 t
imes
/ w
eek
wee
kly
dai
ly
3 -
4 t
imes
/ w
eek
wee
kly
dai
ly
3 -
4 t
imes
/ w
eek
wee
kly
dai
ly
3 -
4 t
imes
/ w
eek
wee
kly
dai
ly
3 -
4 t
imes
/ w
eek
wee
kly
dai
ly
3 -
4 t
imes
/ w
eek
wee
kly
dai
ly
3 -
4 t
imes
/ w
eek
wee
kly
dai
ly
3 -
4 t
imes
/ w
eek
wee
kly
dai
ly
3 -
4 t
imes
/ w
eek
wee
kly
dai
ly
3 -
4 t
imes
/ w
eek
wee
kly
dai
ly
3 -
4 t
imes
/ w
eek
wee
kly
dai
ly
3 -
4 t
imes
/ w
eek
wee
kly
dai
ly
3 -
4 t
imes
/ w
eek
wee
kly
Poori(% TF0.00)
white bread(% TF 0.00)
sandwichbread (% TF
0.0)
Tea bun(%TF 0.00)
Kimbulabun(% TF
0.00)
Kottu (% TF0.0)
Chickennuggets (%
TF 0.28)
chickenburger(% TF
0.35)
Maniocchips(% TF
0.6)
Pizza (% TF0.71)
Paratha(%TF 0.75)
chillie paste(% TF 0.94)
Fried wholefish(% TF
1.02)
Fried rice(% TF 1.48)
Fried wholechicken (%
TF 1.63)
Household Adolescent
%

59
FATTY ACID PROFILE OF OILS AND FATS
The fatty acid profile of the oils were slightly different in the different districts. A similar
difference in fatty acid profile was observed in the foods between different districts. Vegetable
oil had a fatty acid profile which was very similar to palm oil in all districts indicating that the
predominant oil in vegetable oil is probably palm oil. The coconut oil in Galle and
Anuradhapura had a much lower saturated fat content when compared to the other districts
highlighting the possibility of adulteration with cheaper varieties of oil. Despite the use of
gingerly oil there were no major differences in the fatty acid profiles of foods between districts.
In general, the prepared foods have saturated fat contents of over 30%, whether they have TFA
or not, reflecting the fatty acid profile of the most commonly used oils in Sri Lanka which is
coconut and vegetable oil. Our findings are in line with previous small studies. Gamage et al,
showed that the bakeries in the urban areas used margarine as an ingredient for their bread
making38. However, in rural areas bakeries used fat spread as a basic ingredient38. More than
50% of the bakery products in the Central Province used Fat spread and TFA content ranged
from 0.1% to 5.77%, and was mostly observed in chocolate cakes, and least used in
doughnuts38. The highest TFA levels reported in these findings are much lower than those
reported in western countries but similar to South Asia. An opportunity exists for South East
Asia to move towards zero TFA now and before infiltration of the food environment with oils
and particularly fats that are much higher in TFA than is currently observed.
Figure 23: Fatty acid profile: oils and fats in the Colombo District
87.92
54.4
88.52
47.05
55.12 53.18
21.49
61.8758.9
46.88
0.68 0.96 0 1.61 2.980 0 2.07 0.64
11.4611.4
44.64
11.48
51.34
41.8946.82
78.51
36.0640.46 41.67
0
10
20
30
40
50
60
70
80
90
100
SFA(% of the total fat) MUFA(% of the total fat) PUFA(% of the total fat) Trans fat (% of total fat)
%

60
Figure 24: Fatty acid profile: oils and fats in the Kandy District
Figure 25: Fatty acid profile: oils and fats in the Galle District
80.78
19.89
39.21
44.57
52.3749.52
1.16 1.99 2.415.48
18.74
1.71
14.6
75.71
57.39
49
28.88
44.72
0
10
20
30
40
50
60
70
80
90
Coconut oil-white
Sunflower oil Normal coconutoil
Palm oil Hyco
SFA(% of the total fat) MUFA(% of the total fat) PUFA(% of the total fat) Trans fat (% of total fat)
GheeFat spread
%
39.21
53.37
44.57
52.12
61.8
48.4
2.41
18.74
5.482.98 3.2 3.8
57.39
27.88
49
43.89
30.2
45.7
0
10
20
30
40
50
60
70
Normal coconutoil
Hyco Palm oil Vegetable oil PastryMargarine
Vegetable Ghee
SFA(% of the total fat) MUFA(% of the total fat) PUFA(% of the total fat) Trans fat (% of total fat)
Fat spread
%
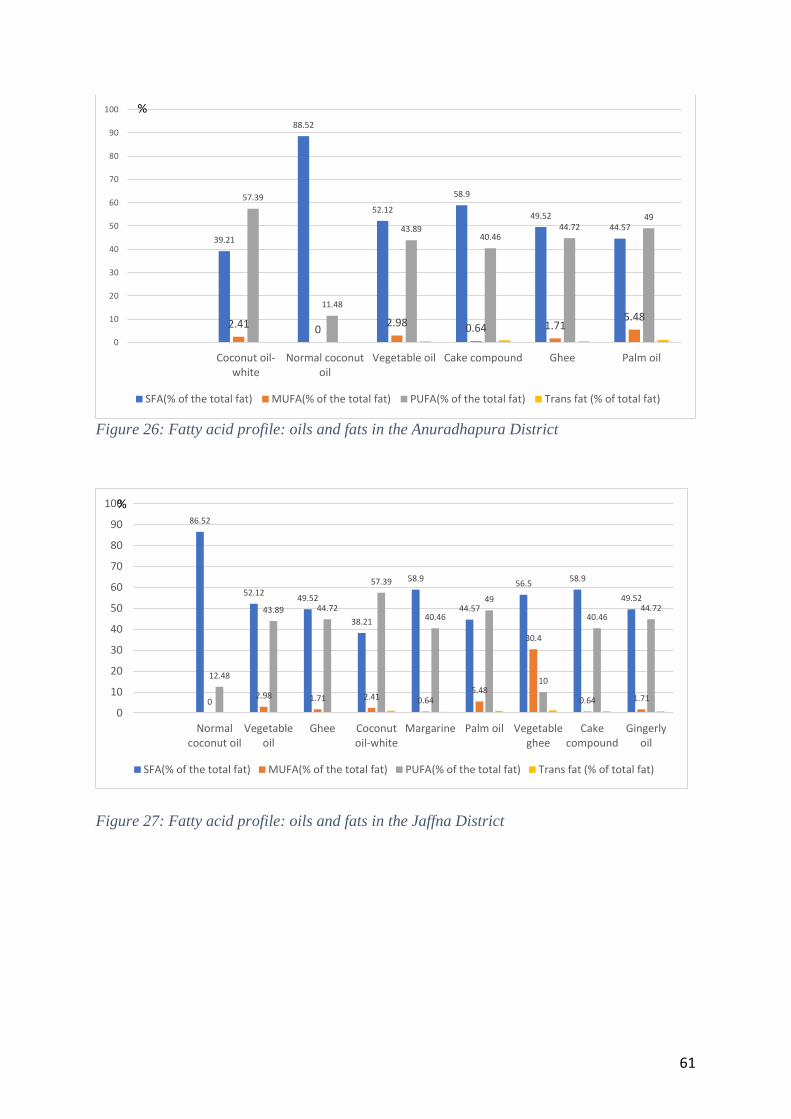
61
Figure 26: Fatty acid profile: oils and fats in the Anuradhapura District
Figure 27: Fatty acid profile: oils and fats in the Jaffna District
39.21
88.52
52.12
58.9
49.5244.57
2.41 02.98 0.64 1.71
5.48
57.39
11.48
43.8940.46
44.7249
0
10
20
30
40
50
60
70
80
90
100
Coconut oil-white
Normal coconutoil
Vegetable oil Cake compound Ghee Palm oil
SFA(% of the total fat) MUFA(% of the total fat) PUFA(% of the total fat) Trans fat (% of total fat)
%
86.52
52.1249.52
38.21
58.9
44.57
56.558.9
49.52
02.98 1.71 2.41 0.64
5.48
30.4
0.64 1.71
12.48
43.89 44.72
57.39
40.46
49
10
40.4644.72
0
10
20
30
40
50
60
70
80
90
100
Normalcoconut oil
Vegetableoil
Ghee Coconutoil-white
Margarine Palm oil Vegetableghee
Cakecompound
Gingerlyoil
SFA(% of the total fat) MUFA(% of the total fat) PUFA(% of the total fat) Trans fat (% of total fat)
%
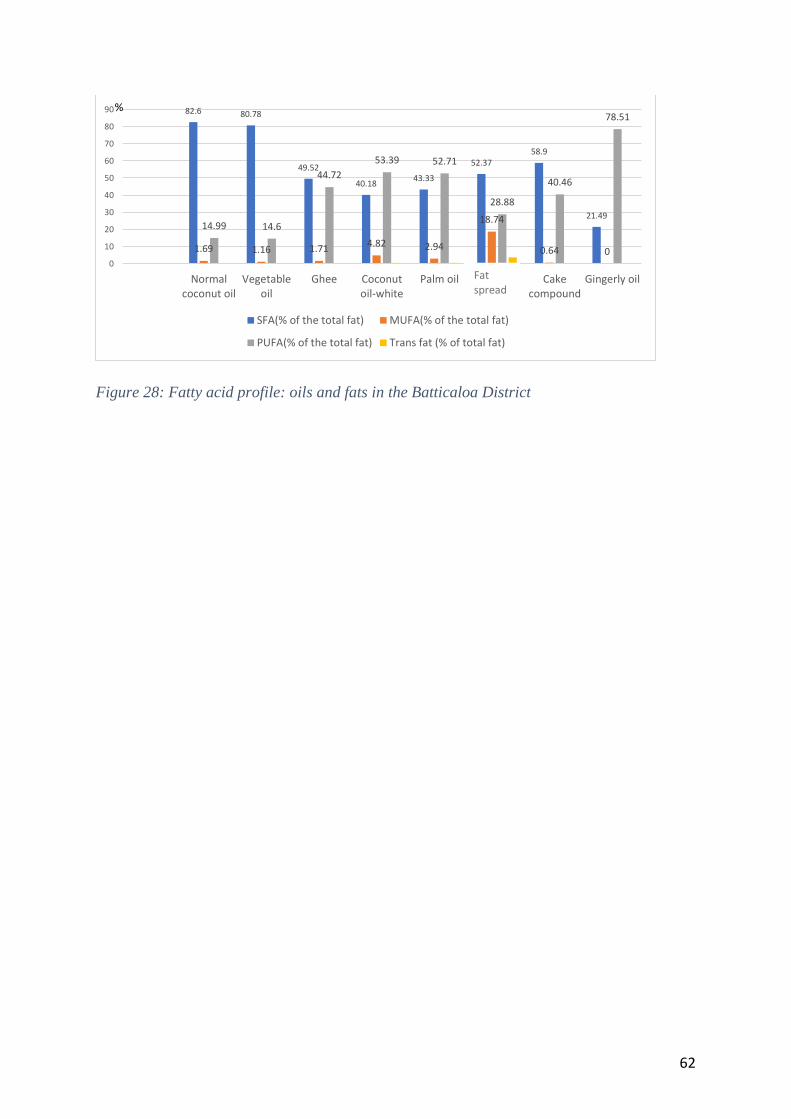
62
Figure 28: Fatty acid profile: oils and fats in the Batticaloa District
82.6 80.78
49.52
40.1843.33
52.3758.9
21.49
1.69 1.16 1.71 4.82 2.94
18.74
0.64 0
14.99 14.6
44.72
53.39 52.71
28.88
40.46
78.51
0
10
20
30
40
50
60
70
80
90
Normalcoconut oil
Vegetableoil
Ghee Coconutoil-white
Palm oil Hyco Cakecompound
Gingerly oil
SFA(% of the total fat) MUFA(% of the total fat)
PUFA(% of the total fat) Trans fat (% of total fat)
Fat spread
%

63
CONCLUSIONS: STRATEGIES THAT CAN BE CONSIDERED FOR SRI
LANKA BASED ON THE EVIDENCE GENERATED.
POLICY AND REGULATIONS
Mandatory TFA limits restricting industrially-produced TFA to less than 2% of total fat in oils,
fats and foods without increasing saturated fat and a total ban on PHO as well as supportive
regulations are the way forward for Sri Lanka given the totality of the limited evidence
available. The Nutrition policy and NCD policy
prioritizes addressing unhealthy diets and TFA and
provision does exist for mandatory food standards to be
declared by the government, advised by the food advisory
committee. Hence the environment for policy change is
conducive. Agriculture policy needs to consider TFA and
saturated fat content when selecting which oils seeds to
encourage and provide subsidies for in cultivation and
processing. Trade and import policies need to include
bans on oils, fats and foods with TFA higher than 2% of
total fat. Incentives for import through differential
taxation policies can encourage the import of better
quality oils that are refined and of which TFA content is
known and where labeling is a prerequisite to import
licensing.
In Sri Lanka, regulations on oils and fats need to be better
aligned with health recommendations as not only TFA but
also saturated fat must be addressed, with standards being
more specific with regard to the quality of the fats.
Currently TFA limits and labeling regulations in relation
to TFA are not mandatory, although the labelling
regulations have been revised for TFA labeling to be
mandatory in the near future. Since a proportion of the oils
and fats in the domestic market includes unbranded
products, it is essential to identify the origin of these
products in order to implement a universal labeling
requirement and ban.
Regulation of TFA through labeling of foods will address
up to 30% of foods that are sold as packaged foods and this proportion is steadily increasing.
Of these only a few contain industrially produced TFA as technological changes such as
interesterification is practiced by major companies to stay abreast with global markets. Smaller
companies are unlikely to have the technology to produce partially hydrogenated oils and will
depend on imports or bulk purchase from larger companies. Hence control of imports are likely
to have potential to address a significant proportion of partially hydrogenated oils.

64
With regard to implementing control and scrutiny of products, it can be declared essential to
obtain prior permission for import based on TFA content of oils and fats. While differential
import taxation is an important tool that can be used for the reduction of TFA, particularly
partially hydrogenated oils (PHO), it is currently not used for non-trade related reasons. Fats
high in TFA such as PHO or elaidinized fats as well as interesterified fats are currently taxed
at the same rates. While maintaining the trade rationale, a tax structure can be devised in order
to address both nutrition as well as trade reasons. Further, the import duty and tax structure for
oils and fats need to be created based on SFA content in addition to TFA with possible
exemption for those with better fatty acid profiles: cutoffs need to be decided on. Those that
contain TFA greater than 2% of total fat should be banned and refused entry at the port with a
complete import ban on PHO.
In formulating future trade agreements, a clause for TFA (and SFA) needs to be incorporated
in line with a future ban or mandatory declaration of TFA limits. When unrefined edible oils
are imported, documentation should be maintained of who refines it.
Although it is specified that the sale of deep-fried items of food should be limited in schools
and that the oil used for deep frying should not be re-used, a mechanism for monitoring or
evaluating the school canteens is required. The healthy canteen policy can be extended to all
work places.
FOOD CONSUMPTION PATTERNS
Most foods studied were not consumed on a daily basis. The highest consumption frequencies
in both the household survey and the adolescent survey by a significant proportion of the
populations was 3-4 times per week and once a week consumption was observed only for a
few foods high in TFA. Packaged food from the formal sector were not consumed in high
frequencies except for biscuits. Behavior change is required to replace consumption of vadai
and rolls among adolescents and kottu, vadai, murukku and manioc chips among women, with
healthier options, but this is more a concern for their content of saturated fat than for TFA.
There is no direct evidence for the TFA content with repeated deep-frying except the TFA
content seen in such street foods where we may expect this practice. However even here, TFA
did not appear to be very high through higher.
Following the regulation of poor quality fats, the informal sector needs to be provided with
replacements with either healthier oils, inter-esterified fats as well as blends of oils with better
fatty acid profiles. Agriculture and trade inputs together with support from larger companies
would be required. Our analysis identifies that palm oil and vegetable oil (which is a mixture
containing palm oil) is the cheapest replacement oil available currently. Cost is a significant
factor. Consumer education to encourage the public to pay more for healthier products would
be one way to address this, but will be effective only in some settings.
Considering replacement, the usual practice of recommending coconut oil with respect to its
near zero TFA content though valid from a TFA perspective, does not satisfy the condition

65
“without increasing saturated fat”. It is important to observe that the saturated fat content of
most TFA containing foods studied was more than 30%. However, at the very low levels of
TFA reported for the foods studied, replacement is unlikely to result in a big increase in the
SFA content, albeit in foods already high in SFA. Advice to use poly unsaturated oils can also
be given. As a later step the high percentages of saturated fat in foods would need to be
addressed where replacement options being a greater challenge to identify on the background
of coconut and palm oil, both of which are high in saturated fatty acids.
For both the formal and informal food sector, innovative mixtures from within the oils in the
country need to be tried out which also addresses cost, taste and feasibility: less utilized local
oils such as ground nut or gingerly oil are a source of polyunsaturates. Although palm oil has
some monounsaturates, it has little advantage over coconut with respect to saturated fatty acid
content. Cultivation of trait-enhanced oil seeds is also the future option.
INFORMAL SECTOR
The household survey did not include consumption patterns of the working population who
buy their meals out of home. While it is important to observe that street and restaurant foods
did not contain very high levels of TFA, which are the foods that the working population are
exposed to, the only concern would be that this population would be expected to consume these
foods in greater frequency and amounts than the population surveyed here. Hence reduction of
TFA from these foods further by recommending oils lower in TFA is likely to have a positive
overall impact. Reducing the quantity of oil consumed through better draining techniques and
measured addition of oil to foods is possibly the strongest untapped behavior change required
in both the informal sector and home cooking. Studies on reducing the amount of added
coconut oil and its impact on the total saturated fat content of the diet and recommending a
combination of oils to be used is urgently required as future research. Sri Lanka’s priority must
be developing strategies for improving cooking in the informal sector and at home as this is
the largest contributor to oil intake than formal packaged foods. Further, most foods in the
formal sector are already low in TFA.
In order to address poor quality processing by cottage industry, all oils sold as wholesale and
retail should be tested and correctly labeled for TFA and SFA, and if TFA is more than the
national cut off, they should be banned. Both the ban on imports together with the labeling and
banning of oils at point of sale whether wholesale or retail, has potential to address the balance
percentage of oils and fats sold in a loose packaging informally. This requires development of
testing facilities and a strong protocol.
Given the TFA levels and the consumption data, in the Sri Lankan context, in addition to a
mandatory < 2% limit for TFA, encouraging voluntary zero TFA could potentially begin
earlier. It is prudent to plan for both these at the same time, thus minimizing the effort and
investment to do so.
66
PACKAGED FOODS FORMAL AND INFORMAL SECTOR
Contrary to general belief, prepackaged foods had TFA less than 2% of total fat for most foods
studied. However, this is not a reason for complacency and needs to be viewed as an
opportunity to work towards zero TFA. Since most multinational companies have the
technology for reducing TFA, support needs to be given to small companies and the informal
food sector that produces packaged foods. The current analysis was done on packaged foods
bought from the formal sector and this maybe one reason for the low TFA. Informal packaged
foods are likely to contain levels similar to the street foods studied but needs to be evaluated.
For packaged foods in the informal sector, replacement is more applicable than reformulation
as these products are produced with minimal technology hence identification of replacement
oils and oil mixtures is essential.
FORMAL SECTOR REGULATION, INNOVATION AND TECHNOLOGY
The oils tested were low in TFA but coconut palm and vegetable were high in saturated fat.
Currently, a large variety of specialty fats are available for sale online and wholesale and it is
unclear how many of these are partially hydrogenated fats or inter-esterified or imported or
locally produced and may contain high TFA. Of the fats tested only some had TFA levels
higher than 2%, with a ban on these fats being likely to be beneficial. While most foods are
low in TFA, it is prudent to work with industry to achieve zero TFA with reformulation,
encouraging industry to innovate within the oils available in Sri Lanka, with agricultural
commitment to increase supply. Currently, low supply of ideal oils stimulate industry to move
away from better oils for cheaper alternatives. The likelihood of coconut products as
replacements would increase the saturated fat content and possibly the cost. Hence feasibility
studies are also required.
SLSI standards should be revised for oils, fats and foods to include TFA less than 2% of total
fat as a mandatory requirement and then it can progress to zero TFA. A monitoring method is
essential to ensure compliance.
Following mandatory labelling regulations, in a situation where the label is acceptable but
where the TFA is greater than 2% of total fat, a protocol needs to be devised giving the FCA
authority to request reformulation of the products in order to reduce TFA while either reducing
or maintaining the SFA content of the food.
Tighter control on claims related to fats and TFA are required as food with zero fat may have
undesirable levels of saturated fat and sugar. The Nutrient profile model ensures that foods
containing more than 1% of total energy as TFA will not be allowed to be marketed to children
and captures this sentiment.
Technology sharing is essential in order to empower producers. Joint ventures with producers
with experience for example of products such as Vanaspati with zero TFA, and specialty
baking fats with zero trans is important. Larger companies have a role to play in sharing
interesterification technology with smaller producers.
67
While TFA in the current food chain appears closer to 2% in most oils, fats and products, this
should be considered an opportunity for South East Asia to move towards zero TFA now before
infiltration of the food environment with oils and particularly fats that are much higher in TFA
and poor fatty acid profiles than are currently observed.
ASSESSMENT AND MONITORING
▪ Regular assessment of industrially-produced TFA levels in foods, fats and
oils should be carried out. Industrially-produced TFA can be identified
separately from naturally occurring ruminant TFA through analysis of
foods, fats and oils by gas chromatography-mass spectrometry (GCMS)
▪ Food intake by food frequency assessments done initially and expanding to
testing of blood levels at a later date
▪ Monitoring of correct labelling on packaging
▪ Penalties for non-enforcement identified through a compliance monitoring
system at points of import, production and sale
▪ Further study on how to improve enforcement capacity
▪ Identify replacement options and ways to promote availability of these
CREATE AWARENESS
▪ Improve formal and informal food industry and consumer awareness
▪ Address the following issues:
▪ harmfulness of TFA
▪ food containing TFA and PHO
▪ that reformulation and replacement should be done with
polyunsaturates and not saturates
▪ Create awareness in policy makers and stakeholders and publicly commit to
change.
VOLUNTARY ACTIONS BY INDUSTRY TO REFORMULATE PRODUCTS TO
REDUCE TFAS
Global data show that reducing and subsequently eliminating TFA from the food supply is
politically and technically feasible1,11. In countries where the food supply has very high levels
of TFA a step wise reduction is required but in countries with lower TFA levels similar to Sri
Lanka mandatory policy less than 2% TFA of total fat has been practical. Multinational
companies have already reformulated their products in countries where TFA policies exist.
They also have the technology to do so even in countries without policies. This is evident in
Sri Lanka where zero trans products are currently voluntarily produced by some multinational
companies. Yet it has been shown globally that mandatory policy is essential to ensure
reformulation by all companies and in all foods, in order to systematically eliminate TFA in
the future11. Currently mandatory TFA policies have been enacted by 56 countries and the
number is growing. As more countries ban TFA, countries with unregulated markets will find
68
increasing levels of TFA in their food supply due to “dumping” of products with high TFA.
For example, multinational food companies who made TFA-free versions of their products for
countries with TFA policies, sold products that contained TFA in Thailand11.
RECOMMENDATION
It is essential that Sri Lanka adopts mandatory limits that restrict industrially-produced
TFA in oils, fats and foods to less than 2% of total fat, together with a complete ban on
partially hydrogenated oils and fats. The positive features observed in Sri Lanka are that the
levels of TFA in the food supply are currently low which makes it feasible for industry to
reformulate to less than 2% and also to achieve zero trans in the near future through a voluntary
basis. The fact that some companies already carry out voluntary reduction and the fact that the
food supply currently has low TFA levels highlights that the technology exists, the environment
is conducive, and that it is essential to act soon to prevent “dumping” in Sri Lanka.

69
REFERENCES
1. https://www.who.int/news-room/q-a-detail/q-a-replace-trans-fat
2. Gurr MI, Harwood JL, Frayn KN et al. (2016) Lipids: Biochemistry, Biotechnology
and Health. John Wiley & Sons: Chichester.
3. Brouwer IA. Effect of trans-fatty acid intake on blood lipids and lipoproteins: a
systematic review and meta-regression analysis. World Health Organization 2016.
4. de Souza RJ, Mente A, Maroleanu A, Cozma AI, Ha V, Kishibe T, Uleryk E,
Budylowski P, Schünemann H, Beyene J, Anand SS. Intake of saturated and trans
unsaturated fatty acids and risk of all cause mortality, cardiovascular disease, and type
2 diabetes: systematic review and meta-analysis of observational studies. BMJ
2015;351:h3978 doi: 10.1136/bmj.h3978
5. WHO. Draft Guidelines: Saturated fatty acid and trans-fatty acid intake for adults and
children. 2018. Geneva: WHO.
6. Bhardwaj S, Passi SJ, Misra A, Pant KK, Anwar K, Pandey R, et al. Effect of
heating/reheating of fats/oils, as used by Asian Indians, on trans fatty acid formation.
Food Chemistry. 2016; 212: 663-70.
7. Tarrago-Trani MT, Phillips KM, Lemar LE, Holden JM. New and existing oils and
fats used in products with reduced trans-fatty acid content. Journal of the American
Dietetic Association. 2006;106(6):867-80.
8. Skeaff C. Feasibility of recommending certain replacement or alternative fats.
European Journal of Clinical Nutrition 2009; 63: S34.
9. Berry SE, Bruce JH, S. Steenson S, Stanner S, Buttriss JL,Spiro A, Gibson PS,
Bowler I, Dionisi F,Farrell L, Glass A, Lovegrove JA, Nicholas j Peacock E, Porters
E, Mensink RP, Hall WL. Interesterified fats: What are they and why are they used?
A briefing report from the Roundtable on Interesterified Fats in Foods. Nutrition
Bulletin. 2019; 44,
10. Yang LY & Kuksis A (1991) Apparent convergence (at 2-monoacyl- glycerol level)
of phosphatidic acid and 2-monoacylglycerol path- ways of synthesis of chylomicron
triacylglycerols. Journal of Lipid Research 32: 1173–86.
11. Trans fat free by 2023- case studies in trans fat elimination. NCD Alliance, May 2019
12. https://www.upfieldprofessional.com/en-lk/products/astra-gold-fat-spread-5kg
13. https://www.flora.com/en-gb/flora/healthy-living/in-the-kitchen/spreads-butter-or-
margarine-what-is-best
14. Ekanayake S, Perera R , Hettiaratchi U and Mahavithanage S, Prathapan S. Survey on
dietary behavior related to foods likely to contain trans fats, 2020. (Unpublished
observations)
15. http://www.health.gov.lk/moh_final/english/public/elfinder/files/news/2019/Colour%
20coding%20for%20solids.pdf
16. http://www.health.gov.lk/moh_final/english/public/elfinder/files/publications/publish
policy/13_NCD.pdf
17. http://www.agrimin.gov.lk/web/images/docs/1252389643AgPolicy4.pdf

70
18. http://www.agrimin.gov.lk/web/images/Information_Act/Development/2019_08_19_
Draft_OAP.pdf
19. Sri Lanka IPS 2002 Sri Lanka state of the economy
https://www.ips.lk/wp-content/uploads/2017/01/SOE2002.pdf
20. http://www.customs.gov.lk/public/files/tariff/Tariff%20Proper/3%20Sec%20III%20(
Ch15)/Ch15.pdf
21. Sri Lankas edible oil exports 2016. Center for international development Havard
https://growthlab.cid.harvard.edu/files/growthlab/files/edible_oils_analysis_website.p
df
22. https://www.globaltradealert.org/state-act/44502/sri-lanka-special-commodity-levy-
reduced-on-the-imports-of-certain-vegetable-fats-and-oils
23. Ministry of Health (2011) Food based dietary guidelines for Sri Lankans, Nutrition
Division, Ministry of Health, in collaboration with WHO (2nd Edition), Colombo: Sri
Lanka.
24. The Gazette of the Democratic Socialist Republic of Sri Lanka,Food act of Sri Lanka,
No 26, of 1980, Ministry of Health, Colombo 8, Sri Lanka
http://extwprlegs1.fao.org/docs/pdf/srl14452.pdf
25. The Gazette of the Democratic Socialist Republic of Sri Lanka. Food amendment act,
no. 20 of 1991.Ministry of Health, Colombo 8, Sri Lanka
26. The Gazette of the Democratic Socialist Republic of Sri Lanka, Food amendment act,
no. 29 of 2011. Ministry of Health, Colombo 8, Sri Lanka
27. The Gazette of the Democratic Socialist Republic of Sri Lanka, The Food (Fats and
Oils Standards) Regulations – 2006. The Ministry of Healthcare and Nutrition Section
32 of the Food Act, No. 26 of 1980. Ministry of Health, Colombo 8, Sri Lanka.
Available at
http://203.94.76.60/FOODWEB/files/regulations/draft/fats_oils_regulations.pdf
28. The Gazette of the Democratic Socialist Republic of Sri Lanka, Food labelling and
advertising regulations 2005 of Food Act, No. 26 of 1980. Ministry of Health,
Colombo 8, Sri Lanka. Available at
http://203.94.76.60/FOODWEB/files/regulations/Food%20(labelling%20and%20Adv
ertising)%20Regulations%20-
%202005/Food%20(labelling%20and%20Advertising)%20Regulations%20-
%202005-%20E.pdf
29. WHO EURO Eliminating trans fats in Europe a policy brief 2015.
30. http://www.health.gov.lk/moh_final/english/public/elfinder/files/news/2019/Colour%
20coding%20for%20solids.pdf
31. Maintenance of Healthy Canteens in Schools, circular No. 35/2015 (dated 2015.12.31).
Ministry of Health, Colombo 8, Sri Lanka
32. https://www.ips.lk/wp-
content/uploads/2017/03/IPS_IFPRI_FoodValueChainWorkshop_NutritionPolicy_Ap
ril2016.pdf
33. Foresight 2.0 – Global Panel on Agriculture and Food Systems for Nutrition 2020.
https://www.glopan.org/foresight/

71
34. Food Balance sheets for oils crops Sri Lanka.
https://knoema.com/FAOFBS2017/food-balance-sheets?country=1001590-sri-lanka.
Accessed 08.2020.
35. https://www.slideshare.net/AmilaBuddika/final-final-51192673 (Assignment report)
(Accessed on 15st January 2020).
36. Gupta V, Downs SM, Ghosh-Jerath S, et al. Unhealthy fat in street and snack foods in
low-socioeconomic settings in India: a case study of the food environments of rural
villages and an urban slum. Journal of Nutrition Education and Behavior 2016; 48:
269-279. e261
37. Shauna M Downs, Vidhu Gupta, Suparna Ghosh-Jerath, Karen Lock, Anne Marie
Thow and Archna Singh, Reformulating partially hydrogenated vegetable oils to
maximise health gains in India: is it feasible and will it meet consumer demand?
BMC Public Health 2013, 13:1139 http://www.biomedcentral.com/1471-
2458/13/1139
38. G.S.Gamge, S. Sivakanthan, P.H.P.Prasanna, W.M.T Madujith. Quantification of
trans fat in selected bakery products available in the central province, 6th Annual
research symposium 2014.
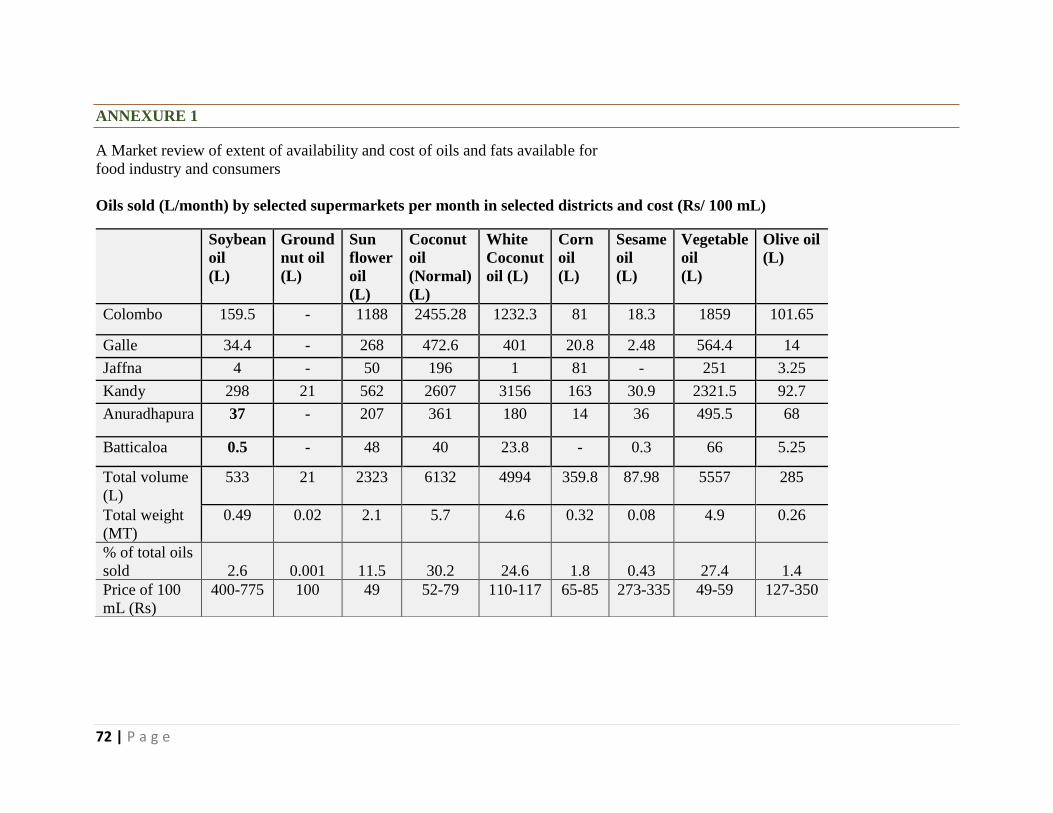
72 | P a g e
ANNEXURE 1
A Market review of extent of availability and cost of oils and fats available for
food industry and consumers
Oils sold (L/month) by selected supermarkets per month in selected districts and cost (Rs/ 100 mL)
Soybean
oil
(L)
Ground
nut oil
(L)
Sun
flower
oil
(L)
Coconut
oil
(Normal)
(L)
White
Coconut
oil (L)
Corn
oil
(L)
Sesame
oil
(L)
Vegetable
oil
(L)
Olive oil
(L)
Colombo 159.5 - 1188 2455.28 1232.3 81 18.3 1859 101.65
Galle 34.4 - 268 472.6 401 20.8 2.48 564.4 14
Jaffna 4 - 50 196 1 81 - 251 3.25
Kandy 298 21 562 2607 3156 163 30.9 2321.5 92.7
Anuradhapura 37 - 207 361 180 14 36 495.5 68
Batticaloa 0.5 - 48 40 23.8 - 0.3 66 5.25
Total volume
(L)
533 21 2323 6132 4994 359.8 87.98 5557 285
Total weight
(MT)
0.49 0.02 2.1 5.7 4.6 0.32 0.08 4.9 0.26
% of total oils
sold 2.6 0.001 11.5 30.2 24.6 1.8 0.43 27.4 1.4
Price of 100
mL (Rs)
400-775 100 49 52-79 110-117 65-85 273-335 49-59 127-350

73 | P a g e
Fats sold per outlet in selected districts (kg/month)
District
Butter
(kg)
Fat spreads
(kg)
Vanaspati
(kg)
Vegetable
ghee (kg)
Other fats
(Bakery)
(kg)
Total
(kg)
Colombo 1069.4 3223.45 - 87.60 - 4381
Galle 315.6 800.75 - 10.8 - 1127
Jaffna 37 13.50 - 3 - 53.5
Kandy 315.6 2287.00 - 111 5.5 2719
Anuradhapura 179.7 362 - 35 - 577
Batticaloa 4 4.4 - 10 - 18.4
Total (Kg) 1921 6691 0 257.4 5.5 8875
% of total
21.75 75.3
0
2.9
0.06

74 | P a g e
ANNEXURE 2
METHODOLOGY OF:
LANDSCAPE ANALYSIS OF TOTAL FATS, TFA AND FATTY ACID PROFILE OF
LOCALLY AVAILABLE INDUSTRIALLY PRODUCED FOODS AND FOOD
INGREDIENTS IN SRI LANKA
Agribusiness Center, University of Peradeniya
August 2020
TEAM OF RESEARCHERS
1. Prof. Terrence Madhujith, University of Peradeniya (Principal Investigator)
2. Prof. D.C.K. Illeperuma, University of Peradeniya
3. Dr Weerasinghe, Veterinary Research Institute, Gannoruwa
4. Prof L.H.P. Gunaratne, Director, Agribusiness Center, University of Peradeniya
5. Ms Subajiny Sivakanthan, University of Jaffna
6. Ms Dilini Wasana, Postgraduate Institute of Agriculture (Research Assistant)
INSTITUTIONS INVOLVED
1. University of Peradeniya
2. Veterinary Research Institute, Gannoruw

75 | P a g e
1 Sampling Procedure
1.1. Study area for sample collection
The samples were collected from six (06) of the nine provinces (67% of all provinces) and one
district from each province in Sri Lanka so as to cover all ethnicities and as much as possible
dietary variations.
1. Colombo district representing the Western region
2. Kandy district representing the Central region
3. Jaffna district representing the Northern region
4. Galle district representing the Southern region
5. Anuradhapura district representing the North Central region
6. Batticaloa district representing Eastern region
1.2 Collection of samples
A total of 278 samples of foods which are commonly consumed by Sri Lankans were analyzed.
The number of samples was decided based on the number required to capture the expected
variation of the foods in Sri Lanka and the feasibility of laboratory analysis and related costs
assuming that there are 1000 types of fat containing food with the precision level of 95%, the
required sample size was determined to be 278.
The food samples used for the study belonged to the following categories aiming at including the
range of foods that are likely to contain TFA in the country as well as to assess the variation of
such foods in the selected districts.
a) Packaged foods and food ingredients
b) Ready to eat foods
c) Non-packaged/ non-branded fats and oils available to consumers and commercial food
producers
a) Packaged foods:
Industrially produced and pre-packaged foods that are likely to contain TFA were collected from
Kandy district. Pre-packaged food samples were collected from different supermarkets, grocery
stores and other retail outlets located in Kandy district. Three consumer-sized packages from the
same lot of selected popular brands were collected. If the weight of the consumer sized package

76 | P a g e
weighed less than 500 g, a number of packages were collected so that the total weight of all
packages of a given brand totaled up to 1500 g or more. In case of oils and fats, three 500 mL/500g
bottles or packages were collected, from the same lot of oils.
b) Ready to eat food samples:
The ready to eat food samples were collected from bakery chains, restaurants, grocery stores as
well as from street vendors, corner stores and small food outlets. Ready to eat food samples were
collected from the above two categories of food outlets each of these selected districts. Outlet
selection, was done after conducting a pilot study. These outlets were selected based on two
criteria: the places which are most frequented by consumers and the outlets which are likely to use
cheap fats and oils. Three 500g portions of the same food samples from different lots were
collected from these outlets.
C) Non-packaged/non-branded fats and oils
According to the survey within the main town area, identified retail and wholesale outlets that sells
non-packaged/ non-branded fats and oils (available to consumers and commercial food producers).
Then the required number of outlets to be sampled were selected using a random technique retail.
Three 500 mL/500g bottles/packets were collected, from the same lot of oils and fats.
1.3 Transportation of samples
The perishable food items such as ready to eat foods were placed in food grade plastic containers
with ice packs and were transported within the same day to the analytical laboratory at University
of Peradeniya. In the event that transport was not possible within the day the food items were
refrigerated overnight before being transported. Dry and packaged foods were transported without
using ice.
The name and address of the grocery store/ready to eat food outlets, district, date purchased, date
manufactured, food category (e.g., cookies), the sample size, brand name, name of the
manufacturer and the lot number were recorded. Once the samples were received at the analytical
laboratory of University of Peradeniya, they were unpacked and photographed. After recording
the sample details, the samples were properly labeled, packed in polythene packages and frozen
until used.
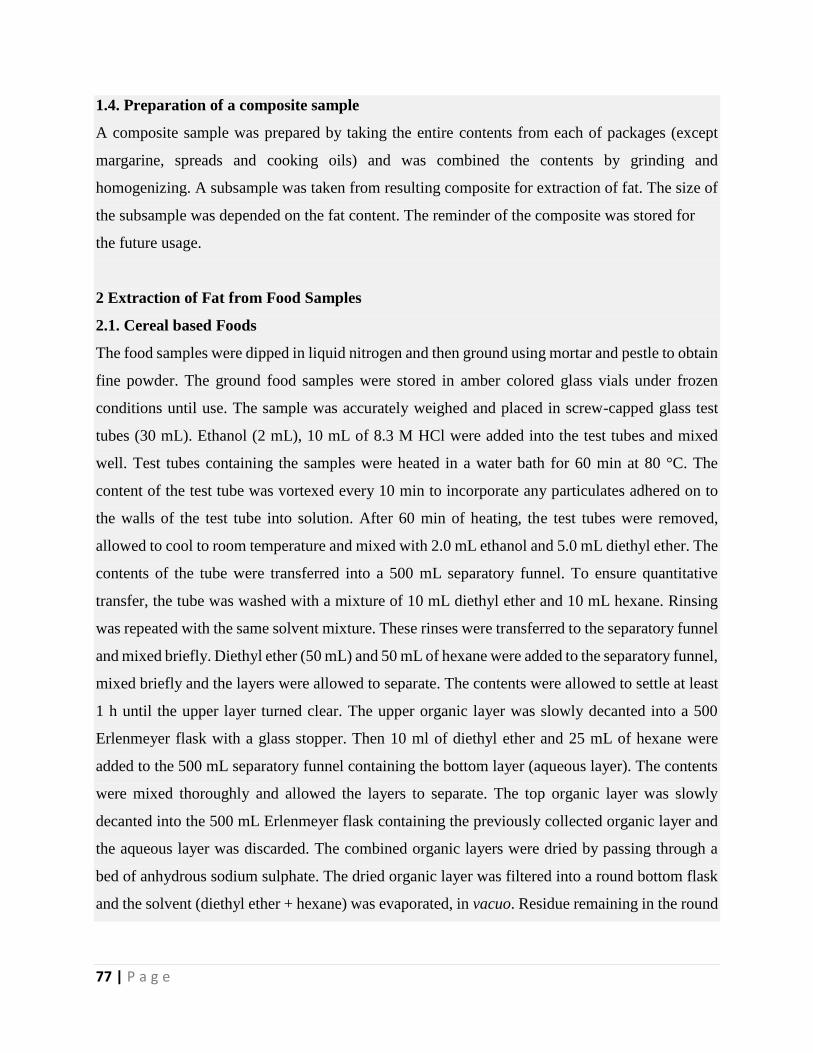
77 | P a g e
1.4. Preparation of a composite sample
A composite sample was prepared by taking the entire contents from each of packages (except
margarine, spreads and cooking oils) and was combined the contents by grinding and
homogenizing. A subsample was taken from resulting composite for extraction of fat. The size of
the subsample was depended on the fat content. The reminder of the composite was stored for
the future usage.
2 Extraction of Fat from Food Samples
2.1. Cereal based Foods
The food samples were dipped in liquid nitrogen and then ground using mortar and pestle to obtain
fine powder. The ground food samples were stored in amber colored glass vials under frozen
conditions until use. The sample was accurately weighed and placed in screw-capped glass test
tubes (30 mL). Ethanol (2 mL), 10 mL of 8.3 M HCl were added into the test tubes and mixed
well. Test tubes containing the samples were heated in a water bath for 60 min at 80 °C. The
content of the test tube was vortexed every 10 min to incorporate any particulates adhered on to
the walls of the test tube into solution. After 60 min of heating, the test tubes were removed,
allowed to cool to room temperature and mixed with 2.0 mL ethanol and 5.0 mL diethyl ether. The
contents of the tube were transferred into a 500 mL separatory funnel. To ensure quantitative
transfer, the tube was washed with a mixture of 10 mL diethyl ether and 10 mL hexane. Rinsing
was repeated with the same solvent mixture. These rinses were transferred to the separatory funnel
and mixed briefly. Diethyl ether (50 mL) and 50 mL of hexane were added to the separatory funnel,
mixed briefly and the layers were allowed to separate. The contents were allowed to settle at least
1 h until the upper layer turned clear. The upper organic layer was slowly decanted into a 500
Erlenmeyer flask with a glass stopper. Then 10 ml of diethyl ether and 25 mL of hexane were
added to the 500 mL separatory funnel containing the bottom layer (aqueous layer). The contents
were mixed thoroughly and allowed the layers to separate. The top organic layer was slowly
decanted into the 500 mL Erlenmeyer flask containing the previously collected organic layer and
the aqueous layer was discarded. The combined organic layers were dried by passing through a
bed of anhydrous sodium sulphate. The dried organic layer was filtered into a round bottom flask
and the solvent (diethyl ether + hexane) was evaporated, in vacuo. Residue remaining in the round

78 | P a g e
bottom flask contains extracted fat. The extracted lipid samples were stored in amber color
ampules under frozen conditions.
2.2. Margarine and other spreads
Approximately 1 g sample from margarine/spread samples was taken from each brand; it was
mixed thoroughly to create a composite. Then 500 mg (accurately weighed) subsample was taken
from the composite. The composite subsample (500 mg) was placed in a separatory funnel (250
mL capacity) and 50 mL of hexane was added. Then 50 mL of distilled water was added and then,
shaken gently. The layers were allowed to separate. The organic layer (top layer) was contained
the extracted fat. Then the top layer (by first draining out the bottom aqueous layer) was collected
into an Erlenmeyer flask. The content was dried for about 15 minutes using anhydrous sodium
sulphate. The organic extract was filtered and collected into a round bottom flask. The solvent was
slowly evaporated using a nitrogen stream to aid in evaporation. Residue remaining in the flask
contains extracted fat.
2.3. Salad oils, Cooking oils and Vegetable Ghee
Since these are 100% pure oils, there is no need to extract oil.
3. Methylation of Extracted Fat
The extracted fat was dissolved in 2 ml toluene in a screw-capped glass test tube (20 mL). Then 2
mL of 7% BF 3 -methanol reagent was added and the vials were capped. The tube was heated at
100 °C for 45 min in a heating block and the tube was gently shaken every 10 min during heating.
The tubes were removed from the heating block, and allowed to cool to room temperature and then
5 mL of distilled water, 2 mL of hexane and 1 g of sodium sulphate was added. The tubes were
capped and shaken. After 10 min, FAME- hexane solution was collected into small glass vials.
Then the vial was flushed with nitrogen and capped. The samples were analyzed immediately
injected into the gas liquid chromatograph.
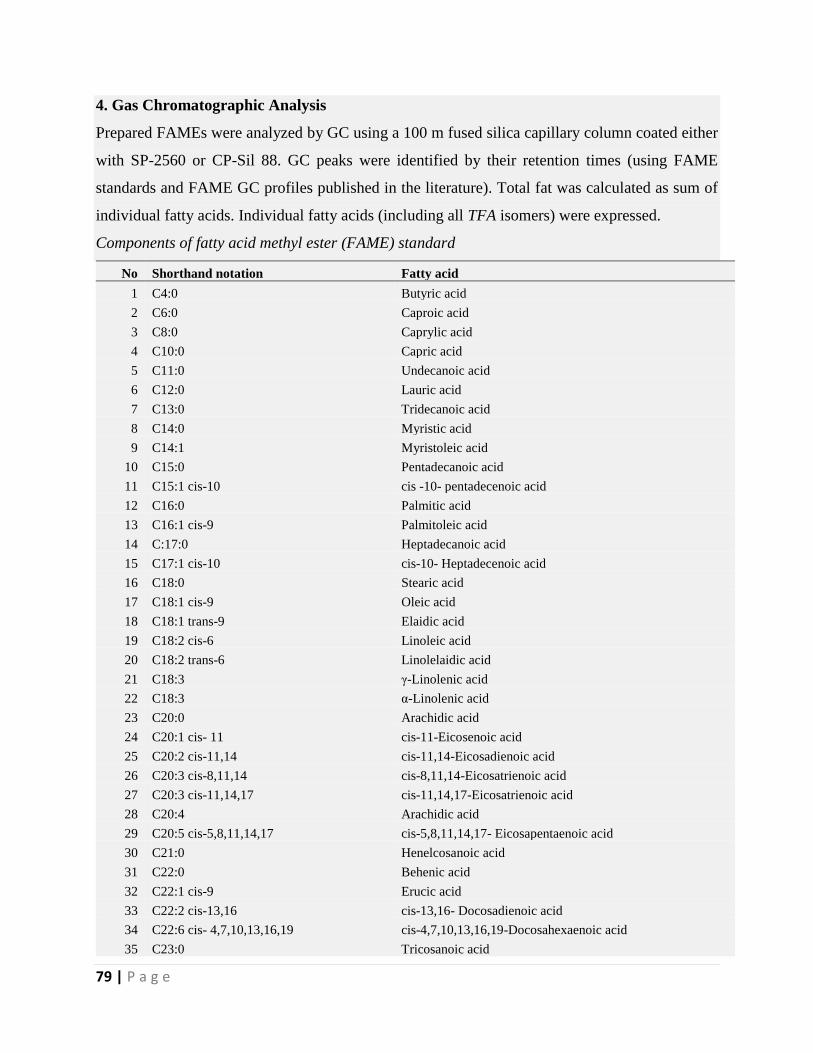
79 | P a g e
4. Gas Chromatographic Analysis
Prepared FAMEs were analyzed by GC using a 100 m fused silica capillary column coated either
with SP-2560 or CP-Sil 88. GC peaks were identified by their retention times (using FAME
standards and FAME GC profiles published in the literature). Total fat was calculated as sum of
individual fatty acids. Individual fatty acids (including all TFA isomers) were expressed.
Components of fatty acid methyl ester (FAME) standard
No Shorthand notation Fatty acid
1 C4:0 Butyric acid
2 C6:0 Caproic acid
3 C8:0 Caprylic acid
4 C10:0 Capric acid
5 C11:0 Undecanoic acid
6 C12:0 Lauric acid
7 C13:0 Tridecanoic acid
8 C14:0 Myristic acid
9 C14:1 Myristoleic acid
10 C15:0 Pentadecanoic acid
11 C15:1 cis-10 cis -10- pentadecenoic acid
12 C16:0 Palmitic acid
13 C16:1 cis-9 Palmitoleic acid
14 C:17:0 Heptadecanoic acid
15 C17:1 cis-10 cis-10- Heptadecenoic acid
16 C18:0 Stearic acid
17 C18:1 cis-9 Oleic acid
18 C18:1 trans-9 Elaidic acid
19 C18:2 cis-6 Linoleic acid
20 C18:2 trans-6 Linolelaidic acid
21 C18:3 γ-Linolenic acid
22 C18:3 α-Linolenic acid
23 C20:0 Arachidic acid
24 C20:1 cis- 11 cis-11-Eicosenoic acid
25 C20:2 cis-11,14 cis-11,14-Eicosadienoic acid
26 C20:3 cis-8,11,14 cis-8,11,14-Eicosatrienoic acid
27 C20:3 cis-11,14,17 cis-11,14,17-Eicosatrienoic acid
28 C20:4 Arachidic acid
29 C20:5 cis-5,8,11,14,17 cis-5,8,11,14,17- Eicosapentaenoic acid
30 C21:0 Henelcosanoic acid
31 C22:0 Behenic acid
32 C22:1 cis-9 Erucic acid
33 C22:2 cis-13,16 cis-13,16- Docosadienoic acid
34 C22:6 cis- 4,7,10,13,16,19 cis-4,7,10,13,16,19-Docosahexaenoic acid
35 C23:0 Tricosanoic acid

80 | P a g e
36 C24:0 Lignoceric acid
37 C24:1 cis-9 Nervonic acid
The operating parameters used were injection port temperature 250 °C, detector temperature 250
°C, oven temperature 180 °C, carrier gas - hydrogen; column head pressure 170 kPa (25 psi); flow
rate, 1.0mL/min; linear velocity, 26 cm/s; split ratio 100:1, carrier gas: helium; column head
pressure 286 kPa (41 psi); flow rate, 1.0 mL/min; linear velocity, 19 cm/s; split ratio 100:1.
Performance check: The column and GC performance were checked using a suitable mixture of
FAME covering the range of fatty acid under investigation. One μL test sample FAME was
injected.
Blank sample: A blank sample (hexane) was injected before running a test sample FAME. This
test was repeated in every ten samples.
TFA composition was calculated and expressed both as % total fatty acids and as g fatty acids
per 100 g of test food sample.
Precision of data: Selected five food samples were tested from Outside laboratory, SGS Lanka
(Pvt) Ltd. Chilli paste (Jaffna district), Fat spread (Kandy district), Fried rice (Jaffna district),
Chocolate cake (Pre- packaged) and Palm oil (Galle district) were the selected food samples. Fat
was extracted according to the method which followed for the other food samples and 5 ml of
extracted fat from each food sample was sent for the analysis. The results which received from
the outside laboratory were compared with our results.
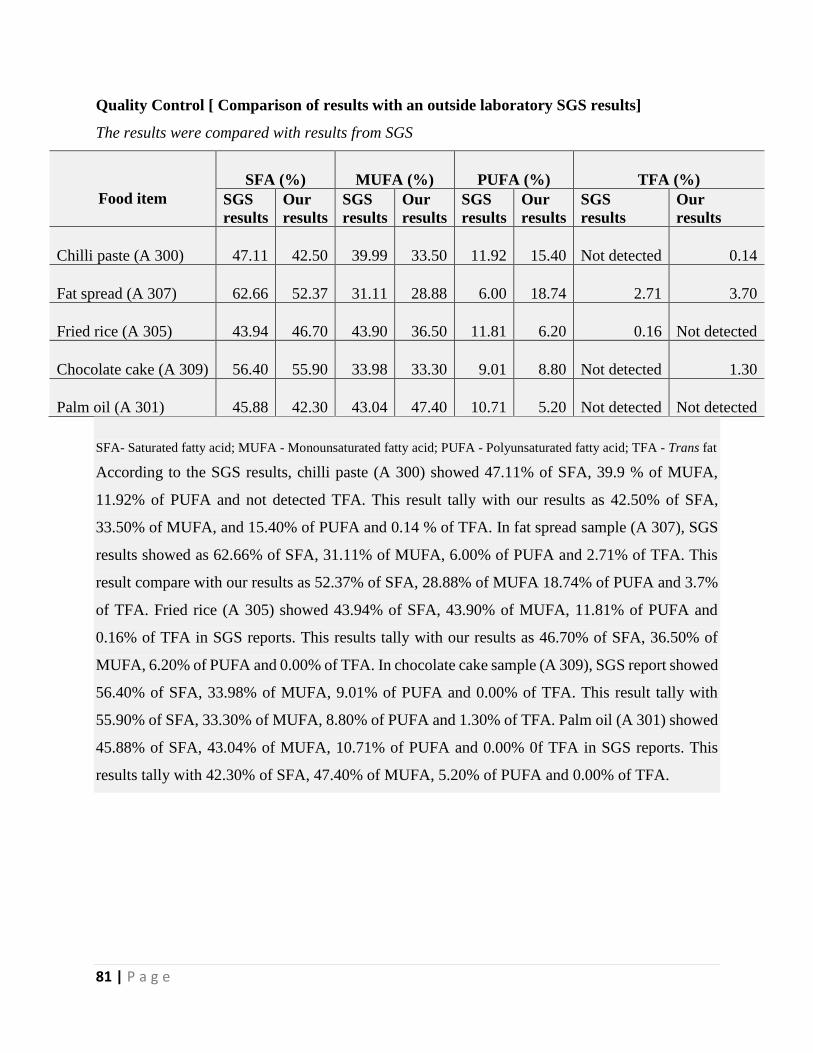
81 | P a g e
Quality Control [ Comparison of results with an outside laboratory SGS results]
The results were compared with results from SGS
Food item
SFA (%) MUFA (%) PUFA (%) TFA (%)
SGS
results
Our
results
SGS
results
Our
results
SGS
results
Our
results
SGS
results
Our
results
Chilli paste (A 300) 47.11 42.50 39.99 33.50 11.92 15.40 Not detected 0.14
Fat spread (A 307) 62.66 52.37 31.11 28.88 6.00 18.74 2.71 3.70
Fried rice (A 305) 43.94 46.70 43.90 36.50 11.81 6.20 0.16 Not detected
Chocolate cake (A 309) 56.40 55.90 33.98 33.30 9.01 8.80 Not detected 1.30
Palm oil (A 301) 45.88 42.30 43.04 47.40 10.71 5.20 Not detected Not detected
SFA- Saturated fatty acid; MUFA - Monounsaturated fatty acid; PUFA - Polyunsaturated fatty acid; TFA - Trans fat
According to the SGS results, chilli paste (A 300) showed 47.11% of SFA, 39.9 % of MUFA,
11.92% of PUFA and not detected TFA. This result tally with our results as 42.50% of SFA,
33.50% of MUFA, and 15.40% of PUFA and 0.14 % of TFA. In fat spread sample (A 307), SGS
results showed as 62.66% of SFA, 31.11% of MUFA, 6.00% of PUFA and 2.71% of TFA. This
result compare with our results as 52.37% of SFA, 28.88% of MUFA 18.74% of PUFA and 3.7%
of TFA. Fried rice (A 305) showed 43.94% of SFA, 43.90% of MUFA, 11.81% of PUFA and
0.16% of TFA in SGS reports. This results tally with our results as 46.70% of SFA, 36.50% of
MUFA, 6.20% of PUFA and 0.00% of TFA. In chocolate cake sample (A 309), SGS report showed
56.40% of SFA, 33.98% of MUFA, 9.01% of PUFA and 0.00% of TFA. This result tally with
55.90% of SFA, 33.30% of MUFA, 8.80% of PUFA and 1.30% of TFA. Palm oil (A 301) showed
45.88% of SFA, 43.04% of MUFA, 10.71% of PUFA and 0.00% 0f TFA in SGS reports. This
results tally with 42.30% of SFA, 47.40% of MUFA, 5.20% of PUFA and 0.00% of TFA.
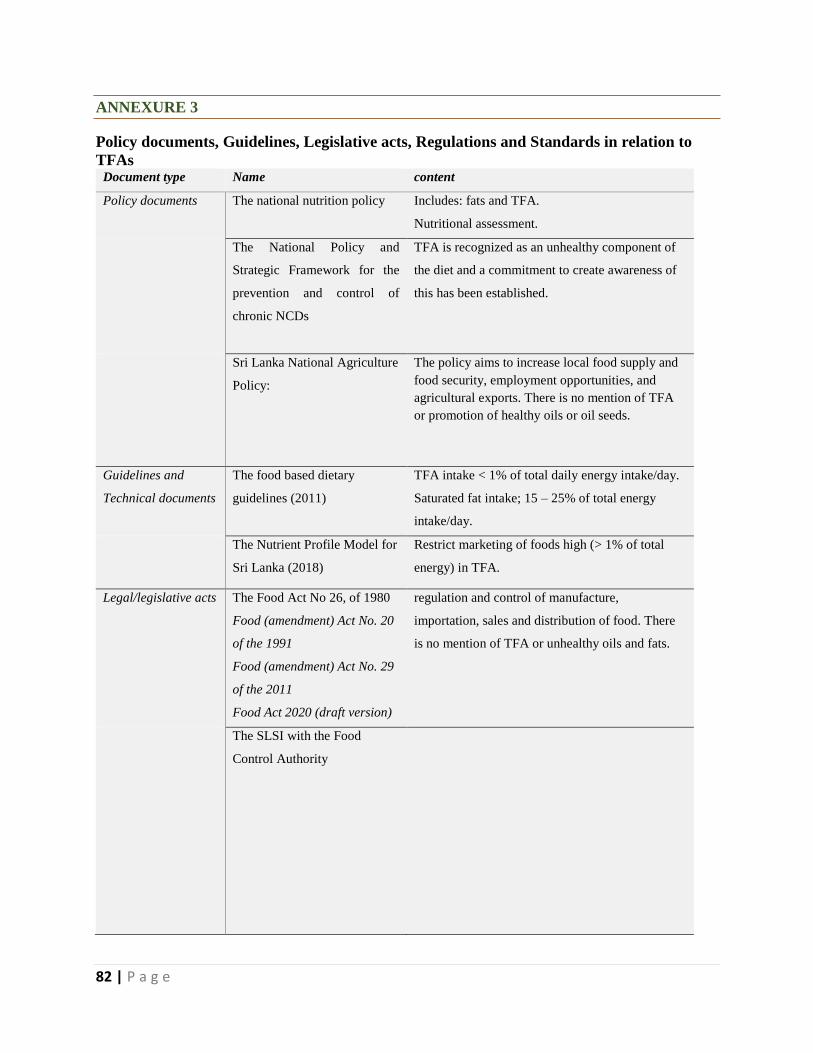
82 | P a g e
ANNEXURE 3
Policy documents, Guidelines, Legislative acts, Regulations and Standards in relation to
TFAs Document type Name content
Policy documents The national nutrition policy
Includes: fats and TFA.
Nutritional assessment.
The National Policy and
Strategic Framework for the
prevention and control of
chronic NCDs
TFA is recognized as an unhealthy component of
the diet and a commitment to create awareness of
this has been established.
Sri Lanka National Agriculture
Policy:
The policy aims to increase local food supply and
food security, employment opportunities, and
agricultural exports. There is no mention of TFA
or promotion of healthy oils or oil seeds.
Guidelines and
Technical documents
The food based dietary
guidelines (2011)
TFA intake < 1% of total daily energy intake/day.
Saturated fat intake; 15 – 25% of total energy
intake/day.
The Nutrient Profile Model for
Sri Lanka (2018)
Restrict marketing of foods high (> 1% of total
energy) in TFA.
Legal/legislative acts The Food Act No 26, of 1980
Food (amendment) Act No. 20
of the 1991
Food (amendment) Act No. 29
of the 2011
Food Act 2020 (draft version)
regulation and control of manufacture,
importation, sales and distribution of food. There
is no mention of TFA or unhealthy oils and fats.
The SLSI with the Food
Control Authority

83 | P a g e
Food (Standards)
Regulations
Section 32 of the Food Act,
No. 26 of 1980 and the
regulations of 2008
Standards for 13 different food products are stated.
Margarine, Vegetable Fat (Hydrogenated
Vegetable Oil), Bakery Shortening, Coconut Oil
(Edible Coconut Oil), Gingelly Oil (Edible
Gingelly Oil, Sesame Oil), Corn Oil (Or Maize Oil),
Olive Oil, Ground Nut Oil, Soya Bean Oil, Palm
Kernel Oil (Edible), Palm Oil (Edible), Lard and
Dripping. Ground nut oil and Gingelly oil < 3.0%
of free fatty acids. All other food products < 1% free
fatty acids. Butter, Butter Oil (Ghee), Cheese,
Yogurt, Curd, Ice Cream, and Malted Food/Malted
Milk Powder are also mentioned in relation
physical and chemical properties. None of these
standards include or mention TFA limits.
Food (Adoption of Standards) Regulations 2008
Lists 158 food items. Listed below are food products which are either a fat or an oil:
Food standards in relation to food fats and oils (Section 32 of the Food Act, No. 26 of
1980 and the regulations of 2008)
Coconut oil (SLS 32) None of the food products mention TFA
nor give standards for the proportion or
percentage of TFA in the food product.
Unfortunately, the presence of many
amendments not clearly linked make the
Food (Adoption of Standards)
Regulations 2008 less user friendly.
sesame oil/gingelly oil (SLS 231)
Palm Oil (SLS 961; published in 1992),
Palm Stearin (SLS 960; 1st revision),
Groundnut (Peanut) Oil (SLS 947; 1st
revision),
Corn (Maize) Oil (SLS 905, 1st
revision),
Palm Kernel Oil (SLS 862, 1st revision),
Soya Bean Oil (SLS 293; 2nd revision
1992),
Butter (SLS 279; 1st revision),
fat spreads and blends (SLS 1427)

84 | P a g e
The Food (Fats and Oils
Standards) Regulations –
2006(17
defines oils as edible fat or edible oil and as
triglycerides of fatty acids of vegetable or animal
origin but does not include different grades of
cream, butter, recombined butter, butter oil, ghee or
dairy fat spread, and does not specify TFA limits.
Food (Bread standards)
Regulations 1994(20)
Under the ingredients and optimal ingredients for
bread – only edible oil seeds are mentioned, with no
mention of TFA limits.
Regulations on
labelling and
advertising of oils
and fats
Food (labelling and
advertising) Regulations 2005
labeling should be in accordance with the Food
(Labelling and Advertising) Regulations 2005
Food (Fats and Oils Standards)
Regulations – 2006
Reduced fat: greater than 30% and not more than
60%. No mention of TFA limits
Food (labelling and
advertising) Regulations 2005
Specifications on limits of fat content as per
standards above, no mention of TFA limits.
Food (Colour coding for Sugar,
Salt and Fat) Regulations 2019
A food product cannot be packaged, sold or
advertised unless color coded into red, orange and
green. Green < 3g total fatty acids/100g. Red >
17.5g total fatty acids/100g. Orange: 3g - 17.5
g/100g.
Regulations on
Imports and health
certificates
Customs Regulations (June
2020) Import duties or Tax
Oils including their fractions in both refined and
non-refined states are required to pay a customs
duty of 15% or at the rate of Rs.66.00 per
kilogram or whichever is higher. Specified oils are
soya-bean oil, ground-nut oil, olive oil, palm oil
sunflower seed, safflower or cotton-seed oil,
coconut (copra), palm kernel or babassu oil.
With effect from June 2020 the Sri Lankan
Minister of Finance, Economic, and Policy
Development imposed a Special Commodity Levy
of Rs. 600 on the imports of certain vegetable fats
and oils and their fractions replacing the earlier tax
and being the only duty applicable to import.
Trade agreements Sri Lanka Free Trade
Agreement (1998)
Sri Lanka converted imported crude palm oil into
vanaspati and re-exported to India. It is not known
if this still continues.

85 | P a g e
Circulars Maintenance of Healthy
Canteens in Schools. Circular
No. 35/2015
Foods containing fats and TFAs, are prohibited in
school canteens. (i.e processed meat such as ham,
sausages, brockworst, lingus, bacon or foods made
with these, pastries and puffs, deep fried foods,
rolls, patties, samoza, cutlets, fried potatoes and
manioc).
Sale of food cooked using oil: only coconut oil to
be used for deep-frying and not vegetable oils such
as palm oil. Oils such as gingerly oil, olive oil,
canola oil, sun-flower oil, maize oil, and soya oil for
tempering and roasting food are allowed.

86 | P a g e
ANNEXURE 4
Standards for edible fats and oils (in accordance with The Food (Fats and Oils Standards) Regulations – 2006)*
Defines permitted refining processes,
Defines labeling criteria as to the source of vegetable oil from which the refined oil has been manufactured,
Defines antioxidants which are approved for use
Defines fatty acid compositions of vegetable oils / fats and animal oils / fats listed as determined by Gas Chromatography.
Blended edible vegetable oil is an admixture of any two edible vegetable oils where proportion by weight of any edible vegetable
oil used in the admixture should not be less than 20%.
Vegetable oils (excluding palm olein and palm stearin): include plant source, the relative density at a specified temperature,
refractive index (clarity), iodine value (unsaturation),saponification (FFA) value. The limits or absence of free fatty acids,
moisture, unsaponifiable matter, any other oil or fat, or mineral oil, and any suspended or other foreign matter, any added colouring
or flavouring substance.
Vanaspati include the permitted contents of FFA, moisture, unsaponifiable matter and colouring substances and flavouring
substances. However, the fatty acid profile or the TFA content is not specified.
Lard and Tallow, include relative density, refractive index, iodine value, saponification value are specified in the act. In addition,
the permitted limits or absence of substances resulting from rendering process, other than fatty acids and fat, moisture,
unsaponifiable matter and any other foreign substance are specified. Limits of fatty acids, where mono-unsaturated (18-1) and
polyunsaturated (18-2) fatty acids make up 31-67% of total fatty acids.
*Standards have been specified for coconut oil, corn oil, gingelly oil (edible gingelly oil, sesame seed oil, sesame oil, til oil), groundnut oil (arachis oil, peanut
oil), mustard oil (mustard seed oil), olive oil, palm oil (edible palm oil ), palm kernel oil (edible palm kernel oil), palm olein, palm stearin (high melting
fraction derived from the fractionation of palm oil), rice bran oil, soya bean oil, safflower oil and blended edible vegetable oil

87 | P a g e
ANNEXURE 5
Standards for products derived from edible fats and oils (including “fat spreads” and “blended fat
spreads”)
Standard applies to fat products containing > 10% and < 90 % m/m fat.
“Fat spreads” include solid/ malleable emulsion (water-in oil type) products, derived from
solid and/or liquid vegetable oil and/or animal fats with a milk fat content ≤ 3% 3.0% of the
fat content.
Fat content: Margarine 80.0% - 90.0% m/m, Halvarine / Minarine 39.0% - 41.0% m/m,
Milk fat content (not more than 3.0 % m/m of the total fat)
In margarine, the free fatty acids limit moisture, absence of mineral oil, and any other
substance, except salt
Skimmed milk solids (with the exception of milk-fat); more than 3% and less than 80% of
the total fat content. The total fat content and the milk fat content need to be declared on the
label.
Fatty acid compositions are not given for fat spreads or blended fat spreads and TFA content
is also not specified.

88 | P a g e