Traffic Volume Summary Statisticsonlinepubs.trb.org/Onlinepubs/trr/1991/1305/1305-014.pdf ·...
5
108 TRANSPORTATION RESEARCH RECORD 1305 Traffic Volume Summary Statistics DAVID ALBRIGHT Standardized traffic volume data provide a basis for preliminary examination of the underlying distribution of the data. In this study, traffic volume data from permanently installed devices were examined on a daily basis throughout (Federal) fiscal year 1989. The examination included computer-based edits and analyst data review. If the edited data were accepted, the data were stored in a computer file for later use. Missing or incomplete days of data were not included. Data were not adjusted on the basis of professional judgment. The reviewed and accepted data were maintained in a file specifically designed to prohibit intentional or unintentional operator modification of the measurements. The$e steps were taken to help ensure base data integrity. At the end of the year, all accepted data were analyzed using Statistical Anal- ysis System software. The traffic volume data from the permanent sites indicate that traffic on many roads is not normally distributed and that site-specific traffic data collected over the period of 1 year may be more variable than previously estimated. The purpose of this study is to examine the underlying distri- bution of traffic volume data using 1 year of standardized traffic volume data. Data from permanently installed traffic volume recorders in New Mexico were used in the analysis. The importance of ensuring base data integrity, the distribu- tion of traffic volume data over the period of 1 year, and the variance associated with annual traffic volume summary sta- tistics are described. BACKGROUND During 1987 and 1988, the New Mexico Highway and Trans- portation Department conducted a survey of traffic monitor- ing practice within the state and nationally. This survey led to the awareness of needed reform through establishing of mandatory traffic data standards (1). In May 1988, the sec- retary of the department signed the first set of statewide traffic monitoring standards, designed to go into effect October 1, 1988 (2). The standards were required for both the public and private sectors for all traffic counts on roads that received, or were proposed to receive, state or federal funding. The state requirements were designed to ensure the integ- rity of base data. A computer system, written in Statistical Analysis System (SAS) language, was developed and imple- mented to help ensure that all public and private sector data complied with the traffic standards. This program was termed the "Traffic Monitoring System" (TMS). Of the several principal TMS design elements, the most important was base data integrity (3). Daily electronic edits were implemented for all data from permanent traffic record- ing devices. Each day, all permanently installed devices were New Mexico State Ilighway and Transportation Department, 1120 Cerrillos Road, Santa Fe, N.Mex. 87502. polled using a telecommunications system. Hourly records of traffic volume were uploaded to a VAX 8550 computer. These data were edited by computer to check for compliance with standards. Following electronic edits, an analyst reviewed site- specific, hourly volume records that were flagged as having questionable directional distribution or variance. For all questionable data, an analyst was given the respon- sibility to review the hourly traffic records. The analyst also had the authority to accept or delete questionable days' data. If deleted from the active file, TMS automatically stored the data for further analysis in a research file. No procedures were permitted for individual analysts to exercise professional judgment in modifying measurements. Similarly, individual analysts were not allowed to complete missing or incomplete days of data. Any missing or erroneous mechanical measurements resulted in nonacceptance of the day's data, and data storage in the research file. All edited, reviewed, and accepted daily data were defined as "standard" or "edit-accepted" data days. Traffic summary statistics were calculated solely from this edit-accepted data. On October 1, 1989, the first complete year of standard traffic data had been-collected, edited, summarized, and was available for analysis. This provided an opportunity to ex- amine standard data files from traffic counts in a computer software environment suited for statistical analysis. (Federal) fiscal year (FFY) 1989 traffic volume data are appropriate to the purpose of this study because the data were collected and maintained with an emphasis on base data in- tegrity. On the basis of what was observed from the first year of standard data, additional modifications were made to the standards and TMS ( 4). Both the standards and TMS were designed for refinement on the basis of what was learned from implementation. STANDARD PERMANENT COUNTER DATA During FFY 1989, there were 66 permanent devices statewide. Of these, 62 sites were used in this study to examine the data distribution. Among the 62 sites considered appropriate for the purpose of this study, the range of standard data days during the year was from 107 to 310 days. The sites not used in this analysis had 3, 4, 31, and 44 days of standard data. The low standard days were related to new device installation and construction on the roadway. The 62 sites with data analyzed in this study were predom- inantly rural. There were 44 counters on rural roads, and 18 counters from urban roads. The included sites are presented by functional classification in Table 1. For all permanent counter sites included in the study, there was an average of 247 days of standard data. Because traffic
Transcript of Traffic Volume Summary Statisticsonlinepubs.trb.org/Onlinepubs/trr/1991/1305/1305-014.pdf ·...

108 TRANSPORTATION RESEARCH RECORD 1305
Traffic Volume Summary Statistics
DAVID ALBRIGHT
Standardized traffic volume data provide a basis for preliminary examination of the underlying distribution of the data. In this study, traffic volume data from permanently installed devices were examined on a daily basis throughout (Federal) fiscal year 1989. The examination included computer-based edits and analyst data review. If the edited data were accepted, the data were stored in a computer file for later use. Missing or incomplete days of data were not included. Data were not adjusted on the basis of professional judgment. The reviewed and accepted data were maintained in a file specifically designed to prohibit intentional or unintentional operator modification of the measurements. The$e steps were taken to help ensure base data integrity. At the end of the year, all accepted data were analyzed using Statistical Analysis System software. The traffic volume data from the permanent sites indicate that traffic on many roads is not normally distributed and that site-specific traffic data collected over the period of 1 year may be more variable than previously estimated.
The purpose of this study is to examine the underlying distribution of traffic volume data using 1 year of standardized traffic volume data. Data from permanently installed traffic volume recorders in New Mexico were used in the analysis. The importance of ensuring base data integrity, the distribution of traffic volume data over the period of 1 year, and the variance associated with annual traffic volume summary statistics are described.
BACKGROUND
During 1987 and 1988, the New Mexico Highway and Transportation Department conducted a survey of traffic monitoring practice within the state and nationally. This survey led to the awareness of needed reform through establishing of mandatory traffic data standards (1). In May 1988, the secretary of the department signed the first set of statewide traffic monitoring standards, designed to go into effect October 1, 1988 (2). The standards were required for both the public and private sectors for all traffic counts on roads that received, or were proposed to receive, state or federal funding.
The state requirements were designed to ensure the integrity of base data. A computer system, written in Statistical Analysis System (SAS) language, was developed and implemented to help ensure that all public and private sector data complied with the traffic standards. This program was termed the "Traffic Monitoring System" (TMS).
Of the several principal TMS design elements, the most important was base data integrity (3). Daily electronic edits were implemented for all data from permanent traffic recording devices. Each day, all permanently installed devices were
New Mexico State Ilighway and Transportation Department, 1120 Cerrillos Road, Santa Fe, N.Mex. 87502.
polled using a telecommunications system. Hourly records of traffic volume were uploaded to a VAX 8550 computer. These data were edited by computer to check for compliance with standards. Following electronic edits, an analyst reviewed sitespecific, hourly volume records that were flagged as having questionable directional distribution or variance.
For all questionable data, an analyst was given the responsibility to review the hourly traffic records. The analyst also had the authority to accept or delete questionable days' data. If deleted from the active file, TMS automatically stored the data for further analysis in a research file.
No procedures were permitted for individual analysts to exercise professional judgment in modifying measurements. Similarly, individual analysts were not allowed to complete missing or incomplete days of data. Any missing or erroneous mechanical measurements resulted in nonacceptance of the day's data, and data storage in the research file.
All edited, reviewed, and accepted daily data were defined as "standard" or "edit-accepted" data days. Traffic summary statistics were calculated solely from this edit-accepted data.
On October 1, 1989, the first complete year of standard traffic data had been-collected, edited, summarized, and was available for analysis. This provided an opportunity to examine standard data files from traffic counts in a computer software environment suited for statistical analysis.
(Federal) fiscal year (FFY) 1989 traffic volume data are appropriate to the purpose of this study because the data were collected and maintained with an emphasis on base data integrity. On the basis of what was observed from the first year of standard data, additional modifications were made to the standards and TMS ( 4). Both the standards and TMS were designed for refinement on the basis of what was learned from implementation.
STANDARD PERMANENT COUNTER DATA
During FFY 1989, there were 66 permanent devices statewide. Of these, 62 sites were used in this study to examine the data distribution. Among the 62 sites considered appropriate for the purpose of this study, the range of standard data days during the year was from 107 to 310 days.
The sites not used in this analysis had 3, 4, 31, and 44 days of standard data. The low standard days were related to new device installation and construction on the roadway.
The 62 sites with data analyzed in this study were predominantly rural. There were 44 counters on rural roads, and 18 counters from urban roads. The included sites are presented by functional classification in Table 1.
For all permanent counter sites included in the study, there was an average of 247 days of standard data. Because traffic

Albright
TABLE 1 NEW MEXICO PERMANENT COUNTER SITE DATA BY FUNCTIONAL CLASSIFICATION FOR FFY 1989
Functional Classification
Interstate Rural
Principal Arterial Rural
Minor Arterial Rural
Interstate Urban
Principal Arterial Urban
Minor Arterial Urban
Number of Sites
14
7
23
4
12
2
Total 62
data have been historically and are conventionally grouped by functional classification of roadway, it is appropriate to examine standard data days by these categories. Six functional classifications are represented by the permanent counter sites in this study. The average days of standard data by functional classification of roadway are presented in Table 2.
Among functional classifications, the Interstate urban had the lowest number of average standard data days for analysis. During the first year of standard operations, the edits for standard compliance resulted in rejection of more days of data on Interstate urban roads than for other road classifications. Approximately 45 percent of the data were accepted as standard. The data collection edits resulted in rejecting daily data Jess frequently among the other five roadway functional classifications. For the functional classifications excluding Interstate urban , between 65 and 81 percent of the data were accepted as standard. At each of the 62 counter sites included in the study, there is an adequate sample of days of the year to examine daily data variability.
The annual average daily traffic (AADT) was calculated from standard data days of data at each site, with the data weighted by day of week (5). The AADT varied among the sites. The range of AADT was from 500 to 127,000. The distribution of AADT by volume group is provided in Table 3.
TABLE 2 PERMANENT COUNTER STANDARD DATA DAYS BY FUNCTIONAL CLASSIFICATION FOR FFY 1989
Functional Classification Standard Data Days
Interstate Rural .... . .... . .. .... . . ...... 238
Principal Arterial Rural .......... . ..... 278
Minor Arterial Rural . ... ... .. . .......... 251
Interstate Urban ......... .. . . . . .. . ...... 165
Principal Arterial Urban ....... . .. . ..... 254
Minor Arterial Urban .... . .. . ...... . ..... 294
TABLE 3 PERMANENT COUNTER SITES AND VOLUME GROUPS BY AADT FOR FFY 1989
AADT Number of Included Sites
<l,000 ................ • .. . .. ...•... 3
1,000 5,999 •....... . ... . . . .... 22
5,000 9,999 . . ..... . ......... . . 11
10,000 - 19,999 ..•.... .. .... . ..... 11
20,000 - 29,999 .......... . . . .. . .... 5
30,000 - 39,999 .......... . . . ....... 7
40,000 - 49,999 . ... . . . . .. ... . ... . .. 1
50,000 + ..........••• .. .• .. .•.....• 2
Total 62
IMPACT OF DATA STANDARDS
109
The establishment and enforcement of traffic data standards resulted in significant changes in traffic summary statistics. The impact of standardizing data collection and summarization practice is in part reflected by the change in permanent counter summary statistics from FFY 1988 to FFY 1989.
The FFY 1988 data for the permanent counter sites were the last year of nonstandard data practice. The practice used was similar to that of most states in the nation. Missing values were imputed from current data when there were few missing hours in the dataset, and were estimated from previous years' data when there were many missing hours or days of data. Professional judgment was used to complete and smooth the data.
FFY 1989 was the first year of statewide data standards. The FFY 1989 data summarization standards prohibited any imputation or completion of missing data, and rejected any day's data not both complete and conforming to other data integrity edits.
Of the 62 permanent counters accepted for analysis in this study, 57 can be used for comparing the 1988 and 1989 summary statistics. At five remaining sites, the counters were not installed throughout FFY 1988.
Comparing the impact of change in methodology is problematic when the change involves two different years of data . This noted, some rules of comparison may be reasonably established. First, none of the sites exhibited a year-to-year traffic decrease over the past two decades, and no land use change occurred at the sites in the 2-year study period to suggest a decrease would be expected. A decrease in AADT from FFY 1988 to FFY 1989 could be expected to be identified as a site at which the change was a result of implementing traffic standards.
Second, the fuel consumption in the state increased by approximately 3.5 percent between the two years. Although this figure may be biased because of reporting problems , and the change would be expected to vary by functional classification, any increase in volume between 0 and 5 percent between FFY

110
1988 and FFY 1989 may be considered reasonable. The increase may or may not be correct, but there is not an appropriate basis for rejecting the increase. Volume increase greater than 5 percent would appear to be a combination of change in traffic and method, unless there was a traffic generation change known to the data analysts. These sites with traffic generation changes that would indicate a greater than 5 percent increase were among those five newer installation sites already deleted from the comparison.
Of the 57 sites that can be used to compare the impact of traffic standards prohibiting professional judgment, smoothing, and imputation procedures, 30 sites had a decrease in AADT from 1988 to 1989, whereas 27 sites had an increase. The relatively equal distribution between the number of increasing and decreasing values would be expected if the two methods were neither inherently nor intentionally biased to produce higher or lower traffic volumes. If there were a methodological impact, the incidence of increase am! decrease would be expected to be, and is, almost equally distributed.
Of the 27 sites with an increase in traffic, 9 had increases greater than 5 percent. Combining these permanent counter sites with the 30 that experienced a decrease, nearly 70 percent of the sites were characterized by non-traffic-related change in summary statistic through the data standards.
The range of percent change in AADT from 1988 to 1989 also indicates the impact of the change in method. The high and low values in the change are significantly different than would be expected if the change were caused by unobserved and unaccountable changes in traffic flow. The range of AADT change from FFY 1988 to FFY 1989, by functional classification, is presented in Table 4.
In Table 4, the low change column is not applicable in one case because there was only one minor arterial urban site included in this comparison.
The changes identified at permanent counter sites may be associated to some degree with the establishment of data standards that preclude certain common practices. This observation is important, because the extent of the change suggests not only that standard practice has an impact, but also that nonstandard traffic bases that permit professional judgment in smoothing and imputing missing data points may be limited in their ability to support analyses of traffic variability. The comparisons also suggest that traffic volume summary statistics may be distorted by previous assumptions of mechanical failure insignificance, data imputation, and data smoothing.
TABLE 4 RANGE OF PERCENT CHANGE IN PERMANENT COUNTER AADT BY FUNCTIONAL CLASSIFICATION OF ROADWAY, FFY 1988 TO FFY 1989
Functional Classification High Low
Interstate Rural ......... .• ........ 10% ..... - 7%
Principal Arterial Rural ............ 9% ..... - 6%
Minor Arterial Rural ..... . .......... 8% ..... -10%
Interstate Urban ................... 12% ..... -21%
Principal Arterial Urban ............ 7% ..... - 5%
Minor Arterial Urban ..... . .......... 2% .... .
TRANSPORTATION RESEARCH RECORD 1305
SITE-SPECIFIC TRAFFIC VOLUME VARIABILITY
The standard data measurements from 62 permanent counters were used to calculate site-specific information about traffic daily variation over the period of 1 year. The variability was examined by site, by functional classification, and rural and urban roads.
There Is an inherent annual variability in traffic at any site. This annual variability is intuitively known, on the basis of the common experience of driving the same road at the same time on different days and noting that traffic differs . However, the variability of traffic has been commonly underestimated in the literature (6) .
The distribution of the coefficients of variation, which ranged from 8.3 to 42.1 percent, is presented in Table 5.
The results reflect inherent traffic variability that is higher than commonly considered. The principle is fundamental to uaffic monitoring truth-in-data: estimates of variability should be based on actual measurements of traffic, unaffected by either the judgment of the data collector or incere t of the data user.
NORMAL DISTRIBUTION OF THE DATA
Some applications of mean summary statistics such as AADT assume normal distribution of data. It may be helpful to consider the effect of skew on the distribution of the mean. Skew is an indication that the mean may not indicate the central tendency of the data.
The data from permanent counter sites were tested to determine whether or not they are normally distributed. Using
TABLE 5 PERMANENT COUNTER SITES INHERENT VARIABILITY BY AADT COEFFICIENTS OF VARIATION FOR FFY 1989
CV Numbe~ of Sites
8 9.9 .................... 2
10 - 11.9 .................... 6
12 - 13.9 .................... 5
14 - 15.9 ................... 13
16 - 17.9 ................... 12
18 - 19.9 .................... 8
20 - 21.9 .................... 6
22 - 23.9 .................... 1
24 - 25.9 .................... 2
26 - 27.9 .................... 2
28 - 29.9 .................... 3
30 + .....••....•.....•...••. 2
Total 62
Albright
the SAS structure of TMS, the moments of the distribution were calculated for edit-accepted data from each permanent counter. The Kolmogorov D test was used to test for departure from normal form , to accept or reject the null hypothesis that the data are a random sample from a normal distribution. The Kolmogorov test measures the discrepancy in location, scale, and shape between a normal distribution and an observed distribution. Data at a permanent counter site for which the null hypothesis was rejected were then examined for skew and kurtosis.
Many of the permanent counters have data that are not normally distributed. An example of a distribution that is positively skewed is from a permanent counter on Interstate 10, milepoint 445. The null hypothesis was rejected. There were 249 standard days of data , and skewness of 1.47711.
An example of standard permanent counter data that are negatively skewed was the permanent counter on FederalAid Local Road 4797, milepoint 1. This counter had 310 standard days of data, rejection of the null hypothesis of normal distribution, and skewness of -0.887133.
Data from some of the counters more closely approximate a bimodal distribution. A permanent counter on Federal-Aid Local Road 5096, milepoint 2, had 218 standard data days, with a mean of 38,750, and failed the Kolmogorov D test. There is a skewness of -0.959344 . All permanent counter data distributions that appear bimodal were also negatively skewed.
111
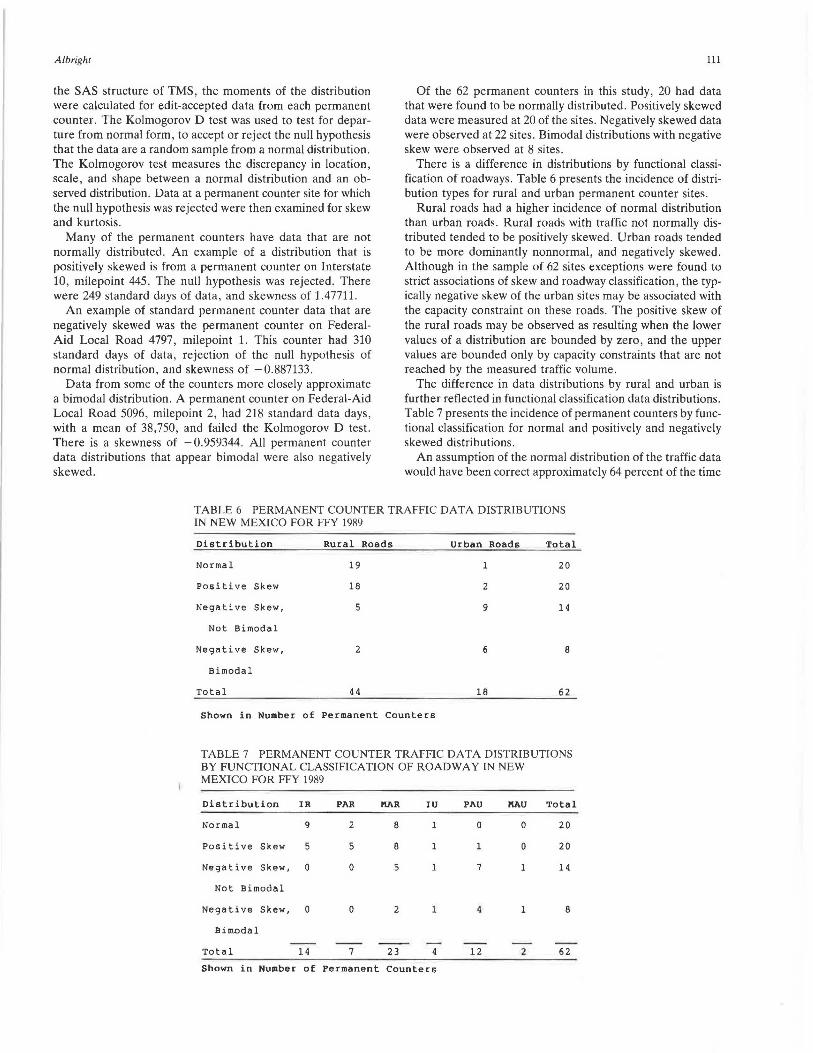
Of the 62 permanent counters in this study, 20 had data that were found to be normally distributed . Positively skewed data were measured at 20 of the sites. Negatively skewed data were observed at 22 sites. Bimodal distributions with negative skew were observed at 8 sites.
There is a difference in distributions by functional classification of roadways. Table 6 presents the incidence of distribution types for rural and urban permanent counter sites .
Rural roads had a higher incidence of normal distribution than urban roads. Rural roads with traffic not normally distributed tended to be positively skewed. Urban roads tended to be more dominantly nonnormal, and negatively skewed. Although in the sample of 62 sites exceptions were found to strict associations of skew and roadway classification, the typically negative skew of the urban sites may be associated with the capacity constraint on these roads. The positive skew of the rural roads may be observed as resulting when the lower values of a distribution are bounded by zero, and the upper values are bounded only by capacity constraints that are not reached by the measured traffic volume.
The difference in data distributions by rural and urban is further reflected in functional classification data distributions. Table 7 presents the incidence of permanent counters by functional classification for normal and positively and negatively skewed distributions.
An assumption of the normal distribution of the traffic data would have been correct approximately 64 percent of the time
TABLE 6 PERMANENT COUNTER TRAFFIC DATA DISTRIBUTIONS IN NEW MEXICO FOR FFY 1989
Distribution Rural Roads Urban Roads Total
Normal 19 l 20
Positive Skew 18 2 20
Negative Skew, 5 9 14
Not Bimodal
Negative Skew, 2 6 8
Bimodal
Total 44 18 62
Shown in Number of Permanent Counters
TABLE 7 PERMANENT COUNTER TRAFFIC DAT A DISTRIBUTIONS BY FUNCTIONAL CLASSIFICATION OF ROADWAY IN NEW MEXICO FOR FFY 1989
Distribution IR PAR MAR IU PAU MAU Total
Normal 9 2 8 l 0 0 20
Positive Skew 5 5 8 l l 0 20
Negative Skew, 0 0 5 1 7 l 14
Not Bimodal
Negative Skew, 0 0 2 1 l 8
Bimodal
Total 14 7 23 4 12 2 62
Shown in Number of Permanent Counters

112
on the Interstate rural roads where daily traffic was monitored. For this functional classification, actual distributions most often satisfied the hypothesis of normality, but the assumption was still inappropriate about one-third of the time. On all other functional classifications of roadway, the assumption of normality was inappropriate in more cases than not. On urban arterials, no sites were found with normally distributed traffic data .
The skew of the traffic data was found to be more significant than kurtosis. Twelve of the sites were evaluated as leptokurtic, and one of the sites as platykurtic.
Over the course of a year, there is inherent variation in traffic at any site. The inherent variability should be assessed before evaluating the error introduced by alternative sampling procedures and adjustment factors . Traffic summaries at permanent counters may be more appropriately understood as a range of values at given probabilities, not as specific or "true" values.
As noted earlier, the observed variability of traffic is higher than previously estimated in the literature. This difference, in part , may be associated with the historical practice of smoothing base data. It suggests but does not define the extent of the traffic summarization errors introduced by the practice of altering base data.
The assumption of normal distribution of traffic data is not appropriate on most roadways . Mean traffic summary statistics should not necessarily be considered as indicating the central tendency of the data. Statistical analyses that assume normal distribution and homogeneity of variance may be inappropriate for traffic volume data.
FURTHER RESEARCH
The process has just begun in learning from the traffic data collected and summarized under standard practice. At present, there are active efforts underway to define standards of practice by the ASTM, and to define a guidance for common practice by AASHTO. Through these efforts, in the coming years the number of standard data bases can be expected to increase substantially. A larger sample will facilitate further analyses, particularly in urban areas .
Several issues addressed in this study may be further examined. Mean statistics are considered robust in that departures from normality may not diminish the helpfulness of the mean in indicating the central tendency of the data. Thus,
TRANSPORTATION RESEARCH RECORD 1305
further work in defining the appropriate limits of accepting the mean statistic is recommended for future research .
The indication that traffic data frequently are not normally distributed leads to further questions . Alternative summary statistics, perhaps based on percentiles, may be examined for use in traffic analyses.
The difference in distributions of traffic data within the same functional classifications of roadway indicates the need for continued research concerning operational classification of roadway data. The principle of operational classification is that the data should be grouped on the basis of observed variations in traffic measurements, rather than marginally political and a priori categories such as functional classification. The potential for reexamining how base measurements are grouped suggests that base data integrity involves not only saving unmodified measurements, but also retaining the measurements for future hypothesis testing.
ACKNOWLEDGMENTS
The contributions of several persons, most notably Joe Wilkinson , Connie Moore , and Larry McQuarie, have been instrumental in the development of this paper.
REFERENCES
1. D. Albright, R. Goldstine, and C. Blewett. Statewide Traffic Monitoring Standards: Implementing the Traffic Monitoring Gu.ide in New Mexico . In Transportation Research Record 1236, TRB , National Research Council , Washington, D.C., 1989.
2. New Mexico State Traffic Monitoring Standards: 1988-89. New Mexico State Highway and Transportation Department, Santa Fe, Oct. 1988.
3. D . Albright and J. Wilkinson. Implementation of a Statewide Traffic Monitoring System. In Transportation Research Record 1271, TRB, National Research Council, Washington, D.C., 1990.
4. D. Albright. Revisions to Statewide Traffic Monitoring Standards Indicated During Implementation of a Traffic Monitoring System. In Transportation Research Record 1271, TRB, National Research Council, Washington, D.C., 1990.
5. D. Albright. The Development of ASTM Highway Traffic Monitoring Standards. H. W. Kummer Lecture, ASTM, Philadelphia, Pa., Dec. 1990.
6. B. B. Petroff. Experience in Application of Statistical Method to Traffic Counting. Public Roads, Vol. 29, No. 5, Dec. 1956.
Publication of this paper sponsored by Commillee on Transportation Data and Information Systems.