Traffic Incident Management State of the Art Review (MPC ... · TRAFFIC INCIDENT MANAGEMENT STATE...
53
TRAFFIC INCIDENT MANAGEMENT STATE OF THE ART REVIEW Dr. Peter T. Martin Piyali Chaudhuri Ivana Tasic Milan Zlatkovic Tristan Pedersen Civil and Environmental Engineering University of Utah September 2011
Transcript of Traffic Incident Management State of the Art Review (MPC ... · TRAFFIC INCIDENT MANAGEMENT STATE...

TRAFFIC INCIDENT MANAGEMENT
STATE OF THE ART REVIEW
Dr. Peter T. Martin
Piyali Chaudhuri
Ivana Tasic
Milan Zlatkovic
Tristan Pedersen
Civil and Environmental Engineering
University of Utah
September 2011

Disclaimer
The contents of this report reflect the views of the authors, who are responsible for the facts and the
accuracy of the information presented. This document is disseminated under the sponsorship of the
Department of Transportation, University Transportation Centers Program, in the interest of information
exchange. The U.S. Government assumes no liability of the contents or use thereof.
North Dakota State University does not discriminate on the basis of age, color, disability, gender expression/identity, genetic information, marital status, national origin, public assistance status, sex, sexual orientation, status as a U.S. veteran, race or religion. Direct inquiries to the Vice President for Equity, Diversity and Global Outreach, 205 Old Main, (701)231-7708.

TABLE OF CONTENTS
1. INTRODUCTION ............................................................................................................................... 1
2. TRAFFIC INCIDENT DEFINITION ............................................................................................... 3
3. STAGES IN TRAFFIC INCIDENT MANAGEMENT PROCESS ............................................. 11
3.1 Traffic Incident Management Area ......................................................................................... 12 3.2 TOC Functions ........................................................................................................................ 13
4. TRAFFIC INCIDENT MANAGEMENT TOOLS ........................................................................ 15
4.1 Variable Message Signs .......................................................................................................... 15 4.1.1 Applications and Design .......................................................................................... 16
4.1.2 Operating Fundamentals of VMS ............................................................................ 17
4.1.3 Issues and Principles of Message Design ................................................................. 18
4.1.4 Maximum Message Length and Viewing Distance ................................................. 20
4.1.5 Long Messages and Priority Reduction Principles.................................................. 24
4.1.6 Dynamic Features on VMSs ....................................................................................... 25
4.2 The 511 Service ....................................................................................................................... 26 4.2.1 Roadway Content (Highways and Arterials) ........................................................... 26
4.2.2 Transit Content ......................................................................................................... 28
4.2.3 Weather Content....................................................................................................... 29
4.2.4 Optional Content ...................................................................................................... 31
4.2.5 Content Quality and Consistency Issues .................................................................. 31
4.2.6 Emergency Alert Messages ...................................................................................... 32
4.3 Highway Advisory Radio ........................................................................................................ 33 4.4 Ramp Metering ........................................................................................................................ 34
5. CONCLUSIONS ............................................................................................................................... 37
6. REFERENCES .................................................................................................................................. 39
7. BIBLIOGRAPHY ............................................................................................................................. 45

LIST OF FIGURES
Figure 2.1 Profile of Reported Freeway Incidents by Type (11.) .............................................................. 7
Figure 3.1 Timeline of Stages in the Traffic Incident Management Process [1] ..................................... 12
Figure 3.2 Examples of Traffic Incident Management Area Signs ......................................................... 13
Figure 4.1 Sign Detection, Reading, Decision, Response Initiation, and Response Relationship ........... 21
Figure 4.2 VMS Detection, Reading, Decision, and Out-of-Vision Relationships ................................. 21
Figure 4.3 Required Message Viewing Distance for VMS Mounted over the Travel Lanes .................. 22
Figure 4.4 Additional Sight Distance Required for Lateral VMS Offset ................................................ 22
Figure 4.5 Two Alternatives of a Two-Phase VMS Message.................................................................. 26

LIST OF TABLES
Table 2.1 Fraction of Freeway Capacity Available Under Incident Conditions Traffic Control
Systems Handbook 1996 ............................................................................................................ 5
Table 2.2 Accident Impact - Summary of Previous Research Findings .................................................... 6
Table 2.3 Accident Impact – Summary of Previous Research Findings .................................................... 8
Table 4.1 Classification of VMS .............................................................................................................. 15
Table 4.2 The Application of Permanent VMS ....................................................................................... 17
Table 4.3 Examples of the Units of Information in VMS Messages ....................................................... 19
Table 4.4 Possible Base VMS Message Elements ................................................................................... 20
Table 4.5 Suggested VMS Legibility Distances for Use in Message Design (ft) .................................... 23
Table 4.6 Maximum Number of Units of Information in VMS Message
(Base Maximum Message Length) .......................................................................................... 23
Table 4.7 Information Priority Order for Incidents .................................................................................. 24
Table 4.8 Information Priority Order for Roadwork ................................................................................ 25

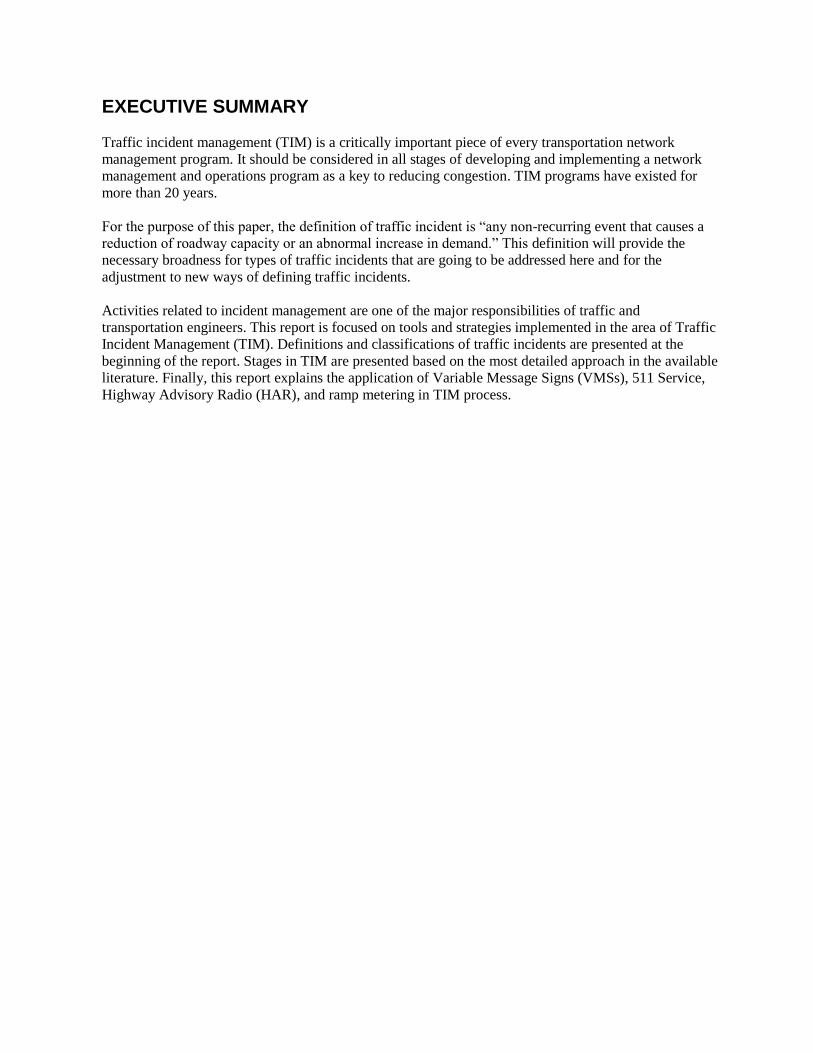
EXECUTIVE SUMMARY
Traffic incident management (TIM) is a critically important piece of every transportation network
management program. It should be considered in all stages of developing and implementing a network
management and operations program as a key to reducing congestion. TIM programs have existed for
more than 20 years.
For the purpose of this paper, the definition of traffic incident is “any non-recurring event that causes a
reduction of roadway capacity or an abnormal increase in demand.” This definition will provide the
necessary broadness for types of traffic incidents that are going to be addressed here and for the
adjustment to new ways of defining traffic incidents.
Activities related to incident management are one of the major responsibilities of traffic and
transportation engineers. This report is focused on tools and strategies implemented in the area of Traffic
Incident Management (TIM). Definitions and classifications of traffic incidents are presented at the
beginning of the report. Stages in TIM are presented based on the most detailed approach in the available
literature. Finally, this report explains the application of Variable Message Signs (VMSs), 511 Service,
Highway Advisory Radio (HAR), and ramp metering in TIM process.


1
1. INTRODUCTION
Activities related to incident management are one of the major responsibilities of traffic and
transportation engineers. Traffic incident management (TIM) is a critically important piece of every
transportation network management program. It should be considered in all stages of developing and
implementing a network management and operations program as a key to reducing congestion. TIM
programs have existed for more than 20 years. At first they were developed to provide safe and efficient
clearance of traffic incident site. Modern TIM programs and support systems have expanded their
activities to response time optimization, increasing the accuracy of incident verification, and investigating
the incident prediction techniques. The main purpose and basis of all incident management programs has
always been the reduction of traffic congestion.
Traffic congestion can be classified as recurrent and non-recurrent. Recurrent congestion is a known
occurrence that can be addressed by employing measures ranging from the building of new roads to ride-
sharing programs. Non-recurrent congestion is largely produced by traffic accidents, such as vehicle
disablements and flat tires, and is a major cause of the decline in mobility in the United States. There is
also a symbiotic relationship between congestion, both recurrent and non-recurrent, and traffic accidents.
This vicious cycle is a major problem that threatens mobility and safety [1.].
Traffic incidents have been identified as one of the major contributors to increased congestion. The
National Traffic Incident Management Coalition (NTIMC) estimates that traffic incidents are the cause of
about one-quarter of the congestion on U.S. roadways, and every minute a freeway lane is blocked due to
an incident results in four minutes of traveler delay time. It has been shown that improved TIM reduces
both overall incident duration as well as secondary crashes. The impact of this reduction incident duration
is demonstrated by a study published in the ITS Journal that estimates the likelihood of a secondary crash
increases by 2.8 percent for every minute that the primary incident remains a hazard.
Traffic incident management (TIM) is the systematic, planned, and coordinated use of human,
institutional, mechanical, and technical resources to reduce the duration and impact of traffic incidents,
and improve the safety of motorists, crash victims, and traffic incident responders. Effectively using these
resources can also increase the operating efficiency, safety, and mobility of the highway. This results
from reducing the time to detect and verify a traffic incident occurrence, implementing the appropriate
response, safely clearing the incident, and managing the affected flow until full capacity is restored [1.].
Incident management is the coordination of activities undertaken by one or more agencies to restore
traffic flow to normal conditions after an incident has occurred. A well-organized and coordinated
incident management operation will reduce the cost of the incident in terms of delay and wasted fuel.
A TIM program is a logical, structured, and integrated set of traffic incident management activities
tailored to a specific geographic area. It includes policies, strategies, and technologies integrated into a
multi-agency, multi-jurisdictional environment aimed at reducing the occurrence and impact of traffic
incidents. To be successful, a TIM program must be on-going actively administered, organizationally
structured, inter-jurisdictional, multi-disciplinary, and fully documented [1.]. The TIM program should be
developed and managed in conjunction with the area’s freeway management and operations program [2.].
From the perspective of a freeway management and operations program, TIM is often a major element, if
not the cornerstone. The organization of the TIM program and the operational responsibilities of its
participants should fit into the organization structure of the region, recognizing the existing assignment of
traffic incident management activities and addressing gaps and overlaps in those assignments. Moreover,
like all programs and activities that are intended to improve the operation of the transportation network,
the performance of a traffic incident management program should be regularly monitored and assessed,
potentially resulting in changes and refinements.

2
Several ITS components can support and enhance a traffic incident management program, including
surveillance to detect and verify incidents, disseminating information to travelers regarding the resulting
congestion and alternatives, improving response via the coordination afforded by a Traffic Operations
center, as well as the real-time sharing of information among the affected agencies. Additionally, the
various activities and coordination needs for traffic incident management parallel those associated with
special event management and emergency/evacuation management.

3
2. TRAFFIC INCIDENT DEFINITION
According to Federal Highway Administration TIM Handbook published in 2000 [11.], “Traffic incident
is any non-recurring event that causes a reduction of roadway capacity or an abnormal increase in
demand. Such events include traffic crashes, disabled vehicles, spilled cargo, highway maintenance and
reconstruction projects, and special non-emergency events.”
Manual of Uniform Traffic Control Devices [4.] defines traffic incident as “an emergency road user
occurrence, a natural disaster, or other unplanned event that affects or impedes the normal flow of
traffic.”
The definition of an incident has changed after the events of September 11, 2001, and major weather
events like Hurricane Katrina in 2005, and the role of TIM obtained the national importance in the United
States. The broad scope of National Incident Management Systems (NIMS) developed by the U.S.
Department of Homeland Security includes ensuring that U.S. roadways are available for incident
response and has an enormous impact on emerging as well as established TIM programs. In agreement
with NIMS concept, every TIM program is required to have three components:
Strategic: How to plan, prepare for, and measure performance.
Tactical: How to execute the plan and manage resources.
Support: How to incorporate the tools and technologies to manage and communicate
information.
Starting in 2009, the TIM program evaluation procedure for each state measures the emergency
preparedness. The National Incident Management System (NIMS) requires the use of the Incident
Command System (ICS) at traffic incident management scenes. The Incident Command System (ICS) is a
standardized, on-scene, all-hazards incident management approach:
Allows for the integration of facilities, equipment, personnel, procedures, and communications
operating within a common organizational structure.
Enables a coordinated response among various jurisdictions and functional agencies, both public
and private.
Establishes common processes for planning and managing resources.
ICS is flexible and can be used for incidents of any type, scope, and complexity. As a system, ICS is
extremely useful; not only does it provide an organizational structure for incident management, but it also
guides the process for planning, building, and adapting that structure. Using ICS for every incident or
planned event helps hone and maintain skills needed for large-scale incidents.
Though the definition of traffic incident has expanded, the opportunities for addressing core
transportation issues remain:
Incidents are estimated to cause more than 50 percent of total delay experienced by motorists in
all urban areas. Of this, 25 percent is caused by traffic incidents such as crashes, stalled vehicles,
roadway debris, and spilled cargo [15.]
Secondary crashes are estimated to cause 18 percent of all fatalities on freeways [15.]
In 2002, approximately 50 percent of all police, Emergency Medical Services (EMS) personnel,
and firefighter fatalities occurred as a result of transportation incidents (either accidental or
“struck-by” incidents or crashes in pursuit or other line-of-duty activities).

4
Between 1997 and 2006, 17 percent of the accidental law enforcement deaths were the result of
“struck-by” motor vehicle incidents occurring during activities such as traffic stops, roadblocks,
directing traffic and assisting motorists. [U.S. Department of Justice, Federal Bureau of
Investigation, Washington, DC, 2006]
For the purpose of this paper, the definition of traffic incident is “any non-recurring event that causes a
reduction of roadway capacity or an abnormal increase in demand.” This will provide the necessary
broadness for types of traffic incidents that are going to be addressed here and the adjustment to new
ways of defining traffic incidents.
Before starting any traffic incident analysis, it is very important to specify the types of incidents that will
be addressed. Incident classification will provide a way to organize the information about the number of
incidents of various characteristics. For the purpose of this paper the classification is going to provide the
background for incident response evaluation. This is very important from the Traffic Operations Center
(TOC) standpoint, because it could lead to change or support of certain decisions that TOC managers and
operators need to make during the incident management procedure. It is important to mention that each
incident classification is regionally developed and differs from one TOC to another. However, the
purpose and the basic criteria remain the same in every region, and incident classification system is an
important input for every TIM program.
From disabled vehicles to major weather events or even terroristic attacks, the causes of traffic incidents
are numerous. But it is the impact on traffic conditions that determines the classification or “rating” of
traffic incidents. An incident rating system should classify incidents in terms of their potential to cause
delays, fuel wastage, secondary accidents, and other adverse operational impacts. The following are the
main problems and secondary effects associated with highway incidents:
Traveler delay
The serious risk of secondary crashes
Danger posed to rescue and response personnel
Reduction in productivity
Increased fuel consumption
Reduction in air quality
Reduction in quality of life
Incidents can be classified in terms of their severity, nature of incident cause, time of occurrence and the
number of agencies required to respond and clear incidents [21.]. Incident severity is the most often
criterion used in incident rating, and it usually refers to the number of lanes and shoulders blocked and the
delay caused due to a certain incident. If incidents are properly classified using the severity criterion, the
level of incident impact prediction accuracy could be increased. This would positively affect the incident
response time and total time needed for the recovery.
Previous studies that developed incident rating systems considered different variables that are directly
related to the severity of the incident such as number of vehicles involved, lanes blocked, the time of the
day, weather conditions, incident duration and number of service entities responding. The primary
findings of several research studies were that the delay due to an incident is a function of the incident
type. Cambridge Systematics developed an incident classification system using previous research
findings. The large majority of the recorded incidents are categorized as vehicle disablements, referring to
cars and trucks that have run out of fuel, have a flat tire, or simply have broken down and are abandoned
by their drivers. Eighty percent of these disablements are moved to the shoulder, usually by their drivers,
and then cleared in 15 to 30 minutes. Such incidents have no significant effect on traffic flow during off-
5
peak hours, and are usually not included in traffic incident studies. During peak hours, however, they can
cause up to 200 hours of delay to other vehicles. The remaining 20 percent of disabled vehicle incidents
occur in the travel lane and result in one or more blocked lanes. According to a Cambridge Systematics
study, these disablements are cleared in 15 to 30 minutes, but may cause up to 200 hours of delay to other
drivers.
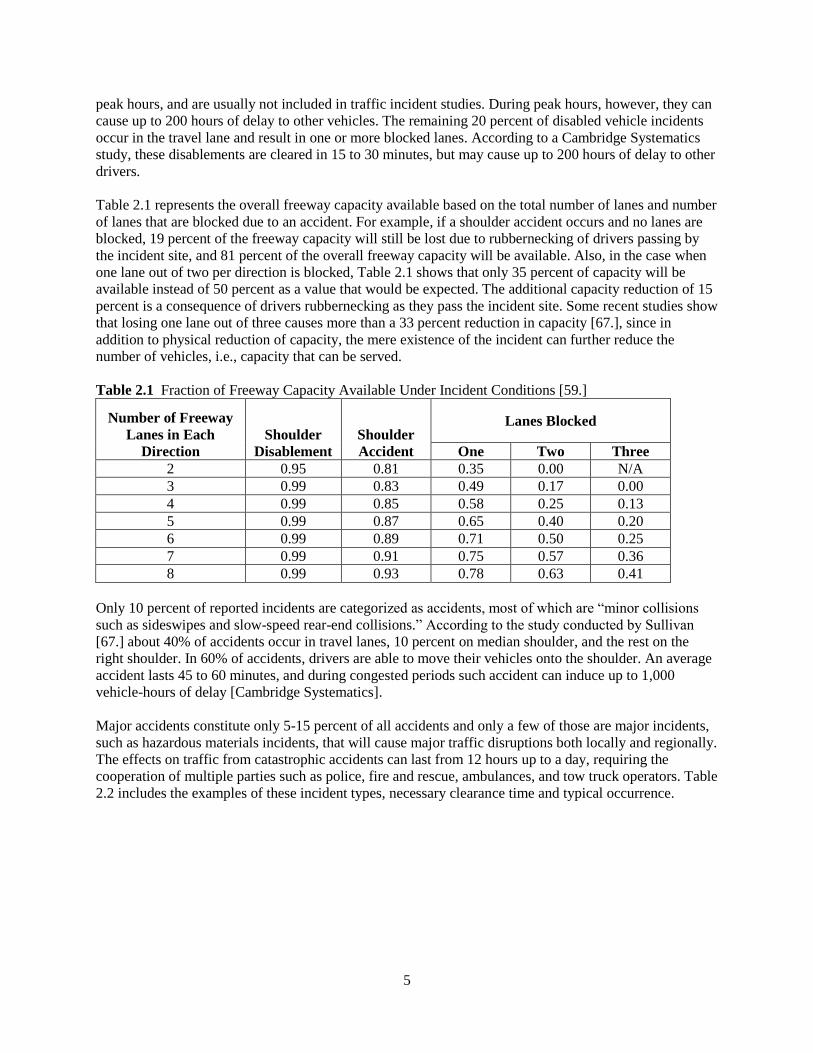
Table 2.1 represents the overall freeway capacity available based on the total number of lanes and number
of lanes that are blocked due to an accident. For example, if a shoulder accident occurs and no lanes are
blocked, 19 percent of the freeway capacity will still be lost due to rubbernecking of drivers passing by
the incident site, and 81 percent of the overall freeway capacity will be available. Also, in the case when
one lane out of two per direction is blocked, Table 2.1 shows that only 35 percent of capacity will be
available instead of 50 percent as a value that would be expected. The additional capacity reduction of 15
percent is a consequence of drivers rubbernecking as they pass the incident site. Some recent studies show
that losing one lane out of three causes more than a 33 percent reduction in capacity [67.], since in
addition to physical reduction of capacity, the mere existence of the incident can further reduce the
number of vehicles, i.e., capacity that can be served.
Table 2.1 Fraction of Freeway Capacity Available Under Incident Conditions [59.]
Number of Freeway
Lanes in Each
Direction
Shoulder
Disablement
Shoulder
Accident
Lanes Blocked
One Two Three
2 0.95 0.81 0.35 0.00 N/A
3 0.99 0.83 0.49 0.17 0.00
4 0.99 0.85 0.58 0.25 0.13
5 0.99 0.87 0.65 0.40 0.20
6 0.99 0.89 0.71 0.50 0.25
7 0.99 0.91 0.75 0.57 0.36
8 0.99 0.93 0.78 0.63 0.41
Only 10 percent of reported incidents are categorized as accidents, most of which are “minor collisions
such as sideswipes and slow-speed rear-end collisions.” According to the study conducted by Sullivan
[67.] about 40% of accidents occur in travel lanes, 10 percent on median shoulder, and the rest on the
right shoulder. In 60% of accidents, drivers are able to move their vehicles onto the shoulder. An average
accident lasts 45 to 60 minutes, and during congested periods such accident can induce up to 1,000
vehicle-hours of delay [Cambridge Systematics].
Major accidents constitute only 5-15 percent of all accidents and only a few of those are major incidents,
such as hazardous materials incidents, that will cause major traffic disruptions both locally and regionally.
The effects on traffic from catastrophic accidents can last from 12 hours up to a day, requiring the
cooperation of multiple parties such as police, fire and rescue, ambulances, and tow truck operators. Table
2.2 includes the examples of these incident types, necessary clearance time and typical occurrence.

6
Table 2.2 Accident Impact - Summary of Previous Research Findings
Accident type Percentage Duration Delay [veh-hours]
One or two lanes
closed 40% 45-90 minutes 1,200-1,500
Major accidents 5-15% More than 60 minutes 2,500-5,000
HAZMAT Up to 5% 10-120 hours 30,000-40,000
Other 45-
55%
70% on the
shoulder Up to 30 minutes Minimal impact
30% on one or
more lanes 60-90 minutes 1,000-1,500
A study conducted in Minnesota shows that 13 percent of all peak-hour crashes are the result of a
previous incident. A study by the Washington State Department of Transportation further emphasizes
this point. This study found that 3,165 shoulder collisions occurred on interstate, limited access, or other
state highways during a period of seven years. The injury rates for shoulder collisions were much higher
than the rates for all other accident categories [21.]. The severity of secondary crashes is greater than that
of the original incident. This is the reason why it is very important to respond and clear incidents as soon
as possible, since the longer the incident is in place, the greater the exposure to secondary crashes. A
1995 analysis of collision statistics in California show that secondary crashes represent an increase in
collision risk of over 600% [21.].
Traffic incidents are divided into three general classes of duration, each of which has unique traffic
control characteristics and needs [MUTCD, 2003].
Major traffic incidents are typically traffic incidents involving hazardous materials, fatal traffic
crashes involving numerous vehicles, and other natural or manmade disasters. These traffic
incidents typically involve closing all or part of a roadway facility for a period exceeding two
hours.
Intermediate traffic incidents typically affect travel lanes for a time period of 30 minutes to two
hours, and usually require control on the scene to divert road users past the blockage. Full
roadway closures might be needed for short periods during traffic incident clearance to allow
traffic incident responders to accomplish their tasks.
Minor traffic incidents are typically disabled vehicles and minor crashes that result in lane
closures for less than 30 minutes. On-scene responders are typically law enforcement and towing
companies, and occasionally highway agency service patrol vehicles.

7
Figure 2.1 Profile of Reported Freeway Incidents by Type (11.)

8
According to Manual on Classification of Motor Vehicle Traffic Accidents [21.], there are four categories
of traffic accident severities:
Severity 1 refers to a single or multiple car incident involving mechanical difficulties or slight
vehicle damage and lasts no longer than 5-10 minutes. Vehicle remains operational or can be
pushed to the nearest exit without endangering life and property of those involved. Very little or
no debris is present and no towing response is necessary. Agency involvement beyond law
enforcement may not be necessary. No injuries are reported.
Severity 2 requires assistance in the form of towing and law enforcement and typically lasts from
15-40 minutes. Vehicles typically cannot move from the freeway to the nearest off ramp or crash
investigation site under their own power. Debris or fluid might be seen, but no injuries are
reported.
Severity 3 involves assistance in the form of towing, law enforcement, fire, and EMS. It typically
lasts from 20 minutes to one hour or more. Vehicles cannot move from the freeway without
mechanical assistance. Debris, fluid, and potential fire hazard are present. Injuries or fatalities are
possible.
Severity 4 refers to incidents that last longer than one hour and may involve multiple disabled
vehicles. There is a possible need for EMS, fire department, and towing. Debris that is present
could require clean up. These incidents last longer than the previous severity types of incidents.
There are many different classifications of traffic incidents. Inside the U.S. this classification differs from
one state to another. To develop the incident classification system for this paper the following incident
types are considered:
Moderate crashes
Severe crashes
Emergency incidents
Major snowstorms
Table 2.3 Accident Impact – Summary of Previous Research Findings
Incident Examples Clearance Time
(hours)
Typical
Occurrence
Moderate Crashes One or more lanes blocked with
personal injuries
1 Daily
Severe Crashes Hazardous material spills, overturned
oversized loads, fire flammable
materials
2-6 Monthly
Emergency Incidents Minor or major earthquakes affecting
bridge structures, plane crashes
affecting major highway, hazardous
material spills requiring the evacuation
of people, forest fires requiring the
closure of a major highway
24+ Rare
Major Snowstorms Severe capacity restriction 2-8 Monthly

9
The classification used for the purpose of this paper [UDOT] is based on the level of closure due to the
traffic incident:
LEVEL 1: Not blocking any lane
LEVEL 2: Blocking less than one half of through lanes
LEVEL 3: Blocking at least one half of through lanes
LEVEL 4: Blocking all lanes and shoulder, no passage possible or permitted

10

11
3. STAGES IN TRAFFIC INCIDENT MANAGEMENT PROCESS
Incident management entails an identifiable series of activities, which may be carried out by personnel
from a variety of response agencies and organizations. These activities are not necessarily performed
sequentially. The most detailed process of incident management is represented in the Freeway
Management and Operations Handbook [1.]:
1. Incident detection is the process by which an incident is brought to the attention of the agency or
agencies responsible for maintaining traffic flow and safe operations on the facility.
2. Incident verification entails confirming that an incident has occurred, determining its exact
location, and obtaining as many relevant details about the incident as possible. Verification
includes gathering enough information to dispatch the proper initial response. Incident
verification is usually completed with the arrival of the first responders on the scene. However,
when hazardous materials are involved, the verification process may be quite lengthy.
3. Motorist information involves activating various means of disseminating incident-related
information to affected motorists. Motorist information needs to be disseminated as soon as
possible, and beyond the time it takes clear an incident. In fact, it should be disseminated until
traffic flow is returned to normal conditions. This may take hours if an incident occurs during a
peak period, and has regional impacts.
4. Incident response includes dispatching the appropriate personnel and equipment, and activating
the appropriate communication links and motorist information media as soon as there is
reasonable certainty that an incident is present. Response requires preparedness by each
responding agency or service provider. This is fostered through training and planning, both as
individual, and collectively with other response agencies. Effective response mainly involves
preparedness by a number of agencies (i.e., planned cooperatively) for a variety of incident types,
so that response to individual incidents is coordinated, efficient, and effective.
5. Site management is the process of effectively coordinating and managing on-scene resources.
Ensuring the safety of response personnel, incident victims, and other motorists is the foremost
objective of incident site management. Effective incident site management can be facilitated by
an incident command system (ICS). An ICS is a formalized system that fosters consistency in the
way agencies and service providers function cooperatively at an incident scene.
6. Traffic management involves the application of traffic control measures in areas affected by an
incident. As with each function of effective incident management, traffic control in the incident
management context is rooted in planning. This includes ensuring the availability of traffic
control equipment and materials, knowledge of available fixed traffic control resources, and
alternate route planning.
7. Incident clearance is the process of removing wreckage, debris, or any other element that disrupts
the normal flow of traffic, or forces lane closures, and restoring the roadway capacity to its pre-
incident condition. At times, this may also include temporary or permanent repair to the
infrastructure.
8. Incident Recovery consists of restoring traffic flow at the site of the traffic incident, preventing
more traffic from flowing into the area and getting trapped in the upstream queue, and preventing
congestion from spilling across the roadway network. Thus it encompasses the activities of site
management, traffic management, and clearance. Resources including traffic operations centers
and their operating staff can facilitate recovery by managing the network-wide effects of traffic
incidents and thus hastening recovery.
12
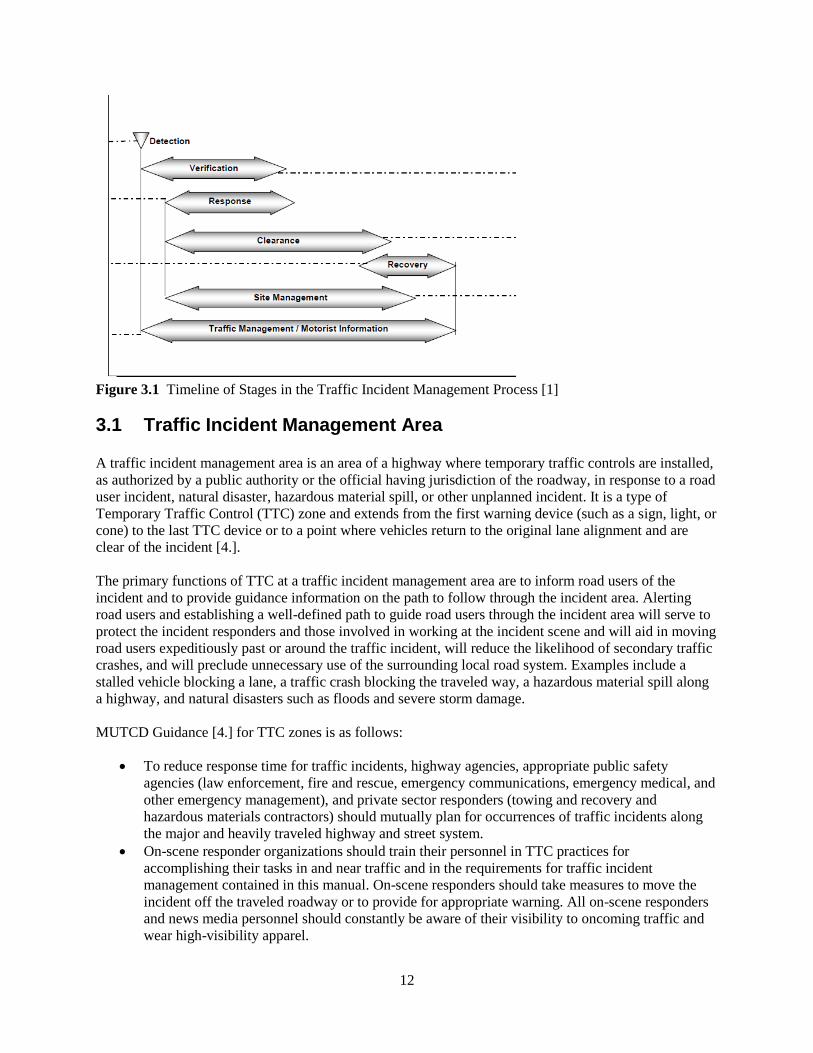
Figure 3.1 Timeline of Stages in the Traffic Incident Management Process [1]
3.1 Traffic Incident Management Area A traffic incident management area is an area of a highway where temporary traffic controls are installed,
as authorized by a public authority or the official having jurisdiction of the roadway, in response to a road
user incident, natural disaster, hazardous material spill, or other unplanned incident. It is a type of
Temporary Traffic Control (TTC) zone and extends from the first warning device (such as a sign, light, or
cone) to the last TTC device or to a point where vehicles return to the original lane alignment and are
clear of the incident [4.].
The primary functions of TTC at a traffic incident management area are to inform road users of the
incident and to provide guidance information on the path to follow through the incident area. Alerting
road users and establishing a well-defined path to guide road users through the incident area will serve to
protect the incident responders and those involved in working at the incident scene and will aid in moving
road users expeditiously past or around the traffic incident, will reduce the likelihood of secondary traffic
crashes, and will preclude unnecessary use of the surrounding local road system. Examples include a
stalled vehicle blocking a lane, a traffic crash blocking the traveled way, a hazardous material spill along
a highway, and natural disasters such as floods and severe storm damage.
MUTCD Guidance [4.] for TTC zones is as follows:
To reduce response time for traffic incidents, highway agencies, appropriate public safety
agencies (law enforcement, fire and rescue, emergency communications, emergency medical, and
other emergency management), and private sector responders (towing and recovery and
hazardous materials contractors) should mutually plan for occurrences of traffic incidents along
the major and heavily traveled highway and street system.
On-scene responder organizations should train their personnel in TTC practices for
accomplishing their tasks in and near traffic and in the requirements for traffic incident
management contained in this manual. On-scene responders should take measures to move the
incident off the traveled roadway or to provide for appropriate warning. All on-scene responders
and news media personnel should constantly be aware of their visibility to oncoming traffic and
wear high-visibility apparel.

13
Emergency vehicles should be safe-positioned (see definition in MUTCD Section 1A.13) such
that traffic flow through the incident scene is optimized. All emergency vehicles that
subsequently arrive should be positioned in a manner that does not interfere with the established
temporary traffic flow.
Responders arriving at a traffic incident should estimate the magnitude of the traffic incident, the
expected time duration of the traffic incident, and the expected vehicle queue length, and then
should set up the appropriate temporary traffic controls for these estimates.
Figure 3.2 Examples of Traffic Incident Management Area Signs
While some traffic incidents might be anticipated and planned for, emergencies and disasters might pose
more severe and unpredictable problems. The ability to quickly install proper temporary traffic controls
might greatly reduce the effects of an incident, such as secondary crashes or excessive traffic delays. An
essential part of fire, rescue, spill clean-up, highway agency, and enforcement activities is the proper
control of road users through the traffic incident management area to protect responders, victims, and
other personnel at the site. These operations might need corroborating legislative authority for the
implementation and enforcement of appropriate road user regulations, parking controls, and speed zoning.
It is desirable for these statutes to provide sufficient flexibility in the authority for, and implementation of,
TTC to respond to the needs of changing conditions found in traffic incident management areas [4.].
3.2 TOC Functions
In the early 1990's, the Utah Department of Transportation (UDOT) began plans to develop Commuter
Link, an Advanced Traffic Management System. By providing real-time information, travelers have an
opportunity to adjust their route, time of travel, or mode of travel to avoid delays. This system, started as
a regional coordination of signals across jurisdictional boundaries within the Salt Lake Valley, has grown
to include over 600 traffic signals, 1400 detector stations, 250 closed circuit television cameras (CCTV),
70 VMS and a wide range of ancillary transportation management systems such as 511, a website, HAR,
RWIS, etc. To support this system, UDOT has installed its own dedicated fiber optic communication
network.
The application of ITS technologies has decreased congestion and delays without the need to increase the
existing capacity of roadway networks. The Commuter Link has resulted in the reduction of freeway

14
delays, traffic signal stops, intersection delays, and has increased peak-hour freeway speeds, thus saving
over 100 million annually and reducing carbon monoxide emissions. ITS deployments have proven to be
a cost effective tool with benefit/cost ratios ranging annually from 8:1 to 20:1. ITS in Utah is funded
primarily through federal, state, and local participation, and the success of the Commuter Link ITS is due
in part to public agencies working together for a seamless transportation system.
The nerve center of Commuter Link is the Utah Department of Transportation Traffic Operation Center
(TOC). Information gathered by Commuter Link is brought together at UDOT's Traffic Operations Center
(TOC). Using advanced technologies such as cameras and traffic and weather sensors, operators in the
TOC can monitor traffic, detect accidents/problems, and take actions necessary to return traffic flow to
normal. Basic TOC functions include the following:
Traffic monitoring: Observing real time traffic conditions
Traffic management: Dealing with “normal” traffic conditions
Incident management: Detection, response and clearance
Involvement in other processes and procedures
Traffic monitoring is related to constant observations of real-time traffic conditions. To provide this
service, TOC uses CCTV to control traffic. Information is also collected from smaller traffic control
centers and UTA’s three radio control centers. The purpose of monitoring traffic is most importantly
having a constant insight of the actual state of traffic, and then using the collected data for further traffic
management under “normal” conditions and in the case of incident occurrence.
The term “traffic management” primary relates to dealing with everyday traffic conditions. This includes
both peak and off-peak day periods. Data collected through traffic control and monitoring system are used
to direct the travelers in the optimal way to their destinations and help them avoid long delays. Using data
from traffic monitoring provides knowledge about real-time traffic and helps traffic management decision
making. Traffic management is accomplished through the use of the systems of ramp metering, VMSs,
traffic signals and their coordination, and advanced traveler information technologies. The final results of
successful traffic management are reduced congestion and improved safety and efficiency of
transportation system.
Incident management represents managing traffic under special conditions related to unplanned events
that could seriously disrupt normal traffic operations. System used to provide this TOC service are the
same as in the case of “regular” previously mentioned traffic management. The only difference is that
incidental situations are difficult to predict, sometimes they are not easily detectable, and time for
decision making certainly needs to be shorter than in the case of everyday traffic management to prevent
or minimize possible negative consequences. The accent is on optimization of response time and time
necessary to clear the incident site so that traffic can go back to its normal state. TOC functions could also
be a part of other planning, design, public transit operations, maintenance, and many other activities in the
transportation system. All TOC functions are goal oriented. The main goals of TOC operations and
functioning are defined as following:
To improve highway safety
To improve the efficiency of Utah’s highways
To provide timely and accurate real-time traffic information
To facilitate cooperative public and private partnerships that integrate transportation services
To provide customer service directly to the public on the operation of the transportation
system

15
4. TRAFFIC INCIDENT MANAGEMENT TOOLS
TIM tools presented in this section are used as traveler information systems or traffic management
systems in congested conditions. The main focus is on variable message signs, since some of the studies
used to support decisions about message display are 30-40 years old and human factors’ research relevant
for the usage of these signs is still not updated. Other traveler information strategies that have a
significant impact during TIM procedures are also described: 511 calls and Highway Advisory Radio. At
the end of this section, basic research findings about ramp meters are presented.
4.1 Variable Message Signs
Variable message signs (VMS) are traffic control devices used for traffic warning, regulation, routing,
and management, and are intended to affect the behavior of drivers by providing real-time traffic-related
information. VMSs are playing increasingly important roles in attempts to improve highway safety,
operations, and use of existing facilities. The first set of VMS design guidelines was written in 1978, and
it was focused on the recommended content in VMS messages, the manner in which messages should be
displayed, and the location where messages should be displayed. Later updates of this document included
maintenance, improvement of target value, motorist reception, operational procedures, and policies. The
main challenge addressed in all these documents is the design and display of VMS messages.
Section 2A.07 of the Manual on Uniform Traffic Control Devices [4.] defines VMS as “traffic control
devices,” and says that a VMS “shall conform to the principles established” in the MUTCD related to the
use of signs within the right-of-way of all classes of public highways, and to the extent practical, the
design and applications prescribed in sections 6F.02 and 6F.52. Section 2E.21 of the MUTCD specifies
that “changeable message signs shall display pertinent traffic operational and guidance information only,
not advertising.”
NTCIP 1203 v02 defines the user needs and features, functional requirements, and standardized design
elements for variable message signs. VMS include all types of signs that can change state.
Table 4.1 Classification of VMS
VMS with fixed number of
messages
VMS with unlimited number
of messages Matrix technologies
Fold-out
Rotating drum
Neon or blank-out signs
Character matrix
Line matrix
Full matrix
Reflective disk matrix
Shuttered fiberoptic signs
Light-emitting diode (LED) signs
Hybrid VMS
Portable VMS provide great flexibility and are usually applied in construction and maintenance
conditions. They are usually diesel or solar-powered and use wireless (cellular) communications to a
central management point, making them a very attractive and flexible tool. Portable changeable message
signs are usually located at the side of the road and do not sit as high as an overhead sign, which can
impair driver visibility. Most are 3-line, 8 or 9- character signs, and although most have the capability of
displaying multiple phases, they tend to be used with simple short messages to allow drivers to read and
comprehend the message. The MUTCD states that no more than two phrases shall be used to display a
message.

16
VMSs should be installed at locations where drivers have the opportunity to take some action in response
to messages displayed [9.]:
Upstream from major decision points (exit ramps, freeway-to-freeway interchanges or
intersections)
Upstream of bottlenecks, high accident areas, and/or major special event facilities (stadiums,
convention centers)
Where regional information concerning weather conditions is crucial
4.1.1 Applications and Design
In the most recent Changeable Message Signs Operations and Messaging Handbook [9.] published by the
Federal Highway Administration, VMS are defined as “programmable traffic control devices that can
usually display any combination of characters to present messages to motorists.” The reason VMS are
applied instead of static guide signs is to present real-time traffic information. VMS can be permanently
installed above the roadway or driven to a desired location as portable devices. Portable VMS are much
smaller than permanent and are oftentimes used in highway work zones, when major crashes or natural
disasters occur, or for special events. The information presented on VMS must be consistent and
compatible with static signs used on the freeway. VMS manage traffic by displaying three types of
messages:
1. Early warning messages give drivers advanced notice of slow traffic, queuing ahead, new detours,
changes in lane patterns, special speed control measures and are effective in reducing secondary
crashes.
2. Advisory messages provide drivers with useful information about a specific problem along their
routes, so they can change their speed or take an alternative route before they reach the problem
area.
3. Alternative route messages influence drivers to travel to their chosen destinations by using routes
different than originally intended. Alternative routes are designated by the transportation agency
and MUST be used in the cases of road closures due to construction, crash, or natural disaster.
VMS display real-time information about traffic conditions, which is why they represent a direct link with
the drivers. Since only a few seconds are available to communicate the message, VMS messages should
be standardized and consistently applied. Reading times for VMS messages are longer than in the case of
static guide signs, because drivers are less familiar with them, so exposure time of the VMS message is
the factor that controls the maximum length of the displayed message. That is why very often a trade-off
must be made and some useful information must be omitted from the message to stay within the
maximum length requirement. Another factor that reduces the amount of information communicated via
VMS is the legibility distance – the distance from which the driver can see, understand, and respond to a
message, taking the possible bad weather conditions into consideration. Factors that are likely to enhance
understanding of the VMS messages are as follows:
Simplicity of words
Brevity
Standardized order of words
Standardized order of message informational units
Understood abbreviations when abbreviations are needed
Standardized applications of messages

17
The messages displayed on VMS should represent what actually happens with traffic, and as traffic
conditions change, VMS messages should follow those changes. If VMS messages are not changed in a
timely manner, the drivers might start questioning the message credibility, and their confidence in VMS
would decrease. VMS messages are changed manually, by system operators who must type in all the new
messages before they are displayed, or automatically, in systems developed with computer assigned
message design and display. A good message is efficient, brief, and to the point. Regardless of how well a
message is designed, VMS must provide timely, reliable, accurate, and relevant information and they
must be operated properly to be effective. Factors that may decrease VMS system credibility are
inaccurate information, not current information, irrelevant information, obvious information, repetitive
information, trivial information, erroneous information, and poor design.
The most important issue related to VMS application is message design. Display and design of VMS
messages should be consistent with recommendations based on human factor research. Many traffic
operations center (TOC) managers don’t have the access to research reports that could assist them in
VMS designing and operating, so they often display as much information that can fit on a VMS without
recognizing that the messages exceed drivers’ capability to read and comprehend them. Every TOC
should have VMS message design and operations policies and procedures in a form of written document.
The process of message design and establishment of a message objective should be completed before
VMS are purchased, to avoid the lack of VMS space, lower target value, and legibility.
Table 4.2 The Application of Permanent VMS
Application Examples
Non-recurrent problems
Caused by random, unpredictable incidents such as crashes, stalled
vehicles, spilled loads; or caused by temporary, preplanned activities
such as construction, maintenance, or utility operations.
Environmental problems Caused by acts of nature such as fog, floods, ice, snow, etc.
Special event traffic
problems
Problems associated with special events (e.g., ballgames, parades,
etc.).
Special operational
problems
Operational features such as high occupancy, reversible, exclusive or
contra-flow lanes and certain design features such as drawbridges,
tunnels, ferry services.
Recurrent problems
In a limited number of cases, caused by daily peak period traffic
demands exceeding freeway capacities. In some cases, limits-of-
congestion messages are displayed; in other cases, travel time
messages are displayed.
4.1.2 Operating Fundamentals of VMS
It is very important that TOC has operations policies, procedures, and guidelines in written form.
Operations policies are guiding principles that are considered to be prudent and that influence the actions
taken by the managers of TOC. Operations procedures and guidelines outline and describe day-to-day
operation of the VMSs. These documents in written form may support manager’s decisions about
displaying certain VMS messages.

18
VMS are tools used to help manage traffic on a roadway system. The TOC managers must select
determine when and how to use VMS to accomplish traffic management tasks. Determination of VMS
involves six basic considerations, and within each of these steps, several factors must be addressed:
1. Determine the purpose for using a VMS
2. Determine which VMS(s) is (are) appropriate to use
3. Determine what to display on the VMS
4. Determine how long to display the message (s)
5. Resolve any message signing conflicts that exist
6. Display and verify VMS message
4.1.3 Issues and Principles of Message Design
The VMS message design process was initially designed at the New Jersey DOT, and it begins with the
development of base VMS message using guidelines of acceptable words and message terms for incidents
or roadwork events. The base VMS message is the sum total of all the information that drivers need to
make fully informed driving decisions. In most cases base VMS message must be shortened because it
exceeds either the amount of information that drivers can read and comprehend or the space available on
VMS. The maximum length of a VMS message depends on the sight distance from which drivers can
adequately view the message and on their perception and information processing capabilities. Factors that
affect sight distance are the type of sign, the sun position, roadway geometric design, travel speed, and
environmental conditions at the VMS location. In cases where portable VMS are used, it may be
necessary to reduce the number of units of information because of the sight distance restrictions related to
vertical grades and horizontal curves. After the maximum number of units that may be displayed is
determined, guidance should be provided to shorten the base VMS message so that the maximum length
is not exceeded but the essential meaning of information is kept. Consistency of information and format
should be provided. This process should prove that drivers will be able to read and understand the
messages. The underlying objective is to keep messages as complete and concise as possible.
Message content refers to specific information displayed on VMS. The key elements are answers to the
questions about what is happening ahead and what driver should do. The content must provide
information relevant to the wants of the motorist. If an incident has occurred, the first information drivers
are interested in is location. If the incident is near, they will want to change their primary route. If the
incident is far, they might not be affected. The next important information is the level of incident impact
on the roadway network, which can be expressed in terms of lanes closed if the information about delay is
not prepared by TOC operators. At the end of the VMS message should be the “advice” such as REDUCE
SPEED, EXIT, TAKE OTHER ROUTES etc. In order for drivers to follow the advice presented on the
VMS, the message should include the reason for the given recommendation such as MAJOR INCIDENT,
ROADWORK, AVOID 20 MINUTE DELAY, etc.
Message length refers to number of words or number of characters and spacing in a VMS message.
Several factors may require the length of the message to be reduced:
Reading time is the time that the driver has to read and comprehend the message content. It is
affected by VMS legibility zone and the amount of activity in the traffic stream (reading signs,
adjusting vehicle speed, lane positioning, etc.).
Message familiarity because unfamiliar or unusual messages may increase the reading time. This
factor varies from location to location.
Driver workload refers to the fact that drivers must pay attention to more than one task while
driving, which increases the reading time.

19
Reading the VMS message requires longer time because the entire message must be read to
properly understand the meaning.
Message length should not exceed eight words (excluding prepositions), or it will result in some
drivers slowing to read the message.
The complexity of driving situation due to extremes in geometrics, heavier traffic volumes,
increased traffic conflicts, or weather conditions could increase drivers’ workload and visibility
and thus decrease the time available to read the VMS message. When reducing the length, the
message designer should take care not to lose the intent of the message. Also the philosophy “if it
fits on the VMS, the message is OK” should be avoided, because the designed message might be
longer than necessary.
Message load is the amount of the information expressed in the VMS message, usually in terms of units
of information (informational units).
Unit of information (informational unit) is the answer to a question a driver might ask. It represents each
data item that a driver could use to make a decision. Each answer is one unit of information [9.]. Unit of
information usually contains up to three words, at times up to four. The concept of informational unit is
presented in Table 4.3.
Table 4.3 Examples of the Units of Information in VMS messages
Research and experience indicate that no more than four units of information should be in a VMS
message when traffic speeds are 35 mph or more. When operating speeds are less than 35 mph, no more
than five units of information should be displayed. In addition, no more than three units of information
should be displayed on a single message phase. Normally only one unit of information appears on each
line of the VMS. However, a unit of information may be displayed on more than one line. A sign line
should not contain more than two units of information. In a case when all informational requirements are
met but VMS message exceeds the allowed length, tradeoffs must be made to determine which message
parts should be omitted.
Message format refers to the order and arrangement of the units of information on a VMS. Order of
information in the VMS message must be as expected from drivers. If the order of information is wrong,
it may cause driver confusion and increase the reading time. For the appropriate order of VMS message
parts, refer to the VMS Operations and Messaging Handbook 2004 (Tables 8-1 to 8-8).
Message design process begins with a base VMS message that is then reduced. The base VMS message is
the sum total of all the information that drivers need to make a fully informed driving decisions. It will
normally exceed the maximum amount of informational units that should be displayed, and so must
normally be reduced in length and content. Three elements should be initially included in a base VMS
message:

20
Problem
Location of problem
Recommended driver action
It is not always possible to provide information about each of these elements because some state policies
do not allow the VMS operator to post diversion messages. Instead of “Problem” and “Action,” more
useful information could be posted, taking into account sign space and sign legibility. The base VMS
message will differ depending upon whether the VMS is on the same freeway and relatively close to the
incident/roadwork, same freeway but relatively far from the incident/roadwork, or different freeway than
the incident/roadwork.
Table 4.4 Possible Base VMS Message Elements
In 2001, Dudek [9.] developed a VMS message design process that recognizes that there are variations to
the message elements that can be used effectively in a VMS message. Message display is a dynamic
process in which messages on a particular VMS can change as conditions change after an incident occurs.
VMS message designers and VMS operators should be aware of the totality of information needed by
motorists to make fully informed and rational decisions. VMS message designers and VMS operators
should be aware that if the totality of driver information needed cannot be displayed in a message, the
message length, in most cases, must be reduced. VMS message designers and VMS operators should be
aware of the amount and type of information needed by drivers that cannot be displayed.
4.1.4 Maximum Message Length and Viewing Distance
All highway signs must display a message such that the driver is able to detect the sign, read and
understand the message, and make the appropriate decision based on the information displayed. Initiating
a control response and completing the required maneuver could also be the actions included in driver’s
reactions to a VMS message. The amounts of time required for each of these actions generate the
adequate VMS reading distance. Various factors have an impact on the maximal length of a VMS
message:
Driver’s perception/reaction time
Obstructions between the driver and VMS
Available reading distance

21
Figure 4.1 Sign Detection, Reading, Decision, Response Initiation, and Response Relationship
In cases where VMS does not require that a driver initiate and complete a maneuver prior to reaching the
sign, the only elements that are relevant for maximum message length analysis are detection distance,
reading and decision distance, and out-of-view distance. Distances traveled during each of these three
components are mainly governed by the speed of the vehicle. Important definitions for this analysis are as
follows:
The minimum required visibility distance refers to a distance that a driver needs to detect the
VMS.
The minimum required legibility distance refers to a distance from a VMS where a driver needs
to begin reading a VMS.
Figure 4.2 VMS Detection, Reading, Decision, and Out-of-Vision Relationships

22
For permanently mounted overhead VMSs, these relationships are the same, except for the fact that the
angle is vertical rather than horizontal. The factor that dictates the available reading time for drivers is
the minimum required legibility distance, taking the obstructions between the drivers and VMS into
consideration. The higher the vehicle speed, the minimum legibility distance required is greater.
Figure 4.3 Required Message Viewing Distance for VMS mounted over the Travel Lanes
For VMSs positioned off to the side of the roadway additional sight distance is required to read the
message. The greater the lateral offset between the driver and the center of the VMS is the greater the
additional sight distance is needed.
Figure 4.4 Additional sight distance required for lateral VMS offset

23
VMS legibility distance is the maximum distance at which drivers can first correctly identify letters and
words of a VMS message. However, the maximal legibility distance is not always available, and that
decreases the available reading time and requires shorter VMS messages. The maximal legibility distance
is often reduced due to the following:
Lightning conditions
Position of the sun
Rain and fog
Vertical alignment
Horizontal alignment
Sight obstructions
Trucks in the traffic stream
VMS legibility depends on design characteristics of the sign: type of display technology, height and width
of the characters, the stroke width of the characters, and the type of font displayed. Smaller characters
yield shorter distances. Legibility distances proposed for use in VMS message design presented in Table
10 include standard font (all uppercase), 18-inch character heights, 13-inch (approximate) character
widths, and about 2.5-inch stroke (pixel) widths. Character heights on VMSs used on freeways and other
high-speed highways should not be less than 18 inches (4).
Table 4.5 Suggested VMS legibility distances for use in message design (ft)
Table 4.6 Maximum number of units of information in VMS message (base maximum message length)
The presence of vertical curves usually affects portable VMSs positioned on the shoulder of the roadway.
When actual operating speeds that are higher than the design speed of a vertical curve (non-freeway
applications) can sometimes result in less reading time for the VMS message. In the case of vertical curve
design speeds 45 mph and above, no reductions of unit information is required for LED VMSs. Vertical
curve design speeds lower than 45 mph require the reduction of number of information units to account
for lower legibility. For the required reduction of the number of units of information in the VMS message
due to vertical curve refer to the VMS Operations and Messaging Handbook (2004).

24
If a permanent VMS is properly located, horizontal curvature will not impact the viewing distance and
unit information reductions will not be necessary. The reductions are deployed in cases when portable
LED VMSs are used. For the required reduction of the number of units of information in the VMS
message due to horizontal curve, refer to the VMS Operations and Messaging Handbook (2004).
Rain and fog deteriorate the amount of light that is coming from the VMS and thus reduce the contrast
between the sign legend and its background, decreasing drivers’ capability to read the message properly.
The percentage of trucks in the traffic stream also impacts the visibility of VMS messages. As the
percentage of trucks increases, and the design speed decreases, the percentage of drivers able to fully read
a VMS message decreases. For the percentage of drivers able to fully read a VMS message with
maximum base number of units of information, and for different types of highways, refer to the VMS
Operations and Messaging Handbook 2004 (Tables 7-14 to 7-17).
4.1.5 Long Messages and Priority Reduction Principles
It is usually necessary to reduce the base VMS message because it is too long to be displayed in its
primary form. Message length can be reduced by omitting unimportant word or phrases and using
abbreviations. Approaches used are as follows:
1. Initial Reduction Approach
a. Omitting unimportant words/phrases
b. Omitting evident or redundant information
c. Combining base VMS message elements
2. Secondary Reduction Approach
a. Reducing the number of destinations in the “Audience for Action” message element
3. Priority Reduction Principles: Information units are eliminated starting with the lowest priority
In the case of splitting the message and displaying it on a VMS in sequences, the following principles
should be deployed:
No more than two phases should be used.
Each phase must be understood.
Compatible units of information should be displayed on the same phase.
A message line should not contain portions of two different units of information.
No more than three units of information should be displayed on a single phase at high freeway
speeds.
Table 4.7 Information priority order for incidents

25
Table 4.8 Information priority order for roadwork
After the message reduction approaches and requirements have been applied to the base VMS message
and the message still has more units of information than should be displayed to drivers at the prevailing
freeway speed, then the priority reduction principles discussed in this section should be applied. There is a
priority of information that motorists need in order to make driving decisions when incidents occur or
lanes are closed due to roadwork. The information needed by motorists in order of priority for incidents
and roadwork is shown in Tables 4.7 and 4.8. Although the incident descriptor and the roadwork
descriptor are useful to motorists, these message elements can be replaced with the lanes closed message
element. When the number of information units exceeds the maximum that should be displayed under
prevailing speeds and the initial reduction approaches and the secondary reduction approach have been
applied, then the message designer must begin eliminating informational units. This is done by
eliminating units of information starting with the lowest priority (4).
4.1.6 Dynamic Features on VMSs
Dynamic features on VMS messages are either flashing words or phrases of the message or parts of a split
message in sequences. Messages with flashing words or phrases are displayed to attract the attention of
drivers and emphasize the importance of the message. The effect that flashing has on drivers while
traveling on a freeway is not fully known. The results of a single-task study shows that in a laboratory
setting, flashing one-phrase, three-line messages increase the average reading time while not significantly
affecting message comprehension. In contrast, for the driving simulator studies, the results indicate that
unfamiliar drivers would have difficulty in understanding all parts of the entire message when it is
flashed, while no differences were found between the flashing and static messages. Further research
should be conducted to resolve this disagreement. Flashing one-line of three-phase messages significantly
increase average reading time during both the laboratory and the driving simulator studies, while
comprehension levels are lower. This implies that VMS messages should not be displayed with single
flashing lines. Some VMSs operate as they have a two-phase message, but with information on two lines
constant and redundant between two phrases. The results of the studies conducted in this area strongly
imply that alternating line messages should not be displayed due to the increase of reading time and split
subject preferences.

26
Figure 4.5 Two alternatives of a two-phase VMS message
4.2 The 511 Service
Operational 511 service is a part of a larger traveler information system (ATIS) that provides information
to travelers via multiple media – web sites, television stations, and other technologies. To achieve useful
and comprehensive 511 service, deployers need to be concerned with data acquisition, data quality, and
system integration. It must be recognized that 511 is a service, and that it operates in an overall business
environment created by the travel information market and the lead coordinating, or facilitating, agency.
Information content for 511 service can be broken into two main types: basic and optional. Basic content
comes in three general categories:
1. Roadway (Highway and Arterials) – Information associated with particular roadways in a 511
service area
2. Transit or Public Transportation – Information associated with transit services (bus, rail, etc. ) in a
511 service area
3. Weather – Information associated with observed and forecasted weather and road surface
conditions that may impact travel in the 511 service area
In each of these content categories, the guidelines provide general principles or philosophies and specific
guidelines on the type of information that should be provided to callers. The key concept in 511 service
planning is that 511 systems must be designed to provide information beyond a single agency, mode, or
content type. While content is organized in different types and categories, one principal carries throughout
all content: provide sufficient “context” for an unfamiliar user of the service.
4.2.1 Roadway Content (Highways and Arterials)
As the primary means of travel in the United States, roadways (highways and arterials) and information
about major roadways should be a principal part of 511 system. The core of many existing telephone-
based traveler information services is highway conditions reporting. As these systems migrate to 511
access and new systems are established, the following guidance should be considered.
While not applicable in all areas, regional overviews can provide the caller with general high-level
information about a region, helping to determine if the caller should seek additional detailed information
by going to the routes/corridor and continuing through the content. Regional overviews, summaries, or

27
floodgate messages allow users to get important information quickly, (i.e., incidents or service disruptions
that may impact one’s trip) without going through the menu system. Upon hearing the overview, the
caller would be able to select the specific route or segment to obtain detailed information. Thresholds for
determining what content is placed in a regional overview should be determined regionally.
Content should be route/corridor based, and 511 service should provide information that is retrievable by
route number and/or name. In certain circumstances, if one or more roads run parallel, it may be
acceptable to provide information on a corridor basis. However, providing information on major
roadways on a broad geographic basis (e.g., “roads in the northwest portion of the state will be…”) is not
recommended. When a route/corridor is operated by multiple agencies, these agencies should work
together to provide an integrated description of conditions.
Limited access roadways and the National Highway System (NHS) should be covered by the basic 511
highway/roadway – related content – with 40% of the nation’s travel, including 75% of truck traffic and
90% of tourist traffic, the 160,000 mile National Highway System should be the focus of the basic 511
content. Limited access roadways that are not part of the NHS, likely to exist in urban areas, should also
be part of the basic content.
Segment specification is left to the implementer, but should follow logic with segments defined between
major towns, landmarks, roadways, or by weather differences. In urban areas, segments should be defined
between major interchanges and will generally be smaller in length than non-urban segments. Once the
511 service knows the specific section of highway that the caller is interested in, it then provides the
caller with a report of the relevant basic content. In non-urban areas, long routes should be sub-divided
into segments.
Urban areas need more details given the increased traffic volumes and congestion levels, and the fact that
even minor events could have large impacts to travel. Thus, greater content detail is recommended in
urban areas. Whether the information provided to the caller is a human recorder message or synthesized
or digitalized speech, this information should be stored and automatically provided to callers. There need
not be any direct contact between callers and human operators to provide basic highway content. For each
segment, specific types of content should be provided including the following:
Construction/maintenance project
Road closures and major delays
Major special events
Weather and road surface conditions
For each of these highway content types, it is necessary to provide details that enable callers to assess
travel conditions and make travel decisions associated with a route segment:
Location
Direction of travel
General description and impact
Days/hours and duration
Travel time or delay
Detours/restrictions/routing advice
Forecasted weather and road surface conditions
Current observed weather and road surface conditions

28
The fundamental structure of telephone system design matches highways very well. Telephone systems
are usually accessed through a “menu tree” that is navigated by voice commands or by touching a phone’s
keypad. Eventually, callers reach their desired destination in the system and either get a recorded or
digitalized voice message. When seeking highway information, callers will first find the specific highway
or corridor for which they desire information, unless a regional overview is available and selected. Callers
will then find the specific segment of highway or corridor that they are interested in, especially if it is a
lengthy road.
The fundamental structure of a 511 telephone system design matches public transportation operations.
Telephone systems are usually accessed through a “menu tree” that is navigated by voice commands or by
touching a phone’s keypad. Eventually, callers reach their desired destination in the system and get either
a recorded or digitalized voice message or possibly a live operator. In complex or large areas, the 511
service area may be segmented in sub-areas to simplify agency identification. Sub-areas may be dealt
with by using voice recognition as described in San Francisco above.
Some content topics have been demonstrated to provide value to callers, but are recognized as difficult to
uniformly implement. As services improve and evolve toward the long-range vision, these items should
be incorporated into the service if not done so at the outset. Particularly in urban areas, estimated travel
times across a route segment have proven highly desirable by callers. Travel times could be provided in
absolute terms (“segment travel time is 24 minutes”) or in terms of delay from normal conditions
(“segment travel time is delayed five minutes”). In the case of absolute travel times, it is recommended
that travel times given do not exceed the speed limit travel time. In urban areas, multi-segment or corridor
travel times are also acceptable.
Observed or measured weather information may, when combined and processed with other road and
weather data, form the basis in predicting and providing callers with segment or route specific weather-
related travel conditions.
4.2.2 Transit Content
In many cases, public transportation operators already have established methods of communicating to the
public about their services, including websites and customer service centers accessible by telephone. If
properly utilized and coordinated with these existing communications methods, 511 can assist public
transportation operators in serving their customers better and even attracting new customers. Public
transportation operators could take many different approaches to implement their portion of 511 services.
Information about all transit agencies in the area should be available. Often, one or two dominant public
transportation agencies exist in the area, but many more exist that collectively provide a region’s public
transportation system. All these operators should be accessible via 511. In complex or large geographic
areas, it may be necessary to subdivide areas before identifying specific agencies. The San Francisco Bay
area does not use sub-regions, which is one of the benefits of having a voice recognition system. The
system asks callers to say the name of the transit agency they want, and if the caller does not know, then
the system asks the caller to say the name of the city or county into which they are traveling. The 511
system returns with the agencies serving the city/county. If the caller still does not know which agency to
say, the system takes the caller to the menu of the predominant local transit agency for the selected city or
county.
The 511 service works in conjunction with transit customer service centers, and it is not intended to
replace operators, but to provide compatible and supplemental information, usually in the form of
recorded scripts. Further, the vision is that the callers would have direct access to customer service via
511, and how this occurs is an agency decision.

29
Experience shows that access to 511 can increase the number of callers seeking public transportation
information. If 511 were merely designed as a shorter number to access the service center, this could
significantly increase the number of calls to the customer service center. However, 511 systems can and
should be designed to provide automated messages that will answer many callers’ questions prior to
seeking assistance from customer service center operators. Ideally, thoughtful design will reduce the
number of calls fielded by operators and allow them to handle only the calls that require their expertise,
and increase the total number of calls successfully managed. The 511 service must work in concert with
the existing transit information call centers for it to be useful to the operating agencies.
To ensure information quality and agency autonomy, any information provided via 511 for particular
public transportation operator must be provided or quality-checked by that operator.
For each public transportation agency, the 511 system should have at least a single automated report that
provides the following:
A brief description of the agency’s operations
Major service disruptions, changes, or additions
Where appropriate, an option to be transferred to the agency’s customer service center
Other “broadcast” information at discretion of agency
Agencies may add more “layers” to reports at their option
Weather or road surface conditions that could impact travel along the route segment
In addition, in the case of large or complex 511 service areas, the service area can be subdivided for
navigating and providing transit reports. Each agency in the service area should be accessible.
4.2.3 Weather Content
Weather information is a basic component of 511 information provision, and it is recommended that
deployers provide travelers with whatever weather information is available that may affect travel. This
includes weather information provided by the National Weather Service and private sector weather
forecasts, as well as roadway weather or surface conditions, both observations and forecasts, which can be
provided by mobile and stationary sensor data information gathered by maintenance and operations
personnel. The basic principle for providing weather information is simple: if weather will impact
people’s trips, then they should be alerted to that actuality or possibility. It is recommended that deployers
provide the most appropriate transportation information in the shortest amount of time.
Travelers need prioritized hazard information for the impacts of both current and changing weather
conditions, and if there is weather forecasted along the route that will impact the travel. These reports
should be segmented by route or trip where appropriate. This also includes the weather impact on transit
operations – on guideways, railways, pathways – and related passenger information such as wind chill
effects on those waiting at bus stops.
Weather information on a 511 system can range from a regional alert (hurricane, winter storm, etc.) to a
route specific observation or alert (low visibility, icy pavement, high winds, etc.). Deployers should
include any available weather-related information that could impact a person’s travel and attempt to
package and deliver the information in a consistent manner. The two keys to weather are relaying and
providing navigational references to aid the traveler.

30
When weather conditions are the cause of accidents, incidents, and delays, it is recommended that this be
noted on 511. For example, there is a ten-minute delay at the bridge crossing due to high winds. This is at
the heart of weather information provided on 511. In other words, it is not direct weather that is important
to 511, it is the related impact that is important. This is why future generations of 511 will include
weather in the context of travel rather than simply providing the “data.”
Weather information should be presented with a navigation reference, such as road segment, cities/towns,
milepost, exits, major intersection/interchange to major intersection/interchange, landmarks, and rest
areas.
Recommendations for implementation of 511 weather information are detailed below:
Format for Depicting Road Conditions – The society of Automotive Engineers (SAE) ATIS
standard/message sets are appropriate for sharing and presenting weather information on 511. The
ATIS and Traffic Management Data Dictionary (TMDD) – standards for center to center
communication – committees coordinate message set structures and coding to ensure
commonnality. Many of the elements come from National Transportation Communications for
ITS Protocol (NTCIP), Environmental Sensor Stations (ESS), or from TMDD when they do not
come directly from the ATIS standard. Still to be worked on as of this document’s publication
date by the SAE ATIS standards team are more “FORECAST” type messages to deal with
predicted weather conditions.
Observed vs. Forecasted – 511 users want to get more timely, accurate, and relevant (e.g.,
location or route specific) forecasted information than they might on the nightly news or radio.
There is a need for route specific weather forecasts, and the operational weather community is
working on providing this data. It is recommended that a 511 deployer include weather conditions
and forecasts likely to impact the ability to travel. One way to accomplish this is through
“Nowcasting,” a zero to three-hour statement of what is happening and the changing conditions
that are important to travelers.
Short, Live Update Frequently – It is recommended that weather condition information on 511 be
updated frequently so that the information presented is the best available at the time. Weather
forecasts and current conditions are available through a variety of means (RWS, radar, etc.) and
in a number of time frames. Weather conditions may be slow, moderate, or fast changing and a
511 deployer needs to convey the impact of these changes to travelers. Thus, 511 deployers must
be cognizant of the time frame in which weather conditions and forecasts may be ascertained and
the resultant impact on travelers.
Road Surface Conditions – Road conditions can change swiftly. Atmospheric and pavement
sensor data can provide indications of conditions affecting traffic flow and roadway safety (e.g.,
low visibility, slippery pavement). Environmental sensor station (ESS0 data are typically
collected by road weather information systems (RWIS) deployed by maintenance managers.
These managers can supplement observed data from ESS with information on maintenance
operations to provide data on actual surface conditions. Route-specific road condition data are
currently provided, through traveler information websites, by 39 state agencies. Deployers of 511
systems should coordinate with state and local agencies to access existing data from advanced
road condition reporting systems.
Metropolitan Rural Differences – In non-urban areas, it is important to provide weather
information on road segments before logical decisions point along a route. If there is snow in the
pass and chains are sequined, this needs to be conveyed to travelers well in advance so that they
may put on chains, use an alternate route or delay passage. In urban areas, segments are more
proximate to other areas and there is more information available on many segments that are
relatively close to one another.

31
4.2.4 Optional Content
The 511 service can provide additional content beyond the basic content described in the previous section.
As long as quality basic content is provided, providing optional concept will benefit callers. Based on
local demographics or geography, some of these optional content categories would be expected by local
callers. Implementers should factor these expectations into their service planning process. In providing
additional content implementers have essentially two choices:
Providing a richer set of basic services, for instance, more highway routes added to the basic
system, more detailed content on public transit services, improved accuracy, timeliness or
availability of information, improving quality instead of quantity.
Providing additional categories included in 511 services that are not part of the basic content
package, for instance, tourist information, special events, parking, local information/points of
interest, interregional information, driving directions, public transportation trip itinerary planning,
multimodal routing and trip planning, incident reporting, carpools and vanpools, reservations and
purchases, personalized services, customer feedback, and caller reports.
4.2.5 Content Quality and Consistency Issues
The accuracy, timeliness, and reliability of information on 511 is an important issue for the 511
community and users as well. In an increasingly advanced information society, callers are generally
accustomed to high quality information. 511 content must be no different. In 2001, ITS America, in its
national consumer research on 511, determined that “those surveyed said that if they used 511 and found
the information to be inaccurate in their first few uses, they would be unlikely to give the service another
chance.” Therefore, 511 implementers must focus on the following five quality parameters:
Accuracy – Reports are recommended to contain information that matches actual conditions.
Timeliness – Closely related to accuracy, information provided by 511 is recommended to be
timely to the greatest extent possible in accordance with the speed of changing conditions.
Reliability – Often, transportation management systems are staffed during normal working hours,
but travelers use highways 24 hours a day, seven days a week. In fact, often the most challenging
travel conditions are at nighttime and on weekends. Methods must be developed to provide
callers with a reliable stream of information 24/7.
Consistency of Presentation – It is recommended that reports use the same, or similar,
terminology to describe conditions. Lack of consistent terminology leads to misunderstanding and
confusion among callers, and consistent terminology will make the system more usable as users
move from system to system. The use of existing and evolving standards for messages, such as
the TMDD and SAE J2354, enable this consistency.
Relevancy – The information that is provided needs to be relevant to the callers given their
locations, modal choices and/or actions they may need to take as a consequence of weather and
road conditions or service disruptions.
The quality of basic content will largely determine the success of 511. This is why the information is
recommended to be tailored to the travelers’ needs along their routes. It is recommended that 511 services
give callers the ability to gauge the quality of the reported information to enable them to properly weigh
the information in their decision-making. However, no specific quality parameters are in the existing 511
service implementation guidelines, mainly because of the experience and user feedback and objective
analysis/requirements that are needed prior to determining optimal quality parameters, and because the
focus on information quality should lead to quality services.

32
While the concept of dialing an easy to remember telephone number and providing quality information to
the traveling public is easy to grasp, the complexities of the systems behind the service, or the total lack
of relevant technologies to assist in providing the service, could present a problem in building the entire
511 system. The deployment of roadside detectors, wireless communication devices, and other systems is
key to the development of a nationwide 511 service. In fact, many states are presenting 511 as the “face
of ITS” to elected officials and the public and are using 511 as a way to increase the coverage area of
detection and systems. The more detection and base-level of technological investment there is, the better
the 511 service, and more consistent the level of information provided, can be. If every state or region has
a similar level of detection and integrated networks for collection, then the products could also be similar.
4.2.6 Emergency Alert Messages
Broadcast or floodgate messages can be a critical tool for disseminating information to the traveling
public during a major incident, be it weather, event, or security-related. Broadcast messages can be
implemented in various ways, but the two basic types are uninterruptible and interruptible – meaning a
caller can override or terminate the message.
In times of emergencies, uninterruptible broadcast messages can deliver a brief, important message at/or
after the greeting of a 511 service and terminate the call, thus creating a 511 system that has short call
durations and disseminates the most critical information to callers and nothing else. This will alleviate
some of the peak capacity issues that deployers are experiencing. The uninterruptible message relating to
a lesser service disruption with a large impact requires callers to hear the whole message before they may
continue to additional selectable information. Other forms of the message type are broadcast by service,
mode of geographic area. Interruptible messages can be placed in the same areas of the system, but are
typically used for less important information.
Virginia DOT found that 511 is a welcome asset during incident and traffic management situations. The
511 service is being used in conjunction with permanent and portable VMSs to relay critical information
to travelers during major incidents, typically hazardous material spills that can close an interstate.
Because VMSs are limited to three lines of text on three panels, multiple detour listings and descriptions
of complex situations are generally not possible. The VMSs convey the necessary information as they
normally would in these situations, but they also prompt travelers to dial 511 for additional information.
In one situation, VDOT used VMS up to 100 miles from an incident to alert drivers to dial 511 where
they received information about up to three detours depending on their desired destinations. VDOT has
documented that by using the VMS and 511 together, call volumes to the service double almost
immediately.
The AMBER Alert is a child abduction response system that uses radio, television, VMSs, and
emergency broadcast systems to disseminate information about kidnapping suspects and victims soon
after the crime is committed. The system is designed to solicit aid from the public to look for victims by
providing known details such as descriptions of vehicles and individuals. In recent months, 511 services
have become an additional tool for disseminating AMBER Alert information quickly and completely. In
fact, many states have realized a significant increase in unsafe driving from the amount of information
displayed on the message boards, which seems to be supported by University of Minnesota research that
recommended changes to the Minnesota AMBER Alert messages on its VMSs, including referring
drivers to other information sources to retrieve more detailed information. As a solution, Utah DOT is
using less detailed AMBER Alert messages on its VMSs and prompting drivers to dial 511 where they
can receive accurate information about the solution. This process was recognized by the AMBER Alert
representatives in Utah with the designation of the 511 system as a “certified” source of AMBER Alert
information.
33
4.3 Highway Advisory Radio
Highway advisory radio (HAR) is another type of traveler information system. Highway users receive the
information through the radio receivers in their vehicles. The instruction to tune the vehicle radio to a
specific frequency in order to hear the relevant information is displayed via roadside or overhead signs.
Both live and prerecorded messages are broadcast.
The most important advantage of HAR is that it can reach more travelers than VMS because it
communicates not only with the drivers at a particular point, but in the entire broadcast area. Another
advantage of HAR over VMS is that HAR can deliver a greater amount of information.
The disadvantages of HAR are restriction to low power, often poor signal quality due to the impact of
outside factors such as weather, and the requirement that a driver takes an action. All these disadvantages
may often discourage drivers to use HAR.
Typically, HAR has been implemented using 10-watt AM transmitters, and this technology has proven to
be effective. The application of digital HAR field systems eliminated many limitations of traditional dial-
up systems, and improved quality of messages broadcast to the travelers. Digital systems offer increased
speed of message updating, centralized management of multiple stations, enhanced reliability, superior
radio quality, ease of operation, and automated event logging.
HAR messages can be broadcast in point or wide-area coverage. In a point broadcast, a single transmitter
is used to broadcast to a given area. This type of coverage is applicable at diversion points in areas of
recurring congestion to notify motorists of queues and congestion. Wide-area broadcast transmits a signal
to a larger coverage area using multiple synchronized transmitters. It is used when a single message is
applicable to a large coverage area and the coverage area is sufficiently large for a driver to hear the
longer message. Synchronization is difficult to accomplish technically, and studies have proven that
drivers prefer brief, specific messages.
In areas where the coverage is limited, the application of portable and mobile HAR systems is possible.
These systems can be implemented in route guidance strategies at the decision points before the alternate
routes to increase drivers’ confidence in alternate route instructions.
HAR messages can be disseminated through centralized or distributed recording, storage, and playback.
The centralized alternative considers transmission lines for audio connectivity and time synchronization
with selected transmitters, while messages are created and stored at a central operations center. This type
of architecture is subject to single point failures at the central operations center. The second alternative is
distributed recording, storage, and playback where all system functionality is remote to the field HAR
station. A distributed storage system is inherently more robust and less vulnerable to single point failures
than a centralized system.
The signage indicating HAR frequency is typically installed throughout each zone. These signs usually
include flashing beacons that are activated only when a message of some predetermined level of
importance is being broadcast. The system is continuously broadcasting “default” messages during non-
congestion periods, and alerting drivers to an emergency message by turning on the flashing beacons.
This prevents the drivers from hearing the same message more times than needed, which could negatively
impact system credibility. VMS messages could also be used to alert drivers to the broadcast of HAR
message.

34
One way to overcome the need for HAR signing and manual tuning to the HAR frequency is to use
automatic highway advisory radio (AHAR). The AHAR transmitter sends out a leading message, which is
picked up by a special in-vehicle receiver when the vehicle enters the AHAR zone. The message
automatically tunes the radio to the AHAR station and mutes any regular radio broadcast until the AHAR
transmission is complete. A form of AHAR has been implemented in Europe via the “Radio Data System
[RDS] Traffic Management Channel [TMC].” This system relies on a silent data channel broadcast via
FM from existing radio stations.
Urban areas typically present a unique set of challenges to HAR application. Tall buildings present an
obstacle to uniform transmission since the FCC restricts antenna height to approximately 50 feet. High-
power electric lines can incur on the transmission and negatively impact broadcast quality. Messages are
broadcast in the field from transmitters that play stored messages. These messages are transmitted to the
field from a central location, which can be a traffic control center or any telephone. In its simplest form,
no central system is needed, only an analog phone line to the transmitter so an operator can record a
message in the transmitter for broadcast. This is labor intensive if an agency maintains a number of
transmitters and traffic conditions change throughout the day. Its advantage is that it is inexpensive, and
messages can be sent to a transmitter from anywhere a phone exists, even from a cell phone.
Alternatively, a central message distribution system is used to record new messages, store pre-recorded
messages, and distribute messages to the transmitters (simultaneous if necessary). This is typically a PC-
based system with security access control.
4.4 Ramp Metering
The primary goal of ramp control and management is to connect functionally different roadways in a
manner that will decrease traffic delay for the users. Close spacing, short acceleration distances, and
constantly increasing congestion are some of the most serious problems in ramp design. From the aspect
of incident management, the role of ramps is important simply because they are directly connected to two
facilities, and the consequences of an incident in the ramps’ area can cause greater delays comparing to
other roadway segments. Typical ramp management strategies are ramp metering, ramp closure, special
ramp treatments, and ramp terminal treatments [4.]. Many freeway activities are related to or dependent
upon ramp management. This section is focused on ramp metering as an element of traffic incident
management.
Ramp metering is the use of traffic signals deployed on a ramp to control the rate at which vehicles enter
a freeway, thus making the traffic flow on the freeway more consistent, and allowing more efficient use
of existing freeway capacity. Several ramp metering aspects must be considered before making decisions
about the implementation of ramp meters:
Metering Strategy – The control decision made that best addresses the specific goals and
objectives of the metering system.
Geographic Extent – The area that will be covered by ramp metering and whether the ramp
meters in that area will be operated in an isolated manner or as part of a larger system of meters.
Metering Approaches – Local or system-wide and pre-timed or traffic responsive.
Metering Algorithms – The specific logic and calculations used to select or determine a metering
rate.
Queue Management – How the metering rate will be affected by ramp queues and how the
agency will keep queues at a manageable and acceptable level.
Flow Control – How traffic will be released from the meter, one at a time or two at a time in one
lane or multiple lanes.
Signing – How drivers will know that a ramp meter is on or off.

35
Ramp metering strategies have been the subject of several research studies both in the United States and
in Europe. One of the first applications of mathematical programming to the problem of on-ramp control
was by Wattleworth in 1965. This early formulation was based on a static model of traffic behavior,
whereby the flows at any cross-section in the system could be expressed as the sum of the flows entering
the freeway upstream of that location, scaled by a known proportion of vehicles that did not exit at any
upstream off-ramp. This density-less model allowed the formulation of a linear program, since it avoided
the important non-linearity in freeway traffic behavior – the relationship between flow and density also
known as the fundamental diagram.
Many later contributions have built upon the original formulation by Wattleworth. Yan and Kreer
proposed a quadratic cost to replace Wattleworth’s liner maximization of on-ramp flows, in order to
achieve a more equitable distribution of the control effort. Chen suggested the use of Total Travel
Distance as the objective. Wang and May discussed several more enhancements, and extended the model
to consider the effect of voluntary diversion to surface streets. Later authors furthered extended the model
to capture the entire corridor, which comprises both the freeway and an alternative parallel route that
allows drivers some flexibility in their choice of freeway access points. Payne and Thompson considered
“Wardrop’s first principle” as dictating the selection of routes by drivers, coupled with an on-ramp
control formulation similar to Wattleworth’s, and solved it with suboptimal dynamic programming
algorithm. Iida posed a similar problem and employed a heuristic numerical method consisting of iterated
solutions of two linear programs.
Another more recent enhancement has been the consideration of dynamic models. Most problem
formulations using dynamic models have reverted to the simpler situation, where the effect of on-ramp
control on access point selection is not considered. In these cases, the numerical method used to solve the
resulting nonlinear optimization problem is gradient-based, and therefore provides only local solutions.
The ramp metering strategy extensively used by Caltrans is percent occupancy metering. This scheme
utilizes occupancy measurements taken upstream of the on-ramp, in order to set the metering rate.
Another strategy, Alinea, tested in Paris for the first time, tends to sustain near maximum flow
downstream of the on-ramp by regulating the downstream occupancy to a target value set a little below
the critical occupancy at which congestion first appears. The Alinea control strategy uses an integral of
occupancy error between the set point occupancy and the actual downstream occupancy to compute the
desired ramp metering rate. In the case where highways do not have loop detectors downstream of the
ramps, Alinea can be adjusted to use the upstream detector – which as the simulation results have shown
is preferred during congestion.
Based on the simulation and testing of these two ramp metering strategies, University of California
Berkeley developed a new technique for generating optimal coordinated ramp meter plans. The design of
this new and predictive coordinated strategy is based on avoiding the loss of travel time related to off-
ramp blockage using the asymmetric cell transmission model. This solution requires only going through a
single linear program to find the metering rates. After testing this technique in Pasadena, California, travel
time savings of 8.4% were predicted. This research has shown that minimizing total travel time is
equivalent to maximizing a weighted sum of flows. The advantage of this technique over many other
predictive on-ramp metering designs is that it requires only solving a single linear program, which can be
done with extreme efficiency using any modern LP solver. This solution takes on-ramp storage
constraints into account.
Finally, the optimal solution is near global if slowly varying on-ramp flows are imposed, with respect to a
cost function that is quantitatively similar to total travel time. This technique is envisioned as part of a
larger and more robust traffic-responsive control structure on the complete freeway network. Perhaps the
most important conclusion coming from the existing literature for other researchers is the efficiency of
microsimulation tools such as VISSIM for different ramp metering strategies evaluation [61.].

36
Ramp metering reduces stop-and-go driving behavior, resulting in fewer rear-end collisions. Ramp meters
also break up platoons entering a freeway, resulting in fewer side-swipe and merge-related collisions.
During periods of severe weather, ramps may be closed to prevent motorists from accessing freeways that
are impassable. Ramp-arterial treatments, such as signal timing improvements, may also improve safety
by containing vehicle queues to the ramp, preventing queues from spilling back onto the freeway or
adjacent arterial.

37
5. CONCLUSIONS
TIM programs address issues that are of vital concern: congestion and travel delay, public health and
safety, energy savings, public safety resources, and responders’ safety. Decision makers in most TOCs
still do not have TIM procedures determined, usually because the cost-benefits of TIM investments are
unknown.
Traffic incidents account for about one quarter of all congestion on U.S. roadways. For every minute that
a freeway lane is blocked during a peak travel period, four minutes of travel delay results after the
incident is cleared [16.]. Reduced incident-related travel delay is a key benefit of TIM programs. By
reducing travel delay, fuel consumption, emissions, and secondary incidents, TIM programs benefit both
the national and regional economy. TIM also decreases costs for highway users and makes the roads safer
for them.
The future goals of TOCs should be to expand TIM programs to coordinated networks of freeways and
arterials, in order to decrease travelers’ delay even more. Using traveler information technologies to
reroute drivers from a freeway incident decreases costs on their original route but also tends to increase
delay on the arterial network. This brings out the question about the optimal number of drivers we need to
reroute. VMS will have the greatest role in this matter, after the human factors are investigated and
drivers’ reaction and response to VMS messages are considered. This is still entirely new area of research,
and some of the studies dealing with the problem of human response to VMSs were performed 30-40
years ago.
From the standpoint of performance measures of the current TIM programs, it is undeniable that all time
periods relevant for an incident – detection, response, clearance, and recovery – are optimized by
implementation of different TIM tools and strategies, and thus lead to time and cost savings for both users
and stakeholders.

38

39
6. REFERENCES 1. Neudorff, L., J. Randall, Freeway Management and Operations Handbook, Report FHWA-OP-04-
003, U.S. Department of Transportation, FHWA, September 2003
2. Urbanik, T., D. Hunphreys, Coordinated Freeway and Arterial Operations Handbook, Report
FHWA-HRT-06-095, U.S. Department of Transportation, FHWA, May 2006
3. Advanced Transportation Management Technologies, Report FHWA-SA-98-003, FHWA, U.S.
Department of Transportation, 1998
4. Manual on Uniform Traffic Control Devices, FHWA, U.S. Department of Transportation, 2009
5. Koonce, P., Signal Timing Manual, Report FHWA-HOP-08-024, U.S. Department of Transportation,
FHWA, June 2008
6. Seymor, E.J., J.D. Carve, Handbook for Developing a TMC Operations Manual, Report FHWA-
HOP-06-015, U.S. Department of Transportation, FHWA, November 2005
7. TMC Operations Manual, Institute of Transportation Engineers, 2001
8. Jacobson, L., J. Stribiak, Ramp Management and Control Handbook, Report FHWA-HOP-06-001,
U.S. Department of Transportation, FHWA, January 2006
9. Dudek, C.L., Changeable Message Sign Operation and Messaging Handbook, Report FHWA-OP-03-
070, U.S. Department of Transportation, FHWA, August 2004
10. Owens, N., A. Armstrong, P. Sullivan, Traffic Incident Management Handbook, Report FHWA-
HOP-10-013, FHWA, U.S. Department of Transportation, January 2010
11. Traffic Incident Management Handbook, FHWA, U.S. Department of Transportation, November
2000
12. Shaw, T., Performance Measures of Operational Effectiveness for Highway Segments, Transportation
Research Board of the National Academies, National Cooperative Highway Research Program,
Synthesis 311, March 2003
13. Carson, J., Best Practices in Traffic Incident Management, Report FHWA-HOP-1—050, FHWA,
U.S. Department of Transportation, September 2010
14. ITS for Traffic Incident Management, Report FHWA-JPO-07-001, U.S. Department of
Transportation, FHWA, January 2007
15. National Traffic Incident Management Coalition, www.TIMcoalition.org
16. Benefits of Traffic Incident Management, National Traffic Incident Management Coalition,
www.TIMcoalition.org
17. Traffic Incident Management Systems, FEMA, FHWA, U.S. Department of Transportation, April
2008

40
18. Traffic Incident Management Recommended Operational Guidelines, Minnesota Department of
Transportation, March 2002
19. Regional Traffic Incident Management Programs – Implementation Guide, FHWA, TMC Pooled
Fund Study, http://tmcpfs.ops.fhwa.dot.gov/index.cfm, May 2001
20. Strategic Highway Research – Saving Lives, Reducing Congestion, Improving Quality of Life, Special
Report 260, Transportation Research Board of the National Academies, 2001
21. Lopez, J.J., Development of a Freeway Incident Rating System, The University of Texas at Arlington,
August 2008
22. Pearce, V., S. Subramaniam, ITS Field Operational Test Cross-Cutting Study Incident Management:
Detection, Verification, and Traffic Management, Report FHWA-RD-JPO-034, U. S. Department of
Transportation, FHWA, September 1998
23. Lerner, N., J. Singer, Driver Use of En Route Real-Time Travel Time Information – Final Report,
FHWA, July 2009
24. Metropolitan TMC Case Study – Georgia Navigator, FHWA, TMC Pooled Fund Study,
http://tmcpfs.ops.fhwa.dot.gov/index.cfm, October 1999
25. Penttinen, M., E. Aittoniemi, Calling for Integrated Traffic Information – Case 511, Technical
Research Centre of Finland, California Department of Transportation
26. Transit, Call Centers, and 511: A Guide for Decision Makers, Report 134, Transportation Research
Board of the National Academies, Federal Transit Administration, Transit Cooperative Research
Program, 2009
27. CTC & Associates LLC, Winter Road Condition Reporting for the Public, Bureau of Highway
Operations, Division of Transportation Infrastructure Development, Wisconsin DOT, October 2002
28. Cambridge Systematics, Weather-Responsive Traffic Management – Concept of Operations, U.S.
Department of Transportation, FHWA, January 2003
29. Swan, N., S. Baker, 511 Virginia Evaluation, Virginia Tech Transportation Institute, January 2004
30. Bingham, D., AZTech TM Traveler Information Services, National Conference on Transportation
Operations for Planned and Unplanned Events, 2009
31. Parkany, E., C. Xie, A Complete Review of Incident Detection Algorithms & Their Deployment: What
Works and What Doesn’t, The New England Transportation Consortium, February 2005
32. Martin, P., J. Perrin, B. Hansen, Incident Detection Algorithm Evaluation, Utah Department of
Transportation, March 2001
33. Hellinga, B., H. Rakha, M. Van Aerde, Assessing the Potential of Using Traffic Simulation Model
Results for Evaluating Automatic Incident Detection Algorithms, Ontario Ministry of Transportation,
Canada

41
34. Adeli, H., Neural Network Model for Automatic Traffic Incident Detection, Ohio DOT and FHWA,
August 2001
35. Hawkins, G., J. Conrad, Traffic Incident Response Practices in Europe, Report FHWA-PL-06-002,
FHWA, U.S. Department of Transportation, February 2006
36. Bunn, Michele., Savage, Integrated Traffic Management and Emergency Response: Success Factors,
Report No. 01101, University Transportation Center for Alabama, September 2003
37. Pal, R., K.C. Sinha, Optimal Design of Freeway Incident Response Systems, Report FHWA-IN-
JTPR-99/10, U.S. Department of Transportation, FHWA, May 2000
38. Subramaniam, S., Optimization models and analysis of routing, location, distribution and design
problems on networks – Chapter 5, Virginia Tech, 1998
39. Zografos, K.G., T. Nathamail, P. Michalopoulos, Analytical Framework for Minimizing Freeway
Incident Response Time, American Society of Civil Engineers, www.asce.org
40. Chauhan, A.S., Development and Evaluation of Diversion Strategies under Incident Response using
Dynamic Traffic Assignment System, Massachusetts Institute of Technology, September 2003
41. Ozbay, K., W. Xiao, Probabilistic Programming Models for Dispatching and Resource Allocation in
Traffic Incident Management, Department of Industrial and Systems Engineering, Rutgers University
42. Safe and Quick Clearance of Traffic Incidents, Synthesis 318, National Cooperative Highway
Research Program (NHCPR), Transportation Research Board of the National Academies, August
2003
43. James, P., J. Mansoureh, Using Simulation to Estimate Incident Recovery Time, The Journal of
Transportation Research Forum, January 2011
44. Saka, A., M. Jeihani, P. James, Estimation of Traffic Recovery Time for Different Flow Regimes on
Freeways, Maryland Department of Transportation, July 2008
45. Ozbay, K., M. Baykal-Gursoy, Modeling Traffic Flow Interrupted by Incidents, European Journal of
Operational Research 195, 2009
46. Hall, R., Y. Mehta, Incident Management Process Analysis and Improvement, Report UCB-ITS-
PWP-98-31, University of California Berkeley – Institute of Transportation Studies, December 1998
47. Manley, E., Simulation of Non-Recurrent Congestion on Urban Road Networks, University College
London
48. Zografis, K.G., K.N. Androutsopoulos, G.M. Vasilakis, A Real-Time Decision Support System for
Roadway Network Incident Response Logistics, Athens University of Economics and Business, June
2000
49. Ngassa, C.K., Estimation of Network Based Incident Delay in a Transportation Network Using
Dynamic Traffic Assignment, The City University of New York, 2006

42
50. Teng, H., J. Masinick, An Analysis on the Impact of Rubbernecking on Urban Freeway Traffic,
Report No. UVACTS-15-0-62, Center for Transportation Studies, University of Virginia, August
2004
51. Boyles, S., D. Fajardo, T. Waller, A Naïve Bayesian Classifier for Incident Duration Prediction, The
University of Texas at Austin, July 2006
52. Ozbay, K., W. Xiao, Evaluation of Incident Management Strategies and Technologies Using an
Integrated Traffic/Incident Management Simulation, Int. J. Technology Management, Vol. X, No. Y,
XXXX
53. Shlayan, N., P. Kachroo, Formal Language Method Based Modeling for Traffic Incident
Management, Transportation Research Center, University of Nevada, Las Vegas, July 2009
54. Kachroo, P., K. Ozbay, Fuzzy Feedback Control for Real-Time Dynamic Traffic Routing: User
Equilibrium Model Formulations and Controller Design, Transportation Research Record 1556,
Transportation Research Board, Washington D.C.
55. Fu, L., L. Rillet, Real-Time Estimation of Incident Delay in Dynamic and Stohastic Networks,
Transportation Research Record 1603, Transportation Research Board of the National Academies
56. Fu, L., B. Hellinga, Real-Time, Adaptive Prediction of Incident Delay for Advanced Traffic
Management Systems, Department of Civil Engineering, University of Waterloo
57. Xia, J., M. Chen, Freeway Travel Time Forecasting Under Incident, Department of Civil
Engineering, University of Kentucky Lexington, September 2007
58. Wei, C.H., Y. Lee, Sequential Forecast of Incident Duration Using Artificial Neural Network Models,
ELSEVIER Ltd. 2007
59. Kachroo, P. and V. Visudevan, Analysis, Modeling and Design for Traffic Incident Management
System, University of Nevada, Las Vegas, June 2008
60. Hu, J., R. Krishman, Incident Duration Prediction for In-Vehicle Navigation System, Transportation
Research Board of the National Academies, 2011
61. Horowitz, R., A. May, Design, Field Implementation and Evaluation of Adaptive Ramp Metering
Algorithms, UCB-ITS-PRR-2005-2, University of California Berkeley, Institute of Transportation
Studies, January 2005
62. Chu, L., H. Liu, H.M. Zhang, Performance Evaluation of Adaptive Ramp Metering Algorithms Using
Microscopic Traffic Simulation Model, University of California Irvine, June 2005
63. Scariza, J.R., Evaluation of Coordinated and Local Ramp Metering Algorithms using Microscopic
Traffic Simulation, Massachusetts Institute of Technology, June 2003
64. Taylor, C., D. Meldrum, Evaluation of a Fuzzy Logic Ramp Metering Algorithm: A Comparative
Study Among Three Ramp Metering Algorithms Used in the Greater Seattle Area, Washington State
Transportation Commission and FHWA, February 2000

43
65. Wang, J.H., C. Hunter, Y. Cao, A Design of Experiment Approach to Study the Display of Variable
Message Signs, Report FHWA-RIDOT-RTD-02-7, U.S. Department of Transportation, FHWA,
December 2002
66. Latoski, K., and S. Richards, ITS Impacts on Safety and Traffic Management: An Investigation of
Secondary Crash Causes, ITS Journal, 1999, Vol. 5, pp.39-52
67. Sullivan, E.C., New Model for Predicting Incidents and Incident Delays, ASCE J. Transportation
Engineering, Vol. 123, No. 4 July/Aug, 1997, pp. 267-275
68. Dudek, C.L., R.D. Huchingson, W.R. Stockton, R.J. Koppa, S.H. Richards, T.M. Mast., Human
Factors Requirements for Real-Time Motorist Information Displays, Vol. 1 – Design Guide. Report
FHWA-RD-78-5. FHWA, U.S. Department of Transportation, September 1978
69. Dudek, C.L. and R.D. Huchingson, Manual on Real-Time Motorist Information Displays. Report
FHWA-IP-86-16. FHWA, U.S. Department of Transportation, August 1986
70. Dudek, C.L., Guidelines on the Use of Changeable Message Signs. Report FHWA-TS- 90-043.
FHWA, U.S. Department of Transportation, July 1991
71. Dudek, C.L., Changeable Message Signs. National Cooperative Research Highway Program,
Synthesis of Highway Practice 237, TRB, National Research Council, 1997
72. Dudek, C.L., Variable Message Sign Operations Manual. Report FHWA-NJ-2001-10, New Jersey
Department of Transportation, December 2001
73. ITE-AASHTO TM2.01 (Draft), Message Sets for External Traffic Management Center
Communication (MS/ETMCC), ITS Fact Sheet. January 2002
74. National Transportation Communications for ITS Protocol (NTCIP), Object Definitions for Dynamic
Message Signs, A User Comment Draft of AASHTO, ITE, NEMA. September 2002
75. Huchingson, R.D. and C.L. Dudek. Delay, Time Saved, and Travel Time Information for Freeway
Traffic Management. In Transportation Research Record 722, TRB, National Research Council,
1979, pp. 36-40

44

45
7. BIBLIOGRAPHY
ITS Handbook – Recommendations from the World Road Association (PIARC), PIARC Committee on
Intelligent Transport, 2000.
Ozbay, K. and P. Kachroo, Incident Management in Intelligent Transportation Systems, Artech House,
Inc. 1999.
Transportation Modelling for Tomorrow, Delft University Press, 1996.