Making the Business Case for Traffic Incident Management · Figure 2. Chart. Traffic incident...
92
Making the Business Case for Traffic Incident Management December 2016
Transcript of Making the Business Case for Traffic Incident Management · Figure 2. Chart. Traffic incident...

A
Making the Business Case for Traffic Incident
ManagementDecember 2016

B
Cover Photo Sources: iStock.com/Thomas Francois (top)Arizona Department of Transportation (middle left)Virginia Department of Transportation (bottom right)Grady Carrick (bottom left)
Notice
This document is disseminated under the sponsorship of the U.S. Department of Transportation in the interest of information exchange. The U.S. Government assumes no liability for the use of the information contained in this document.
The U.S. Government does not endorse products or manufacturers. Trademarks or manufacturers’ names appear in this report only because they are considered essential to the objective of the document.
Quality Assurance Statement
The Federal Highway Administration (FHWA) provides high-quality information to serve Government, industry, and the public in a manner that promotes public understanding. Standards and policies are used to ensure and maximize the quality, objectivity, utility, and integrity of its information. FHWA periodically reviews quality issues and adjusts its programs and processes to ensure continuous quality improvement.

i
Technical Report Documentation1. Report No.
FHWA-HOP-16-084
2. Government Accession No. 3. Recipient’s Catalog No.
4. Title and Subtitle
Making the Business Case for Traffic Incident Management
5. Report DateDecember 2016
9. Performing Organization Name and AddressAEM Corporation13880 Dulles Corner Ln, Suite 300Herndon, VA 20171Under contract with Cambridge Systematics, Inc.
7. Author(s)Kelley Klaver Pecheux, Ph.D.; Vaishali Shah; Cara O’Donnell
6. Performing Organization Code
8. Performing Organization Report No.
10. Work Unit No.
11. Contract or Grant No.DTFH61-12-D-00036
13. Type of Report and Period CoveredFinal Report.
14. Sponsoring Agency CodeHOP
12. Sponsoring Agency Name and AddressFederal Highway AdministrationU.S. Department of TransportationOffice of Operations1200 New Jersey Avenue, SEWashington, DC 2059015. Supplementary Notes Ms. Laurel Radow, Federal Highway Administration, Office of Operations, Technical Point of Contact
16. AbstractIn order to transform a traffic incident management (TIM) program or project from a stand-alone effort to a sustainable core function of an agency, the establishment of a solid business case is necessary. The purpose of this document is to support TIM agencies and partner agencies in the development of a strong business case for their TIM programs, as well as to introduce strategies that link investments with program results and, ultimately, with the strategic outcomes of the broader organization. This document is designed to be used throughout the entire lifecycle of an investment to ensure meaningful discussion between program managers and the approval or funding authority from the earliest possible time.
The document is organized around four primary chapters that correspond to the four phases of the TIM business case development process. Each of these four chapters begins by listing the essential elements to be developed for the TIM business case product and/or activities to be conducted within that stage of the process. Then, within the chapter, these elements/activities are described in more detail, and examples are presented to provide context. Each chapter concludes with a checklist of the important questions that should be answered by the end of each phase. The checklists are shaped such that once the questions in each chapter are answered and the phases are complete, the information needed to populate a full business case report template should be available.
17. Key WordsTraffic incident management. Business case. Financial resources. Funding sources. Strategic planning. Options analysis.
18. Distribution StatementNo restrictions.
19. Security Classification (of this report)
Unclassified
20. Security Classification (of this page)
Unclassified
21. No of Pages
92
22. Price N/A
Form DOT F 1700.7 (8-72) Reproduction of completed page authorized.
ii
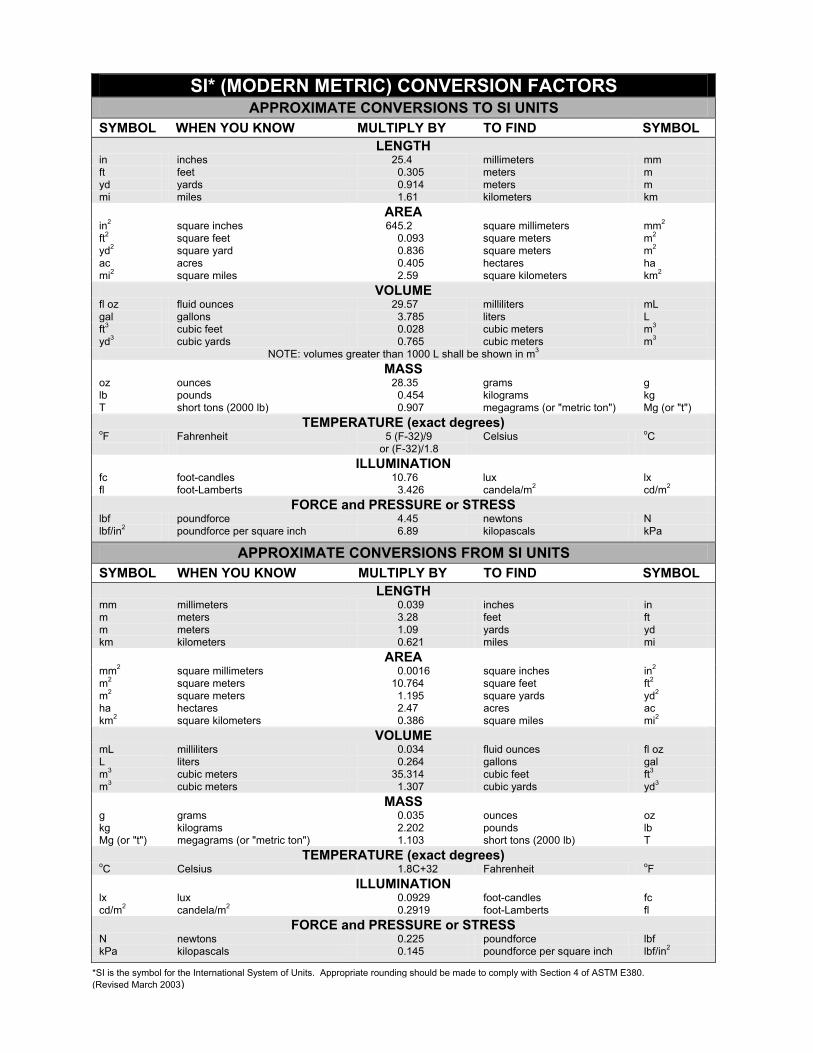
SI* (MODERN METRIC) CONVERSION FACTORS APPROXIMATE CONVERSIONS TO SI UNITS
SYMBOL WHEN YOU KNOW MULTIPLY BY TO FIND SYMBOL LENGTH
in inches 25.4 millimeters mmft feet 0.305 meters myd yards 0.914 meters mmi miles 1.61 kilometers km
AREA in2 square inches 645.2 square millimeters mm2
ft2 square feet 0.093 square meters m2
yd2 square yard 0.836 square meters m2
ac acres 0.405 hectares ha mi2 square miles 2.59 square kilometers km2
VOLUMEfl oz fluid ounces 29.57 milliliters mLgal gallons 3.785 liters Lft3 cubic feet 0.028 cubic meters m3
yd3 cubic yards 0.765 cubic meters m3
NOTE: volumes greater than 1000 L shall be shown in m3
MASSoz ounces 28.35 grams g lb pounds 0.454 kilograms kg T short tons (2000 lb) 0.907 megagrams (or "metric ton") Mg (or "t")
TEMPERATURE (exact degrees) oF Fahrenheit 5 (F-32)/9 Celsius oC
or (F-32)/1.8 ILLUMINATION
fc foot-candles 10.76 lux lx fl foot-Lamberts 3.426 candela/m2 cd/m2
FORCE and PRESSURE or STRESS lbf poundforce 4.45 newtons Nlbf/in2 poundforce per square inch 6.89 kilopascals kPa
APPROXIMATE CONVERSIONS FROM SI UNITS SYMBOL WHEN YOU KNOW MULTIPLY BY TO FIND SYMBOL
LENGTH mm millimeters 0.039 inches inm meters 3.28 feet ftm meters 1.09 yards ydkm kilometers 0.621 miles mi
AREA mm2 square millimeters 0.0016 square inches in2
m2 square meters 10.764 square feet ft2
m2 square meters 1.195 square yards yd2
ha hectares 2.47 acres ac km2 square kilometers 0.386 square miles mi2
VOLUMEmL milliliters 0.034 fluid ounces fl oz L liters 0.264 gallons galm3 cubic meters 35.314 cubic feet ft3
m3 cubic meters 1.307 cubic yards yd3
MASSg grams 0.035 ounces oz kg kilograms 2.202 pounds lb Mg (or "t") megagrams (or "metric ton") 1.103 short tons (2000 lb) T
TEMPERATURE (exact degrees)oC Celsius 1.8C+32 Fahrenheit oF
ILLUMINATION lx lux 0.0929 foot-candles fc cd/m2 candela/m2 0.2919 foot-Lamberts fl
FORCE and PRESSURE or STRESS N newtons 0.225 poundforce lbfkPa kilopascals 0.145 poundforce per square inch lbf/in2
*SI is the symbol for the International System of Units. Appropriate rounding should be made to comply with Section 4 of ASTM E380. (Revised March 2003) ii

iii
1 Introduction ....................................................................................................................1
What is a Business Case ......................................................................................1
Traffic Incident Management Business Case Development Process ..................3
Develop Vision .........................................................................................3
Evaluate and Select ..................................................................................3
Formalize .................................................................................................4
Implement and Manage ............................................................................4
Scoping and Living the Business Case ...............................................................4 Purpose and Organization of Document .............................................................6
2 Develop Vision ................................................................................................................9
Provide an Organizational Overview ..................................................................9
Organizational Structure ..........................................................................9
Traffic Incident Management Business Objectives ...............................10
Current Activities and Services, Including the Audience and Key Stakeholders ............................................................................11
State the Problem or Need .................................................................................12
Identify the Drivers for Change ........................................................................12
Introduce the Proposed Solution and Options ...................................................13
Present Likely Business Outcomes ...................................................................14
Demonstrate Strategic Fit ..................................................................................15
3 Evaluate and Select .....................................................................................................21
Define Basis Options Analysis and Evaluation Criteria ....................................22
Estimate Traffic Incident Management Benefits ...............................................24
Data Needs .............................................................................................25
Traffic Incident Management Performance Measures ...........................26
Quantify the Benefits of Traffic Incident Management .........................28
Monetize Traffic Incident Management Benefits and Compute Net Present Value ...................................................................................33
Estimate Traffic Incident Management Costs ..................................................36
Conduct Comparative Analysis and Select Preferred Option ...........................40
TABLE OF CONTENTS

iv
4 Formalize ......................................................................................................................45
Incorporate Traffic Incident Management into the Planning Process ...............45
Establish/Maintain Relationships with Traffic Incident Management Partners ........................................................................................47
Involve the Community .....................................................................................48
Work to Improve the Organization’s Overall Traffic Incident Management Processes and Capabilities ............................................................49
Identify Potential Funding Sources ...................................................................50
Traditional Funding Sources ..................................................................50
New Potential Funding Sources – The Fixing America’s Surface Transportation Act ....................................................................53
Other Funding Sources ..........................................................................54
5 Prepare for Implementation ........................................................................................59
Develop Implementation and Management Plan ..............................................59
Develop Risk Management Plan .......................................................................60
Develop Performance Management Plan ..........................................................60
6 Summary and Conclusion ...........................................................................................61
Appendix A. Business Case Report Template ...........................................................................63
Appendix B. Checklist of Traffic Incident Management Data Elements by Source .................67
Appendix C. Example Business Case Summary – Washington State Department of Transportation Corridor Capacity Report – Incident Response .........................69
Acknowledgments ......................................................................................................................71
Bibliography ..............................................................................................................................73

v
Figure 1. Chart. Key components of a compelling business case product or report .................... 1
Figure 2. Chart. Traffic incident management business case development process. ................... 2
Figure 3. Chart. Develop Vision section of traffic incident management business case development process. .................................................................................................................... 9
Figure 4. Chart. Evaluate and select section of traffic incident management business case development process .......................................................................................................... 21
Figure 5. Chart. Arizona Department of Transportation strategic focus areas ........................... 24
Figure 6. Chart. Comparison of secondary crashes involving a first responder in Arizona from 2011-2013 ............................................................................................................. 31
Figure 7. Chart. Comparison of secondary crashes involving non-responders in Arizona from 2011-2013 ............................................................................................................. 31
Figure 8. Estimated program costs in the Florida Department of Transportation’s 2006 Traffic Incident Management Strategic Plan .............................................................................. 38
Figure 9. Coordinated Highways Action Response Team’s (CHART) proposed operations enhancement costs for Maryland ............................................................................... 39
Figure 10. Image. Freeway service patrol cost calculator in the Traffic Incident Management Benefit-Cost Tool ........................................................................ 40
Figure 11. Chart. Formalize section of traffic incident management business case development process ................................................................................................................... 45
Figure 12. Chart. Prepare for implementation section of traffic incident management business case development process ................................................................................................. 59
LIST OF FIGURES
Table 1. Arizona Department of Public Safety metropolitan Phoenix traffic incident management performance between October-December 2010 and October-December 2014 ...................................................................................................... 28
Table 2. Recommended hourly values of travel time savings (2013 $ per person-hour) ........... 34
Table 3. Recommended hourly values of travel time savings (2013 $ per person-hour) ........... 34
Table 4. Values for avoided air emissions in 2013 dollars ......................................................... 35
Table 5. Range of costs for traffic incident management programs – small freeway service patrol programs to comprehensive statewide traffic incident management programs .................................................................................................. 37
LIST OF TABLES

vi

vii
• Advanced Traffic Management System (ATMS)
• American Association of State Highway and Transportation Officials (AASHTO)
• Arizona Department of Public Safety (AZDPS)
• Arizona Department of Transportation (ADOT)
• Benefit-Cost Ratio (BCR)
• Capability Maturity Framework (CMF)
• Closed-Circuit Television (CCTV)
• Colorado Department of Transportation (CDOT)
• Computer-aided Dispatch (CAD)
• Congestion Mitigation and Air Quality (CMAQ)
• Coordinated Highways Action Response Team (CHART)
• Delaware Valley Regional Planning Commission (DVRPC)
• Department of Motor Vehicles (DMV)
• Department of Transportation (DOT)
• Dynamic Message Signs (DMS)
• Emergency Medical Services (EMS)
• Federal Emergency Management Agency (FEMA)
• Federal Highway Administration (FHWA)
• Federal Motor Carrier Safety Administration (FMCSA)
• Fixing America’s Surface Transportation (FAST)
• Florida Department of Transportation (FDOT)
• Freeway Incident Response Safety Team (FIRST)
• Freeway Service Patrol (FSP)
• Freeway Service Patrol Evaluation (FSPE)
• Georgia Department of Transportation (GDOT)
• Highway Emergency Response Operators (HERO)
• Incident Clearance Time (ICT)
• Incident Management Assistance Patrols (IMAP)
• Incident Response (IR)
LIST OF ABBREVIATIONS

viii
• Information Technology (IT)
• Integrated Corridor Management (ICM)
• Intelligent Transportation Systems (ITS)
• ITS Deployment Analysis System (IDAS)
• Long Range Plan (LRP)
• Los Angeles Service Authority for Freeway Emergencies (LA SAFE)
• Maryland Department of Transportation (MDOT)
• Maryland State Highway Administration (SHA)
• Memorandum of Understanding (MOU)
• Metropolitan Planning Organization (MPO)
• Metropolitan Transportation Commission Service Authority for Freeways and Expressways (MTC SAFE)
• Minnesota Department of Transportation (MnDOT)
• Motor Vehicle Emission Simulator (MOVES)
• National Cooperative Highway Research Program (NCHRP)
• National Highway Performance Program (NHPP)
• National Highway System (NHS)
• National Highway Traffic Safety Administration (NHTSA)
• National Household Travel Survey (NHTS)
• National Institute of Justice (NIJ)
• Net Present Value (NPV)
• New Jersey Department of Transportation (NJDOT)
• Nitric Oxides/Nitrogen Dioxides (NOx)
• Operations and Maintenance (O&M)
• Oregon Department of Transportation (ODOT)
• Particulate Matter (PM)
• Pennsylvania Department of Transportation (PennDOT)
• Rapid Incident Scene Clearance (RISC)
• Regional Emergency Action Coordination Team (REACT)
• Roadway Clearance Time (RCT)
• Rutgers Incident Management System (RIMS)
• Statewide Transportation Improvement Program (STIP)

ix
• Strategic Highway Research Program 2 (SHRP2)
• Strategic Highway Safety Plan (SHSP)
• Sulfur Oxides (SOx)
• Surface Transportation Program (STP)
• Traffic Incident Management Benefit-Cost (TIM-BC)
• Traffic and Criminal Software (TraCS)
• Traffic Incident Management (TIM)
• Traffic Incident Management Enhancement (TIME)
• Traffic Incident Management Performance Measurement (TIM PM)
• Traffic Incident Management Self-Assessment (TIM SA)
• Traffic Operations Center (TOC)
• Traffic Records Coordinating Committee (TRCC)
• Transportation Improvement Program (TIP)
• Transportation Investment Generating Economic Recovery (TIGER)
• Transportation Management Center (TMC)
• Transportation Research Board (TRB)
• Transportation System Management and Operations (TSM&O)
• U.S. Department of Transportation (USDOT)
• University of Washington (UW)
• Value Pricing Pilot Program (VPPP)
• Vehicle Miles Traveled (VMT)
• Vehicle-to-Infrastructure (V2I)
• Vehicle-to-Vehicle (V2V)
• Virginia Department of Transportation (VDOT)
• Volatile Organic Compounds (VOCs)
• Washington State Department of Transportation (WSDOT)
• Wisconsin Department of Transportation (WisDOT)

x

1
CHAPTER 1. INTRODUCTION
Making the Business Case for Traffic Incident Management.
Agencies know intuitively that there is a profound value in traffic incident management (TIM) programs; however, it is often challenging to estimate and communicate the value of TIM inter-nally to executive management and externally to decisionmakers. The value of TIM must be ac-curately estimated and effectively communicated to maintain and grow a TIM program. Typical-ly, a report presenting an “analysis,” “evaluation,” or “study” is generated after a TIM program or project has been implemented to summarize the benefit of the program or project; however, this is often a one-time activity. In order to transform a TIM program or project from a stand-alone effort to a sustaining core function of an agency, the establishment of a solid business case is necessary.
WHAT IS A BUSINESS CASE?A business case is a well-reasoned argument designed to convince an audience of the benefits of an investment while educating them about the associated changes, costs, and risks. A business case is both a product and a process. The business case product is important as it uses writing, data and analyses, and graphs and charts to articulate the business need, the proposed investment, and the value generated by making an investment. It is the tool used to inform key stakeholders about an initiative and to convince them to support it in specific ways, such as funding, rule-making, policy changes, or process adherence. [1]
There are five components that together make for a compelling business case: the problem, the proposed solution, a value analysis, a risk assessment, and the strategic fit. Figure 1, adapted from a guide on developing a business case for renewable energy at airports, outlines these key components of a business case product. [2]
Figure 1. Chart. Key components of a compelling business case product or report.
(Source: AEM Corporation.)
A business case is both a product and a process.

2
Figure 1 also provides the important questions that need to be answered within each of the key business case components. While the traditional business case product is a report, a compelling business case may include targeted briefings, fact sheets, testimony, an informational video, or other communica-tions products. “There is no magic formula when it comes to the size of a business case. The size is irrelevant. What is relevant is that the business case provides all the necessary information to make the job of the decision maker possible. [1]”
While the business case product is what ultimately gets delivered or presented, it should not be viewed as the final step. In fact, the overall TIM business case development process is as important as the product itself. This process helps to formalize and institutionalize the proposed initiative, setting it up for success and smart growth. The business case development process is shown in Figure 2.
Figure 2. Chart. Traffic incident management business case development process.
(Source: AEM Corporation.)
While the traditional business case product is a report, a compelling
business case may include targeted briefings, fact sheets, testimony, an informational video, or other
communications products.
Making the Business Case for Traffic Incident Management.
3
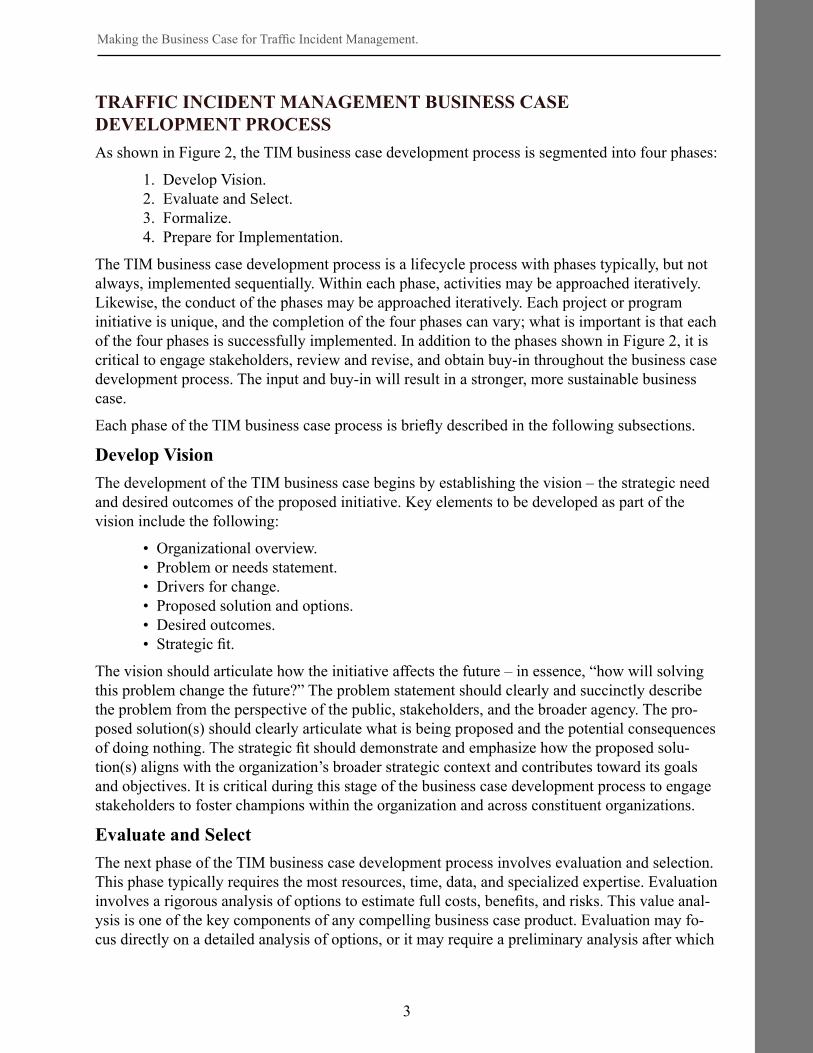
TRAFFIC INCIDENT MANAGEMENT BUSINESS CASE DEVELOPMENT PROCESSAs shown in Figure 2, the TIM business case development process is segmented into four phases:
1. Develop Vision. 2. Evaluate and Select. 3. Formalize. 4. Prepare for Implementation.
The TIM business case development process is a lifecycle process with phases typically, but not always, implemented sequentially. Within each phase, activities may be approached iteratively. Likewise, the conduct of the phases may be approached iteratively. Each project or program initiative is unique, and the completion of the four phases can vary; what is important is that each of the four phases is successfully implemented. In addition to the phases shown in Figure 2, it is critical to engage stakeholders, review and revise, and obtain buy-in throughout the business case development process. The input and buy-in will result in a stronger, more sustainable business case.
Each phase of the TIM business case process is briefly described in the following subsections.
Develop VisionThe development of the TIM business case begins by establishing the vision – the strategic need and desired outcomes of the proposed initiative. Key elements to be developed as part of the vision include the following:
• Organizational overview. • Problem or needs statement. • Drivers for change. • Proposed solution and options. • Desired outcomes. • Strategic fit.
The vision should articulate how the initiative affects the future – in essence, “how will solving this problem change the future?” The problem statement should clearly and succinctly describe the problem from the perspective of the public, stakeholders, and the broader agency. The pro-posed solution(s) should clearly articulate what is being proposed and the potential consequences of doing nothing. The strategic fit should demonstrate and emphasize how the proposed solu-tion(s) aligns with the organization’s broader strategic context and contributes toward its goals and objectives. It is critical during this stage of the business case development process to engage stakeholders to foster champions within the organization and across constituent organizations.
Evaluate and SelectThe next phase of the TIM business case development process involves evaluation and selection. This phase typically requires the most resources, time, data, and specialized expertise. Evaluation involves a rigorous analysis of options to estimate full costs, benefits, and risks. This value anal-ysis is one of the key components of any compelling business case product. Evaluation may fo-cus directly on a detailed analysis of options, or it may require a preliminary analysis after which
Making the Business Case for Traffic Incident Management.
4
a few viable options are selected. The evaluation should include quantitative, monetized, and qualitative assessments. Selection involves the delineation of the preferred option with sufficient detail to instill confidence that the proposed investment has been appropriately considered and that the presented estimates are within an acceptable degree of accuracy. The business case report should include a comparative summary of the findings associated with each option and should demonstrate the analytics and strategic basis for the preferred option. A clear summary of findings will serve as the content by which to prompt decisionmakers to recognize and support investment in TIM initiatives.
FormalizeThe third phase of the TIM business case development process is formalization. Formalization involves activities that help to integrate TIM within and across organizations, prepare the TIM program or strategies for institutionalization, and solidify funding sources for the program – in essence, activities that help to establish the TIM program as part of the fabric of the agency. While the previous phase includes a traditional benefit-cost analysis, a formalization strategy frames this analysis within the broader story of the value of TIM within the organization, the transportation planning process, and the diverse stakeholder community. The formalization strategy is content that should be used as part of the strategic fit component of the business case product.
The move toward formalization requires “socialization” of the TIM program. Socialization strat-egies in the context of a TIM agency may:
• Grow a collective “in the same boat mentality” within the agency and across stakeholders.
• Formally disseminate information and informally share value within the context of work.
• Communicate the value of TIM for counterparts – how will law enforcement, emergency medical services (EMS), and other stakeholders benefit in their core missions from supporting TIM?
The cornerstone to TIM socialization and formalization is the involvement and participation of stakeholders to foster champions within the organization and across constituent organizations.
Implement and ManageTo demonstrate a commitment to the execution and management of the proposed initiative, the final phase of the TIM business case development process includes defining the implementation and management of the proposed initiative. Depending on whether the business case is for a program or project, items may include the processes for tracking project progress, risks, changes, and outcomes, as well as performance measurement and management strategies. The documentation of these implementation and management concerns helps to instill confidence that the proposed initiative will be well managed across the project or program lifecycle.
SCOPING AND LIVING THE BUSINESS CASE The business case, both as a product and a process, provides decisionmakers, stakeholders, and the public with a tool for evidence-based and transparent decisionmaking as well as the blue-
Making the Business Case for Traffic Incident Management.

5
prints for the delivery, management, and performance monitoring of the resultant program. The level of resources, time, and expertise needed to develop the business case will be a function of the size of the proposed investment, the availability of data, and the time-frame within which a decision is made. In scoping the resource needs for business case development, be sure to:
• Identify what business case products will be needed to market the preferred solution to decisionmakers, legislative bodies, stakeholder agencies, and the benefiting public. While a business case report and briefing may be the right products for the decisionmakers, it may miss the mark with the general public or with the legislative entities that define line-item funding. Be sure to consider what is needed to produce the desired quality and type of required business case products.
• Understand the timeline for investment decisionmaking and be sure to allocate sufficient time to market the business case throughout the development process and subsequent to the completion of the business case products. The best business cases may fail in securing funding, or at the very least be deferred significantly, if the busi- ness case does not align with the agency’s process and timeline for funding decisions.
• Recognize that the evaluation should align with expertise, data, and TIM program implementation and maintenance costs. Evaluations can employ a range of approaches from simple computations, to empirical analyses using observational data, to complex mathematical models driven by simulations. The business case for a large, multi-million dollar TIM program will likely require a robust, data-intensive estimation of the benefits. Conversely, the business case for a smaller TIM program investment, such as funding three sessions of responder training, may require a qualitative evaluation that relies on national best practices.
• Incorporate a plan for documenting the process with an eye to the future to support reproducibility and to capture why specific decisions were made in the development of the business case. The meta-data on the business case process and products, as well as the data collected in the evaluation of options, will be key components to support subsequent investment decisions.
Within the context of TIM, the investment requests may be segmented. That is, a small invest-ment request associated with a pilot study may precede a larger request for system-wide solution implementation. In this situation, the evaluation and selection phase of the business case process may involve limited analysis centered on capturing the problem, a qualitative delineation of value using industry information on best practices, and referencing of peer results. The data (both operational and process focused) generated from the pilot study can then serve as a more formal evaluation and recommendation for system-level implementation.
Typically, the business cases that culminate in program implementation will include a post-im-plementation review, which serves as the starting point for the next investment consideration. Consequently, the business case report and the business case process best serve the program or project when viewed as a living document and activity over the lifecycle of the investment. The business case should not be viewed as “once and done.” Demonstration and communication of the continued value from the initial investment and commitment of operations funding will ensure that the TIM program remains viable and that future growth opportunities are met with support.
Making the Business Case for Traffic Incident Management.

6
PURPOSE AND ORGANIZATION OF DOCUMENTThe purpose of this document is to support TIM agencies and partner agencies in the develop-ment of a strong business case for their TIM programs, as well as to introduce strategies that link investments with program results and, ultimately, with the strategic outcomes of the broader organization.
Program managers seeking approval or continued funding for a TIM activity, project, or program are the primary audience for this document. This document can be used throughout the entire lifecycle of an investment to ensure meaningful discussions between managers and the approval or funding authority from the earliest possible time.
Following this introductory chapter, the document contains four core chapters that correspond to the four phases of the TIM business case development process. Each of the four core chapters begins by listing the essential elements to be developed (e.g., for the business case product) and/or activities to be conducted within that stage of the process. These elements/activities are described in more detail within each chapter, and examples are presented to provide context. Each chapter concludes with a check list of the important questions that should be answered by the end of each phase. The core chapters are described briefly below:
• Chapter 2 focuses on the first stage of the business case development process – Develop Vision. This chapter discusses the various elements of the vision and provides examples of how TIM organizations have developed the vision for their programs and initiatives.
• Chapter 3 examines the second stage of the business case development process – Evaluate and Select. This chapter provides more detail about the methodologies available for estimating the benefits of TIM for the purposes of evaluation and selection and provides examples of how TIM organizations estimate the benefits and costs of their programs.
• Chapter 4 centers on the third stage of the business case development process – Formalize. This chapter discusses and provides examples on the activities used to facilitate the integration of TIM within and across organizations and to prepare the TIM program or strategies for institutionalization. Common and creative funding sources for TIM activities and programs are also included.
• Chapter 5 focuses on the fourth stage of the business case development process – Prepare for Implementation. This chapter discusses and provides examples on how to plan for the implementation and management of a proposed project/program to demonstrate a commitment to the execution and management of the initiative.
Finally, Chapter 6 provides a summary and conclusion to this document and lists other relevant resources for agencies in support of the development of a compelling TIM business case. In ad-dition, Appendix A provides a business case report template that is adapted from a business case template developed by the Treasury Board of Canada Secretariat. [3] The phases, questions, and checklists presented throughout this document are also adapted from this template. The template is shaped so that once the questions in each chapter are answered and the phases are complete, the information needed to populate the business case report template should be available.
Making the Business Case for Traffic Incident Management.

7
CHAPTER 1 REFERENCES[1] I. Bogorad, “6 essential elements for a winning business case,” TechRepublic, 27 July
2008. [Online]. Available: http://www.techrepublic.com/blog/tech-decision-maker/6-essential-elements-for-a-winning-business-case/. [Accessed 13 May 2016].
[2] S. Barrett, P. DeVita, J. Kenfield, B. Jacobsen and D. Bannard, “Developing a Business Case for Renewable Energy at Airports,” Transportation Research Board, Washington, D.C., 2016.
[3] Treasury Board of Canada Secretariat, “Business Case Template,” Catalogue No. BT53-15/2-2009E-PDF, 2009.
Making the Business Case for Traffic Incident Management.

8
9
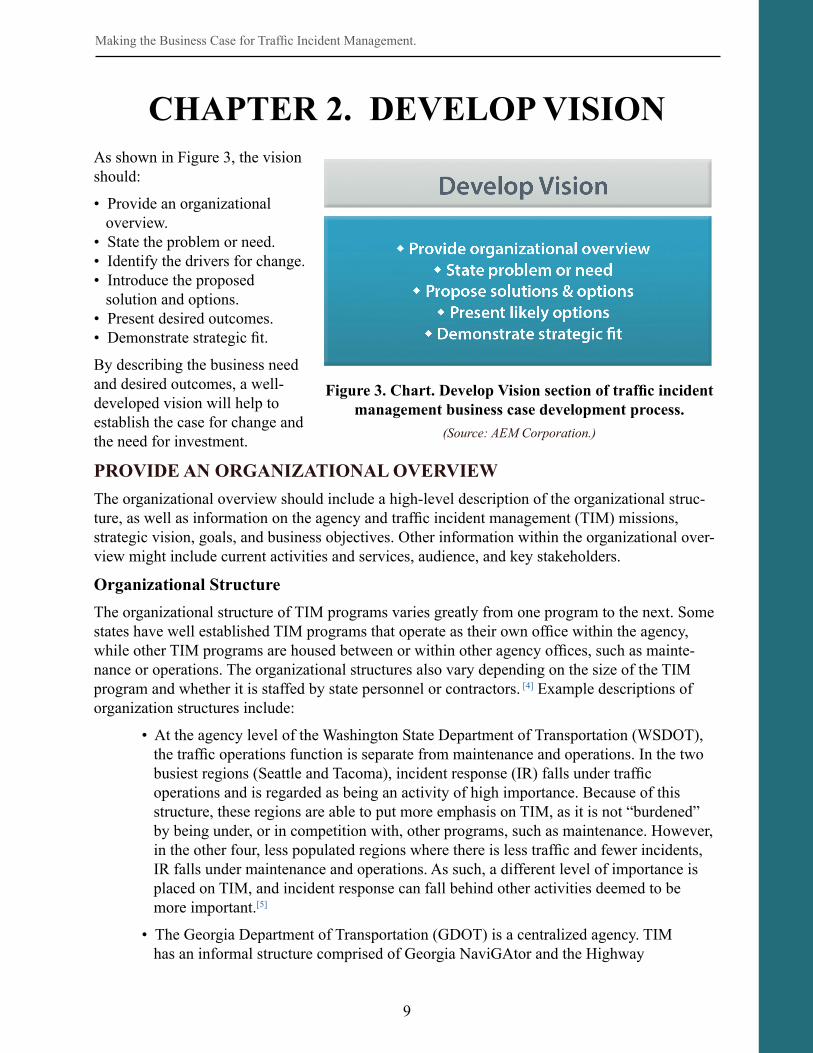
As shown in Figure 3, the vision should:
• Provide an organizational overview. • State the problem or need. • Identify the drivers for change. • Introduce the proposed solution and options. • Present desired outcomes. • Demonstrate strategic fit.
By describing the business need and desired outcomes, a well- developed vision will help to establish the case for change and the need for investment.
PROVIDE AN ORGANIZATIONAL OVERVIEWThe organizational overview should include a high-level description of the organizational struc-ture, as well as information on the agency and traffic incident management (TIM) missions, strategic vision, goals, and business objectives. Other information within the organizational over-view might include current activities and services, audience, and key stakeholders.
Organizational StructureThe organizational structure of TIM programs varies greatly from one program to the next. Some states have well established TIM programs that operate as their own office within the agency, while other TIM programs are housed between or within other agency offices, such as mainte-nance or operations. The organizational structures also vary depending on the size of the TIM program and whether it is staffed by state personnel or contractors. [4] Example descriptions of organization structures include:
• At the agency level of the Washington State Department of Transportation (WSDOT), the traffic operations function is separate from maintenance and operations. In the two busiest regions (Seattle and Tacoma), incident response (IR) falls under traffic operations and is regarded as being an activity of high importance. Because of this structure, these regions are able to put more emphasis on TIM, as it is not “burdened” by being under, or in competition with, other programs, such as maintenance. However, in the other four, less populated regions where there is less traffic and fewer incidents, IR falls under maintenance and operations. As such, a different level of importance is placed on TIM, and incident response can fall behind other activities deemed to be more important.[5]
• The Georgia Department of Transportation (GDOT) is a centralized agency. TIM has an informal structure comprised of Georgia NaviGAtor and the Highway
CHAPTER 2. DEVELOP VISION
Making the Business Case for Traffic Incident Management.
Figure 3. Chart. Develop Vision section of traffic incident management business case development process.
(Source: AEM Corporation.)

10
Emergency Response Operators (HERO) incident response units, and it is housed within the Office of Traffic Operations under the Division of Permits and Operations. While TIM activities are currently constrained to the metro Atlanta area, GDOT is considering expanding the TIM program outside of the urban area. However, given the centralized nature of the agency, expanding TIM is likely to come with new challenges. [6]
• The Maryland State Highway Administration (SHA) has several operational offices that report to the chief engineer. The Office of The Coordinated Highways Action Response Team (CHART) and ITS Development, which is Maryland’s TIM program, began in the Office of Safety and evolved to become its own office with a board of directors to include multiple SHA Offices along with other key stakeholders. This structure allows for broad stakeholder representation in key decisionmaking and future planning of the TIM program goals and objectives.[7]
The description of the organizational structure in the business case may also need to reflect the current political climate or culture. For example, in the more rural Oregon Department of Transportation (ODOT) regions, the culture had been that the maintenance staff handled inci-dent response – a part of the job that they enjoyed. Therefore, even though a vacant maintenance position would have allowed ODOT Region 3, District 8 to hire a dedicated incident responder, the maintenance crews were opposed to doing so, as giving up a maintenance position came with many unknowns. [7]
Understanding and explaining how the TIM program fits into the overall organizational struc-ture, culture, and political climate, and how these in turn affect the TIM program, is an important component of setting the stage for the business case.
Traffic Incident Management Business ObjectivesCompared with the primary private sector business objective of generating revenue, public sector business objectives deal more with addressing the needs of the public in an economically responsible and efficient manner. Transportation agencies are in the business of keeping people and goods moving in a safe, efficient, and environmentally responsible manner. As TIM is usually a program within an overall agency structure, TIM business objectives need to align with the overall agency mission, vision, goals, and business objectives. TIM business objectives should also be overarching to include all of the various agencies involved. [8] Based on conversa-tions with various agencies, TIM business objectives within their organizations were articulated as follows:
• In the early days of the Maryland CHART Program – a cooperative effort of the Maryland SHA, Maryland Transportation Authority, and the Maryland State Police, in cooperation with other Federal, state, and local agencies – the primary business objectives were to help disabled motorists and to manage congestion during incidents. Recognizing the safety and mobility effects
Making the Business Case for Traffic Incident Management.
Compared with the primary private sector business objective of generating revenue, public sector business objec-
tives deal more with addressing the needs of the public in an economically
responsible and efficient manner.
11
of incidents, CHART’s mission-critical primary objective is now clearing incidents as quickly as possible, which aligns with the Maryland Department of Transportation’s (MDOT) overall objectives of improving safety, mobility, and travel time reliability. [9, 10]
• The Delaware Valley Regional Planning Commission (DVRPC) provides guidance and assistance to agencies within the nine-county, bi-state, greater Philadelphia area to build a sustainable and livable region. DVRPC’s main TIM business objective is to coordinate and facilitate discussions that help to address the issues and connect people that can impact change in the region. [11] Regional TIM stakeholders include the Pennsylvania Department of Transportation (PennDOT), the New Jersey Department of Transportation (NJDOT), the regional freeway service patrol (FSP) program, and the Pennsylvania and New Jersey State Police.
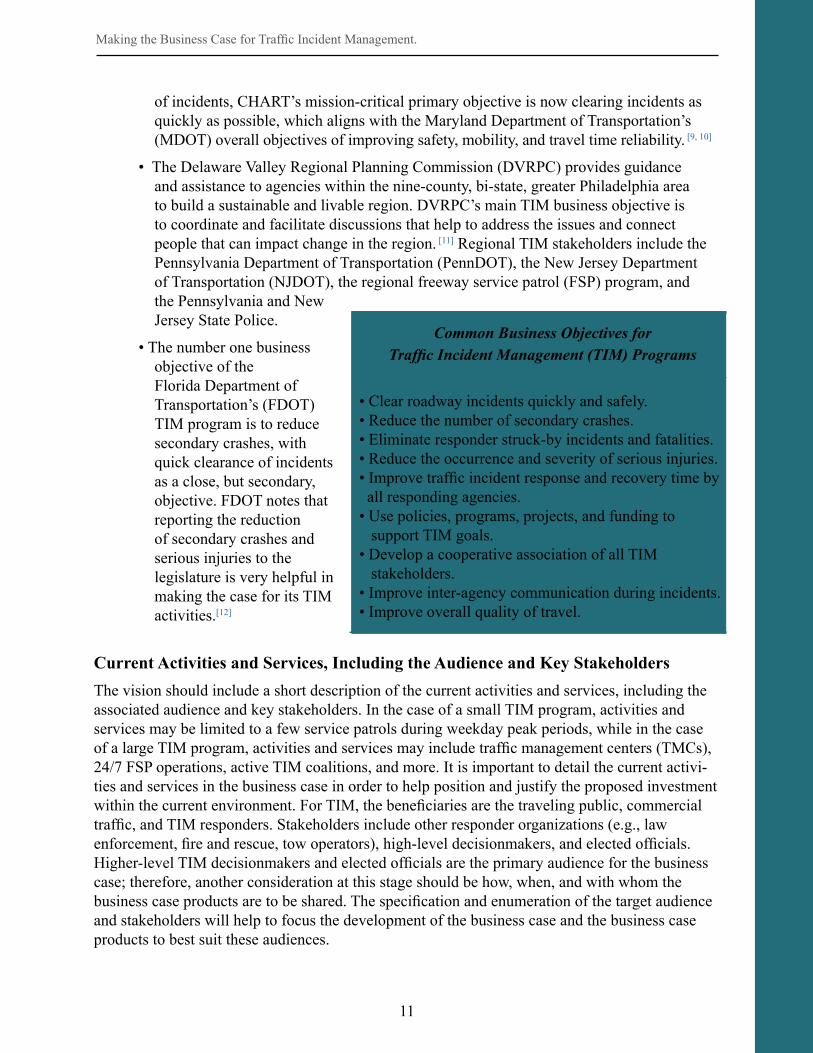
• The number one business objective of the Florida Department of Transportation’s (FDOT) TIM program is to reduce secondary crashes, with quick clearance of incidents as a close, but secondary, objective. FDOT notes that reporting the reduction of secondary crashes and serious injuries to the legislature is very helpful in making the case for its TIM activities.[12]
Current Activities and Services, Including the Audience and Key StakeholdersThe vision should include a short description of the current activities and services, including the associated audience and key stakeholders. In the case of a small TIM program, activities and services may be limited to a few service patrols during weekday peak periods, while in the case of a large TIM program, activities and services may include traffic management centers (TMCs), 24/7 FSP operations, active TIM coalitions, and more. It is important to detail the current activi-ties and services in the business case in order to help position and justify the proposed investment within the current environment. For TIM, the beneficiaries are the traveling public, commercial traffic, and TIM responders. Stakeholders include other responder organizations (e.g., law enforcement, fire and rescue, tow operators), high-level decisionmakers, and elected officials. Higher-level TIM decisionmakers and elected officials are the primary audience for the business case; therefore, another consideration at this stage should be how, when, and with whom the business case products are to be shared. The specification and enumeration of the target audience and stakeholders will help to focus the development of the business case and the business case products to best suit these audiences.
Making the Business Case for Traffic Incident Management.
Common Business Objectives for Traffic Incident Management (TIM) Programs
• Clear roadway incidents quickly and safely.• Reduce the number of secondary crashes.• Eliminate responder struck-by incidents and fatalities.• Reduce the occurrence and severity of serious injuries.• Improve traffic incident response and recovery time by all responding agencies.• Use policies, programs, projects, and funding to support TIM goals.• Develop a cooperative association of all TIM stakeholders.• Improve inter-agency communication during incidents.• Improve overall quality of travel.

12
In addition to identifying the audience and key stakeholders, it is also prudent to engage them both during the development of the vision and throughout the business case development lifecy-cle. The engagement of key stakeholders, in particular, can go a long way in supporting the suc-cess of the proposed investment. Maryland’s CHART program has made it a priority to engage key stakeholders, working together with other responder organizations in ways that will benefit the operations of both or all involved parties. For example, CHART purchased a new crash reporting technology system for the State police out of the TIM operations budget. This system benefits the State police operations and also helps improve CHART’s incident response numbers. [9] Chapter 4 – Formalize – provides more specific direction on engaging both the community and partner organizations.
STATE THE PROBLEM OR NEEDThe business case should contain a brief, compelling, service-oriented problem or needs state-ment, which is presented in the context of the current environment. This statement should be no more than one or two sentences. The three general approaches to developing a problem or needs statement are:
1. Describe the current situation and explain the adverse effect. Highlight the problems, difficulties, and inadequacies of the status quo (e.g., shortfalls in vision, goals, or objectives).
2. Describe how the world is today and how the world will look tomorrow when the proposed change is implemented.
3. State what the case is proposing and describe why it is being considered. Why now?
IDENTIFY THE DRIVERS FOR CHANGEThe business case should identify what has triggered the investment proposal. Both internal and external drivers for change should be identified and clearly linked to the business need. Internal drivers for change could be related to knowledge, resources, capabilities, or desires. External drivers for change could be political (laws and regulations), economical, technological, or cus-tomer/stakeholder related.
Often times in the case of TIM, the driver for change is a catastrophic crash that causes significant delays and/or results in multiple injuries or fatalities. For the Seattle Department of Transportation, the driver for change occurred in March 2015, when an overturned truck on the Alaskan Way Viaduct blocked traffic for nearly nine hours and caused significant traffic delays throughout the Seattle area. This event highlighted the lack of a consistent citywide approach to TIM and brought forth the need for comprehensive TIM plans, policies, and training. [13]
For the Arizona Department of Public Safety (AZDPS), the number one driver for change toward performance measurement was that police officers were still being struck at incident scenes,
Making the Business Case for Traffic Incident Management.
Example Problem Statement – Oregon Department of Transportation (ODOT)
Because ODOT Region 3, District 8 relied wholly on maintenance crews to respond to incidents, maintenance resources were not being efficiently applied. A dedicated incident response program would serve to improve both
maintenance and traffic operations.

13
despite efforts toward improvement in this area. Between 2000 and 2010, 10 officers were killed at incident scenes, six of which started out as minor, routine incidents. In 2010, it was apparent to the AZDPS that in order to be able to determine if TIM strategies were improving safety, more emphasis needed to be placed on collecting TIM performance measures. [14]
For ODOT Region 3, District 8, the driver for change in the approach to incident response was an increase in incidents on weekends. With no dedicated resources for incident response, main-tenance employees were assigned to cover weekend hours to handle incidents. At one point, staff were being called out so frequently that three different maintenance groups had to assign staff to weekend shifts to avoid paying overtime. This led to inefficiencies in scheduling and conducting maintenance activities – using maintenance staff on the weekends for operations-related business left them understaffed during the week – which is what drove the need for a dedicated incident response staff. [7]
INTRODUCE THE PROPOSED SOLUTION AND OPTIONSOnce the problem or need has been clearly stated and linked to the drivers for change, the business case should introduce the proposed solution, objectives, and options considered (if applicable). Be sure to articulate the boundaries of the investment for each option. The scope of the business case clarifies what is to be included or excluded from each option.
If the business case is being developed to maintain the existing TIM program and funding levels, then two alternatives may suffice:
• The base alternative of the continued expenditure of capital resources consistent with the past.
• The “No TIM” alternative that would eliminate funding and allow the dissolution of the TIM program.
If the business case is being developed for a significant new TIM capability, there may be multi-ple alternatives. For example, in considering investment for an FSP program, two levels of FSP equipment investment and three options for hours of service may result in six alternatives for consideration.
AZDPS proposed an innovative solution regarding the need for improved TIM performance. AZDPS worked through the Arizona Traffic Records Coordinating Committee (TRCC) to add 15 blank fields to the Traffic and Criminal Software (TraCS) tool used to complete crash reports. This approach allowed AZDPS to incorporate the three national TIM performance measures into the tool without changing the crash form, a longer and more arduous process that would have delayed the ability to collect the data. The use of these blank fields in TraCS made it easy for AZDPS to incorporate the time stamps for roadway clearance time (RCT), incident clearance time (ICT), secondary crashes, and a few other TIM performance measures of interest to AZDPS. This ap-proach allowed troopers to easily collect the data at incident scenes while adding other data fields onto the crash form. Several years later, in July 2014, the TRCC and the Arizona Department of Transportation (ADOT) approved and adopted the changes to the statewide crash form.
The solution proposed by ODOT Region 3, District 8 to improve maintenance and incident response efficiencies within the district was to hire a dedicated incident response staff to cover incidents from Wednesdays through Mondays and to put the weekend, on-call maintenance staff back on regular maintenance crews.
Making the Business Case for Traffic Incident Management.

14
PRESENT LIKELY BUSINESS OUTCOMESA likely business outcome is the expected result or benefit that the organization is striving to achieve at the end of an intervention or change. Outcomes an-swer the question, “What are we trying to achieve?” Potential outcomes are the reason for undertaking a project and are therefore critical to a successful business case. For the TIM business case, outcomes should be clearly defined, measurable, and developed with stakeholder involvement. Key TIM benefits from the transportation perspective can be categorized within mobility, safety, efficiency, environmental, and traveler assistance.
Mobility benefits include less travel delays and greater travel time reliability for motorists. Safety benefits include increased safety at incident scenes, fewer secondary crashes, fewer crashes in-volving responders, and quicker arrival of emergency medical services (EMS) during the critical hour for those injured. Efficiency benefits include reduced incident durations, more efficient use of roadway capacity during incidents, and reduced personnel or equipment costs from more efficient responses. Environmental benefits include less fuel consumption and less emissions. Traveler satisfaction benefits include reduced cost of towing/assistance to motorists, frequen-cy and valuation of assistance to motorists, and improved customer satisfaction.
For the proposed dedicated IR program, ODOT laid out a number of clearly defined and measurable outcomes and associated measures, which were aligned with ODOT’s overall statewide goals using the Federal Highway Administration (FHWA) Traffic Incident Manage-ment Handbook and Best Practices in Traffic Incident Management documents. [15, 16] The expected outcomes were:
• Increased responder safety (by reducing on-scene exposure).• Enhanced inter-agency cooperation and relationships.• Decreased response time to incidents.• Reduced incident duration.• Reduced cost and risk exposure to the traveling public.• Reduced associated congestion (delay). • Fewer secondary crashes.• Enhanced district maintenance and operations efficiency.
Examples of Traffic Incident Management (TIM) Benefits
• The Maryland Coordinated Highways Action Response Team (CHART) program saved Maryland motorists an estimated 6.77 million gallons of fuel in 2014. [17]
• In 2014, Florida reported that the annual reductions in air pollutant emissions related to congestion as a result of the Road Ranger program include a total of 475 tons of hydrocarbon, 5331 tons of carbon monoxide, 227 tons of nitric oxide, and 61,817 tons of carbon dioxide.
[18]
• When surveyed on top priorities for the Maryland State Highway Administration (SHA), citizens overwhelm-ingly ranked clearing the road after an incident as the top priority.[19]
• Washington State Department of Transportation (WS-DOT) reports hundreds of positive comments and letters every year, including checks from some pleased motorists who offer to pay for the service. [20]
Making the Business Case for Traffic Incident Management.
Outcomes should be clearly defined, measurable, and developed with
stakeholder involvement.

15
The measures included:
• Total hazardous incident density and hazardous incidents by type.• Time spent and number of events responded to by crew type and work shift.• Budget saved from reduction in maintenance crews for after hour call-outs.• 90-minute clearance time performance for crash and fatal crash incidents.• Average incident response times for regular work shifts.• Reduction in risk of secondary crashes.• Estimated cost of incident delay.
DEMONSTRATE STRATEGIC FITTo make a robust case for change, the business case should demonstrate how the proposed in-vestment fits within the organization’s broader strategic context and contributes toward its goals and objectives. A strong business case will emphasize that the proposed solution is aligned with established organizational policies and processes.
ODOT had a 2011 I-5 corridor plan that specifically stated that by 2013/2014, there should be dedicated incident response along I-5 to help with congestion management. The plan stated that incident response vehicles should be deployed to patrol I-5 during peak crash periods in order to address operational and safety concerns. [21] In making the case for the dedicated IR program, ODOT Region 3, District 8 referenced this corridor plan, which ultimately played a significant role in the approval of the pilot test.[7]
Making the Business Case for Traffic Incident Management.
Vision Example – Washington State Department of Transportation (WSDOT)
WSDOT’s IR program got its start in 1990 during Seattle’s Goodwill Games. Having the foresight before this event that traffic was going to be a problem, WSDOT purchased a vehi-cle and put one incident responder out on the roads. Following the games, the University of Washington (UW) conducted a before-and-after study of incident clearance, and the results clearly showed the benefits of having the incident responder. The program was maintained, and WSDOT has gone back to the legislature four times to ask for additional funds to ex-pand the program. As a result, the program has grown from $225,000 (biennially) in the early 1990s to $9.5 million (biennially) in 2015. Initially, the primary measure used in support of the program was the number of incidents to which the IR responded; however, now UW con-ducts more sophisticated benefit-cost and economic benefit analyses.
16
At the end of this phase of the business case development process, much of the information that eventually will need to be presented in the business case products will be complete. The checklist that follows identifies these information pieces. After this phase, the agency will begin the analysis needed to justify the proposed investment. This analysis is important to determine additional pieces of key information that are necessary to use in the business case development product.
Another next step for agencies is to consider the type of products that will best meet the needs of their stakeholders and decisionmakers. This consideration is important when determining how the structure and graphics of the business case products will look.
Making the Business Case for Traffic Incident Management.
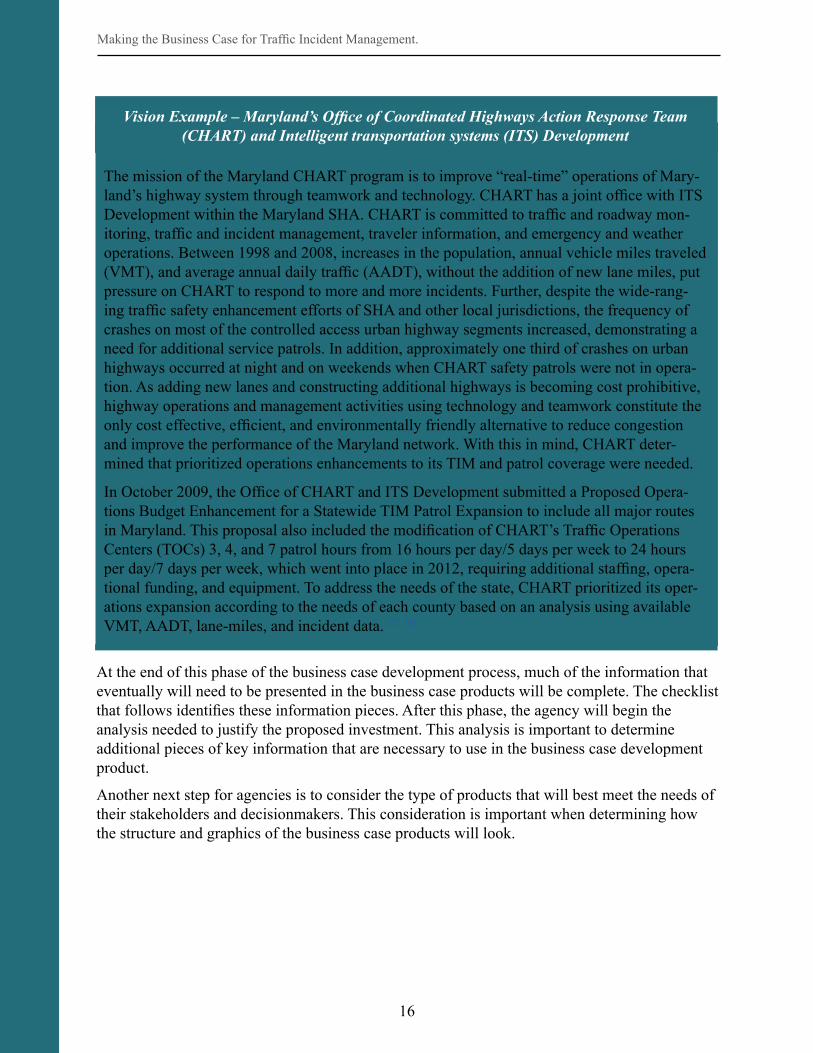
Vision Example – Maryland’s Office of Coordinated Highways Action Response Team (CHART) and Intelligent transportation systems (ITS) Development
The mission of the Maryland CHART program is to improve “real-time” operations of Mary-land’s highway system through teamwork and technology. CHART has a joint office with ITS Development within the Maryland SHA. CHART is committed to traffic and roadway mon-itoring, traffic and incident management, traveler information, and emergency and weather operations. Between 1998 and 2008, increases in the population, annual vehicle miles traveled (VMT), and average annual daily traffic (AADT), without the addition of new lane miles, put pressure on CHART to respond to more and more incidents. Further, despite the wide-rang-ing traffic safety enhancement efforts of SHA and other local jurisdictions, the frequency of crashes on most of the controlled access urban highway segments increased, demonstrating a need for additional service patrols. In addition, approximately one third of crashes on urban highways occurred at night and on weekends when CHART safety patrols were not in opera-tion. As adding new lanes and constructing additional highways is becoming cost prohibitive, highway operations and management activities using technology and teamwork constitute the only cost effective, efficient, and environmentally friendly alternative to reduce congestion and improve the performance of the Maryland network. With this in mind, CHART deter-mined that prioritized operations enhancements to its TIM and patrol coverage were needed.
In October 2009, the Office of CHART and ITS Development submitted a Proposed Opera-tions Budget Enhancement for a Statewide TIM Patrol Expansion to include all major routes in Maryland. This proposal also included the modification of CHART’s Traffic Operations Centers (TOCs) 3, 4, and 7 patrol hours from 16 hours per day/5 days per week to 24 hours per day/7 days per week, which went into place in 2012, requiring additional staffing, opera-tional funding, and equipment. To address the needs of the state, CHART prioritized its oper-ations expansion according to the needs of each county based on an analysis using available VMT, AADT, lane-miles, and incident data. [22, 23]

17
Making the Business Case for Traffic Incident Management.
Develop Vision Checklist:
At the end of the Develop Vision phase, the following questions have been answered:
Where are we now and where do we want to be?
What is the problem or business need?
What has triggered the need for change?
What is the proposed solution and what options were considered?
What are we trying to achieve (likely business outcomes)?
What is the strategic fit?
Who is the audience and the key stakeholders, and how can they be engaged?
How, when, and with whom should we share the business case?
ooooo
o
o
o
18
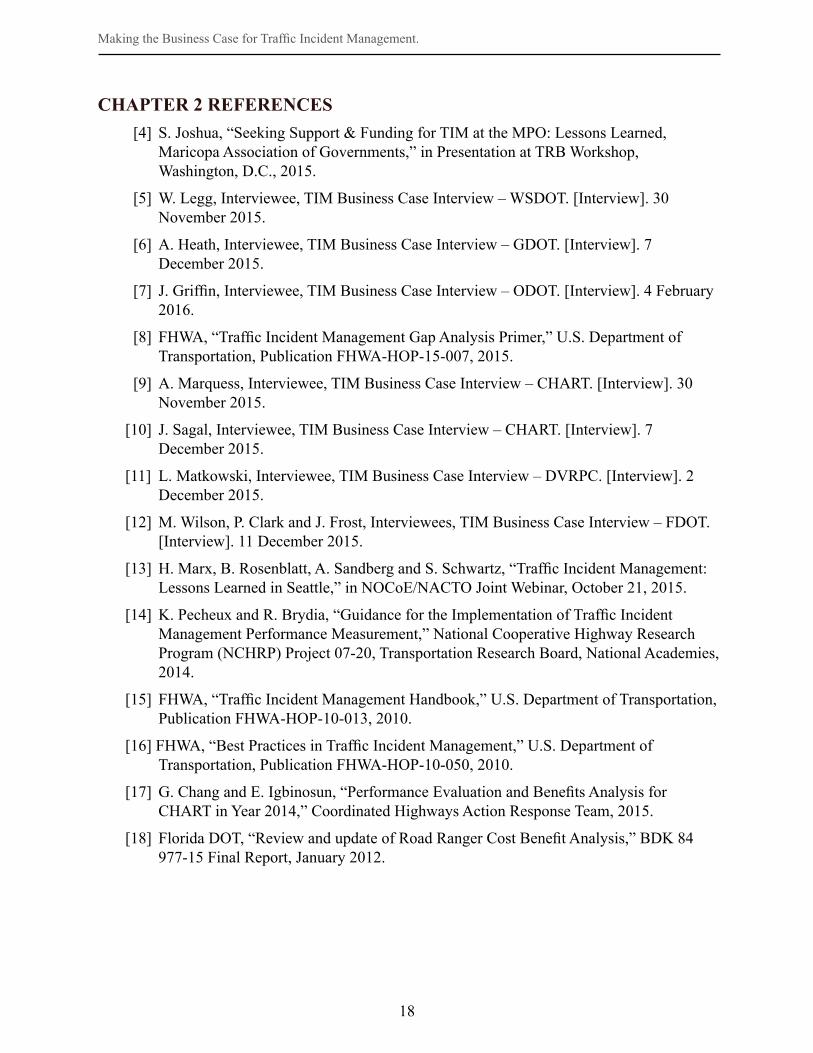
CHAPTER 2 REFERENCES[4] S. Joshua, “Seeking Support & Funding for TIM at the MPO: Lessons Learned,
Maricopa Association of Governments,” in Presentation at TRB Workshop, Washington, D.C., 2015.
[5] W. Legg, Interviewee, TIM Business Case Interview – WSDOT. [Interview]. 30 November 2015.
[6] A. Heath, Interviewee, TIM Business Case Interview – GDOT. [Interview]. 7 December 2015.
[7] J. Griffin, Interviewee, TIM Business Case Interview – ODOT. [Interview]. 4 February 2016.
[8] FHWA, “Traffic Incident Management Gap Analysis Primer,” U.S. Department of Transportation, Publication FHWA-HOP-15-007, 2015.
[9] A. Marquess, Interviewee, TIM Business Case Interview – CHART. [Interview]. 30 November 2015.
[10] J. Sagal, Interviewee, TIM Business Case Interview – CHART. [Interview]. 7 December 2015.
[11] L. Matkowski, Interviewee, TIM Business Case Interview – DVRPC. [Interview]. 2 December 2015.
[12] M. Wilson, P. Clark and J. Frost, Interviewees, TIM Business Case Interview – FDOT. [Interview]. 11 December 2015.
[13] H. Marx, B. Rosenblatt, A. Sandberg and S. Schwartz, “Traffic Incident Management: Lessons Learned in Seattle,” in NOCoE/NACTO Joint Webinar, October 21, 2015.
[14] K. Pecheux and R. Brydia, “Guidance for the Implementation of Traffic Incident Management Performance Measurement,” National Cooperative Highway Research Program (NCHRP) Project 07-20, Transportation Research Board, National Academies, 2014.
[15] FHWA, “Traffic Incident Management Handbook,” U.S. Department of Transportation, Publication FHWA-HOP-10-013, 2010.
[16] FHWA, “Best Practices in Traffic Incident Management,” U.S. Department of Transportation, Publication FHWA-HOP-10-050, 2010.
[17] G. Chang and E. Igbinosun, “Performance Evaluation and Benefits Analysis for CHART in Year 2014,” Coordinated Highways Action Response Team, 2015.
[18] Florida DOT, “Review and update of Road Ranger Cost Benefit Analysis,” BDK 84 977-15 Final Report, January 2012.
Making the Business Case for Traffic Incident Management.

19
[19] FHWA, “Focus State Initiative: Traffic Incident Management Performance Measures Final Report – Performance Measurement Presentation,” U.S. Department of Transportation Federal Highway Administration, Washington, D.C., 2010.
[20] FHWA, “Process for Establishing, Implementing, and Institutionalizing a TIM Performance Measures Program,” U.S. Department of Transportation, Publication FHWA-HOP-15-028, 2016 (anticipated).
[21] David Evans and Associates, “I-5 Rogue Valley Corridor Plan,” Oregon DOT, Roseburg, OR, 2011.
[22] CHART, “CHART Statewide Traffic Incident Management Patrol Expansion, Proposed Operations Budget Enhancement,” 2009.
[23] Maryland.gov, “Department of Transportation Coordinated Highways Action Response Team (CHARTWeb),” [Online]. Available: http://www.chart.state.md.us/. [Accessed 20 April 2016].
Making the Business Case for Traffic Incident Management.

20

21
The Develop Vision phase establishes the case and context for change. The Evaluate and Select phase identifies and pro-vides credence to the direction by which change is to be achieved. The evaluation determines which alternative offers the best value to the agency and to its stake-holders, within acceptable cost and risk. This phase typically requires the most resources and technical expertise. It begins with the development of evaluation criteria, in consultation with stakeholders, considering the five traditional goals of mobility, safety, efficiency, environment, and traveler satisfaction. It concludes with the recommendation of one alternative and well-formulated program plans with requirements, cost, schedule, performance, and benefit parameters for monitoring program exe-cution.
The output of the Evaluate and Select phase of the business case development process is a clear summary of findings and their alignment with business goals. The evaluation and selection should:
• Define the basis and criteria by which to evaluate option(s) – The basis for analysis of alternatives defines a common framework for comparison. The criteria for comparison of options may include cost, schedule, and expertise constraints. Conversely, the criteria may provide added weight to certain considerations. For example, if the legislative and agency focus is on mobility, then alternatives with a more significant mobility benefit may be higher valued compared to an alternative that provides greater agency efficiency. Instruction to establish a common basis and criteria is presented later in this chapter.
• Estimate traffic incident management (TIM) benefits for option(s) – The Guidance of Quantifying the Benefits of TIM lists five steps for a successful TIM benefits analysis and notes that “these steps, while ordered, may be recursive:
1. Define geographic and temporal scope. 2. Identify available data by type, cleanliness, and levels of aggregation. 3. Define analysis methods and tools based on former assessments, ensuring consistency. 4. Define a schedule allocating levels of effort to key activities. 5. Prepare an evaluation plan that summarizes 1-4, and implement.[24]
CHAPTER 3. EVALUATE AND SELECT
Making the Business Case for Traffic Incident Management.
Figure 4. Chart. Evaluate and select section of traffic incident management business case development process.
(Source: AEM Corporation.)

22
In the translation of these steps within the business case framework, defining geographic and temporal scope may either be conducted as a part of this phase or the vision phase. Steps 2-5 in this list define the activities to conduct the analysis.
• Estimate TIM costs for option(s) – Cost estimation is typically agency specific. Common cost delineation includes two areas: capital investment (costs associated with purchasing equipment and new facilities) and operations costs, often referred to as O&M (operations and maintenance). In considering alternatives, the cost for implementation (including but not limited to training, integration, and testing) should also be estimated and included. Cost estimates for alternatives should be presented for the same constant base year.
• Conduct comparative analysis and select preferred option – Within benefits and cost estimation a number of uncertainties exist. A risk assessment identifies uncertainties, addresses the degrees of the risks, and identifies mitigation strategies. Estimates of benefit and cost should be adjusted to account for risk. The potential facets of risk are presented later in this chapter along with how best to summarize findings of benefits and cost analyses.
DEFINE BASIS OPTIONS ANALYSIS AND EVALUATION CRITERIAThe Evaluate and Select phase of the business case development process starts with understand-ing the basis and criteria by which to evaluate options. Key considerations to ensure that the alternatives use a common basis for comparison include:
• Lifecycle or single year evaluation – A key question to consider when embarking on the evaluation is whether the benefits and cost analyses will focus on the lifecycle of the investment, or only on the costs and benefits of a single operating year. If the investment is for one-time costs, such as the acquisition of a vehicle fleet or a closed-circuit television (CCTV) system, the lifecycle estimate of cost and benefit is more appropriate. Conversely, if the investment is for TIM annual operating expenses, for example the annual costs of a freeway service patrol (FSP) program (e.g. maintaining the vehicle fleet, operator salaries, fuel costs), the single year analysis of benefit-cost is sufficient.
• Common year data – To the extent possible, be sure that analyses of alternatives use common periods for analysis with common operations data. Be sure to reconcile benefits and cost estimates to a common net present value (NPV) if alternatives have differing implementation timelines with benefit accrual in different years.
• Use agency-prescribed parameters – When estimating the benefits or costs for alternatives, be sure to adhere to agency-prescribed parameters. These include:
o The cost of fuel applied to estimate fuel savings from reduction in delay. This may include the base year and future fuel cost projections.
o The average cost for specific types of incidents with regard to property or personal injury.
o The passenger and commercial vehicle value of time.
Making the Business Case for Traffic Incident Management.

23
o Other parameters defined by the agency or the state may include demand projections and discount rates. The discount rate estimates future costs, because a dollar today has more value than a dollar in the future. When agency-prescribed parameters are not defined, defer to parameters set by the U.S. Department of Transportation (USDOT) or another Federal agency, such as the Office of Management and Budget (OMB) (discount rate guidance).
Beyond a common basis for analysis, evaluation criteria are needed to compare investment options. Evaluation criteria should be strategically and contextually relevant and defined by the organization in collaboration with relevant stakeholders and senior management. These criteria, along with the benefit-cost ratio (BCR), should be used to select the preferred alternative. The criteria development may be a multi-level process or completed in a single step, may be quantita-tive (e.g., potential to reduce incident duration by five minutes) or qualitative (e.g., high, medi-um, or low alignment with stakeholder need), and should include the following:
• Screening evaluation criteria – When considering a large set of options, first use screening evaluation criteria to eliminate options that are “deal breakers” – that is, options that do not adequately address specific achievability or affordability criteria or are not aligned with the strategic fit and business need. Strategic alignment of each option addresses how the objectives of the investment contribute to the directions and priorities identified in an organization’s mission, vision, goals, and short-term and long-range plans. For example, the Arizona Department of Transportation (ADOT) Strategic Plan outlines five strategic focus areas, as seen in Figure 5. Two of the strategic focus areas include “financial resources” and “innovation,” with key points focusing on “maximizing existing agency financial resources” and “identifying savings and efficiencies,” respectively. If these points reflect a constrained funding environment, proposed investment alternatives that require large costs may be “deal breakers.”
• Essential evaluation criteria – Essential evaluation criteria outline the minimum requirements of the proposed project/program with regard to costs (e.g., maximum cost), implementation (e.g., timeline, systems interoperability), risk, standards (e.g., communications/data standards), and data (e.g., ownership, sharing, security). Essential evaluation criteria should also include expected changes in performance and levels of efficiency as a result of the proposed investment. For TIM, expected changes in performance could relate to the incident timeline (i.e., reduced incident response and clearance times) and response efficiency (e.g., getting just the right resources to the incident).
Making the Business Case for Traffic Incident Management.

24
ESTIMATE TRAFFIC INCIDENT MANAGEMENT BENEFITSTIM benefits are realized by the transportation organization (e.g., department of transportation [DOT] and metropolitan planning organization [MPO]), partner organizations (e.g., state police, emergency medical services [EMS], fire and rescue, tow operators), user communities (e.g., freight and personal vehicle users, transit users, media outlets), and the public at large. Accordingly, when estimating the benefits associated with TIM investments, a wide perspective of stakeholders should be captured through quantitative, qualitative, or monetized benefits. Quantitative TIM benefits are derived from activities
Making the Business Case for Traffic Incident Management.
Traffic Incident Management (TIM) benefits can be categorized as
mobility, safety, efficiency, environment, and traveler satisfaction benefits.
Figure 5. Chart. Arizona Department of Transportation strategic focus areas.(Source: Arizona Department of Transportation.)

25
that promote quicker restoration of roadway capacity, more efficient deployment of resources in the response to incidents, and diversion of demand away from incidents. The benefits from these activities can be categorized as mobility, safety, efficiency, environment, and traveler satisfaction benefits.
In the following sections, data considerations for estimating benefits, tools, and techniques for quantifying benefits are highlighted. The methods and tools used to estimate TIM benefits should be in agreement with the scope of the proposed investment and the availability of data. The accuracy of any benefits estimates depends on the quality of the data and the proper use of statistical techniques to analyze the data.
For alternatives that are yet to be implemented, estimates of the expected performance are derived either from comparable local experience or from comparable national performance. In some cases, an agency may cite past performance as the basis for a proposed expansion alternative. When the Maryland Coordinated Highways Action Response Team (CHART) program proposed geographic and temporal expansion of its TIM Emergency Patrol program, the proposed operational budget enhancement cited past Emergency Patrol performance along with measured increases in vehicle miles traveled (VMT). [22] In the case of alternatives that focus on maintaining an existing investment, estimates of performance in the absence of alternatives may be derived from comparable parts of the network without TIM or from performance data prior to the implementation of TIM.
Data NeedsData are essential to making the business case for TIM. Without the data to demonstrate the value of their activities, TIM programs will struggle to maintain long-term, sustainable support and funding. A survey of State DOTs and MPOs in 2011 asked what kind of information or data would be helpful for them in “making the case” for TIM within their own agency. The general responses can be summarized as follows: [25]
• Reliable system-wide speed data. • Documented information/quantitative data related to the effects (e.g., decreased delay and congestion, improved safety) of TIM programs, including service patrols and traveler information. • Benefit/cost data. • Cost of secondary crashes. • Incident clearance and closure time data that can be integrated with control systems.
As part of National Cooperative Highway Research Program (NCHRP) Project 07-20: Guidance for Implementation of Traffic Incident Management Performance Measurement, a common database schema and data dictionary were developed to help guide agencies in collecting the required and desired data elements for consistent reporting of TIM performance. The data model contains 40
Making the Business Case for Traffic Incident Management.
The accuracy of any benefits esti-mates depends on the quality of the
data and the proper use of statistical techniques to analyze the data.
National Traffic Incident Management (TIM) Performance Measures
• Roadway clearance time. • Incident clearance time.• Secondary crashes.

26
data elements organized in eight different categories, including: incident timeline, details of incident, conditions at time of incident, roadway details, lanes involved, participants involved, and emergency responders and vehicles involved. The report and supporting documents are available for view and download on the Traffic Incident Management Performance Measurement (TIM PM) Web site at: http://nchrptimpm.timnetwork.org. [14] To assist agencies in determining what TIM data elements are available to them and from what sources, a comprehensive checklist of data elements by data source is provided in Appendix B of this document. This checklist is consistent with the NCHRP 07-20 database schema and data dictionary. [20]
While the only data elements required in the database schema are those needed to calculate the three national TIM performance measures, the more incident data elements available to a TIM program, the more the program can do in terms of understanding its performance and demonstrating the value of the program to others. Furthermore, these additional data elements, such as number and duration of lanes blocked, can also support the quantification of TIM benefits, including determining incident-induced congestion and queue lengths.
Data for TIM performance measurement and analysis generally come from advanced traffic management systems (ATMs), FSP programs, and law enforcement via the state crash report. Crowdsourced data providers such as Waze, INRIX®, and others can offer data that serves to notify agencies of incidents, often in advance of other reporting systems. These private data providers also offer data to accurately measure the duration and severity of delays associated with incidents. Integrated systems, statewide systems and databases (e.g., ATMS) to collect the specific data elements needed for TIM performance measurement greatly improve the quantity and quality of data available to agencies for analyses.
Traffic Incident Management Performance MeasuresMeasuring the performance of TIM activities is the first step in quantifying benefits and making the business case for a TIM program. If a TIM program does not measure and track its own performance, those who wish for it to continue will struggle to make the case for the program both internally within the agency and also externally to decisionmakers. Performance measures defined explicitly for TIM should reflect broader agency-wide or statewide goals related to increased productivity, cost-efficiency, and improved quality in the delivery of services. [26]
From a national perspective, the Federal Highway Administration (FHWA), with the input of 11 States through a Focus States Initiative, developed three national TIM performance measures: roadway clearance time (RCT), incident clearance time (ICT), and secondary crashes.[27] Beyond these national TIM performance measures, a number of other time-based performance measures include: incident detection time, incident verification time, incident response time, and the time to return to normal flow of traffic. Beyond the time-based performance measures, agencies use a wide variety of other measures to show performance and demonstrate value. Some of the most common performance measures include the following: average assist times, incident-related
Making the Business Case for Traffic Incident Management.
Other Traffic Incident Management (TIM) Performance Measures
• Incident detection time.• Incident verification time.• Incident response time.• Time to return to normal flow of traffic.• Incident related delay.• Incident related queue length.• Number of fatalities.• Public feedback.

27
delays, speeds, queue lengths, fatalities, and public feedback.
TIM agencies have found that tracking and reporting improvements in average clearance times is a powerful tool to communicate and inform their state legislatures and their customers. Some examples of ways that agencies have used TIM performance measures to improve perception and increase support of the program include:
• The Washington State Department of Transportation’s (WSDOT) quarterly Gray Notebook and annual Corridor Capacity Report provide data about its performance in several areas, including TIM. These publications are the primary tools used to report performance and demonstrate accountability. The data have been used to justify the increased expansion of the Incident Response (IR) program to the legislature. Since the IR program began in 1999, the program has been expanded three times and those decisions have been based on the data. [20] Appendix C provides an example from the 2015 Corridor Capacity Report.
• The Minnesota Department of Transportation (MnDOT) has found that having performance data is important to the continued financial support of its Freeway Incident Response Safety Team (FIRST) program.
• The Virginia Department of Transportation (VDOT) uses TIM performance information for a wide range of strategic and tactical decisions. The data have been beneficial when used during presentations to decisionmakers. The availability of hard data allows for faster buy-in when trying to build consensus and establish policies.
• One of the benefits the Wisconsin Department of Transportation (WisDOT) has realized from having TIM performance data is that it has helped them communicate both within the transportation management center (TMC) and as a bureau. The administration in Wisconsin is supportive of TIM efforts, and it has helped the Highways Division examine the TIM program and establish a new position within the department for TIM. [20]
• The Arizona Department of Public Service (AZDPS) used performance measures before and after a major policy revision that required police officers to move vehicles completely off the roadway (away from view) during incidents to determine if the policy influenced TIM performance. Table 1 compares the average RCT and ICT by injury severity for crashes that occurred prior to the policy change and four years later after the policy change. The significant decreases in average clearance times after the implementation of the policy for the non-injury and injury incidents suggested that the change was effective. The policy change did not have a positive effect on the severe and fatal crashes. [20]
Making the Business Case for Traffic Incident Management.
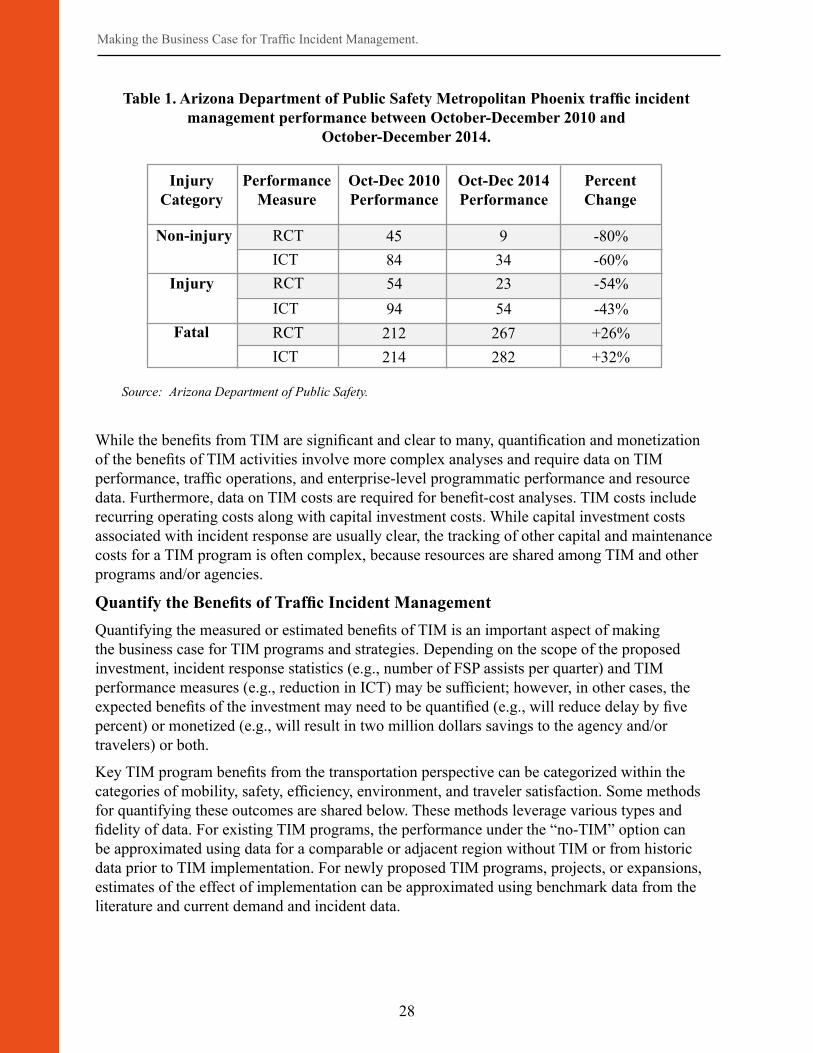
28
Table 1. Arizona Department of Public Safety Metropolitan Phoenix traffic incident management performance between October-December 2010 and
October-December 2014.
While the benefits from TIM are significant and clear to many, quantification and monetization of the benefits of TIM activities involve more complex analyses and require data on TIM performance, traffic operations, and enterprise-level programmatic performance and resource data. Furthermore, data on TIM costs are required for benefit-cost analyses. TIM costs include recurring operating costs along with capital investment costs. While capital investment costs associated with incident response are usually clear, the tracking of other capital and maintenance costs for a TIM program is often complex, because resources are shared among TIM and other programs and/or agencies.
Quantify the Benefits of Traffic Incident Management Quantifying the measured or estimated benefits of TIM is an important aspect of making the business case for TIM programs and strategies. Depending on the scope of the proposed investment, incident response statistics (e.g., number of FSP assists per quarter) and TIM performance measures (e.g., reduction in ICT) may be sufficient; however, in other cases, the expected benefits of the investment may need to be quantified (e.g., will reduce delay by five percent) or monetized (e.g., will result in two million dollars savings to the agency and/or travelers) or both.
Key TIM program benefits from the transportation perspective can be categorized within the categories of mobility, safety, efficiency, environment, and traveler satisfaction. Some methods for quantifying these outcomes are shared below. These methods leverage various types and fidelity of data. For existing TIM programs, the performance under the “no-TIM” option can be approximated using data for a comparable or adjacent region without TIM or from historic data prior to TIM implementation. For newly proposed TIM programs, projects, or expansions, estimates of the effect of implementation can be approximated using benchmark data from the literature and current demand and incident data.
Making the Business Case for Traffic Incident Management.
Source: Arizona Department of Public Safety.
InjuryCategory
PerformanceMeasure
Oct-Dec 2010 Performance
Oct-Dec 2014 Performance
Percent Change
Non-injury
Injury
Fatal
RCTICTRCTICTRCTICT
45845494
212214
9342354
267282
-80%-60%-54%-43%+26%+32%

29
Mobility Benefits of Traffic Incident Management
Mobility benefits of TIM programs include less travel delay and better travel time reliability. Reduced motorist delay is the most frequently cited mobility benefit associated with TIM. During incidents, roadway capacity is reduced, which results in queuing of traffic. By removing incidents more quickly, capacity can be reinstated, mitigating motorist delay.
Three primary approaches are used to derive estimates of the delay reduction associated with TIM programs/strategies:
• Empirical analyses – Empirical analyses of detailed incident and traffic flow data, including speed and volume, are data intensive but relatively straightforward.
• Simulation models – Simulation models can be used to estimate delay and reduction in delay for a shorter incident. This approach is far more complex but provides the analyst with the opportunity to model numerous scenarios that reflect different incident durations, locations, and severity. Analyses based on simulation include the following:
o Hoosier Helper Program – applied CORSIMTM to estimate delay. [28] o Georgia NaviGAtor System – applied CORSIMTM to estimate delay. o New Jersey Variable Message System – applied Rutgers Incident Management System (RIMS) cell transmission simulation to estimate delay. o Maricopa County Department of Transportation’s Regional Emergency Action Coordination Team (REACT) – applied CORSIMTM to estimate delay.
• Capacity reduction functions – The application of capacity reduction functions with incident duration and queuing theory requires far less data than the first two options but is also less precise.
o The Northern Virginia Freeway Service Patrol Evaluation (FSPE) model used capacity reduction factors in conjunction with the geometric and traffic characteristics of an FSP route, the frequency and type of assisted incidents on the route, and a deterministic queuing model to estimate delays.
o North Carolina’s Incident Management Assistance Patrols (IMAP) decision support tool for service expansion applied FREEVAL, which replicates freeway delay estimation from the Highway Capacity Manual.
The ideal data to comprehensively estimate the delay reduction from TIM would include the following incident-specific data:
• Time-dependent traffic volume and speed prior to, during, and subsequent to the incident both upstream and downstream of the incident. • Freeway capacity at the incident location. • Number and duration of lanes blocked. • Vehicle occupancy and the percentage of trucks in traffic.
With comprehensive incident-localized data, an empirical assessment can calculate the delay as measured in vehicle-hours. Typically, operations data will be segment-specific rather than incident-specific. More likely, segment-level traffic volume and capacity averages by morning peak, evening peak, off-peak, weekday, and weekends are applied to estimate delay. A loop
Making the Business Case for Traffic Incident Management.

30
detector system is the typical means for the collection of traffic speed and volume data. The processing and cleaning of these data are non-trivial, and care should be given to ensure data accuracy. For example, loop detector data processing can remove entries where speeds are zero. This rule is in place to exclude erroneous data; however, it may indeed exclude data related to incidents.
A 2012 FHWA publication titled, Analysis, Modeling, and Simulation for Traffic Incident Management Applications, presents the state-of-the-practice and state-of-the-art for estimating the effect of incidents on congestion, lists various simulation and mathematical techniques and specific software that can be applied to TIM, and discusses the challenges and limitations associated with the various techniques. [25]
A number of tools can be applied to estimate the reduction in delay from a reduction in incident duration, most notably the new FHWA TIM Benefit-Cost (TIM-BC) Tool, which estimates delay savings based on a regression model derived from simulation. [29] FREEVAL-RL also supports reliability-focused analysis. [30]
Safety Benefits of Traffic Incident Management
The safety benefits of TIM programs include fewer secondary crashes, fewer secondary crashes involving responders, and less risk exposure for responders. One of the three national TIM performance measures is secondary crashes. The reduction of secondary crashes also generates additional mobility benefits as well as the costs associated with the crashes. Secondary crashes can be measured/estimated through five methods:
• Assumed percentage of total incidents (e.g., 20 percent of all incidents are secondary in nature) – This approach is simple, but it is also the coarsest.
• Analysis of historical data using temporal and spatial parameters – The use of historical data to determine the number/percentage of secondary crashes through temporal and spatial parameters will provide a better estimate; however, if the temporal and spatial parameters are unnecessarily lax or constrained, the resulting estimates will be high or low, respectively.
• Regression-based filtering methods – The regression-based filtering method for estimating secondary crashes can account for characteristics such as the level of congestion and severity associated with incidents to more accurately estimate the percentage of incidents that are secondary.
• Responder reporting – Responder reporting requires significantly less effort but potentially at the expense of consistent reporting.
• Video monitoring and detection – Video detection requires the greatest level of effort but can ensure consistent measurement protocols. Video monitoring and detection, along with responder reporting, is the most accurate.
In the past, it was not common to measure the reduction of secondary crashes from TIM. The number or likelihood of secondary crashes has generally either been estimated as an overall
Making the Business Case for Traffic Incident Management.
Analysis, Modeling, and Simulation for Traffic Incident Management
Applications is a good reference for understanding the range of method-ologies for estimating the mobility
impacts of incidents.

31
percentage of total incidents or simply computed as a percentage of incident duration. [31, 32] More agencies, however, are beginning to collect data on secondary crashes, including many law enforcement agencies such as Arizona, Florida, and Tennessee.
AZDPS has been particularly active in the collection and analysis of both secondary crashes and, even more specifically, secondary crashes involving a law enforcement officer. Figures 6 and 7 compare the percentage of secondary crashes in Arizona (as collected by AZDPS troopers) during a three-year period from 2011 to 2013. The graph on the left shows the overall percentage of crashes that were secondary to a crash and secondary to an incident. In both cases, the occurrence of secondary crashes held steady over the three years. The graph on the right shows the percentage of secondary crashes involving a first responder and whether they were secondary to a crash or to an incident. This graph shows a reduction in secondary crashes involving a first responder over the three years (note the differences in the y-axis for the two graphs). Arizona attributes this reduction to an increase in training and awareness of its law enforcement officers regarding the importance of clearing crashes quickly. [33]
ADOT is conducting a study on reducing secondary crashes. [34] The objectives of the study are to:
• Use data to determine the impact of lane and incident clearance on secondary crashes. • Assess the potential for reducing secondary crashes and calculate the costs of secondary crashes.
Making the Business Case for Traffic Incident Management.
Figure 6. Chart. Comparison of secondary crashes involving a first
responder in Arizona from 2011-2013.
Figure 7. Chart. Comparison of secondary crashes involving non-
responders in Arizona from 2011-2013.
(Source: Arizona Department of Public Safety.)

32
• Quantify the benefits of reducing secondary crashes. • Identify enhanced TIM strategies.
The findings of this study will be beneficial to all members of the technical advisory committee in Arizona, including ADOT, AZDPS, FHWA, fire, EMS, towing, and law enforcement. The findings should also be beneficial to other agencies in making the business case for TIM strategies, particularly related to the safety benefits associated with TIM.
Efficiency Benefits of Traffic Incident Management
The estimation of the reduction in personnel and equipment costs for more efficient response requires raw counts for equipment as well as personnel details applied to incidents. For example, a study in Maricopa County, Arizona in 2002, through the creation of the REACT Evaluation, highlighted a reduction in police and fire personnel responding to long-duration incidents on arterials by 20 to 40 hours per week.[37] In addition, the Oregon Department of Transportation (ODOT) Region 3, District 8 Dedicated Incident Response Pilot Project demonstrated that the availability of one dedicated incident responder – instead of maintenance – to handle incident response could improve the efficiencies in scheduling and conducting maintenance activities. [7]
Environmental Benefits of Traffic Incident Management
The environmental benefits of TIM include less fuel consumption and emissions. Fuel consumption estimation requires measures of delay or speed along with vehicle composition. A number of tools can be used to estimate fuel consumption, including:
• Simulation and modeling based software, such as CORSIM, VisSim, PARAMICS, MOBILE6 Vehicle Emission Modeling Software, Motor Vehicle Emission Simulator (MOVES), and Intelligent Transportation Systems (ITS) Deployment Analysis System (IDAS). • The FSPE model, developed by the University of California, Berkeley. [35] • The use of functions relating delay savings by vehicle type to estimate fuel consumption based on average vehicle fuel efficiency rates (a simpler and coarser method).
Many of the same tools applied for fuel consumption also produce emissions impacts. [36] In addition:
• Typically, emissions estimates are developed purely as a function of delay. • The FHWA TIM-BC Tool provides environmental benefits specific to hydrocarbons, carbon oxides, and nitrous oxides. • Regression models based on CHART data and simulation analyses enable estimation of emissions as a function of hours of delay reduction from TIM. [32]
Traveler Satisfaction Benefits of Traffic Incident Management
The traveler satisfaction benefits include frequency and valuation of assistance to motorists, as well as customer satisfaction. The Georgia NaviGAtor program estimated a $2.995 million benefit from assistance to travelers from May 2003 to April 2004. [38] This is one of the few instances where the benefits to motorists from the assistance of an FSP were monetized. Most TIM programs capture these benefits through the following metrics:
Making the Business Case for Traffic Incident Management.

33
• The number of motorists that received assistance. • The service rating provided by motorists, typically through a comment card. • The minutes of roadside time saved by those assisted, typically through a comment card.
Some agencies hand out comment cards to drivers who are assisted by service patrols on the road. Feedback from the comment cards can be quantitative or qualitative, depending on the types of questions and responses. WSDOT must justify to the legislature how it has used the allocated funding for its IR program. WSDOT uses the data from benefit/cost analyses to justify their program, but it also uses quantitative and qualitative data from the comment cards. WSDOT receives thousands of responses every year. The responses are also shared with the rest of the traveling public as much as possible to improve the overall perception of value. Washington State’s legislature is very supportive of programs that the public sees as valuable.[5] The following text is typical language used by WSDOT to provide justification for additional funding: “By not funding the proposed Incident Response patrols, our ability to manage traffic congestion and maintain roadway capacity will stay at this reduced level. As traffic congestion due to collisions, disabled vehicles and population increase, travel times and delays will increase as well. This has a direct impact on the delivery of goods and services to the citizens and business of the state. [39]”
While quantitative data are persuasive, qualitative information is also often useful, especially with the general public and public officials. When established TIM programs develop requests for funding increases, they often make use of data to justify the additional costs, but they also typically use anecdotal information, such as written comments from the traveling public. A good story that includes poignant anecdotes from people who have benefited from TIM complements quantitative metrics and completes the business case.
TIM agencies are cautioned on how the traveler satisfaction benefit is presented. Some agencies may need to counter a perception that FSP supplants the role of a commercial towing or private road service provider using taxpayer dollars. In this situation, the focus should be maintained on enhancing the safety to those assisted as well to the traveling public by more quickly removing shoulder and mainline incidents to restore freeway capacity.
Monetize Traffic Incident Management Benefits and Compute Net Present ValueMonetization is the process of calculating financial values based on the quantified benefits/predicted benefits of TIM activities. In many cases monetization is as simple as multiplying the quantified benefit by a numerical dollar value. Below are some considerations and information on the selection of appropriate financial values to best monetize different TIM program benefits:
• Discount rates – Discount rates are used to estimate future costs, because a dollar today has more value than a dollar in the future. Official USDOT guidance suggests a 7 percent discount rate with a 3 percent discount rate for sensitivity analysis. The 7 percent rate is an estimate of the average before-tax rate of return to private capital in the U.S. economy. [40]
• Crash costs – Traffic crashes can impose various types of costs including property damage; medical and rehabilitation care; and lost productivity and disability due to compensation, pain, suffering and grief. Crash costs are typically based on the
Making the Business Case for Traffic Incident Management.

34
severity of injuries sustained by vehicle occupants, except in property damage only scenarios where the costs are derived solely on the property damage. In 2015, the National Highway Traffic Safety Administration (NHTSA) issued a revision to the 2010 document, The Economic and Societal Impact of Motor Vehicle Crashes. This document contains information on crash costs in great detail and is the primary source of crash-related monetization guidance. [41] A state agency may refine monetary values for crash types using the NHTSA document to reflect their specific crash categories. For example, the North Carolina Department of Transportation (NCDOT) outlines cost per crash based on severity of the crash and on seven types of crashes (frontal impact, lane departure, rear end, pedestrian, bicycle, pedestrian, train, and truck). [42]
• Time value for passenger vehicle occupants and trucks – USDOT guidance on valuation of travel time provides recommended values for travel time savings (shown in Table 2). USDOT guidance on valuation of travel time and the resource guide for Transportation Investment Generating Economic Recovery (TIGER) grant applications provides values for travel time savings for drivers of commercial vehicles, as shown in Table 3. [43] In a freight-hauling truck, the value is the freight, not the driver. In this case, the earning power of the truck is the correct measure of its time value. The current estimate of average revenue is $65 per hour but ranges from $15 to $105.67. [24]
Table 2. Recommended hourly values of travel time savings (2013 $ per person-hour).
Table 3. Recommended hourly values of travel time savings (2013 $ per person-hour).
• Occupancy ratios – Occupancy ratios are important in monetization because they describe the average number of occupants in a vehicle in different conditions. These values may be multiplied by the value of time for vehicle occupants in the corresponding condition.
Making the Business Case for Traffic Incident Management.
Type of Travel RecommendedHourly Value
Plausible Rangeof Hourly Values
Local TravelPersonal
Business
All Purposes
IntercityPersonal
Business
All Purposes
$12.50
$24.40
$13.00
$17.50
$24.40
$19.00
$8.70-$15.00
$19.50-$29.30
$9.20-$15.60
$15.00-$22.50
$19.50-$29.30
$16.00-$23.90
Type of Travel RecommendedHourly Value
Plausible Rangeof Hourly Values
Truck Drivers
Bus Drivers$25.80
$26.70
$20.70-$31.00
$21.30-$32.00

35
A reliable source for occupancy ratios is the National Household Travel Survey (NHTS), which provides values for average vehicle occupancy by trip purpose. [44] The NHTS does not directly report the all-non-work trip category, but it was calculated based on the share of different types of non-work trips.
• Air pollution costs – Pollution is an increasing concern for transportation agencies and system users. Research on the valuation of different components of pollution is ongoing, and values may change as new results and discoveries emerge from this research. The relative costs of certain pollutants are far greater than others. Likewise, the emissions of certain pollutants are far more than others per gallon of fuel use. USDOT issued the TIGER Benefit-Cost Analysis Resource Guide, providing values for emissions of certain air pollutants in 2013 dollars (shown in Table 4). The pollutants included in this table are volatile organic compounds (VOCs), nitric oxides and nitrogen dioxides (NOx), particulate matter (PM), and sulfur oxides (SOx). The valuations in this table account for the relative costs of each pollutant.[45] Studies have reported different values for CO2. Of the existing literature, the largest cost was found to be $220 per ton in a study performed by researchers at Stanford University. [46] The social cost of CO2 is an area of active study, and it is anticipated that further research will be published in the near future with additional guidance. A higher dollar value per ton would provide a more optimistic estimate of TIM benefits, and a lower dollar value per ton would yield a more conservative estimate of TIM benefits.
Table 4. Values for avoided air emissions in 2013 dollars.
• Fuel costs – Fuel consumption costs are typically defined and projected at the State or local levels and can be differentiated by auto and truck market share.
• Travel time reliability – Travel time reliability is important to transportation users but poses challenges for quantification and monetization. It is possible to measure the number of instances of delay as well as delay on specific facilities temporally, which reflects upon the travel time reliability of the facility. To monetize the value of travel time reliability is even less straightforward. Characteristics affecting the precise calculation of reliability include the thresholds at which a trip is outside of a reasonably expected direction, the value of time, the trip purpose, individual and demographic characteristics, mode, distance, and comfort. [43] Research in this field is ongoing, but indirect and user-specific methods are still primary in estimating the role and costs of travel time reliability.
Making the Business Case for Traffic Incident Management.
Pollutant Cost per Metric Ton Cost per Kilogram
VOCsNOX
SOX
PM
$1,999
$7,877
$360,383
$46,561
$2.00
$7.88
$360.38
$46.56

36
ESTIMATE TRAFFIC INCIDENT MANAGEMENT COSTSData on TIM costs are required for benefit-cost analyses; thus, TIM program and strategy costs should be tracked so that they are easily accessible and used in analyses. TIM costs include capital investment costs and recurring operating and maintenance costs. While capital investment costs associated with incident response are usually clear, tracking TIM operating and maintenance costs is often complex, because resources are often shared between TIM and other programs or agencies.
Depending on the vision and scope, the establishment or expansion of a TIM program can range from very little initial investments or direct costs to large initial investments or direct costs associated with the acquisition and deployment of equipment and the training and resourcing of personnel. For most programs, TIM costs are under the umbrella of larger agency operations budgets, which may include traffic management and traveler information systems. It can be challenging to isolate how much money is spent on TIM personnel and equipment agency-wide, which impedes the ability to make a solid argument for increasing allocations. [16]
Like overall TIM programs, the main cost components of an FSP program include capital, operations, maintenance, and administrative costs. These costs are simplified when the FSP is entirely contracted out and charged on a per truck-hour basis. The annual cost of an FSP depends on the number of centerline miles covered, hours of operations, and number of vehicles maintained. The hours of operation may range from 24 hours to peak service hours only, depending on congestion and budget. [18]
Table 5 provides examples of a range of TIM program costs from small FSP programs to comprehensive statewide TIM programs.
Making the Business Case for Traffic Incident Management.

37
Table 5. Range of costs for traffic incident management programs – small freeway service patrol programs to comprehensive statewide traffic incident management programs.
Making the Business Case for Traffic Incident Management.
Program Cost($)
Program Type Program Details/Description
Few hundred thousand dollars
Freeway Service Patrol
Annual cost of service patrols operating only during the peak hours, maintaining a low fleet of vehicles. [47]
$500,000 Heavy Tow Program
Annual cost of the Colorado Department of Transporta-tion’s Heavy Tow Program along the I-70 corridor between Denver and Vail. [15]
Few million dollars
Freeway Service Patrol
Annual costs of maintaining a service patrol fleet of more than 50 vehicles and providing 24-hour service (Chicago, DC, Oakland, and Orange County). [47]
$2.4 million Freeway Service Patrol
Annual costs associated with Hampton Roads, Virginia Safety Service Patrol. [48]
$9.5 million1 Comprehensive Statewide Incident Response Program
The WSDOT Incident Response Program required biennial spending. [5]
• Includes 6 TMCs, 58 trucks and the personnel that operate them, and regional supervisors and vehicles.
Additional $500,000 biennium to fund the information tech-nology (IT) office for all applications and software for IR and TMCs that are shared statewide.
$20 million dollars
Freeway Service Patrol
Annual cost of Metro freeway service patrol in Los An-geles, which maintains a fleet of 150 vehicles and covers about 650 center line miles. [47]
$29.115 million1
Comprehen-sive Statewide TIM Program
In its 2006 TIM Strategic Plan, the Florida Department of Transportation (FDOT) estimated costs to build its TIM pro-gram over a 3-year period. The estimates included. [49]
•$16,815,000 initial cost.• $12,299,500 for its continuing improvement, expansion, and sustenance for 3 years.
FDOT has continued to expand the Road Ranger program. In 2010, FDOT reported the annual costs of the Road Ranger program to be about $20 million.
$34-36 million1
Comprehen-sive Statewide TIM Program
Maryland CHART Program:• $20 million annual capital budget to fund infrastructure, devices, etc. • $12 million annual operating budget to fund incident response.• $2-4 million per year for IT (e.g., develop software). [50]
1Not necessarily annual costs. See Program Details/Description for cost breakdowns.

38
Figure 8 shows a more detailed breakdown of the estimated program costs from FDOT’s 2006 TIM Strategic Plan. The programs recommended in the TIM Strategic Plan ranged from no direct costs (e.g., policy changes) to substantial equipment costs (e.g., replacing Road Ranger vehicles).[49]
Figure 8. Estimated program costs in the Florida Department of Transportation’s 2006 Traffic Incident Management Strategic Plan.
(Source: Florida Department of Transportation.)
In 2009, CHART proposed an operations budget enhancement for the expansion of its FSP coverage area to include all major routes within Maryland and to modify the patrol hours for CHART’s traffic operations centers (TOC) 3, 4, and 7 from a 15-hour day, 5 days per week operation to a 24-hour day, 7 days per week operation. These changes went into place in 2012. In CHART’s proposal, costs were broken down by a number of component costs including personnel, equipment, annual operating expenses, and other costs. These costs are shown in Figure 9. [22]
Making the Business Case for Traffic Incident Management.

39
Figure 9. Coordinated Highways Action Response Team’s (CHART) proposed operations enhancement costs for Maryland.
(Source: Maryland Department of Transportation, Coordinated Highways Action Response Team.)
Making the Business Case for Traffic Incident Management.
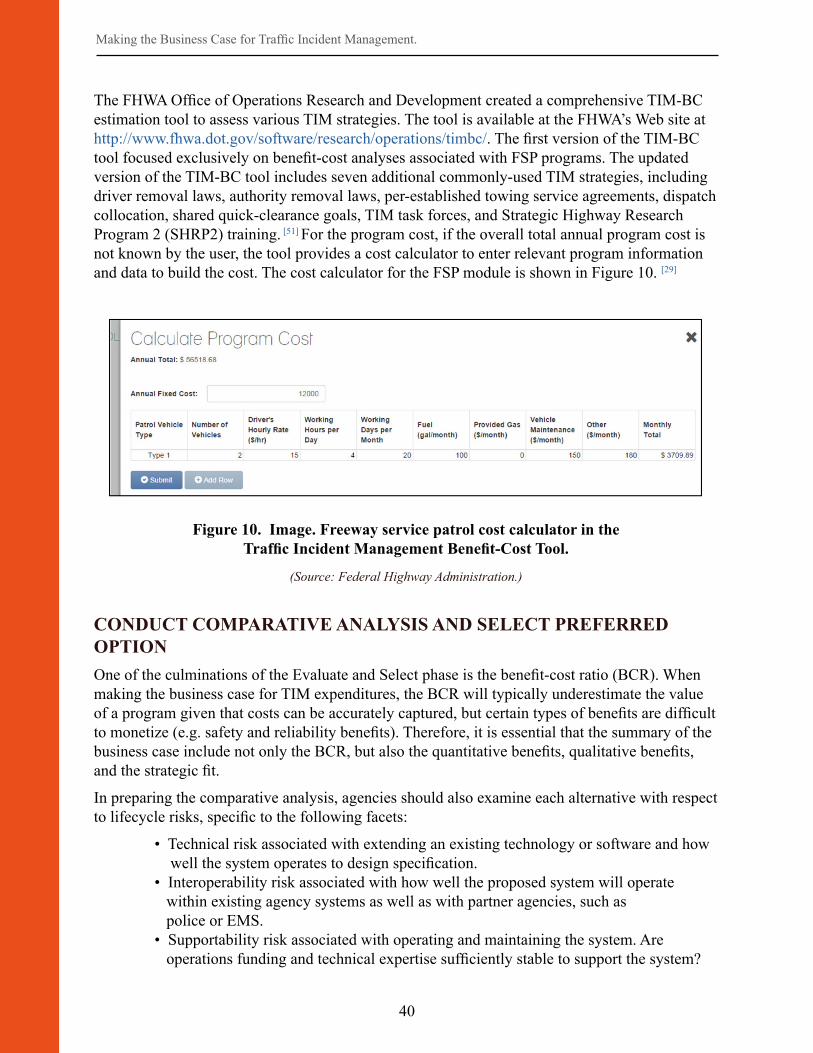
40
The FHWA Office of Operations Research and Development created a comprehensive TIM-BC estimation tool to assess various TIM strategies. The tool is available at the FHWA’s Web site at http://www.fhwa.dot.gov/software/research/operations/timbc/. The first version of the TIM-BC tool focused exclusively on benefit-cost analyses associated with FSP programs. The updated version of the TIM-BC tool includes seven additional commonly-used TIM strategies, including driver removal laws, authority removal laws, per-established towing service agreements, dispatch collocation, shared quick-clearance goals, TIM task forces, and Strategic Highway Research Program 2 (SHRP2) training. [51] For the program cost, if the overall total annual program cost is not known by the user, the tool provides a cost calculator to enter relevant program information and data to build the cost. The cost calculator for the FSP module is shown in Figure 10. [29]
Figure 10. Image. Freeway service patrol cost calculator in the Traffic Incident Management Benefit-Cost Tool.
(Source: Federal Highway Administration.)
CONDUCT COMPARATIVE ANALYSIS AND SELECT PREFERRED OPTIONOne of the culminations of the Evaluate and Select phase is the benefit-cost ratio (BCR). When making the business case for TIM expenditures, the BCR will typically underestimate the value of a program given that costs can be accurately captured, but certain types of benefits are difficult to monetize (e.g. safety and reliability benefits). Therefore, it is essential that the summary of the business case include not only the BCR, but also the quantitative benefits, qualitative benefits, and the strategic fit.
In preparing the comparative analysis, agencies should also examine each alternative with respect to lifecycle risks, specific to the following facets:
• Technical risk associated with extending an existing technology or software and how well the system operates to design specification. • Interoperability risk associated with how well the proposed system will operate within existing agency systems as well as with partner agencies, such as police or EMS. • Supportability risk associated with operating and maintaining the system. Are operations funding and technical expertise sufficiently stable to support the system?
Making the Business Case for Traffic Incident Management.

41
• Benefits estimation risk associated with uncertainty in assumptions and/or lack of data. How will benefits change if regional demand decreases or increases, or other assumptions are different than applied?
• Cost estimation risk considering accuracy of cost estimates and potential for cost overrun.
• Schedule risk considering the likelihood that the alternative will be deployed within the specified schedule.
Within the business case report and briefing, agencies should be sure to provide a comparative summary of all options and demonstrate the analytics and strategic basis for the preferred option compared to all others. The evaluation criteria outlined in the analysis should also be reused, along with new information discovered during the detailed analysis. The use of a summary table based on technical evaluation criteria, including alignment with organizational, opportunity, benchmarks, policy, risk, and strategic considerations is preferred. The report may also include return on investment (ROI), internal rate of return (IRR), net present value (NPV), or other benefit-cost computations as relevant to note the preferred option. A descriptive summary of the recommended option should also accompany the summary table.
The recommended option should then be further clarified, including the approach to implement with sufficient detail to instill confidence that the proposed investment has been appropriately considered, and that the presented estimates are within an acceptable degree of accuracy. The recommendation should be presented in a straightforward manner, clearly stating why the organization will benefit by focusing its investment on one particular option.
Making the Business Case for Traffic Incident Management.
Evaluate and Select Checklist:
At the end of the Evaluate and Select phase, the following questions have been answered/addressed:
What are the lifecycle benefits and non-monetized benefits of each viable option?
What are the lifecycle costs for each viable option?
How does each option align with business needs?
What are the technical, interoperability, schedule, benefits, and cost risks of the options?
What is the best option and how will we get there?
oooo
o

42
CHAPTER 3 REFERENCES[24] V. Shah et al., “NCHRP 03-108: Guidance on Quantifying Benefits of TIM Strategies,”
Transportation Research Board, Washington, DC, 2016 (working document).
[25] FHWA, “Analysis, Modeling, and Simulation for Traffic Incident Management Applications,” U.S. Department of Transportation, Publication FHWA-HOP-12-045, 2012.
[26] TransSafe Consulting, LLC and Sam Schwartz Engineering, DPC, “Traffic Incident Management in Seattle: Observations and Recommendations,” Seattle DOT and Seattle Police Department, Seattle, WA, 2015.
[27] FHWA, “Federal Highway Administration Focus States Initiative: Traffic Incident Management Performance Measures Final Report,” U.S. Department of Transportation, Publication FHWA-HOP-10-010, 2009.
[28] A. Guin, C. Porter and C. Holmes, “Benefits Analysis for Incident Management Program Integrated with ITS Operations: Case Study,” Transportation Research Record No. 2000, pp. 78-87., Washington, DC, 2007.
[29] FHWA, “User’s Manual for The Traffic Incident Management Benefit-Cost (TIM-BC) Tool (Version: 2.0),” Federal Highway Administration Research and Technology, September 2015. [Online]. Available: https://www.fhwa.dot.gov/publications/research/operations/16020/002.cfm.
[30] S. Sajjadi, S. Aghdashi, N. Rouphail, A. Hajbabaie and B. Schroeder, “FREEVAL-RL User Guide,” Institute for Transportation Research and Education of North Carolina State University, Raleigh, NC, 2013.
[31] A. Guin et al., “Benefits Analysis for the Georgia Department of Transportation NaviGAtor Program: Final Report,” Prepared by URS Corporation for the Georgia DOT, 2006.
[32] G. L. Chang and S. Rochon, “Performance Evaluation of CHART – Coordinated Highways Action Response Team – Year 2002,” University of Maryland, College Park and Maryland State Highway Administration, 2003.
[33] J. King, “Traffic Incident Management (TIM) Performance Measures Webinar,” in TIM Performance Measurements, USDOT T3 Webinar Series, https://www.pcb.its.dot.gov/t3/s140612/s140612_TIM_perf_measures_intro.asp, June 12, 2014.
[34] T. Lane, “Reducing Secondary Crashes,” in FHWA TIM Performance Measures Workshop, Las Vegas, NV, June 24, 2015.
[35] For more information on the FSPE Model and how to obtain it, please contact: Mr. Alexander Skabardonis, Professor & Research Engineer, Department of Civil & Environmental Engineering, Institute of Transportation Studies, University of California, 109 McLaughlin Hall, Berkeley CA 94720-1720, Phone: 510-642-9166.
[36] K. Ahn, “Microscopic Fuel Consumption and Emission Modeling,” Virginia Polytechnic Institute and State University, Blacksburg, VA, 1998.
Making the Business Case for Traffic Incident Management.

43
[37] Battelle Memorial Institute, “Regional Emergency Action Coordination Team (REACT) Evaluation,” Prepared for Maricopa County Department of Transportation, 2002.
[38] USDOT, “Georgia HERO Motorist Assistance Patrol Program,” ITS Knowledge Resources Benefits Database, Atlanta, GA, 2006.
[39] WSDOT, “Narrative Justification and Impact Statement for Incident Response,” Washington State Department of Transportation, 2013.
[40] OMB, “Circular No. A-94 Revised (Transmittal Memo No. 64),” Office of Management and Budget, Washington, DC, October 29, 1992.
[41] FHWA, “The Economic Impact of Motor Vehicle Crashes, 2000,” National Highway Traffic Safety Administration, Washington, DC, 2002.
[42] B. Robinson, “Memorandum to the North Carolina Department of Transportation: 2013 Standardized Crash Cost Estimates for North Carolina,” 10 November 2014. [Online]. Available: https://connect.ncdot.gov/resources/safety/Documents/Crash%20Data%20and%20Information/2013%20Crash%20Costs.pdf.
[43] USDOT, “Revised Departmental Guidance on Valuation of Travel Time in Economic Analysis (2015 Update),” Office of the Assistant Secretary for Transportation Policy, Washington, DC, 2015.
[44] “National Household Travel Survey: Understanding How People Get from Place to Place,” NHTS, [Online]. Available: http://nhts.ornl.gov/. [Accessed 2016 15 June].
[45] USDOT, “TIGER Benefit-Cost Analysis Resource Guide,” United States Department of Transportation, Washington, DC, Updated March 27, 2015.
[46] F. Moore, D. Diaz and K. Than, “Estimated Social Cost of Climate Change Too Low,” Stanford University, 12 January 2015. [Online]. Available: https://earth.stanford.edu/news/social-cost-climate-change-too-low. [Accessed 2015].
[47] L. Hagen, Z. Huaguo and H. Singh, “Road Ranger Benefit Cost Analysis,” Florida Department of Transportation, 2005.
[48] L. Dougald, “A Return on Investment Study of the Hampton Roads Safety Service Patrol Program,” Virginia Transportation Research Council, VTRC 07-R33, 2007.
[49] Florida DOT, “Florida Traffic Incident Management Program Strategic Plan,” Prepared by PB Farradyne, 2006.
[50] M. Zezeski, Interviewee, TIM Business Case Interview – CHART. [Interview]. 11 December 2015.
[51] FHWA, “Traffic Incident Management Benefit-Cost (TIM-BC) Tool,” Federal Highway Administration Research and Technology, 28 January 2016. [Online]. Available: https://www.fhwa.dot.gov/software/research/operations/timbc/. [Accessed 20 April 2016].
Making the Business Case for Traffic Incident Management.

44

45
The next important phase in developing a traffic incident management (TIM) business case is to formalize the proposed investment within the organizational structure and processes. Formalization involves activities that help to integrate TIM within and across organizations, prepare the TIM program or strategies for institutionalization, and identify potential funding sources for the program – in essence, activities that help to establish the TIM program as part of the fabric of the agency or agencies. More specifically, formalization should:
• Incorporate TIM into the planning process.• Establish/maintain relationships with TIM partners.• Involve and engage the community.• Work to improve the organization’s overall
TIM processes/capabilities.• Identify potential funding sources.
Because the business case development process is not necessarily a sequential process, formalization can begin at any time – the sooner the better. In addition, many of the formalization activities should be conducted on an on-going basis.
INCORPORATE TRAFFIC INCIDENT MANAGEMENT INTO THE PLANNING PROCESSOnce the vision, costs, and benefits associated with a TIM program, strategy, or group of strategies have been established, these outputs should be incorporated into various planning documents. Including TIM in the transportation planning process is a good business practice for departments of transportation (DOTs), their planning counterparts, and the regional TIM partners. The business case report in and of itself is not sufficient to make the business case. TIM programs need visibility, support, and funding opportunities; incorporating TIM into the planning process can help. In fact, in some cases, a program must be included in the planning process in order to access certain funding mechanisms. [8]
CHAPTER 4. FORMALIZE
Making the Business Case for Traffic Incident Management.
The Traffic Incident Management (TIM) business case development
process is not necessarily sequential. Formalization can begin at any
time – the sooner the better.
Figure 11. Chart. Formalize section of traffic incident management business case development process.
(Source: AEM Corporation.)

46
Some common ways that DOTs have successfully incorporated TIM into the planning process include:
• Develop a focused TIM strategic plan.
• Add TIM as an emphasis area or key strategy in planning documents such as the following:
o Strategic Highway Safety Plan (SHSP).o Statewide Transportation Improvement Program (STIP).o Transportation Improvement Program (TIP).o Congestion Management Plan.o Regional Transportation Safety Plan.o Metropolitan Transportation Plan.o Long range plan (LRP).
• Include TIM as a point of discussion when planning construction and maintenance projects.
A TIM strategic plan presents the vision, goals, objectives, strategies, performance measures, and action items for the program. The documentation of these important factors allows TIM to be more easily integrated into the broader agency transportation strategic plan. [52] Incorporating TIM into strategic planning helps to strengthen the support and funding for a TIM program, as well as make it more widely known as an important, lower-cost strategy proven to improve safety and mobility. [53]
A number of agencies have successfully incorporated TIM into their planning processes:
• In October 2011, the Oregon Department of Transportation (ODOT) developed the I-5 Rogue Valley Corridor Plan to assess the existing and future transportation conditions along 25 miles of I-5 in southwestern Oregon. The plan identified “high performance concepts” to improve safety and capacity along the corridor, one of which was deploying incident response (IR) vehicles to patrol I-5 during peak crash periods.[21] Having incorporated the importance of dedicated incident response into this plan helped drive the support for the Region 3, District 8 Dedicated IR Pilot Project. Requests for the pilot project had been denied for more than two years; however, the corridor plan gave the champion for the IR Pilot Project a reliable source to reference when seeking approval for the project, and it proved to be key in gaining this approval.[7]
• Maryland began incorporating TIM into the planning process by setting goals for various TIM performance measures, such as response times and travel time reliability, and incorporating them into the SHSP. Including TIM in the SHSP identified the Maryland Coordinated Highways Action Response Team (CHART) program as a priority, established a direction for the program, formalized goals toward which it could work, and helped to gain buy-in and support to improve TIM. [9] CHART was also well defined in the Maryland State Highway Administration’s (SHA) business
Making the Business Case for Traffic Incident Management.
Planning documents that reference Traffic Incident Management (TIM)
strategies or programs have proven to be key in obtaining buy-in for programs, as well as approval for
pilot projects and investments.
47
plan. The Maryland Department of Transportation (MDOT) merged and blended the offices of operations, maintenance, and planning, which provided staff in each group with familiarity of the activities of the other groups, such as equipment deployment, project prioritization, and data needs. According to an interview with a representative from CHART, “bringing all of these groups together to discuss incorporating TIM really helped fill gaps and improve internal coordination. [10]”
• The Delaware Valley Regional Planning Commission (DVRPC) includes TIM in the transportation improvement program, long range plan, and the transportation operations plan. The transportation operations plan is a subset of the LRP that focuses on more specific strategy recommendations for transportation system management and operations (TSM&O) activities, including TIM. While including TIM in the TIP and LRP does not guarantee funding, it shows that the board of directors and the entire region believe that it is important, and it ensures that TIM will be part of the funding discussion. [11]
• The Georgia Department of Transportation’s (GDOT) traffic operations group works closely with the planning group to ensure that TIM is included in the STIP. Although it does not guarantee funding, the process of partnering with the planning group does help to secure necessary funding for the TIM program. For all major project developments, TIM is considered early in the planning phase, and a working group is established to incorporate TIM into the project. Incorporating TIM on a daily basis through individual projects supports the growth of the overall TIM program. [6]
The incorporation of TIM into the planning process benefits all involved parties in some way. In the examples provided, on one hand, the DOT benefits by having a more holistic approach that includes aspects of planning for operations. On the other hand, planners benefit by adding a promising, lower cost strategy to show that progress is being made toward improving safety and mobility with the existing infrastructure. Additionally, incorporating TIM into the planning process provides elected officials, regional leaders, and the general public with increased visibility into the importance and benefits of the program, ideally resulting in increased levels of support and funding. Finally, the communications, collaboration, and data sharing necessary to incorporate TIM into the planning process can result in improved relationships with regional TIM partners, contributing to the overall success and viability of the program. [52, 53]
ESTABLISH/MAINTAIN RELATIONSHIPS WITH TRAFFIC INCIDENT MANAGEMENT PARTNERSTIM is good business for a community/region/state, and an effective TIM requires partnerships. Quick incident clearance, efficient movement of people and goods, and the safety of all road users are all community/regional/state efforts. Therefore, the development of a business case for TIM should also be a joint effort. There is strength in numbers; it demonstrates to leadership and decisionmakers that all partners are behind a proposed project and strengthens the business case
Making the Business Case for Traffic Incident Management.
Incorporating Traffic Incident Management (TIM) on a daily basis through individual projects supports
the growth of the overall TIM program.
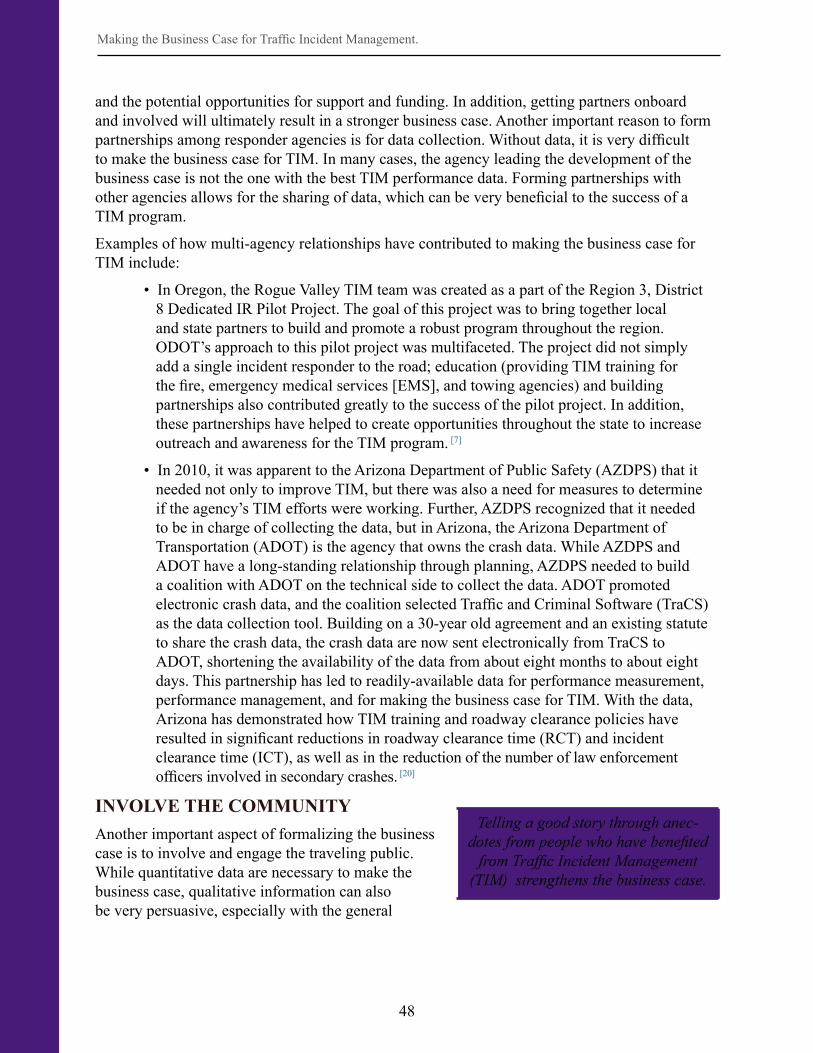
48
and the potential opportunities for support and funding. In addition, getting partners onboard and involved will ultimately result in a stronger business case. Another important reason to form partnerships among responder agencies is for data collection. Without data, it is very difficult to make the business case for TIM. In many cases, the agency leading the development of the business case is not the one with the best TIM performance data. Forming partnerships with other agencies allows for the sharing of data, which can be very beneficial to the success of a TIM program.
Examples of how multi-agency relationships have contributed to making the business case for TIM include:
• In Oregon, the Rogue Valley TIM team was created as a part of the Region 3, District 8 Dedicated IR Pilot Project. The goal of this project was to bring together local and state partners to build and promote a robust program throughout the region. ODOT’s approach to this pilot project was multifaceted. The project did not simply add a single incident responder to the road; education (providing TIM training for the fire, emergency medical services [EMS], and towing agencies) and building partnerships also contributed greatly to the success of the pilot project. In addition, these partnerships have helped to create opportunities throughout the state to increase outreach and awareness for the TIM program. [7]
• In 2010, it was apparent to the Arizona Department of Public Safety (AZDPS) that it needed not only to improve TIM, but there was also a need for measures to determine if the agency’s TIM efforts were working. Further, AZDPS recognized that it needed to be in charge of collecting the data, but in Arizona, the Arizona Department of Transportation (ADOT) is the agency that owns the crash data. While AZDPS and ADOT have a long-standing relationship through planning, AZDPS needed to build a coalition with ADOT on the technical side to collect the data. ADOT promoted electronic crash data, and the coalition selected Traffic and Criminal Software (TraCS) as the data collection tool. Building on a 30-year old agreement and an existing statute to share the crash data, the crash data are now sent electronically from TraCS to ADOT, shortening the availability of the data from about eight months to about eight days. This partnership has led to readily-available data for performance measurement, performance management, and for making the business case for TIM. With the data, Arizona has demonstrated how TIM training and roadway clearance policies have resulted in significant reductions in roadway clearance time (RCT) and incident clearance time (ICT), as well as in the reduction of the number of law enforcement officers involved in secondary crashes. [20]
INVOLVE THE COMMUNITYAnother important aspect of formalizing the business case is to involve and engage the traveling public. While quantitative data are necessary to make the business case, qualitative information can also be very persuasive, especially with the general
Making the Business Case for Traffic Incident Management.
Telling a good story through anec-dotes from people who have benefited
from Traffic Incident Management (TIM) strengthens the business case.

49
public and public officials. A good story that includes moving anecdotes from people who have benefited from TIM complements quantitative metrics to complete the business case. When TIM programs develop requests for funding increases, they must use data to justify the additional costs, but they also typically use anecdotal information, such as written comments and feedback from the traveling public. Strategies to involve and engage the community include public awareness programs, public information and outreach campaigns, public education, and training efforts. [49, 54, 55]
The Maryland CHART program provides a great example for successfully engaging the community and getting the public to embrace the program. The CHART program placed significant effort toward engaging the community and sharing information on the life-saving service that the program provides. As a result, the media uses CHART data for real-time reporting and newscasts, and public safety professionals rely on CHART as incident responders in their communities. With all the popularity that the program has with the public, if there were to be a decline in CHART’s ability to respond to incidents quickly, the public would likely voice their objections to decisionmakers. [10]
The ODOT Region 3, District 8 Dedicated IR Pilot Project essentially had two years to make the case for the dedicated responder, and the project champions approached the project from many different angles to ensure its success. One of the priorities was to conduct community events sponsored by the Rogue Valley TIM Team. The team conducted open houses to build relationships and partnerships with other TIM responder agencies and to provide outreach and education for the general public. The district used these relationships with partners and stakeholders to support its business case for the dedicated responder beyond the two-year pilot project.
WORK TO IMPROVE THE ORGANIZATION’S OVERALL TRAFFIC INCIDENT MANAGEMENT PROCESSES AND CAPABILITIES The Federal Highway Administration’s (FHWA) annual Traffic Incident Management Self-Assessment (TIM SA) provides a formal process for state and local transportation, public safety, and private sector partners to collaboratively assess their TIM programs and to identify opportunities to improve TIM processes and capabilities. FHWA facilitated the initial assessments in the largest 75 U.S. urban areas in 2003. Each year, the new assessments are compared against the baseline assessments and the previous year’s assessments. At a national level, the assessments enable FHWA to evaluate TIM progress and identify national TIM program initiatives. [56]
In addition, FHWA worked closely with the Transportation Research Board (TRB) and the American Association of State Highway and Transportation Officials (AASHTO) to develop a series of documents and tools to help transportation agencies identify what changes in processes and organization are needed to move their operations and management
Making the Business Case for Traffic Incident Management.
Expected Outcomes of Using the Capability Maturity Framework (CMF)
• Jumpstart the improvement process at a program-level.
• Provide justification for actions and program support.
• Improve consistency and collaboration between jurisdictions.
• Continued program improvement.

50
programs in the direction of improved effectiveness and efficiency. [8] A key element of this effort was developing the Capability Maturity Framework (CMF), which is based on self-evaluation of the key processes and institutional capabilities required from a transportation agency (or group of agencies) to achieve effective operations and management. [57] The term “maturity” relates to the degree of formality and optimization of the processes, from ad hoc practices to active optimization of processes. The methodology describes a four-level evolutionary path of increasingly organized and systematically more mature processes.
The TIM CMF is available as a web-based tool on the FHWA Office of Operations’ Web site (http://www.ops.fhwa.dot.gov/tsmoframeworktool/tool/traffic_mgmt/index.htm) and has been integrated with FHWA’s annual TIM SA. The CMF tool enables users to conduct the self-assessment, record the discussion and consensus building around each question, and identify and prioritize actions. The outcomes that can be expected from using the CMF tool include the ability to: [53]
• Jumpstart the improvement process at a program-level.
• Provide justification for actions and program support.
• Improve consistency and collaboration between jurisdictions.
• Continue program improvement.
The CMF complements and intersects the business case for a program, and completing the process will help prepare a TIM program to develop a strongly articulated business case.
IDENTIFY POTENTIAL FUNDING SOURCESIn order to establish, maintain, and improve TIM programs, adequate and ongoing resources to support operations are needed. Program administrators must not only understand the funding process at the Federal, state, and local levels, but they must also be able to identify specific sources of monetary support appropriate for TIM and successfully compete for these funds. It can be a significant challenge to obtain and maintain funding for TIM. To overcome this challenge, the benefits of the existing TIM investments or efforts must be marketed internally and externally. Additional funding cannot be viewed in isolation as a panacea to address TIM challenges; however, adequate funding can help to support incremental improvements in TIM efforts by providing program equipment, personnel, or further research. [16]
Traditional Funding SourcesOne important potential funding source for TIM programs is the Federal-Aid Highway Program under which Congress authorizes Federal funding to specific transportation categories, such as safety and congestion management. It is then up to the discretion of each state, in coordination with their partner metropolitan planning organizations (MPOs), to decide how the Federal-aid dollars are spent. The sources of Federal-aid funding that have been used to support TIM include: [16, 52]
Making the Business Case for Traffic Incident Management.
The Traffic Incident Management (TIM) Capability Maturity Frame-
work (CMF) complements and inter-sects the business case for a program.
Completing the process will help prepare a TIM program to develop a strongly articulated business case.

51
• National Highway System (NHS) Program.• Interstate Maintenance Program.• Surface Transportation Program (STP).• Congestion Mitigation and Air Quality (CMAQ) Program.• Research and Technology Innovation.• Highway Safety (402) Programs.• National Highway Performance Program (NHPP).• Metropolitan Planning Programs.
During the mid to late 1990s, much of the funding for intelligent transportation systems (ITS), advanced traffic management systems (ATMS), and other traveler information systems came from Federal sources, including congressional earmark funding for ITS infrastructure such as dynamic message signs (DMS), closed-circuit television (CCTV) cameras, and other equipment. For many TIM programs, including the Maryland CHART program, this era provided an opportunity to build-out the ITS infrastructure to support traffic and incident management and to capitalize on the program’s proven success over the preceding decade. More recently, however, Federal funding has become more difficult to obtain, and many States have found ways to fund their TIM programs using State funds.
Examples of how agencies have identified funding for their TIM programs include:
• CHART is funded with CMAQ and STP Federal-aid funding. Since the Statewide Operations Center (SOC) was constructed in 1995, the Office of CHART has worked closely with its local Federal-aid office to plan for and request the appropriate funding for the program. Because the CHART program is slated in the Maryland SHA business plan, it does not have to compete for funding each year and is not subject to district-level budget cuts. In addition, in 2000, CHART created an iterative six-year program plan for initiatives and programs, as well as a 20-year non-constrained deployment plan. The six-year program plan iterations only specifically designate funding for the first two years, but funding for the program is guaranteed during those years. [50] In addition, the University of Maryland supports the CHART program by tracking performance measures and conducting an annual benefit-cost analysis, and the results have helped contribute to the increase of funding for the CHART program in recent years. In 2014, the benefit-cost analysis showed that the $10 million investment in CHART operations could result in a reduction in delay of 36.3 million vehicle-hours, resulting in $1.26 billion of direct benefit savings. [17]
• Similarly, GDOT funds many of its operational efforts, including its TIM program in the Atlanta metropolitan area, through the Federal-aid programs. Georgia’s Highway Emergency Response Operators (HERO) program and the Traffic Incident Management Enhancement (TIME) Task Force are funded at 80 percent through Federal STP and CMAQ funds. GDOT
Making the Business Case for Traffic Incident Management.
Georgia Department of Transporta-tion’s (GDOT’s) Traffic Incident Man-agement (TIM) program works with
the planning group annually to incorporate TIM into the Statewide
Transportation Improvement Program (STIP) to make sure the program has
funding for the following year.

52
provides a 20 percent State motor fuel match. All the Federal-aid funding flows through the STIP and requires a match. GDOT receives about $1.2 billion in Federal funding and match each year. GDOT’s TIM program works with the planning group annually to incorporate TIM into the STIP to make sure the program has funding for the following year.
• The TIM program in Florida began through the funding of one specific project – expanding a major highway – and has since evolved into the comprehensive statewide program it is today. The TIM program is funded only from State funds as part of the Florida Department of Transportation’s (FDOT) Five Year Work Program, which includes all projects that have been approved for funding in the upcoming five years. In the past, when funding was short, the legislature continued to provide funding for TIM but capped the amount to be spent. More recently, as FDOT has shown many statistics and strong justification for the value of the program, the legislature designated a minimum amount that must be spent on the program. [12] FDOT receives a lot of support from the legislature and receives money to fund the TIM team, the Rapid Incident Scene Clearance (RISC) program, as well as other components of the TIM program. As a result, FDOT plans to deploy ITS equipment statewide by 2017. FDOT is also working to expand the Road Ranger program due to a new demand area on I-95. The University of Florida is developing a needs analysis that will result in a methodology that uses actual data to help determine where to expand and when. [12]
• The Washington State Department of Transportation (WSDOT) also uses only State funds for its IR program. WSDOT is required to make the case to the State legislature regarding how the funding for the program is used. In the early days when WSDOT was getting started with IR, it used Federal funding (e.g., earmarks, grants) for testing and initial demonstrations. This funding was helpful when WSDOT needed to determine if certain approaches or technologies made a difference. For example, the Washington State legislature provided $346,000 in 2007 to fund a 2-year pilot program to implement an incentive program to expedite the clearance of heavy-truck collisions. The program was designed to target the most challenging heavy-truck collisions. It was funded for approximately 40 activations a year and remains funded to date. [58]
Because freeway service patrol (FSP) programs are able to operate in a more stand-alone fashion, they are often included as separate line items in State or local budgets and may draw from multiple funding sources. Funding for service patrol programs can come from fuel taxes, fees from departments of motor vehicles, and/or a percentage of State or local sales taxes. When States choose to use Federal funding for service patrol programs, it generally comes from CMAQ funds, construction funds, or highway safety funds. In some cases, the funding is sponsored by private agencies. [47] For example, in Georgia, State Farm Insurance provides sponsorship with partial funding of the program through logos placed on the HERO trucks. [16]
In several areas of the country, service patrol programs are jointly funded by the State transportation agency and the MPOs. In other areas, State patrol agencies have assumed the dispatching and administrative costs associated with the program. These cost-sharing arrangements divide the costs amo- ng agencies that also benefit from the program. [59]
Making the Business Case for Traffic Incident Management.
Cost-sharing is a good business practice because it reduces a partic-ular agency’s resource requirements.

53
Cost-sharing is a good business practice because it reduces a particular agency’s resource requirements. [15]
Some State DOTs use contractors to operate their service patrol programs. FDOT’s Road Ranger program is one example. The State-funded contracts are competed every five years in each region except Orlando. In Orlando, the MPO provides the services through its own contract and the large Value Pricing Pilot Program (VPPP) projects, where the Road Rangers are incorporated into the specific projects. [12]
One way to prevent cutbacks or elimination of a service patrol program is to develop a public-private partnership between the transportation agency and an appropriate private sector partner. Several State agencies have authority granted under State statute to enter into contract or license agreements for the sale of business opportunities to provide additional revenue to the agency. These States use this authority to supplement the costs of operating a service patrol program. By carefully choosing sponsors with a strong commitment to highway safety and customer service, the transportation agencies are able to maintain the highest level of integrity. One example is the agreement between the Pennsylvania Turnpike and the State Farm Safety Patrol program. [59]
New Potential Funding Sources – The Fixing America’s Surface Transportation ActThe Fixing America’s Surface Transportation (FAST) Act, signed on December 4, 2015, is “…five-year legislation to improve the Nation’s surface transportation infrastructure, including our roads, bridges, transit systems, and rail transportation network. The bill reforms and strengthens transportation programs, refocuses on national priorities, provides long-term certainty and more flexibility for States and local governments, streamlines project approval processes, and maintains a strong commitment to safety. [60]”
SEC. 6004 of the FAST Act amends Section 503(c) of title 23, United States Code by adding “Advanced Transportation and Congestion Management Technologies Deployment.” In general, this addition provides that the Secretary of Transportation shall establish an advanced transportation and congestion management technologies deployment initiative to provide grants to eligible entities to develop model deployment sites for large scale installation and operation of advanced transportation technologies to improve safety, efficiency, system performance, and infrastructure return on investment. Criteria for selection of an eligible entity to receive a grant under this paragraph include (but are not limited to) the following:
• Reduce costs and improve return on investments, including through the enhanced use ofexisting transportation capacity.
• Deliver environmental benefits that alleviate congestion and streamline traffic flow.• Measure and improve the operational performance of the applicable transportation
network.• Reduce the number and severity of traffic crashes and increase driver, passenger, and
pedestrian safety.
Making the Business Case for Traffic Incident Management.
One way to prevent cutbacks for a service patrol program is to develop
a public-private partnership.
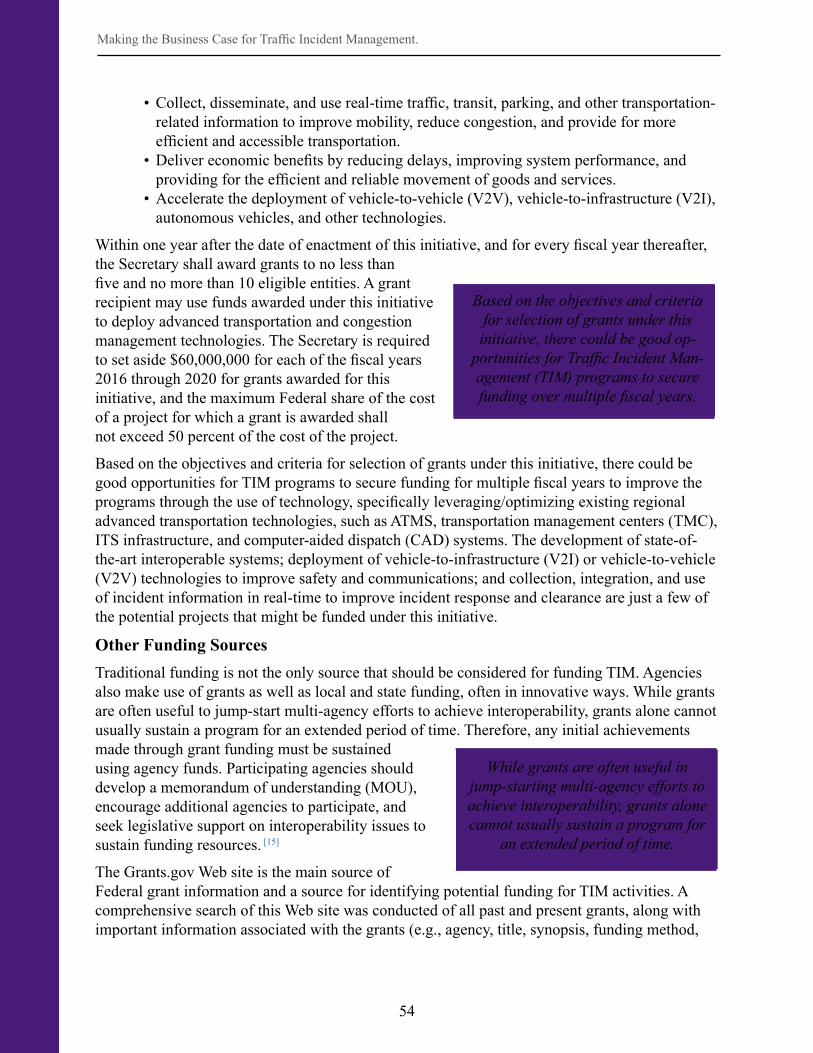
54
• Collect, disseminate, and use real-time traffic, transit, parking, and other transportation-related information to improve mobility, reduce congestion, and provide for more efficient and accessible transportation.
• Deliver economic benefits by reducing delays, improving system performance, and providing for the efficient and reliable movement of goods and services.
• Accelerate the deployment of vehicle-to-vehicle (V2V), vehicle-to-infrastructure (V2I), autonomous vehicles, and other technologies.
Within one year after the date of enactment of this initiative, and for every fiscal year thereafter, the Secretary shall award grants to no less than five and no more than 10 eligible entities. A grant recipient may use funds awarded under this initiative to deploy advanced transportation and congestion management technologies. The Secretary is required to set aside $60,000,000 for each of the fiscal years 2016 through 2020 for grants awarded for this initiative, and the maximum Federal share of the cost of a project for which a grant is awarded shall not exceed 50 percent of the cost of the project.
Based on the objectives and criteria for selection of grants under this initiative, there could be good opportunities for TIM programs to secure funding for multiple fiscal years to improve the programs through the use of technology, specifically leveraging/optimizing existing regional advanced transportation technologies, such as ATMS, transportation management centers (TMC), ITS infrastructure, and computer-aided dispatch (CAD) systems. The development of state-of-the-art interoperable systems; deployment of vehicle-to-infrastructure (V2I) or vehicle-to-vehicle (V2V) technologies to improve safety and communications; and collection, integration, and use of incident information in real-time to improve incident response and clearance are just a few of the potential projects that might be funded under this initiative.
Other Funding SourcesTraditional funding is not the only source that should be considered for funding TIM. Agencies also make use of grants as well as local and state funding, often in innovative ways. While grants are often useful to jump-start multi-agency efforts to achieve interoperability, grants alone cannot usually sustain a program for an extended period of time. Therefore, any initial achievements made through grant funding must be sustained using agency funds. Participating agencies should develop a memorandum of understanding (MOU), encourage additional agencies to participate, and seek legislative support on interoperability issues to sustain funding resources. [15]
The Grants.gov Web site is the main source of Federal grant information and a source for identifying potential funding for TIM activities. A comprehensive search of this Web site was conducted of all past and present grants, along with important information associated with the grants (e.g., agency, title, synopsis, funding method,
Making the Business Case for Traffic Incident Management.
While grants are often useful in jump-starting multi-agency efforts to achieve interoperability, grants alone cannot usually sustain a program for
an extended period of time.
Based on the objectives and criteria for selection of grants under this initiative, there could be good op-
portunities for Traffic Incident Man-agement (TIM) programs to secure funding over multiple fiscal years.

55
date, amount, and grant identification number). In all, data on 34,208 grants dating back to 2007 were reviewed with a search and query tool and a list of pertinent terms. As a result, 174 potential funding opportunities were identified and reviewed. Based on this review only seven grants were identified as possible sources of funding for some TIM activity.
Of the seven identified grants, the majority were funded by FHWA, but other grants were also identified through National Highway Traffic Safety Administration (NHTSA), Federal Motor Carrier Safety Administration (FMCSA), National Institute of Justice (NIJ), and Federal Emergency Management Agency (FEMA). The grants covered various topics that were either directly related to TIM – research and development to reduce the number of law enforcement officers killed at traffic incidents and assisting local EMS systems – or that could potentially be related to TIM – to enhance advancing technology systems, promote highway safety plans, and deploy integrated corridor management (ICM). These grants also had a wide variety of award ceilings – from $115,000 for individual projects to $6,800,000 for a full program operation. It should be noted that none of these grants would likely provide continuous funding to a TIM program.
An increased awareness of funding opportunities coupled with creativity can serve to maximize potential investments. A major mindset shift is necessary to move from one-time funding for capital projects to ongoing funding for critical operations. A need exists to better inform elected leaders at MPOs on the value to look outside the traditional silos when developing multi-agency initiatives such as TIM. The current funding and organizational structures have created many barriers to progress. MPOs can play a critical role to help advance TSM&O solutions in urban areas. Selling the benefits of TSM&O to MPO boards requires much preparation and patience. [4]
Cranberry Township, a suburban Pittsburgh community, provides a good example of leveraging a variety of local funding sources for its TIM program. The sources that have been used include local taxation, the Municipal Pension Plan and Funding Standard and Recovery Act (for volunteer fire companies), Pennsylvania State Fire Commissioners Grant (yearly up to $15,000), and public support (e.g., fund raisers). [61]
Another unique example is in California, where service patrols are supported with combined Federal, state, and local funds, with local funds originating from a one-dollar annual vehicle registration fee in participating counties and are contracted out by the regional MPO. [16] In the San Francisco Bay area, a one-dollar per year fee on motor vehicle registrations for the participating nine counties is collected by the California Department of Motor Vehicles (DMV) and then transferred to the Metropolitan Transportation Commission Service Authority for Freeways and Expressways (MTC SAFE) program. While the program only initially included a service patrol and a call box program, MTC SAFE was expanded to include a comprehensive Incident Management Program & Traveler Information System. [62] Similarly, funding for the Metro Freeway Service Patrol Big Rig Tow Service comes from the Los Angeles Service Authority for Freeway Emergencies (LA SAFE) annual one-dollar vehicle registration surcharge assessed on each vehicle registered in LA County. [63]
Making the Business Case for Traffic Incident Management.
A major shift of mindset is necessary from one-time funding for capital projects to ongoing funding for
critical operations.

56
Making the Business Case for Traffic Incident Management.
Funding Sources Example – Delaware Valley Regional Planning Commission (DVRPC)
The DVRPC is the designated Metropolitan planning organization (MPO) for the nine-county metropolitan region that includes four counties and the City of Philadelphia in Pennsylvania and four counties in New Jersey. DVRPC administers Traffic Incident Management (TIM) for the region, supports eight corridor-based TIM task forces, and serves as the regional clear-inghouse for incident management activities. [64] Funded through the United Public Works Pro-gram, DVRPC’s Office of Transportation Operations Management provides dedicated funding to support staff committed to managing the TIM task forces. DVRPC also receives funding through the Transportation Improvement Program, direct Federal funding that provides a three-year funding commitment. This funding is used to help fund the service patrol program and the traffic operations center. While funding for administering the region’s TIM program is generally not an issue, DVRPC (and the regional responder organizations) do struggle to find funding to conduct TIM train-the-trainer sessions. [65]
Formalize Checklist:
At the end of the Formalize phase, the following questions have been answered/addressed:
How and when will the change be incorporated into the planning process?
How and when will the appropriate internal and external stakeholders be engaged?
How and when will the traveling public be engaged?
How and when will approaches to improving TIM processes and capabilities be implemented?
What potential funding sources have been identified?
oooo
o

57
CHAPTER 4 REFERENCES[52] FHWA, “Making the Connection: Advancing Traffic Incident Management in
Transportation Planning – A Primer,” U.S. Department of Transportation, Publication FHWA-HOP-13-044, 2013.
[53] W. Berman, “Business Process Management Capability Maturity Frameworks – Overview,” in Presentation at TRB Workshop, Washington, DC, 2015.
[54] Connecticut DOT, “Connecticut Strategic Highway Safety Plan,” 2010, Revised 2013.
[55] Arizona DOT, “Toward Zero Deaths by Reducing Crashes for a Safer Arizona – Arizona 2014 Strategic Highway Safety Plan,” 2014.
[56] FHWA, “Traffic Incident Management Self Assessment,” [Online]. Available: http://ops.fhwa.dot.gov/eto_tim_pse/preparedness/tim/self.htm. [Accessed 25 October 2015].
[57] AASHTO, “Transportation Systems Management & Operations Guidance,” American Association of State Highway and Transportation Officials, Washington D.C., 2014.
[58] WSDOT, “Proposal to Expand Major Incident Tow Program (MIT) Coverage – Executive Summary,” Washington State Department of Transportation, 2008.
[59] FHWA, “Freeway Safety Service/Motorist Assistance Patrol Sponsorship Programs Memorandum,” 23 April 2008. [Online]. Available: http://ops.fhwa.dot.gov/regulationpolicy/fmpmemo/index.htm. [Accessed 20 October 2015].
[60] Transportation Infrastructure Committee, “Fixing America’s Surface Transportation (FAST) Act,” U.S. House of Representatives, December 2015. [Online]. Available: http://transportation.house.gov/fast-act/.
[61] J. Schueler, “Leveraging Local Funding Sources – A Webinar Exploring Local Funding Options to Support TIM Practitioners – Cranberry Township Pennsylvania,” Presentation for TIM Network Webinar, 2015.
[62] R. Victor, “MTC’s Role in Traffic Incident Management, Washington D.C. – Regional Traffic Incident Management and Transportation Planning: Creating Crucial Connections, Part 1, Successful Approaches Used by MPOs to Include TIM in Planning,” Transportation Research Board 94th Annual Meeting, 2015.
[63] Los Angeles County Metropolitan Transit Authority, “Los Angeles Meets the Future,” Metro Quarterly, vol. Winter 2007, 2007.
[64] WSDOT, “Corridor Capacity Report,” Washington State Department of Transportation, 2015.
[65] DVRPC, “Traffic Incident Management in the DVRPC Region,” [Online]. Available: http://www.dvrpc.org/Transportation/TSMO/IncidentManagement/. [Accessed December 2015].
Making the Business Case for Traffic Incident Management.

58
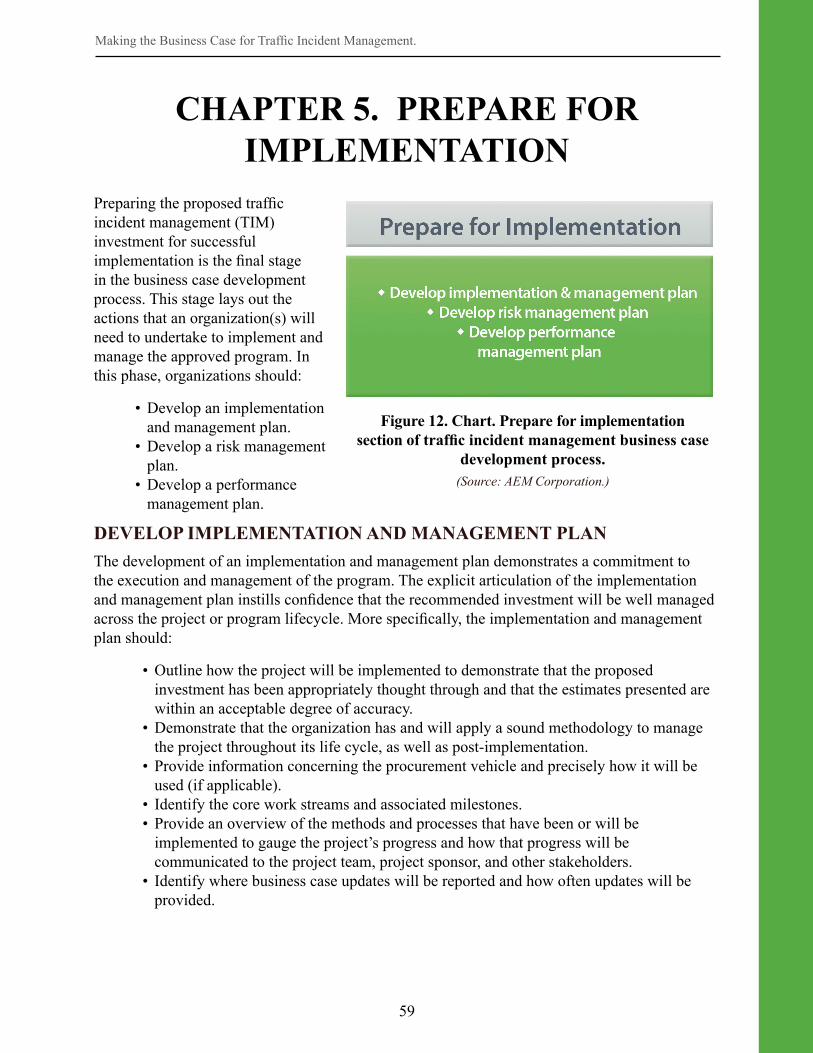
59
Preparing the proposed traffic incident management (TIM) investment for successful implementation is the final stage in the business case development process. This stage lays out the actions that an organization(s) will need to undertake to implement and manage the approved program. In this phase, organizations should:
• Develop an implementation and management plan.
• Develop a risk management plan.
• Develop a performance management plan.
DEVELOP IMPLEMENTATION AND MANAGEMENT PLANThe development of an implementation and management plan demonstrates a commitment to the execution and management of the program. The explicit articulation of the implementation and management plan instills confidence that the recommended investment will be well managed across the project or program lifecycle. More specifically, the implementation and management plan should:
• Outline how the project will be implemented to demonstrate that the proposed investment has been appropriately thought through and that the estimates presented are within an acceptable degree of accuracy.
• Demonstrate that the organization has and will apply a sound methodology to manage the project throughout its life cycle, as well as post-implementation.
• Provide information concerning the procurement vehicle and precisely how it will be used (if applicable).
• Identify the core work streams and associated milestones.• Provide an overview of the methods and processes that have been or will be
implemented to gauge the project’s progress and how that progress will be communicated to the project team, project sponsor, and other stakeholders.
• Identify where business case updates will be reported and how often updates will be provided.
CHAPTER 5. PREPARE FOR IMPLEMENTATION
Making the Business Case for Traffic Incident Management.
Figure 12. Chart. Prepare for implementation section of traffic incident management business case
development process.(Source: AEM Corporation.)

60
Prepare for Implementation Checklist:
At the end of the Prepare for Implementation phase, the following questions have been answered/addressed:
How will the project be implemented?
How will the project be managed and reviewed throughout its lifecycle?
What are the business risks and how will they be mitigated and managed?
How will the performance of the investment be measured?
How will the business outcomes be realized?
oooo
o
DEVELOP RISK MANAGEMENT PLANRisk management is critical to the success of any project and must be developed during the planning stages of the project management process. A risk management plan should provide a summary of the risks associated with the project/program, demonstrate that the organization has a function in place to manage the risks, and describe how the risks will be monitored and managed. More specifically, the risk management plan should:
• Identify the risks related to the proposed investment. • Describe the attributes of each risk.• Describe the methodology used to conduct the risk assessment.• Present the results of the risk assessment activities (e.g., probability of occurrence,
potential impact).• Identify risk mitigation strategies and the methodology to track, control, and
communicate risk mitigation efforts (e.g., risk register).
The project manager should seek input from team members as well as stakeholders and possibly even end users. A risk register or risk log becomes essential as it records identified risks, their severity, and the actions or steps that need to be taken. It can be a simple document, table, spreadsheet, or a database system.
DEVELOP PERFORMANCE MANAGEMENT PLANDeveloping a performance management plan will demonstrate transparency and accountability for the project. The performance management plan addresses how the success of the proposed investment will be measured. The performance management plan should include the following:
• Key performance measures/indicators.• Performance goals/targets.• Data and analyses to be used to measure performance.• Methods in which performance will be presented and documented.• Points in time at which performance will be measured and reported to management and
stakeholders.• Actions that will be taken if performance goals/targets are not being met.• Criteria for project success.
Making the Business Case for Traffic Incident Management.

61
CHAPTER 6. SUMMARY AND CONCLUSION
Making the Business Case for Traffic Incident Management.
This document provides information on how to develop a compelling business case for traffic in-cident management (TIM) investments. The development of a business case is a lifecycle process that does not stop with the development of the business case product, but includes activities that help to formalize and institutionalize TIM within the organization, position TIM for funding, and prepare the project/program for success.
The Oregon Department of Transportation (ODOT) Region 3, District 8 Dedicated Incident Response (IR) Pilot Project, referenced throughout this document, is an excellent example of the need and process for developing a compelling business case for TIM. The district had a prob-lem/need in that the lack of a dedicated incident responder adversely affected the efficiency of maintenance operations. The ODOT champion pushed for several years for a dedicated incident responder without success. It was not until the champion developed a vision and identified a planning document that stated the need for a dedicated response in the corridor that approval was received to conduct a pilot project. The pilot project served as the evaluation phase in which data associated with the objectives and performance measures were collected, analyses were conduct-ed, and the benefits of the dedicated incident responder were demonstrated. In addition, the pilot project provided an opportunity for the district to formalize the program in terms of stakeholder and community engagement. This example clearly demonstrates that all of the phases of the busi-ness case development process played a critical role in getting approval for a permanent dedicat-ed incident responder.
The TIM business case development lifecycle process suggests that it is important to continue to show the benefits of TIM beyond implementation of a TIM program or strategy. Ongoing data collection and program evaluation help garner further support for the investment, future invest-ments, and the TIM program as a whole. While the Washington State Department of Transpor-tation (WSDOT) must justify biennially to the State legislature the funding it receives for its IR program, WSDOT makes a continuous effort to demonstrate accountability for its programs through its quarterly Gray Notebook performance report and its annual Corridor Capacity report. The information contained within these reports (see Appendix B) is a snapshot of WSDOT’s business case for TIM. [64]
Challenges in the development of a business case for TIM do exist. The primary challenge is that data are limited in many regions. Further, there have been few empirical analyses to support the business case for TIM – much of the benefits estimations are based on modeling and assumptions of TIM impacts, and many of those are dated and based on small datasets or small scale applica-tion (specific to a single region’s data). More consistency in incident data collection is needed.
In addition to this document, a number of particularly relevant resources are available to assist agencies as they seek to collect the necessary data, conduct the appropriate analyses, and develop the information needed to make a strong business case for TIM. These resources have been refer-enced throughout this document and include the following:
62
• National Cooperative Highway Research Program (NCHRP) 07-20: Guidance for Implementation of Traffic Incident Management Performance Measurement – Provides guidance on the consistent use and application of TIM performance measures in support of the overall efforts of TIM program assessment. The guidance includes the most common sources of TIM data; a dictionary of data elements pertaining to TIM performance measurement; a model TIM performance measurement database schema; example applications of the model TIM performance measurement database; and database outputs, analyses, and visualizations associated with the example applications. [14]
• Online Traffic Incident Management Performance Measurement (TIM PM) Tool – Provides essentially the same information as the NCHRP 07-20 report in a more usable, online format. The TIM PM tool can be accessed at: http://nchrptimpm.timnetwork.org/. Fourteen detailed agency case studies present and describe the state-of-the-practice in TIM data collection, analysis, and reporting. In addition, TIM PM resources, including written guidance, outreach documents, and a TIM PM PowerPoint briefing can be downloaded for use.
• Process for Establishing, Implementing, and Institutionalizing a Traffic Incident Management Performance Measures Program – Provides a user-friendly, easy-to-apply process to establish, implement, and institutionalize a local, regional, or state TIM performance measurement program. The document covers TIM performance measures, definitions, and data requirements; what TIM data are available; the collection and management of TIM data; the analysis and reporting of TIM data; the involvement of partners in TIM performance measurement and management; and the formalization/institutionalization TIM performance measurements. The process presented is based on approaches, practices, techniques, and technologies that have been or can be applied to support a successful TIM performance measurement program.
[20]
• NCHRP 03-108: Guidance on Quantifying Benefits of TIM Strategies – Pending guidance on the quantification and monetization of TIM benefits. The guidance enables accurate assessment of an agency’s TIM strategies and communication of results to decisionmakers; the quantification of impacts and benefits that can be used in developing operational performance measures; consideration of quantitative factors including safety, mobility, reliability, emissions, business, and freight impacts; awareness of the relationships between elements, such as roadway type, primary and secondary incidents, level of congestion, capacity reductions due to incidents; and analytical estimation of secondary crashes based on factors such as incident location, duration, severity, traffic flow, and congestion. [24]
Making the Business Case for Traffic Incident Management.
63
APPENDIX A. BUSINESS CASE REPORT TEMPLATE
Making the Business Case for Traffic Incident Management.
Appendix A contains a template for producing a business case by following the four-phase pro-cess presented in this document. This business case report template is adapted from a business case template developed by the Treasury Board of Canada Secretariat. [3] To get started, com-plete the entire template. Each section contains brief instructions, which can be removed once your document is finalized. Consult the main body of this document, Making the Business Case for Traffic Incident Management, for more information about a particular section of the business case or information about a business case in general.
BUSINESS CASE COVER PAGEProvide a cover page with the name of the project and the organization information.
TABLE OF CONTENTSProvide a table of contents.
EXECUTIVE SUMMARYProvide an executive summary (high level) that captures only the essential elements of the business case being presented. Include the most pertinent facts in a clear, concise, and strategic overview.
VISIONOrganizational OverviewTo build a strong rationale for a proposed investment, the current environment needs to be described. The organizational overview of the sponsoring department, agency, or entity should include:
• Organizational structure (high level).• Mission.• Strategic vision, goals, and service objectives.• Current activities and services, including the audience and key stakeholders.
Problem or NeedThis subsection contains a clear articulation of the business need in the form of a well-struc-tured statement that addresses the problem or opportunity. This statement should be no more than one or two sentences.
Drivers for ChangeIdentify what has triggered the investment proposal. Both internal and external drivers for change should be identified and clearly linked to the business need.
64
Proposed Solution and OptionsDescribe the proposed solution and all options considered (if applicable). Include the status quo option (also known as the base case) as it will act as the baseline for the upcoming anal-ysis. Describe each preliminary option (high level). Identify what is to be included within the scope of the investment and explicitly state what is excluded from the investment.
Likely Business OutcomesDescribe the expected result or benefit that the organization is striving to achieve at the end of an intervention or change.
Strategic FitDemonstrate how the proposed investment fits within the organization’s broader strategic context and contributes toward its goals and objectives. This subsection maps the investment proposal to the organizational framework.
EVALUATION AND SELECTIONEvaluation Basis and Criteria for Analysis
Define a common framework and the evaluation criteria for which to evaluate the options.
BenefitsEstimate the benefits of each option by defining geographic and temporal scope, identifying available data, defining a schedule, and preparing an evaluation plan.
CostsProvide a complete description of the estimated costs for each option. Estimated costs should include capital investment and operations costs.
Comparative Analysis and Preferred OptionBased on the costs established for each option, describe how those costs are weighed against the benefits. Assess how well each option meets the evaluation criteria. Identify the risks and conduct a risk assessment for each option. Prepare an option outcome analysis and present a summary of the findings for each business outcome. It may be preferable to organize the find-ings in a table format. Select the preferred option. Describe how the option supports the orga-nization’s current business architecture and planned program results and strategic outcomes (if applicable). Present the recommendation in a straightforward manner, clearly stating why the organization will benefit by focusing its investment on one particular option.
FORMALIZATIONPlanningIncorporate TIM into the planning process by developing a focused TIM strategic plan or adding TIM as an emphasis area or key strategy in planning documents. Document the ap-proach (or approaches), establish a timeline, and how these activities will support the invest-ment.
Making the Business Case for Traffic Incident Management.

65
Partner RelationshipsEstablish and maintain relationships by engaging partners and making TIM a community/ regional/state effort. Document how these relationships are or will be established and main-tained over the life of the investment and the importance of these relationships to the success of the project.
Community EngagementInvolve the community by engaging the traveling public and other community stakeholders. Document which community groups will be engaged and how, and establish a timeline of activities and events. Note how these activities will be important to the success of the invest-ment.
TIM Processes and CapabilitiesProvide the approach for identifying what changes in processes and organization are need-ed to move TIM operations and management in the direction of improved effectiveness and efficiency. Include a timeline for the activities and a justification for how these activities will help to support the proposed investment.
FundingIdentify potential funding sources, considering traditional, new, and innovative ways to gain funding to support the investment.
IMPLEMENTATION AND MANAGEMENTImplementation and Management PlanOutline how the project will be implemented and managed to demonstrate that the proposed investment has been appropriately thought through and that the estimates presented are with-in an acceptable degree of accuracy.
Risk Management PlanProvide a summary of the risks associated with the investment, how they were assessed, and how they will be monitored and managed, including risk mitigation strategies.
Performance Management PlanDevelop a performance management plan to demonstrate transparency and accountability for the project and show how the success of the proposed investment will be measured.
Making the Business Case for Traffic Incident Management.

66

67
APPENDIX B. CHECKLIST OF TRAFFIC INCIDENT MANAGEMENT DATA ELEMENTS BY SOURCE1
Making the Business Case for Traffic Incident Management.
K. Pecheux and R. Brydia, “Guidance for the Implementation of Traffic Incident Management Performance Mea-surement,” National Cooperative Highway Research Program (NCHRP) Project 07-20, Transportation Research Board, National Academies, 2014.
1

68
Making the Business Case for Traffic Incident Management.

69
APPENDIX C. EXAMPLE BUSINESS CASE SUMMARY – WASHINGTON STATE DEPARTMENT OF TRANSPORTATION
CORRIDOR CAPACITY REPORT – INCIDENT RESPONSE2
Making the Business Case for Traffic Incident Management.
The Corridor Capacity Report (CCR) is the Washington State Department of Transportation’s WSDOT’s com-prehensive annual analysis of multimodal state highway system performance. This example comes from the 2015 CCR, October 2015, pp. 47-48, http://wsdot.wa.gov/publications/fulltext/graynotebook/CCR15.pdf.
2

70
Making the Business Case for Traffic Incident Management.

71
ACKNOWLEDGMENTS
Making the Business Case for Traffic Incident Management.
This document was developed with input from representatives from State departments of trans-portation, metropolitan planning organizations, and other organizations. The Federal Highway Administration (FHWA) would specifically like to thank the following individuals who assisted with development of this document:
• Alvin Marquess, Maryland State Highway Administration• Andrew Heath, Georgia Department of Transportation• Jeffery Frost, Florida Department of Transportation• Joseph Sagal, Maryland State Highway Administration• Laurie Matkowski, Delaware Valley Regional Planning Commission• Mark Wilson, Florida Department of Transportation• Michael Zezeski, former Maryland State Highway Administration• Paul Clark, Florida Department of Transportation• Salvatore Cowan, New Jersey Department of Transportation• William Legg, Washington State Department of Transportation

72

73
Making the Business Case for Traffic Incident Management.
[1] I. Bogorad, “6 essential elements for a winning business case,” TechRepublic, 27 July 2008. [Online]. Available: http://www.techrepublic.com/blog/tech-decision-maker/6-essential-elements-for-a-winning-business-case/. [Accessed 13 May 2016].
[2] S. Barrett, P. DeVita, J. Kenfield, B. Jacobsen and D. Bannard, “Developing a Business Case for Renewable Energy at Airports,” Transportation Research Board, Washington, DC, 2016.
[3] Treasury Board of Canada Secretariat, “Business Case Template,” Catalogue No. BT53-15/2-2009E-PDF, 2009.
[4] S. Joshua, “Seeking Support & Funding for TIM at the MPO: Lessons Learned, Maricopa Association of Governments,” in Presentation at TRB Workshop, Washington, DC, 2015.
[5] W. Legg, Interviewee, TIM Business Case Interview – WSDOT. [Interview]. 30 November 2015.
[6] A. Heath, Interviewee, TIM Business Case Interview – GDOT. [Interview]. 7 December 2015.
[7] J. Griffin, Interviewee, TIM Business Case Interview – ODOT. [Interview]. 4 February 2016.
[8] FHWA, “Traffic Incident Management Gap Analysis Primer,” U.S. Department of Transportation, Publication FHWA-HOP-15-007, 2015.
[9] A. Marquess, Interviewee, TIM Business Case Interview – CHART. [Interview]. 30 November 2015.
[10] J. Sagal, Interviewee, TIM Business Case Interview – CHART. [Interview]. 7 December 2015.
[11] L. Matkowski, Interviewee, TIM Business Case Interview – DVRPC. [Interview]. 2 December 2015.
[12] M. Wilson, P. Clark and J. Frost, Interviewees, TIM Business Case Interview – FDOT. [Interview]. 11 December 2015.
[13] H. Marx, B. Rosenblatt, A. Sandberg and S. Schwartz, “Traffic Incident Management: Lessons Learned in Seattle,” in NOCoE/NACTO Joint Webinar, October 21, 2015.
[14] K. Pecheux and R. Brydia, “Guidance for the Implementation of Traffic Incident Management Performance Measurement,” National Cooperative Highway Research Program (NCHRP) Project 07-20, Transportation Research Board, National Academies, 2014.
[15] FHWA, “Traffic Incident Management Handbook,” U.S. Department of Transportation, Publication FHWA-HOP-10-013, 2010.
BIBLIOGRAPHY

74
[16] FHWA, “Best Practices in Traffic Incident Management,” U.S. Department of Transportation, Publication FHWA-HOP-10-050, 2010.
[17] G. Chang and E. Igbinosun, “Performance Evaluation and Benefits Analysis for CHART in Year 2014,” Coordinated Highways Action Response Team, 2015.
[18] Florida DOT, “Review and update of Road Ranger Cost Benefit Analysis,” BDK 84 977-15 Final Report, January 2012.
[19] FHWA, “Focus State Initiative: Traffic Incident Management Performance Measures Final Report – Performance Measurement Presentation,” U.S. Department of Transportation Federal Highway Administration, Washington, DC, 2010.
[20] FHWA, “Process for Establishing, Implementing, and Institutionalizing a TIM Performance Measures Program,” U.S. Department of Transportation, Publication FHWA-HOP-15-028, 2016 (anticipated).
[21] David Evans and Associates, “I-5 Rogue Valley Corridor Plan,” Oregon DOT, Roseburg, OR, 2011.
[22] CHART, “CHART Statewide Traffic Incident Management Patrol Expansion, Proposed Operations Budget Enhancement,” 2009.
[23] Maryland.gov, “Department of Transportation Coordinated Highways Action Response Team (CHARTWeb),” [Online]. Available: http://www.chart.state.md.us/. [Accessed 20 April 2016].
[24] FHWA, “NCHRP 03-108: Guidance on Quantifying Benefits of TIM Strategies,” Transportation Research Board, Washington, DC, 2016 (working document).
[25] FHWA, “Analysis, Modeling, and Simulation for Traffic Incident Management Applications,” U.S. Department of Transportation, Publication FHWA-HOP-12-045, 2012.
[26] TransSafe Consulting, LLC and Sam Schwartz Engineering, DPC, “Traffic Incident Management in Seattle: Observations and Recommendations,” Seattle DOT and Seattle Police Department, Seattle, WA, 2015.
[27] FHWA, “Federal Highway Administration Focus States Initiative: Traffic Incident Management Performance Measures Final Report,” U.S. Department of Transportation, Publication FHWA-HOP-10-010, 2009.
[28] A. Guin, C. Porter and C. Holmes, “Benefits Analysis for Incident Management Program Integrated with ITS Operations: Case Study,” Transportation Research Record No. 2000, pp. 78-87., Washington, DC, 2007.
[29] FHWA, “User’s Manual for The Traffic Incident Management Benefit-Cost (TIM-BC) Tool (Version: 2.0),” Federal Highway Administration Research and Technology, September 2015. [Online]. Available: https://www.fhwa.dot.gov/publications/research/operations/16020/002.cfm.
Making the Business Case for Traffic Incident Management.

75
[30] S. Sajjadi, S. Aghdashi, N. Rouphail, A. Hajbabaie and B. Schroeder, “FREEVAL-RL User Guide,” Institute for Transportation Research and Education of North Carolina State University, Raleigh, NC, 2013.
[31] A. Guin et al., “Benefits Analysis for the Georgia Department of Transportation NaviGAtor Program: Final Report,” Prepared by URS Corporation for the Georgia DOT, 2006.
[32] G. L. Chang and S. Rochon, “Performance Evaluation of CHART – Coordinated Highways Action Response Team – Year 2002,” University of Maryland, College Park and Maryland State Highway Administration, 2003.
[33] J. King, “Traffic Incident Management (TIM) Performance Measures Webinar,” in TIM Performance Measurements, USDOT T3 Webinar Series, https://www.pcb.its.dot.gov/t3/s140612/s140612_TIM_perf_measures_intro.asp, June 12, 2014.
[34] T. Lane, “Reducing Secondary Crashes,” in FHWA TIM Performance Measures Workshop, Las Vegas, NV, June 24, 2015.
[35] For more information on the FSPE Model and how to obtain it, please contact: Mr. Alexander Skabardonis, Professor & Research Engineer, Department of Civil & Environmental Engineering, Institute of Transportation Studies, University of California, 109 McLaughlin Hall, Berkeley CA 94720-1720, Phone: 510-642-9166.
[36] K. Ahn, “Microscopic Fuel Consumption and Emission Modeling,” Virginia Polytechnic Institute and State University, Blacksburg, VA, 1998.
[37] Battelle Memorial Institute, “Regional Emergency Action Coordination Team (REACT) Evaluation,” Prepared for Maricopa County Department of Transportation, 2002.
[38] USDOT, “Georgia HERO Motorist Assistance Patrol Program,” ITS Knowledge Resources Benefits Database, Atlanta, GA, 2006.
[39] WSDOT, “Narrative Justification and Impact Statement for Incident Response,” Washington State Department of Transportation, 2013.
[40] OMB, “Circular No. A-94 Revised (Transmittal Memo No. 64),” Office of Management and Budget, Washington, DC, October 29, 1992.
[41] FHWA, “The Economic Impact of Motor Vehicle Crashes, 2000,” National Highway Traffic Safety Administration, Washington, DC, 2002.
[42] B. Robinson, “Memorandum to the North Carolina Department of Transportation: 2013 Standardized Crash Cost Estimates for North Carolina,” 10 November 2014. [Online]. Available: https://connect.ncdot.gov/resources/safety/Documents/Crash%20Data%20and%20Information/2013%20Crash%20Costs.pdf
[43] USDOT, “Revised Departmental Guidance on Valuation of Travel Time in Economic Analysis (2015 Update),” Office of the Assistant Secretary for Transportation Policy, Washington, DC, 2015.
[44] “National Household Travel Survey: Understanding How People Get from Place to Place,” NHTS, [Online]. Available: http://nhts.ornl.gov/. [Accessed 2016 15 June].
Making the Business Case for Traffic Incident Management.

76
[45] USDOT, “TIGER Benefit-Cost Analysis Resource Guide,” United States Department of Transportation, Washington, DC, Updated March 27, 2015.
[46] F. Moore, D. Diaz and K. Than, “Estimated Social Cost of Climate Change Too Low,” Stanford University, 12 January 2015. [Online]. Available: https://earth.stanford.edu/news/social-cost-climate-change-too-low. [Accessed 2015].
[47] L. Hagen, Z. Huaguo and H. Singh, “Road Ranger Benefit Cost Analysis,” Florida Department of Transportation, 2005.
[48] L. Dougald, “A Return on Investment Study of the Hampton Roads Safety Service Patrol Program,” Virginia Transportation Research Council, VTRC 07-R33, 2007.
[49] Florida DOT, “Florida Traffic Incident Management Program Strategic Plan,” Prepared by PB Farradyne, 2006.
[50] M. Zezeski, Interviewee, TIM Business Case Interview – CHART. [Interview]. 11 December 2015.
[51] FHWA, “Traffic Incident Management Benefit-Cost (TIM-BC) Tool,” Federal Highway Administration Research and Technology, 28 January 2016. [Online]. Available: https://www.fhwa.dot.gov/software/research/operations/timbc/. [Accessed 20 April 2016].
[52] FHWA, “Making the Connection: Advancing Traffic Incident Management in Transportation Planning – A Primer,” U.S. Department of Transportation, Publication FHWA-HOP-13-044, 2013.
[53] W. Berman, “Business Process Management Capability Maturity Frameworks – Overview,” in Presentation at TRB Workshop, Washington, DC, 2015.
[54] Connecticut DOT, “Connecticut Strategic Highway Safety Plan,” 2010, Revised 2013.
[55] Arizona DOT, “Toward Zero Deaths by Reducing Crashes for a Safer Arizona – Arizona 2014 Strategic Highway Safety Plan,” 2014.
[56] FHWA, “Traffic Incident Management Self Assessment,” [Online]. Available: http://ops.fhwa.dot.gov/eto_tim_pse/preparedness/tim/self.htm. [Accessed 25 October 2015].
[57] AASHTO, “Transportation Systems Management & Operations Guidance,” American Association of State Highway and Transportation Officials, Washington D.C., 2014.
[58] WSDOT, “Proposal to Expand Major Incident Tow Program (MIT) Coverage – Executive Summary,” Washington State Department of Transportation, 2008.
[59] FHWA, “Freeway Safety Service/Motorist Assistance Patrol Sponsorship Programs Memorandum,” 23 April 2008. [Online]. Available: http://ops.fhwa.dot.gov/regulationpolicy/fmpmemo/index.htm. [Accessed 20 October 2015].
[60] Transportation Infrastructure Committee, “Fixing America’s Surface Transportation (FAST) Act,” U.S. House of Representatives, December 2015. [Online]. Available:
Making the Business Case for Traffic Incident Management.

77
http://transportation.house.gov/fast-act/.
[61] J. Schueler, “Leveraging Local Funding Sources – A Webinar Exploring Local Funding Options to Support TIM Practitioners – Cranberry Township Pennsylvania,” Presentation for TIM Network Webinar, 2015.
[62] R. Victor, “MTC’s Role in Traffic Incident Management, Washington D.C. – Regional Traffic Incident Management and Transportation Planning: Creating Crucial Connections, Part 1, Successful Approaches Used by MPOs to Include TIM in Planning,” Transportation Research Board 94th Annual Meeting, 2015.
[63] Los Angeles County Metropolitan Transit Authority, “Los Angeles Meets the Future,” Metro Quarterly, vol. Winter 2007, 2007.
[64] WSDOT, “Corridor Capacity Report,” Washington State Department of Transportation, 2015.
[65] DVRPC, “Traffic Incident Management in the DVRPC Region,” [Online]. Available: http://www.dvrpc.org/Operations/IncidentManagement.htm. [Accessed December 2015].
Making the Business Case for Traffic Incident Management.

78

79

80
U.S. Department of TransportationFederal Highway Administration
Office of Operations1200 New Jersey Avenue, SE
Washington, DC 20590
Office of Operations Web Sitewww.ops.fhwa.dot.gov
December 2016
FHWA-HOP-16-084
This material is based upon work supported by the FHWA under contract number DTFH61-12-D-00036.
Any opinions, findings and conclusions or recommendations expressed in this publication are those of the author(s) and do not necessarily reflect the views of the FHWA.