Increasing Student E ngagement : 3 E vidence-based I nstructional S trategies

We thank Jonathan Boyd, Al Carrion, James Corley, Dennis Lasser, Jeffrey Harris, June Harding, DanMcKeever, Costanza Meneghetti, Kirsten Soneson, seminar participants at the 2010 Eastern FinanceAssociation Meetings and the 2010 Meetings of the Financial Management Association, and an anonymousreferee for helpful comments and suggestions. Errors or omissions are our responsibility.
*Correspondence author, Department of Finance, College of Business and Economics, West VirginiaUniversity, P.O. Box 6025, Morgantown, West Virginia 26506. Tel: 304-293-7892, Fax: 304-293-3274, e-mail:[email protected]
Received December 2010; Accepted June 2011
■ Naomi Boyd is an Assistant Professor of Finance at the Department of Finance, West VirginiaUniversity, Morgantown, West Virginia. She is also a Consultant, Office of the ChiefEconomist, Commodity Futures Trading Commission (CFTC), Washington, DC.
■ Alexander Kurov is an Associate Professor of Finance at the Department of Finance, WestVirginia University, Morgantown, West Virginia.
© 2011 Wiley Periodicals, Inc.
DOI: 10.1002/fut.20543
TRADER SURVIVAL: EVIDENCE
FROM THE ENERGY FUTURES
MARKETS
NAOMI E. BOYDALEXANDER KUROV*
This study analyzes the adaptation of traders and the determinants of trader sur-vival during a period of changing market structures. Our unique sample of trans-actions level data covers the introduction of electronic trading in the NYMEXenergy futures market. The results show that most floor traders adapted to theside-by-side electronic and open outcry trading, although trader attrition increasedand the profitability of surviving traders declined dramatically. It is also found thattrading profits, trader experience and sophistication, and dual trading have a posi-tive effect on the probability of trader survival. Scalpers are less likely to exit trad-ing in pure open outcry trading, but are more likely to fail than traders who holdopen positions longer in side-by-side trading. Finally, traders trading in multipleenergy futures markets and those who use both the exchange floor and electronictrading appear to have a survival advantage in side-by-side trading. © 2011 WileyPeriodicals, Inc. Jrl Fut Mark 32:809–836, 2012
The Journal of Futures Markets, Vol. 32, No. 9, 809–836 (2012)
Published online August 5, 2011 in Wiley Online Library (wileyonlinelibrary.com)
2 Boyd and Kurov
Journal of Futures Markets DOI: 10.1002/fut
1. INTRODUCTION
Financial markets are in a constant state of flux. The rate of change has beenaccelerated in recent years by the proliferation of new financial instrumentsand trading platforms. These rapid changes are exemplified by the recent movefrom physical trading floors to electronic trading platforms implemented by allof the major exchanges. This fundamental shift in the trading mechanismrequires adaptation by market participants if they want to survive.
The influence of changing environments on biological processes has beenextensively studied. For example, Darwin’s theory of natural selection predi-cates that if a species does not adapt to changes in its environment it will dis-appear, and that only those who can adjust to the new conditions will survive.Two streams of financial economics literature are directly related to theories of evolution and natural selection. The first examines the evolutionary theory ofgames (Smith, 1982); the second focuses on the notion of market selection.Blume and Easley (1992, 2008) ask two questions: (1) Is it possible to charac-terize the rules of selection or who wins? and (2) If selection does take place,do traders who use rational decision rules survive, and do irrational traders van-ish? Theoretical literature on market selection has focused on the question ofsurvival of irrational traders and their impact on asset prices.1
Some research has examined how traders learn from their trading experi-ence (Seru, Shumway, & Stoffman, 2010), but very little empirical work hasbeen done on adaptation of traders to a change in market structure or on thedeterminants of trader survival. This study contributes to the existing literaturein two ways: (1) by evaluating the adaptation of traders following a change inthe trading mechanism, and (2) by examining individual trader characteristicsthat influence the probability of trader survival.
We evaluate local traders in four energy futures markets traded on theNew York Mercantile Exchange (NYMEX): crude oil, natural gas, gasoline, andheating oil, over the period from January 2005 to February 2009. During thisperiod, the energy markets experienced a large increase in trading activity andprice volatility, attracting close attention from regulators and lawmakers (e.g.,MacDonald, Chazan, & Cui, 2009). NYMEX floor traders resisted implemen-tation of day-time electronic trading, even as most of the other large financialexchanges had already established electronic trading platforms. However, com-petition from the all-electronic Intercontinental Exchange (ICE) caused themanagement of NYMEX to quickly implement electronic trading after ICEbegan trading of crude oil futures contracts essentially identical to those tradedon NYMEX. Trading of NYMEX’s physically settled energy products on a
1For more theoretical work on market selection and investor survival, see Yan (2008) and Kogan, Ross, Wangand Westerfield (2006, 2009).
810

Trader Survival 3
Journal of Futures Markets DOI: 10.1002/fut
well-established electronic trading platform, Globex, began on September 5,2006. Floor trading in the same contracts continued on regular schedule.Thus, similar to other US futures exchanges, NYMEX now uses a hybrid trad-ing mechanism, with electronic and floor trading operating side by side.
Our unique data set allows for the tracking of positions and personal trad-ing revenues of individual exchange locals. These professional traders have tra-ditionally enjoyed exclusive access to open outcry trading that gave them aninformational advantage over off-floor traders (e.g., Ferguson & Mann, 2001,Locke & Onayev, 2007). NYMEX’s introduction of day-time electronic tradingcreates an opportunity to study the ability of local traders to adapt and survivewhen faced with drastic changes in their environment. These changes includea move of most of the customer order flow to Globex, anonymity of electronictrading, and increased competition for order flow from off-exchange Globextraders. As electronic trading is very different from floor trading, it may requiredifferent characteristics for a trader to survive and succeed.
We find that the introduction of daytime electronic trading on NYMEXwas followed by a large drop in floor trading activity and by a large decline intrading revenues and profits of exchange locals. Despite the large drop in theirincome, most floor traders survived the transition to side-by-side trading andnow use both trading platforms. Although side-by-side trading initiallyattracted new local traders, trader failures in side-by-side trading are muchmore frequent than during the pure open outcry period.
Profit is a key measure of trading success. As stated by Alchian (1950)“. . .those who realize positive profits are the survivors; those who suffer lossesdisappear.” We identify several trader characteristics that are likely to influencetrader profitability and, hence, the probability of survival. These characteristicsinclude trader experience, sophistication, dual trading (i.e., the execution oftrades for both personal and customer accounts), degree of concentration in aparticular futures market, and trading style. The results of our hypotheses testsshow a positive impact of trader experience, sophistication, and dual trading onprofitability and survival in both pure open outcry trading and side-by-side trad-ing. We also find that good open outcry traders continue earning above-averageprofits under the new trading mechanism.
Our survival analysis also shows that the effect of trader specialization in aparticular market and trading style on trader survival depends on the tradingmechanism. Traders using multiple energy futures markets appear to have asurvival advantage in side-by-side trading but no significant advantage in floortrading. Scalpers, i.e., traders who quickly trade in and out of positions, are lesslikely to exit the market than traders who trade less frequently and hold openpositions longer in pure open outcry trading; however, scalpers are more likelyto fail in side-by-side trading. Finally, we find that traders who use both the
811

4 Boyd and Kurov
Journal of Futures Markets DOI: 10.1002/fut
exchange floor and Globex during the side-by-side trading period are morelikely to survive than those who trade exclusively on the floor or only onGlobex.
2. DATA AND DESCRIPTIVE STATISTICS
2.1. Data
We use 50 months of transaction-level data from the crude oil, natural gas, heat-ing oil, and gasoline futures markets traded on NYMEX, spanning January 2005through February 2009.2 The data set is obtained from the US CommodityFutures Trading Commission (CFTC) and contains the records of all open-outcry and electronic trades. The data include the price, number of contractstraded, trade date, trade time,3 trade direction (buy or sell), delivery month andyear of the contract, venue code (floor or electronic), trade type code, the exe-cuting broker identification, and customer type indicator (CTI). CTI range from1 to 4 as follows: CTI 1 are trades executed by an individual exchange memberfor his own account; CTI 2 are trades executed for a proprietary account of anexchange member firm; CTI 3 are trades executed for a personal account ofanother individual exchange member; CTI 4 are trades executed for an accountof any other trader. CTI 4 trades originate from off-exchange customers. Ourprimary interest is in local (CTI 1) trades because the executing broker identi-fication allows tracking trading positions and revenues of individual exchangemembers.
Daily settlement prices used to mark to market are also obtained from theCFTC. Only futures trades executed during the regular floor trading hours(from 10:00 a.m. to 2:30 p.m. EST before February 1, 2007 and from 9:00 a.m.to 2:30 p.m. EST beginning February 1, 2007) are included in the sample.4 Wealso remove trades identified as void, indicating that an error, for example anincorrect price or quantity, occurred in the execution of the trade. Tradeswhere the difference between the trade price and settlement price exceeds100%, indicating a likely data error, are also removed.
2The gasoline futures data includes two futures contracts: unleaded gasoline and RBOB gasoline. The RBOBgasoline futures started trading in March 2005 and gradually captured the bulk of trading volume fromunleaded gasoline futures. The unleaded gasoline futures stopped trading in December 2006. For the periodwhen both contracts traded simultaneously, we aggregate them into a single gasoline futures market.3Trade execution times are reported to the nearest minute for open outcry trading and to the nearest secondfor electronic trading.4We remove after-hours trades for several reasons. First, after-hours trading is relatively thin. Second, we areinterested in examining the difference between pure electronic trading and side-by-side trading, but all after-hours trading is done electronically. Finally, settlement prices that we use to calculate trading revenues aredetermined based on the prices at the end of the regular trading day.
812

Trader Survival 5
Journal of Futures Markets DOI: 10.1002/fut
2.2. Summary Statistics
Table I provides summary statistics including the average daily volume, averagetrading frequency, average trade size, and customer execution costs across thecrude oil, natural gas, heating oil, and gasoline futures markets. The overalltrading activity measured by daily trading volumes increased in all four marketsin the side-by-side period. This increase ranged from about 37% in the heatingoil market to 96% in crude oil. The floor trading activity declined dramatically,with over 80% of the trading volume executed electronically in the side-by-sideperiod. Trading frequency on Globex is extremely high, particularly in the
TABLE I
Summary Statistics
Pure OpenSide-by-side Trading
Outcry Trading 9/5/06–2/27/09
1/3/05–9/1/06 Floor Electronic Overall
Crude OilMean daily volume (contracts) 212,286 68,592 346,540 415,132Mean number of trades per minute 37.2 5.6 467.6 473.2Mean trade size (contracts) 21.10 37.17 2.26 2.67Median trade size (contracts) 10 15 1 1Mean all-trade effective spread (basis points) 3.16 1.31 0.07 0.11Mean against-local effective spread (basis points) 4.26 2.09 0.12 0.32
Heating OilMean daily volume (contracts) 48,188 12,300 53,475 65,775Mean number of trades per minute 15.4 2.4 90.3 92.7Mean trade size (contracts) 11.62 15.51 1.81 2.16Median trade size (contracts) 5 9 1 1Mean all-trade effective spread (basis points) 5.28 2.19 0.26 0.39Mean against-local effective spread (basis points) 7.37 10.11 1.36 1.87
GasolineMean daily volume (contracts) 48,719 11,901 55,700 67,601Mean number of trades per minute 14.2 1.8 89.7 91.5Mean trade size (contracts) 12.65 20.12 1.89 2.25Median trade size (contracts) 7 10 1 1Mean all-trade effective spread (basis points) 6.87 1.04 0.33 0.68Mean against-local effective spread (basis points) 8.44 13.72 1.27 2.57
Natural GasMean daily volume (contracts) 75,716 21,125 95,212 116,337Mean number of trades per minute 23.8 3.7 135.5 139.3Mean trade size (contracts) 11.74 17.30 2.14 2.55Median trade size (contracts) 5 5 1 1Mean all-trade effective spread (basis points) 4.89 2.25 �0.04 0.004Mean against-local effective spread (basis points) 5.80 6.25 0.17 0.28
Effective spread for off-exchange customers is computed as the average customer buy price minus the average customer sell price,divided by the average customer buy price, over a five-minute interval. Only the most actively traded contract for each market is usedin calculation of effective spreads.
813

6 Boyd and Kurov
Journal of Futures Markets DOI: 10.1002/fut
crude oil futures market. Most of the Globex trades are small, however, with amedian trade size of only one contract. Floor trade sizes tend to be much larger,especially during the side-by-side period. This suggests that small traders havemoved to electronic trading, whereas some larger traders continue using theexchange floor.
Following Kurov (2005), we calculate the effective spread as the averageoff-exchange customer buy price minus the average customer sell price, dividedby the average customer buy price, over a five-minute interval. Before the intro-duction of daytime electronic trading, the average effective spread calculatedacross all customer orders ranged from about 3 basis points in the crude oilfutures market to about 7 basis points in the gasoline futures market. Thespreads collapsed when the energy futures were launched on Globex. Forexample, in the electronically traded natural gas futures market, the mean all-trade effective spread is negative, suggesting that off-exchange customers fre-quently supply liquidity to exchange members. In all four markets, effectivespreads are much higher in floor trading than on Globex under side-by-sidetrading.
Many exchange locals trade in several markets of the energy complex ratherthan concentrating in just one market. Examining each market in isolation inour analysis of trader survival would lead to instances where, for example, a par-ticular trader no longer trades natural gas futures but is still active in the crudeoil market. To avoid classifying such instances as trader failures, we take a port-folio approach to studying trader’s participation by consolidating all four mar-kets of the energy complex into a single data set. This approach allows trackingthe overall trading activity, profits and survival status of each local trader.
Figure 1 shows the time variation in the total number of local traders inthe four energy futures markets that we consider. The average number of per-sonal account traders in NYMEX’s energy complex over the entire sampleperiod is about 586. The number of personal account traders increased imme-diately after the introduction of daytime electronic trading, but then graduallydeclined. Figure 1 also shows the percentage of the total dollar trading volumeand personal account (CTI1) volume executed on Globex. By the end of 2006,about 60% of the overall volume in these markets was executed electronically,and Globex’s share continued to grow rapidly, exceeding 90% in 2008. In com-parison, when MATIF introduced side-by-side floor and electronic trading in1998, almost all of the trading volume quickly moved to the electronic platformand the floor was closed soon thereafter. The percentage of personal accounttrading executed electronically by exchange locals remained lower than the cor-responding share of the overall trading activity. This indicates that exchangelocals tend to execute a larger share of their trading volume on the exchange floorthan do other traders.
814

Trader Survival 7
Journal of Futures Markets DOI: 10.1002/fut
2.3. Trading Profits and Trader Exits
To estimate trading revenues, we follow Fishman and Longstaff (1992) by com-puting the difference between the settlement and trade prices, multiplying bythe signed trade quantity (positive for buys and negative for sells) and cumulat-ing over all trades for a given trader during a particular week. In order to findtotal portfolio revenues, personal account revenues are summed over all mar-kets that a particular trader traded each week. To enjoy member trading privi-leges (and to have his trades classified as CTI1), a trader must own or lease anexchange seat. To estimate trader profits, we use the NYMEX lease renewalrate as a proxy for fixed costs.
Table II shows summary statistics for personal account trading revenues andprofits before and after the move to side-by-side trading.5 The profit is calculatedas weekly revenue minus the average weekly lease renewal rate. The median
FIGURE 1Number of local traders and Globex share in trading volume.
5To eliminate transient traders, this table and the rest of the study examines only local traders who executedpersonal account trades on at least ten days in the sample, which is similar to the culling process used byLocke and Mann (2005). The removal of transient traders from our sample eliminated 210 traders and leftus with a sample of 1,065 traders. Although the percentage of transient traders comprised approximately 16%of the initial sample, these traders accounted for only 0.01% of the total trading volume.
815

8 Boyd and Kurov
Journal of Futures Markets DOI: 10.1002/fut
weekly profit declined by more than 80%, from about $12,600 in pure openoutcry trading to about $2,200 under side-by-side trading. In side-by-side trad-ing, floor trading revenues are higher than revenues from electronic trading.6
This is consistent with the higher effective spreads on the floor shown in TableI and with locals playing a market-making role on the floor.
The dispersion of trader profits increased significantly in side-by-side trad-ing. This increase in volatility of profits is due to a large increase in the inci-dence of extreme observations. For example, in pure open outcry trading,weekly revenues exceeding $1 million in absolute value were observed in only0.25% of trader weeks. This percentage increased to 0.63% of trader weeks inside-by-side trading. Similarly, the maximum and minimum revenue observa-tions are larger in absolute value during the side-by-side trading period. A possi-ble reason behind the increase in the incidence of extreme revenue observationsis that, despite our attempt to aggregate all of the major NYMEX’s energyfutures markets into a single data set, this data set leaves out several parts ofthe energy derivatives market, such as the options on futures, as well as theenergy futures and options traded on the ICE. A trader may, for example, arbi-trage between futures contracts on NYMEX and ICE by executing offsettingtrades. Our data set includes only NYMEX futures trades, leading to profitsfrom such arbitrage trades being measured with a potentially large error.Similarly, traders can use options to hedge their futures trades, and vice versa.After the introduction of side-by-side trading, it became easier for local tradersto trade in different energy derivatives markets simultaneously, possibly making
TABLE II
Weekly Personal Account Trading Revenues and Profits
Mean Median St. Dev. Observations
Pure open outcry trading (1/3/05–9/1/06)Revenue 30.10 16.60 164.83 51,797Profit 26.04 12.57 164.82 51,797
Side-by-side trading (9/5/06–2/27/09)Total Revenue 7.59 3.16 225.31 74,964Total profit 6.49 2.21 225.30 74,964Revenue from open outcry trading 5.68 2.59 226.35 48,186Revenue from electronic trading 4.87 0.79 158.95 60,573
The table presents weekly trading revenues and profits (in thousands of dollars) for personal account trading. Revenues and profits areaggregated across all four futures markets of the NYMEX energy complex. When a particular trader did not trade on the floor or onGlobex in a given week during the side-by-side period, the corresponding floor or Globex revenue observation is treated as missing.
6When a particular trader did not trade on the floor or on Globex in a given week, the corresponding floor orGlobex revenue is treated as missing. Using revenue of zero for such observations would impart a downwardbias to the mean and median revenues by trading platform.
816

Trader Survival 9
Journal of Futures Markets DOI: 10.1002/fut
our revenue and profit measures noisier. In Section 5 of the study, we winsorizeweekly profits at the 0.1 and 99.9 percentile to reduce influence of extreme values.
Figure 2 shows median weekly personal account trading revenues andprofits for our sample period, as well as the average weekly lease renewal rates.The figure confirms a dramatic decline in local trader profitability immediatelyafter the introduction of daytime electronic trading. The average weekly leaserenewal rates also declined from about $4,200 immediately before the intro-duction of side-by-side trading to about $440 by the end of our sample period.
Panel A in Figure 3 shows the weekly number of local trader exits. A trader-week when a particular local trader appears in the data for the lasttime is classified as trader exit. In the pure open outcry period, floor trader exitsare relatively rare, with less than one exit per week on average. The averagenumber of failures per week increases to about 3.3 in the side-by-side tradingperiod, suggesting a more difficult trading environment for local traders. Oursample during the side-by-side trading period includes 311 new traders and690 incumbent traders, or those who were in the market before and after theintroduction of side-by-side trading. The numbers of exits for these two groupsof traders were 140 and 290, respectively. This implies a slightly higher attri-tion rate for new traders (about 45% vs. about 42% for incumbent traders). The
FIGURE 2Median weekly revenues and profits for CTI1 personal account trading.
817

10 Boyd and Kurov
Journal of Futures Markets DOI: 10.1002/fut
FIGURE 3Weekly number of local trader exits and entrances. Panel A. Trader exits. Panel B. New trader
entrances.
818

Trader Survival 11
Journal of Futures Markets DOI: 10.1002/fut
weekly number of new trader entrances (shown in Panel B of Figure 3) initiallyincreases with the introduction of side-by-side trading, but then graduallydeclines.
It is also useful to examine how trading activity and profitability changebefore a trader’s failure. Figure 4 presents this information for the period of 16weeks immediately before a trader’s exit. Following Coval and Shumway(2005), we standardize weekly profits and trading volumes by dividing them bytrader-specific standard deviations. To remove patterns arising due to overallchanges in the trading environment over the sample period, we demean stan-dardized profits and trading activity variables used in Figure 4.
Panel A of the figure shows a gradual decline in the average trading activ-ity in the weeks before a trader disappears from the sample. Panel B shows arelatively flat trajectory in average standardized profits, followed by a pro-nounced drop in performance in the last three weeks of trading. The figure alsoshows that exiting traders are less active and less profitable than average wellbefore they exit the market.
3. THE ADAPTATION OF INCUMBENT TRADERSTO SIDE-BY-SIDE TRADING
As Figure 1 shows, the transition to electronic trading was not immediate, butrather occurred gradually over an approximately eight-month period fromSeptember 2006 through April 2007. Here we wish to examine the process ofadaptation that incumbent traders went through when Globex was introduced.As such, we define an incumbent trader as one who traded both before andafter the introduction of side-by-side trading. We omit traders who either exitthe sample before the introduction of Globex or begin trading after the intro-duction of Globex.
After the introduction of side-by-side trading, locals had the ability (1) tocontinue trading only in the open outcry trading pit or (2) to trade on both plat-forms. The first option requires no immediate adaptation to take place, butdooms the trader to failure if the floor market withers away. The second optionrequires significant learning for the trader to adapt to electronic trading, andalso allows the trader to use information generated in the trading pit to hisadvantage in the electronic marketplace. We classify incumbent traders intothese two categories and examine the two categories separately. Out of 687incumbent traders in the markets of the energy complex, 153 chose not to par-ticipate in trading on Globex and remain solely in the open outcry trading pits,and 534 traded in both the open outcry trading pits and on Globex.
We examine the trading characteristics of incumbent traders during twoeight-month time periods immediately before and after the introduction of
819

12 Boyd and Kurov
FIGURE 4Personal account trading activity and profits before trader exits. Panel A. Demeaned personal accounttrading activity. Panel B. Demeaned standardized personal account profit. The sample includes 420
traders who appeared in the data for at least 16 weeks. Personal trading volume and profits arestandardized by dividing them by trader-specific standard deviations and then demeaned by subtracting
the mean for all traders for the corresponding week.
820

Trader Survival 13
Journal of Futures Markets DOI: 10.1002/fut
electronic trading and partition the sample based on the two trader categoriesidentified above. The first period is evaluated to provide a baseline of tradingactivity and performance before the shift in market structure. The secondperiod is studied to evaluate changes that followed the introduction of the newelectronic trading platform. Table III provides statistics identified in the extantliterature (i.e., Kuserk & Locke, 1993) to describe the trading characteristics oflocal traders in futures markets, which include the average daily volume pertrader, average daily total volume for the particular trader category, averagenumber of trades per trader, and average trade size per trader. We also docu-ment the average and median daily revenue, the number of trader days, and thenumber of trader exits.
Floor traders who chose not to participate in trading on Globex accountfor only a small portion of the local trading in the side-by-side period, indicat-ing that these traders were relatively inactive. Traders who participated only onthe floor struggled to stay profitable, with median daily revenues of approxi-mately $970, which was less than half of their pre-period level of $2,210. Fortraders who remained in the open outcry trading pits throughout the sampleperiod, their daily average volume and the number of trades decreased,
TABLE III
Incumbent Traders During the Transition Period
Pure Open Outcry Trading Transition to Side-by-side 1/3/06–9/1/06 Trading 9/5/06–4/30/07
Category 1 Category 2 Category 1 Category 2
Number of incumbent traders 153 534 153 534Mean daily volume per trader (contracts) 310.0 869.7 213.7 786.5Mean daily total volume (contracts) 28,486 338,177 15,791 325,697Mean daily number of trades per trader 26.5 64.1 16.3 136.5Mean trade size (contracts) 11.70 13.57 13.08 5.76Mean daily revenue 3.96 8.71 0.10 3.54Median daily revenue 2.21 4.28 0.97 1.80Number of trader days 15,437 65,327 11,968 67,503Number of trader exitsa – – 41 36Exits as percentage of incumbent tradersa – – 26.8% 6.7%
The table presents information on incumbent traders, i.e., those who traded both before and after the introduction of side-by-side trad-ing, during the transition period (eight months before and eight months after the introduction of side-by-side trading). In both sub-periods, traders are divided into two categories: (1) traders who traded only through open outcry during the transition to side-by-sidetrading, and (2) traders who traded on both platforms during the transition. The sample includes only incumbent traders who madepersonal account trades in at least two weeks during the eight-month period before the introduction of side-by-side trading. Both buyand sell trades are included in calculation of volume and number of trades. The mean daily total volume includes only trading volumefor the given category of incumbent traders.
aThese statistics are not reported for the pure open outcry trading time period because, by definition, an incumbent trader is one whowas in the sample before and after the introduction of electronic trading, and, as such, could not have experienced failure during thepit only time period. Traders did experience failure during this time period, but those traders are excluded from the subsample usedto study the transition period.
821

14 Boyd and Kurov
Journal of Futures Markets DOI: 10.1002/fut
whereas their average daily trade size increased with the onset of electronictrading. Out of 153 traders in this category, 26.8% exited after the introductionof side-by-side trading as compared to 6.7% of traders who exited from thegroup of traders who utilized both trading platforms. This provides evidencethat trading on the floor and electronically may result in a higher probability ofsurvival due to higher overall profits.
For traders who participated in both markets, the level of activity was signif-icantly higher than those who remained in the open outcry trading pits. The aver-age total personal account trading volume declined somewhat with the onset ofside-by-side trading, whereas the daily number of trades more than doubled. Themedian daily revenues of this set of traders fell by more than 50%. The largeincrease in the number of trades per trader, along with the reduction in thetrade size, indicates that this set of incumbent traders had to drastically changethe way in which they traded with the onset of electronic trading. Withincreased competition, traders had to adapt to the new trading environment byprocessing more trades.
In the eight months preceding the introduction of side-by-side trading, 36traders who started trading before January 2006 exited the market. This com-pares to 77 incumbent trader failures in the eight months following the intro-duction of Globex. Given the increased attrition rate under side-by-side trading,we now turn to an evaluation of the determinants of trader survival to studywhether certain trader characteristics increase the chance of survival after theshift in market structure.
4. KEY VARIABLES AND HYPOTHESES
Multiple factors may affect the overall success and survival of traders in futuresmarkets. We consider the following trader characteristics that are likely toinfluence trader profitability and the probability of survival:
(1) Experience: Trading in the NYMEX energy complex involves a highdegree of knowledge about and specialization in energy markets, as well as theability to react quickly to changes in these volatile markets. Such abilities areacquired through experience. Traders also tend to become better at tradingwith experience (e.g., Seru et al., 2010). Thus, experience is likely to increasetrader performance and probability of survival through increased trading skilland ability to adapt to changing market conditions. We measure trader experi-ence at week t as the number of days on which a trader has placed a trade up toand including week t. At the beginning of our sample period, this variable isequal to zero for all traders in the sample.
(2) Trader sophistication: Liu, Wang, and Zhao (2010) use combinationorders, i.e., orders that combine put and call options, as a proxy for sophistication
822

Trader Survival 15
Journal of Futures Markets DOI: 10.1002/fut
for options traders. Non-regular trades in futures markets, such as calendarand intercommodity spread trades, also involve the trading of several futurescontracts and account for about half of the personal trading volume in oursample.7 To use spreads a trader must follow several contract maturities or sev-eral markets simultaneously and understand the fundamental factors drivingtheir relative prices. Therefore, traders using spreads and other non-regulartype trades are likely to be more sophisticated than traders using primarily reg-ular trades.8 We use the percentage of personal trading volume (with the vol-ume expressed in dollars of notional contract value) in non-regular type tradesas a proxy for trader sophistication. Similar to experience, trader sophisticationshould positively influence trader performance and adaptability.9
(3) Dual trading status: Dual trading has been shown to benefit futurestraders in two ways: first, dual traders may glean useful information from cus-tomer order flow (e.g., Menkveld, Sarkar, & van der Wel, 2011); and second,brokerage commissions charged on customer trades provide an additionalsource of income that may be especially helpful in periods with low personalaccount trading income. Following Chakravarty and Li (2003) and Menkveld et al. (2011), we classify a trader as a dual trader in weeks when his trading vol-ume for customer accounts is between 2 and 98% of his total trading volume,with the trading volume expressed in dollars of notional contract value. Basedon this criterion, approximately one-third of the total number of trader weeksin the sample fall in the dual trading category.
(4) The degree of specialization in a particular market of the NYMEX’senergy complex. Kuserk and Locke (1993) show that floor traders tend to spe-cialize in a particular commodity rather than a portfolio of commodities. Someof this specialization is undoubtedly due to physical constraints of pit trading. A trader’s exclusive focus on a single trading pit also helps him establish a rep-utation as a reliable counterparty and build trading relationships with othertraders in the same pit. Therefore, the degree of specialization may have a pos-itive effect on trader survival in floor markets. In electronic trading, however,the above considerations no longer apply, potentially making trading in multi-ple markets more attractive.
To measure the degree of market concentration in personal account trad-ing, we compute a Herfindahl-like index for trader i in week t as
, where sijt is the percentage of personal trading volume forFOCUSit � a4
j�1s2ijt
7Spread trades account for about 90% of the volume of non-regular type trades.8The notion that trading spreads requires a certain degree of sophistication is a commonly held view in prac-tice and is frequently noted in articles on the basics of trading in futures markets. Here, we attempt to for-malize this notion to capture the degree of sophistication of a trader by analyzing the percentage of their vol-ume traded in non-regular trades such as spreads.9Feng and Seasholes (2005) show that experienced and sophisticated investors are less prone to behavioralbiases.
823

16 Boyd and Kurov
Journal of Futures Markets DOI: 10.1002/fut
that trader and week in market j. This variable can range from 1/4 if the tradersplits his trading volume equally among the four markets to 1 if the trader usesonly one market in a given week. The average value of this index in the purefloor trading period is about 0.94, with about 22% of trader weeks containingtrades in more than one market. In the side-by-side trading period, the averagevalue of the concentration index is 0.87, with about 41% of trader weeks con-taining trades in several markets.
(5) Trading style: Speculators in futures markets are traditionally classifiedas scalpers, day traders, or position traders. Scalpers tend to behave as marketmakers, attempting to buy at the bid and sell at the offer. These traders tradefrequently and quickly reduce their inventory. Day traders have a somewhatlonger trading horizon and attempt to profit from price changes that take placeover the course of one trading day. Most local traders (presumably scalpers andday traders) end the trading day with a zero inventory level (e.g., Manaster &Mann, 1996).
We use three variables to identify scalpers: trading frequency, mediantrade holding time, and average end-of-day inventory as a percentage of thetrader’s personal trading volume.10 Trading frequency is computed as the aver-age number of trades per day.11 Trade holding times are measured using themethodology of Locke and Mann (2005). This approach involves tracking posi-tion changes for a given trader over a trading day and computing weighted aver-age holding times for the open position after each trade. If a trader increaseshis position, the position holding time is reduced. If the position is reduced butnot eliminated, the holding time of the remaining position increases. FollowingLocke and Mann (2005), we use holding times for completed trades, computedat the time when a position is reduced, eliminated, or reversed.12 We classifyscalpers as traders who are in the bottom half of the median trade holding time,top half of trading frequency, and the bottom half of average end-of-day inven-tory. The percentile rankings are performed separately for each week in thesample to account for changes in distributions over time. Based on our classifi-cation, scalpers account for about 25% of trader weeks in the sample.
Position traders trade relatively infrequently and often keep open positionsovernight. As Manaster and Mann (1996, p 957) note, our data set is not wellsuited for tracking inventory changes over intervals longer than a day; therefore,to identify position traders we use end-of-day inventory and trading frequency.Traders in the bottom half of trading frequency and the top quartile of average
10Kuserk and Locke (1993) use a somewhat similar set of measures to select scalpers.11A single trade is often split into several trade executions, especially in electronic trading, as a market orderwalks up or down the limit order book. To compute the number of trades, we aggregate multiple trade exe-cutions of the same type (buy or sell) with the same execution time into a single trade.12In calculation of trade holding times, we assume that any positions remaining open at the close of the reg-ular trading session are closed at that time.
824

Trader Survival 17
Journal of Futures Markets DOI: 10.1002/fut
end-of-day inventory are classified as position traders. Based on this classifica-tion, position traders account for about 21% of trader weeks in the sample.
The effect of trading style on profitability and probability of survival maydepend on the trading mechanism. In particular, scalping is well suited to tra-ditional open outcry trading, because scalpers take short-term positions usingshort-lived information generated in the trading pit. When much of the tradingactivity shifted to the electronic platform, the informational advantage enjoyedby locals over off-floor traders may have diminished, making scalping more dif-ficult.
(6) Specialization in open outcry or electronic trading during the side-by-side period: Many traders successfully adapted to the side-by-side trading anduse both the floor and Globex for their personal trading. Some floor traders,however, continued trading exclusively on the floor after introduction of day-time electronic trading on NYMEX. Kurov and Lasser (2004) provide evidencethat floor traders may be able to extract information from the order flow in theopen outcry trading pits to trade profitably on Globex. These traders are alsouniquely positioned to arbitrage between open outcry and electronic executionplatforms. Therefore, traders using both trading platforms may have a survivaladvantage over their counterparts who are using only one of the platforms.
The considerations above lead to the following hypotheses:
Hypothesis 1: Trading experience has a positive effect on trader profitability andprobability of trader survival.
Hypothesis 2: Trader sophistication has a positive effect on trader profitabilityand probability of trader survival.
Hypothesis 3: Dual trading increases trading profits and probability of tradersurvival.
Hypothesis 4: Traders trading in multiple markets of the energy complex have asurvival advantage, particularly in side-by-side trading.
Hypothesis 5: The effect of trading style on profitability and probability of tradersurvival depends on the trading mechanism.
Hypothesis 6: Traders using both trading platforms in side-by-side trading aremore likely to survive than those who trade exclusively on the floor or only onGlobex.
Exchange locals are trading professionals with heterogeneous levels of trad-ing skill (e.g., Manaster & Mann, 1996). Electronic trading requires differentskills than does traditional pit trading. It is an empirical question as to whether
825

18 Boyd and Kurov
Journal of Futures Markets DOI: 10.1002/fut
locals who exhibited superior performance in open outcry trading remain supe-rior traders in side-by-side trading. We test the following hypothesis:
Hypothesis 7: Trading profits of incumbent traders in side-by-side trading arepositively related to their average profits in pure open outcry trading.
According to Massimb and Phelps (1994), “compared with open outcry, anelectronic matching system imposes additional costs and risks on the local.”Chow, Lee, and Shyy (1996) note that, given a choice between open outcry andelectronic trading, exchange locals prefer floor trading because it allows themto use their trading skills and provides them with access to valuable informa-tion, such as the ability to observe behavior of other traders, hear ambientnoises on the floor, etc. Floor trading activity and, therefore, the amount ofinformation aggregated and generated in the trading pits, declined significantlyafter the introduction of side-by-side trading. To test whether the increasedattrition of locals in side-by-side trading apparent in Figure 3 can be fullyexplained by the large decline in trading profits, we propose the followinghypothesis:
Hypothesis 8: Controlling for trading profits, the introduction of side-by-sidetrading increases trader attrition.
5. EMPIRICAL RESULTS
5.1 Analysis of Trader Profits
Few profitable traders quit trading. Therefore, before turning to the analysis oftrader survival, we examine determinants of trading profits. In addition to set-ting the stage for the survival analysis, this subsection tests several of ourhypotheses relating to trader profits. The baseline regression specification is asfollows:
(1)
where Profitit is the standardized profit, EXPERit is the number of days (dividedby 100) up until the end of week t on which a particular trader has placed apersonal account trade, NRTit is the percentage of non-regular type trades inthe personal trading volume, DUALit is the dummy variable for dual traders,FOCUSit is the Herfindahl-type index representing concentration of personaltrading volume in a particular energy futures market, SCALPERit is the dummyvariable for scalpers, and PTRit is the dummy variable for position traders. The
� b6SCALPERit � b7PTRit � eit,
Profitit � ai � b1EXPERit � b2EXPER2it � b3NRTit � b4DUALit � b5FOCUSit
826

Trader Survival 19
Journal of Futures Markets DOI: 10.1002/fut
model for the side-by-side period also includes dummy variables for trader-weeks with exclusively floor or exclusively Globex personal trading. All variablesare measured at weekly intervals. To account for time variation in average prof-its and for trader heterogeneity, the model is estimated with period and/or indi-vidual fixed-effects.13
We estimate the model separately for the pure open outcry period, forincumbent local traders during the transition period from September 5, 2006to April 27, 2007, for all local traders in the entire side-by-side trading period,and finally for the full sample period. The estimation results for all of thesesample partitions are shown in Table IV. Consistent with hypothesis 1, in boththe pure outcry period and side-by-side period, there is a significant positiverelation between standardized profits and trader experience. The proxy forsophistication (the percentage of non-regular type trades) also has a significantpositive effect on trading profits, which provides some support to hypothesis 2.On the other hand, one could argue that using non-regular trades increases theprofits of a trader because such trades are more difficult to execute and are,therefore, more profitable on average. If this is the case, the positive relation-ship between sophistication and trader profitability would be driven by thehigher associated profits earned by traders who engage in non-regular trades.
We examined whether non-regular type trades are in fact more profitableon average than regular trades. We found the opposite: non-regular trades tend to be significantly less profitable on a per contract basis than regulartrades. Non-regular type trades also tend to be much larger than regular trades.Spread trades have less volatility and require lower margin requirements thanregular trades, and traders use them to control the overall portfolio risk. Thefinding of lower profitability of non-regular trades is in line with the traditionalrisk-return tradeoff. We conclude that our results relating to the effect of tradersophistication on profitability are not being driven by higher profits earnedfrom more complex trades.
Dual trading status is also positively related to profitability. Traders whofocus on a single market of the energy complex tend to perform significantlybetter than less focused traders in pure open outcry trading.
To test hypothesis 7, we estimate the model for the incumbent traders dur-ing the transition period with the average standardized profit for a given traderin the eight-month period before the introduction of side-by-side tradingincluded as an additional regressor.14 This variable, named Profit Before, servesas a proxy for trading skill in open outcry trading. Consistent with hypothesis 7,
13We use panel-corrected standard errors that adjust for contemporaneous correlation and heteroskedasticityacross traders.14Because the Profit Before variable is fixed for a given trader, we omit the individual fixed effects from thisestimation to avoid perfect multicollinearity.
827

TA
BL
E I
V
Det
erm
inan
ts o
f Pe
rson
al A
ccou
nt T
radi
ng P
rofit
s
Pur
e O
pen
Incu
mbe
nt T
rade
rsS
ide-
by-s
ide
Out
cry
Trad
ing
Dur
ing
Tran
siti
on P
erio
dTr
adin
gF
ull S
ampl
e Pe
riod
Fix
ed e
ffect
sP
erio
d an
d In
div.
Per
iod
and
Indi
v.P
erio
dP
erio
d an
d In
div.
Per
iod
and
Indi
v.In
divi
dual
EX
PE
R0.
468
(0.0
60)*
**�
0.00
8 (0
.122
)0.
028
(0.0
32)
0.06
4 (0
.017
)***
0.08
4 (0
.014
)***
0.04
7 (0
.021
)**
EX
PE
R2
�0.
068
(0.0
11)*
**�
0.04
6 (0
.010
)***
�0.
005
(0.0
05)
�0.
008
(0.0
01)*
**�
0.01
0 (0
.001
)***
�0.
007
(0.0
02)*
**N
RT
0.10
2 (0
.041
)**
0.12
2 (0
.038
)***
0.26
1 (0
.025
)***
0.05
6 (0
.018
)***
0.03
5 (0
.016
)**
0.04
5 (0
.018
)**
DU
AL
0.07
7 (0
.021
)***
0.04
3 (0
.025
)*0.
060
(0.0
14)*
**0.
040
(0.0
12)*
**0.
089
(0.0
10)*
**0.
096
(0.0
10)*
**F
OC
US
0.13
9 (0
.066
)**
0.22
7 (0
.069
)***
0.14
2 (0
.052
)***
0.03
8 (0
.028
)0.
142
(0.0
27)*
**0.
177
(0.0
30)*
**S
CA
LPE
R0.
281
(0.0
18)*
**0.
087
(0.0
21)*
**0.
101
(0.0
17)*
**0.
059
(0.0
10)*
**0.
160
(0.0
09)*
**0.
157
(0.0
09)*
**P
TR
�0.
345
(0.0
30)*
**�
0.16
6 (0
.033
)***
�0.
138
(0.0
25)*
**�
0.11
6 (0
.015
)***
�0.
252
(0.0
15)*
**�
0.26
0 (0
.015
)***
Pro
fit B
efor
e–
–0.
366
(0.0
30)*
**–
––
SB
S–
––
––
�0.
430
(0.0
45)*
**O
nly
Flo
or–
�0.
003
(0.0
24)
�0.
077
(0.0
17)*
**0.
045
(0.0
17)*
**–
–O
nly
Glo
bex
–�
0.11
4 (0
.030
)***
�0.
201
(0.0
26)*
**�
0.10
7 (0
.014
)***
––
Sam
ple
perio
d1/
3/05
–9/1
/06
9/5/
06–4
/30/
079/
5/06
–4/3
0/07
9/5/
06–2
/27/
091/
3/05
–2/2
7/09
1/3/
05–2
/27/
09N
umbe
r of
trad
ers
770
687
687
1,00
01,
064
1,06
4O
bser
vatio
ns51
,797
19,6
6319
,663
74,9
6312
6,76
012
6,76
0R
20.
283
0.19
50.
114
0.16
50.
226
0.19
3
The
tabl
e re
port
s co
effic
ient
s fo
r th
e fo
llow
ing
pane
l reg
ress
ion
(bas
e sp
ecifi
catio
n):
whe
re P
rofit
itis
the
stan
dard
ized
pro
fit, E
XP
ER
itis
the
num
ber
of d
ays
(div
ided
by
100)
up
until
the
end
of w
eek
ton
whi
ch a
par
ticul
ar tr
ader
has
pla
ced
a pe
rson
al a
ccou
nt tr
ade,
NR
Tit
is th
epe
rcen
tage
of n
onre
gula
r ty
pe tr
ades
in th
e pe
rson
al tr
adin
g vo
lum
e, D
UA
L itis
the
dum
my
varia
ble
for
dual
trad
ers,
FO
CU
Sit
is th
e H
erfin
dahl
-typ
e in
dex
repr
esen
ting
conc
entr
atio
n of
per
sona
ltr
adin
g vo
lum
e in
a p
artic
ular
ene
rgy
futu
res
mar
ket,
SC
ALP
ER
itis
the
dum
my
varia
ble
for
scal
pers
, and
PT
Rit
is th
e du
mm
y va
riabl
e fo
r po
sitio
n tr
ader
s. P
rofit
Bef
ore i
is th
e av
erag
e st
anda
rd-
ized
pro
fit f
or in
cum
bent
tra
der
iove
r th
e pe
riod
from
Jan
uary
3,
2006
to
Sep
tem
ber
1, 2
006.
SB
Stis
a d
umm
y va
riabl
e th
at is
equ
al t
o on
e af
ter
the
intr
oduc
tion
of s
ide-
by-s
ide
trad
ing
onS
epte
mbe
r 5,
200
6. O
nly
Flo
oran
d O
nly
Glo
bex
are
dum
my
varia
bles
for
trad
er w
eeks
with
exc
lusi
vely
floo
r or
exc
lusi
vely
Glo
bex
pers
onal
trad
ing,
res
pect
ivel
y. A
ll va
riabl
es a
re m
easu
red
atw
eekl
y in
terv
als.
Pan
el-c
orre
cted
sta
ndar
d er
rors
that
adj
ust f
or c
onte
mpo
rane
ous
corr
elat
ion
and
hete
rosk
edas
ticity
acr
oss
trad
ers
are
show
n in
par
enth
eses
. *, *
*, *
** in
dica
te th
at th
e co
effi-
cien
t is
stat
istic
ally
sig
nific
ant a
t 10,
5, a
nd 1
% le
vels
, res
pect
ivel
y.
Pro
fitit
�a
i�b
1EX
PE
Rit
�b
2EX
PE
R2 it
�b
3NR
Tit
�b
4DU
AL i
t�b
5FO
CU
Sit
�b
6SC
ALP
ER
it�b
7PT
Rit
�e
it,

Trader Survival 21
Journal of Futures Markets DOI: 10.1002/fut
the coefficient estimate of this variable shown in Table IV is positive andstrongly significant, indicating that good open outcry traders continue earningabove-average profits in side-by-side trading. The results for the full sampleperiod with a dummy variable for side-by-side trading are shown in the last col-umn of Table IV. The coefficient estimate of this dummy confirms that theintroduction of side-by-side trading was followed by a significant decline inaverage trading performance.
5.2 Analysis of Trader Survival
Survival analysis is used for studying the occurrence and timing of certainevents, where an event is defined as a qualitative change that can be situated intime (e.g., Allison, 1995). A survival model describes the probability distributionof event times. Survival models are widely used in the biological and medicalsciences. Such models have also been used in financial research. For example,Lo, MacKinlay and Zhang (2002) use survival modeling to examine the deter-minants of limit order executions. We apply a survival model to study the prob-ability that a trader will exit the sample, i.e., will fail to survive.
A trader begins trading at t � 0, which is either the first week of the sam-ple estimation period or the first week that the trader appears in our sample,whichever is later. We are interested in determining the factors affecting thelikelihood that the trader will quit trading at time t. We model this likelihoodusing the Cox hazard regression. This model has two attractive features. First,as opposed to the accelerated failure model that is also used in survival analy-sis, the Cox regression does not require assumption of a probability distributionfor survival times. Secondl the Cox hazard model accommodates time-varyingcovariates. This feature of the Cox model is useful because the trader charac-teristics that we examine change over time, and such changes may affect theprobability of trader failure. The model represents the hazard of individual i attime t as a function of k time-varying covariates as follows:
where h0t is an unspecified non-negative baseline hazard function. In a log-lin-ear form, the model becomes:
where at � log h0t.A juxtaposition of median trading profits shown in Figure 2 with the num-
ber of trader exits in Figure 3 suggests a strong relation between profits andtrader survival. Figure 4 shows a large decline in average standardized trading
loghit � at � b1xi1t � . . . � bkxikt,
hit � h0t exp(b1xi1t � . . . � bkx ikt),
829

22 Boyd and Kurov
Journal of Futures Markets DOI: 10.1002/fut
profits in the weeks before a trader exits. Trader characteristics discussed inSection 4 may affect trader survival either directly or through their effect ontrading profits or, more likely, both. In other words, the effect of trader charac-teristics on survival may not be fully captured by profits. To examine the effectof profits on trader survival, as well as the effect of our other explanatory vari-ables, controlling for profits, we include the standardized personal accounttrading profit in the survival model. To test whether traders are more likely toexit trading after a streak of losses, we include the number of losing weeks fortrader i in the last five trading weeks as another covariate. We test our hypothe-ses relating to survival of local traders using the following Cox regression:
(2)
where hit is the hazard of trader failure, LWit is the number of losing weeks fortrader i in the last five weeks of trading. The remaining variables are defined inthe previous subsection.15 The model for the side-by-side period also includes adummy variable for traders who started trading during the open outcry period.The model is estimated for the same four sample partitions as the profitsregression in the previous subsection. The survival time for a particular traderis divided into a series of intervals, where the length of each interval representsthe number of calendar weeks between the end of week t and the end of theprevious week when the trader appeared in the sample. The trader survival sta-tus is represented by an indicator variable that, for example, takes the value of1 if an event (trader failure) occurred in that interval and 0 if the event has notoccurred (signifying a censored observation). As trader failures are only presentin a small proportion of trader weeks, the percentage of censored observationsexceeds 99% in all cases.
The survival model estimation results are shown in Table V. As expected,higher profits reduce the trader failure hazard. Controlling for current profits,the number of recent losing weeks is strongly positively related to failure hazardacross the four sample partitions. In the full sample, one additional loosingweek in the last five weeks of trading increases failure hazard by about 40%.
Supporting hypothesis 1, the proxy for trader experience is negativelyrelated to the hazard of trader failure. The hazard ratio of this coefficient dur-ing the pure open outcry period is about 0.41.16 This means that for a 100-day
� b5DUALit � b6FOCUSit � b7SCALPERit � b8PTRit,
log hit � at � b1Profitit � b2LWit � b3EXPERit � b4NRTit
15If the square of the experience variable is included in the model, the coefficient estimates of EXPER andEXPER2 become insignificant. Adding the squared experience term in the survival model reduces the modelfit adjusted for the number of parameters, as measured by the Schwarz criterion (SBC). We also performed arobustness check that showed that the effect of experience on failure hazard is approximately linear.16The hazard ratio for coefficient bk is simply .ebk
830

TA
BL
E V
Sur
viva
l Mod
el E
stim
ates
Incu
mbe
nt T
rade
rsP
ure
Ope
n O
utcr
y Tr
adin
gD
urin
g Tr
ansi
tion
Per
iod
Sid
e-by
-sid
e Tr
adin
gF
ull S
ampl
e Pe
riod
Coe
ffici
ent
Haz
ard
Rat
ioC
oeffi
cien
tH
azar
d R
atio
Coe
ffici
ent
Haz
ard
Rat
ioC
oeffi
cien
tH
azar
d R
atio
Pro
fit�
0.30
(0.
09)*
**0.
74�
0.27
(0.
12)*
**0.
76�
0.18
(0.
05)*
*0.
84�
0.21
(0.
04)*
**0.
81LW
0.39
(0.
10)*
**1.
480.
33 (
0.09
)***
1.40
0.27
(0.
04)*
**1.
320.
34 (
0.04
)***
1.40
EX
PE
R�
0.89
(0.
21)*
**0.
41�
0.22
(0.
09)*
*0.
81�
0.05
(0.
04)
0.95
�0.
13 (
0.03
)***
0.88
NR
T�
1.76
(0.
38)*
**0.
17�
0.29
(0.
35)
0.75
�0.
52 (
0.16
)***
0.59
�0.
61 (
0.14
)***
0.54
DU
AL
�1.
34 (
0.35
)***
0.26
�0.
48 (
0.28
)*0.
62�
0.17
(0.
13)
0.84
�0.
41 (
0.12
)***
0.66
FO
CU
S0.
16 (
0.87
)1.
171.
08 (
0.80
)2.
950.
97 (
0.31
)***
2.65
0.85
(0.
28)*
**2.
35S
CA
LPE
R�
1.26
(0.
54)*
*0.
280.
13 (
0.33
)1.
130.
33 (
0.13
)***
1.39
0.18
(0.
13)
1.19
PT
R0.
19 (
0.34
)1.
20�
0.73
(0.
33)*
*0.
480.
04 (
0.14
)1.
040.
24 (
0.12
)**
1.27
Onl
y F
loor
––
1.52
(0.
35)*
**4.
551.
15 (
0.19
)***
3.15
––
Onl
y G
lobe
x–
–0.
99 (
0.37
)***
2.71
0.98
(0.
16)*
**2.
67–
–S
BS
––
––
––
0.85
(0.
17)*
**2.
33In
cum
bent
Tra
der
––
––
0.23
(0.
16)
1.26
––
Sam
ple
perio
d1/
3/05
–9/1
/06
9/5/
06–4
/30/
079/
5/06
–2/2
7/09
1/3/
05–2
/27/
09O
bser
vatio
ns48
,763
19,6
3773
,746
122,
509
Num
ber
of F
ailu
res
6077
430
490
The
tabl
e re
port
s co
effic
ient
s fo
r th
e fo
llow
ing
Cox
sur
viva
l reg
ress
ion
(bas
e sp
ecifi
catio
n):
whe
re h
itis
the
haz
ard
of t
rade
r fa
ilure
, a
t�
log
h 0tis
a b
asel
ine
haza
rd r
ate,
Pro
fitit
is t
he s
tand
ardi
zed
profi
t, LW
itis
the
num
ber
of lo
sing
wee
ks f
or t
rade
r ii
n th
e la
st fi
ve w
eeks
of
trad
ing,
EX
PE
Rit
is th
e nu
mbe
r of
day
s (d
ivid
ed b
y 10
0) u
p un
til th
e en
d of
wee
k to
n w
hich
a p
artic
ular
trad
er h
as p
lace
d a
pers
onal
acc
ount
trad
e, N
RT
itis
the
perc
enta
ge o
f non
regu
lar
type
trad
es in
the
pers
onal
tra
ding
vol
ume,
DU
AL i
tis
the
dum
my
varia
ble
for
dual
tra
ders
, F
OC
US
itis
the
Her
finda
hl-t
ype
inde
x re
pres
entin
g co
ncen
trat
ion
of p
erso
nal t
radi
ng v
olum
e in
a p
artic
ular
ene
rgy
futu
res
mar
ket,
SC
ALP
ER
itis
the
dum
my
varia
ble
for
scal
pers
, an
d P
TR
itis
the
dum
my
varia
ble
for
posi
tion
trad
ers.
Onl
y F
loor
and
Onl
y G
lobe
xar
e du
mm
y va
riabl
es f
or t
rade
r w
eeks
with
excl
usiv
ely
floor
or
excl
usiv
ely
Glo
bex
pers
onal
tra
ding
, re
spec
tivel
y. S
BS
tis
a d
umm
y va
riab
le t
hat
is e
qual
to
one
afte
r th
e in
trod
uctio
n of
sid
e-by
-sid
e tr
adin
g on
Sep
tem
ber
5, 2
006.
Incu
mbe
nt T
rade
r iis
a d
umm
y va
riabl
e fo
r tr
ader
s w
ho s
tart
ed tr
adin
g be
fore
intr
oduc
tion
of s
ide-
by-s
ide
trad
ing.
All
varia
bles
are
mea
sure
d at
wee
kly
inte
rval
s. S
tand
ard
erro
rs a
re s
how
n in
pare
nthe
ses.
*, *
*, *
** in
dica
te th
at th
e co
effic
ient
is s
tatis
tical
ly s
igni
fican
t at 1
0, 5
, and
1%
leve
ls, r
espe
ctiv
ely.
log
h it�a
t�b
1Pro
fitit
�b
2LW
it�b
3EX
PE
Rit
�b
4NR
Tit
�b
5DU
AL i
t�b
6FO
CU
Sit
�b
7SC
ALP
ER
it�b
8PT
Rit,

24 Boyd and Kurov
Journal of Futures Markets DOI: 10.1002/fut
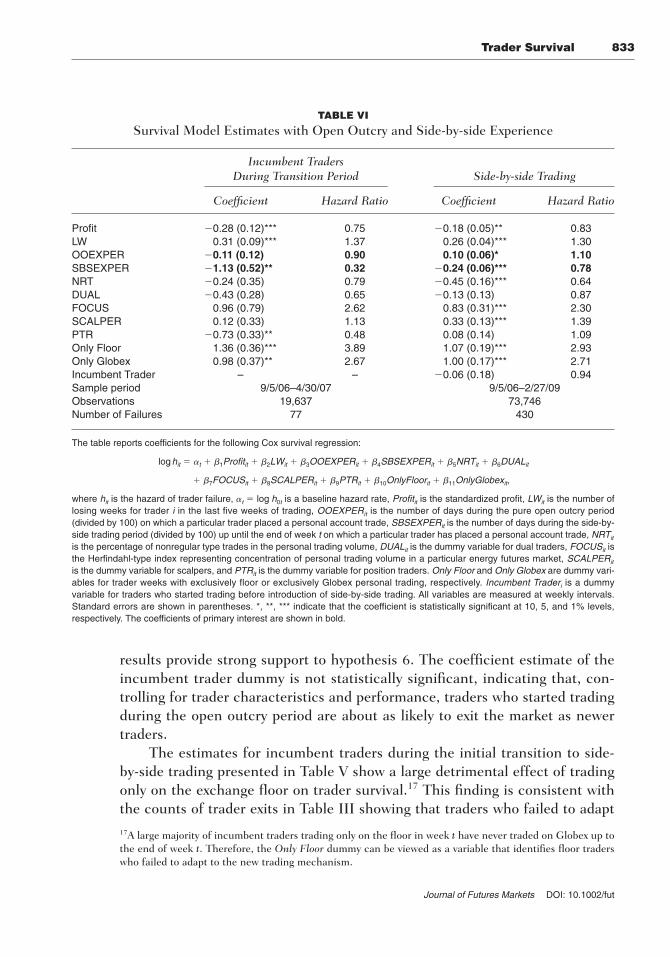
increase in trading experience the hazard of failure declines by about 59%(0.41 � 1 � �0.59). The coefficient estimate of the experience variable for theside-by-side trading period is also negative, although it is not statistically signif-icant. A possible explanation for the relatively weak effect of experience on sur-vival in side-by-side trading is that traders with the most experience wereincumbent traders who primarily had experience of open outcry trading. To testthis conjecture, we re-estimate the survival model after decomposing the expe-rience variable into open outcry experience and experience in side-by-side trad-ing. The results reported in Table VI show that the experience of side-by-sidetrading has a strong negative effect on failure hazard.
As shown in Table V and consistent with our second hypothesis, tradersophistication, proxied by the percentage of non-regular type trades, alsoreduces failure hazard in both sub-sample periods. The negative coefficientestimate of the dual trading dummy indicates that dual traders are less likely tofail. The effect of dual trading on survival is especially strong in the pure floortrading period, implying a decline of the probability of failure for dual traders of about 74%. This finding supports hypothesis 3. The relatively weak effect ofdual trading on survival in side-by-side trading is consistent with lower demandfor floor broker intermediation under this trading mechanism. The degree ofconcentration of personal trading in a particular energy market has no signifi-cant effect on trader failure hazard during the pure open outcry period. In con-trast, traders who trade in multiple energy markets seem to have a significantsurvival advantage in side-by-side trading. This result lends some support tohypothesis 4.
Consistent with hypothesis 5, the survival model estimates in Table Vshow that the effect of trading style on the probability of trader survivaldepends on the trading mechanism. In pure floor trading, scalpers appear tohave a significant survival advantage. In the side-by-side trading period, how-ever, scalping seems to increase failure hazard. Scalpers tend to act as marketmakers in open outcry futures markets, maintaining bid-ask spreads to com-pensate them for providing liquidity. Their ability to trade profitably depends onshort-lived information signals generated in open outcry trading pits. The bid-ask spreads collapsed with the introduction of electronic trading. The floortrading activity declined, possibly eroding the informational advantage enjoyedby locals over off-floor traders. These changes are likely to contribute to thehigh failure rate of scalpers in side-by-side trading.
Further, traders who trade exclusively on the floor or only on Globex havemuch higher failure hazard than traders who use both trading platforms inside-by-side trading. For example, based on the estimated hazard ratio, fortraders who trade only on the exchange floor, the failure hazard is more thanthree times as high as for traders who utilize both trading platforms. These
832
Trader Survival 25
Journal of Futures Markets DOI: 10.1002/fut
results provide strong support to hypothesis 6. The coefficient estimate of theincumbent trader dummy is not statistically significant, indicating that, con-trolling for trader characteristics and performance, traders who started tradingduring the open outcry period are about as likely to exit the market as newertraders.
The estimates for incumbent traders during the initial transition to side-by-side trading presented in Table V show a large detrimental effect of tradingonly on the exchange floor on trader survival.17 This finding is consistent withthe counts of trader exits in Table III showing that traders who failed to adapt
TABLE VI
Survival Model Estimates with Open Outcry and Side-by-side Experience
Incumbent TradersDuring Transition Period Side-by-side Trading
Coefficient Hazard Ratio Coefficient Hazard Ratio
Profit �0.28 (0.12)*** 0.75 �0.18 (0.05)** 0.83LW 0.31 (0.09)*** 1.37 0.26 (0.04)*** 1.30OOEXPER �0.11 (0.12) 0.90 0.10 (0.06)* 1.10SBSEXPER �1.13 (0.52)** 0.32 �0.24 (0.06)*** 0.78NRT �0.24 (0.35) 0.79 �0.45 (0.16)*** 0.64DUAL �0.43 (0.28) 0.65 �0.13 (0.13) 0.87FOCUS 0.96 (0.79) 2.62 0.83 (0.31)*** 2.30SCALPER 0.12 (0.33) 1.13 0.33 (0.13)*** 1.39PTR �0.73 (0.33)** 0.48 0.08 (0.14) 1.09Only Floor 1.36 (0.36)*** 3.89 1.07 (0.19)*** 2.93Only Globex 0.98 (0.37)** 2.67 1.00 (0.17)*** 2.71Incumbent Trader – – �0.06 (0.18) 0.94Sample period 9/5/06–4/30/07 9/5/06–2/27/09Observations 19,637 73,746Number of Failures 77 430
The table reports coefficients for the following Cox survival regression:
where hit is the hazard of trader failure, at � log h0t is a baseline hazard rate, Profitit is the standardized profit, LWit is the number oflosing weeks for trader i in the last five weeks of trading, OOEXPERit is the number of days during the pure open outcry period(divided by 100) on which a particular trader placed a personal account trade, SBSEXPERit is the number of days during the side-by-side trading period (divided by 100) up until the end of week t on which a particular trader has placed a personal account trade, NRTit
is the percentage of nonregular type trades in the personal trading volume, DUALit is the dummy variable for dual traders, FOCUSit isthe Herfindahl-type index representing concentration of personal trading volume in a particular energy futures market, SCALPERit
is the dummy variable for scalpers, and PTRit is the dummy variable for position traders. Only Floor and Only Globex are dummy vari-ables for trader weeks with exclusively floor or exclusively Globex personal trading, respectively. Incumbent Traderi is a dummy variable for traders who started trading before introduction of side-by-side trading. All variables are measured at weekly intervals.Standard errors are shown in parentheses. *, **, *** indicate that the coefficient is statistically significant at 10, 5, and 1% levels,respectively. The coefficients of primary interest are shown in bold.
� b7FOCUSit � b8SCALPERit � b9PTRit � b10OnlyFloorit � b11OnlyGlobexit,
log hit � at � b1Profitit � b2LWit � b3OOEXPERit � b4SBSEXPERit � b5NRTit � b6DUALit
17A large majority of incumbent traders trading only on the floor in week t have never traded on Globex up tothe end of week t. Therefore, the Only Floor dummy can be viewed as a variable that identifies floor traderswho failed to adapt to the new trading mechanism.
833

26 Boyd and Kurov
Journal of Futures Markets DOI: 10.1002/fut
to the new hybrid trading mechanism accounted for a disproportionate share oftrader failures after the introduction of side-by-side trading.
To test hypothesis 8 that the introduction of side-by-side trading increasestrader attrition even after controlling for trading profits, we use the full sampleperiod to estimate the survival model that includes a dummy variable for theside-by-side period. The results are shown in the last column of Table V. The coefficient estimate of the side-by-side dummy is positive and strongly sig-nificant. The corresponding hazard ratio indicates that, controlling for profitsand trader characteristics, the probability of trader failure more than doubledin side-by-side trading. This finding lends evidence supporting hypothesis 8.
Overall, we find that trading profits, trader experience and sophistication,dual trading status, market specialization and trading style have strong effectson survival of futures traders. Most of these characteristics, with the exceptionof market specialization and trading style, have qualitatively similar effects onsurvival in pure floor trading and in side-by-side trading.
6. CONCLUSION
This research serves to evaluate the impact of an exogenous change in marketstructure on the behavior and survival of traders. Our data covers NYMEX’sintroduction of electronic trading on Globex and allows for the tracking of indi-vidual trading activity for exchange local traders. We study the shift of localtraders from open-outcry to side-by-side trading. This shift creates a naturalexperiment to examine trader adaptation, profitability and survival under twodifferent trading mechanisms: pure floor trading and side-by-side floor andelectronic trading.
We find that most incumbent floor traders made a transition to the newmarket structure, although the rate at which they exit the market increased sig-nificantly. Most of these incumbent individual exchange locals also chose toutilize both trading platforms, which facilitated the use of information gleanedfrom order flow in the open outcry trading pits for transactions on Globex.Further, these traders had to adapt to the new, more competitive, trading envi-ronment, which eroded profits and required them to transact more frequentlyusing smaller trades in order to survive. We find that skillful traders whoshowed superior profitability in pure open outcry trading continue to earnabove-average profits in side-by-side trading.
Estimates of our survival model show that the survival of local traders is pos-itively influenced by trader profitability, experience, sophistication, and dual trad-ing under both trading mechanisms. In side-by-side trading, traders using severalenergy futures markets tend to survive longer. Furthermore, we show that localswho use both trading platforms have a survival advantage under side-by-side
834

Trader Survival 27
Journal of Futures Markets DOI: 10.1002/fut
trading compared to those who trade only on the floor or exclusively in the elec-tronic market. We also find that scalpers have a survival advantage in pure openoutcry trading, but are more likely than other traders to exit the market in side-by-side trading. This result is consistent with the notion that increased competitionfrom off-floor limit order traders, sharply lower bid-ask spreads and declining floortrading activity have made scalping more difficult in side-by-side trading.Overall, we find that most local traders have been able to adapt to a dramaticchange in the trading mechanism, although the surviving traders are not nearlyas profitable as they were under pure open outcry trading.
BIBLIOGRAPHY
Alchian, A. A. (1950). Uncertainty, evolution, and economic theory. Journal of PoliticalEconomy, 58, 211–221.
Theory, 58, 9–40.
Chakravarty, S., & Li, K. (2003). An examination of own account trading by dualtraders in futures markets. Journal of Financial Economics, 69, 375–397.
Chow, E. H., Lee, J. H., & Shyy, G. (1996). Trading mechanism and trading prefer-ences on a 24-hour futures market: A case study of the floor/GLOBEX switch onMATIF. Journal of Banking and Finance, 20, 1695–1713.
Coval, J. D., & Shumway, T. (2005). Do behavioral biases affect prices? Journal ofFinance, 60, 1–34.
Feng, L., & Seasholes, M. S. (2005). Do investor sophistication and trading experienceeliminate behavioral biases in financial markets? Review of Finance, 9, 305–351.
Ferguson, M. F., & Mann, S. C. (2001). Execution costs and their intraday variation infutures markets. Journal of Business, 74, 125–160.
Fishman, M., & Longstaff, F. (1992). Dual trading in futures markets. Journal ofFinance, 47, 643–671.
Kogan, L., Ross, S. A., Wang, J., & Westerfield, M. M. (2006). The price impact andsurvival of irrational traders. Journal of Finance, 61, 195–229.
Kogan, L., Ross, S. A., Wang, J., & Westerfield, M. M. (2009). Market selection.Working paper, National Bureau of Economic Research.
Markets, 25, 1067–1092.Kurov, A., & Lasser, D. (2004). Price dynamics in the regular and E-mini futures mar-
kets. Journal of Financial and Quantitative Analysis, 39, 365–384.Kuserk, G. J., & Locke, P. R. (1993). Scalper behavior in futures markets: An empirical
examination. Journal of Futures Markets, 13, 409–431.Liu, Y. J., Wang, M. C., & Zhao, L. (2010). Narrow framing: Professionalism, sophisti-
835
Blume, L., & Easley, D. (1992). Evolution and market behavior. Journal of EconomicNC: SAS Institute.
New York: Macmillan Publishers .
cation, and experience. Journal of Futures Markets, 30, 203–229.
Allison, P. D. (1995). Survival analysis using the SAS system: A practical guide. Cary,
L. Blume (Eds.), The New Palgrave Dictionary of Economics, Volume 5 (pp. 296–300).
Kurov, A. (2005). Execution quality in open outcry futures markets. Journal of Futures
Blume, L., & Easley, D. (2008). Market competition and selection. In: S. N. Durlauf &

28 Boyd and Kurov
Journal of Futures Markets DOI: 10.1002/fut
Lo, A. W., MacKinlay, A. C., & Zhang, J. (2002). Econometric models of limit orderexecutions. Journal of Financial Economics, 65, 31–71.
Locke, P. R., & Mann, S. C. (2005). Professional trader discipline and trade disposi-tion. Journal of Financial Economics, 76, 401–444.
Locke, P. R., & Onayev, Z. (2007). Order flow, dealer profitability, and price formation.Journal of Financial Economics, 85, 857–887.
MacDonald, A., Chazan, G., & Cui, C. (2009). Oil ‘speculators’ under fire. The WallStreet Journal, July 8, 2009, A1.
Manaster, S., & Mann, S. C. (1996). Life in the pits: Competitive market making andinventory control. Review of Financial Studies, 9, 953–975.
Massimb, M. N., & Phelps, B. D. (1994). Electronic trading, market structure and liq-uidity. Financial Analysts Journal, 50, 39–50.
Menkveld, A. J., Sarkar, A., & van der Wel, M. (2011). Customer order flow, intermedi-aries, and discovery of the equilibrium risk-free rate. Journal of Financial andQuantitative Analysis; forthcoming.
Seru, A., Shumway, T., & Stoffman, N. (2010). Learning by trading. Review ofFinancial Studies, 23, 705–739.
Smith, J. M. (1982). Evolution and the theory of games. Cambridge, MA: CambridgeUniversity Press.
Yan, H. (2008). Natural selection in financial markets. Management Science, 54,1935–1950.
836