TradeDiversityandStages - Uniwersytet Warszawski
22
Trade Diversity and Stages of Development–Evidence on EU Countries Aleksandra Parteka 1 , Ph.D., Gdansk University of Technology, Faculty of Management and Economics Keywords: diversification, concentration, trade, economic development JEL: F14, O11, O52 1. Introduction Following recent interest in the relationship between the diversity of eco- nomic activity and stages of economic development [Cadot et al., 2011a; Imbs and Wacziarg, 2003], the main purpose of this paper is to present related em- pirical evidence concerning EU countries. In particular, we will aim at locat- ing European economies within the so-called ‘diversification curve’ (re- vealed in international panel data settings) which approximates the link be- tween trade diversity measures and income per capita levels. The process of economic development (the movement along stages of de- velopment) is marked by a process of a structural transformation in which countries: (i) change the set of produced (and traded) goods (ii) change the typology of goods, typically moving towards more demanding products. Here we focus on the first aspect, analyzing quantitative changes in the composi- tion of trade baskets, occurring as countries move towards higher levels of in- come per capita 2 . It has been found that the effects of trade (in particular ex- port) diversification on economic growth can be nonlinear, with developing countries gaining most from diversification and higher income countries benefiting from major specialization [Hesse, 2009]. Consequently, we expect that EU countries, being mainly high-income ones, should already have high- ekonomia 30 23 1 The author gratefully acknowledges financial support from Polish Ministry of Science and Higher Education (research grant 2011/01/B/HS4/04759). 2 Trade diversification in the economic growth process can also go along with changes in the relative importance of intra-industry trade (IIT) and inter-industry trade. For instance, Brülhart [2009, p. 417] shows that trade among high-income countries is characterized by the highest IIT shares on average while IIT among the low-income countries is almost non-existent. In the simplest way IIT can be seen as two-way trade of differentiated products with similar prices, but due to the growing importance of trade in qualitatively differentiated products, it has been disentangled into IIT in horizontally differentiated (similar) products and IIT in verti- cally differentiated products (with different quality). Vertical IIT (VIIT) accounts for specializa- tion in products of different quality within industries and can be further decomposed into ‘up-market’ VIIT and ‘down-market’ VIIT. Up-market VIIT takes place when unit values of ex- port flow are greater than import unit values.
Transcript of TradeDiversityandStages - Uniwersytet Warszawski

Trade Diversity and Stagesof Development–Evidence on EU CountriesAleksandra Parteka1, Ph.D., Gdansk University of Technology, Faculty of Managementand Economics
Keywords: diversification, concentration, trade, economic developmentJEL: F14, O11, O52
1. IntroductionFollowing recent interest in the relationship between the diversity of eco-
nomic activity and stages of economic development [Cadot et al., 2011a; Imbsand Wacziarg, 2003], the main purpose of this paper is to present related em-pirical evidence concerning EU countries. In particular, we will aim at locat-ing European economies within the so-called ‘diversification curve’ (re-vealed in international panel data settings) which approximates the link be-tween trade diversity measures and income per capita levels.
The process of economic development (the movement along stages of de-velopment) is marked by a process of a structural transformation in whichcountries: (i) change the set of produced (and traded) goods (ii) change thetypology of goods, typically moving towards more demanding products. Herewe focus on the first aspect, analyzing quantitative changes in the composi-tion of trade baskets, occurring as countries move towards higher levels of in-come per capita2. It has been found that the effects of trade (in particular ex-port) diversification on economic growth can be nonlinear, with developingcountries gaining most from diversification and higher income countriesbenefiting from major specialization [Hesse, 2009]. Consequently, we expectthat EU countries, being mainly high-income ones, should already have high-
ekonomia 30 23
1 The author gratefully acknowledges financial support from Polish Ministry of Science andHigher Education (research grant 2011/01/B/HS4/04759).
2 Trade diversification in the economic growth process can also go along with changes inthe relative importance of intra-industry trade (IIT) and inter-industry trade. For instance,Brülhart [2009, p. 417] shows that trade among high-income countries is characterized by thehighest IIT shares on average while IIT among the low-income countries is almost non-existent.In the simplest way IIT can be seen as two-way trade of differentiated products with similarprices, but due to the growing importance of trade in qualitatively differentiated products, ithas been disentangled into IIT in horizontally differentiated (similar) products and IIT in verti-cally differentiated products (with different quality). Vertical IIT (VIIT) accounts for specializa-tion in products of different quality within industries and can be further decomposed into‘up-market’ VIIT and ‘down-market’ VIIT. Up-market VIIT takes place when unit values of ex-port flow are greater than import unit values.

ly diversified trade structures and could actually gain from their decon-centration.
The analysis focuses on a group of EU27 countries, observed across theyears 1988–2010 and compared to a sample of 136 international economies atall levels of development. We will use very detailed product level statistics(six digit HS0, almost 5,000 product lines) to calculate synthetic measures oftraded products diversity. Importantly, the analysis will be performed simul-taneously for imports and exports which will allow us to confront patterns ofproduct diversification typical for both flows.
The remaining part of the paper is structured as follows: in Section 2 wewill briefly summarize related literature, focusing on the evidence concern-ing trade diversification process in European countries. Methodology used inthe present study (details on data and adopted measures of product diversity)will be described in Section 3. The core of the paper will be presented in Sec-tion 4 where we will first compare patterns of trade diversification in EU27sample with respect to the rest of the world, and subsequently estimateeconometrically the ‘diversification curve’, locating EU countries in a com-parative setting versus international trends. Both flexible nonparametricand parametric estimation methods will be used. Finally, Section 5 con-cludes the paper.
2. Related literatureRecent empirical literature on the relationship between diversification of
economic activity and stages of development originates mainly from the sem-inal contribution of Imbs and Wacziarg [2003] who were among the first to re-veal nonmonontonicity in the link between diversification and income percapita levels. Using measures of concentration calculated with sector levelemployment and export data, they revealed a specific hump shaped patternof diversification in the process of economic growth. Poor countries tend todeconcentrate their economic structures (introducing more varieties) but atsome point in the development process, economies tend to re-concentrate:such a pattern is illustrated by a U-shaped ‘diversification curve’, with a turn-ing point revealed by Imbs and Wacziarg to occur around $9,000 (1985 PPP).Such a ‘diversification curve’ was obtained by linking income per capita lev-els (plotted on horizontal axis) and the index of production concentration (onthe vertical axis). The U-shape of the curve results from the use of an inversemeasure of diversification (based on inequality/concentration index), conse-quently the decreasing part of the U-curve corresponds to the decreasingconcentration (increasing diversification) of economic activity along thedevelopment process, while the upward rising part of the U-curve illustratesthe re-concentration track.
Since then many studies deviated from Imbs and Wacziarg [2003] contribu-tion, introducing methodological or conceptual modifications in the originalapproach (see Cadot et al., 2012 for an excellent literature review). The
24 ekonomia 30
Aleksandra Parteka

U-shaped path of diversification followed by respecialization/reconcentra-tion was confirmed by Koren and Tenreyro [2007], using different productiondata. Other authors focused on the diversity visible in trade structures:Klinger and Lederman [2011] found a U-shaped pattern of diversification ofexports with a turning point at $22,500 (2000 PPP). Cadot et al. [2011a]reached a similar conclusion (turning point at $25,000, 2005 PPP) and moveda step further: in particular, they examined what forces can drive the upwardrising part of the curve. Using the decomposition properties of the Theil in-dex (employed as an inverse measure of product diversity) they explore in-tensive and extensive margins of trade3. The decreased concentration of ex-ported products typical for lower income countries results from a rise in thenumber of exported products (activity at extensive margin), intensive margindominates around the turning point and afterwards the extensive one domi-nates again: rich countries close export lines quicker than they open newones which explains the reconcentration track.
A slightly different stream of research proposed another view on thestages of diversification, where its degree for each country is assessed withrespect to the rest of the sample through the use of the so-called relative mea-sures of diversification [Bickenbach et al., 2010; de Benedictis et al., 2009]. Insuch a setting the relative diversification track dominates in the economicdevelopment process (countries’ economic structures become more andmore dissimilar with respect to the typical benchmark) and no robust ten-dency towards respecialization occurs4.
Export studies dominate the literature on trade diversification, while evi-dence on imports’ diversity and its relationship with economic development,performed in a panel data setting, is much more scarce. Most of the import re-lated studies focused on country-specific effects of a rise in imported inputsvariety on productivity and welfare (see Cadot et al., 2012, Section 5 for anoverview). A different aspect of import diversity—the geographical one—wasexamined for more countries by Cadot et al. [2011b], They analyze the geo-graphical concentration of OECD imports across countries of origin (i.e. thediversity of suppliers) and find that that reconcentration of imports after theyear 2000 was caused by rising importance of China as a supplier.
As far as the specific case of EU countries is concerned, the evidence onstages of trade diversification is rather limited, especially if we seek for stud-ies performed with a highly disaggregated trade data. Parteka [2009] has pre-sented patterns of evolving economic activity concentration with respect toincome per capita levels of 25 European countries (revealing U-shaped pat-
ekonomia 30 25
Trade Diversity and Stages of Development—Evidence on EU Countries
3 The distinction between the two margins became popular after the paper by Hummels andKlenow [2005]. Roughly speaking, the extensive margin concerns changes in the number of ac-tive product lines while intensive margin of trade refers to the variation in trade values for al-ready traded goods.
4 See Parteka [2010] for a comparison between the results obtained with absolute and rela-tive diversification measures calculated with employment and export sector level statistics.

tern similar to what Imbs and Wacziarg, 2003, found in an international sam-ple of countries) but the focus here is on employment and not on trade. Funkeand Ruhwedel [2005] calculate relative export variety measure based onFeenstra [1994] index, confirming the role of export variety fostering eco-nomic growth of 14 East European transition economies (1993–2000). Alongthese lines, Misztal [2011] argues that export diversification was a positivedeterminant of economic growth in 27 EU countries in the later period(1995–2009). To the best of our knowledge, EU-focused import-export studieson stages of diversification are missing.
3. Measurement
3.1. DataTrade statistics on imports and exports used in our study come from
UNComtrade and have been downloaded using World Integrated Trade Solu-tions software5. We use direct statistics for imports and mirrored data for ex-ports (imports are usually recorded with more accuracy than exports becauseimports generally generate tariff revenues while exports don't). Mirroringimplies using information from the partner, so that in order to obtain value ofexports from A to B we use data on imports from A reported by B. We are in-terested in tracing product diversification patterns in the course of time, sowe use as disaggregated data for a long period of time as possible: we rely onHS06 6-digit division7. We use automatic conversion tables from WITS to ob-tain concordance between various revisions of the HS system. After neces-sary clearing of rough data (eliminating ‘silent lines’—never traded goodsetc.) we are left with a set of 4,963 product lines (all commodities—the list ofchapters corresponding to broad product categories is reported in Table A1.in the Appendix). With these statistics for each country and year we will cal-culate the synthetic measures of product diversity (defined in Section 3.2)and then match them with income per capita data and additional countrylevel statistics. GDP per capita (in PPP, 2005 int. USD), population (in 1000)and GDP (in PPP, 2005 int. USD) statistics come from World Bank’s WorldDevelopment Indicators (release 2011).
26 ekonomia 30
Aleksandra Parteka
5 https://wits.worldbank.org/WITS6 HS stands for the Harmonized System. It is an international nomenclature for the classifi-
cation of products which allows participating countries to classify traded goods on a commonbasis for customs purposes. HS0 corresponds to the first launch of the system (1988/1992).Disaggregation deeper than 6-digit is not harmonized across countries so cannot be used incross-country studies.
7 “The six digits can be broken down into three parts. The first two digits (HS-2) identify thechapter the goods are classified in, e.g. 09 = Coffee, Tea, Maté and Spices. The next two digits(HS-4) identify groupings within that chapter, e.g. 09.02 = Tea, whether or not flavoured. Thenext two digits (HS-6) are even more specific, e.g. 09.02.10 Green tea (not fermented)…” (infor-mation from UNComtrade Knowledgebase http://unstats.un.org/unsd/tradekb/Knowledgebase/Harmonized-Commodity-Description-and-Coding-Systems-HS).
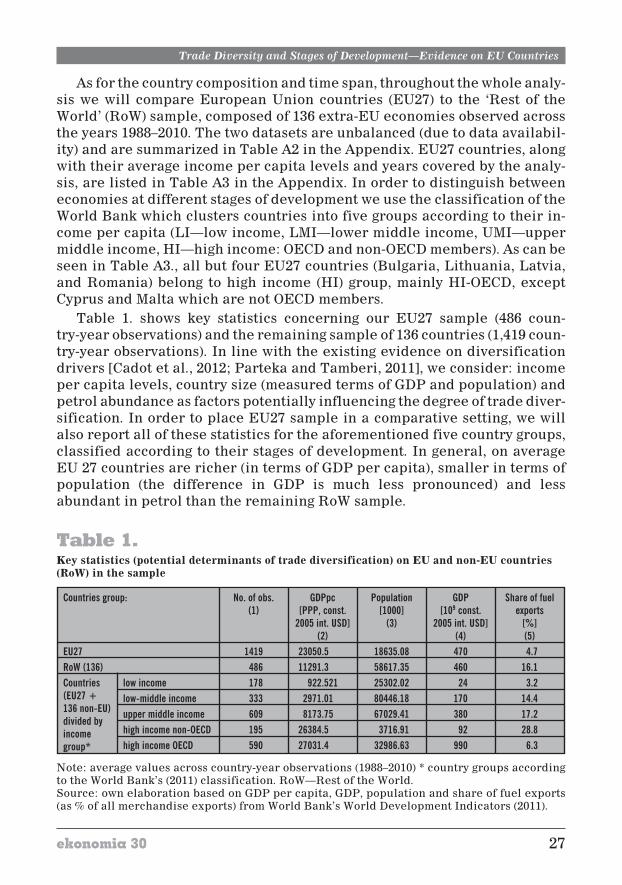
As for the country composition and time span, throughout the whole analy-sis we will compare European Union countries (EU27) to the ‘Rest of theWorld’ (RoW) sample, composed of 136 extra-EU economies observed acrossthe years 1988–2010. The two datasets are unbalanced (due to data availabil-ity) and are summarized in Table A2 in the Appendix. EU27 countries, alongwith their average income per capita levels and years covered by the analy-sis, are listed in Table A3 in the Appendix. In order to distinguish betweeneconomies at different stages of development we use the classification of theWorld Bank which clusters countries into five groups according to their in-come per capita (LI—low income, LMI—lower middle income, UMI—uppermiddle income, HI—high income: OECD and non-OECD members). As can beseen in Table A3., all but four EU27 countries (Bulgaria, Lithuania, Latvia,and Romania) belong to high income (HI) group, mainly HI-OECD, exceptCyprus and Malta which are not OECD members.
Table 1. shows key statistics concerning our EU27 sample (486 coun-try-year observations) and the remaining sample of 136 countries (1,419 coun-try-year observations). In line with the existing evidence on diversificationdrivers [Cadot et al., 2012; Parteka and Tamberi, 2011], we consider: incomeper capita levels, country size (measured terms of GDP and population) andpetrol abundance as factors potentially influencing the degree of trade diver-sification. In order to place EU27 sample in a comparative setting, we willalso report all of these statistics for the aforementioned five country groups,classified according to their stages of development. In general, on averageEU 27 countries are richer (in terms of GDP per capita), smaller in terms ofpopulation (the difference in GDP is much less pronounced) and lessabundant in petrol than the remaining RoW sample.
Key statistics (potential determinants of trade diversification) on EU and non-EU countries(RoW) in the sample
Countries group: No. of obs.(1)
GDPpc[PPP, const.
2005 int. USD](2)
Population[1000]
(3)
GDP[109 const.
2005 int. USD](4)
Share of fuelexports
[%](5)
EU27 1419 23050.5 18635.08 470 4.7RoW (136) 486 11291.3 58617.35 460 16.1Countries(EU27 +136 non-EU)divided byincomegroup*
low income 178 922.521 25302.02 24 3.2low-middle income 333 2971.01 80446.18 170 14.4upper middle income 609 8173.75 67029.41 380 17.2high income non-OECD 195 26384.5 3716.91 92 28.8high income OECD 590 27031.4 32986.63 990 6.3
Note: average values across country-year observations (1988–2010) * country groups accordingto the World Bank’s (2011) classification. RoW—Rest of the World.Source: own elaboration based on GDP per capita, GDP, population and share of fuel exports(as % of all merchandise exports) from World Bank’s World Development Indicators (2011).
ekonomia 30 27
Trade Diversity and Stages of Development—Evidence on EU Countries

3.2. Measures of imported and exported products’ diversificationAs the simplest measure of product diversity we consider the number of
active product lines with non-zero export (import) value, respectively for ex-port (import) diversification measures. We denote them as Nactive
itexp and
Nactiveitimp where i refers to country and t to time period. Additionally, we ex-
press the number of exported/imported products with respect to the numberof products effectively being exported (imported) at the world level at time t,obtaining R expelNactive
itand R impelNactive
it.
The process of product diversification at the extensive margin could bevisible through the increase in the number of traded goods. Hence, to quan-tify this issue we need to count the number of new product lines appearing inthe country’s export (import) portfolio. However, given that many trade rela-tions are extremely vulnerable and tend to disappear very quickly (as hasbeen documented by Besedes and Prusa, 2006), instead of a mere change inNactive
itexp and Nactive
itimp we calculate the number of new product lines
which are added to export (import) basket and, importantly, manage to sur-vive. In order to do so, we will adopt two alternative definitions. First, in linewith Besedes and Prusa [2006], for each country and time period we will de-fine a new product as such which was not exported (imported) by this countryin the prior year but started to be exported (imported) at time t and is still ex-ported (imported) in the following year (t + 1). This definition is based onone-year cutoff and three-year moving window to define the spell. The sec-ond definition (based on Cadot et al., 2011a) is more restrictive and usesa five-year moving window and a two-year cutoff. Consequently, we will countthe number of new product lines using the two alternative definitions:
� �Nnewit
1 exp , � �Nnewit
1 imp and � �Nnewit
2 exp , � �Nnewit
2 imp .Finally, we rely on Theil measure of product concentration which serves
as an inverse measure of product diversification (calculated as in Cadot et al.,2011a and based on Theil, 1972):
Theiln
x
x
x
xitikt
it
ikt
itk
nexp � �
�
�
�����
�������
�1
1
ln (1)
where i refers to countries, k = 1, …, n to products, x stands for exports’ value
while xx
nit
iktk
n
� �
�1 is the average (across products) export value of country i.
Similarly, in case of imports, the index is obtained as:
Theiln
m
m
m
mitimp ikt
it
ikt
itk
n
� ��
�
�����
�������
�1
1
ln (2)
with m referring to imports value. The computation of Theil index involvesthe use of natural logarithm, so in cases in which the argument of ln turnedout to be equal to zero (due to the presence of zero trade flow—products notpresent in country’s trade portfolio), we substituted it with a very small num-
28 ekonomia 30
Aleksandra Parteka

ber (10–10), which allowed us to compute correctly the index affecting its valueonly negligibly. The lower bound of Theil indices is 0 (and corresponds tomaximum product diversity within the analysed set of product lines) whilethe upper limit is equal to ln(n), signalling maximum product concentration(minimum diversity) of trade portfolio.
Summary statistics of import and export product diversifiction measures, sep-arately for EU27 and RoW samples, are reported in Table 4A in the Appendix.
4. Stages of import and export diversification
4.1. Prima facie evidence—EU27 versus RoW sampleIn Table 2 and Table 3 we report the comparison between measures of im-
ported and exported products diversity typical for EU27 countries in oursample and for other countries. First of all, it is clear that EU27 have well di-versified baskets of traded goods: on average they export 3,816 and import4,378 kinds of commodities (out of 4,963 products theoretically present in ourHS0 set). These values correspond, respectively, to 78% and 90% of goods ef-fectively exported and imported at the world level (column 2). For compari-son, countries from RoW sample, composed of 136 extra EU27 economies, im-port 77% and export only 47% of all goods that are imported (exported) in theworld. As can be seen, product heterogeneity varies greatly across develop-ment levels—the difference is especially pronounced in case of export port-folio (Table 2) with low income countries covering only 21% of the potentialexport basket and 83% for high income OECD countries. Note that high in-come non-OECD countries do not have very heterogeneous exports, mainlydue to the fact that they are often small (in terms of population) and petrolabundant countries (see Table 1), thus relying on exports of petrol products.
Measures of exported products diversity—EU27 versus other countries
Countries group: No of active exportproduct lines(max = 4963)
(1)
Relative numberof active exportproduct lines
(2)
Theil index(exports)
(3)
No of newexport lines
(1)(4)
No of newexport lines
(2)(5)
EU27 3816 0.47 2.750 162 64
RoW (136) 2299 0.78 4.700 189 69
Countries(EU27 +136 non-EU)divided byincomegroup*
low income 1014 0.21 5.718 155 49
low-middle income 1662 0.35 5.003 198 71
upper middle income 2528 0.52 4.438 222 84
high income non-OECD 2291 0.47 4.932 208 86
high income OECD 4063 0.83 2.821 131 49
Note: average values across country-year observations (1988–2010) * country groups accordingto the World Bank’s (2011) classification.Source: own elaboration based on trade data from UNComtrade.
ekonomia 30 29
Trade Diversity and Stages of Development—Evidence on EU Countries

Measures of imported products diversity—EU27 versus other countries
Countries group: No. of active importproduct lines(max = 4963)
(1)
Relative number ofactive importproduct lines
(2)
Theil index(imports)
(3)
No. of newimport lines
(1)(4)
No. of newimport lines
(2)(5)
EU27 4378 0.90 2.170 63 30
RoW (136) 3760 0.77 2.700 99 38
Countries(EU27 +non-EU)divided byincomegroup*
low income 3063 0.63 3.261 154 47
low-middle income 3476 0.71 2.943 127 50
upper middle income 3931 0.80 2.470 99 39
high income non-OECD 3746 0.77 2.865 99 38
high income OECD 4467 0.91 2.156 49 23
Note: average values across country-year observations (1988–2010) * country groups accordingto the World Bank’s (2011) classification.Source: own elaboration based on trade data from UNComtrade.
Similar pattern of varying export and import heterogeneity across variousstages of development is confirmed when we compare average values ofTheil index (column 3 of Table 2 and Table 3). Its low value for EU27 (2.75 incase of exports and 2.17 in case of imports) indicates a high degree of productheterogeneity and low product concentration.
As far as the process of diversification visible through the introduction(and survival) of new product lines is concerned, EU27 countries already hav-ing well diversified baskets of exported and imported products add everyyear less new lines than countries from the RoW sample (columns 4 and 5 ofTable 2 and Table 3).
4.2 Country specific trends (EU27)In order to provide evidence on trade diversity evolution in particular EU
countries from our sample, in Figure 1 we show plots of synthetic measure ofexport (Theilexp) and import (Theileimp) concentration against time. There issome heterogeneity across countries, but several common observations canbe done. First of all, most of the countries from the EU27 sample, being al-ready well developed ones (and classified as high income countries—see Ta-ble 3A in the Appendix) registered an increase in both import and exportmeasure of product concentration, which corresponds to the respecializationtrack. This is in line with Cadot et al. (2011a) pattern of trade reconcentrationat higher stages of economic development. Such a pattern, common for im-ports and exports, concerns such European countries as: AUT, BEL, CZE,FRA, GBR, GER, HUN, IRL, ITA, LTU, LUX (till 2007), NLD, SVK, SVN andSWE. On the other extreme, we find less developed countries such as BGR orROM (classified as upper-middle income countries). Romania followed
30 ekonomia 30
Aleksandra Parteka

a clear path of trade diversification (drop in Theilexp and Theileimp) while Bul-garia was characterized by a U-shaped pattern of diversification followed byreconcentration of exports and imports in the recent years. Hence, trends intrade diversity seem to be linked to stages of development. We will addressthis issue in the next section, where we examine econometrically the link be-tween import/export diversity indices and income per capita.
Evolution of import and export diversity in EU27 countriesSource: own elaboration based on trade data from UNComtrade (HS0, 4963 product lines).
ekonomia 30 31
Trade Diversity and Stages of Development—Evidence on EU Countries1
.81
.85
1.9
1.9
52
2.0
5
The
il_e
xp
orts
1.5
1.6
1.7
1.8
1.9
2
The
il_im
ports
1995 2000 2005 2010
year
imports
exports
AUT
2.1
2.2
2.3
2.4
2.5
The
il_e
xp
orts
1.8
22
.22
.42
.6
The
il_im
ports
2000 2005 2010
year
imports
exports
BEL
2.5
52
.62
.65
2.7
2.7
52
.8
The
il_e
xp
orts
22
.53
The
il_im
ports
1995 2000 2005 2010
year
imports
exports
BGR
3.4
3.6
3.8
44
.2
The
il_e
xp
orts
2.2
2.4
2.6
2.8
3
The
il_im
ports
1990 1995 2000 2005 2010
year
imports
exports
CYP
1.8
22
.22
.42
.6
The
il_e
xp
orts
1.6
1.8
22
.22
.4
The
il_im
ports
1990 1995 2000 2005 2010
year
imports
exports
CZE
2.1
2.2
2.3
2.4
2.5
2.6
The
il_e
xp
orts
1.6
1.7
1.8
1.9
2
The
il_im
ports
1990 1995 2000 2005 2010
year
imports
exports
DNK
2.1
52
.22
.25
2.3
The
il_e
xp
orts
1.8
22
.22
.42
.6
The
il_im
ports
1990 1995 2000 2005 2010
year
imports
exports
ESP
2.9
33
.13
.23
.33
.4
The
il_e
xp
orts
1.8
22
.22
.42
.6
The
il_im
ports
1995 2000 2005 2010
year
imports
exports
EST
2.9
33
.13
.23
.33
.4
The
il_e
xp
orts
1.8
22
.22
.42
.6
The
il_im
ports
1990 1995 2000 2005 2010
year
imports
exports
FIN
1.8
1.9
22
.12
.2
The
il_e
xp
orts
1.6
1.8
22
.2
The
il_im
ports
1995 2000 2005 2010
year
imports
exports
FRA
22
.22
.42
.62
.8
The
il_e
xp
orts
1.7
1.8
1.9
22
.12
.2
The
il_im
ports
1990 1995 2000 2005 2010
year
imports
exports
GBR
1.6
1.7
1.8
1.9
2
The
il_e
xp
orts
1.6
1.8
22
.2
The
il_im
ports
1990 1995 2000 2005 2010
year
imports
exports
GER
2.8
33
.23
.4
The
il_e
xp
orts
22
.22
.42
.62
.83
The
il_im
ports
1990 1995 2000 2005 2010
year
imports
exports
GRC
22
.53
The
il_e
xp
orts
1.8
22
.22
.42
.6
The
il_im
ports
1990 1995 2000 2005 2010
year
imports
exports
HUN
33
.54
4.5
The
il_e
xp
orts
22
.22
.42
.62
.8
The
il_im
ports
1990 1995 2000 2005 2010
year
imports
exports
IRL

Evolution of import and export diversity in EU27 countriesSource: own elaboration based on trade data from UNComtrade (HS0, 4963 product lines).
4.3 Estimation resultsAs stated in Section 2, recent empirical literature on diversification dynam-
ics focused on the nonlinear relationship between measures of product con-centration and economic development levels. Hence, in order to check the ex-istence (or not) of such a relationship in our sample of EU27 countries, in thefirst step we perform a nonparametric estimation in the form of the lowesscurve (Cleveland, 1979) which can be described by the following equation:
� �Y f GDPpcit itexp � (3)
where Yexp = {Nactiveexp, Theilexp} denotes one of the synthetic measures ofexported products diversity defined in eq. 1 and eq. 2, i refers to countries
32 ekonomia 30
Aleksandra Parteka1
.55
1.6
1.6
51
.71
.75
The
il_e
xp
orts
1.8
22
.22
.4
The
il_im
ports
1995 2000 2005 2010
year
imports
exports
ITA
33
.23
.43
.63
.8
The
il_e
xp
orts
22
.53
3.5
The
il_im
ports
1995 2000 2005 2010
year
imports
exports
LTU
33
.13
.23
.33
.43
.5
The
il_e
xp
orts
2.4
2.5
2.6
2.7
The
il_im
ports
2000 2005 2010
year
imports
exports
LUX
3.2
3.4
3.6
3.8
44
.2
The
il_e
xp
orts
1.8
22
.22
.42
.6
The
il_im
ports
1995 2000 2005 2010
year
imports
exports
LVA
5.2
5.4
5.6
5.8
6
The
il_e
xp
orts
3.1
3.2
3.3
3.4
3.5
The
il_im
ports
1995 2000 2005 2010
year
imports
exports
MLT
1.6
1.8
22
.22
.4
The
il_e
xp
orts
1.6
1.8
22
.22
.42
.6
The
il_im
ports
1990 1995 2000 2005
year
imports
exports
NLD
2.2
52
.32
.35
2.4
2.4
5
The
il_e
xp
orts
1.7
1.8
1.9
22
.1
The
il_im
ports
1995 2000 2005 2010
year
imports
exports
POL
2.4
2.6
2.8
33
.2
The
il_e
xp
orts
1.9
22
.12
.22
.3
The
il_im
ports
1990 1995 2000 2005 2010
year
imports
exports
PRT
2.8
33
.23
.43
.6
The
il_e
xp
orts
22
.53
3.5
44
.5
The
il_im
ports
1990 1995 2000 2005 2010
year
imports
exports
ROM
22
.53
3.5
The
il_e
xp
orts
1.8
22
.22
.42
.6
The
il_im
ports
1995 2000 2005 2010
year
imports
exports
SVK
2.3
2.4
2.5
2.6
2.7
2.8
The
il_e
xp
orts
1.6
1.8
22
.2
The
il_im
ports
1995 2000 2005 2010
year
imports
exports
SVN
2.3
2.3
52
.42
.45
2.5
The
il_e
xp
orts
1.6
1.8
22
.22
.4
The
il_im
ports
1990 1995 2000 2005 2010
year
imports
exports
SWE

and t to time period. GDPpc is a proxy of the development level (income percapita in real terms) and f(.) is a flexible function estimated through the use ofthe lowess smoother and represented graphically. Similarly, the equation forimports takes on the following form:
� �Y f GDPpcitimp
it� (4)
where Yimp = {Nactiveimp, Theilimp} denotes one of our synthetic measures ofimported products diversity.
Graphical representation of nonparametric curve for exports is shown inFigure 2, while Figure 3 presents data for imports. We will compare the pat-tern typical for the EU27 sample (upper plot) with that emerging from theRoW sample (lower plot).
Measures of product diversity versus level of economic development, nonparametric plots(EU27 and RoW), exportsNote: RoW—Rest of the World (136 countries); nonparametric plot obtained with lowess—span= 0.8, sample without outliers defined as observations below the 1st or above the 99th percentile.Source: own elaboration based on trade data from UNComtrade (HS0, 4,963 product lines) andGDP per capita from World Bank’s World Development Indicators (2011).
ekonomia 30 33
Trade Diversity and Stages of Development—Evidence on EU Countries
2.5
33
.54
The
ilin
dex
ofp
roductco
nce
ntr
atio
n(expo
rts)
250
03
00
03
50
04
00
04
50
0
Nu
mb
er
ofa
ctive
exp
ortlin
es
10000 20000 30000 40000
GDP per capita (PPP,const.2005intUSD)
No. active lines exp Theil_exp
EU27
3.5
44
.55
5.5
The
ilin
dex
ofp
roductco
nce
ntr
atio
n(expo
rts)
100
02
00
03
00
04
00
0
Nu
mb
er
ofa
ctive
exp
ortlin
es
0 10000 20000 30000 40000 50000
GDP per capita (PPP,const.2005intUSD)
No. active lines exp Theil_exp
RoW

Measures of product diversity versus level of economic development, nonparametric plots(EU27 and RoW), imports
Note: RoW—Rest of the World (136 countries); nonparametric plot obtained with lowess—span= 0.8, sample without outliers defined as observations below the 1st or above the 99th percentile.Source: own elaboration based on trade data from UNComtrade (HS0, 4,963 product lines) andGDP per capita from World Bank’s World Development Indicators (2011).
By analyzing exports (Figure 2) concerning the EU27 sample, we can ob-serve a rise in the number of exported product lines (Nactive
itexp ) up to an in-
come per capita level of approximately $30,000 [PPP, 2005] followed by a sub-sequent drop in Nactive
itimp which marks the reconcentration track. Theil in-
dex, measuring product concentration, mirrors the plot obtained with thenumber of active lines and thus follows a U-shaped path. By comparing EU27to the rest of the word (RoW) sample, we note that in the latter case the pat-tern of progressing export diversification is dominating (constant increase inNactive
itexp as income per capita grows, only a slight increase in Theilexp at
higher stages of development). This is in line with the predictions based onCadot et al. [2011a] hump-shaped evidence on export diversity evolution be-cause EU27 sample is composed of more developed countries than RoW sam-
34 ekonomia 30
Aleksandra Parteka
22
.22
.42
.62
.8
The
ilin
dex
ofp
roductco
nce
ntr
atio
n(im
po
rts)
410
04
20
04
30
04
40
04
50
0
Nu
mb
er
ofa
ctive
imp
ortlin
es
10000 20000 30000 40000
GDP per capita (PPP,const.2005intUSD)
No. active lines imp Theil_imp
EU27
2.4
2.6
2.8
33
.2
The
ilin
dex
ofp
roductco
nce
ntr
atio
n(im
po
rts)
320
03
40
03
60
03
80
04
00
04
20
0
Nu
mb
er
ofa
ctive
imp
ortlin
es
0 10000 20000 30000 40000 50000
GDP per capita (PPP,const.2005intUSD)
No. active lines imp Theil_imp
RoW

ple (compare average income per capita levels reported in Table 1: $23,050.5,PPP 2005 in the case of EU27 and $11,291.3, PPP 2005 in the case of RoW).
With regard to trends typical for the import structures (Figure 3), the pat-tern is very similar, with increasing import diversity in EU27 sample up to anincome per capita levels of $30,000 [PPP, 2005] and observable reconcentra-tion afterwards. On average, less developed RoW sample is characterized bystrong import diversification path at the initial stages of economic develop-ment.
However, unconditional lowess estimation does not take into accountother factors which affect diversification opportunities. Consequently, weshould correct eq. (3) and (4) for the inclusion of additional right hand sidevariables and assess their statistical significance. In the following step, in or-der to check the pattern revealed through nonparametric estimation, we esti-mate parametrically the following models:
� � � �Y GDPpc GDPpc GDP Fuel Dit it it it it texp � � � � � �1 2
2
3 4
� �
v
Y Nactive Theil
it
� �exp exp exp,(5)
and
� � � �Y GDPpc GDPpc GDP Fuel Dit it it it it timp � � � � � �1 2
2
3 4
� �
v
Y Nactive Theil
it
� �imp imp imp,(6)
In alternative specifications, real income per capita enters linearly or ina quadratic form (to correct for eventual non-linearity in diversification-in-come relationship and check its importance once other factors are taken intoaccount). Additionally, following empirical literature on the determinants oftrade diversification [Cadot et al, 2011b; Parteka and Tamberi, 2011] we con-sider the importance of such country specific characteristic as: country size(GDP) and petrol abundance (Fuel—as percentage of total merchandise ex-ports). All models include time dummies (in order to account for commonbusiness cycle effects)8.
As far as export diversity is concerned (results reported in Table 4 andTable 5), when considering the number of exported products, it turns out tobe positively and significantly related to income per capita levels (columns 1,2 and 3 of Table 4). Coefficients associated with GDPpc in models employingTheil index of export concentration are negative (column 1, 2, and 3 of Table5) which is correct, given that it is an inverse measure of productdiversification. Quadratic formulation turns out to be not significant. Countrysize and petrol abundance are among positive determinants of exportdiversity in the EU27 sample. The results concerning imports’ diversification
ekonomia 30 35
Trade Diversity and Stages of Development—Evidence on EU Countries
8 We do not adopt FE estimation with country dummies as it would wipe out most of the vari-ability across countries which is captured for instance by the inclusion of size variable.

and its relation to stages of development (reported in Table 6 and Table 7) aresimilar: the number of imported products is positively related to income percapita levels (negative coefficient is obtained when Theil index of importconcentration is used as a dependent variable). The model with the numberof imported products as a dependent variable (Table 6) performs better interms of variables’ significance and goodness of fit. All in all, the crucialconclusion is that also within the EU27 sample the diversity of exported andimported products increases in income per capita.
Estimation results—exports (dependent variable: number of active lines), EU27 sample
Dependent variable: No. of active export product lines
(1) (2) (3) (4) (5) (6)
(GDPpc) 2 –7.30E – 08 –1.74E – 07 –5.20E – 07
[–0.14] [–0.37] [–1.23]
GDPpc [PPP, const.2005 int. USD]
5.501e – 02*** 4.020e – 02*** 4.509e – 02*** 5.810e – 02*** 4.757e – 02** 6.752e – 02***
[19.45] [13.45] [14.19] [2.59] [2.23] [3.56]
GDP [PPP, const.2005 int. USD]
4.571e – 10*** 4.539e – 10*** 4.571e – 10*** 4.534e – 10***
[9.58] [9.79] [9.58] [9.85]
Fuel exports [% totalmerchandise exports]
2.541e + 01*** 2.736e + 01***
[3.13] [3.72]
No. of observations 460 458 458 460 458 458
adj R2 0.33 0.42 0.44 0.33 0.42 0.44
Time fixed effects yes yes yes yes yes yes
Note: *, ** and *** denote significance at 10%, 5% and 1% levels, respectively. Least Squaresestimates, sample without outliers defined as observations below 1st or above 99th percentile.Robust t-statistics in parenthesis under coefficients.Source: own elaboration based on trade data from UNComtrade (HS0, 4,963 product lines); GDPper capita, GDP and fuel exports from WB WDI (2011).
Estimation results—exports (dependent variable: Theil index), EU27 sample
Dependent variable: Theil index of export concentration
(1) (2) (3) (4) (5) (6)
(GDPpc)2 –4.56E – 10 –3.13E – 10 4.81E – 11
[–0.62] [–0.50] [0.08]
36 ekonomia 30
Aleksandra Parteka

Dependent variable: Theil index of export concentration
(1) (2) (3) (4) (5) (6)
GDPpc [PPP, const.2005 int. USD]
–2.671e – 05*** –8.828e – 06** –1.446e – 05*** –7.41E – 06 4.44E – 06 –1.65E – 05
[–6.48] [–2.01] [–3.31] [–0.25] [0.18] [–0.68]
GDP [PPP, const.2005 int. USD]
–5.637e – 13*** –5.543e – 13*** –5.636e – 13*** –5.543e – 13***
[–11.48] [–11.67] [–11.33] [–11.68]
Fuel exports [%totalmerchandise exports]
–2.964e – 02*** –2.981e – 02***
[–3.15] [–3.13]
No. of observations 455 453 453 455 453 453
adj R2 0.1 0.26 0.28 0.1 0.26 0.28
Time fixed effects yes yes yes yes yes yes
Note: *, ** and *** denote significance at 10%, 5% and 1% levels, respectively. Least Squaresestimates, sample without outliers defined as observations below 1st or above 99th percentile.Robust t-statistics in parenthesis under coefficients.Source: own elaboration based on trade data from UNComtrade, 2011 (HS0, 4963 product lines);GDP per capita, GDP and fuel exports from WB WDI (2011).
Estimation results—imports (dependent variable: number of active lines), EU27 sample
Dependent variable: No. of active import product lines
(1) (2) (3) (4) (5) (6)
(GDPpc)2 –4.324e – 07*** –4.529e – 07*** –5.345e – 07***
[–2.70] [–2.94] [–3.66]
GDPpc [PPP, const.2005 int. USD]
1.672e – 02*** 1.282e – 02*** 1.384e – 02*** 3.507e – 02*** 3.207e – 02*** 3.687e – 02***
[12.68] [8.38] [8.67] [4.86] [4.41] [5.35]
GDP [PPP, const.2005 int. USD]
1.147e – 10*** 1.138e – 10*** 1.137e – 10*** 1.124e – 10***
[7.91] [7.94] [8.00] [8.06]
Fuel exports [% totalmerchandise exports]
5.671e + 00** 7.427e + 00***
[2.42] [3.42]
No. of observations 462 460 460 462 460 460
adj R2 0.49 0.53 0.53 0.49 0.53 0.54
Time fixed effects yes yes yes yes yes yes
Note: *, ** and *** denote significance at 10%, 5% and 1% levels, respectively. Least Squaresestimates, sample without outliers defined as observations below 1st or above 99th percentile.Robust t-statistics in parenthesis under coefficients.Source: own elaboration based on trade data from UNComtrade, 2011 (HS0, 4963 product lines);GDP per capita, GDP and fuel exports from WB WDI (2011).
ekonomia 30 37
Trade Diversity and Stages of Development—Evidence on EU Countries

Estimation results—imports (dependent variable: Theil index), EU27 sample
Dependent variable: Theil index of import concentration
(1) (2) (3) (4) (5) (6)
(GDPpc)2 –1.15E – 10 –1.07E – 10 –1.81E – 10
[–0.34] [–0.33] [–0.58]
GDPpc [PPP, const.2005 int. USD]
–8.143e – 06*** –1.83E – 06 –7.35E – 07 –3.28E – 06 2.74E – 06 7.07E – 06
[–3.82] [–0.76] [–0.31] [–0.22] [0.19] [0.51]
GDP [PPP, const.2005 int. USD]
–1.735e – 13*** –1.739e – 13*** –1.738e – 13*** –1.745e – 13***
[–8.26] [–8.17] [–8.14] [–8.06]
Fuel exports [% totalmerchandise exports]
6.10E – 03 6.69E – 03
[1.24] [1.45]
No. of observations 459 457 457 459 457 457
adj R2 0.2 0.26 0.26 0.2 0.26 0.26
Time fixed effects yes yes yes yes yes yes
Note: *, ** and *** denote significance at 10%, 5% and 1% levels, respectively. Least Squaresestimates, sample without outliers defined as observations below the 1st or above the 99th per-centile. Robust t-statistics in parenthesis under coefficients.Source: own elaboration based on trade data from UNComtrade, 2011 (HS0, 4963 product lines);GDP per capita, GDP and fuel exports from WB WDI (2011).
4.4 Extensions and robustness checks9
First of all, we checked if changes in the level of disaggregation of tradedata used for the calculation of diversity indices could influence the re-sults. In order to do so, we recalculated, for the same set of countries andyears, Theil indices of product concentration defined in eq. (1) and eq. (2)with more aggregated data: we used statistics classified according to SITCrev. 3, 4-digit nomenclature (712 lines). Indices obtained with HS0 6-digitproduct level data (~5,000 products, used in the main analysis) and those cal-culated with SITC 4-digit data are highly correlated. For the whole sample(1,905 obs.) corr(Theilexp_HS0, Theilexp_SITC) = 0.93; corr(Theilimp_HS0,Theilimp_SITC) = 0.89 while in the sample of EU countries onlycorr(Theilexp_HS0, Theilexp_SITC) = 0.87; corr(Theilimp_HS0, Theilimp_SITC) =0.94. Consequently, the results (e.g. the lowess curves plotted in Figure 2 andFigure 3. obtained with less disaggregated data are very similar to the bench-mark ones.
Secondly, we considered modifications in the estimated empirical model.We included the degree of trade openness (OPEN) as an additional explana-tory variable, potentially influencing diversification possibilities. We then
38 ekonomia 30
Aleksandra Parteka
9 All the results referring to this section are obtainable upon request from the author. Theyare not presented here due to space limits.

considered a change in the estimation method (applying instrumental vari-ables estimator), treating income per capita as potentially endogenous andinstrumented with its own lag. Finally, we substituted GDP, as a measure ofcountry size, with population (POP); the two variables are highly correlated:corr(GDP, POP) = 0.93. In all of the cases, the main result (negative relation-ship between synthetic measures of traded product diversity and the level ofeconomic development) remains robust.
5. Summary of the findings and conclusionsFollowing recent interest in diversification-economic development rela-
tionship, this paper presents related empirical evidence concerning EUcountries. Our analysis focuses on EU27 economies observed across the years1988–2010 and compared to an international sample of 136 economies at alllevels of income per capita. Through the use of very detailed product levelstatistics (circa 5,000 goods) on both export and import flows, we are able totrace changes in trade diversification visible at a level of detail deeper thansector or industry.
The results presented in this paper lead to a few observations. First of all,in line with the ‘stages of diversification’ approach [Imbs and Wacziarg, 2003]and existing empirical literature on trade diversity and its relationship withincome per capita [Cadot et al., 2011a], EU countries can be located amongeconomies with already well diversified baskets of exported and importedproducts. On average, EU27 countries export 78% and import 90% of goods ef-fectively exported and imported at the world level. However, in terms of evo-lution along the development path, most EU countries, being already well de-veloped (and classified as high income countries), registered an increase inboth import and export measures of product concentration in the analyzedperiod (reconcentration track). Less developed EU economies, such as Bul-garia and Romania. followed a typical diversification path, characteristic forcountries at lower stages of development.
In all, evidence on EU27 fits well in a general ‘diversification curve’ (illus-trating the product diversity-development relationship) which predicts di-versification followed by a reconcentration track. Using both non-parametric(lowess) and parametric estimation methods, we estimate the curve in oursample of EU27 countries. The results obtained confirm a positive relation-ship between trade diversity and income per capita levels, with a possibilityof reconcentration at higher stages of development (observable innonparametric estimates). Further research could focus on changes in thetypology of goods traded at distinct stages of development.
BibliographyBesedes T. and Prusa T., 2006, “Ins, Outs and the Duration of Trade,” Canadian Jour-
nal of Economics, 39: p. 266–295.
ekonomia 30 39
Trade Diversity and Stages of Development—Evidence on EU Countries

Bickenbach F., Bode E. and Krieger-Boden C., 2010, “Closing the Gap between Abso-lute and Relative Measures of Localization, Concentration or Specialization,”Kiel Working Paper No.1660.
Brülhart M., 2009, “An Account of Global Intra-Industry Trade, 1962–2006,” The WorldEconomy, 32(3): p. 401–459.
Cadot O., Carrere C., Strauss-Kahn V. (2011a). Export Diversification: What’s Behindthe Hump? The Review of Economics and Statistics, 93(2): 590–605.
Cadot O., Carrere C., Kukenova M., Strauss-Kahn V., 2011b, “OECD Imports. Diversifi-cation of Suppliers and Quality Search.” The World Bank Policy Research WorkingPaper No. 5258.
Cadot O., Carrere C., Strauss-Kahn V., 2012, “Trade Diversification, Income, andGrowth: What Do We Know?,” Journal of Economic Surveys (forthcoming).
Cleveland W., 1979, “Robust Locally Weighted Regression and Soothing Scatter-plots,” Journal of American Statistic Association, 74(368): p. 829–836.
de Benedictis L., Gallegati M., Tamberi M., 2009, “Overall Trade Specialization andEconomic Development: Countries Diversify,” Review of World Economics, 145(1):p. 37–55.
Feenstra R.C., 1994, “New Product Varieties and the Measurement of InternationalPrices,” American Economic Review, 84 (1994): p. 157–177
Funke M., Ruheweld R., 2005, “Export Variety and Economic Growth in East Euro-pean Transition Economies,” Economics of Transition, 13(1): p. 25–50.
Hesse H., 2009, “Economic Diversification and Economic Growth,” [in:] Newfamer R.,Shaw W., Walkenhorst P. (eds.). Breaking Into New Markets. Emerging Lessons forExport Diversification, Washington, DC: The World Bank, Chapter 3 (p. 55–80).
Hummels D. and Klenow P., 2005, “The Variety and Quality of a Nation’s Exports,”American Economic Review, 94(1): p. 704–723.
Imbs J., Wacziarg R., 2003, “Stages of diversification,” American Economic Review,93(1): p. 63–86.
Klinger B., Lederman D., 2011, “Export Discoveries, Diversification and Barriers toEntry,” Economic Systems, 35(1): p. 64–83.
Misztal P., 2011, “Export Diversification and Economic Growth in European UnionMember States”, Oeconomia 10(2): p. 55–64
Koren M.; Tenreyro S., 2007, “Volatility and Development,” Quarterly Journal of Eco-nomics, 122(1): p. 243–287.
Parteka A., 2009, “Employment Specialisation in the Enlarged European Union,”Ekonomia, 24: p. 6–21.
Parteka A., 2010, “Employment and Export Specialisation Along the DevelopmentPath: Some Robust Evidence,” Review of World Economics, 145(4): p. 615–640.
Parteka A. and M. Tamberi, 2011, “Export Diversification and Development—Empiri-cal Assessment,” Universit2 Politecnica delle Marche, Dipartimento di ScienzeEconomiche e Sociali Working Papers No. 359.
Theil H., 1972, Statistical Decomposition Analysis, North-Holland, Amsterdam.
40 ekonomia 30
Aleksandra Parteka

Appendix
Table 1A.List of product categories present in disaggregated trade data used in the analysis
01–05 Animal & Animal Products
06–15 Vegetable Products
16–24 Foodstuffs
25–27 Mineral Products
28–38 Chemicals & Allied Industries
39–40 Plastics / Rubbers
41–43 Raw Hides, Skins, Leather, & Furs
44–49 Wood & Wood Products
50–63 Textiles
64–67 Footwear / Headgear
68–71 Stone / Glass
72–83 Metals
84–85 Machinery / Electrical
86–89 Transportation
90–97 Miscellaneous
98–99 Service
Note: numbers correspond to HS 2-digit code.Source: UNComtrade
Summary statistics of country-year panels: EU27 and ‘RoW—Rest of the World’ sample
EU27 countries RoW (Rest of the world)
Total number of country-year obs. 486 1,419
Time span 1988–2010 1988–2010
Number of countries 27 136
Number of year obs. percountry
Mean 18 10
Min 12 1
Max 23 23
Number of country obs.per year
Mean 21 61
Min 4 7
Max 27 103
Source: own elaboration
ekonomia 30 41
Trade Diversity and Stages of Development—Evidence on EU Countries

List of European countries (EU27) covered by the analysis
Countrycode
Country name Income group* GDP per capita[PPP,
const.2005 int.USD]**
Years covered by the analysis
First Last
AUT Austria HI-OECD 31864.6 1994 2010
BEL Belgium HI-OECD 31735.3 1999 2010
BGR Bulgaria UMI 8857.79 1996 2010
CYP Cyprus HI-nonOECD 21986.6 1989 2010
CZE Czech Republic HI-OECD 18435.4 1993 2010
DEU/GER Germany HI-OECD 29069.6 1988 2010
DNK Denmark HI-OECD 30139.5 1989 2010
ESP Spain HI-OECD 24020.7 1989 2010
EST Estonia HI-OECD 13504.8 1995 2010
FIN Finland HI-OECD 26349.9 1988 2010
FRA France HI-OECD 28154.1 1994 2010
GBR United Kingdom HI-OECD 29747.5 1993 2010
GRC Greece HI-OECD 21101.5 1988 2010
HUN Hungary HI-OECD 13499.7 1992 2007
IRL Ireland HI-OECD 30952.2 1992 2010
ITA Italy HI-OECD 27161.6 1994 2010
LTU Lithuania UMI 12000.1 1994 2010
LUX Luxembourg HI-OECD 66777.1 1999 2010
LVA Latvia UMI 10659.3 1994 2010
MLT Malta HI-nonOECD 19966.7 1994 2010
NLD Netherlands HI-OECD 31695.1 1992 2006
POL Poland HI-OECD 12676.2 1994 2010
PRT Portugal HI-OECD 19329.4 1988 2010
ROM Romania UMI 8257.19 1989 2010
SVK Slovak Republic HI-OECD 14937.6 1994 2010
SVN Slovenia HI-OECD 21107.5 1994 2010
SWE Sweden HI-OECD 29122.1 1992 2010
Note: * country groups according to the World Bank’s (2011) classification: LI—low income,LMI—lower middle income, UMI—upper middle income, HI- high income (OECD andnon-OECD members), ** year averageSource: own elaboration.
42 ekonomia 30
Aleksandra Parteka

Summary statistics of import and export diversification measures—EU27 and other countries(RoW—Rest of the World)
Export diversification measures
index group obs mean sd min max
Number of active products Nactiveexpit EU27 472 3784 873 829 4858
Relative number of active products RelNactiveexpit EU27 472 0.77 0.18 0.17 0.99
Number of new product lines (1year cutoff) Nnew(1)expit EU27 444 155 121 2 680
Number of new product lines (2year cutoff) Nnew(2)expit EU27 418 60 58 0 320
Theil index of product concentration Theilexpit EU27 467 2.80 0.79 1.63 5.96
Export diversification measures
index group obs mean sd min max
Number of active products Nactiveexpit RoW 1395 2320 1435 171 4798
Relative number of active products RelNactiveexpit RoW 1395 0.47 0.29 0.03 0.98
Number of new product lines (1year cutoff) Nnew(1)expit RoW 1302 185 127 2 765
Number of new product lines (2year cutoff) Nnew(2)expit RoW 1218 65 55 0 319
Theil index of product concentration Theilexpit RoW 1400 4.66 1.44 1.85 7.84
Import diversification measures
index group obs mean sd min max
Number of active products Nactiveimpit EU27 474 4383 317 2435 4867
Relative number of active products RelNactiveimpit EU27 474 0.90 0.06 0.50 0.99
Number of new product lines (1year cutoff) Nnew(1)impit EU27 424 60 51 0 307
Number of new product lines (2year cutoff) Nnew(2)impit EU27 398 27 32 0 204
Theil index of product concentration Theilimpit EU27 471 2.18 0.41 1.60 4.07
Import diversification measures
index group obs mean sd min max
Number of active products Nactiveimpit RoW 1393 3788 721 1257 4868
Relative number of active products RelNactiveimpit RoW 1393 0.77 0.15 0.26 0.99
Number of new product lines (1year cutoff) Nnew(1)impit RoW 1038 95 78 0 340
Number of new product lines (2year cutoff) Nnew(2)impit RoW 969 34 43 0 214
Theil index of product concentration Theilimpit RoW 1396 2.69 0.53 1.62 4.15
Note: Sample without outliers defined as observations below the 1st or above the 99th percentile.Source: own elaboration.
ekonomia 30 43
Trade Diversity and Stages of Development—Evidence on EU Countries

A b s t r a c t Trade Diversity and Stages of Development—Evidence on EU CountriesThe paper presents the dynamics of trade diversification with respect tostages of development in the European context. The analysis focuses on EU27countries observed across the years 1988–2010 and compared to a sample of136 international economies at all levels of income per capita. We will useproduct level statistics (six digit HS0) and confront export and import patternsof absolute diversification/concentration. The results show that in line with‘stages of diversification’ approach [Imbs and Wacziarg, 2003], EU27 countriesare characterized by a high degree of trade diversity (on average, EU27 coun-tries export 78% and import 90% of goods effectively exported and imported atthe world level) and within the analyzed period most of them registereda reconcentration of trade structures. Obtained estimation results confirma positive relationship between trade diversity and economic developmentlevels (conditional mainly upon the size of the country) with a possibility ofreconcentration at higher stages of development (observable in nonpara-metric estimates).Keywords: diversification, concentration, trade, economic developmentJEL: F14, O11, O52
44 ekonomia 30
Aleksandra Parteka