TrackMapper Rises
14
TrackMapper Rises Agri-Science Queensland Innovation Opportunity July 2016 Anthony Courtney, Alex Campbell, Ross Quinn, Michael O’Neill and Matthew Campbell (DAF) Jason Shen and Michael Emery (DSITI)
Transcript of TrackMapper Rises
TrackMapper Rises
Agri-Science Queensland Innovation Opportunity
July 2016 Anthony Courtney, Alex Campbell, Ross Quinn, Michael O’Neill and Matthew Campbell (DAF) Jason Shen and Michael Emery (DSITI)
This publication has been compiled by Dr Tony Courtney of Agri-Science Queensland, Department of Agriculture and Fisheries.
© State of Queensland, 2016
The Queensland Government supports and encourages the dissemination and exchange of its information. The copyright in
this publication is licensed under a Creative Commons Attribution 3.0 Australia (CC BY) licence.
Under this licence you are free, without having to seek our permission, to use this publication in accordance with the licence
terms.
You must keep intact the copyright notice and attribute the State of Queensland as the source of the publication.
Note: Some content in this publication may have different licence terms as indicated.
For more information on this licence, visit http://creativecommons.org/licenses/by/3.0/au/deed.en
The information contained herein is subject to change without notice. The Queensland Government shall not be liable for
technical or other errors or omissions contained herein. The reader/user accepts all risks and responsibility for losses,
damages, costs and other consequences resulting directly or indirectly from using this information.
Summary This project repaired and upgraded non-functional Department of Agriculture and Fisheries (DAF) TrackMapper software, to a faster, functional, user-friendly, web-based application that can be directly accessed by researchers, fishery managers and others.
TrackMapper is database software that was developed by DAF researchers in 2007 as part of an externally funded Fisheries Research and Development Corporation project (FRDC project 2002/056 Innovative stock assessment and effort mapping using VMS and electronic logbooks). However, over the last 5-6 years, the program has become incompatible with contemporary Windows-based operating platforms, rendering it inoperable.
TrackMapper was developed for the Queensland east coast otter trawl fishery, which is the state’s most valuable commercial fishery, harvesting 7000-8000 t of seafood annually valued at $80-90 million. The most useful feature of TrackMapper is that it can produce maps of fishing effort, catch and catch rates for the fishery at a spatial resolution that is 10-50 times that reported using logbook data alone.
This information can be used for a range of fisheries management and research tasks, including the assessment of targeted stocks of prawns, scallops, bugs and stout whiting, as well as impacts on the bottom and other non-target bycatch species. This is noteworthy as much of the fishery occurs in waters of the Great Barrier Reef Marine Park (GBRMP), which has World Heritage status.
Example outputs from the upgraded TrackMapper program are provided and include:
• significantly enhanced spatial resolution of catch from the eastern king prawn fishery
• a high spatial resolution map of trawling in Moreton Bay and the Moreton Bay Marine Park closed areas
• application to stock assessment of the saucer scallop fishery, including high-resolution maps that show a decline in catch, effort and catch rates over a 10-year period
• high-resolution maps of catch from all trawl sectors along the Queensland coast, including areas within the GBRMP.
The project not only restored the functionality of TrackMapper, but significantly improved the software. Upgraded features include:
• faster, automated ‘marrying’ of the commercial fishery logbook catch (CFISH) and vessel monitoring systems (VMS) datasets. Importantly, this feature maintains the confidentiality of these datasets as it does not create any permanent copy of the combined data.
• fast web-based application with instantaneous high-resolution on-screen maps, as well as output shape files
• a user-friendly menu-driven interface that can be accessed by several users simultaneously (restricted to DAF network).
As more of Queensland’s commercial fishing sectors adopt VMS, there may be potential to expand TrackMapper’s application to these additional sectors.
Table of Contents
Background ........................................................................................................................................... 1
What is TrackMapper? ........................................................................................................................ 1
Project Objectives ................................................................................................................................. 2
Methodology .......................................................................................................................................... 2
Hosting and Maintenance Support ..................................................................................................... 3
Results ................................................................................................................................................... 3
Examples of TrackMapper outputs ....................................................................................................... 4
Conclusions/Significance/Recommendations ................................................................................... 9
Key Messages ....................................................................................................................................... 9
Where to next ........................................................................................................................................ 9
Budget Summary ................................................................................................................................ 10
Web-application developed, tested and deployed to SCI1 ............................................................. 10
Hosting and warranty support provided for FY16/17 ...................................................................... 10
List of Figures
Figure 1. A comparison of the spatial distribution of catch in the eastern king prawn fishery in southeast Queensland for 2015. The figure on the left is based on the CFISH 30 x 30 minute (i.e. 0.5 degree) logbook grids, which have been commonly used in the past. The figure on the right is derived by TrackMapper and reveals much finer spatial resolution of the catch data based on 0.01 degree (~1.1 km). The dotted line is the 100 m depth contour. .......................................................................... 5 Figure 2: The spatial distribution and intensity of trawling (black lines) in Moreton Bay and the adjacent offshore eastern king prawn fishery in 2015, based on TrackMapper, which uses hourly satellite polls from vessels to determine if they are trawling, steaming or at anchor. The red/pink line is the 90 m depth contour. The dark blue and dark green areas are part of the Moreton Bay Marine Park and closed to trawling. ............................................................................................................................ 6 Figure 3. The figure shows how outputs of TrackMapper can be used to examine change in the Queensland scallop trawl fishery. This analysis was restricted to one major 30 minute logbook grid (T30) in the scallop fishery, which is located east of Gladstone. The left-hand figure shows the distribution of scallop catch rates and trawls in T30 in 2005. The same figure is provided for 2015 on the right. Both the catch rates and number of trawls (blue trawl tracks) have declined markedly in 2015 compared to 2005, and the geographical range of trawling has reduced. The small squares are 0.01 degree (~1.1 km). The large blank square in the bottom right of T30 is a scallop replenishment closure (i.e. closed to trawling). .............................................................................................................. 7 Figure 4. Spatial distribution of catches in the sectors that make up the Queensland east coast otter trawl fishery from 2011-2015. Dotted line is the 100 m depth contour. .................................................. 8
List of Tables
Table 1. Breakdown of milestones and payments for the project. ........................................................ 10
TrackMapper Rises, Department of Agriculture and Fisheries, 2016 1
Background What is TrackMapper?
TrackMapper is database software that was developed by DAF researchers in 2007 as part of an externally funded Fisheries Research and Development Corporation project (FRDC project 2002/056 Innovative stock assessment and effort mapping using VMS and electronic logbooks). The most useful and innovative feature of TrackMapper is that it can derive estimates of catch, fishing effort and catch rates for the Queensland east coast otter trawl fishery, at significantly higher spatial resolution than previous methods based on logbook data alone.
TrackMapper combines two large independent fishery databases: 1) reported mandatory daily logbook catch for each commercial fishing vessel (known as the Queensland Government’s CFISH database), and 2) hourly satellite global positioning system data for each Queensland commercial trawl fishing vessel that are generated by the state’s vessel monitoring system (VMS). Each database is several gigabytes in size. TrackMapper combines the databases and can undertake analyses that include data back to 2000 (~16 years) when the VMS system was mandated.
The two databases were developed and are used for two separate purposes, and were not originally intended to be combined. The CFISH database was designed mainly to record catch details for each commercial fisher for each day of fishing, to a spatial resolution of 6 nautical mile (~11 km) or 30 nautical mile (~55 km), based on where the fisher reports the majority of the catch was taken. In contrast, the VMS was designed mainly to monitor fishing effort, and for enforcement pertaining to closures. VMS reports the actual position of the vessel at approximately hourly intervals. From these positions, the activity of the vessel (trawling, steaming from one location or another, or at anchor) is determined based on its average speed using the distance between positions.
By combining each vessel’s daily catch data to its daily trawl ‘tracks’, TrackMapper can produce fishing catch, fishing effort and catch rates for each vessel, at a spatial resolution that is 10-50 times (i.e. ~1.1 km) that reported using the CFISH logbook data alone. This high spatial resolution information can be used for a range of fishery management tasks and research, including quantitative assessment of the targeted stocks of prawns, scallops, Moreton Bay bugs and stout whiting. It can also be used to examine the spatial distribution and intensity of trawling to assess the ‘environmental footprint’ of the fishery, including within the Great Barrier Reef Marine Park, which has World Heritage status. The information can be used to assess impacts on the bottom and non-target species, including species of conservation interest, as well as the design and assessment of closures.
It is important to note that TrackMapper was designed for the Queensland east coast otter trawl fishery, which is the largest prawn trawl fishery in Australia and the most valuable commercial fishery in Queensland. In recent years the fishery has been composed of about 300 active fishing licenses that expend about 35 000 boat-days annually for a landed catch of 7000-8000 t of seafood valued at $80-90 million. TrackMapper is a highly useful tool for research and management of the fishery.
What is the problem?
TrackMapper was developed in 2007 in FORTRAN as a command line tool. Users are required to edit configuration files to run the program. It also requires a locally installed intermediate Oracle 9 database and is only compatible with 32-bit Windows XP. Over the last 5-6 years, TrackMapper has become incompatible with contemporary Windows operating platforms, rendering it inoperable on DAF computers. It is also incompatible with 64-bit operating systems.
TrackMapper Rises, Department of Agriculture and Fisheries, 2016 2
There is a strong need to make TrackMapper operational again. In addition to the repairs, it would be productive to upgrade the software so that the ‘marrying’ of the CFISH and VMS datasets is automated, as this task has had to be undertaken manually in the past and is time-consuming, requiring queries to run overnight. Furthermore and despite its usefulness, executing TrackMapper has been limited to few users who are familiar with editing the configuration files. These problems could be addressed through the development of a menu-driven, user-friendly graphical user interface (GUI).
In summary, funding was sought to repair and upgrade the TrackMapper database software program which has become inoperable. The software is a valuable tool for the research and management of Queensland’s most valuable commercial fishery. There is a growing need for finer spatial-scale reporting of the Queensland trawl fishery, and other commercial and recreational fisheries. The project has addressed these needs.
Project Objectives 1) To repair TrackMapper to a reliable, functional condition capable of running on current Windows
platforms used on DAF staff computers.
2) If the program could be repaired and funding is available, then the secondary objective of upgrading the software was to:
a. automate the marrying of the large (several gigabytes) CFISH and VMS databases
b. develop a user-friendly interface that removes the need to run command lines and edit configuration files
c. develop a web-based version of the program that can be accessed by any approved DAF user from any location.
Methodology DAF project staff sought advice and quotes for the repairs and upgrading of TrackMapper from within the state government departments and externally. After consideration, a contract to undertake the work was awarded to Mr Jason Shen of the Department of Science Information Technology Innovation (DSITI) System Support Team of the Water Assessment and Systems (WAS) Unit. Reasons for this included:
• Co-location of the DSITI WAS Unit and DAF project Animal Science staff at the Ecosciences Precinct (ESP) was deemed a strong advantage, facilitating regular communication and convenient and efficient progress meetings.
• Costs were deemed to be cheaper if undertaken within Government, as a private external contractor was likely to include a profit margin.
• The contract was concluded to promote collaboration and communication between DSITI and DAF staff located at ESP, which was one of the goals of establishing ESP.
• On-going warranty, maintenance and support of TrackMapper could be more easily undertaken if the service provider was based at ESP.
TrackMapper Rises, Department of Agriculture and Fisheries, 2016 3
The methodology included restoring functionality to TrackMapper under Microsoft Windows 7 (64-bit) and migrating the current intermediate database from Oracle 9 to a recent release of Oracle database. This required:
• recompiling TrackMapper to work on Windows 7 (x64) • migrating the intermediate database to Oracle 11g or above • recompiling TrackMapper together with the migrated database to produce correct shape files.
These tasks were successfully undertaken, thus addressing Objective 1 (repairing TrackMapper to a reliable functional condition). The project then addressed Objective 2 (upgrading).
This included redeveloping TrackMapper as a web-application. The new TrackMapper was to present a graphical user interface (GUI) to replace the legacy text configuration files. Direct connections to DAF enterprise databases were desirable if granted permission to access. Maintenance of the confidentiality of the CFISH and VMS databases is the responsibility of Fisheries Queensland (FQ) and, therefore, permission was sought for the new TrackMapper web-application to gain access to these data and to be hosted on the Water Assessment and Systems’ baseline server (SCI1).
This required the following:
• developing a web-application with Microsoft ASP.NET MVC using C#
• configuration of input parameters to be customised using the GUI of the web-application
• developing the necessary queries/materialised views on either of these databases as the new TrackMapper’s data store
• developing scheduled tasks to update the above data store
• using an intermediate database if access to the above databases is not granted. Note that up-to-date data cannot be guaranteed with this approach and that FQ is responsible for making up-to-date CFISH and VMS data available to TrackMapper.
Hosting and Maintenance Support
The new TrackMapper is to be hosted on a baseline Microsoft Windows server which is managed by the DSITI WAS Unit. The System Support Team of WAS will provide technical support for this application for an agreed period. This requires:
• hosting costs for FY 16/17, 17/18 and 18/19 are to be included in initial project funding
• the warranty period is FY 16/17, with troubleshooting and bug fixes free of charge.
• a support period of FY 17/18 and 18/19: up to 36 hours of technical support per year is provided free of charge, which excludes work to enhance or improve the TrackMapper.
Results The repair and upgrading of TrackMapper have been successful. The speed, functionality and ease-of-use have been greatly improved. The program can now run on modern Windows 7 platforms, as used on DAF computers. Because of the confidentiality of the data, use of the program is currently
TrackMapper Rises, Department of Agriculture and Fisheries, 2016 4
limited to nine DAF staff in Fisheries Queensland and Animal Science and two DSITI staff, including the software programmers, by way of an Administration user list.
A noteworthy outcome of the project is the very fast ‘marrying’ of the CFISH and VMS databases which has been achieved using improved algorithms. This process now occurs as part of each TrackMapper query and does not require users to periodically join the two databases manually beforehand to create a third combined database. The maximum duration for the most data-intensive query takes about four minutes. This is a significant improvement on the initial TrackMapper software, which took several hours to join the two databases. Furthermore, as the joining is undertaken in random access memory (RAM), there is no permanent stored copy of the merged CFISH and VMS data. As a result, there has been no need to purchase an updated (and costly) version of the Oracle database, nor is there a need to maintain any database within TrackMapper. Rather, the two databases, which are held on a secure FQ server, are only accessed by TrackMapper. This has allayed concerns by the FQ database managers who are responsible for maintaining confidentiality of the databases. TrackMapper remains dependent upon FQ to periodically update the CFISH and VMS databases.
Examples of TrackMapper outputs Outputs from TrackMapper are currently being used in a number of projects, including stock assessment of the Queensland scallop trawl fishery and assessment of impacts of the fishery on bycatch species. Some example applications of TrackMapper to these and other projects are provided below.
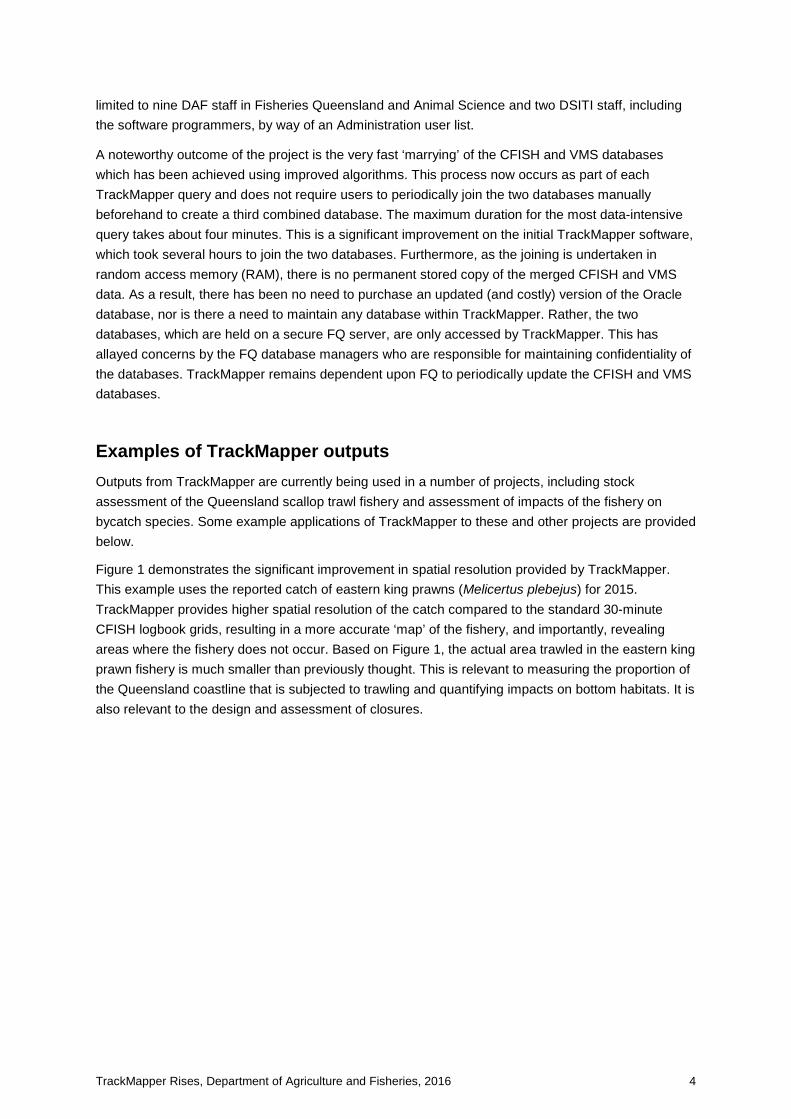
Figure 1 demonstrates the significant improvement in spatial resolution provided by TrackMapper. This example uses the reported catch of eastern king prawns (Melicertus plebejus) for 2015. TrackMapper provides higher spatial resolution of the catch compared to the standard 30-minute CFISH logbook grids, resulting in a more accurate ‘map’ of the fishery, and importantly, revealing areas where the fishery does not occur. Based on Figure 1, the actual area trawled in the eastern king prawn fishery is much smaller than previously thought. This is relevant to measuring the proportion of the Queensland coastline that is subjected to trawling and quantifying impacts on bottom habitats. It is also relevant to the design and assessment of closures.
TrackMapper Rises, Department of Agriculture and Fisheries, 2016 5
Figure 1. A comparison of the spatial distribution of catch in the eastern king prawn fishery in southeast Queensland for 2011-2015. The figure on the left is based on the CFISH 30 x 30 minute (i.e. 0.5 degree) logbook grids, which have been commonly used in the past. The figure on the right is derived by TrackMapper and reveals much finer spatial resolution of the catch data based on 0.01 degree (~1.1 km). The dotted line is the 100 m depth contour.
CFISH Logbook grids (0.5 degree resolution) TrackMapper (0.01 degree resolution)
TrackMapper Rises, Department of Agriculture and Fisheries, 2016 6
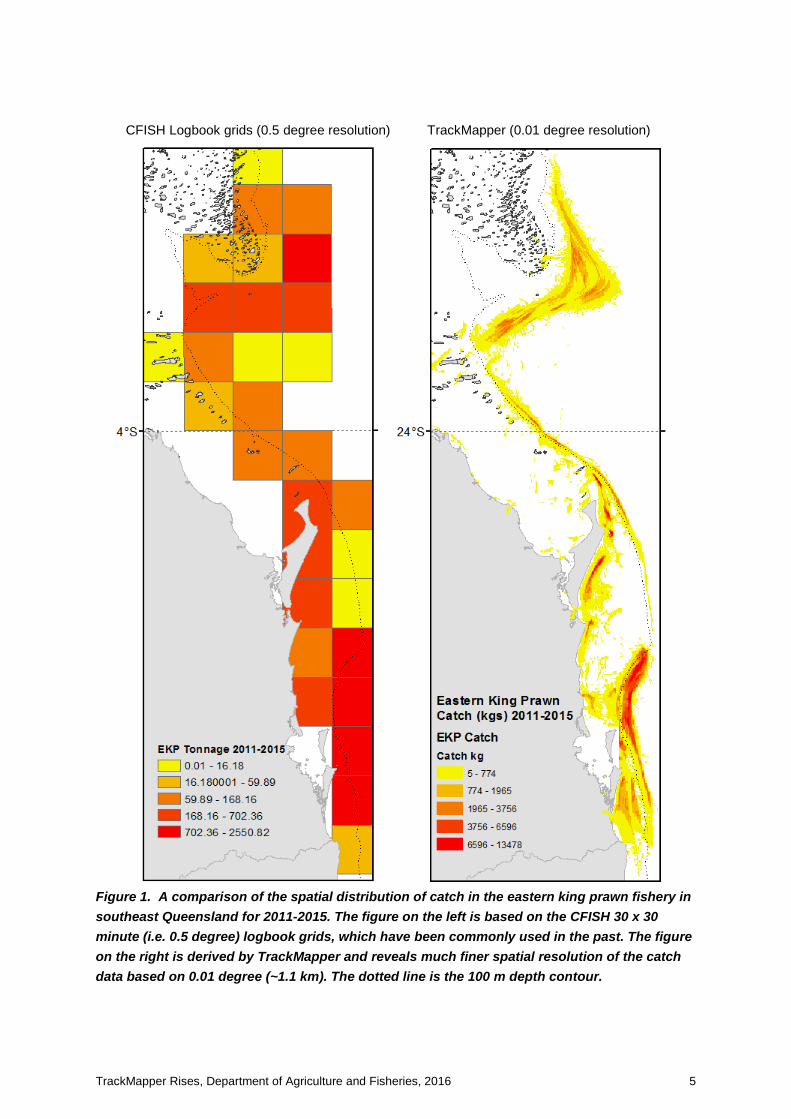
Figure 2 shows the spatial distribution of trawling (black track lines) in Moreton Bay and the adjacent offshore eastern king prawn fishery, including the dark blue and green Moreton Bay Marine Park areas that are closed to trawling, based on TrackMapper outputs.
TrackMapper uses hourly satellite VMS data on the position and speed of each vessel. The speed is used to determine whether the vessel is trawling, steaming from one location or another, or at anchor. Trawling in this region is undertaken at speeds of 2-3 knots (i.e. 1.02-1.54 m/s). If the vessel speed is greater than this range it is deemed to be steaming, and if it is less than this is it deemed to be at anchor or not trawling. It is important to acknowledge that some track lines in Figure 2 (~<2%) are unlikely to be trawling, but rather periods when the vessel has slowed to within the trawl speed range, possibly prior to anchoring or stowing the otter boards and nets. Nevertheless, the main trawling areas are well defined.
In recent years, there have been 72 operators licensed to trawl in Moreton Bay that operate under two license types: 47 T1/M1 license holders and 25 M2 license holders. As the M2 vessels are not required to have VMS, Figure 2 does not represent the total amount of trawling in the Bay in 2015. However, all vessels trawling outside the bay are required to have a VMS installed and, therefore, do produce TrackMapper outputs.
Figure 2: The spatial distribution and intensity of trawling (black lines) in Moreton Bay and the adjacent offshore eastern king prawn fishery in 2015, based on TrackMapper, which uses hourly satellite polls from vessels to determine if they are trawling, steaming or at anchor. The red/pink line is the 90 m depth contour. The dark blue and dark green areas are part of the Moreton Bay Marine Park and closed to trawling.
TrackMapper Rises, Department of Agriculture and Fisheries, 2016 7
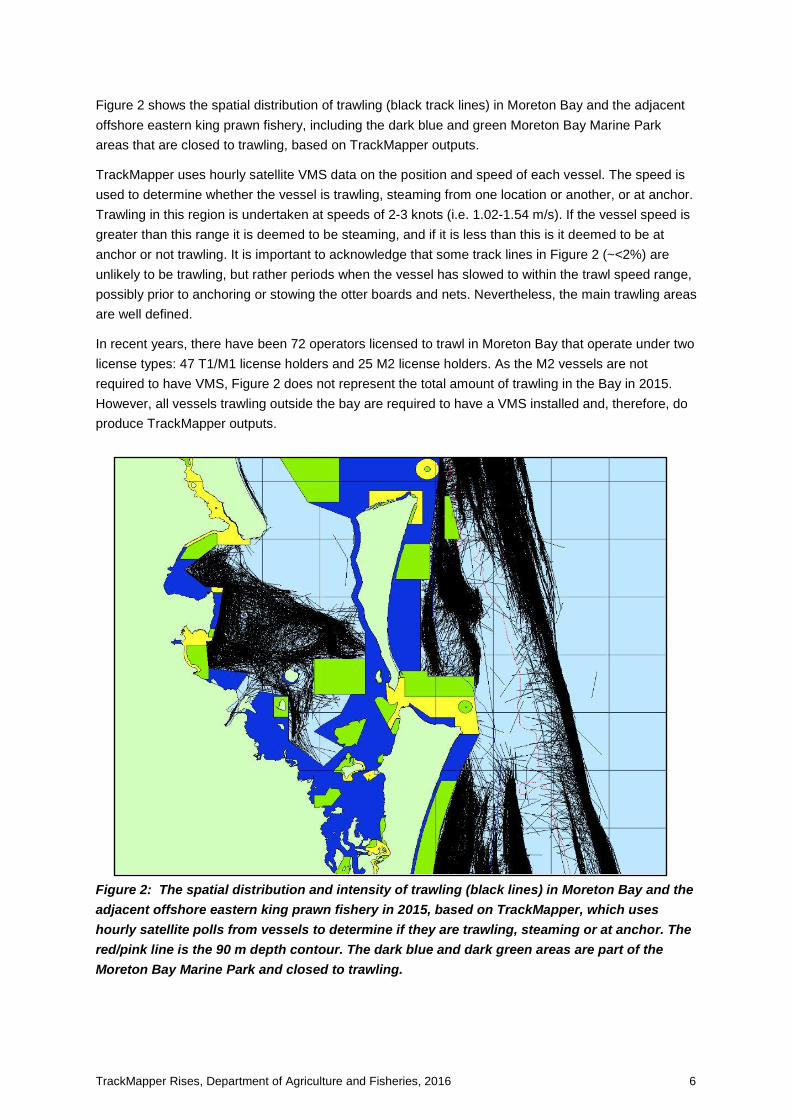
Outputs from TrackMapper can be used to examine change in the Queensland trawl fishery over time. Figure 3 shows a decline in catch rates (catch per unit effort, CPUE kg/h) and fishing effort (hours, h) in a major saucer scallop (Amusium balloti) fishing ground off the central Queensland coast in 2015 compared to 2005. Catch rates and landings in the scallop fishery have been declining over the last decade and the geographical range of trawling has reduced. Reasons for this are unclear and possibly attributed to changing coastal and oceanographic conditions.
TrackMapper is currently being used to generate monthly high-resolution (i.e. 0.01 degree, ~1.1 km) maps of catch rates in the scallop fishery from 2000-2015 (i.e. 16 years x 12 months = 192 maps), which are used to construct a quantitative population model of the stock, including the effects of fishing mortality. This assessment will help fishery managers and fishers determine if the stock is overfished and whether fishing effort should be reduced.
Figure 3. The figure shows how outputs of TrackMapper can be used to examine change in the Queensland scallop trawl fishery. This analysis was restricted to one major 30 minute logbook grid (T30) in the scallop fishery, which is located east of Gladstone. The left-hand figure shows the distribution of scallop catch rates and trawls in T30 in 2005. The same figure is provided for 2015 on the right. Both the catch rates and number of trawls (blue trawl tracks) have declined markedly in 2015 compared to 2005, and the geographical range of trawling has reduced. The small squares are 0.01 degree (~1.1 km). The large blank square in the bottom right of T30 is a scallop replenishment closure (i.e. closed to trawling).
TrackMapper Rises, Department of Agriculture and Fisheries, 2016 8
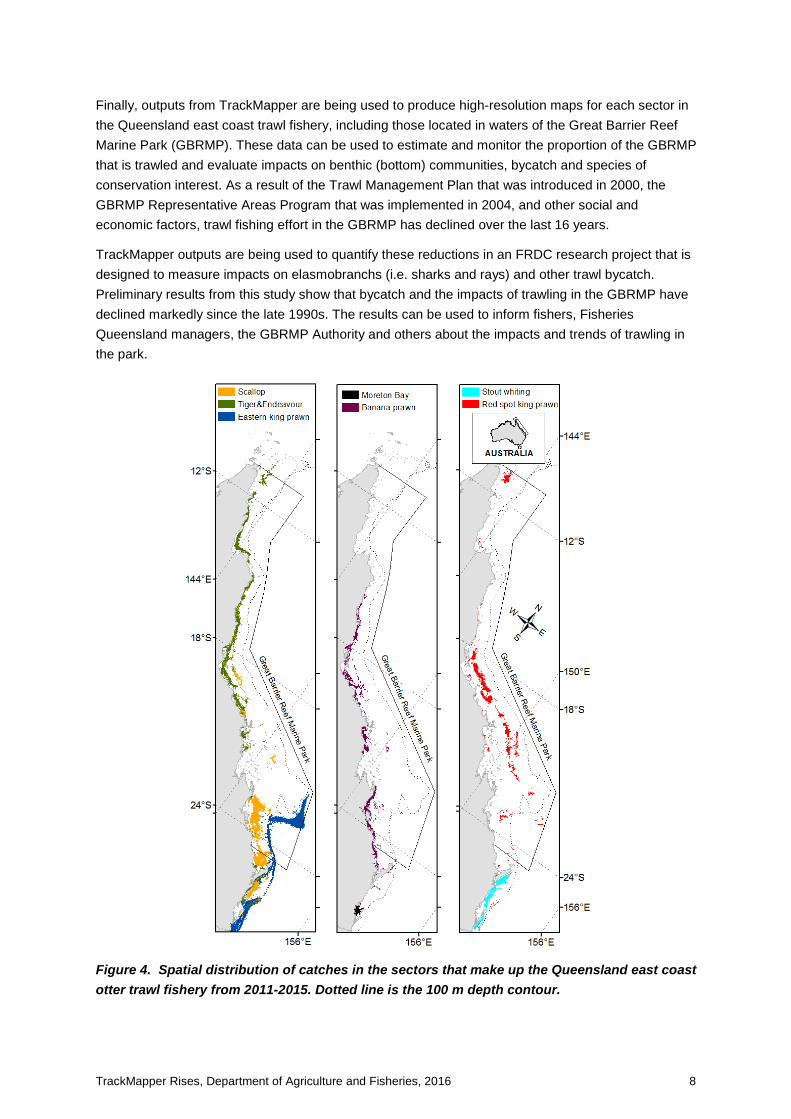
Finally, outputs from TrackMapper are being used to produce high-resolution maps for each sector in the Queensland east coast trawl fishery, including those located in waters of the Great Barrier Reef Marine Park (GBRMP). These data can be used to estimate and monitor the proportion of the GBRMP that is trawled and evaluate impacts on benthic (bottom) communities, bycatch and species of conservation interest. As a result of the Trawl Management Plan that was introduced in 2000, the GBRMP Representative Areas Program that was implemented in 2004, and other social and economic factors, trawl fishing effort in the GBRMP has declined over the last 16 years.
TrackMapper outputs are being used to quantify these reductions in an FRDC research project that is designed to measure impacts on elasmobranchs (i.e. sharks and rays) and other trawl bycatch. Preliminary results from this study show that bycatch and the impacts of trawling in the GBRMP have declined markedly since the late 1990s. The results can be used to inform fishers, Fisheries Queensland managers, the GBRMP Authority and others about the impacts and trends of trawling in the park.
Figure 4. Spatial distribution of catches in the sectors that make up the Queensland east coast otter trawl fishery from 2011-2015. Dotted line is the 100 m depth contour.
TrackMapper Rises, Department of Agriculture and Fisheries, 2016 9
Conclusions/Significance/Recommendations The repair and upgrading of TrackMapper have been successful and were achieved on time and within budget.
The new web-based version is now menu-driven and more user-friendly, making it easier and faster to use. As such, it is now accessible to more DAF fisheries management and research staff.
The automated ‘marrying’ of the CFISH and VMS databases greatly reduces the amount of time that users need to spend to ensure the application is using the most recent, available data. Furthermore and importantly, the algorithms used to join the two databases result in no copies of the CFISH and VMS data being produced, which helps to maintain confidentiality of the data.
The upgrading of TrackMapper is significant. The program was designed for the Queensland east coast otter trawl fishery, which is the largest prawn trawl fishery in Australia, producing 7000-8000 t of seafood annually valued at $80-90million. TrackMapper is a very useful tool for researching and managing the fishery, especially for assessment of stocks and other impacts, particularly in the GBRMP which has World Heritage status. While most Australian states have logbook programs and VMS for their commercial fleets, including some with electronic logbooks (i.e. elogs), we are unaware of any other State or Commonwealth fishery with similar software that combines and analyses these data together. In this regard, Queensland is the national leader in the use and application of high-resolution catch, fishing effort and catch rate data in trawl fisheries.
The decision to undertake the upgrading of TrackMapper ‘in-house’ at ESP through a formal agreement between DAF and DSITI has proven to be productive. This has facilitated collaboration, improved communication and efficiency within the project. The decision continues to benefit DAF and the project through the warranty and maintenance conditions which were part of the agreement.
Key Messages The key message is that the TrackMapper database program is a very useful tool for the management and research of the Queensland trawl fishery. The program is now fully functional on DAF computers and as a result of the upgrade, it is easier to use and much faster than the previous version.
Where to next TrackMapper was developed for the Queensland trawl fishery, which is the state’s most valuable commercial fishery. Its development was possible because all otter trawl vessels in Queensland have been mandated to use VMS since 2000 (with the exception of Moreton Bay M2 license holders). There is increasing pressure for other Queensland commercial fishing sectors (e.g. reef line, net and crab) to also adopt VMS, particularly in the GBRMP. Fisheries Queensland has undertaken trials of VMS in some of these sectors in recent years. If they adopt VMS then there would be potential to modify and expand TrackMapper to include these additional sectors.
While TrackMapper outputs are useful, the program could be further improved. For example, identifying and excluding anchorages, closures and other areas (i.e. rivers, reefs) where trawling does not occur, would be useful. At present, if vessels pass through these areas at trawl speed then TrackMapper incorrectly allocates a trawl track and a proportion of the catch to the area. This could be addressed through the development of user-defined exclusion zones (i.e. shape file polygons). The upgraded version of TrackMapper does have a preliminary feature to do this, but it requires further development.
TrackMapper Rises, Department of Agriculture and Fisheries, 2016 10
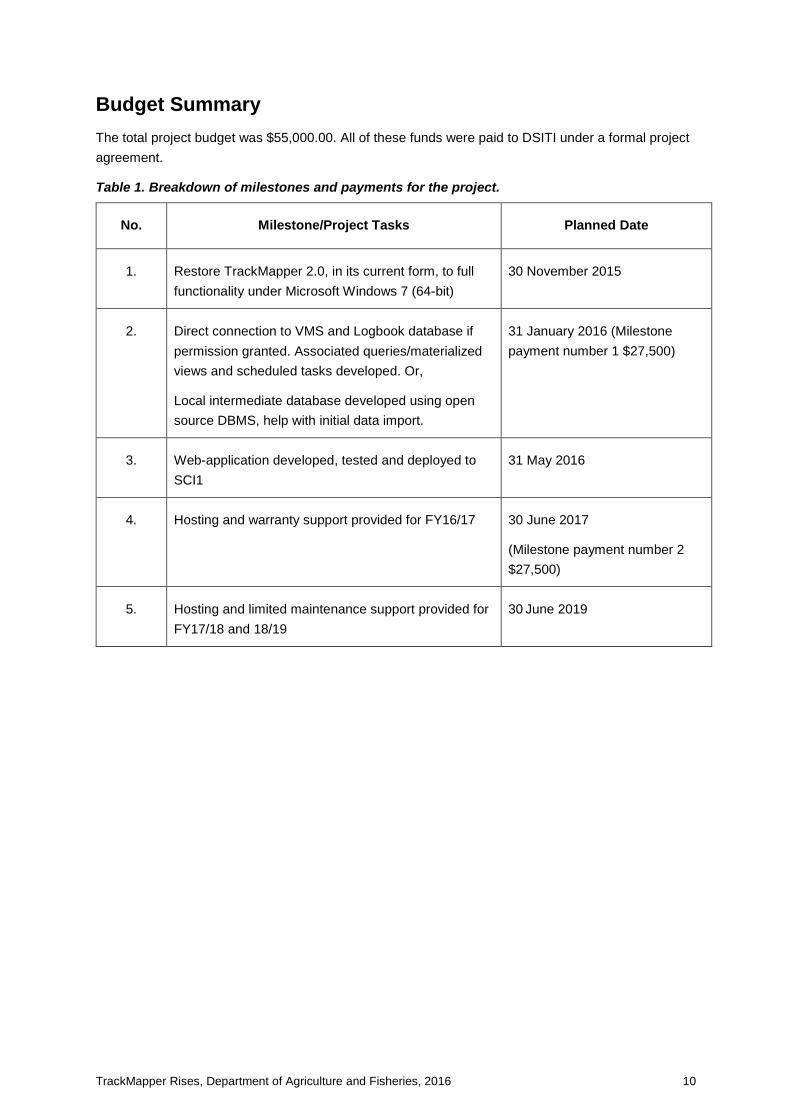
Budget Summary The total project budget was $55,000.00. All of these funds were paid to DSITI under a formal project agreement.
Table 1. Breakdown of milestones and payments for the project.
No. Milestone/Project Tasks Planned Date
1. Restore TrackMapper 2.0, in its current form, to full functionality under Microsoft Windows 7 (64-bit)
30 November 2015
2. Direct connection to VMS and Logbook database if permission granted. Associated queries/materialized views and scheduled tasks developed. Or,
Local intermediate database developed using open source DBMS, help with initial data import.
31 January 2016 (Milestone payment number 1 $27,500)
3. Web-application developed, tested and deployed to SCI1
31 May 2016
4. Hosting and warranty support provided for FY16/17 30 June 2017
(Milestone payment number 2 $27,500)
5. Hosting and limited maintenance support provided for FY17/18 and 18/19
30 June 2019