
TOXIC SUBSTANCES MONITORING PROGRAM 1991 DATA REPORT
34
TOXIC SUBSTANCES MONITORING PROGRAM 1991 DATA REPORT 93-1WQ 1993 Prepared by Del Rasmussen Division of Water Quality Field and Laboratory Operations Conducted by the Water Pollution Control Laboratory California Department of Fish and Game STATE WATER RESOURCES CONTROL BOARD CALIFORNIA ENVIRONMENTAL PROTECTION AGENCY
Transcript of TOXIC SUBSTANCES MONITORING PROGRAM 1991 DATA REPORT

TOXIC SUBSTANCES MONITORING PROGRAM
1991 DATA REPORT
93-1WQ 1993
Prepared by Del Rasmussen
Division of Water Quality
Field and Laboratory Operations Conducted by the Water Pollution Control Laboratory
California Department of Fish and Game
STATE WATER RESOURCES CONTROL BOARD CALIFORNIA ENVIRONMENTAL PROTECTION AGENCY
ii
ACKNOWLEDGEMENTS
The State Water Resources Control Board wishes to acknowledge the contributions of the following
individuals to this report:
Department of Fish and Game, Water Pollution Control Laboratory
Director: Richard Hansen
Field Support: Jack Linn
Karen Fothergill
Laboratory Support: David Crane
Kathleen Regalado
Laurie Smith
State Water Resources Control Board
Graphic Support: Dale Oliver

iii
Toxic Substances Monitoring Program - 1991 Data Report
TABLE OF CONTENTS
Page
Acknowledgements ...............................................................................................................................................ii
List of Appendices ............................................................................................................................................... iv
List of Tables ........................................................................................................................................................ v
List of Abbreviations ............................................................................................................................................vii
1. 1991 PROGRAM
Introduction............................................................................................................................................1
Summary...............................................................................................................................................1
2. FIELD AND LABORATORY OPERATIONS ..........................................................................................9
Substances Measured ..........................................................................................................................9
Sample Size ..........................................................................................................................................9
Wet and Lipid Weight Measurements ..................................................................................................9
Station Numbers .................................................................................................................................10
3. ADMINISTRATIVE AND COMPARATIVE CRITERIA..........................................................................11
Maximum Tissue Residue Levels (MTRLs) .......................................................................................11
FDA Action Levels and NAS Guidelines.............................................................................................12
Median International Standards (MIS)
for Trace Elements .....................................................................................................................12
Elevated Data Levels (EDL)................................................................................................................12
4. LITERATURE CITED .............................................................................................................................26

iv
Toxic Substances Monitoring Program - 1991 Data Report
APPENDICES
Page
Appendix A- Summary of 1991 Species Data .............................................................................................. A-1
Appendix B- Summary of 1991 Data: Trace Elements in Sediment
(ppm, dry weight) ...................................................................................................................... B-1
Appendix C- Summary of 1991 Data: Organic Chemicals in Sediment
(ppb, dry weight) ....................................................................................................................... C-1
Appendix D- Summary of 1991 Data: Organic Chemicals in Freshwater Fish
Exceeding Maximum Tissue Residue Levels (MTRLs)
(ppb, wet weight)....................................................................................................................... D-1
Appendix E- Summary of 1991 Data: Trace Elements in Freshwater Fish
Exceeding Selected Criteria (ppm, wet weight) ....................................................................... E-1
Appendix F- Summary of 1991 Data: Organic Chemicals in Freshwater Fish
Exceeding Selected Criteria (ppb, wet weight) .........................................................................F-1
Appendix G- Summary of 1991 Data: PCP and TCP in Freshwater Fish
(ppb, wet weight).......................................................................................................................G-1
Appendix H- Summary of 1991 Data: Trace Elements in Marine Fish
Exceeding Selected Criteria (ppm, wet weight) ....................................................................... H-1
Appendix I- Summary of 1991 Data: Organic Chemicals in Marine Fish
Exceeding Selected Criteria (ppb, wet weight) ..........................................................................I-1
Appendix J- Summary of 1991 Data: Organic Chemicals in Freshwater Fish
Exceeding Lipid Weight EDL 85 and EDL 95
(ppb, lipid weight).......................................................................................................................J-1
Appendix K- Summary of 1991 Data: Organic Chemicals in Marine Fish
Exceeding Lipid Weight EDL 85 and EDL 95
(ppb, lipid weight)...................................................................................................................... K-1
Appendix L- -Summary of 1991 Data: Trace Elements in Fish, Crayfish,
and Turtles (ppm, wet weight) ...................................................................................................L-1
v
Toxic Substances Monitoring Program - 1991 Data Report
APPENDICES (continued)
Page
Appendix M- Summary of 1991 Data: Organic Chemicals in Fish, Crayfish,
and Turtles (ppb, wet weight) ...................................................................................................M-1
Appendix N- Summary of 1991 Data: Lipid Data in Fish
(ppb, lipid weight)...................................................................................................................... N-1
Appendix O- Station Sampling History ..........................................................................................................O-1
Appendix P- 1991 Station Descriptions ........................................................................................................ P-1
Appendix Q- 1991 Station Latitudes and Longitudes....................................................................................Q-1
Appendix R- Maps Showing 1991 Station Locations.................................................................................... R-1
Appendix S- Field and Laboratory Operations.............................................................................................. S-1
Appendix T- Median International Standards ............................................................................................... T-1
Appendix U- Elevated Data Levels................................................................................................................ U-1
LIST OF TABLES
Table 1. 1991 Toxic Substances Monitoring Program ....................................................................................3
Table 2. 1991 Freshwater Fish Code List ........................................................................................................7
Table 3. 1991 Marine Fish Code List ...............................................................................................................8
Table 4. 1991 Non-Fish Species Code List .....................................................................................................8
Table 5. Maximum Tissue Residue Levels (MTRLs)
for Inland Surface Waters ................................................................................................................14
Table 6. NAS Guidelines and FDA Action Levels For
Toxic Chemicals in Fish (wet weight) ..............................................................................................15

vi
Toxic Substances Monitoring Program - 1991 Data Report
LIST OF TABLES (continued)
Page
Table 7. Median International Standards for Trace
Elements in Freshwater Fish and Marine
Shellfish (edible portion, ppm, wet weight) ......................................................................................16
Table 8. TSMP EDL 85 and EDL 95 For Trace Elements
in Fish Livers. Calculated Using 1978-1991
Data (ppm, wet weight) ................................................................................................................... .17
Table 9. TSMP EDL 85 and EDL 95 For Trace Elements
in Whole Fish. Calculated Using 1978-1991
Data (ppm, wet weight) ................................................................................................................... .18
Table 10. TSMP EDL 85 and EDL 95 For Trace Elements
in Fish Filets. Calculated Using 1978-1991
Data (ppm, wet weight) ................................................................................................................... .19
Table 11. TSMP EDL 85 and EDL 95 For Organic Chemicals in
Freshwater Fish Filets. Calculated Using 1978-1991
Data (ppm, wet weight) ................................................................................................................... .20
Table 12. TSMP EDL 85 and EDL 95 for Organic Chemicals in
Marine Fish Filets. Calculated Using 1978-1991
Data (ppb, wet weight) .....................................................................................................................21
Table 13. TSMP EDL 85 and EDL 95 for Organic Chemicals in
Whole Freshwater Fish. Calculated Using 1978-1991
Data (ppb, wet weight) .....................................................................................................................22
Table 14. TSMP EDL 85 and EDL 95 for Organic Chemicals in
Whole Marine Fish. Calculated Using 1978-1991
Data (ppb, wet weight) .....................................................................................................................23
Table 15. TSMP EDL 85 and EDL 95 for Organic Chemicals in
Filet and Whole Freshwater Fish. Calculated
Using 1980-1991 Lipid Data (ppb, lipid weight) .............................................................................. .24
Table 16. TSMP EDL 85 and EDL 95 for Organic Chemicals in
Filet and Whole Marine Fish. Calculated
Using 1980-1991 Lipid Data (ppb, lipid weight) ...............................................................................25

vii
Toxic Substances Monitoring Program - 1991 Data Report
LIST OF ABBREVIATIONS
DBP Dichlorobenzophenone
DDD Dichlorodiphenyldichloroethane
DDE Dichlorodiphenyldichloroethylene
DDT Dichlorodiphenyltrichloroethane
DDMS Dichlorodiphenylmonochlorosaturatedethane
DDMU Dichlorodiphenylmonochlorounsaturatedethane
DFG California Department of Fish and Game
d/s Downstream
EDL Elevated Data Level(s)
FDA or (USFDA) United States Food and Drug Administration
HCB Hexachlorobenzene
HCH Hexachlorocyclohexane
MIS Median International Standard(s)
MTRL Maximum Tissue Residue Level(s)
NAS National Academy of Sciences
PAHs Polynuclear Aromatic Hydrocarbons
PCBs Polychlorinated Biphenyls
ppb Parts Per Billion (ng/g)
ppm Parts Per Million (ug/g)
Regional Water Boards California Regional Water Quality Control Boards
State Water Board California State Water Resources Control Board
or SWRCB
TSMP Toxic Substances Monitoring Program
USEPA United States Environmental Protection Agency
u/s Upstream

1
TOXIC SUBSTANCES MONITORING PROGRAM
1991
Introduction
The Toxic Substances Monitoring Program (TSMP) was initiated in 1976 by the California State Water
Resources Control Board (State Water Board). The TSMP was organized to provide a uniform statewide
approach to the detection and evaluation of the occurrence of toxic substances in fresh, estuarine, and
marine waters of the State through the analysis of fish and other aquatic life. The TSMP primarily targets
water bodies with known or suspected impaired water quality and is not intended to give an overall water
quality assessment. The California Department of Fish and Game (DFG) carries out the statewide TSMP
for the State Water Board by collecting and analyzing samples. The State Water Board provides funding
for the program under an ongoing interagency agreement with the DFG. Sampling stations are selected
primarily by the nine Regional Water Quality Control Boards (Regional Water Boards) which are identified
on the inside back cover.
The DFG reports annual sampling results to the State Water Board. The information is transmitted to the
Regional Water Boards and to other federal, State, and local agencies in the form of an annual TSMP
report. The report provides information on the statewide occurrence and levels of toxic substances and
the data can be used by the Regional Water Boards and other agencies to identify waters impacted by
toxic pollutants and to eventually abate such problems. This report presents the results of the 1991
sampling and analysis program. The raw data from the 1991 sampling program has already been
released to the Regional Water Boards, other State agencies, and to the interested public. This report is
the formal report on the 1991 program. The TSMP reports are routinely transmitted to the Office of
Environmental Health Hazard Assessment of the California Environmental Protection Agency, which has
responsibility for evaluating pollutant levels based on human health concerns and issuing fish
consumption health advisories if indicated.
TSMP results are used by the State and Regional Water Boards in the statewide Water Quality
Assessment/Clean Water Strategy. Water bodies are classified from good to impaired water quality
relative to each other and ranked according to this classification and resource value. TSMP results are
used to assist in the ranking process. For example, water bodies that exceed human health criteria are
considered more impaired than water bodies that only exceed environmental protection criteria. TSMP
results are also used in the regulatory activities of the Regional Water Boards and the Department of
Pesticide Regulation.
Summary
Table 1 at the end of this section lists the 108 stations (94 water bodies) sampled in 1991 including
15 stations sampled as part of a special urban lake survey in Region 4. Fifty-six of the stations were
sampled for the first time. A total of 159 samples were analyzed for trace elements (metals), pesticides,
and PCBs (Appendix A). Fish were collected at all but five of the stations. Crayfish were collected at five
stations in Regions 4, 5, and 8. A spiny soft shelled turtle was collected at the Westmorland station on the
New River in Region 7. Along with aquatic organisms, sediment was analyzed from five stations in
2
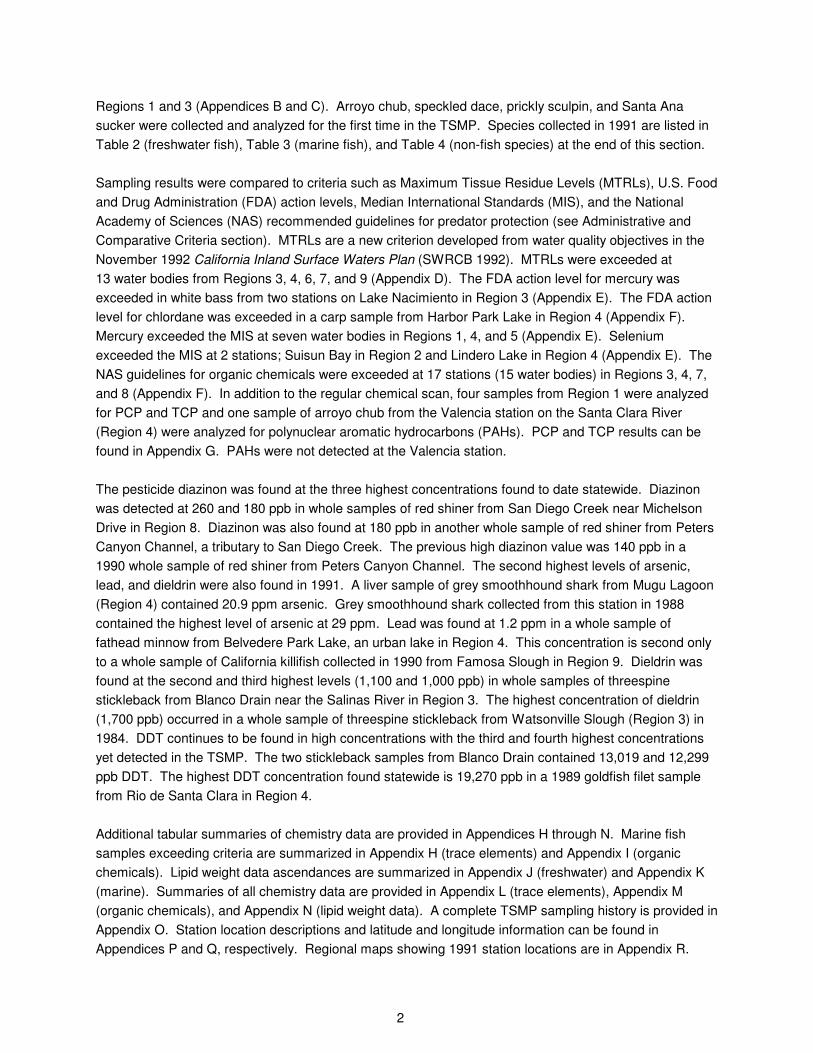
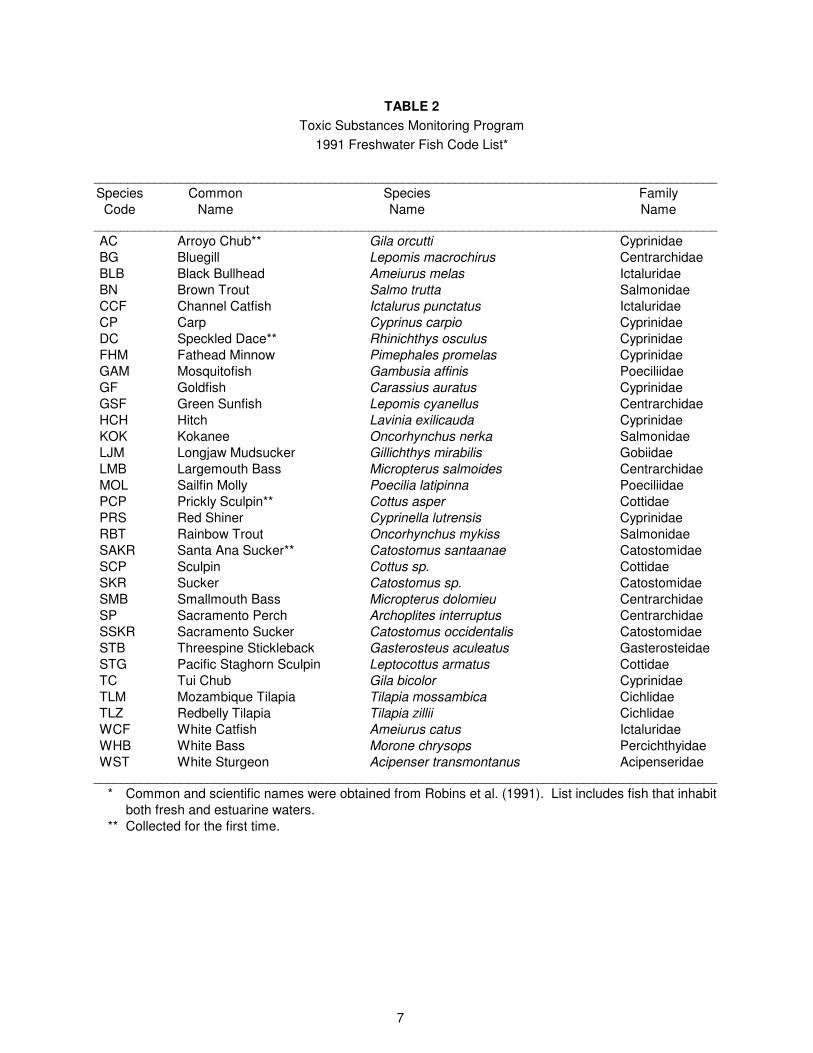
Regions 1 and 3 (Appendices B and C). Arroyo chub, speckled dace, prickly sculpin, and Santa Ana
sucker were collected and analyzed for the first time in the TSMP. Species collected in 1991 are listed in
Table 2 (freshwater fish), Table 3 (marine fish), and Table 4 (non-fish species) at the end of this section.
Sampling results were compared to criteria such as Maximum Tissue Residue Levels (MTRLs), U.S. Food
and Drug Administration (FDA) action levels, Median International Standards (MIS), and the National
Academy of Sciences (NAS) recommended guidelines for predator protection (see Administrative and
Comparative Criteria section). MTRLs are a new criterion developed from water quality objectives in the
November 1992 California Inland Surface Waters Plan (SWRCB 1992). MTRLs were exceeded at
13 water bodies from Regions 3, 4, 6, 7, and 9 (Appendix D). The FDA action level for mercury was
exceeded in white bass from two stations on Lake Nacimiento in Region 3 (Appendix E). The FDA action
level for chlordane was exceeded in a carp sample from Harbor Park Lake in Region 4 (Appendix F).
Mercury exceeded the MIS at seven water bodies in Regions 1, 4, and 5 (Appendix E). Selenium
exceeded the MIS at 2 stations; Suisun Bay in Region 2 and Lindero Lake in Region 4 (Appendix E). The
NAS guidelines for organic chemicals were exceeded at 17 stations (15 water bodies) in Regions 3, 4, 7,
and 8 (Appendix F). In addition to the regular chemical scan, four samples from Region 1 were analyzed
for PCP and TCP and one sample of arroyo chub from the Valencia station on the Santa Clara River
(Region 4) were analyzed for polynuclear aromatic hydrocarbons (PAHs). PCP and TCP results can be
found in Appendix G. PAHs were not detected at the Valencia station.
The pesticide diazinon was found at the three highest concentrations found to date statewide. Diazinon
was detected at 260 and 180 ppb in whole samples of red shiner from San Diego Creek near Michelson
Drive in Region 8. Diazinon was also found at 180 ppb in another whole sample of red shiner from Peters
Canyon Channel, a tributary to San Diego Creek. The previous high diazinon value was 140 ppb in a
1990 whole sample of red shiner from Peters Canyon Channel. The second highest levels of arsenic,
lead, and dieldrin were also found in 1991. A liver sample of grey smoothhound shark from Mugu Lagoon
(Region 4) contained 20.9 ppm arsenic. Grey smoothhound shark collected from this station in 1988
contained the highest level of arsenic at 29 ppm. Lead was found at 1.2 ppm in a whole sample of
fathead minnow from Belvedere Park Lake, an urban lake in Region 4. This concentration is second only
to a whole sample of California killifish collected in 1990 from Famosa Slough in Region 9. Dieldrin was
found at the second and third highest levels (1,100 and 1,000 ppb) in whole samples of threespine
stickleback from Blanco Drain near the Salinas River in Region 3. The highest concentration of dieldrin
(1,700 ppb) occurred in a whole sample of threespine stickleback from Watsonville Slough (Region 3) in
1984. DDT continues to be found in high concentrations with the third and fourth highest concentrations
yet detected in the TSMP. The two stickleback samples from Blanco Drain contained 13,019 and 12,299
ppb DDT. The highest DDT concentration found statewide is 19,270 ppb in a 1989 goldfish filet sample
from Rio de Santa Clara in Region 4.
Additional tabular summaries of chemistry data are provided in Appendices H through N. Marine fish
samples exceeding criteria are summarized in Appendix H (trace elements) and Appendix I (organic
chemicals). Lipid weight data ascendances are summarized in Appendix J (freshwater) and Appendix K
(marine). Summaries of all chemistry data are provided in Appendix L (trace elements), Appendix M
(organic chemicals), and Appendix N (lipid weight data). A complete TSMP sampling history is provided in
Appendix O. Station location descriptions and latitude and longitude information can be found in
Appendices P and Q, respectively. Regional maps showing 1991 station locations are in Appendix R.

3
TABLE 1
1991 Toxic Substances Monitoring Program
_____________________________________________________________________________________________
Station Sample Collection Analyses
Name Date
_____________________________________________________________________________________________
Region 1
Beaughton Creek/d/s Highway 97 Bridge Brown Trout (BN) 09/19/91 Metals, Organics,
PCP, TCP
Carrville Pond* Sediment (SED) 09/18/91 Metals, Organics
Estero Americano* Pacific Staghorn Sculpin (STG) 07/16/91 Cu, Hg
Estero de San Antonio* Prickly Sculpin (PCP) 07/16/91 Metals
Klamath River/d/s Iron Gate Reservoir* Speckled Dace (DC) 09/19/91 Metals, Organics,
PCP, TCP
Lake Mendocino Largemouth Bass (LMB) 09/09/91 Hg
Lake Pillsbury Largemouth Bass (LMB) 09/10/91 Metals
Lake Sonoma Largemouth Bass (LMB) 09/09/91 Hg
Lost River/Tule Lake Tui Chub (TC) 09/20/91 Metals, Organics
McDaniel Slough Threespine Stickleback (STB) 09/16/91 Metals
Russian River/Duncans Mills* Prickly Sculpin (PCP) 07/17/91 Metals, Organics
Shasta River Speckled Dace (DC) 09/19/91 Metals, PCP, TCP
Trinity River/d/s Burnt Ranch Rainbow Trout (RBT) 09/17/91 Organics
Trinity River/East Fork Rainbow Trout (RBT) 09/18/91 Metals, Organics,
PCP, TCP
Trinity River/Willow Creek Sculpin (SCP) 09/16/91 Metals, Organics
Region 2
Alameda Creek/Niles Canyon Road* Sculpin (SCP) 07/09/91 Metals, Organics
Napa River/Napa Hitch (HCH) 07/11/91 Hg, Se, Organics
Stevens Creek Rainbow Trout (RBT) 07/09/91 Metals, Organics
Suisun Bay White Sturgeon (WST) 01/12/92 Metals, Organics
Walker Creek* Pacific Staghorn Sculpin (STG) 07/16/91 Metals, Organics
Walnut Creek* Green Sunfish (GSF) 07/10/91 Metals, Organics
Region 3
Aptos Creek* Prickly Sculpin (PCP) 08/07/91 Metals, Organics
Blanco Drain/Salinas River Threespine Stickleback (STB) 09/04/91 Organics
Carmel Lagoon Threespine Stickleback (STB) 08/01/91 Metals, Organics
Sediment (SED) 08/01/91 Metals, Organics
Corcoran Lagoon* Pacific Staghorn Sculpin (STG) 08/07/91 Metals, Organics
El Estero* Bluegill (BG) 08/02/91 Metals, Organics
Lake Nacimiento/Dip Creek White Bass (WHB) 07/31/91 Metals
Sediment (SED) 07/31/91 Metals
Lake Nacimiento/Las Tablas White Bass (WHB) 07/31/91 Metals
Sediment (SED) 07/31/91 Metals
Moran Lake* Threespine Stickleback (STB) 08/06/91 Metals, Organics
Neary's Lake* Sacramento Sucker (SSKR) 08/06/91 Hg, Se, Organics
Roberts Lake* Sacramento Perch (SP) 08/01/91 Metals, Organics
Santa Maria River/Mouth* Sediment (SED) 07/31/91 Organics
Schwann Lake* Largemouth Bass (LMB) 08/07/91 Metals, Organics
_____________________________________________________________________________________________
* Stations sampled for the first time.

4
TABLE 1 (continued)
1991 Toxic Substances Monitoring Program
_____________________________________________________________________________________________
Station Sample Collection Analyses
Name Date
_____________________________________________________________________________________________
Region 4
Alamitos Bay* California Corbina (CCB) 06/12/91 Metals, Organics
Arroyo Conejo Green Sunfish (GSF) 06/19/91 Metals, Organics
Arroyo Simi* Fathead Minnow (FHM) 06/19/91 Metals, Organics
Belvedere Park Lake*# Fathead Minnow (FHM) 04/18/91 Metals, Organics
Calabasas Lake*# Largemouth Bass (LMB) 04/20/91 Metals, Organics
Calleguas Creek Goldfish (GF) 06/18/91 Organics
Conejo Creek* Mosquitofish (GAM) 06/19/91 Metals, Organics
Echo Park Lake # Largemouth Bass (LMB) 04/19/91 Metals, Organics
Eleanor Lake*# Black Bullhead (BLB) 04/22/91 As
Goldfish (GF) 04/22/91 As, Hg, Se,
Organics
El Dorado Park Lake*# Largemouth Bass (LMB) 04/21/91 Metals, Organics
Harbor Park Lake # Carp (CP) 06/15/91 Organics
Hollenbeck Park Lake*# Red Swamp Crayfish (PROI) 04/18/91 Metals, Organics
Legg Lake # Largemouth Bass (LMB) 04/17/91 Metals, Organics
Lincoln Park Lake # Largemouth Bass (LMB) 04/18/91 Metals, Organics
Lindero Lake*# Largemouth Bass (LMB) 04/22/91 Metals, Organics
Los Angeles River/Sepulveda Basin* Goldfish (GF) 05/15/91 Hg, Se, Organics
Malibu Creek Bluegill (BG) 06/18/91 Metals, Organics
Malibou Lake*# Largemouth Bass (LMB) 04/23/91 Metals, Organics
Mugu Lagoon Gray Smoothhound Shark (GSS) 06/17/91 Metals
Peck Road Lake # Largemouth Bass (LMB) 04/17/91 Metals, Organics
Puddingstone Reservoir # Largemouth Bass (LMB) 06/11/91 Metals, Organics
Rio de Santa Clara/Oxnard Drain Mosquitofish (GAM) 06/17/91 Organics
San Gabriel River Mozambique Tilapia (TLM) 06/16/91 Metals
Santa Clara River/Santa Paula Santa Ana Sucker (SAKR) 06/20/91 Hg, Se
Santa Clara River/Valencia* Arroyo Chub (AC) 06/11/91 Organics, PAHs
Sherwood Lake*# Largemouth Bass (LMB) 04/22/91 Metals, Organics
Ventura River Carp (CP) 06/20/91 Metals, Organics
Westlake Lake*# Largemouth Bass (LMB) 04/23/91 Metals, Organics
Region 5
American River/d/s Folsom Reservoir* Largemouth Bass (LMB) 10/03/91 Hg
American River/d/s Watt Avenue Bridge Sacramento Sucker (SSKR) 10/16/91 Hg
Feather River/d/s Highway 99 Bridge Channel Catfish (CCF) 10/09/91 Hg
Feather River/d/s Oroville Reservoir* Sucker (SKR) 11/05/91 Hg
Franks Tract* Crayfish (PACI) 10/21/91 Metals
Sacramento River/Hood White Catfish (WCF) 10/11/91 Hg
White Catfish (WCF) 11/21/91 Hg
Crayfish (PACI) 10/21/91 Metals
Sacramento River/u/s I-5 Overcrossing* Crayfish (PACI) 10/11/91 Metals
San Joaquin River/Vernalis Channel Catfish (CCF) 10/30/91 Hg
Yuba River/N.F./d/s Bullards Bar Res* Smallmouth Bass (SMB) 10/15/91 Hg
_____________________________________________________________________________________________
* Stations sampled for the first time.
# Urban Lake Survey

5
TABLE 1 (continued)
1991 Toxic Substances Monitoring Program
_____________________________________________________________________________________________
Station Sample Collection Analyses
Name Date
_____________________________________________________________________________________________
Region 6
Bishop Creek Canal/d/s Bishop* Brown Trout (BN) 07/23/91 Metals, Organics
Carson River/W.F./d/s Paynesville* Brown Trout (BN) 09/27/91 Metals, Organics
Donner Lake* Kokanee (KOK) 10/23/91 Metals, Organics
Gull Lake* Sacramento Perch (SP) 07/24/91 Metals
Haiwee Reservoir* Smallmouth Bass (SMB) 07/24/91 Metals
Little Rock Creek Reservoir* Black Bullhead (BLB) 08/14/91 Metals
Sabrina Lake* Brown Trout (BN) 07/23/91 Metals
Silver Creek* Sucker (SKR) 09/27/91 Metals
Silverwood Lake* Largemouth Bass (LMB) 08/14/91 Metals
Squaw Creek Brown Trout (BN) 10/22/91 Metals, Organics
Region 7
Colorado River/Needles Carp (CP) 08/20/91 Hg, Se, Organics
Colorado River/u/s Imperial Dam Largemouth Bass (LMB) 08/18/91 Metals, Organics
Fig Drain Sailfin Molly (MOL) 08/17/91 Se, Organics
Mayflower Drain* Mosquitofish (GAM) 08/16/91 Se, Organics
New River/International Boundary Carp (CP) 12/18/91 Se, Hg, Organics
New River/Westmorland Channel Catfish (CCF) 08/15/91 Se, Organics
Spiny Soft Shelled Turtle (SST) 08/15/91 Se, Organics
Orange Drain* Mosquitofish (GAM) 08/17/91 Se, Organics
Palo Verde Outfall Drain Carp (CP) 08/19/91 Se, Organics
Peach Drain* Mosquitofish (GAM) 08/17/91 Se
Reservation Main Drain Redbelly Tilapia (TLZ) 08/18/91 Se, Organics
Rose Drain Mosquitofish (GAM) 08/17/91 Se, Organics
Salton Sea/North Orangemouth Corvina (ORC) 05/30/91 Metals, Organics
Orangemouth Corvina (ORC) 06/18/91 Se, Organics
Sargo (SAR) 05/30/91 Metals, Organics
Salton Sea/South Orangemouth Corvina (ORC) 05/15/91 Metals, Organics
Region 8
El Modena Channel/u/s Walnut Avenue Brg* Red Shiner (PRS) 05/16/91 Metals, Organics
Huntington Harbour/Anaheim Bay White Croaker (WCK) 11/21/91 Metals, Organics
Newport Bay Spotted Sand Bass (SSB) 06/20/91 Metals, Organics
Peters Canyon Channel Red Shiner (PRS) 05/16/91 Metals, Organics
San Diego Creek/Barranca Parkway Red Shiner (PRS) 05/16/91 Metals, Organics
San Diego Creek/Michelson Drive Red Shiner (PRS) 05/16/91 Metals, Organics
Santa Ana River/Prado Dam Largemouth Bass (LMB) 05/14/91 Metals, Organics
Red Swamp Crayfish (PROI) 05/14/91 Metals, Organics
Santa Ana River/USGS Gage Santa Ana Sucker (SAKR) 05/14/91 Hg, Se
_____________________________________________________________________________________________
* Stations sampled for the first time.

6
TABLE 1 (continued)
1991 Toxic Substances Monitoring Program
_____________________________________________________________________________________________
Station Sample Collection Analyses
Name Date
_____________________________________________________________________________________________
Region 9
Chollas Creek/Main Street* Longjaw Mudsucker (LJM) 06/14/91 Metals, Organics
Keys Creek* Green Sunfish (GSF) 06/13/91 Metals, Organics
Rainbow Creek* Black Bullhead (BLB) 06/14/91 Metals, Organics
San Luis Rey River/Foussat Road* Largemouth Bass (LMB) 06/13/91 Metals, Organics
San Luis Rey River/Highway 15* Largemouth Bass (LMB) 06/13/91 Metals, Organics
San Luis Rey River/Highway 76* Largemouth Bass (LMB) 06/13/91 Metals, Organics
Santa Margarita River/Willow Glen Road* Green Sunfish (GSF) 06/14/91 Metals, Organics
_____________________________________________________________________________________________
* Stations sampled for the first time.
7
TABLE 2
Toxic Substances Monitoring Program
1991 Freshwater Fish Code List*
_____________________________________________________________________________________________
Species Common Species Family
Code Name Name Name _____________________________________________________________________________________________
AC Arroyo Chub** Gila orcutti Cyprinidae
BG Bluegill Lepomis macrochirus Centrarchidae
BLB Black Bullhead Ameiurus melas Ictaluridae
BN Brown Trout Salmo trutta Salmonidae
CCF Channel Catfish Ictalurus punctatus Ictaluridae
CP Carp Cyprinus carpio Cyprinidae
DC Speckled Dace** Rhinichthys osculus Cyprinidae
FHM Fathead Minnow Pimephales promelas Cyprinidae
GAM Mosquitofish Gambusia affinis Poeciliidae
GF Goldfish Carassius auratus Cyprinidae
GSF Green Sunfish Lepomis cyanellus Centrarchidae
HCH Hitch Lavinia exilicauda Cyprinidae
KOK Kokanee Oncorhynchus nerka Salmonidae
LJM Longjaw Mudsucker Gillichthys mirabilis Gobiidae
LMB Largemouth Bass Micropterus salmoides Centrarchidae
MOL Sailfin Molly Poecilia latipinna Poeciliidae
PCP Prickly Sculpin** Cottus asper Cottidae
PRS Red Shiner Cyprinella lutrensis Cyprinidae
RBT Rainbow Trout Oncorhynchus mykiss Salmonidae
SAKR Santa Ana Sucker** Catostomus santaanae Catostomidae
SCP Sculpin Cottus sp. Cottidae
SKR Sucker Catostomus sp. Catostomidae
SMB Smallmouth Bass Micropterus dolomieu Centrarchidae
SP Sacramento Perch Archoplites interruptus Centrarchidae
SSKR Sacramento Sucker Catostomus occidentalis Catostomidae
STB Threespine Stickleback Gasterosteus aculeatus Gasterosteidae
STG Pacific Staghorn Sculpin Leptocottus armatus Cottidae
TC Tui Chub Gila bicolor Cyprinidae
TLM Mozambique Tilapia Tilapia mossambica Cichlidae
TLZ Redbelly Tilapia Tilapia zillii Cichlidae
WCF White Catfish Ameiurus catus Ictaluridae
WHB White Bass Morone chrysops Percichthyidae
WST White Sturgeon Acipenser transmontanus Acipenseridae _____________________________________________________________________________________________
* Common and scientific names were obtained from Robins et al. (1991). List includes fish that inhabit
both fresh and estuarine waters.
** Collected for the first time.

8
TABLE 3
Toxic Substances Monitoring Program
1991 Marine Fish Code List*
_____________________________________________________________________________________________
Species Common Species Family
Code Name Name Name _____________________________________________________________________________________________
CCB California Corbina Menticirrhus undulatus Sciaenidae
GSS Gray Smoothhound Shark Mustelus californicus Carcharhinidae
ORC Orangemouth Corvina Cynoscion xanthulus Sciaenidae
SAR Sargo Anisotremus davidsoni Haemulidae
SSB Spotted Sand Bass Paralabrax maculatofasciatus Serranidae
WCK White Croaker Genyonemus lineatus Sciaenidae _____________________________________________________________________________________________
*Common and scientific names were obtained from Robins et al. (1991).
TABLE 4
Toxic Substances Monitoring Program
1991 Non-Fish Species Code List
_____________________________________________________________________________________________
Species Common Species Family
Code Name Name Name _____________________________________________________________________________________________
PACI Crayfish Pacifastacus leniusculus Astacidae
PROI Red Swamp Crayfish Procambarus clarki Astacidae
SST Spiny Soft Shelled Turtle Trionyx spiniferus Trionychidae _____________________________________________________________________________________________

9
FIELD AND LABORATORY OPERATIONS
The presence of many toxic substances in fresh waters is determined by analyzing tissues from fish and
other aquatic organisms. Concentrations of these substances in water are often too low or transitory to be
reliably detected through the more traditional methods of analysis of water samples. Also, many toxic
substances are not water soluble, but can be found associated with sediment or organic matter. Fish and
other aquatic organisms are sampled because they bioaccumulate and bioconcentrate toxic substances to
levels which may be many hundreds of times the levels actually in the water. This concentration factor
facilitates detection of toxic pollutants. The following is a general overall discussion of field and laboratory
procedures. A detailed discussion is provided in Appendix S.
Substances Measured
A total of 10 trace elements (metals) and 45 pesticides and PCBs (organic chemicals) are analyzed in the
TSMP on a regular basis. Additional substances, such as polynuclear aromatic hydrocarbons (PAHs),
pentachlorophenol (PCP), and tetrachlorophenol (TCP), are looked for on a request basis only. Not every
sample is analyzed for all metals or organic chemicals. Each sample at each station is handled individually.
The requesting agency, usually the Regional Water Boards, will specify the type of analysis for each
sample. All metals, except mercury and selenium, are routinely analyzed in liver tissue. Mercury, selenium,
and all organic chemicals are analyzed in muscle tissue (filet). When only very small fish are available,
metal or organic chemical analysis is performed on a whole-body composite of larger than usual numbers of
individual fish.
Sample Size
Composite samples, using six fish of each species, are collected whenever possible. The number and size
uniformity of the fish in each composite depends upon their availability. Replicate composites are collected
and analyzed to measure the variability of toxicant concentrations in single species composites collected at
the same time and place. Collection of the same species from all stations is desirable to minimize possible
variation in the data due to differences in pollutant uptake between species. However, this is not possible
over the entire State due to the variety of habitat sampled and limited collection time available in the
program. All reasonable efforts are made to maintain both station-to-station and year-to-year uniformity in
collections. In general, predator fish are desired from all stations. Forage fish are desired as supplemental
samples at stations where pollution problems are known to exist, or as substitute samples where predatory
fish are not available.
Wet and Lipid Weight Measurements
Tissue concentrations of metals and organic chemicals are measured on a wet weight basis. Metal data
are presented in parts per million (ppm), while organic chemical data are presented in parts per billion (ppb).
In addition to wet weight measures, organic chemicals are also expressed on a lipid weight basis. Lipid

10
weight measurements offer several advantages. Because chlorinated hydrocarbons are much more soluble
in lipids (fat tissues) than in water, they partition into lipid-rich tissues of aquatic organisms (Stout and
Beezhold 1981). Animals with higher proportions of lipid in their tissue usually have had higher
concentrations of chlorinated hydrocarbon pollutants (Phillips 1980). Factors such as season, water
temperature, health of the organism, stress on the organism, and type of species can affect the lipid levels
of samples collected for analysis and can, therefore, cause variability in results. Use of lipid weight
measurements may reduce this source of variability, although disadvantages have also been noted
(Phillips 1980). As a result, lipid weight values may represent a more realistic measure of environmental
availability of chlorinated hydrocarbons than wet weight values. Wet weight measures, however, remain the
preferred measure for most readers because all standards for human health and for predator protection are
based on wet weight measures. Also, wet weight measures better reflect the exposure of predators or
humans to the actual concentration in freshly caught fish.
Station Numbers
Each TSMP station is identified by a unique seven digit number derived from the State Water Board's
hydrologic basin planning maps. The first digit of a station number signifies one of the nine Regional Water
Boards. The second and third digits represent a hydrologic area, while the fourth and fifth digits identify a
hydrologic subarea. The sixth and seventh digits represent the distance in miles above the downstream
hydrologic boundary. For example, station 519.21.01 is in Region 5, hydrologic area 19, subarea 21, and is
one mile upstream from the hydrologic unit boundary. Not all mileage indicators are accurate, however. In
certain instances, it was necessary to assign an arbitrary mileage indicator. For example, the arbitrary
designation is used when two or more stations within the same hydrologic subarea are located within the
same number of miles of the hydrologic boundary, resulting in the same station number. In this case, one
or more of the stations is arbitrarily assigned a mileage designator from 90 to 99.

11
ADMINISTRATIVE AND COMPARATIVE CRITERIA
In this report, as in previous TSMP reports, the term "criteria" is used to refer to the criteria against which a
particular metal or organic chemical is being compared. As more than one criterion may apply to any one
metal or organic compound, a hierarchy was established. The intent of the hierarchy is to compare data
against the more important criterion. In general, FDA action levels and the "Median International
Standards" (MIS), human health-related criteria, are considered more important or critical. Following
human health criteria are NAS guidelines, predator protection criteria. Last in the hierarchy are "elevated
data levels" (EDL). New to this report are Maximum Tissue Residue Levels (MTRLs), also human health
related criteria. All appropriate 1991 data will be compared separately to MTRLs in addition to following the
usual hierarchy. The criteria mentioned above are discussed below.
In interpreting the TSMP data by any of the criteria provided, the reader is cautioned that there is no simple
relationship between concentrations of toxic substances observed in tissue samples and actual
concentrations in water. Different aquatic organisms tend to bioaccumulate a given toxic substance in
water to different levels; however, the differences usually do not prevent a general interpretation of the
data. The reader is cautioned that the limited number of samples obtained and analyzed at each station in
a single year is generally too small to provide a statistically sound basis for making absolute statements on
toxic substance concentrations. The values reported herein should be accepted as indicators of relative
levels of toxic pollution in water, not as absolute values. In this sense, trends over time and ranking values
of a toxic substance in a particular species provide only an indication of areas where fish are evidently
accumulating concentrations which are above "normal".
Maximum Tissue Residue Levels (MTRLs)
MTRLs were developed from human health water quality objectives in Table 2 of the State Water Board's
November 1992 California Inland Surface Waters Plan (SWRCB 1992). The objectives represent
concentrations in water that protect against drinking water and consuming fish or shellfish that contain
substances at levels which could result in significant human health problems. MTRLs are used as alert
levels or guidelines indicating water bodies with potential human health concerns and are an assessment
tool and not compliance or enforcement criteria. MTRLs are compared only to filet or edible tissue samples
and should not be compared to whole body or liver samples. Table 5 at the end of this section lists MTRLs
for those substances monitored in the TSMP. The MTRLs for 10 of the 15 carcinogens listed in Table 5 are
below the current tissue detection limit for those substances. Only MTRLs for arsenic, DDT, HCB, gamma-
HCH, and PCP are above the detection limits.
The MTRLs were calculated by multiplying the human health water quality objectives by the
bioconcentration factor (BCF) for each substance as recommended in the USEPA Draft Assessment and
Control of Bioconcentratable Contaminants in Surface Waters (USEPA 1991). BCFs were taken from the
USEPA 1980 Ambient Water Quality Criteria Documents for each substance. MTRLs were not calculated
for objectives that are based on maximum contaminant levels (MCLs) or taste and odor criteria.

12
FDA Action Levels and NAS Guidelines
The U.S. Food and Drug Administration (FDA) has established maximum concentration levels for some
toxic substances in human foods (USFDA 1985). The levels are based on specific assumptions of the
quantities of food consumed by humans and upon the frequency of their consumption. The FDA limits are
intended to protect humans from the chronic effects of toxic substances consumed in foodstuffs. The
National Academy of Sciences (NAS) has established recommended maximum concentrations of toxic
substance concentrations in freshwater fish tissue (NAS 1973). They were established not only to protect
the organisms containing the toxic compounds, but also to protect the species that consume these
contaminated organisms. The specific action levels and guidelines used in this report are shown in Table 6
at the end of this section.
Median International Standards (MIS) for Trace Elements
The Food and Agriculture Organization of the United Nations has published a survey of health protection
criteria used by member nations (Nauen 1983). These criteria vary somewhat in the tissues to be analyzed
or the level of protection desired, but may be compared qualitatively. Table 7 at the end of this section
summarizes these standards as an indication of what other countries have determined to be unsafe levels
of trace elements. Though the standards do not apply within the United States, they provide an indication of
what other nations consider to be an elevated concentration of trace elements in fish tissues. Even so, the
reader is reminded that most TSMP metal analyses are done in liver, rather than in edible portions. To
date, only mercury and selenium are routinely measured in edible portions in the TSMP. Measurements in
liver should not be compared to Median International Standards. A description of how the Median
International Standards were compiled is provided in Appendix T.
Elevated Data Levels
The "elevated data level" (EDL) was introduced in 1983 as an internal comparative measure which ranks a
given concentration of a particular substance with previous data from the TSMP. The EDL is calculated by
ranking all of the results for a given chemical from the highest concentration measured down to and
including those records where the chemical was not detected. From this, a cumulative distribution is
constructed and percentile rankings are calculated. For example, the 50th percentile corresponds to the
median or "middle" value rather than to the mean. With a large number of records, the median can be
approximately compared to the mean.
Starting in 1990, EDL calculations were modified to reflect the growing number of marine species analyzed
in the TSMP. In the past, EDL calculations for wet weight measures were grouped by similar tissue types,
such as filet or whole-body samples. In 1990, the EDL calculations were further split into freshwater and
marine fish types. Now when any sample is compared to an EDL, it is compared to the EDL calculated
from the same fish and tissue types (i.e. freshwater fish filets are compared only to other freshwater fish
filets, etc.). The substance most affected by the change in the EDL calculations was arsenic. The EDL
criteria for arsenic in freshwater fish livers and whole samples were lowered by approximately half from
1978-1989 calculations. A separate copper EDL is calculated for salmonid liver tissue because trout are
known to accumulate copper to higher levels than other species. White bass also seem to accumulate
copper and other trace elements to higher levels. Starting in 1988, white bass are not included in the EDL

13
calculations. White bass are found only in a few locations in California and further sampling of this species
will be avoided whenever possible. In calculating the EDLs for lipid weight measures of organic chemicals,
all tissue types are combined because lipid weight measures in different tissue types tend to be far more
similar than wet weight measures (Phillips 1980). However, like wet weight measures, EDL lipid weight
calculations were also split into freshwater and marine fish types. The 1978-1991 EDLs and the number of
data points used to calculate each EDL are provided in Tables 8 through 16 at the end of this section.
The 85th percentile (EDL 85) was chosen as an indication that a chemical is elevated from the median. The
85th percentile corresponds to measures used by the U.S. Fish and Wildlife Service in their National
Contaminant Biomonitoring Program and would represent approximately one and one-half standard
deviations from the mean, if the data were normally distributed. The 95th percentile (EDL 95) was chosen to
indicate values that are highly elevated above the median. The 95th percentile would represent two
standard deviations from the mean, if the data were normally distributed. When used along with other
information, these measures provide a useful guideline to determine if a chemical has been found in
unusually high concentrations. A more detailed description of EDL rankings is provided in Appendix U. The
reader is again cautioned that EDLs are not directly related to potentially adverse human or animal health
effects; they are only a way to compare findings in a particular area with the larger data base of findings
from all over the state.

14
TABLE 5
Toxic Substances Monitoring Program
Maximum Tissue Residue Levels (MTRLs) for Carcinogens in Inland Surface Waters
_____________________________________________________________________________________________
Water Quality Objective a BCF
b MTRL
c
Substance (µg/l) (l/kg) (µg/kg, ppb)
_____________________________________________________________________________________________
aldrin 0.00013 d 0.05
arsenic 5.0 e 44 200.0 (0.2 ppm)
chlordane (total) 0.00008 14100 1.1
DDT (total) 0.00059 53600 32.0
dieldrin 0.00014 4670 0.65
heptachlor 0.00016 11200 1.8
heptachlor epoxide 0.00007 11200 0.8
hexachlorobenzene (HCB) 0.00066 8690 6.0
hexachlorocyclohexane (HCH), alpha 0.0039 130 0.5
hexachlorocyclohexane (HCH), beta 0.014 130 1.8
hexachlorocyclohexane (HCH), gamma 0.019 130 2.5
PAHs (total) 0.0028 30 0.08
PCBs (total) 0.00007 31200 2.2
pentachlorophenol (PCP) 0.28 11 3.1
toxaphene 0.00067 13100 8.8
_____________________________________________________________________________________________
Maximum Tissue Residue Levels (MTRLs) for Non-carcinogens in Inland Surface Waters
_____________________________________________________________________________________________
Water Quality Objective a BCF
b MTRL
c
Substance (µg/l) (l/kg) (µg/kg, ppb)
_____________________________________________________________________________________________
cadmium 0.01 64 0.64
endosulfan (total) 0.0009 270 0.25 (250 ppb)
endrin 0.0008 3970 3.0 (3,000 ppb)
mercury 0.000012 f 1.0
nickel 0.6 47 28.0
_____________________________________________________________________________________________
a. From Table 2, Human Health Water Quality Objectives, "California Inland Surface Waters Plan"
(SWRCB 1992). MTRLs were not developed for objectives based on maximum contaminant levels (MCLs) or
taste and odor criteria.
b. Bioconcentration Factors taken from the USEPA 1980 Ambient Water Quality Criteria Documents for each
substance.
c. MTRLs were calculated by multiplying the Water Quality Objective by the BCF, except for aldrin, arsenic, and
mercury.
d. Aldrin MTRL is derived from a combination of aldrin and dieldrin risk factors and BCFs as recommended in the
USEPA 1980 "Ambient Water Quality Criteria for Aldrin/Dieldrin" (USEPA 1980).
e. Arsenic MTRL was calculated from the formula NSRL ÷ (WI/BCF) + FC = MTRL. [NSRL (California's No
Significant Risk Level for arsenic) = 10 µg/d, WI (Water Intake) = 2 l/d, FC (daily fish consumption) = 0.0065
kg/d].
f. The MTRL for mercury is the FDA action level. The water quality objective for mercury in the Inland Surface
Waters Plan is based on the FDA action level as recommended in the USEPA 1985 "Ambient Water Quality
Criteria for Mercury" (USEPA 1985).

15
TABLE 6
NAS Guidelines and FDA Action Levels for Toxic Chemicals in Fish
(wet weight)
_____________________________________________________________________________________________
NASa FDA
b
Recommended Guideline Action Level for
for Freshwater Fish Freshwater and Marine Fish
(Whole Fish) (Edible Portion)
Chemical ug/g (ppm) ng/g (ppb) ug/g (ppm) ng/g (ppb)
_____________________________________________________________________________________________
Mercury 0.5 500 1.0d 1,000
DDT (total) 1.0 1,000 5.0 5,000
PCB (total) 0.5 500 2.0e 2,000
aldrin 0.1c 100 0.3 300
dieldrin 0.1c 100 0.3 300
endrin 0.1c 100 0.3 300
heptachlor 0.1c 100 0.3 300
heptachlor epoxide 0.1c 100 0.3 300
chlordane (total) 0.1c 100 0.3 300
lindane 0.1 100 - -
hexachlorocyclo-
hexane (total) 0.1c 100 - -
endosulfan (total) 0.1c 100 - -
toxaphene 0.1c 100 5.0 5,000
_____________________________________________________________________________________________
a National Academy of Sciences-National Academy of Engineering. 1973. Water Quality Criteria, 1972
(Blue Book). U.S. Environmental Protection Agency, Ecological Research Series.
b U. S. Food and Drug Administration. 1984. Shellfish Sanitation Interpretation: Action Levels for
Chemical and Poisonous Substances, June 21, 1984. U.S.F.D.A., Shellfish Sanitation Branch,
Washington, D.C.
c Individually or in combination. Chemicals in this group under NAS Guidelines are referred to as
Chemical Group A in this report.
d As methyl mercury.
e A tolerance, rather than an action level, has been established for PCBs (21CFR 109, published May
29, 1984). An action level is revoked when a regulation establishes a tolerance for the same
substance and use.

16
TABLE 7
Median International Standards for Trace Elements
in Freshwater Fish and Marine Shellfish a
(edible portion, ppm, wet weight)
_____________________________________________________________________________________________
Number of Countries
Element Fish Shellfish Range with Standards
_____________________________________________________________________________________________
Antimony 1.0 1.0 1.0 to 1.5 3
Arsenic 1.5 1.4 0.1 to 5.0 11
Cadmium 0.3 1.0 0.05 to 2.0 10
Chromium 1.0 1.0 1.0 1
Copper 20.0 20.0 10 to 100 8
Fluoride 150.0 - 150.0 1
Fluorine 17.5 - 10 to 25 2
Lead 2.0 2.0 0.5 to 10.0 19
Mercury 0.5 0.5 0.1 to 1.0 28
Selenium 2.0 0.3 0.3 to 2.0 3
Tin 150.0 190.0 50 to 250 8
Zinc 45.0 70.0 40 to 100 6
_____________________________________________________________________________________________
a Based on: Nauen, C. C., Compilation of Legal Limits for Hazardous Substances in Fish and Fishery
Products, Food and Agriculture Organization of the United Nations, 1983.
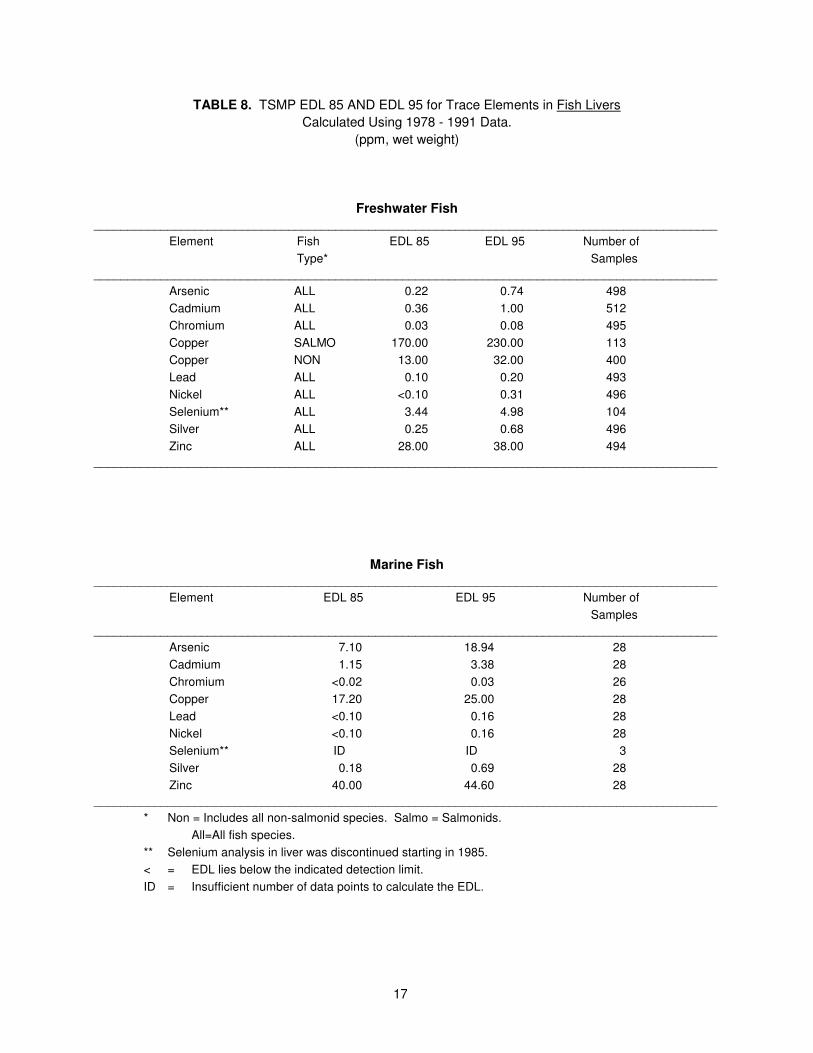
17
TABLE 8. TSMP EDL 85 AND EDL 95 for Trace Elements in Fish Livers
Calculated Using 1978 - 1991 Data.
(ppm, wet weight)
Freshwater Fish _____________________________________________________________________________________________
Element Fish EDL 85 EDL 95 Number of
Type* Samples
_____________________________________________________________________________________________
Arsenic ALL 0.22 0.74 498
Cadmium ALL 0.36 1.00 512
Chromium ALL 0.03 0.08 495
Copper SALMO 170.00 230.00 113
Copper NON 13.00 32.00 400
Lead ALL 0.10 0.20 493
Nickel ALL <0.10 0.31 496
Selenium** ALL 3.44 4.98 104
Silver ALL 0.25 0.68 496
Zinc ALL 28.00 38.00 494
_____________________________________________________________________________________________
Marine Fish _____________________________________________________________________________________________
Element EDL 85 EDL 95 Number of
Samples
_____________________________________________________________________________________________
Arsenic 7.10 18.94 28
Cadmium 1.15 3.38 28
Chromium <0.02 0.03 26
Copper 17.20 25.00 28
Lead <0.10 0.16 28
Nickel <0.10 0.16 28
Selenium** ID ID 3
Silver 0.18 0.69 28
Zinc 40.00 44.60 28
_____________________________________________________________________________________________
* Non = Includes all non-salmonid species. Salmo = Salmonids.
All=All fish species.
** Selenium analysis in liver was discontinued starting in 1985.
< = EDL lies below the indicated detection limit.
ID = Insufficient number of data points to calculate the EDL.

18
TABLE 9. TSMP EDL 85 AND EDL 95 for Trace Elements in Whole Fish
Calculated Using 1978 - 1991 Data.
(ppm, wet weight)
Freshwater Fish _____________________________________________________________________________________________
Element EDL 85 EDL 95 Number of
Samples
_____________________________________________________________________________________________
Arsenic 0.48 0.85 93
Cadmium 0.08 0.15 93
Chromium 0.19 0.34 93
Copper 3.41 4.14 93
Lead 0.20 0.77 93
Mercury 0.08 0.15 94
Nickel 0.20 0.46 94
Selenium 1.50 2.06 114
Silver 0.03 0.04 93
Zinc 40.00 44.35 93
_____________________________________________________________________________________________
Marine Fish _____________________________________________________________________________________________
Element EDL 85 EDL 95 Number of
Samples
_____________________________________________________________________________________________
Arsenic ID ID 2
Cadmium ID ID 2
Chromium ID ID 2
Copper ID ID 4
Lead ID ID 2
Mercury ID ID 4
Nickel ID ID 2
Selenium ID ID 2
Silver ID ID 2
Zinc ID ID 2
_____________________________________________________________________________________________
ID = Insufficient number of data points to calculate the EDL.

19
TABLE 10. TSMP EDL 85 AND EDL 95 for Trace Elements in Fish Filets
Calculated Using 1978 - 1991 Data.
(ppm, wet weight)
Freshwater Fish _____________________________________________________________________________________________
Element EDL 85 EDL 95 Number of
Samples
_____________________________________________________________________________________________
Arsenic 0.10 0.20 30
Cadmium <0.01 0.01 16
Chromium <0.02 <0.02 16
Copper 0.70 0.81 16
Lead <0.10 <0.10 16
Mercury 0.83 1.80 1070
Nickel <0.10 <0.10 16
Selenium 1.10 2.00 384
Silver <0.02 <0.02 16
Zinc 23.40 32.80 16
_____________________________________________________________________________________________
Marine Fish _____________________________________________________________________________________________
Element EDL 85 EDL 95 Number of
Samples
_____________________________________________________________________________________________
Arsenic ID ID 2
Cadmium ID ID 1
Chromium ID ID 1
Copper ID ID 1
Lead ID ID 1
Mercury 0.17 0.68 28
Nickel ID ID 1
Selenium 3.64 3.96 44
Silver ID ID 1
Zinc ID ID 1
_____________________________________________________________________________________________
< = EDL lies below the indicated detection limit.
ID = Insufficient number of data points to calculate the EDL.
20
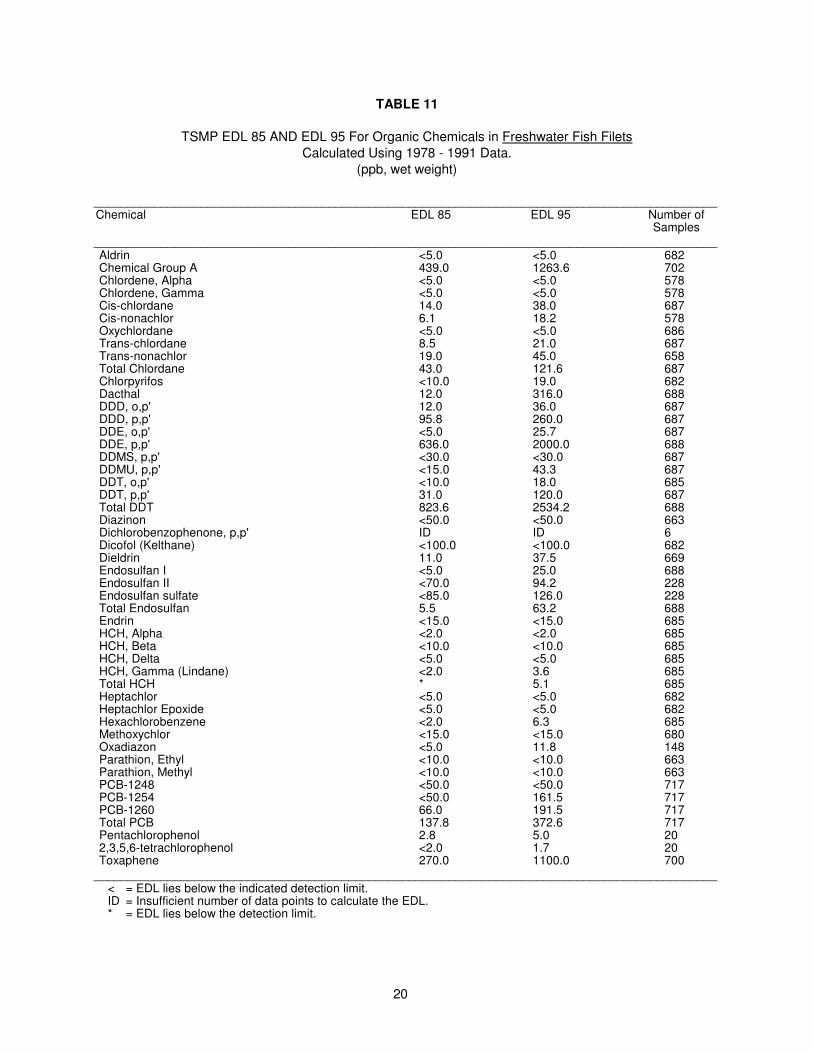
TABLE 11
TSMP EDL 85 AND EDL 95 For Organic Chemicals in Freshwater Fish Filets
Calculated Using 1978 - 1991 Data.
(ppb, wet weight)
_____________________________________________________________________________________________ Chemical EDL 85 EDL 95 Number of Samples
_____________________________________________________________________________________________ Aldrin <5.0 <5.0 682 Chemical Group A 439.0 1263.6 702 Chlordene, Alpha <5.0 <5.0 578 Chlordene, Gamma <5.0 <5.0 578 Cis-chlordane 14.0 38.0 687 Cis-nonachlor 6.1 18.2 578 Oxychlordane <5.0 <5.0 686 Trans-chlordane 8.5 21.0 687 Trans-nonachlor 19.0 45.0 658 Total Chlordane 43.0 121.6 687 Chlorpyrifos <10.0 19.0 682 Dacthal 12.0 316.0 688 DDD, o,p' 12.0 36.0 687 DDD, p,p' 95.8 260.0 687 DDE, o,p' <5.0 25.7 687 DDE, p,p' 636.0 2000.0 688 DDMS, p,p' <30.0 <30.0 687 DDMU, p,p' <15.0 43.3 687 DDT, o,p' <10.0 18.0 685 DDT, p,p' 31.0 120.0 687 Total DDT 823.6 2534.2 688 Diazinon <50.0 <50.0 663 Dichlorobenzophenone, p,p' ID ID 6 Dicofol (Kelthane) <100.0 <100.0 682 Dieldrin 11.0 37.5 669 Endosulfan I <5.0 25.0 688 Endosulfan II <70.0 94.2 228 Endosulfan sulfate <85.0 126.0 228 Total Endosulfan 5.5 63.2 688 Endrin <15.0 <15.0 685 HCH, Alpha <2.0 <2.0 685 HCH, Beta <10.0 <10.0 685 HCH, Delta <5.0 <5.0 685 HCH, Gamma (Lindane) <2.0 3.6 685 Total HCH * 5.1 685 Heptachlor <5.0 <5.0 682 Heptachlor Epoxide <5.0 <5.0 682 Hexachlorobenzene <2.0 6.3 685 Methoxychlor <15.0 <15.0 680 Oxadiazon <5.0 11.8 148 Parathion, Ethyl <10.0 <10.0 663 Parathion, Methyl <10.0 <10.0 663 PCB-1248 <50.0 <50.0 717 PCB-1254 <50.0 161.5 717 PCB-1260 66.0 191.5 717 Total PCB 137.8 372.6 717 Pentachlorophenol 2.8 5.0 20 2,3,5,6-tetrachlorophenol <2.0 1.7 20 Toxaphene 270.0 1100.0 700
_____________________________________________________________________________________________ < = EDL lies below the indicated detection limit. ID = Insufficient number of data points to calculate the EDL. * = EDL lies below the detection limit.

21
TABLE 12
TSMP EDL 85 AND EDL 95 For Organic Chemicals in Marine Fish Filets
Calculated Using 1978 - 1991 Data.
(ppb, wet weight)
_____________________________________________________________________________________________ Chemical EDL 85 EDL 95 Number of Samples
_____________________________________________________________________________________________ Aldrin <5.0 <5.0 33 Chemical Group A 7.6 36.8 33 Chlordene, Alpha <5.0 <5.0 32 Chlordene, Gamma <5.0 <5.0 32 Cis-chlordane <5.0 <5.0 33 Cis-nonachlor <5.0 8.5 32 Oxychlordane <5.0 <5.0 33 Trans-chlordane <5.0 <5.0 33 Trans-nonachlor <5.0 13.1 33 Total Chlordane * 23.4 33 Chlorpyrifos <10.0 <10.0 33 Dacthal 21.4 30.7 33 DDD, o,p' <10.0 <10.0 33 DDD, p,p' 16.0 20.1 33 DDE, o,p' <10.0 <10.0 33 DDE, p,p' 222.0 288.0 33 DDMS, p,p' <30.0 <30.0 33 DDMU, p,p' <15.0 <15.0 33 DDT, o,p' <10.0 <10.0 33 DDT, p,p' <10.0 <10.0 33 Total DDT 236.8 308.9 33 Diazinon <50.0 <50.0 33 Dichlorobenzophenone, p,p' ID ID 0 Dicofol (Kelthane) <100.0 <100.0 33 Dieldrin <5.0 <5.0 33 Endosulfan I <5.0 <5.0 33 Endosulfan II <70.0 <70.0 20 Endosulfan sulfate <85.0 <85.0 20 Total Endosulfan * * 33 Endrin <15.0 <15.0 33 HCH, Alpha <2.0 <2.0 33 HCH, Beta <10.0 <10.0 33 HCH, Delta <5.0 <5.0 33 HCH, Gamma (Lindane) <2.0 <2.0 33 Total HCH * * 33 Heptachlor <5.0 <5.0 33 Heptachlor Epoxide <5.0 <5.0 33 Hexachlorobenzene <2.0 <2.0 33 Methoxychlor <15.0 <15.0 33 Oxadiazon <5.0 <5.0 16 Parathion, Ethyl <10.0 <10.0 33 Parathion, Methyl <10.0 <10.0 33 PCB-1248 <50.0 <50.0 33 PCB-1254 <50.0 141.0 33 PCB-1260 59.8 127.0 33 Total PCB 96.2 266.6 33 Pentachlorophenol ID ID 0 2,3,5,6-tetrachlorophenol ID ID 0 Toxaphene <100.0 <100.0 33
_____________________________________________________________________________________________ < = EDL lies below the indicated detection limit. ID = Insufficient number of data points to calculate the EDL. * = EDL lies below the detection limit.
22
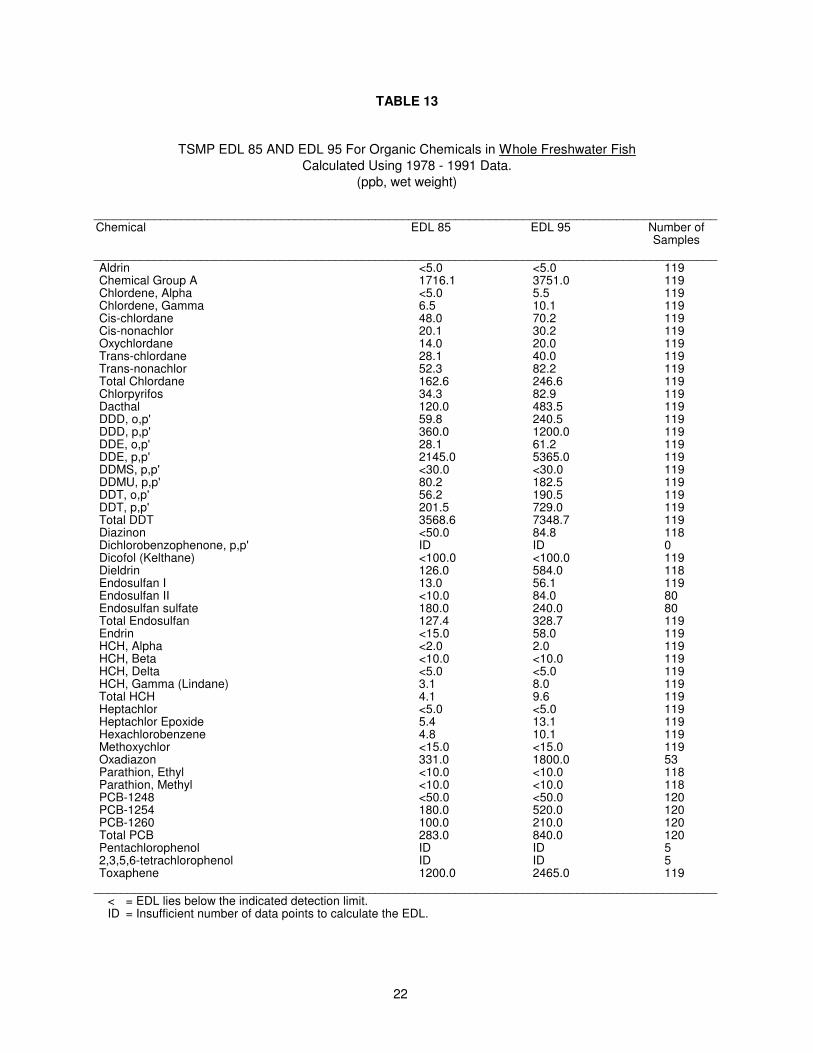
TABLE 13
TSMP EDL 85 AND EDL 95 For Organic Chemicals in Whole Freshwater Fish
Calculated Using 1978 - 1991 Data.
(ppb, wet weight)
_____________________________________________________________________________________________ Chemical EDL 85 EDL 95 Number of Samples
_____________________________________________________________________________________________ Aldrin <5.0 <5.0 119 Chemical Group A 1716.1 3751.0 119 Chlordene, Alpha <5.0 5.5 119 Chlordene, Gamma 6.5 10.1 119 Cis-chlordane 48.0 70.2 119 Cis-nonachlor 20.1 30.2 119 Oxychlordane 14.0 20.0 119 Trans-chlordane 28.1 40.0 119 Trans-nonachlor 52.3 82.2 119 Total Chlordane 162.6 246.6 119 Chlorpyrifos 34.3 82.9 119 Dacthal 120.0 483.5 119 DDD, o,p' 59.8 240.5 119 DDD, p,p' 360.0 1200.0 119 DDE, o,p' 28.1 61.2 119 DDE, p,p' 2145.0 5365.0 119 DDMS, p,p' <30.0 <30.0 119 DDMU, p,p' 80.2 182.5 119 DDT, o,p' 56.2 190.5 119 DDT, p,p' 201.5 729.0 119 Total DDT 3568.6 7348.7 119 Diazinon <50.0 84.8 118 Dichlorobenzophenone, p,p' ID ID 0 Dicofol (Kelthane) <100.0 <100.0 119 Dieldrin 126.0 584.0 118 Endosulfan I 13.0 56.1 119 Endosulfan II <10.0 84.0 80 Endosulfan sulfate 180.0 240.0 80 Total Endosulfan 127.4 328.7 119 Endrin <15.0 58.0 119 HCH, Alpha <2.0 2.0 119 HCH, Beta <10.0 <10.0 119 HCH, Delta <5.0 <5.0 119 HCH, Gamma (Lindane) 3.1 8.0 119 Total HCH 4.1 9.6 119 Heptachlor <5.0 <5.0 119 Heptachlor Epoxide 5.4 13.1 119 Hexachlorobenzene 4.8 10.1 119 Methoxychlor <15.0 <15.0 119 Oxadiazon 331.0 1800.0 53 Parathion, Ethyl <10.0 <10.0 118 Parathion, Methyl <10.0 <10.0 118 PCB-1248 <50.0 <50.0 120 PCB-1254 180.0 520.0 120 PCB-1260 100.0 210.0 120 Total PCB 283.0 840.0 120 Pentachlorophenol ID ID 5 2,3,5,6-tetrachlorophenol ID ID 5 Toxaphene 1200.0 2465.0 119
_____________________________________________________________________________________________ < = EDL lies below the indicated detection limit. ID = Insufficient number of data points to calculate the EDL.

23
TABLE 14
TSMP EDL 85 AND EDL 95 For Organic Chemicals in Whole Marine Fish
Calculated Using 1978 - 1991 Data.
(ppb, wet weight)
_____________________________________________________________________________________________ Chemical EDL 85 EDL 95 Number of Samples
_____________________________________________________________________________________________ Aldrin ID ID 1 Chemical Group A ID ID 1 Chlordene, Alpha ID ID 1 Chlordene, Gamma ID ID 1 Cis-chlordane ID ID 1 Cis-nonachlor ID ID 1 Oxychlordane ID ID 1 Trans-chlordane ID ID 1 Trans-nonachlor ID ID 1 Total Chlordane ID ID 1 Chlorpyrifos ID ID 1 Dacthal ID ID 1 DDD, o,p' ID ID 1 DDD, p,p' ID ID 1 DDE, o,p' ID ID 1 DDE, p,p' ID ID 1 DDMS, p,p' ID ID 1 DDMU, p,p' ID ID 1 DDT, o,p' ID ID 1 DDT, p,p' ID ID 1 Total DDT ID ID 1 Diazinon ID ID 1 Dichlorobenzophenone, p,p' ID ID 0 Dicofol (Kelthane) ID ID 1 Dieldrin ID ID 1 Endosulfan I ID ID 1 Endosulfan II ID ID 1 Endosulfan sulfate ID ID 1 Total Endosulfan ID ID 1 Endrin ID ID 1 HCH, Alpha ID ID 1 HCH, Beta ID ID 1 HCH, Delta ID ID 1 HCH, Gamma (Lindane) ID ID 1 Total HCH ID ID 1 Heptachlor ID ID 1 Heptachlor Epoxide ID ID 1 Hexachlorobenzene ID ID 1 Methoxychlor ID ID 1 Oxadiazon ID ID 0 Parathion, Ethyl ID ID 1 Parathion, Methyl ID ID 1 PCB-1248 ID ID 1 PCB-1254 ID ID 1 PCB-1260 ID ID 1 Total PCB ID ID 1 Pentachlorophenol ID ID 0 2,3,5,6-tetrachlorophenol ID ID 0 Toxaphene ID ID 1
_____________________________________________________________________________________________ ID = Insufficient number of data points to calculate the EDL.
24
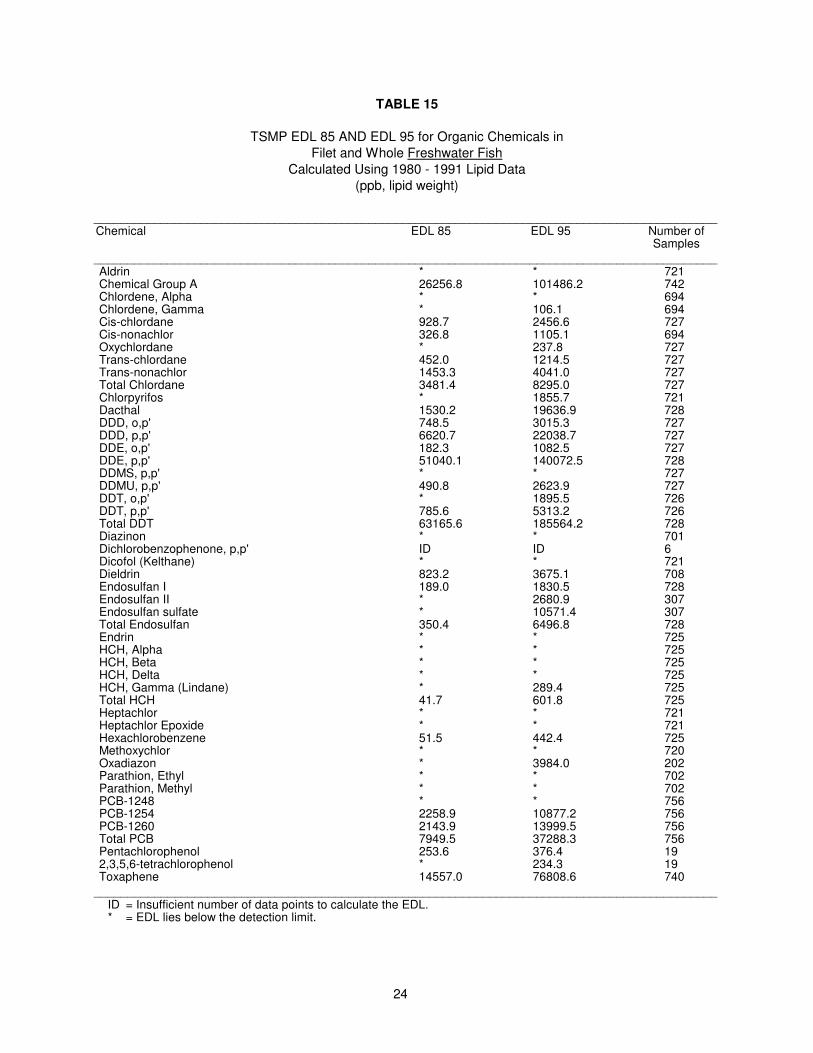
TABLE 15
TSMP EDL 85 AND EDL 95 for Organic Chemicals in
Filet and Whole Freshwater Fish
Calculated Using 1980 - 1991 Lipid Data
(ppb, lipid weight)
_____________________________________________________________________________________________ Chemical EDL 85 EDL 95 Number of Samples
_____________________________________________________________________________________________ Aldrin * * 721 Chemical Group A 26256.8 101486.2 742 Chlordene, Alpha * * 694 Chlordene, Gamma * 106.1 694 Cis-chlordane 928.7 2456.6 727 Cis-nonachlor 326.8 1105.1 694 Oxychlordane * 237.8 727 Trans-chlordane 452.0 1214.5 727 Trans-nonachlor 1453.3 4041.0 727 Total Chlordane 3481.4 8295.0 727 Chlorpyrifos * 1855.7 721 Dacthal 1530.2 19636.9 728 DDD, o,p' 748.5 3015.3 727 DDD, p,p' 6620.7 22038.7 727 DDE, o,p' 182.3 1082.5 727 DDE, p,p' 51040.1 140072.5 728 DDMS, p,p' * * 727 DDMU, p,p' 490.8 2623.9 727 DDT, o,p' * 1895.5 726 DDT, p,p' 785.6 5313.2 726 Total DDT 63165.6 185564.2 728 Diazinon * * 701 Dichlorobenzophenone, p,p' ID ID 6 Dicofol (Kelthane) * * 721 Dieldrin 823.2 3675.1 708 Endosulfan I 189.0 1830.5 728 Endosulfan II * 2680.9 307 Endosulfan sulfate * 10571.4 307 Total Endosulfan 350.4 6496.8 728 Endrin * * 725 HCH, Alpha * * 725 HCH, Beta * * 725 HCH, Delta * * 725 HCH, Gamma (Lindane) * 289.4 725 Total HCH 41.7 601.8 725 Heptachlor * * 721 Heptachlor Epoxide * * 721 Hexachlorobenzene 51.5 442.4 725 Methoxychlor * * 720 Oxadiazon * 3984.0 202 Parathion, Ethyl * * 702 Parathion, Methyl * * 702 PCB-1248 * * 756 PCB-1254 2258.9 10877.2 756 PCB-1260 2143.9 13999.5 756 Total PCB 7949.5 37288.3 756 Pentachlorophenol 253.6 376.4 19 2,3,5,6-tetrachlorophenol * 234.3 19 Toxaphene 14557.0 76808.6 740
_____________________________________________________________________________________________ ID = Insufficient number of data points to calculate the EDL. * = EDL lies below the detection limit.

25
TABLE 16
TSMP EDL 85 AND EDL 95 for Organic Chemicals in
Filet and Whole Marine Fish
Calculated Using 1980 - 1991 Lipid Data
(ppb, lipid weight)
_____________________________________________________________________________________________ Chemical EDL 85 EDL 95 Number of Samples
_____________________________________________________________________________________________ Aldrin * * 34 Chemical Group A 537.4 1611.9 34 Chlordene, Alpha * * 33 Chlordene, Gamma * * 33 Cis-chlordane * 284.4 34 Cis-nonachlor * 317.3 33 Oxychlordane * * 34 Trans-chlordane * 182.8 34 Trans-nonachlor * 390.4 34 Total Chlordane * 1155.2 34 Chlorpyrifos * * 34 Dacthal 1761.7 2433.5 34 DDD, o,p' * * 34 DDD, p,p' 936.1 1841.7 34 DDE, o,p' * * 34 DDE, p,p' 28582.9 36517.9 34 DDMS, p,p' * * 34 DDMU, p,p' * 499.3 34 DDT, o,p' * * 34 DDT, p,p' * * 34 Total DDT 30431.6 36517.9 34 Diazinon * * 34 Dichlorobenzophenone, p,p' ID ID 0 Dicofol (Kelthane) * * 34 Dieldrin * * 34 Endosulfan I * * 34 Endosulfan II * * 21 Endosulfan sulfate * * 21 Total Endosulfan * * 34 Endrin * * 34 HCH, Alpha * * 34 HCH, Beta * * 34 HCH, Delta * * 34 HCH, Gamma (Lindane) * * 34 Total HCH * * 34 Heptachlor * * 34 Heptachlor Epoxide * * 34 Hexachlorobenzene * * 34 Methoxychlor * * 34 Oxadiazon * * 16 Parathion, Ethyl * * 34 Parathion, Methyl * * 34 PCB-1248 * * 34 PCB-1254 * 5274.3 34 PCB-1260 3753.0 20741.1 34 Total PCB 8519.5 26018.3 34 Pentachlorophenol ID ID 0 2,3,5,6-tetrachlorophenol ID ID 0 Toxaphene * * 34
_____________________________________________________________________________________________ ID = Insufficient number of data points to calculate the EDL. * = EDL lies below the detection limit.

26
LITERATURE CITED
Adrian, W.J. 1971. A New Wet Digestion Method for Biological Material Utilizing Pressure. Atom.
Absorption Newsletter 10 (4):96.
(DFG) Department of Fish and Game. 1990. Laboratory Quality Assurance Program Plan
(March 14, 1990). Environmental Services Division, California Department of Fish and Game.
Sacramento, California.
Evans, S.J., M.S. Johnson, and R.T. Leah. 1986. Determination of Mercury in Fish Tissue, a Rapid,
Automated Technique for Routine Analysis. School of Biology, University of Liverpool, U. K. In
Varian Pamphlet No. AA-60, May 1986. Walnut Creek, Calif.
(NAS) National Academy of Sciences-National Academy of Engineering. 1973. Water Quality Criteria
1972 (Blue Book). EPA Ecological Research Series. EPA-R3-73-033. U.S. Environmental
Protection Agency, Washington, D.C.
Nauen, C.E. 1983. Compilation of Legal Limits for Hazardous Substances in Fish and Fishery Products,
Circular No. 764. FIRI/C764, Food and Agricultural Organization of the United Nations.
Phillips, D.J.H. 1980. Quantitative Aquatic Biological Indicators. Applied Science Publishers Ltd, Ripple
Road, Barking, Essex, England. Pages 38-90.
Robins, C.R., R.M. Bailey, C.E. Bond, J.R. Brooker, E.A. Lachner, R.N. Lea, and W.B. Scott. 1991.
Common and Scientific Names of Fishes from the United States and Canada. American Fisheries
Society Special Publication 20, Bethesda, Maryland.
Stout, V.F. and F.L. Beezhold. 1981. Chlorinated hydrocarbon levels in fishes and shellfishes of the
northeastern Pacific Ocean including the Hawaiian Islands. Mar. Fish. Rev. 43:1:1-12.
(SWRCB) State Water Resources Control Board. 1992. Water Quality Control Plan for Inland Surface
Waters of California. November 1992. State Water Resources Control Board, California
Environmental Protection Agency, Sacramento, California.
(USEPA) U.S. Environmental Protection Agency. 1991. "Draft" Assessment and Control of
Bioconcentratable Contaminants in Surface Waters. March 1991. Office of Water, U.S. EPA,
Washington, D.C.
(USEPA) U.S. Environmental Protection Agency. 1985. Ambient Water Quality Criteria for Mercury.
EPA 440/5-84-026. U.S. EPA, Office of Water Regulations and Standards, Washington, D.C.
27
LITERATURE CITED (continued)
(USEPA) U.S. Environmental Protection Agency. 1980. Ambient Water Quality Criteria for
Aldrin/Dieldrin. EPA 440/5-80-019. U.S. EPA, Office of Water Regulations and Standards,
Washington, D.C.
(USFDA) U.S. Food and Drug Administration, Bureau of Foods. 1985. Action Levels for Poisonous or
Deleterious Substances in Human Food and Animal Feed. USFDA, Washington, D.C.
Uthe, J.F., H.C. Freeman, J.R. Johnson, and P. Michalik. 1974. Comparison of wet ashing and dry
ashing for the determination of arsenic in marine organisms, using methylated arsenals for
standards. Assoc. Official Analytical Chem., J., 57(6):1363-1365.


