TOURISM QUARTERLY PERFORMANCE REPORT 2nd EDITION: …
15
TOURISM QUARTERLY PERFORMANCE REPORT 2 nd EDITION: APRIL-JUNE 2020
Transcript of TOURISM QUARTERLY PERFORMANCE REPORT 2nd EDITION: …

TOURISM QUARTERLY PERFORMANCE REPORT
2nd EDITION: APRIL-JUNE 2020

TABLE OF CONTENTS
Contents INTRODUCTION ............................................................................................................................................................................................................................................3
SECTION ONE: SUMMARY ANALYSIS OF SOUTH AFRICA’S TRAVELLERS (ARRIVALS AND DEPARTURES) DURING APRIL-JUNE 2020 .........................................................3
SECTION 2: PERFORMANCE OF SOUTH AFRICA’S TOURISM RELATED INDUSTRIES ....................................................................................................................................5
2.1 ACCOMMODATION INDUSTRY .....................................................................................................................................................................................................5
2.2 FOOD AND BEVERAGE INDUSTRY ................................................................................................................................................................................................6
2.3 AIRLINE INDUSTRY: PASSENGERS MOVEMENT ...........................................................................................................................................................................6
3. TOURISM RELATED INDUSTRY EMPLOYMENT APRIL-JUNE 2020 COMPARED TO APRIL-JUNE 2019 ..................................................................................................7
SECTION 3: GLOBAL INTERNATIONAL TOURIST ARRIVALS BY REGION ........................................................................................................................................................9
SECTION 4: GLOBAL AIRLINE INDUSTRY PERFORMANCE ......................................................................................................................................................................... 10
AIR TRANSPORT PERFORMANCE INDICATORS APRIL-JUNE 2019 COMPARED TO APRIL-JUNE 2020 ................................................................................................... 10
REFERENCES .......................................................................................................................................................................................................................................... 11

3
INTRODUCTION
The quarterly performance report provides an analysis of tourist arrivals and tourism related industries for the period April-June 2020 compared to April-June 2019 at a national
and global level. The report also includes the impact of coronavirus (COVID-19) on the tourism sector for the period April-June 2020 based on secondary data sources. To limit
the spread of COVID-19 and to prepare the health care sector, the South African government announced a 21-day national lockdown starting from 27 March 2020 and the
country was still under lockdown during the period under review. The lockdown prevented movement of people entering and leaving South Africa during this period. The
lockdown restrictions that were in place during April, May and June 2020 still prevented arrival and departure of tourists in and out of country’s borders as well as domestic
travel for tourism purposes. However, exceptions were made for some South Africans and foreign travellers from other countries to return to their country of residence.
Furthermore, permission was given to people transporting specific cargo, and permitted retail goods to neighbouring countries, which included all goods imported via SA ports
of entry, for re-export to neighbouring countries. Statistics South Africa (Stats SA) has therefore published data on the number of arrivals, departures and transit travellers of
South African residents and foreign travellers during April to June 2020. This report provides an analysis of all travellers for April to June 2020 as well as the performance of key
related tourism industries.
_________________________________________________________________________________________________________________________________________
SECTION ONE: SUMMARY ANALYSIS OF SOUTH AFRICA’S TRAVELLERS
(ARRIVALS AND DEPARTURES) DURING APRIL-JUNE 2020
1.1 TOTAL TRAVELLERS: APRIL-JUNE 2020 COMPARED TO APRIL-JUNE 2019
1.1.1 TOTAL ARRIVALS AND DEPARTURES
Table 1 indicates that in April-June 2020 period there was a total of 443 251
travellers (arrivals, departures and transits) who passed through South African
ports of entry, which was a decline of -95,7% compared to 10 274 341 travellers
recorded in April-June 2019. Further analysis on the total travellers including South
African resident travellers and foreign arrivals is provided in Table 2 and 3
respectively.
Table 1: Total Arrivals and Departures: June 2020 compared to June 2019
Total Travellers
Apr-Jun 2020 Apr-Jun 2019 % Change
443 251 10 274 341 -95,7%
Source: Stats SA: Tourism and Migration report: April, May and June 2020
1.1.2 SOUTH AFRICAN RESIDENT TRAVELLERS
Table 2 shows that there was a total of 145 102 of South African resident travellers
(arrivals and departure) recorded in April-June 2020, which was a decrease of
-95, 1% (-2 832 542) compared to the April-June 2019. Further analysis indicated
that the number of South African arrivals and departures also declined by -94,9%
and -95,3% respectively during April-June 2020. There were no South Africans on
transit during April-June 2020 period, whilst 2 515 transit passengers were
recorded in April-June 2019.

4
Table 2: South Africa resident travellers: April-June 2020 compared to April-
June 2019 South Africa Residents
Apr-Jun 2020 Apr-Jun 2019 % Change
Arrivals 72 876 1 431 631 -94,9%
Departures 72 226 1 543 498 -95,3%
Transits 0 2 515 -100,0%
Total 145 102 2 977 644 -95,1%
Source: Stats SA: Tourism and Migration report: April, May and June 2020
The decline recorded in April-June 2020 was as a result of the COVID-19 lockdown
in South Africa, which prevented people from leaving and entering the country.
Table 3 indicates foreign travellers by arrivals, departures and transits for April-
June 2020 compared to April-June 2019. The total foreign travellers decreased by
-95,9%; from 7 296 697 in 2019 to 298 149 in 2020. Furthermore, analysis showed
that the number of foreign arrivals and departures declined by -96, 2% and -95,
4% respectively during April-June 2020. There were 146 transit foreign travellers
recorded during April- June 2020 period.
Table 3: Foreign travellers: April-June 2020 compared to April-June 2019 Foreign Travellers Apr-Jun 20 Apr-Jun 19 % Change
Arrivals 141 663 3 727 416 -96,2%
Departures 156 340 3 368 975 -95,4%
Transits 146 200 306 -99,9%
Total 298 149 7 296 697 -95,9%
Source: Stats SA: Tourism and Migration report: April, May and Jun 2020
1.1.3 FOREIGN ARRIVALS BY REGION AND MODE OF TRAVEL
Table 4 shows foreign arrivals by region and mode of transport for April-June 2020.
There was a total of 141 663 foreign arrivals recorded in April-June 2020 as already
indicated. There were more foreign arrivals from Africa, a total of 140 238 (99,0%
share) compared to 1 371 (1,0% share) of foreign arrivals from overseas during
April-June 2020. Most of the foreign arrivals from Africa travelled to South Africa
using road transport.
Table 4: Foreign travellers by region and mode of transport: April-June 2020
Region April Total Air Road Sea
Overseas 1 371 521 619 231
Europe 552 155 299 98
North America 62 21 38 3
Central and South America 249 231 12 6
Australasia 45 9 33 3
Middle East 3 2 1 0
Asia 460 103 236 121
Africa 140 238 194 140 032 12
Unspecified 54 35 19 0
Total 141 663 750 140 670 243
Source: Stats SA Tourism and Migration report, April, May and June 2020
5
SECTION 2: PERFORMANCE OF SOUTH AFRICA’S TOURISM RELATED
INDUSTRIES
IMPACT OF CORONAVIRUS (COVID-19) ON TOURISM RELATED INDUSTRIES
PERFORMANCE
On 11 March 2020, the World Health Organisation (WHO) declared the
coronavirus (COVID-19) outbreak a global pandemic (WHO, 2020). In order to limit
the spread of COVID-19, many countries had started to introduce lockdown
measures, which prevented people from leaving their countries. On 05 March
2020, the South African government announced the first case of COVID-19 in the
country. As a result of the increased levels of infection, the government
announced a 21-day lockdown starting from 27 March 2020. On 1st May 2020, the
South African government adopted the Risk Adjustment Strategy that aimed to
increase economic activity while putting measures in place to reduce the
transmission of the virus. As part of this approach, five (5) Coronavirus alert levels
were introduced, which indicated the different sectors that can operate under
these levels. In April 2020, the country was under lockdown level five that
prevented most industries from operating. On 1st May 2020, South Africa moved
to level 4 lockdown restrictions and on 01st June 2020, the country moved to level
3 lockdown restrictions. The results below for the tourism related industries
should be viewed within the context of South Africa’s COVID-19 lockdown
regulations for the different lockdown restriction levels.
2.1 ACCOMMODATION INDUSTRY
2.1.1 ACCOMMODATION INDUSTRY INCOME: APRIL-JUNE 2020 COMPARED
TO APR-JUNE 2019
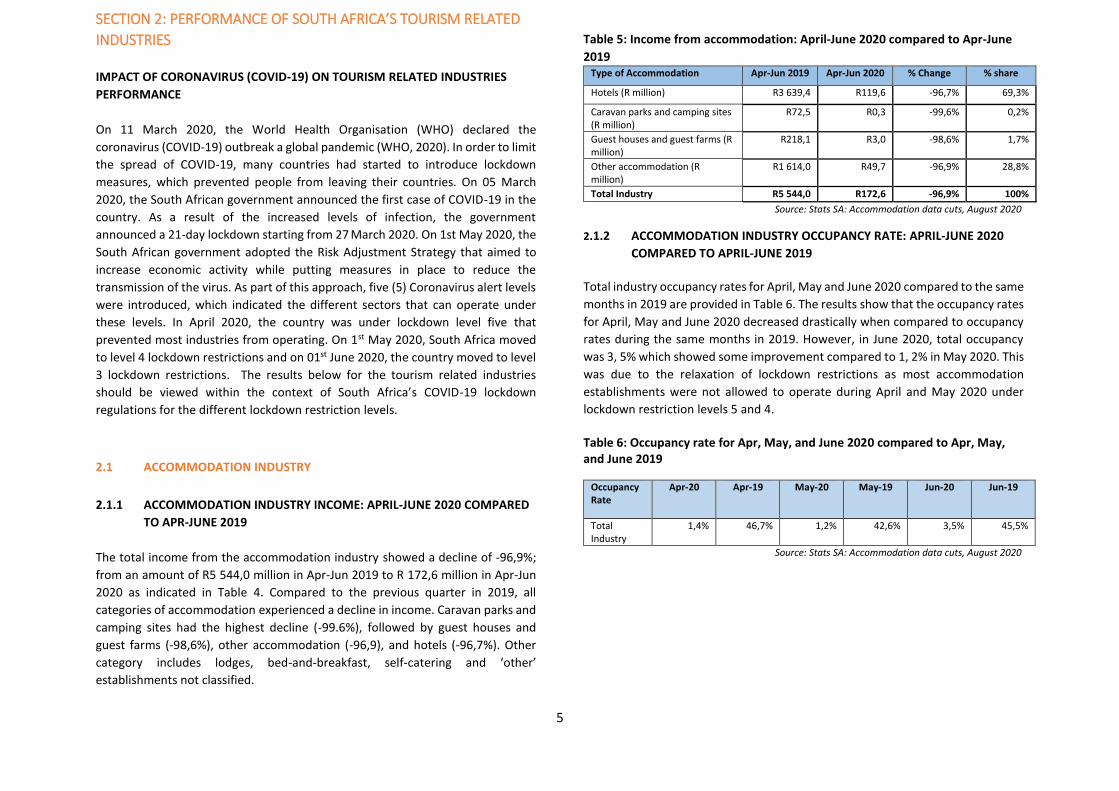
The total income from the accommodation industry showed a decline of -96,9%;
from an amount of R5 544,0 million in Apr-Jun 2019 to R 172,6 million in Apr-Jun
2020 as indicated in Table 4. Compared to the previous quarter in 2019, all
categories of accommodation experienced a decline in income. Caravan parks and
camping sites had the highest decline (-99.6%), followed by guest houses and
guest farms (-98,6%), other accommodation (-96,9), and hotels (-96,7%). Other
category includes lodges, bed-and-breakfast, self-catering and ‘other’
establishments not classified.
Table 5: Income from accommodation: April-June 2020 compared to Apr-June
2019 Type of Accommodation Apr-Jun 2019 Apr-Jun 2020 % Change % share
Hotels (R million) R3 639,4 R119,6 -96,7% 69,3%
Caravan parks and camping sites (R million)
R72,5 R0,3 -99,6% 0,2%
Guest houses and guest farms (R million)
R218,1 R3,0 -98,6% 1,7%
Other accommodation (R million)
R1 614,0 R49,7 -96,9% 28,8%
Total Industry R5 544,0 R172,6 -96,9% 100%
Source: Stats SA: Accommodation data cuts, August 2020
2.1.2 ACCOMMODATION INDUSTRY OCCUPANCY RATE: APRIL-JUNE 2020
COMPARED TO APRIL-JUNE 2019
Total industry occupancy rates for April, May and June 2020 compared to the same
months in 2019 are provided in Table 6. The results show that the occupancy rates
for April, May and June 2020 decreased drastically when compared to occupancy
rates during the same months in 2019. However, in June 2020, total occupancy
was 3, 5% which showed some improvement compared to 1, 2% in May 2020. This
was due to the relaxation of lockdown restrictions as most accommodation
establishments were not allowed to operate during April and May 2020 under
lockdown restriction levels 5 and 4.
Table 6: Occupancy rate for Apr, May, and June 2020 compared to Apr, May, and June 2019
Occupancy Rate
Apr-20 Apr-19 May-20 May-19 Jun-20 Jun-19
Total Industry
1,4% 46,7% 1,2% 42,6% 3,5% 45,5%
Source: Stats SA: Accommodation data cuts, August 2020

6
2.2 FOOD AND BEVERAGE INDUSTRY
FOOD AND BEVERAGES INDUSTRY INCOME: APRIL-JUNE 2020 COMPARED TO
APRIL-JUNE 2019
The results in Figure 1 below indicate that the total income of the food and
beverages industry was about R 2 974,9 million in Apr-Jun 2020, recording a
decrease of -78,0% when compared to income of about R 13 510,9 million during
Apr-June 2019. All categories of food and beverage industry had a decline with
restaurants and coffee shops having the highest decline (-90,0%), followed by
take-away and fast food outlets (-66,7%) as well as catering services with -61,2%
during the period under review. Figure 1: Total income by type of food and beverage industry: April-June 2020 compared to April-June 2019
Source: Stats SA: Food and Beverages data cuts, August 2020
Table 6 indicates the growth in total income for different food and beverages
categories. Comparing month on month performance, the results show that there
was a steep decline in income for all food and beverages categories during April to
June 2020 compared to the same period in 2019. The decline in the income
recorded by the food and beverage industry was due to COVID-19 lockdown
measures, which were implemented on 27 March 2020 whereby trade with all
food and beverage services were closed by the government to limit the spread of
COVID-19 as already indicated. However, the improvement is noted, month-on-
month, when food and beverages industry got opened gradually at different levels
under the revised regulations.
Table 7: Change in income by food and beverage type for Apr, May and June 2020 over 2019
Food and Beverages categories
Apr 2020vs Apr2019
May2020vs May 2019
Jun 2020vs Jun2019
Catering services -71,8% -60,0% -51,5%
Take-away and fast food outlets -100,0% -85,8% -15,4%
Restaurants and coffee shops -100,0% -97,7% -72,6%
Total -95,7% -87,8% -50,3%
Source: Stats SA: Food & Beverage data cuts August 2020
2.3 AIRLINE INDUSTRY: PASSENGERS MOVEMENT
2.3.1 PASSENGER ARRIVALS MOVEMENT: APRIL-JUNE 2020 COMPARED TO
APRIL-JUNE 2019
Table 8 indicates the total passenger arrivals in Airports Company South Africa
(ACSA) airports during April-June 2020 compared to April-June 2019. Total
passenger arrivals decreased by -98.9%; from 5 045 719 in April-June 2019 to
54 348 in April-June 2020. According to country’s Risk Adjustment Strategy, there
was also limited domestic air travel, with a restriction on the number of flights per
day and flight authorisation was based on the reason for travel and subject to the
ports of entry arrangements (South Africa government, 2020). The number of
domestic passengers arriving during April-June 2020 decreased by -98,9%; from 3
562 983 in April-June 2019 to 38 886 in April-June 2020. Unscheduled departures
recorded an increase of 8.3%. Annexure A provides a list of flights that arrived in
South Africa during April-June 2020 to repatriate South Africans who were in other
countries during this period.
Table 8: Arriving passengers to South Africa by region Apr-June 2020 compared to Apr-June 2020
Arriving Passengers
Apr-Jun 2019 Apr-Jun 2020 Difference % Change
International 1 333 469 890 -1 332 579 -99,93%
Regional 135 838 36 -135 802 -99,97%
Domestic 3 562 983 38 886 -3 524 097 -98,9%
Unscheduled 13 429 14 536 1 107 8,3%
Total 5 045 719 54 348 -4 991 371 -98,9%
Source: ACSA data, June 2020

7
2.3.2 PASSENGER DEPARTURE MOVEMENTS: APRIL-JUNE 2020 COMPARED
TO APRIL-JUNE 2019
Table 9 shows the total passengers departing from ACSA airports during the period
Apr-Jun 2020 compared to April-June 2019. Total passengers departing from the
country decreased by -98.6% in Apr-Jun 2020 compared to Apr-Jun 2019. Regional,
International and domestic passengers departing from different ACSA airports
recorded a decline in April-Jun 2020 compared to same period last year. For
passengers departing on international and regional flights, there was a decrease
of -99, 9% and 99,6% respectively during the period under review. Due to the
restrictions of inter provincial travel, departing domestic passengers declined by -
98,9%; from 3 581 435 during April-June 2019 to 39 586 in April-June 2020 period.
The number of passengers on unscheduled flights during this period increased by
146,4% and that could be due to the flights that had to be arranged by different
embassies in South Africa for travellers who were unable to leave South Africa
because of the lockdown restrictions that were introduced to curb the spread of
the corona virus.
Table 9: Departing passengers from South Africa by region: April-June 2020
compared to April-June 2020 Departing Passengers Apr-Jun 2019 Apr-Jun 2020 Difference % Change
International 1 446 831 1 495 -1 445 336 -99,9%
Regional 139 987 60 -139 927 -99,6%
Domestic 3 581 435 39 586 -3 541 849 -98,9%
Unscheduled 13 212 32 550 19 338 146,4%
Total 5 181 465 73 691 -5 107 774 -98,6%
Source: ACSA data, June 2020
3. TOURISM RELATED INDUSTRY EMPLOYMENT: APRIL-JUNE 2020 COMPARED
TO APRIL-JUNE 2019
3.1 EMPLOYMENT IN TOURISM RELATED INDUSTRIES: APRIL-JUNE 2020
COMPARED TO APRIL-JUNE 2019
Note: Previous quarterly performance reports provided estimates on the number of direct
jobs created by the tourism sector in South Africa by applying ratios to the different tourism
related industries. The ratios were sourced from the latest Tourism Satellite Account (TSA).
However, tourism trends have changed due to the impact of COVID-19 and therefore
tourism ratios form the TSA could not be applied on the latest employment data. This section
reports on the total number of jobs created by the tourism related industries even though
there were limited tourism activities during April-June 2020 period.
The information presented in this section uses Stats SA’s Quarterly Labour Force Survey
(QLFS) data cuts to provide employment for tourism related industries, which are identified
in the TSA. Table 10 indicates that during April-June 2020 about 18,1% of South African jobs
were from the tourism related industries, which was a decrease of -11,6% (-336 355) in total
jobs from the same industries when compared to the same period in 2019.
Table 10: Tourism related industries employment: April-June 2020 compared to April-June 2019
Employment Apr-Jun 2020 Apr-Jun 2019 Difference % Growth
Total Tourism Related
Industries Employment
2 560 500 2 896 855 -336 355 -11,6%
Total Employment 14 148 215 16 312 706 -2 164 490 -13,3%
Share of tourism related
industries to total
employment
18,1% 17,76%
Source: Stats SA, Q2 2020 Quarterly Labour Force Survey data cuts

8
Table 11: Tourism related industries share of employment: Apr-June 2020 compared to Apr- 2019
Tourism Related Industries Total
Employment: April-June 2020
Total Employment:
April-June 2019
% Change: April-June 2020
compared to April-June 2019
Accommodation 133 372 148 272 -10,0%
Food and Beverages 271 218 394 330 -31,2%
Railway passenger transport 73 047 72 907 0,2%
Road Passenger transport 582 168 639 948 -9,0%
Water passenger transport services 435 1 084 -59,8%
Air Passenger Transport 13 379 28 063 -52,3%
Transport Equipment Rental 14 873 14 918 -0,3%
Travel agencies 21 898 34 753 -37,0%
Cultural Services 61 950 83 548 -25,9%
Sporting and other recreation services 58 044 83 473 -30,5%
Retail trade 1 330 115 1 395 558 -4,7%
Total Tourism Related Industries Employment
2 560 500 2 896 855 -11,6%
Source: Stats SA, Q2 2020 Quarterly Labour Force Survey data cuts
Table 11 provides the total number of jobs by different tourism related industries for the period April-June 2020 compared to April-June 2019. All tourism related industries recorded
a decline in the number of jobs except for railway passenger transport industry, which had a flat growth rate of 0,2% during the period under review. As already indicated, South Africa was under lockdown in Quarter 2: 2020 (April, May and June 2020), and that prevented most of the tourism related industries from fully operating in order to prevent the spread of COVID-19. These figures might change in Quarter 3: 2020 (Jul-Sept 2020) as the sector anticipates improvement in employment figures since most of the lockdown regulations were relaxed as from July 2020 to boost the economic growth.

9
SECTION 3: GLOBAL INTERNATIONAL TOURIST ARRIVALS BY REGION
FIGURE 2: PERCENTAGE GROWTH OF GLOBAL TOURIST ARRIVALS BY REGION: APRIL-JUNE 2020 COMPARED TO APRIL-JUNE 2019
Source: UNWO TOURISM Barometer, Volume 18 • Issue 5 • August/September 2020
UNWTO has only released percentage growth of tourist arrivals by region for April-June 2020, which was compared to April-June 2019 figures. The absolute figures have not
yet been released by the UNWTO at the time of finalising this report. The tourism sector has been one of the most affected sectors by COVID-19 with most airlines being
grounded; hotels closed and travel restrictions implemented in most countries around the world (UNWTO, 2020). The effect of the pandemic can be seen in the tourist arrival
figures for the period April-June 2020 when compared to the same period in 2019. Total international tourist arrivals declined by -95.2% in April-June 2020 when compared
to the same period last year. Africa had the highest decline (-99.0%), followed by Asia and the Pacific (-98.6%), Europe and Middle East (-94,1% each) and Americas (-93,0%).

10
SECTION 4: GLOBAL AIRLINE INDUSTRY PERFORMANCE
AIR TRANSPORT PERFORMANCE INDICATORS APRIL-JUNE 2019 COMPARED TO APRIL-JUNE 2020
The global airline industry has also been negatively affected by the COVID-19. Table 9 below shows the airline industry performance for April, May and June 2020. Total
market revenue passenger kilometres (RPKs) decreased in April, May and June 2020 compared to the same months in 2019 and this was influenced by declines in both
international and domestic RPK. Comparing April-June 2020 data to same months last year, domestic RPKs for June 2020 declined by -67,6%, which was an improvement
when compared to -79,2% in May 2020 and -86,9% in April 2020. The improvement has been driven by domestic demand as more countries began to loosen travel restrictions
within their borders (IATA, 2020). Passenger load factors were at their lowest during April-June 2020 compared to the same months in 2019.
Table 9: Airline performance April, May and June 2020
Source: IATA, Air Passenger Market Analysis, June 2020

11
REFERENCES
1. Airports Company South Africa. March 2020 Data cuts. 2. IATA Air Passenger Market Analysis: JUNE 2020 3. IATA, Outlook 2020-2021, 2020 4. Statistics South Africa. APRIL-JUNE 2020. Accommodation data cuts 5. Statistics South Africa. APRIL-JUNE 2020. Food and Beverages data cuts.
6. Statistics South Africa. April, May and June 2020. Monthly Tourism and Migration report. 7. Statistics South Africa. Quarterly Labour Force Survey, September 2020.
8. Str Global Hotel data JUNE 2020 for South Africa and the Globe 9. UNWTO Tourism Barometer, May 2020 edition 10. WTTC, monthly impact report, 2020 11. DIRCO newsletter, 2020

12
Annexure A: List of Repatriated Flights from South Africa (April-June 2020)
8 April 2020
A SAA flight from São Paulo repatriated 66 South Africans from Brazil
A SAA flight from Frankfurt repatriated 54 South Africans from Germany
9 April 2020
A Turkish Air cargo flight repatriated two South Africans accompanying mortal remains of the deceased father
10 April 2020
A private charter repatriated four South Africans from Afghanistan
A private charter repatriated 49 South Africans from Namibia
11 April 2020
A SAA flight from Brussels to Johannesburg, with a stop-over in Lagos, repatriated 119 South
Africans
A private charter repatriated 41 South Africans from the Maldives
12 April 2020
A SAA flight from London to Cape Town repatriated 200 South Africans
A private charter repatriated four South Africans from Madagascar
13 April 2020
A SAA flight from Ghana repatriated 62 South Africans
14 April 2020
A private charter repatriated three South Africans from Zambia
15 April 2020
A SAA flight chartered by Workaways International in the United States of America repatriated 305 South African workers
16 April 2020
An Ethiopian Airlines cargo flight from Addis Ababa repatriated 13 South Africans
17 April 2020
A SAA flight from Frankfurt via Luanda repatriated 84 South Africans
18 April 2020
A SAA flight from Frankfurt via Rome repatriated 80 South Africans from Italy
A private charter repatriated six South African crew members from Haiti
19 April 2020
A SAA flight from Frankfurt repatriated 206 South Africans
A private charter flight repatriated 36 South Africans from Luanda, Angola
A private charter flight from Cameroon via Luanda, Angola, repatriated 29 South Africans
21 April 2020
A Saudi Air flight repatriated 93 South Africans from Saudi Arabia
A private charter repatriated 83 South Africans from Pakistan
23 April 2020
A SAA flight re-routed through Cairo, Egypt, repatriated 25 South Africans
A Saudi Air flight repatriated 60 South Africans

13
A special charter flight from the Democratic Republic of Congo (DRC) repatriated 11 South Africans
24 April 2020
A special charter flight repatriated 23 South Africans from Zambia
A special charter flight repatriated two South Africans from Zambia
25 April 2020
The last SAA flight from Frankfurt, chartered by the German Government, returned to South Africa with 160 people on board
An Emirates Air flight repatriated 165 South Africans on a special charter flight from Dubai
A special charter flight repatriated nine South Africans from Guinea Conakry
A special charter flight repatriated 23 South Africans from the Seychelles
28 April 2020
A Qantas Air flight, chartered by the Australian Government, repatriated 185 South Africans
29 April 2020
A charter flight from Tanzania repatriated 26 South Africans
A charter flight from Egypt repatriated 13 South Africans
A charter flight from the DRC repatriated 51 South Africans
30 April 2020
A Namibian Air Charter repatriated 23 South Africans
1 May 2020
A charter flight from Mali repatriated 19 South Africans
A Comair Charter flight from Harare repatriated 26 passengers
An Ethiopian Airlines charter repatriated 256 South Africans (Workways)
A private charter flight repatriated three South Africans from Madagascar
2 May 2020
A private charter flight repatriated 19 South Africans from Mali
3 May 2020
A SAA flight from Washington, USA, repatriated 275 South Africans
A flight from Ethiopia repatriated 27 South Africans
4 May 2020
A flight from Zambia repatriated 21 South Africans
7May 2020
A flight from Qatar repatriated 121 South Africans
8 May 2020
A flight from Jeddah repatriated 165 South Africans
A flight from Bangkok repatriated 235 South Africans
A flight from St Helena repatriated one South African patient
A flight from Guinea repatriated nine South Africans
A flight from Bali and Jakarta repatriated 134 South Africans
10 May 2020
A flight from Washington repatriated 236 passengers
A flight from Zambia repatriated 18 passengers

14
11 May 2020
A flight from Windhoek, Namibia, repatriated 18 South Africans
Another flight from Windhoek repatriated 26 South Africans
A flight from Zambia repatriated 21 South Africans
12 May 2020
A private charter from Beira repatriated three South Africans
A flight from Qatar repatriated 167 South Africans.
1 June 2020
A flight from Sierra Leone repatriated 71 South Africans
2 June 2020
A flight from Washington repatriated 163 South Africans
A flight from Qatar repatriated 149 South Africans
4 June 2020
A flight from Madagascar repatriated 81 South Africans
5 June 2020
A flight from Namibia repatriated 12 South Africans
A flight from Zambia repatriated 24 South Africans
6 June 2020
A flight from Ethiopia repatriated 37 South Africans
7 June 2020
A flight from Senegal repatriated six South Africans
A flight from Malawi repatriated 35 South Africans
A flight from Angola repatriated 51 South Africans
8 June 2020
A fight from the DRC repatriated 10 South Africans
9 June 2020
A flight from Zambia repatriated 18 South Africans
A flight from Spain repatriated 269 South Africans
10 June 2020
A flight from Australia repatriated 217 South Africans
A flight from the Democratic Republic of Congo (DRC) repatriated 26 South Africans
11 June 2020
A flight from Russia repatriated three South Africans, as well as seven Russian diplomatic staff family members
A flight from the USA repatriated 93 South Africans
A flight from Angola repatriated 38 South Africans
A flight from Pakistan repatriated 89 South Africans
12 June 2020

15
A flight from Tanzania repatriated 10 South Africans
A flight from Guinea repatriated 16 South Africans
A flight from the Netherlands and Zimbabwe repatriated 194 South Africans
A flight from the DRC repatriated two South Africans
A flight from Zimbabwe repatriated 44 South Africans
13 June 2020
A flight from Tanzania repatriated 10 South Africans
14 June 2020
A flight from the Netherlands repatriated 60 South Africans
A flight from Zimbabwe repatriated 100 South Africans
A flight from Germany and Russia repatriated 275 South Africans
A flight from Tanzania repatriated 10 South Africans
A flight repatriated seven South Africans from Ghana
A flight from Ethiopia repatriated 21 South Africans
15 June 2020
A flight from Ethiopia repatriated 25 South Africans
A flight from the Seychelles repatriated 24 South Africans
16 June 2020
A flight repatriated 50 South Africans from the Netherlands
A flight from Namibia repatriated 50 South Africans
A flight from Brazil repatriated 130 South Africans
17 June 2020
A flight from Namibia repatriated 31 South Africans
A flight from India repatriated 49 South Africans
A flight from Tanzania repatriated five South Africans
18 June 2020
A flight from the USA repatriated 44 South Africans
A flight from Namibia repatriated 47 South Africans
19 June 2020
A flight from Vietnam and Bangkok repatriated 105 South Africans
A flight from Dubai repatriated 249 South Africans. Source: http://www.dirco.gov.za/repatriation_newsletters/2020/repatriation-newsletter09_19-june-2020.pdf