TOTVS S.A. - DFP 2015_ENG.pdf · (A free translation of the original in Portuguese) 3 MANAGEMENT...
69
TOTVS S.A. Financial Statements December 31, 2015 and 2014
Transcript of TOTVS S.A. - DFP 2015_ENG.pdf · (A free translation of the original in Portuguese) 3 MANAGEMENT...

TOTVS S.A. Financial Statements
December 31, 2015 and 2014

(A free translation of the original in Portuguese)
2
Contents
Management report and comments on Company’s performance……………….………3
Independent auditor’s report……………………………………………………………………….…….10
Audited financial statements:
Balance sheets .............................................................................................. 12 Income statements………………………………………………………………………………….. 13 Statements of comprehensive income ......................................................... 14 Statements of changes in Shareholder’s Equity ........................................... 15 Cash flow statements .................................................................................... 16 Statements of value added ........................................................................... 17 Notes to financial statements ....................................................................... 18
Audit Committee Opinion ....................................................................................... 66

(A free translation of the original in Portuguese)
3
MANAGEMENT REPORT AND COMMENTS ON COMPANY’S PERFORMANCE
Dear Shareholders,
Pursuant to legal provisions, TOTVS S.A., the largest developer of application software, collaboration
and productivity platforms, hardware and consulting services in Brazil and Latin America, submits for the
appreciation of its shareholders the Management Report and corresponding Financial Statements,
accompanied by the independent auditor's opinion for the fiscal years ended December 31, 2015 and 2014,
prepared in accordance with the Brazilian accounting practices considering the provisions of OCPC 07
approved in 2014
MESSAGE FROM THE MANAGEMENT
In 2015, the transition from the licensing model to the software subscription model was the main driver
that contributed to the net revenue growth of TOTVS. In addition to the negative impacts on profitability,
which were already expected during the initial phase of this transition, the worsening economic scenario in
Brazil posed additional challenges for the Company, resulting in lower net income and operating cash flow in
the year.
The corporate reorganization involving Bematech in 2015 was another important step towards
strengthening TOTVS’ portfolio of business solutions and its transition to the subscription model. With
Bematech, TOTVS became the leading solutions provider for the retail segment in Brazil by combining
specialized solutions in management system, point of sale (POS), commercial automation, fiscal solutions, e-
commerce, mobility, means of payment solutions and collaboration platform.
As such, we will adopt a customer-centric approach, while continuing our transition towards the
subscription model and our specialization strategy in each segment, having the client as the central focus.
Despite the current adversities, we continue to believe in the potential of Brazil and in technological innovation
as an instrument to increase productivity and competitiveness of companies, especially small and medium
businesses.
ECONOMIC SCENARIO
Global economic growth in 2015 remained modest as in previous years. Growth of emerging economies
fell for the 5th consecutive year, mainly impacted by falling prices of oil and other commodities and by the
slowdown in China's growth, while developed economies recovered marginally. In Latin America, the weak
economic growth was led by Colombia and Peru.
As in 2014, the U.S. economy grew 2.4%. The Eurozone increased its growth rate this year, despite the
currency instability resulting from divergences between Greece and Germany.
In Brazil, the economic scenario deteriorated significantly and was one of the reasons for the country
being downgraded by the main global credit rating agencies. GDP fell 3.8% in the year, the steepest decline

(A free translation of the original in Portuguese)
4
since 1990, leading to an increase unemployment. Inflation, as measured by the IPCA index, closed the year
at 10.67%, the highest annual rate since 2002, mainly driven by the fuel, electricity, food and beverage
segments. The basic interest rate (Selic), which ended 2014 at 11.75%, reached 14.25% in December 2015,
while the U.S. dollar spiked 48% against the Brazilian real, the highest annual increase in the last 13 years.
The year was also marked by changes in the federal government’s economic team, with Nelson Barbosa
taking over as Finance Minister, replacing Joaquim Levy, and Valdir Simão taking over as Planning Minister. In
addition to economic instability, the country has been engulfed in a political crisis that culminated with the
Congress starting the process for impeachment of the Brazilian president.
Despite the negative impacts of the political and economic crises, Brazil still remains a land of numerous
business opportunities, a huge consumer market, and strong and independent institutions.
CONSOLIDATED OPERATING AND FINANCIAL PERFORMANCE
Due to the ownership restructuring between TOTVS and Bematech in 2015, in addition to the following
comments, the amounts related to fiscal year 2015 are impacted by the consolidation of Bematech’s results
in November and December.
In 2015, net revenue totaled R$1,908,737 thousand, an increase 7.7% over 2014. This growth is due to:
(i) the Company’s initiatives to capture the growth of the software market, which included segmenting its
business solutions by industry type, and the fluig platform; and (ii) the growth in recurring revenue from
subscriptions.
Net revenue from license fees fell 19.7% from 2014 to 2015, mainly reflecting the reduction in sales to
new and existing clients. This reduction is mainly due to the downturn in the Brazilian economy, which results
in a longer time for the conversion of the pipeline into sales, and the partial migration of the sales pipeline of
new clients to the subscription model.
Net revenue from services grew 8.4% in 2015, chiefly due to the growth in services not related to
software implementation, especially those related to consulting.
Net revenue from subscription grew 35.1% in the year to R$140,820 thousand. This growth was driven
by sales to small and medium clients, especially under the TOTVS Intera subscription model.
Net revenue from maintenance totaled R$918,556 thousand in 2015, an increase of 7.5% from 2014,
mainly driven by license sales and retention of maintenance agreements, which are annually adjusted based
on pre-defined inflation rates, in most cases the IGP-M index.
Net revenue from hardware totaled R$51,664 thousand in 2015 and included the sales of equipment
and technical support services by Bematech.

(A free translation of the original in Portuguese)
5
The 8.5% decline in software costs in 2015 primarily reflects the drop in sales mentioned above in the
comments on licensing fee revenue.
Cost of support increased 34.4% in the year, chiefly due to wage increases and the growth of
subscription sales in the period.
Cost of services increased 11.4% in the year to reach R$507,298 thousand. This growth, which was
higher than the growth in net revenue from services, was mainly the result of: (i) the lower allocation of
implementation professionals on account of the slower pace of software sales, especially of licenses; (ii)
additional costs with rationalization of the cost and expense structure during the second half of 2015; and (iii)
wage increases resulting from collective bargaining agreements entered into during the year, which were
higher than in 2014, on average, on account of higher inflation but which were not fully passed on to projects
for implementation of the software sold.
Cost of hardware, which include the sales of equipment and technical support services provided by
Bematech, totaled R$34,050 thousand. Note that hardware costs also include depreciation amounting to
R$583 thousand.
Research and development expenses increased 13.6% in 2015, due to (ii) additional costs with
rationalization of the cost and expense structure during the second half of 2015; and (ii) wage increases on
account of collective bargaining agreements during the year.
Advertising expenses increased by 18.9% in 2015, totaling R$49,281 thousand. This increase is mainly
due to the reduction in advertising and marketing expenses in 2014 on account of the Soccer World Cup in
Brazil.
Selling expenses totaled R$152,230 thousand in the year, up 15.6%, while commission expenses totaled
R$155,981 thousand, up 0.6%. The sum of these expenses as a percentage of total net revenue remained
unchanged. These expenses are directly related to the sales mix between own branches and franchises, and
to the net revenue mix, due to the different levels of commissions among the revenue lines.
General and administrative (G&A) expenses increased by 63.7% in 2015 to R$187,277 thousand. This
increase is chiefly due to the addition of R$59,022 thousand to the provision for legal contingencies made in
the fourth quarter of 2015. This change in the estimated provision for legal contingencies is due to the
continuous monitoring and risk control by TOTVS, which during 2015 entailed: (i) the substitution of the main
legal advisors conducting the civil and labor lawsuits to obtain greater consistency and efficiency in the way
proceedings are monitored and solved; (ii) the review of the quantification of expected losses related to the
proceedings; and (iii) the review of past outcomes of lawsuits and the circumstances surrounding the new
proceedings in which the Company is the defendant. It is important to note that this provision does not affect
cash immediately and, even with the provisions booked, TOTVS will continue to take all applicable measures
to defend its rights in the lawsuits in question.
Management fees decreased 9.9% between 2014 and 2015, and was mainly influenced by the the
provision for bonus for executives related to the achievement of financial and individual targets in the period.

(A free translation of the original in Portuguese)
6
Depreciation and amortization totaled R$103,077 thousand in 2015, compared to R$88,928 thousand
in 2014, increasing by 15.9%, mainly due to: (i) purchase price allocation of the acquisition price of Virtual Age
in 2Q15, when there was an extraordinary impact of R$5,458 million from the 12-month accumulated
amortization of their intangible assets; and (ii) the purchase price allocation of the corporate reorganization
with Bematech in 4Q15, which increased depreciation and amortization expenses in November and December
in the total amount of R$3,416 thousand.
Allowance for doubtful accounts totaled R$34,562 thousand in 2015, equivalent to 1.8% of net revenue,
versus 1.6% in 2014. This increase in the allowance is mainly due to higher default levels seen in the market
during the year.
Financial result (financial income net of financial expenses) was a positive R$26,526 thousand, resulting
in growth of 101.2% in 2015. This growth primarily reflects the increase in financial income resulting from
higher financial investments in the first nine months of 2015; and the addition of R$9,028 thousand to the
provision for premium due to non-conversion of debentures.
Income tax and social contribution decreased 38.6% in 2015, totaling R$59,888 thousand. This decline,
which was steeper than the drop in earnings before income tax and social contribution, is due to the lower
effective tax rate, mainly resulting from the combination of: (i) the 29.3% drop in earnings before income tax
and social contribution; (ii) the 126.8% increase in the effect of differentiated taxation at the subsidiaries; (iii)
the 46.5% increase in the interest no equity; and (iv) the 3.9% increase in the incentive to research and
development.
Net income decreased 25.8% in 2015, mainly due to the combination of: (i) the 34.3% decline in earnings
before financial effects and equity income; (ii) the 101.2% increase in financial result; and (iii) the 38.6% drop
in income tax and social contribution; and (iii) the 38.6% drop in income tax and social contribution.
EBITDA(*) in 2015 totaled R$332,042 thousand, down 23.9% from 2014. EBITDA margin (% EBITDA of
total net revenue) ended 2015 at 17.4%, as against 24.6% in 2014, as a result of the events described in the
comments in each item.
(*) EBITDA (Earnings before interest, taxes, depreciation and amortization) is a non-accounting measure used by the Company,
calculated in accordance with one of the suggestions of CVM Circular 01/2007, which consists of income before taxes and contributions,
the net financial result (interest income and expenses), depreciation and amortization.
(A free translation of the original in Portuguese)
7
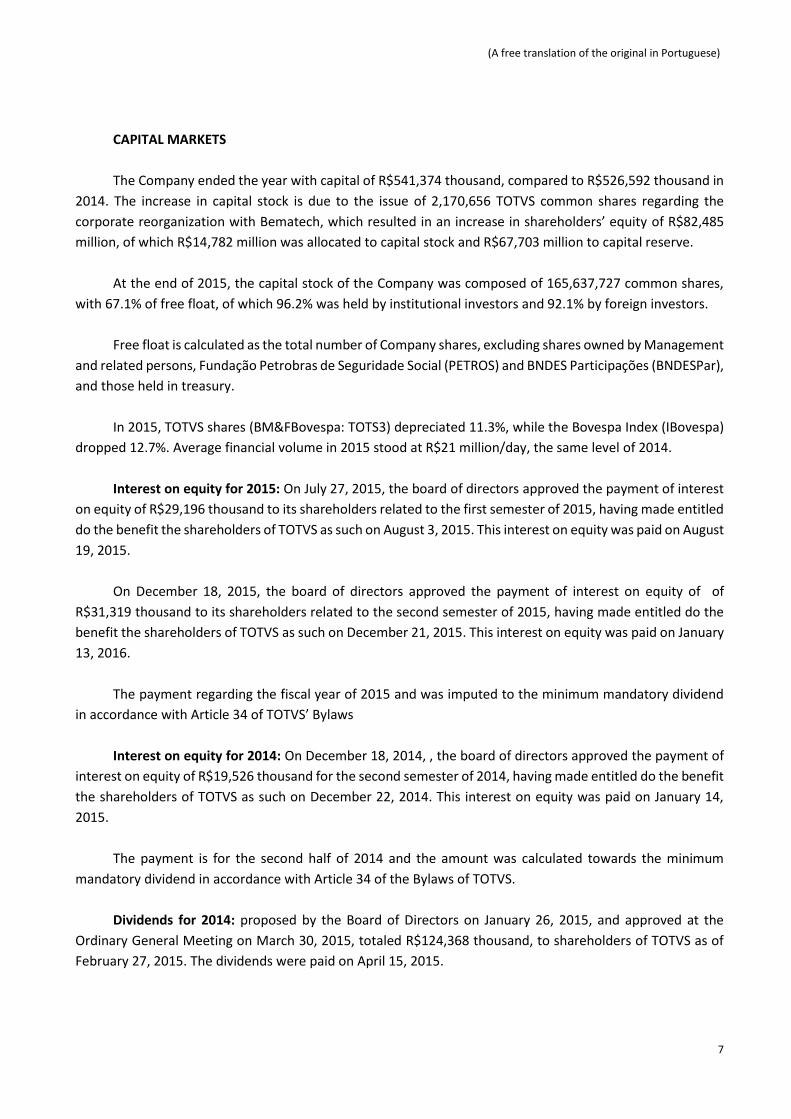
CAPITAL MARKETS
The Company ended the year with capital of R$541,374 thousand, compared to R$526,592 thousand in
2014. The increase in capital stock is due to the issue of 2,170,656 TOTVS common shares regarding the
corporate reorganization with Bematech, which resulted in an increase in shareholders’ equity of R$82,485
million, of which R$14,782 million was allocated to capital stock and R$67,703 million to capital reserve.
At the end of 2015, the capital stock of the Company was composed of 165,637,727 common shares,
with 67.1% of free float, of which 96.2% was held by institutional investors and 92.1% by foreign investors.
Free float is calculated as the total number of Company shares, excluding shares owned by Management
and related persons, Fundação Petrobras de Seguridade Social (PETROS) and BNDES Participações (BNDESPar),
and those held in treasury.
In 2015, TOTVS shares (BM&FBovespa: TOTS3) depreciated 11.3%, while the Bovespa Index (IBovespa)
dropped 12.7%. Average financial volume in 2015 stood at R$21 million/day, the same level of 2014.
Interest on equity for 2015: On July 27, 2015, the board of directors approved the payment of interest
on equity of R$29,196 thousand to its shareholders related to the first semester of 2015, having made entitled
do the benefit the shareholders of TOTVS as such on August 3, 2015. This interest on equity was paid on August
19, 2015.
On December 18, 2015, the board of directors approved the payment of interest on equity of of
R$31,319 thousand to its shareholders related to the second semester of 2015, having made entitled do the
benefit the shareholders of TOTVS as such on December 21, 2015. This interest on equity was paid on January
13, 2016.
The payment regarding the fiscal year of 2015 and was imputed to the minimum mandatory dividend
in accordance with Article 34 of TOTVS’ Bylaws
Interest on equity for 2014: On December 18, 2014, , the board of directors approved the payment of
interest on equity of R$19,526 thousand for the second semester of 2014, having made entitled do the benefit
the shareholders of TOTVS as such on December 22, 2014. This interest on equity was paid on January 14,
2015.
The payment is for the second half of 2014 and the amount was calculated towards the minimum
mandatory dividend in accordance with Article 34 of the Bylaws of TOTVS.
Dividends for 2014: proposed by the Board of Directors on January 26, 2015, and approved at the
Ordinary General Meeting on March 30, 2015, totaled R$124,368 thousand, to shareholders of TOTVS as of
February 27, 2015. The dividends were paid on April 15, 2015.

(A free translation of the original in Portuguese)
8
CORPORATE GOVERNANCE
Novo Mercado: TOTVS was the first Brazilian software company to join the segment that meets the
highest corporate governance standards of the São Paulo Stock Exchange (BM&FBovespa).
Board of Directors: TOTVS’ Board of Directors is composed of 8 members, of which 7 of them external
and independent members, in accordance with Novo Mercado regulations. 15 officers compose the Executive
Board. The list containing the names, position and a brief resume of the Board members and Executive Officers
is available on the Company´s Reference Form, in http://ir.totvs.com.
Audit Committee: It is an advisory body to support the Board of Directors, and its mission is to monitor, evaluate and ensure the best operation of processes, management of internal and external audit mechanisms and controls related to risk management and consistency of financial policies with the strategic guidelines and business risk profile. Currently, the Audit Committee is composed of 3 independent external members elected by the Board of Directors, chaired by an independent member of the Board of Directors.
Remuneration Committee: assists the Board in setting compensation policies and benefits for directors,
officers and participants. Important to highlight that the company currently has 3 members, of which 2 are
independent, and is chaired by an independent member of the Board of Directors.
Arbitration: according to Novo Mercado Regulations and the Company’s Bylaws, the controlling
shareholder, administrators, the Company itself and the Fiscal Council members should undertake to settle all
and any dispute or controversy arising from or relating to Novo Mercado Regulations, the Novo Mercado
Adhesion Agreement, Arbitration Clauses, especially, regarding its application, validity, effectiveness,
interpretation, breach and their effects through arbitration. Disputes regarding the sale of the Company’s
control shall also be solved through arbitration.
Management Statement: in accordance with subparagraphs V and VI, Article 25 - CVM Instruction
480/09, the officers of TOTVS declare that they discussed, reviewed and agreed with the views expressed in
the independent auditors' report and financial statements for the fiscal year ended on December 31, 2015 .
RELATIONSHIP WITH INDEPENDENT AUDITORS
The Company’s policy on engaging services not related to external audit by independent auditors is
grounded on the principles that preserve their autonomy. These principles consist of internationally accepted
standards, namely: (a) auditors must not audit their own work; (b) auditors must not exercise management
functions at their clients; and (c) auditors must not create conflicts of interest with their clients.
Procedures adopted by the Company pursuant to item III, article 2 of CVM Instruction 381/03: The
Company and its subsidiaries adopt as a formal procedure, before hiring independent auditors for
professionals services not related to external audit, ensuring that the execution of these other services does
not affect their autonomy and objectivity necessary for the performance of independent audit services, and
obtaining the approval of their Audit Committee. In addition, formal statements are requested from the
auditors regarding their autonomy in the execution of services not related to audit.

(A free translation of the original in Portuguese)
9
Other services were provided in addition to those related to the audit of financial statements in 2015.
The fees for these services totaled R$354,420 thousand and corresponded to 40.7% of total fees related to
external audit.
ACKNOWLEDGEMENTS
We thank all those who contributed to the success of TOTVS in 2015, especially our clients, employees,
partners and shareholders.
(A free translation of the original in Portuguese)
10
INDEPENDENT AUDITOR’S REPORT ON THE FINANCIAL STATEMENTS
To the Board of Directors and Shareholders TOTVS S.A.
We have audited the accompanying financial statements of TOTVS S.A. ("Parent Company"), which comprise the balance sheet as at December 31, 2015 and the statements of income, comprehensive income, changes in equity and cash flows for the year then ended, and a summary of significant accounting policies and other explanatory information.
We have also audited the accompanying consolidated financial statements of TOTVS S.A. and its
subsidiaries ("Consolidated"), which comprise the consolidated balance sheet as at December 31, 2015 and the consolidated statements of income, comprehensive income, changes in equity and cash flows for the year then ended, and a summary of significant accounting policies and other explanatory information.
Management's responsibility for the financial statements Management is responsible for the preparation and fair presentation of the parent company financial
statements in accordance with accounting practices adopted in Brazil, and for the consolidated financial statements in accordance with the International Financial Reporting Standards (IFRS) issued by the International Accounting Standards Board (IASB) and accounting practices adopted in Brazil, and for such internal control as management determines is necessary to enable the preparation of financial statements that are free from material misstatement, whether due to fraud or error.
Auditor's responsibility Our responsibility is to express an opinion on these financial statements based on our audit. We
conducted our audit in accordance with Brazilian and International Standards on Auditing. Those standards require that we comply with ethical requirements and plan and perform the audit to obtain reasonable assurance about whether the financial statements are free from material misstatement.
An audit involves performing procedures to obtain audit evidence about the amounts and disclosures
in the financial statements. The procedures selected depend on the auditor's judgment, including the assessment of the risks of material misstatement of the financial statements, whether due to fraud or error.
In making those risk assessments, the auditor considers internal control relevant to the entity's
preparation and fair presentation of the financial statements in order to design audit procedures that are appropriate in the circumstances, but not for the purpose of expressing an opinion on the effectiveness of the entity's internal control. An audit also includes evaluating the appropriateness of accounting policies used and the reasonableness of accounting estimates made by management, as well as evaluating the overall presentation of the financial statements.
We believe that the audit evidence we have obtained is sufficient and appropriate to provide a basis for
our audit opinion.

(A free translation of the original in Portuguese)
11
Opinion on the parent company financial statements In our opinion, the parent company financial statements referred to above present fairly, in all material
respects, the financial position of TOTVS S.A. as at December 31, 2015, and its financial performance and its cash flows for the year then ended, in accordance with accounting practices adopted in Brazil.
Opinion on the consolidated financial statements In our opinion, the consolidated financial statements referred to above present fairly, in all material
respects, the financial position of TOTVS S.A. and its subsidiaries as at December 31, 2015, and their financial performance and their cash flows for the year then ended, in accordance with the International Financial Reporting Standards (IFRS) issued by the International Accounting Standards Board (IASB) and accounting practices adopted in Brazil.
Other matters Supplementary information – statements of value added We also have audited the parent company and consolidated statements of value added for the year
ended December 31, 2015, which are the responsibility of the Company's management. The presentation of these statements is required by the Brazilian corporate legislation for listed companies, but they are considered supplementary information for IFRS purposes. These statements were subject to the same audit procedures described above and, in our opinion, are fairly presented, in all material respects, in relation to the financial statements taken as a whole. São Paulo, March 15, 2016. PricewaterhouseCoopers Auditores Independentes CRC 2SP000160/O-5 Marco Aurélio de Castro e Melo Contador CRC 1SP153070/O-3

12
(A free translation of the original in Portuguese)
TOTVS S.A.
Balance sheets as at December 31, 2015 and 2014
(In thousands of reais)
The accompanying notes are an integral part of these financial statements.
Parent Company Consolidated Parent Company Consolidated
Assets 2015 2014 2015 2014 Liabilities and equity 2015 2014 2015 2014
Current assets 731,220 1,038,751 1,157,673 1,156,160 Current liabilities 475,288 317,060 658,683 379,611
Cash and cash equivalents (Note 5) 314,405 659,236 426,415 697,901 Payroll and labor obligations (Note 14) 99,190 95,757 133,152 111,397 Marketable securities (Note 17) 17,488 10,415 75,213 35,169 Trade accounts payable 37,311 28,546 86,932 35,479 Trade accounts receivable (Note 6) 401,750 400,829 565,002 448,360 Loans and financing (Note 15) 168,643 24,798 177,514 25,314 Allowance for doubtful accounts (Note 6) (56,551) (53,652) (75,860) (58,864) Taxes payable 11,293 11,791 18,923 13,739 Stocks (Nota 7) - - 44,407 - Commissions payable 52,172 56,131 56,579 58,571 Taxes recoverable (Note 8) 27,673 473 81,284 6,336 Dividends payable (Note 20) 32,428 47,071 32,885 47,071 Other assets 26,455 21,450 41,212 27,258 Liabilities from acquisition of investments (Note 17) 24,492 18,417 82,220 51,499 Debentures (Note 16) 49,473 33,834 61,915 33,834 Other liabilities 286 715 8,563 2,707 Non-current assets 1,630,795 1,015,821 1,504,402 987,706
Marketable securities (Note 17) 28,780 38,416 39,534 70,680 Non-current liabilities 649,041 621,138 765,660 646,193
Trade accounts receivable (Note 6) 38,676 39,411 40,953 40,828 Loans and financing (Note 15) 466,532 457,176 500,795 457,176
Receivables from related parties (Note 10) 3,622 1,345 - - Debentures (Note 16) 49,429 79,020 82,371 79,020
Taxes recoverable (Note 8) - - 17,881 - Provision for losses on investments (Note 11) 584 294 - 938 Deferred income and social contribution taxes
(Note 9) 16,954 22,044 63,507 57,525 Payables to related parties (Note 10) 15,023 13,216 - -
Financial assets at fair value (Note 4) - - 68,044 46,934 Provision for contingencies related to legal proceedings (Note 18) 70,392 10,854 90,507 12,518
Judicial deposits (Note 18) 31,688 21,811 43,407 22,420 Liabilities from acquisition of investments (Note 17) 47,065 60,046 88,272 88,983 Other assets 10,405 12,481 18,466 18,112 Other liabilities 16 532 3,715 7,558
Equity (Note 19) 1,237,686 1,116,374 1,237,732
1,118,062
Investments (Note 11) 1,001,473 392,211 - - Capital 541,374 526,592 541,374 526,592 Property, plant and equipment (Note 12) 86,235 66,724 113,598 79,121 Treasury shares (71,012) (52,212) (71,012) (52,212) Intangible assets (Note 13) 412,962 421,378 1,099,012 652,086 Capital reserves 159,213 92,493 159,213 92,493 Other comprehensive income results 21,329 29 21,329 29 Retained profit reserve 520,203 451,768 520,203 451,768 Proposed additional dividend 66,579 97,704 66,579 97,704 Non-controlling interests - - 46 1,688
Total assets 2,362,015 2,054,572 2,662,075 2,143,866 Total liabilities and equity 2,362,015 2,054,572 2,662,075 2,143,866

13
(A free translation of the original in Portuguese)
TOTVS S.A.
Statement of income Years ended December 31, 2015 and 2014 (In thousands of reais, except by the earnings per share)
Parent Company Consolidated
2015 2014 2015 2014
(Reclassified
note 2.2) (Reclassified
note 2.2)
Licensing fees 198,511 249,414 239,979 298,949
Services 444,480 427,987 557,718 514,572
Subscriptions 86,113 79,456 140,820 104,228
Maintenance 828,741 784,582 918,556 854,698
Hardware - - 51,664 -
Net revenue from services and sales (Note 28) 1,557,845 1,541,439 1,908,737 1,772,447
Cost of software (69,527) (71,316) (75,399) (82,443)
Cost of services (388,881) (376,956) (507,298) (455,256)
Cost of support (83,974) (63,402) (89,722) (66,764)
Cost of hardware - - (34,050) -
Gross profit 1,015,463 1,029,765 1,202,268 1,167,984
Operating income (expenses)
Research and development (224,041) (209,853) (267,013) (235,086)
Advertising expenses (38,243) (35,316) (49,281) (41,439)
Selling expenses (106,515) (97,697) (152,230) (131,741)
Commissions (Note 27) (138,075) (142,175) (155,981) (154,986)
General and administrative expenses (156,588) (90,324) (187,277) (114,376)
Management fees (Note 10) (19,280) (19,639) (23,476) (26,049)
Depreciation and amortization (Notes 12 and 13) (70,894) (69,249) (103,077) (88,928)
Allowances for doubtful accounts (Note 6) (30,192) (24,297) (34,562) (27,565)
Other net operating income (expenses) (5,853) 844 (988) (155)
Income before financial effects and equity pickup 225,782 342,059 228,383 347,659
Financial income (Note 24) 97,627 62,062 121,165 71,008
Financial expenses (Note 24) (82,107) (47,756) (94,639) (57,826)
Equity pick-up (Note 11) (4,628) (1,497) (75) (583)
Income before income tax and social contribution 236,674 354,868 254,834 360,258
Income tax and social contribution current (47,025) (88,122) (69,250) (96,957)
Income tax and social contribution deferred 5,088 (3,786) 9,362 (503)
Total of Income tax and social contribution (41,145) (91,908) (59,888) (97,460)
Net income for the year 159,529 262,960 194,946 262,798
Net income attributable to the owners of company 159,529 262,960 159,529 262,960
Net income attributable to non-controlling interest - - (583) (162)
Basic earnings per thousand shares (in Reais) 1.20 1.61 1.20 1.61
Diluted earnings per thousand shares (in Reais) 1.19 1.59 1.19 1.59
The accompanying notes are an integral part of these financial statements.

(A free translation of the original in Portuguese)
14
TOTVS S.A.
Statements of comprehensive income Years ended December 31, 2015 and 2014 (In thousands of Reais )
Parent Company
2015 2014
Net income for the year 159,529 262,960
Cumulative adjustment for currency exchange 32,272 2,650
Deferred income tax (10,972) (901)
Cumulative adjustement for currency exchange, net
of tax effects
21,300 1,749
Comprehensive income for the year 216,829 264,709
Consolidated
2015 2014
Net income for the year 194,946 262,798
Cumulative adjustment for currency exchange 32,272 2,650
Deferred income tax (10,972) (901)
Cumulative adjustement for currency exchange,
net of taxes effects
21,300 1,749
Comprehensive income for the year 216,246 264,547
Net income for the year attributable to controlling
shareholders
216,829 264,709
Attributable to non-controlling interest (583) (162)
The accompanying notes are an integral part of these financial statements.
15
TOTVS S.A. (A free translation of the original in Portuguese)
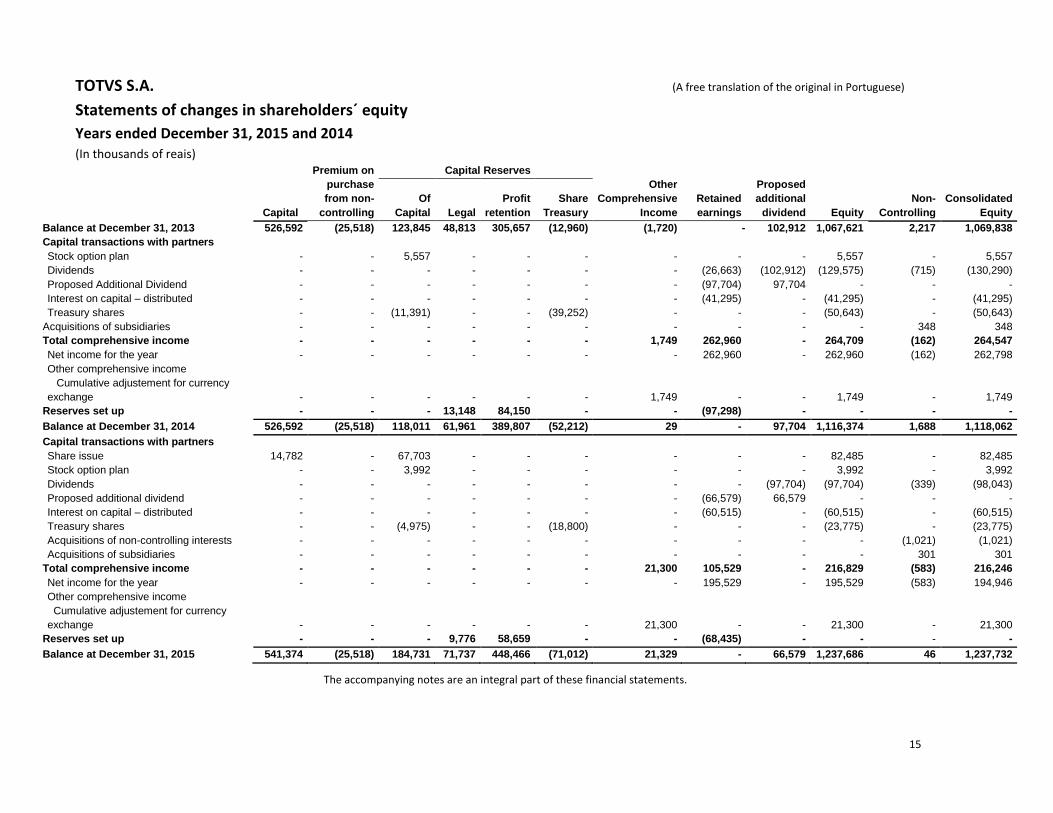
Statements of changes in shareholders´ equity
Years ended December 31, 2015 and 2014
(In thousands of reais)
Capital
Premium on
purchase
from non-
controlling
Capital Reserves
Other
Comprehensive
Income
Retained
earnings
Proposed
additional
dividend Equity
Non-
Controlling
Consolidated
Equity
Of
Capital Legal
Profit
retention
Share
Treasury
Balance at December 31, 2013 526,592 (25,518) 123,845 48,813 305,657 (12,960) (1,720) - 102,912 1,067,621 2,217 1,069,838
Capital transactions with partners
Stock option plan - - 5,557 - - - - - - 5,557 - 5,557
Dividends - - - - - - - (26,663) (102,912) (129,575) (715) (130,290)
Proposed Additional Dividend - - - - - - - (97,704) 97,704 - - -
Interest on capital – distributed - - - - - - - (41,295) - (41,295) - (41,295)
Treasury shares - - (11,391) - - (39,252) - - - (50,643) - (50,643)
Acquisitions of subsidiaries - - - - - - - - - - 348 348
Total comprehensive income - - - - - - 1,749 262,960 - 264,709 (162) 264,547
Net income for the year - - - - - - - 262,960 - 262,960 (162) 262,798
Other comprehensive income
Cumulative adjustement for currency
exchange - - - - - - 1,749 - - 1,749 - 1,749
Reserves set up - - - 13,148 84,150 - - (97,298) - - - -
Balance at December 31, 2014 526,592 (25,518) 118,011 61,961 389,807 (52,212) 29 - 97,704 1,116,374 1,688 1,118,062
Capital transactions with partners
Share issue 14,782 - 67,703 - - - - - - 82,485 - 82,485
Stock option plan - - 3,992 - - - - - - 3,992 - 3,992
Dividends - - - - - - - - (97,704) (97,704) (339) (98,043)
Proposed additional dividend - - - - - - - (66,579) 66,579 - - -
Interest on capital – distributed - - - - - - - (60,515) - (60,515) - (60,515)
Treasury shares - - (4,975) - - (18,800) - - - (23,775) - (23,775)
Acquisitions of non-controlling interests - - - - - - - - - - (1,021) (1,021)
Acquisitions of subsidiaries - - - - - - - - - - 301 301
Total comprehensive income - - - - - - 21,300 105,529 - 216,829 (583) 216,246
Net income for the year - - - - - - - 195,529 - 195,529 (583) 194,946
Other comprehensive income
Cumulative adjustement for currency
exchange - - - - - - 21,300 - - 21,300 - 21,300
Reserves set up - - - 9,776 58,659 - - (68,435) - - - -
Balance at December 31, 2015 541,374 (25,518) 184,731 71,737 448,466 (71,012) 21,329 - 66,579 1,237,686 46 1,237,732
The accompanying notes are an integral part of these financial statements.

(A free translation of the original in Portuguese)
16
TOTVS S.A. Statement of cash flow Years ended December 31, 2015 and 2014
(In thousands of Reais)
Parent Company Consolidated
2015 2014 2015 2014
Cash flow from operating activities
Profit before taxation income and social contribution 236,674 354,868 254,834 360,258
Adjustments for:
Depreciation and amortization ( Notes 12 and 13) 70,894 69,249 103,660 88,928
Stock option plan (Note 21) 3,992 5,557 3,992 5,557
Losses (gains) on disposal of fixed assets 2,474 474 (1,980) 2,501
Allowance for doubtful accounts ( Note 6) 30,192 24,297 34,562 27,565
Equity pick up (Note 11) 4,628 1,497 75 583
Provision for contingencies and legal obligations 59,538 3,671 56,833 5,213
Provision (reversal) others obligations (1,388) - (6,388) -
Interest and monetary and exchange variations, net 31,598 29,223 42,331 25,053
Changes in operating assets and liabilities:
Trade accounts receivable (24,261) (65,736) (42,110) (65,270)
Other assets 29,379 (1,714) 20,559 (298)
Judicial deposits (9,877) (7,195) (9,046) (7,804)
Labor and social security liabilities 1,965 12,363 (2,837) 10,839
Taxes recoverable (26,258) 1,003 (37,886) 1,369
Suppliers 8,662 1,007 10,377 1,308
Commission payable (3,959) (278) (2,816) 239
Taxes payable (27,648) (47,831) (40,327) (55,880)
Other accounts payable (944) 100 8,811 (4,447)
Cash flow provided by operations 385,661 380,555 392,644 395,714
Interest paid (46,163) (22,229) (46,828) (22,229)
Income tax and social contributions paid (20,237) (39,562) (32,649) (41,440)
Net cash provided by operating activities 319,261 318,764 313,167 332,045
Cash flow provided by investment activities
Capital increase in subsidiaries (Note 11) (67,726) (72,894) - -
Dividends received 15,027 600 - -
Purchases of intangible assets (Note 13) (41,039) (6,978) (43,199) (7,320)
Acquisitions of subsidiaries, net of cash obtained in the
acquistions (502,755) (60,007) (423,329) (91,911)
Cash and cash equivalents of merged subsidiaries 48,562 - - -
Value of sales of fixed assets 1,448 780 845 881
Purchases of property, plant and equipment (Note 12) (42,042) (25,613) (47,524) (31,227)
Purchases of investments measured at fair value - - 6,088 (3,194)
Net cash used in investment activities (588,525) (164,112) (507,119) (132,771)
Cash flow from financing activities
Payment of principal on loans and financing (27,512) (51,226) (27,452) (52,861)
Payment of principal on debentures (32,002) - (33,908) -
New loans and financing 181,055 227,078 181,858 227,078
Receivables from related companies (470) 28,300 - -
Dividends and interest on capital paid (172,863) (155,810) (174,257) (158,009)
Treasury shares, net (23,775) (50,644) (23,775) (50,644)
Net cash used in financing activities (75,567) (2,302) (77,534) (34,436)
Increase (decrease) in cash and cash equivalents (344,831) 152,350 (271,486) 164,838
Cash and cash equivalents at beginning of year 659,236 506,886 697,901 533,063
Cash and cash equivalents at the end of the year 314,405 659,236 426,415 697,901
The accompanying notes are an integral part of these financial statements.

(A free translation of the original in Portuguese)
17
TOTVS S.A. Statement of Value Added Years ended December 31, 2015 and 2014
(In thousands of Reais) Parent Company Consolidated
2015 2014 2015 2014
1 – REVENUES 1,674,463 1,662,509 2,062,599 1,908,375
1.1 Sales of goods, products and services 1,710,507 1,685,964 2,094,744 1,934,472
1.2 Other revenue (5,852) 842 2,417 1,468
1.3 Allowance for doubtful accounts – recording (30,192) (24,297) (34,562) (27,565)
2 - RAW MATERIALS ACQUIRED FROM THIRD-PARTIES
(includes ICMS and IPI taxes) (584,860) (509,225) (726,476) (583,765)
2.1 Cost of goods and services sold (69,527) (69,955) (113,220) (81,684)
2.2 Materials, energy, outsourced services and other (515,333) (439,270) (613,256) (502,081)
3 - GROSS VALUE ADDED ( 1-2 ) 1,089,603 1,153,284 1,336,123 1,324,610
4 - DEPRECIATION AND AMORTIZATION (70,894) (69,249) (103,660) (88,928)
5 - NET VALUE ADDED PRODUCED BY THE ENTITY (3-4) 1,018,709 1,084,035 1,232,463 1,235,682
6 - VALUE ADDED RECEIVED THROUGH TRANSFERS 92,999 60,565 121,090 70,425
6.1 Equity pick-up (4,628) (1,497) (75) (583)
6.2 Financial income 97,627 62,062 121,165 71,008
7 - TOTAL VALUE ADDED TO DISTRIBUTE (5+6) 1,111,708 1,144,600 1,353,553 1,306,107
8 - VALUE ADDED DISTRIBUTION 1,111,708 1,144,600 1,353,553 1,306,107
8.1 Personnel 586,644 543,970 742,803 659,122
8.1.1 Direct Compensation 472,671 445,596 602,430 540,505
8.1.2 Benefits 68,195 59,849 84,904 73,727
8.1.3 FGTS (worker’s severance fund) 45,778 38,525 55,469 44,890
8.2 Taxes and contributions 224,193 265,696 289,384 295,841
8.2.1 Federal 182,790 224,907 209,980 248,589
8.2.2 State 5 160 25,661 899
8.2.3 Municipals 41,398 40,629 53,743 46,353
8.3 Interest and rent 105,342 71,974 126,420 88,346
8.3.1 Interest 82,107 47,756 94,586 57,826
8.3.2 Rents 23,235 24,218 31,963 30,520
8.3.3 Others - - (129) -
8.4 Remuneration of equity capital 195,529 262,960 194,946 262,798
8.4.1 Interest on capital 60,515 41,295 60,515 41,295
8.4.2 Dividends paid or credited to shareholders 66,579 124,367 66,579 124,367
8.4.3 Retained profit / loss for the year 68,435 97,298 68,435 97,298
8.4.4 Minority interest in retained earnings - - (583) (162)
The accompanying notes are an integral part of these financial statements.

(A free translation of the original in Portuguese)
18
TOTVS S.A. Notes to the financial statements Years ended December 31, 2015 and 2014 (In thousands of Reais)
1. Operations
TOTVS S.A. (“TOTVS”, or “Company”) is a publicly held corporation, headquartered at Av. Braz
Leme, 1631 – 2nd floor, in the city and state of São Paulo, whose shares are traded on the Novo Mercado
of BM&FBOVESPA - Securities, Commodities and Futures Exchange.
The Company’s business purpose is the development and sale of management software,
productivity and collaboration platform, as well as the provision of implementation, consulting, assistance
and maintenance services. The solutions developed by the Company are segmented according to the
diverse sectors of the economy, resulting in greater importance of the applications in our clients’ business,
both in back office processes or in those specific to the respective sectors. In 2015, with the corporate
reorganization involving Bematech, the Company began to consolidate industrialization and sale activities
of hardware, combining specialized solutions in management system, point of sale (POS), commercial
automation, tax, e-commerce, mobility, payment methods solutions and the collaboration platform.
The Financial Statements presented in this document were approved at the Board of Directors’
Meeting held on March 15, 2016.
Non-financial data included in this report, such as the number of clients, average ticket, market
share, and other, were not audited by our independent auditors.
2. Basis of Preparation and Summary of the Main Accounting Practices
The individual and consolidated financial statements were prepared and presented in accordance
with the accounting practices adopted in Brazil, including the pronouncements issued by the Accounting
Pronouncements Committee (“CPC”) and the rules issued by the Brazilian Securities Commission (“CVM”).
In addition, the consolidated financial statements are presented in accordance with International
Financial Reporting Standards (“IFRS”) issued by the International Accounting Standards Board
(“IASB”)and show all material information strictly relating to the financial statements, which are
consistent with that used by the management.
The financial statements were prepared on the historical cost basis, except for the valuation of
certain assets and liabilities, such as financial instruments from business combinations, which are
measured at their fair value.
The preparation of financial statements requires the use of certain critical accounting estimates
and, more than that, the exercise of judgment by Company management in applying the accounting
policies of TOTVS S.A. The areas that need a higher level of judgment and which have a greater degree of
complexity, as well as the areas in which the assumptions and estimates are significant for the financial
statements are: (i) Allowance for doubtful accounts, (ii) Realizable value of tangible and intangible assets,

(A free translation of the original in Portuguese)
19
including goodwill; (iii) Deferred taxes; and (iv) Provision for contingencies related to legal proceedings.
More information on the estimates and assumptions used in the items mentioned above is provided in
the respective notes.
The pronouncements or interpretations of CPCs / IFRS that came into effect from 2015 did not have
any significant impact on the Company's financial statements.
Below is a summary of key accounting practices adopted by the Company, highlighting only
information considered relevant by Management.
2.1. Consolidation
The consolidated financial statements include the operations of the Company and the following
subsidiaries. The percentages of the interests held by the Company on the balance sheet date are
summarized below:
Direct interest: Head % Interest
Corporate Name office Name used 2015 2014
TOTVS Serviços Ltda. (former TOTVS Rio) BRA TOTVS Serviços 100 100 TOTVS Nordeste Software Ltda. BRA TOTVS Nordeste 100 100 TOTVS Brasília Software Ltda. BRA TOTVS Brasília 100 100 TQTVD Software Ltda. BRA TQTVD 100 100 TOTVS Ventures Participações Ltda. BRA TOTVS Ventures 100 100 TOTVS Soluções em Agroindústria S.A. BRA TOTVS Agroindústria (e) - 60 P2RX Soluções em Software S.A. BRA P2RX (e) - 60 TOTVS Argentina S.A. ARG TOTVS Argentina 100 100 Datasul Argentina S.A. ARG Datasul Argentina 100 100 TOTVS México S.A. MEX TOTVS México 100 100 Datasul S.A. de CV. MEX Datasul México 100 100 TOTVS Corporation BVI TOTVS Corporation 100 100 EuroTOTVS Lda. POR EuroTOTVS (c) - 100 TOTVS Incorporation USA TOTVS Inc. 100 100 Virtual Age Soluções em Tecnologia Ltda. BRA Virtual Age 100 100 Neolog Consultoria e Sistemas S.A. BRA Neolog (a) 60 - Ciashop - Soluções para Comércio Eletrônico S.A. BRA Ciashop 70 70 TOTVS Resultados em Outsourcing Ltda. BRA RO 100 100 Bematech S.A. BRA Bematech (a) 100 -
Indirect Interest: % Interest
Corporate Name Head
office Name used
Investor Notes 2015 2014
DTS Consulting Partner, SA de CV MEX Partner Datasul México 100 100 W&D Participações S.A. BRA W&D TOTVS Brasília 100 100 PC Informática S.A. BRA PC Informática W&D 100 100 uMov.me S.A. BRA uMov.me TOTVS Ventures (b) - 20 RMS Software S.A. BRA RMS TOTVS Nordeste 100 100 Webstrategie Software Ltda. BRA Webstrategie RMS 100 100 Kerina Software Ltda. BRA Kerina TQTVD (d) 100 -
(a) Business combinations occurred in 2015.
(b) Divestment made in 2015.

(A free translation of the original in Portuguese)
20
(c) Company closed in June 2015
(d) Company established in September 2015.
(e) Companies established in 2015.
On April 2, 2015, TOTVS Ventures, a subsidiary of TOTVS S.A., sold its 20% non-controlling interest
in uMov.me for R$1,600, rescinding all future investment commitments established at the time of
acquisition of said interest in uMov.me.
The results of subsidiaries acquired and/or merged during the fiscal year ended December 31, 2015
and 2014 are included in the income statements since the date of their acquisition and/or merger. Hence,
for the purpose of comparison of the parent company’s and consolidated results between 2014 and 2015,
the dates of acquisition and merger of the results of each subsidiary must be considered.
All intercompany balances and transactions were eliminated in consolidation.
2.2. Reclassification of comparable figures
With the purpose of better presenting its financial statements, as of the first quarter of 2015 the Company added new lines relating to subscriptions of software and cost of support to the statement of income, and renamed the item Cost of licensing fee to Cost of software in the financial statements. Due to these changes, revenue and cost lines disclosed in 2014 were reclassified for better comparison.
Also in 2015, due to the abovementioned changes, the Company reclassified amounts between cost
of services, previously stated as cost of services and maintenance, and research and development expenses, which were reclassified for fiscal years 2014 and 2013 for better comparison. The reclassified amounts are:
2014 2013
Parent Company Balance reported
Reclassific
ation
Balance reclassified
Balance
reported
Reclassification
Balance
reclassified
Cost of services and maintenance (435,054) - - (381,770) - - Cost of services - (376,956) (376,956) - (317,787) (317,787) Cost of support - (63,402) (63,402) - (63,983) (63,983) Research and development (215,157) 5,304 (209,853) - - -
Total (650,211) (435,054) (650,211) (381,770) (381,770)
2014 2013
Consolidated Balance reported
Reclassifi-
cation
Balance reclassified
Balance
reported
Reclassifi-cation
Balance
reclassified
Cost of software (83,123) 680 (82,443) (74,569) 2,107 (72,462) Cost of services and maintenance (516,036) - - (466,727) - - Cost of services - (455,256) (455,256) - (415,020) (415,020) Cost of support - (66,764) (66,764) - (58,872) (58,872) Research and development (240,390) 5,304 (235,086) (213,602) 5,058 (208,544)
Total (839,549) (516,036) (839,549) (754,898) (466,727) (754,898)

(A free translation of the original in Portuguese)
21
2.3. Information by segment
Given that its activities are concentrated in developing and selling licenses to use automated
systems, and providing implementation, consulting, advisory and maintenance services, the Company is
organized around one single business unit. Accordingly, the Company’s Management assesses the
business as one single segment.
However, with the acquisition of Bematech in October 2015, the Company started to consolidate
its hardware investments and results, whose assets, revenues and operating profit do not meet the
minimum quantitative parameters for a reportable segment, despite being a product that differs from
software.
The Company's software is designed to serve diverse segments of the economy and all the
investments and results of the Company are analyzed, monitored and evaluated in an integrated manner.
2.4. Financial Instruments
2.4.1 Classification
The Company classifies financial assets upon initial recognition into the following categories: at fair
value through profit or loss and loans and receivables. The classification depends on the purpose for which
the financial assets were acquired.
On December 31, 2015 and 2014, the Company had no financial assets classified as available for
sale.
(a) Financial assets at fair value through profit or loss
TOTVS maintains investments in companies whose share of the interest is held indirectly through
venture capital organizations and which are measured at fair value through profit or loss.
(b) Loans and receivables
The Company's loans and receivables are mainly composed of "Accounts receivable and other
receivables" and "cash and cash equivalents."
2.5. Accounts receivable from customers
Accounts receivable from customers are shown at their net realizable value, and accounts
receivable from foreign customers are restated using the exchange rates in force at the date of the
Financial Statements. Accounts receivable maturing after one year are discounted to present value
Accounts receivable are recognized at nominal value and deducted from the allowance for doubtful
accounts, which is constituted based on the history of losses by maturity range, which the Company
deems sufficient to cover any losses.
(A free translation of the original in Portuguese)
22
2.6. Stocks Stocks are measured at the lowest value between cost and net realizable value. Stock costs are
based on the weighted average cost principle and include expenses with the acquisition of raw material,
cost of production and transformation and other costs to transport goods to their current locations and
under existing conditions. In case of manufactured stocks and products in progress, the cost includes a
portion of general manufacturing costs based on the normal operating capacity.
2.7. Provision for impairment of assets
Management annually reviews the net book values of assets with a view to evaluating the impact
of events or economic, operational and technological changes that may indicate deterioration or
impairment. When such evidence is identified and the net book value exceeds the recoverable value, a
provision is established for the impairment, adjusting the net book value to the recoverable value.
Goodwill paid for expected future profitability is tested annually for impairment or when
circumstances indicate a loss due to the depreciation of its book value.
2.8. Revenues and expenses
The Company and its subsidiaries earn software license revenue, made up of licensing fees, revenue
from services that includes consulting fees, revenue from support services, revenue from maintenance
and revenue from subscription. With the corporate restructuring involving Bematech, the Company
started to consolidate revenue from sale of products (hardware).
Revenue related to software license is recognized when all of the following are cumulatively
achieved:
(i) execution of the agreement and software delivery to the client;
(ii) the amount can be measured reliably (as per the terms of the agreement);
(iii) all risks and rewards inherent to the license are transferred to the buyer;
(iv) the Company no longer holds effective control over the license;
(v) it is probable that economic benefits be generated for the benefit of the Company. License
revenues resulting from subscription are recognized on a monthly basis over the terms of the
agreements with customers.
Revenue from services is billed separately and recognized as the services are performed. Revenue
from maintenance, comprising technological developments and technical support services (phone or
Internet service for inquiries), and revenue from subscription, representing the subscription of software
available to clients, are billed and recognized monthly over the terms of the agreements with customers.

(A free translation of the original in Portuguese)
23
Billed revenue that does not meet the recognition criteria is not included in the balances of
respective revenue account and accounts receivable. The revenue is presented in the income statement
at its net amount, i.e. excluding taxes.
Hardware revenue is recognized when there is reliable evidence that: (i) the risks and rewards
inherent to the product were transferred to the buyer; (ii) the economic benefits will flow to the entity;
and (iii) the associated costs and possible return of goods may be estimated reliably. If a discount can
probably be granted and the amount can be reliably measured, the discount is deducted from revenue as
sales are recognized.
The costs related to revenue from licensing fees include the costs of acquisition of databases, costs
of the media in which the products are delivered, and price of licenses paid to third parties, in the case of
resold software. Costs related to revenue from maintenance services consist mainly of the salaries of
consulting and support personnel and other costs related to those areas.
Expenses with research and development incurred by the development (software programming
and manufacturing) area, linked to new software versions and upgrades of existing software are
registered as expenses for the year in which they are incurred and are stated separately from selling costs,
in operating expenses.
2.9. Taxation
Sales taxes
Revenues from sales and services are subject to the following taxes and contributions at the
following basic rates:
Social Contribution on Gross Revenue for Social Integration Program (PIS) 0.65% and 1.65%;
Social Contribution on Gross Revenue for Social Security Financing (COFINS) 3.0% and 7.6%;
Service Tax (ISS) between 2% and 5%;
National Social Security Institute (INSS) 2% up to November 2015 and 4.5% as of December 2015.
These charges are accounted for as sales deductions in the income statement.
Income and social contribution taxes – current and deferred
The taxation on income includes Income and Social Contribution Taxes, which stand at the nominal
rate of 34% on taxable income recognized using the accrual basis of accounting.
2.10. Government subsidy Bematech, a subsidiary of TOTVS S.A., enjoys the tax benefit established by State Decree
1,922/2011, which allows the appropriation of presumed ICMS credit equivalent to the rate provided for in the respective output of goods listed in the Decree. This benefit applies to industrial plants manufacturing IT and automation products located in the state of Paraná and which meet the

(A free translation of the original in Portuguese)
24
requirements of the Law of Information Technology. This credit is given as a subsidy for investments, for which the Company must:
a) have publications in Interministerial Decree (Finance, Development, Industry and Foreign Trade,
and Science and Technology); and b) invest in research and development activities according to item II, paragraph 2, of Article 1 of
State Decree 1,922/2011.
2.11. New standards and interpretations that have yet to take effect
IFRS 15 - Revenue from Contracts with Customers, which is the result of a joint initiative involving
the IASB and FASB to converge the standards on revenue recognition and disclosure that apply to
contracts with customers. This new standard establishes the principles that an entity shall apply to
measure revenue and when it is recognized. It becomes effective on January 1, 2018 and replaces IAS 11
– Construction Contracts and IAS 18 – Revenue and related interpretations. The Company is analyzing the
possible impacts of the application of this standard.
IFRS 16 – Leases, which replaces IAS 17, providing a single accounting treatment for operating and
finance leases based on a model similar to the finance lease, impacting fixed assets and financial liabilities.
This standard becomes effective on January 1, 2019, and the Company is evaluating its content and
possible impacts from its adoption.
There are no other IFRS standards not yet effective that may have significant impact on the
Company and its subsidiaries.
3. Business combination
Business combinations and acquisitions of interests in 2015 and 2014 are in line with the Company's
strategy of specialization and consolidation of its position as a provider of solutions to different segments
of the economy, and bringing new solutions to TOTVS’ customers through portfolio diversification with
niche-specific solutions.
The Company uses the acquisition method to book business combinations. The Company
recognizes the noncontrolling interest in the company acquired, both at its fair value and in proportion to
the noncontrolling interest in the fair value of the acquired company’s net assets.
3.1. Acquisition of subsidiaries
Corporate reorganization – Bematech S.A.
On August 14, 2015, the boards of directors of the Company and Bematech S.A. (“Bematech”) approved the corporate reorganization involving the companies to integrate their activities. At the extraordinary shareholders meeting held on September 3, 2015, the shareholders of both companies approved the corporate restructuring, as follows:

(A free translation of the original in Portuguese)
25
(i) Makira II Empreendimentos e Participações S.A. (“Makira II”) absorbs Bematech shares at market value for R$549,900, resulting in the issue by Makira II of 749,863,050 common shares and 4,249,223,950 redeemable preferred shares in favor of Bematech shareholders who held the merged shares.
(ii) Redemption of the redeemable preferred shares of Makira II, issued in favor of the former shareholders of Bematech, in the total amount of R$467,415 (R$0.11 for each redeemed share), paid in cash by the Company as the successor to Makira II on November 10, 2015 for the inflation-adjusted amount of R$473,586. Makira II preferred shares were cancelled and deducted from capital reserve.
(iii) With the redemption of preferred shares, the shareholders resolved on the merger of Makira II with the Company, with the absorption of its net assets stated at book value, and the consequent dissolution of Makira II. As a result, a total of 2,170,656 Company's new common shares were issued in favor of Bematech's shareholders to replace Makira II’s common shares.
As a result of the merger of Makira II, the shareholders’ equity of the Company increased by R$82,485, which corresponds to the book value of the net assets of Makira II. Of the equity increase reported by the Company, (a) R$14,782 were allocated to Company’s capital increase and (b) R$67,703 were allocated to capital reserve.
The acquisition price is summarized below:
The purpose of the corporate reorganization is to unify the efforts to strengthen the portfolio of
software and hardware platforms and solutions, given that the complementary nature of the current product portfolios will make the Company even more complete and valuable to its clients and shareholders. Moreover, the synergies from the integration of the companies will also generate lower combined expenses and economies of scale.
Up to the reporting date, transaction costs totaled R$5,895, recorded in the Company's statement
of income and included in other operating expenses. The above-mentioned restructuring was concluded on October 22, 2015, when the Company took
over Bematech, after approval by Brazil’s antitrust agency (CADE) on October 6, 2015 and after 15 days
during which appeals could be filed by third parties, which had conditions precedent.
Acquisition of remaining interest in capital of TOTVS Agroindústria S.A. and P2RX Soluções em
Software S.A. On May 11, 2015, the Company acquired the remaining interest of 40% in the capital of the
subsidiaries TOTVS Agroindústria S.A. and P2RX Soluções em Software S.A. for R$8,834, according to the share purchase agreement and other covenants entered into on April 18, 2013. With these acquisitions, TOTVS now holds 100% interest in these subsidiaries.
Consideration paid for redemption of preferred shares of Makira II R$473,586 Exchange of shares R$82,485
Total consideration R$556,071
(A free translation of the original in Portuguese)
26
Acquisition of Neolog Consultoria e Sistemas S.A. On February 11, 2015, the Company acquired 60% of the capital of Neolog Consultoria e Sistemas
S.A. (“Neolog”) for R$15,547. Neolog develops software solutions in the software as a service (SaaS) model for the Logistics and Supply Chain Management market. In addition to this amount, the agreement establishes the payment of a variable, which shall be paid with the attainment of certain targets defined to Neolog up to June 30, 2016.
The agreement also establishes that the Company acquire the remaining interest in Neolog
between January 2018 and January 2020 for a variable amount based on Neolog’s performance metrics. The estimated amount relating to the acquisition of Neolog’s remaining interest at the present value on the acquisition date was R$9,992 and is recorded under liabilities due to investment acquisition.
Acquisition of Virtual Age Soluções em Tecnologia Ltda.
On May 21, 2014, the Company acquired 100% of the capital of Virtual Age Soluções em Tecnologia
Ltda. (“Virtual Age”), which develops cloud-based software solutions for the fashion and apparel value
chain, for R$50,105. The agreement also establishes the payment of a variable amount of up to R$25,000,
of which R$15,000 was paid and the balance shall be paid based on the achievement by Virtual Age of
certain metrics defined in the agreement, by December 2016.
Acquisition of CIASHOP – Soluções para Comércio Eletrônico S.A.
On January 5, 2014, after CADE’s approval without restrictions, the Company acquired, through its
subsidiary TOTVS Sales (merged into TOTVS S.A. in October 2014), 70% of the capital of Ciashop – Soluções
para Comércio Eletrônico S.A. (“CIASHOP”) for R$16,442, which is a pioneer in e-commerce in Brazil,
offering a cloud platform that delivers its solutions in the Software as a Service (SaaS) model.
3.2. Identifiable assets acquired and goodwill
The fair value of identifiable assets acquired in the business combinations mentioned above was
measured and recognized on the acquisition date. The methods and assumptions used for fair value
measurements were based on cash flow discounted to its present value and replacement cost. To
estimate the amount using the discounted cash flow method, the rate used varied from 14.4% to 18.3%
p.a. (in nominal terms). The amount of assets not identifiable from these business combinations was
booked as goodwill based on technical studies of future profitability.
The fair value, goodwill and the cost of holding interest on the acquisition date of the identifiable assets acquired that impacted the consolidated financial statements on December 31, 2015 and 2014 are shown below:

(A free translation of the original in Portuguese)
27
(*) The allocation of Bematech’s intangible assets is preliminary and it is under review for the determination of fair value of identifiable assets acquired and liabilities assumed. The Company expects to conclude these studies in the coming months. (**) Goodwill from expected future profitability to be deducted for tax purposes after the merger totaled R$102,855, which refers to the amount paid less Bematech’s equity (before fair value adjustments).
Acquisitions – 2014
Fair value Ciashop Virtual Age Total
Current Assets 639 3,821 4,460
Cash and cash equivalents 28 616 644
Trade accounts receivable 529 2,744 3,273
Other current assets 82 461 543
Non-current assets 10,368 28,096 38,464
Identifiable assets 9,429 27,542 36,971
Client portfolio 166 4,011 4,177
Brand 2,151 - 2,151
Software 6,989 21,118 28,107
Non-competition 123 2,413 2,536
Current liabilities 1,211 3,275 4,486
Non-current liabilities 350 34 384
Non-controlling interests 5 - 5
Net assets and liabilities 9,441 28,608 38,049
Acquisition cost 16,442 75,105 91,547
Goodwill 7,001 46,497 53,498
The acquisitions mentioned above are incorporated into the management model and distribution
channels of TOTVS and contributed to net revenue of R$86,845 on December 31, 2015 (R$29,954 on
Preliminary fair value Neolog Bematech (*) (**) Total
Current Assets 1,421 274,018 275,439
Cash and cash equivalents 254 78,854 79,108
Trade accounts receivable 1,005 106,300 107,305
Inventories - 40,092 40,092
Other current assets 162 48,772 48,934
Non-current assets 13,833 249,935 263,768
Other non-current assets 638 58,608 59,246
Brands and patents - 25,628 25,628
Software 7,933 49,100 57,033
Client portfolio 4,226 116,599 120,825
Non-competition 1,036 - 1,036
Current liabilities 1,117 102,100 103,217
Non-current liabilities 184 126,705 126,889
Non-controlling interests 303 - 303
Net assets and liabilities 13,650 295,148 308,798
Acquisition cost 16,223 556,071 572,294 Remaining installment 9,992 - 9,992
Goodwill 12,565 260,923 273,488

(A free translation of the original in Portuguese)
28
December 31, 2014) and net income of R$2,107 on December 31, 2015 (R$6,473 on December 31, 2014)
in the consolidated results of the Company.
3.3. Merged companies
Over the course of 2015 and 2014, the Company merged the net assets, recorded at book value, of
the subsidiaries shown in the table below:
2015
Balance Sheet TOTVS
Agroindústria P2RX
Makira II
Total
Current Assets 3,795 385 47,632 51,812 Non-current assets 403 3 - 406
Long-term assets 13 - - 13
Property, plant and
equipment 157 3 -
160 Intangible assets 233 - - 233
Total assets 4,198 388 47,632 52,218
Current liabilities 1,091 597 172 1,860 Shareholders’ Equity 3,107 (209) 47,460 50,358
Total liabilities 4,198 388 47,632 52,218
2014
Balance Sheet Seventeen TOTVS Sales Total
Current Assets 1,758 14,041 15,799 Non-current assets 252 37,823 38,075
Long-term assets - 722 722 Investments - 590 590
Property, plant and
equipment 248 - 248 Intangible assets 4 36,511 36,515
Total assets 2,010 51,864 53,874
Current liabilities 1,856 12,302 14,15
8 Non-current liabilities 65 584 649
Shareholders’ Equity 89 38,978 39,06
7
Total liabilities 2,010 51,864 53,874
In accordance with the merger protocol approved in the Extraordinary Shareholders Meetings held
on September 3, 2015 for Makira II, December 15, 2015 for TOTVS Agroindústria and P2RX, and October
22, 2014 for Seventeen and TOTVS Sales, the net assets of the subsidiaries were valued by experts who
issued their valuation reports of the companies as on March 31, 2015, September 30, 2015 and August
31, 2014, respectively. Changes to equity after the base date until the effective merger date were
absorbed by TOTVS Sales, relating to Seventeen in 2014, and TOTVS, relating to TOTVS Sales in 2014 and
Makira II, TOTVS Agroindústria and P2RX in 2015.

(A free translation of the original in Portuguese)
29
4. Financial instruments and sensitivity analysis of financial assets and liabilities
4.1. Analysis of financial instruments
Through the information available and using the appropriate valuation methodologies, the
Company and its subsidiaries valued their financial assets and liabilities in relation to market value.
However, the interpretation of market data and the selection of valuation methods require
considerable judgment and estimates to calculate the most appropriate realizable value. Consequently,
the estimates presented do not necessarily show the amounts that may be realized in the market. The
use of different market assumptions and/or methods may have a material effect on the estimated
realizable values.
The table below compares the Company’s financial instruments by class, as presented in its financial
statements:
Fair Value through
profit
Loans and receivables
Held to maturity
Financial liabilities measured at cost
2015
2014 2015
2014 2015
2014 2015
2014
Financial Instruments Assets Cash and cash equivalents - - 426,415 697,901 - - - - Securities - - - - 114,747 105,849 - - Accounts receivable, net - - 530,095 430,324 - - - - Court deposits - - - - 43,407 22,420 - -
Investments at fair value 68,044 46,934 - - - - - - Other assets - - - 59,678 45,370 - - Financial liabilities Loans and Financing - - - - - - 678,309 482,490 Debentures and non-conversion premium - - - - - - 144,286 112,854 Accounts payable and suppliers - - - - - - 346,888 281,603 Other liabilities - - - - - - 12,278 10,265
Total 68,044 46,934 956,510 1,128,225 217,832 173,639 1,181,761 887,212
The fair value of financial assets and liabilities is included in the amount for which the instrument
could be exchanged in a transaction where the parties are willing to negotiate, and not in an enforced
sale or settlement. The methods and assumptions below were used to estimate the fair value:
Securities, trade accounts receivable, trade accounts payable and other short-term liabilities
approximate their respective book values mainly due to the short-term maturities of these
instruments.
Financial assets at fair value not traded in an active market are estimated using a valuation
technique.
Loans and financing and debentures are recognized initially at fair value, net of costs incurred
in the transaction and are subsequently stated at amortized cost.

(A free translation of the original in Portuguese)
30
4.2. Financial assets at fair value
Investments in startups made by the Company, through TOTVS Ventures, have a medium-term
strategy in which the exit is planned for the moment when the expected financial returns are achieved
and, therefore, are recognized as financial instruments. The value of these investments on December 31,
2015 was R$68,044 (R$46,934 on December 31, 2014).
On January 21, 2015, TOTVS Ventures announced the sale of its non-controlling interest in
ZeroPaper.
4.3. Measurement of fair value
It is assumed that the balances of accounts receivable and accounts payable to suppliers at book
value, less loss (impairment) in the case of accounts receivable, approximate their fair values.
The table below presents the Group's consolidated assets and liabilities measured at fair value on
December 31, 2015 and 2014:
2015 2014
Level 1 Level 2 Level 3 Level 1 Level 2 Level 3
Financial Assets Financial investments - 320,607 - - 636,337 -
Financial assets at fair value through profit or loss - - 68,044 - - 46,934
Financial Liabilities
Loans and Financing - 678,309 - - 482,490 -
Debentures 45,384 - 144,286 - - 112,854
There were no transfers between Levels 1 and 2 during the year.
4.4. Sensitivity analysis of financial assets and liabilities
The Company's financial instruments are represented by cash and cash equivalents, accounts
receivable, payables, debentures, loans and financing, and are recorded at cost plus income or charges
incurred and which, on December 31, 2015 and 2014 approximated their market values.
The key risks related to the Company’s operations are related to the variations in the long-term
interest rate (TJLP) and the extended consumer price index (IPCA) for funding from the Brazilian
Development Bank (BNDES), and for the debentures issued, and the variation of the overnight interest
rate (CDI) for financial investments.
Investments at fair value through profit or loss relate to startups privately held and which do not
have quoted prices in an active market. The fair values of these investments are measured by a valuation
technique or multiple valuation techniques employed by the market considering the reasonableness the
range of values shown by them. The fair value measurement is the point within that range that best
represents the fair value in the circumstances. Additionally, the biggest investment – GoodData - refers

(A free translation of the original in Portuguese)
31
to the D Series preferred shares, which have preference in case of liquidation.
To check the sensitivity of indexes for the financial investments that the Company was exposed to
on December 31, 2015, three different scenarios were created. Based on the forecast by financial
institutions, we arrived at CDI forecast of 14.13% for December 2015 and which was defined as the
probable scenario (scenario I). From this rate, we calculated variations of 25% (scenario II) and 50%
(scenario III).
For each of these scenarios the “gross financial revenue” was estimated, without including taxes
on investment yields. The reference date for the portfolio was December 31, 2015, with a one-year
projection to check the sensitivity of CDI to each scenario.
Operation Balances in 2015 Risk Probable
Scenario (I) Scenario (II) Scenario
(III)
Reduction
Financial investments R$ 320,607 CDI 14.13% 10.60% 7.07%
Financial income R$ 45,302 R$ 33,984 R$ 22,667
To check the sensitivity of the indexes to which the Company is exposed when estimating the debts
as on December 31, 2015, three different scenarios were created. Based on TJLP and the IPCA rates in
force on December 31, 2015, the most probable scenario (scenario I) was determined for 2016 and, from
this, variations of 25% (scenario II) and 50% (scenario III) were calculated.
For each scenario, the gross financial expense was calculated, not taking into account the tax and
the maturity flow for each agreement scheduled for 2015. The reference date used for the financing and
debentures was December 31, 2015, projecting the rates for one year and checking their sensitivity in
each scenario.
Operation Balances in 2015 Risk
Probable Scenario (I) Scenario (II)
Scenario (III)
Increase BNDES - Financing R$602,520 TJLP (a) 7.00% 8.75% 10.50%
R$2,380 UMBND(b) 45.00% 56.25% 67.50% Estimated finance expense R$43,247 R$54,059 R$64,871
Increase Debentures R$98,902 TJLP (a) 7.00% 8.75% 10.50%
IPCA (c) 10.67% 13.34% 16.01%
R$45,384 CDI (d) 14.13% 17.66% 21.20%
Estimated finance expense R$25,391 R$28,411 R$31,431
(a) Long-term Interest Rate (b) UMBND – BNDES monetary unit. (c) Brazil’s Extended Consumer Price Index (d) Interbank Deposit Certificate

(A free translation of the original in Portuguese)
32
4.5. Financial risk management
The main market risks to which the Company and its subsidiaries are exposed when conducting
their activities are:
a. Liquidity Risk
The Company’s and its subsidiaries’ liquidity and cash flow controls are monitored on a daily basis
by the Company’s management in order to ensure that cash flow from operations and funding, when
necessary, are sufficient to meet their cash commitment schedule, not generating liquidity risks for the
Company and its subsidiaries.
The table below analyzes non-derivative financial liabilities of the Company, by maturity
corresponding to the remaining period between the balance sheet date and the contractual maturity date.
The amounts disclosed in the table represent the contractual undiscounted cash flows.
Consolidated
Less than one year
Between
one and two years (i)
Between
two and five years (i)
Over five years (i)
On December 31, 2015 Suppliers 86,932 - - -
Loans and Financing 177,514 177,316 327,246 - Debentures 61,915 40,707 51,338 - Liabilities from investment acquisition 82,220 41,258 48,460 - Other liabilities 8,563 - - - On December 31, 2014 Suppliers 35,479 - - -
Loans and Financing 25,314 119,412 337,764 - Debentures 33,834 48,002 31,018 - Liabilities from investment acquisition 51,499 78,260 10,723 - Other liabilities 2,707 - - -
(i) As the amounts included in the table represent undiscounted cash flows, these amounts
will not be reconciled with the amounts reported in the balance sheet for loans, derivative
financial instruments, suppliers and other obligations.
b. Credit risk
Credit risk is the risk that the counterparty in a deal will not fulfill an obligation set forth in a financial
instrument or contract with a client, which would cause a financial loss.
Regarding the credit risk associated with financial institutions, the Company and its subsidiaries
distribute this exposure among financial institutions with risk ratings of at least BBB.
The credit risk related to services rendered and sale of licenses and hardware is minimized by strict
control of the customer base and active delinquency management through clear policies on provision of
services and sale of licenses and hardware. The subsidiary Bematech operates with distribution

(A free translation of the original in Portuguese)
33
agreements and currently concentrates its distribution in a single logistics distributor, with a low credit
risk. On December 31, 2015, 6.6% of consolidated accounts receivable pertained to distributors.
c. Market risk
i) Interest rate and inflation risk: interest rate risk arises from the portion of the debt related to
TJLP, IPCA and financial investments in CDI, which can adversely affect the financial income or expenses
in the event of unfavorable changes in the interest rate and inflation.
ii) Exchange rate risk: this risk arises from the possibility of losses due to exchange rate fluctuations
that could increase the liabilities resulting from loans and foreign currency purchase commitments or that
could reduce the assets resulting from trade accounts receivable in foreign currency.
The Company and its subsidiaries do not have currency hedge instruments since they do not have
any significant operations denominated in foreign currencies.
d. Investments at fair value through profit and loss
Investments at fair value through profit or loss consist of startup companies whose success depends
on product development, market acceptance, operational efficiency, ability of investee companies to raise
additional funds in financial markets that can be volatile, and other key business factors.
Startup companies could fail or not be able to raise additional funds when needed, or may receive
lower ratings than in previous investments. These events could cause our investments to become
impaired. In addition, market volatility could negatively affect our ability to realize our investments
through liquidity events such as initial public offerings, mergers, and private sales.
e. Derivatives
The Company and its subsidiaries do not maintain derivative operations in the reported periods.
4.6. Capital management
The Company’s capital management aims to ensure a strong credit rating with institutions and an
excellent capital ratio in order to drive the Company’s businesses and maximize value for shareholders.
TOTVS controls its capital structure by adjusting itself to current economic conditions. To maintain
this structure, the Company may pay dividends, repurchase shares, take out new loans, issue debentures
or promissory notes and contract operations with derivatives.
The Company’s net debt structure includes loans, financing and debentures, less cash and cash
equivalents.

(A free translation of the original in Portuguese)
34
Parent Company Consolidated
2015 2014 2015 2014
Loans and financing and debentures and leasing 734,077 594,828 822,595 595,344
Liabilities due to acquisitions of investments 71,557 78,463 170,492 140,482
(-) Cash and cash equivalents (314,405) (659,236) (426,415) (697,901)
(-) Securities (46,268) (48,831) (114,747) (105,849)
Net debt 444,961 (34,776) 451,925 (67,924)
Equity 1,237,686 1,116,374 1,237,732 1,118,062
Equity and debt 1,682,647 1,081,598 1,689,657 1,050,138
5. Cash and cash equivalents
Cash and cash equivalents are maintained for the purpose of meeting short-term cash requirements
to the Company’s strategic investments, as well as other purposes. The Company's cash equivalents
include financial investments in CDB (Interbank Deposit Certificates) and repurchase agreements, which
are redeemable in a period of up to 90 days from the date of the respective transactions. Parent Company Consolidated
2015 2014 2015 2014
Cash equivalents 57,930 32,518 105,808 61,564
Cash and cash equivalents 256,475 626,718 320,607 636,337
Repurchase agreements 183,897 618,429 147,714 598,649
CDB 72,578 8,289 172,893 37,688
314,405 659,236 426,415 697,901
The Company has financial investment policies, which establish that the investments focus on low
risk securities and investments in top-tier financial institutions, and are significantly remunerated based
on CDI variation, which averaged 1.04% a month during the year ended December 31, 2015.
6. Trade accounts receivable
The following are the amounts receivable in domestic and foreign markets:
Parent Company Consolidated
2015 2014 2015 2014
Domestic market 439,241 440,240 579,125 478,776 Foreign market 1,185 - 26,830 10,412
Gross trade accounts receivable 440,426 440,240 605,955 489,188 (-) allowances for doubtful accounts (56,551) (53,652) (75,860) (58,864)
Net trade accounts receivable 383,875 386,588 530,095 430,324
Current assets 345,199 347,177 489,142 389,496 Non-current assets 38,676 39,411 40,953 40,828
The accounts receivable from the foreign market mainly refers to sales of the Company´s foreign
subsidiaries in Argentina: R$8,228; Mexico: R$6,458, USA: R$5,473 (In 2014 Argentina: R$6,362; Mexico:

(A free translation of the original in Portuguese)
35
R$3,837; and USA: R$213), converted using the end of period rate.
Below are the receivables in connection with the net amount of allowance for doubtful accounts
by aging list on December 31, 2015 and 2014:
Parent Company Consolidated
2015 2014 2015 2014
Falling due 348,071 357,106 475,821 388,213
Overdue
1 to 30 days 19,949 13,168 30,226 17,508
31 to 60 days 5,492 5,417 8,076 9,299
61 to 90 days 5,347 4,430 6,899 6,716
91 to 180 days 7,069 5,891 10,346 7,189
181 to 360 days 16,413 15,317 34,078 17,720
more than 360 days 38,085 38,911 40,509 42,543
Gross accounts receivable 440,426 440,240 605,955 489,188
(-) Allowance for doubtful accounts (56,551) (53,652) (75,860) (58,864)
Net accounts receivable 383,875 386,588 530,095 430,324
Changes in the allowance for doubtful accounts are as follows:
Parent Company Consolidated 2015 2014 2015 2014 Balance at the beginning of the year 53,652 34,639 58,864 39,765
Acquisition of subsidiary - - 15,082 -
Additional provision in the year 30,192 24,297 34,562 27,565
Written off from the provision: (27,293) (5,284) (32,648) (8,466)
Balance on December 31, 2015 56,551 53,652 75,860 58,864
Management believes that the risk related to trade accounts receivable is minimized by the fact
that the Company’s customer portfolio is highly diluted, except for accounts receivable from distributors
of Bematech, as mentioned in Note 4.5(b). The Company does not require any guarantee on installment
sales.
7. Stocks The breakdown of stocks of Bematech on December 31, 2015 is as follows:
Consolidated Consolidated 2015 2014
Finished products 15,305 - Raw material 22,924 - Products for resale and others 6,190 - Parts for technical assistance 2,536 - (-) Provision for adjustment to realization
value
(2,548) - 44,407 -

(A free translation of the original in Portuguese)
36
8. Taxes recoverable Parent Company Consolidated 2015 2014 2015 2014
State Goods and Services Tax (ICMS) (a) - -
47,972 -
Tax on manufactured products (IPI) - - 3,413 -
Withholding income tax 21,273 277 33,157 33,157
2,566
Withholding social contribution tax 6,399 156 8,057 1,186
Withholding PIS and COFINS taxes - 40 3,612 283
Other 1 - 2,954 2,301
27,673 473 99,165 6,336
Current 27,673 473 81,284 6,336
Non-current - - 17,881 -
(a) Bematech uses ICMS tax benefit for investments granted by the state of Paraná, which aim to foster the development of
technological products, provided the requirements included in the Federal Law are met, especially regarding research and development expenditure. There is the concession of ICMS presumed credit equivalent to the amount due on the outflow of products and, starting from September 1, 2015, is limited to the ICMS debit amount of the respective period, pursuant to Decree 2,175/2015 of the State of Paraná. Although recent changes in Paraná State laws contributed to the reduction in the accumulated ICMS credits, the Company and its subsidiary are conducting studies jointly with their legal counsel to realize these credits.
9. Income and social contribution taxes
Income and social contribution taxes, current and deferred, were recorded pursuant to the current
rates in force. Deferred income tax and social contribution are calculated over temporary differences and
accrued tax losses/negative social contribution base.
9.1. Reconciliation of income and social contribution tax expenses
The reconciliation of expenses calculated by applying the Income and Social Contribution Tax rates
is as follows: Parent Company Consolidated
2015 2014 2015 2014
Income before taxes 236,674 354,868 254,834 360,258 Income and social contribution taxes at combined nominal rate of
34% (80,469) (120,655) (86,644) (122,488) Adjustments for the statement of effective rate
Equity pick-up 3,359 133 (26) (198) Law No. 11,196/05 (Incentive for research and development) (a) 16,567 15,946 17,501 16,838 Effect of subsidiaries subject to special rates - - (10,178) (4,488) Interest on equity 20,575 14,040 20,575 14,040 Management stake (352) (76) (363) (91) Accounts receivable deemed uncollectible (146) (145) (426) (230) Workers' Food Program 845 1,578 1,185 1,593 Stock Options (535) (1,843) (535) (1,843) Other (989) (886) (977) (593)
Income tax and social contribution expense (41,145) (91,908) (59,888) (97,460)
Current income tax and social contribution (47,025) (88,122) (69,250) (96,957) Deferred income tax and social contribution 5,880 (3,786) 9,362 (503)
Effective rate 17.4% 25.9% 23.5% 27.1%

(A free translation of the original in Portuguese)
37
a) The Brazilian tax legislation provide a mechanism to encourage the technological development of the
country, which granted tax incentives to companies that carry out technological research and
development (R&D). On September 30,2105 was publishet the Provisional Presidential Decree 694, which
sougth to suspend in fiscal year 2016 the benefit envisaged in Law. However, this provisional expired on
8 March 2016 for not being voted upon by the Senate by said date, and new provisional can be edited by
the Executive Power.
9.2. Breakdown of deferred income and social contribution taxes
Parent Company Consolidated
2015 2014 2015 2014
Deriving from temporary differences:
Difference between fiscal base and book value
from goodwill 117,789 77,012 139,130 95,453 Amortization of fiscal benefit (63,136) (55,334) (89,744) (55,511) Intangible asset allocation (97,784) (58,705) (114,762) (71,077) Provision for commissions 18,144 19,744 19,133 20,590 Anticipated income or revenues (5,542) (4,835) (4,599) (3,869) Allowance for doubtful accounts 19,227 18,242 20,317 19,375 Provision for contingencies and other liabilities 23,933 3,690 30,764 3,686 Provision for losses in inventories and guarantees - - 2,541 - Tax losses and social contribution tax losses
carried forwards - - 53,794 26,075 Provision for premiums due to non-conversion of
debentures - 10,546 - 10,546 Present value adjustment 1,802 2,520 2,592 2,523 Other 2,521 9,164 4,341 9,734
Net deferred income and social contribution tax 16,954 22,044 63,507 57,525
The net deferred income tax and social contribution of the Company and its subsidiaries are
presented under non-current assets.
Below is the description of deferred income tax and social contribution:
Parent
Company Consolidated
On January 1 22,044 57,525 Expense in income statement 5,880 9,362
Tax related to other comprehensive income (10,972) (10,972)
Acquisition of subsidiary - 7,497 Other 2 95
On December 31, 2015 16,954 63,507

(A free translation of the original in Portuguese)
38
9.3. Estimated realization of deferred taxes
Based on projections of taxable income from future years approved by the Board of Directors on
December 31, 2015, the Company expects to recover tax credits recorded in non-current assets in the
following years:
Parent Company Consolidated
2016 31,981 42,653 2017 4,932 19,353 2018 12,034 26,123 2019 12,670 26,643 2020 onwards 18,473 38,479
80,090 153,251
Tax benefit of goodwill (a) (63,136) (89,744)
Deferred tax assets, net 16,954 63,507
(a) Refers to the amount of the tax benefit amortized without established timeframe for realization, since this will be done only through the sale or write-off of Investments that generated said tax benefit.
During the year ended December 31, 2015, no material event occurred that indicates a limitation
on the full recovery of deferred taxes recognized within 10 years.
10. Related-party balances and transactions
Transactions between the Parent Company and its subsidiaries are carried out under market
conditions and prices established by the parties, and are eliminated for the purposes of consolidating the
financial statements.
10.1. Transactions with subsidiaries and associate companies
On December 31, 2015 and 2014, the balance of transactions with related parties classified as
related companies in non-current assets and liabilities were:
Parent Company
ASSETS 2015 2014
TOTVS Nordeste - 211
TOTVS Brasília 1,921
TOTVS RO 32 -
Ciashop 1,550 1,134
PC Sistemas 119 -
3,622 1,345
LIABILITIES
TOTVS Serviços (5,435) (6,599)
TQTVD (2,278) (1,717)
TOTVS Nordeste (2,808) -
TOTVS Ventures (4,502) -
TOTVS Brasília - (4,900)
(15,023) (13,216)

(A free translation of the original in Portuguese)
39
The amounts refer to accounts payable and receivable among subsidiaries, without remuneration
and/or forecast maturity. There was no purchase and sale or provision of services between the
subsidiaries and the parent company. Credits are related to loan transactions.
10.2. Transactions or relationships with shareholders and key management personnel
a) Shareholders
The Company maintains property lease agreements with companies, some of which are owned by
shareholders of TOTVS. Rental paid was R$8,352 for the year ended December 31, 2015 (R$7,944 for the
year ended December 31, 2014), in line with market rates. The agreements are effective for 60 months
and are adjusted by IGP-M (General Price Index – Market) every 12 months. Additionally, the Company
entered into an agreement in 2013 to build the new headquarters for delivery in March 2017 confome
mentioned in Note 23.2.
Some Company Officers directly or indirectly hold 17.4% of the Company’s shares on December 31,
2015 (17.7% on December 31, 2014), and the indirect interest is held through LC-EH Empreendimentos e
Participações S.A.
The Company also has loans and financing operations (Note 15) and debentures (Note 16),
substantially with the BNDES, which held 4.49% of the Company’s capital on December 31, 2015 (Note
19), plus a member of Board of Directors.
b) Key management personnel
Itaú Unibanco is a related party of the Company through one of the independent members on the
Board of Directors. On December 31, 2015, the amounts and transactions involving the Itaú Unibanco
Group companies, which were conducted under usual market conditions, include the following:
Parent Company
Nature of transaction 2015 2014
Financial investments 29,156 68,957
Revenue from assignment of use rights and technical support 12,841 7,263
Partnership with Rede S.A. (a) 1,500 -
Other revenues 2,782 -
Other expenses 1,095 1,136
47,374 77,356
(a) On February 24, 2015, the Company signed a commercial partnership agreement with Rede S.A., a payments
company belonging to the Itaú Group, to offer a complete solution encompassing management. e-commerce and automation of stores and payment methods targeted at micro and small companies.
The Company has an agreement, for no consideration, relating to the management of the pension
plan with Itaú Vida e Previdência S.A.

(A free translation of the original in Portuguese)
40
10.3. Management fees
Expenses related to fees of managers of the Company and subsidiaries are summarized below:
Parent Company Consolidated
2015 2014 2015 2014
Short-term benefits to managers Salaries, fees and payroll charges 14,990 13,578 18,978 19,456 Private pension plan 459 417 483 417 Variable bonus 1,036 224 1,220 756
16,485 14,219 20,681 20,629 Share-based payments (Note 21) 2,795 5,420 2,795 5,420
19,280 19,639 23,476 26,049
The Company does not have any additional post-employment liabilities, nor does it provide other
long-term benefits, such as paid leave based on years of service and other benefits for years of service at
the Company. It also does not provide other benefits when members of its management quit, in addition
to those established by Brazilian laws.
11. Investments
The breakdown of investments in subsidiaries is shown below:
Summarized financial statements of affiliate companies and subsidiaries on December 31, 2015
Equity pick-up (parent Company) for years ended:
Balance of investments as of:
Assets Liabilities Net Equity Gross
Revenue P&L for the year 2015 2014 2015 2014
TOTVS Serviços 15,420 (5,210) 20,630 21,089 7,659 7,659 9,202 20,629 24,934 TOTVS Nordeste 100,278 27,661 72,617 8,575 3,982 3,982 (3,051) 72,618 68,092 TOTVS Brasília 151,658 34,120 117,538 5,535 6,197 6,197 2,662 117,538 111,341 TOTVS Argentina 15,561 4,567 10,994 27,240 15 15 1,075 10,994 8,632 TOTVS México 9,224 8,271 953 13,941 (11,381) (11,381) (7,339) 953 - EuroTOTVS - - - - - - (32) - 316 TQTVD 16,215 (652) 16,867 12,995 2,045 2,045 1,458 16,868 14,823 TOTVS Inc. 80,623 252 80,371 218 (8,924) (8,924) (6,944) 80,370 57,360 Datasul Argentina 325 - 325 - (11) (11) (70) 325 338 TOTVS Agroindústria (b) - - - 12,255 (1,299) (865) 209 - 2,241 P2RX (b) - - - 2,413 (1,903) (1,910) 220 - 411 TOTVS Sales (a) - - - - - - (1,640) - Seventeen (a) - - - - - - (824) - - TOTVS RO 4,316 2,571 1,745 20,190 1,735 1,735 - 1,745 - TOTVS Ventures 6,629 (4,501) 11,130 - 5,550 5,550 (2,205) 11,130 6,120 Ciashop (c) (d) 2,375 3,208 (833) 8,875 (565) (2,284) (2,175) 10,117 14,541
Virtual Age (c) (d) 16,751 4,218 12,533 40,848 3,510 (5,586) 7,957 77,476 83,062
Neolog (c) (d) 2,068 1,328 740 6,935 30 (1,868) - 24,319 -
Makira II (b) (c) - - - - 581 581 - - -
Bematech (c) (d) 672,091 216,915 455,176 94,673 2,076 437 - 556,391 -
(4,628) (1,497) 1,001,473 392,211
(a) Companies merged in 2014.
(b) Companies merged during 2015, see note 3.3.
(c) Business combinations in 2015 and 2014, see note 3.1.

(A free translation of the original in Portuguese)
41
(d) Goodwill from acquired companies is recorded under Investments in the parent company's profit or loss. The difference between the results from acquired companies and equity pick-up refers to the amortization of intangible assets in the determination of fair value of assets of the respective acquired companies.
2013 Addition Business
Combination Equity Pick-
up Foreign
Exchange Merger
Dividends Reclassifi-
cation 2014
TOTVS Serviços 15,732 - - 9,202 - - - - 24,934 TOTVS Nordeste 67,043 4,100 - (3,051) - - - - 68,092 TOTVS Brasília 92,129 16,550 - 2,662 - - - - 111,341 TQTVD 20,938 (7,573) - 1,458 - - - - 14,823 TOTVS Argentina 7,100 1,622 - 1,075 (1,165) - - - 8,632 TOTVS México 987 9,468 - (7,339) (3,222) - - 106 - TOTVS Inc. 41,973 15,194 - (6,944) 7,137 - - - 57,360 EuroTOTVS 348 - - (32) - - - - 316 Datasul Argentina 508 - - (70) (100) - - - 338 TOTVS Ventures 7,504 821 - (2,205) - - - - 6,120 TOTVS Sales 8,332 31,550 - (1,640) - (38,242) - - - TOTVS Agroindústria 3,075 - - 209 - - (540) (503) 2,241 P2RX 251 - - 220 - - (60) - 411 Virtual Age - 1,066 74,039 7,957 - - - - 83,062 Ciashop - 98 16,430 (2,175) - - - 188 14,541 Seventeen - - - (824) - 824 - - -
Sum of Investments 265,920 72,896 90,469 (1,497) 2,650 (37,418) (600) (209) 392,211
Ciashop - - - - - - - (188) (188) TOTVS México - - - - - - - (106) (106)
Sum of provision for losses - - - - - - - (294) (294)
Total Investments 265,920 72,896 90,469 (1,497) 2,650 (37,418) (600) (503) 391,917
2014
Addition (Write-
off) Business
Combination Dividends Equity Pick-
up Foreign
Exchange Merger Reclassifi
cation 2015
TOTVS Serviços 24,934 - - (11,964) 7,659 - - - 20,629 TOTVS Nordeste 68,092 544 - - 3,982 - - - 72,618 TOTVS Brasília 111,341 - - - 6,197 - - - 117,538 TOTVS Argentina 8,632 1,262 - - 15 1,085 - - 10,994 TOTVS México - 8,065 - - (11,381) 4,375 - (106) 953 EuroTOTVS 316 (334) - - - 18 - - -
TQTVD 14,823 - - - 2,045 - - - 16,868
TOTVS Inc. 57,360 5,022 - - (8,924) 26,912 - - 80,370 Datasul Argentina 338 - - - (11) (2) - - 325 TOTVS Agroindústria 2,241 2,806 - (271) (865) - (3,911) - - P2RX 411 1,456 - (209) (1,910) - 252 - - TOTVS RO - 10 - - 1,735 - - - 1,745 TOTVS Ventures 6,120 2,015 - (2,555) 5,550 - - - 11,130 Ciashop 14,541 - (2,536) - (2,284) - - 396 10,117 Virtual Age 83,062 - - - (5,586) - - - 77,476 Neolog - - 26,215 (28) (1,868) - - - 24,319 Makira II - 46,880 - - 581 - (47,461) - - Bematech - - 556,071 - 437 (117) - - 556,391
Sum of Investments 392,211 67,726 579,750 (15,027) (4,628) 32,271 (51,120) 290 1,001,473
TOTVS México (106) - - - - - - 106 - Ciashop (188) - - - - - - (396) (584)
Sum of provision for losses (294) - - - - - - (290) (584)
Total Investments 391,917 67,726 579,750 (15,027) (4,628) 32,271 (51,120) - 1,000,889

(A free translation of the original in Portuguese)
42
12. Property, plant and equipment
Property, plant and equipment of the Company are booked at the acquisition cost and depreciation of assets is calculated according to the
straight-line method, and takes into consideration the estimated useful economic life of assets. The breakdown of the Company’s property, plant
and equipment is shown below:
Parent Company
Computers and
software
Vehicles
Furniture and
Fixtures
Facilities
machinery and
equipment Others
Total Property,
plants and
equipment
Cost or valuation Balance on December 31, 2013 76,479 6,652 11,021 13,695 21,578 129,425 Additions 13,338 1,408 1,595 1,782 7,490 25,613 Write-off (1,055) (2,012) (69) 12 (41) (3,165)
Balance on December 31, 2014 88,762 6,048 12,547 15,489 29,027 151,873
Additions 25,905 3,325 553 300 11,960 42,043 Merger 85 - - 24 - 109 Write-off (1,907) (2,415) (133) (13) (1,837) (6,305)
Balance on December 31, 2015 112,845 6,958 12,967 15,800 39,150 187,720
Depreciation Balance on December 31, 2013 (48,084) (1,825) (5,111) (4,863) (9,149) (69,032) Depreciation in the year (10,826) (1,261) (1,045) (1,309) (3,572) (18,013) Write-off 1,017 920 10 (25) (26) 1,896
Balance on December 31, 2014 (57,893) (2,166) (6,146) (6,197) (12,747) (85,149)
Depreciation in the year (13,092) (1,363) (1,089) (1,398) (4,309) (21,251) Write-off 1,808 1,424 119 2 1,562 4,915
Balance on December 31, 2015 (69,177) (2,105) (7,116) (7,593) (15,494) (101,485)
Residual value
Balance on December 31, 2015 43,668 4,853 5,851 8,207 23,656 86,235
Balance on December 31, 2014 30,869 3,882 6,401 9,292 16,280 66,724
Average annual depreciation rate 20% 20% 10% 10% to 20% 5% to 47%

(A free translation of the original in Portuguese)
43
Consolidated
Computers and
software Vehicles
Furniture and
Fixtures
Facilities
machinery and
equipment Others
Total Property,
plants and
equipment
Cost or valuation
Balance on December 31, 2013 85,060 8,141 13,386 15,061 24,635 146,283 Additions 15,573 1,649 2,050 2,293 8,844 30,409 Acquisition of subsidiary 254 219 167 66 112 818 Write-off (2,208) (2,381) (384) (157) (358) (5,488) Exchange variation 1,742 370 533 769 288 3,702
Balance on December 31, 2014 100,421 7,998 15,752 18,032 33,521 175,724
Additions 27,525 4,363 1,225 1,024 13,387 47,524 Acquisition of subsidiary 5,123 128 1,709 6,143 1,691 14,794 Write-off (2,716) (2,608) (243) (638) (2,552) (8,757) Exchange variation 826 156 200 92 284 1,558
Balance on December 31, 2015 131,179 10,037
- 18,643
- 24,653
- 46,331 230,843
Depreciation Balance on December 31, 2013 (52,636) (2,262) (5,881) (5,186) (9,644) (75,609) Depreciation in the year (12,706) (1,615) (1,368) (1,569) (4,571) (21,829) Write-off 2,057 1,085 190 94 292 3,718 Exchange variation (1,548) (177) (382) (558) (218) (2,883)
Balance on December 31, 2014 (64,833) (2,969) (7,441) (7,219) (14,141) (96,603)
Depreciation in the year (15,446) (1,862) (1,546) (2,180) (5,390) (26,424) Write-off 2,441 1,536 214 46 2,212 6,449 Exchange variation (402) (70) (100) (38) (57) (667)
Balance on December 31, 2015 (78,240) (3,365) (8,873) (9,391) (17,376) (117,245)
Residual value
Balance on December 31, 2015 52,939 6,672 9,770 15,262 28,955 113,598
Balance on December 31, 2014 35,588 5,029 8,311 10,813 19,380 79,121
Average annual depreciation rate 20% 20% 10% 10% to 20% 5% to 47%

(A free translation of the original in Portuguese)
44
13. Intangible assets
Intangible assets acquired separately are measured at cost at the time of their initial recognition, whereas the cost of intangible assets
acquired in a business combination corresponds to the fair value on the date of acquisition. Intangible assets and changes in this account are as
follows:
Parent Company
Software
Trademarks
& patents
Customer
portfolio Other Goodwill
Total
Intangible
assets
Cost or valuation Balance on December 31, 2013 189,080 63,149 207,586 15,080 353,726 828,621
Additions 6,957 - 21 - - 6,978
Merger - - - - 15,463 15,463
Allocation on intangible assets - - 1,362 1,257 (1,164) 1,455
Write-off 32 - - - - 32
Balance on December 31, 2014 196,069 63,149 208,969 16,337 368,025 852,549
Additions 41,039 - - - - 41,039 Merger 188 - - - - 188
Reclassification - - - - (134,214) (134,214)
Balance on December 31, 2015 237,296 63,149 208,969 16,337 233,811 759,562
Amortization Balance on December 31, 2013 (98,247) (22,818) (113,031) (11,608) (134,214) (379,918)
Amortization in the year (22,064) (4,201) (23,082) (1,889) - (51,236)
Write-off (17) (1) - 1 - (17)
Balance on December 31, 2014 (120,328) (27,020) (136,113) (13,496) (134,214) (431,171)
Amortization in the year (22,154) (4,201) (21,634) (1,654) - (49,643) Reclassification - - - - 134,214 134,214
Balance on December 31, 2015 (142,482) (31,221) (157,747) (15,150) - (346,600)
Residual value Balances on December 31, 2015 94,814 31,928 51,222 1,187 233,811 412,962
Balances on December 31, 2014 75,741 36,129 72,856 2,841 233,811 421,378
Average annual amortization rates 10% to 20% 6.7% to 8% 10% to 12.5% 10% to 50%

(A free translation of the original in Portuguese)
45
Consolidated
Software
Trademarks & patents
Customer portfolio Other Goodwill
Total intangible assets
Cost or valuation Balance on December 31, 2013 200,683 66,760 219,391 40,306 508,677 1,035,817 Additions 7,299 - 21 - 90,469 97,789 Allocation of intangible assets 6,989 7,806 16,723 3,864 (46,153) (10,771) Acquisition of subsidiary 694 - - - - 694 Write-off (39) - - - (1,624) (1,663) Exchange variations 1,061 4 (64) 834 - 1,835
Balance on December 31, 2014 216,687 74,570 236,071 45,004 551,369 1,123,701
Additions 43,048 148 - 3 414,216 457,415 Allocation of intangible assets 30,949 20,597 113,275 3,449 (168,270) - Acquisition of subsidiary 53,446 5,031 11,561 - - 70,038 Write-off (1,759) (3) - 721 (3,973) (5,014) Reclassification - - - - (134,299) (134,299) Exchange variations 388 71 (12) 444 - 891
Balance on December 31, 2015 342,759 100,414 360,895 49,621 659,043 1,512,732
Amortization Balance on December 31, 2013 (101,584) (24,020) (117,502) (26,505) (134,299) (403,910) Amortizations for the year (25,828) (7,434) (26,790) (7,047) - (67,099) Write-off 52 - - - - 52 Exchange variations (371) (2) 47 (332) - (658)
Balance on December 31, 2014 (127,731) (31,456) (144,245) (33,884) (134,299) (471,615)
Amortizations for the year (35,112) (7,356) (27,500) (7,268) - (77,236) Write-off 1,090 3 - (238) - 855 Reclassification - - - - 134,299 134,299 Exchange variations (19) (18) 12 2 - (23)
Balance on December 31, 2015 (161,772) (38,827) (171,733) (41,388) - (413,720)
Residual value
Balance on December 31, 2015 180,987 61,587 189,162 8,233 659,043 1,099,012
Balance on December 31, 2014 88,956 43,114 91,826 11,120 417,070 652,086
Average annual amortization rate 10% to 20% 6.7% to 8.00% 10% to 12.5% 20% to 50%

The amortization of intangible assets is based on their estimated useful lives. Intangible assets identified,
the amounts recognized and useful lives of assets resulting from a business combination are based on a technical
study by an independent specialized Company.
The “Other” column in the table above consists basically of non-competition rights arising from the
allocation of the purchase price of business combinations in 2015 and 2014 (see Note 3.2) and also the rights to
explore areas.
13.1. Goodwill and intangible assets identified in business combinations The breakdown and addition/write-off of goodwill in the fiscal years ended December 31, 2015 and 2014
is shown below:
2013
Addition /(write-
off)
Purchase price
allocation 2014 Addition
/(write-off)
Purchase price
allocation 2015
RM 90,992 - - 90,992 - - 90,992 Logo Center 5,703 - - 5,703 - - 5,703 TOTVS BMI 2,053 - - 2,053 - - 2,053 Midbyte 1,765 - - 1,765 - - 1,765 IOSSTS 2,643 - - 2,643 - - 2,643 BCS 11,821 - - 11,821 - - 11,821 Datasul 30,084 - - 30,084 - - 30,084 Setware 961 - - 961 - - 961 Hery 2,927 - - 2,927 - - 2,927 TotalBanco 6,008 - - 6,008 - - 6,008 M2S 12 - - 12 - - 12 SRC 33,688 - - 33,688 - - 33,688 Mafipa 1,195 - - 1,195 - - 1,195 Gens FDES 16,340 - - 16,340 - - 16,340 W&D 73,678 - (9,608) 64,070 - - 64,070 uMov.me (c) 3,061 (1,624) - 1,437 (1,437) - - TOTVS Agroindústria 14,291 - (1,163) 13,128 - - 13,128 RMS 59,074 - (23,334) 35,740 - - 35,740 Seventeen 18,082 - (2,619) 15,463 - - 15,463 Ciashop (a) - 16,430 (9,429) 7,001 (2,536) - 4,465 Virtual Age (a) - 74,039 - 74,039 - (27,542) 46,497 Neolog (b) - - - - 25,760 (13,195) 12,565 Bematech (b) - - - - 388,456 (127,533) 260,923
374,378 88,845 (46,153) 417,070 410,243 (168,270) 659,043
(a) Business combination 2014. (b) Business combination 2015, see note 3. (c) Write-off of goodwill due to impairment in 2014 and due to the sale of interest in the company in 2015.

(A free translation of the original in Portuguese)
47
13.2. Test for impairment of assets
The Company assesses the recoverable book value of goodwill by employing the “value in use” concept
through discounted cash flow models for cash generating units, representing the group of tangible and intangible
assets used in the development and sale of different solutions to its customers.
Cash generating units are composed of assets acquired but not merged and differing operations. In 2015,
cash generating units valued were: TQTVD, TOTVS Argentina and Mexico, PC Informática, Ciashop, RMS, Neolog
and Virtual Age.
Assumptions on cash flow increase and future cash flow projections are based on the Company’s business
plans, approved annually by management, as well as comparable market information, and represent
Management’s best estimates of the economic conditions that will exist during the useful life of these assets for
different cash generating units. Future cash flows were discounted based on the representative rate of cost of
capital.
In keeping with the economic valuation techniques, value in use is determined over a five year period and
from them, taking into account the perpetuity of assumptions in view of the capacity of business continuity
indefinitely.
Growth rates used to extrapolate projections as of December 31, 2015, in addition to the five year period
ranged from 0% to 2%. Estimated future cash flows were discounted at rates ranging from 8.6% to 9.2% p.a. (in
real terms) for each cash generating unit analyzed.
The main assumptions used in the value in use estimate are:
• Revenues – revenues were projected between 2016 and 2020, taking into account the growth of the
customer bases of different cash generating units.
• Operating costs and expenses – costs and expenses were projected in line with the Company’s historical
performance and the historical growth of revenues.
• Capex – investments in capital goods were estimated taking into account the technological infrastructure
required to deliver services, based on the Company’s history.
Key assumptions were based on the Company’s historical performance and reasonable macroeconomic
assumptions, and on financial market projections, documented and approved by the Company’s management.
The Company’s impairment testing of intangible assets, carried out annually, resulted in the provision for
losses of R$2,536 referring to goodwill from subsidiary Ciashop in the year ended December 31, 2015, since the
estimated market value was lower than its net book value on the valuation date.
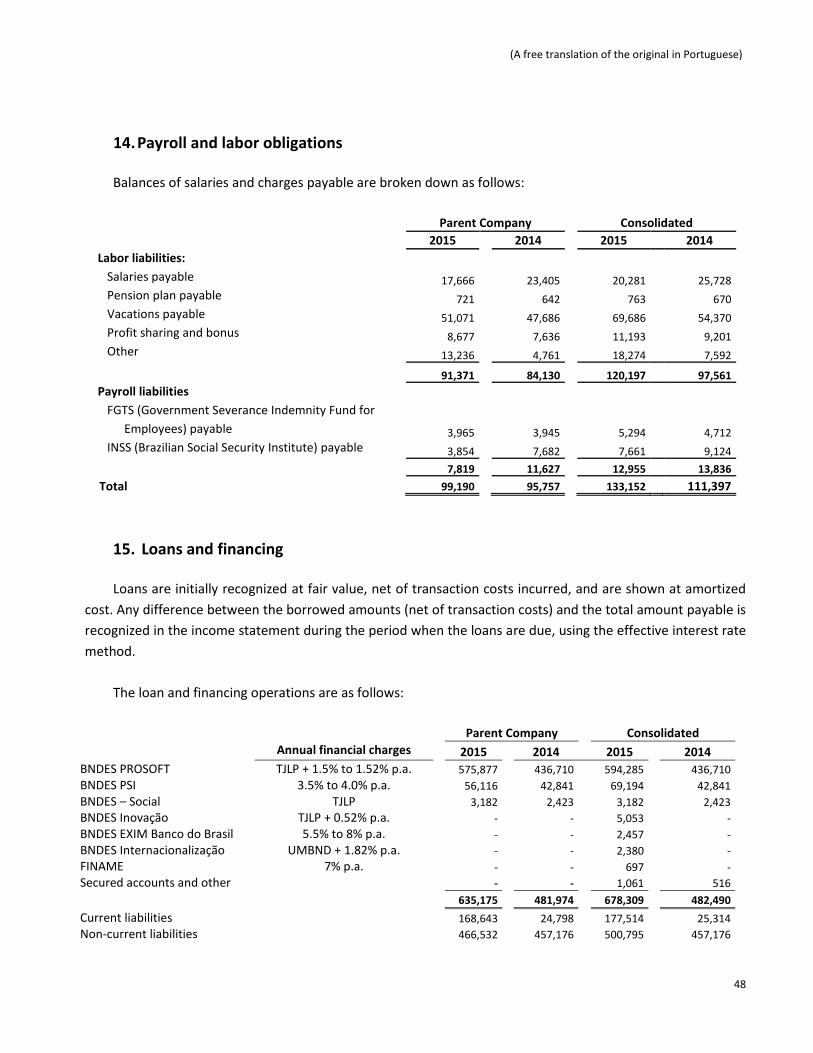
(A free translation of the original in Portuguese)
48
14. Payroll and labor obligations
Balances of salaries and charges payable are broken down as follows:
Parent Company Consolidated
2015 2014 2015 2014
Labor liabilities: Salaries payable 17,666 23,405 20,281 25,728 Pension plan payable 721 642 763 670 Vacations payable 51,071 47,686 69,686 54,370 Profit sharing and bonus 8,677 7,636 11,193 9,201 Other 13,236 4,761 18,274 7,592 91,371 84,130 120,197 97,561
Payroll liabilities FGTS (Government Severance Indemnity Fund for
Employees) payable 3,965 3,945 5,294 4,712 INSS (Brazilian Social Security Institute) payable 3,854 7,682 7,661 9,124
7,819 11,627 12,955 13,836
Total 99,190 95,757 133,152 111,397
15. Loans and financing
Loans are initially recognized at fair value, net of transaction costs incurred, and are shown at amortized
cost. Any difference between the borrowed amounts (net of transaction costs) and the total amount payable is
recognized in the income statement during the period when the loans are due, using the effective interest rate
method.
The loan and financing operations are as follows:
Parent Company Consolidated
Annual financial charges 2015 2014 2015 2014
BNDES PROSOFT TJLP + 1.5% to 1.52% p.a. 575,877 436,710 594,285 436,710
BNDES PSI 3.5% to 4.0% p.a. 56,116 42,841 69,194 42,841
BNDES – Social TJLP 3,182 2,423 3,182 2,423
BNDES Inovação TJLP + 0.52% p.a. - - 5,053 -
BNDES EXIM Banco do Brasil 5.5% to 8% p.a. - - 2,457 -
BNDES Internacionalização UMBND + 1.82% p.a. - - 2,380 -
FINAME 7% p.a. - - 697 -
Secured accounts and other - - 1,061 516
635,175 481,974 678,309 482,490
Current liabilities 168,643 24,798 177,514 25,314
Non-current liabilities 466,532 457,176 500,795 457,176

(A free translation of the original in Portuguese)
49
Amounts recorded in non-current liabilities on December 31, 2015 and 2014, have the following maturity
schedule:
Parent Company Consolidated 2015 2014 2015 2014 2016 - 119,412 - 119,412
2017 164,658 119,412 175,713 119,412
2018 164,658 119,412 173,642 119,412
2019 137,216 98,940 146,200 98,940
2020 - - 5,240 -
Non-current liabilities 466,532 457,176 500,795 457,176
Below is the breakdown of loans and financing on December 31, 2015 and 2014:
Parent Company Consolidated
2015 2014 2015 2014
Balance at beginning of year 481,974 305,127 482,490 306,443
Additions 181,055 227,078 181,858 227,078
Acquisition of subsidiary - - 41,728 -
Interest incurred 40,060 18,594 42,398 19,184
Amortizations (67,914) (68,825) (69,761) (70,215)
Balance at end of year 635,175 481,974 678,309 482,490
The Company and the subsidiary Bematech has loan and financing agreements with covenants usually
applicable to these types of operations, related to the meeting of economic, financial, cash generation and other
metrics. These covenants have been met and do not restrict the Company’s capacity to normally conduct its
operations.
16. Debentures
On December 31, 2015 and 2014, the balance was broken down as follows:
Parent Company Consolidated
Issue Debentures Annual financial charges Unit price
2015 2014
2015 2014
1st series 40,000 IPCA + 3.5% limited to TJLP + 1.5% 0.60 24,737 40,918 24,737 40,918
2nd series 40,000 TJLP + 1.5% 0.60 24,737 40,918 24,737 40,918
Sole series 500 CDI + 2.25% 100.00 - - 45,384 -
Subtotal 49,474 81,836 94,858 81,836
Premium due to non-conversion 49,428 31,018 49,428 31,018
Total 98,902 112,854 144,286 112,854
Current liabilities 49,473 33,834 61,915 33,834
Non-current liabilities 49,429 79,020 82,371 79,020

(A free translation of the original in Portuguese)
50
Maturity of non-current amounts is as follows:
Parent Company Consolidated
2015 2014 2015 2014
August 2016 - 48,002 - 48,002
August 2017 24,714 14,927 35,688 14,927
August 2018 24,715 16,091 35,689 16,091
August 2019 - - 10,994 -
49,429 79,020 82,371 79,020
The changes occurred in the years considered was as shown below:
Parent Company Consolidated
Debentures and premiums from non-conversions 2015 2014
2015 2014
Balance at beginning of year 112,854 104,205 112,854 104,205
Acquisition of subsidiary - - 46,049 -
Interest incurred 23,810 13,279 25,026 13,279
Amortization (37,762) (4,630) (37,762) (4,630)
Debenture repurchase - - (1,881) -
Balance at end of year 98,902 112,854 144,286 112,854
a) Description of operations On August 19, 2008, shareholders approved raising R$200,000 through the issue of up to 100,000 Units,
represented by Brazilian Depositary Receipts, comprised by two non-detachable debentures, one of which is 1st series convertible and the other 2nd series convertible. On December 31, 2015, of the total Units issued by the Company, 60% were converted into common shares during 2010 through 2013, due to the attainment of the conditions described in the indenture.
The 1st series debentures are paid based on the IPCA plus 3.5% interest p.a., limited to TJLP plus 1.5% p.a., annually payable on August 19. The 2nd series debentures are paid based on the TJLP plus 1.5% p.a., half-yearly payable on February 19 and August 19.
The issue was not filed with the Brazilian Securities and Exchange Commission as the debentures issued by the Company were privately issued exclusively to the Company’s shareholders on the issue date, with no general market placement efforts.
On July 10, 2014, Bematech issued unsecured non-convertible debentures in a single series, which was placed through a public offer with restricted placement efforts, in the amount of R$50,000, composed of 500 debentures with unit value of R$100 each. After corporate reorganization involving two companies, TOTVS became guarantor of all the obligations assumed by Bematech related debentures.
The debentures will mature in July 2019 and have been amortized in nine half-yearly installments since July
2015. Interest is paid in half-yearly installments, with the first payment made on January 10, 2015 and the next payment to occur in January 2016.

(A free translation of the original in Portuguese)
51
The debenture indenture have early maturity clauses if certain financial and non-financial covenants and other ancillary obligations are not met. On December 31, 2015 and 2014, the Company and its subsidiaries were in full compliance with all covenants.
b) “Non-conversion of debentures” clause In case of non-conversion, Company’s debentures will be entitled to a non-conversion premium, which for
the 1st series debentures will be equivalent to the difference between IPCA plus 8.0% p.a. and the interest effectively paid, and for the 2nd series debentures, interest of 3.5% p.a.
Premium for non-conversion of 1st series debentures will be restated by IPCA plus 8.0% p.a., while the 2nd
series debentures will be restated at TJLP plus 5.0% p.a. The premium for non-conversion will be paid in at most six installments, and within three years from the payment of the last installment of principal and interest (February 19, 2017).
17. Liabilities due to investment acquisition
These refer to installments payable due to acquisition of investments by the Company and its subsidiaries,
negotiated with installment payments, recorded in current and non-current liabilities, as follows:
Parent Company Consolidated 2015 2014 2015 2014
Datasul MG 2,884 2,470 2,884 2,470 Datasul Saúde MG 641 641 641 641
TotalBanco 99 88 99 88
Hery 545 571 545 571
TQTVD - 237 - 237
SRC 196 173 196 173
Mafipa 1,174 1,036 1,174 1,036
Gens FDES 5,914 8,764 5,914 8,765
Umov.me - - - 754
W&D Participações - - 31,365 28,937
Ciashop 1,186 1,345 1,186 1,345
RMS - - 29,639 32,327
TOTVS Agroindústria 4,742 11,809 4,742 11,809
Virtual Age 33,247 42,209 33,247 42,209
Seventeen 8,070 9,120 8,070 9,120
Neolog 12,859 - 12,859 -
RJ Participações - - 21,527 -
GSR7 - - 1,724 -
Bematech Sistemas - - 14,680 -
Total 71,557 78,463 170,492 140,482
Current liabilities 24,492 18,417 82,220 51,499
Non-current liabilities 47,065 60,046 88,272 88,983
Installments recorded as non-current liabilities mature as follows:
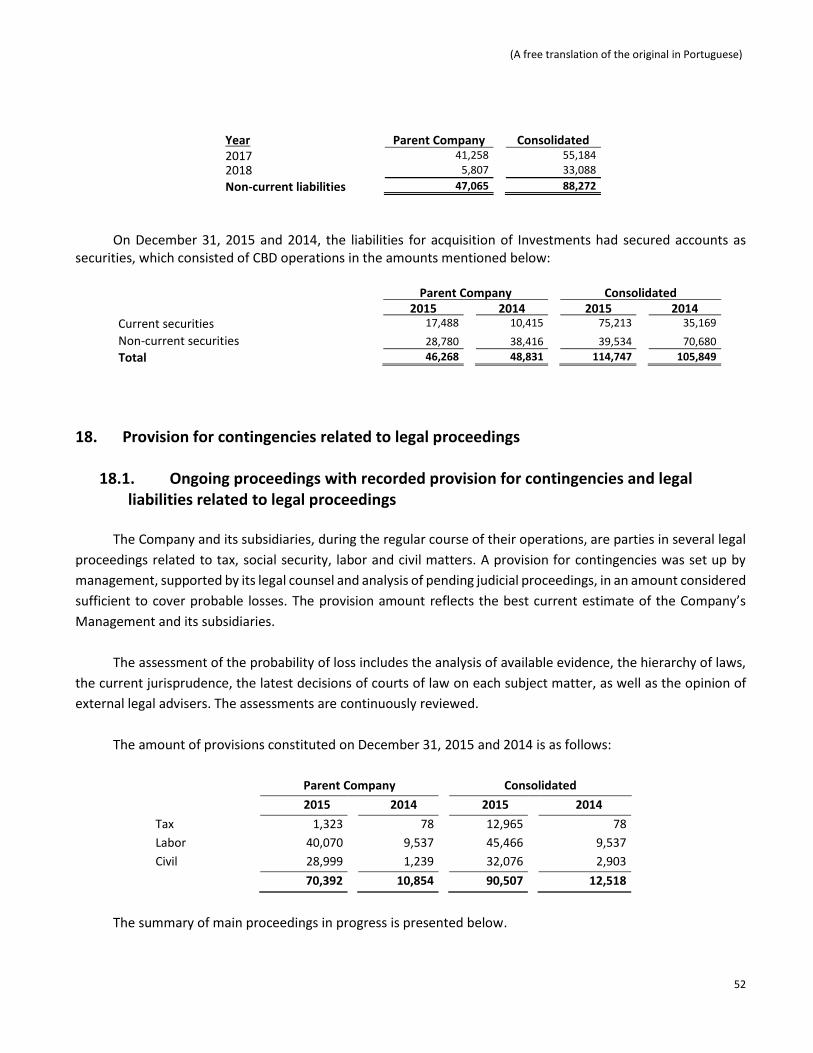
(A free translation of the original in Portuguese)
52
Year Parent Company Consolidated 2017 41,258 55,184 2018 5,807 33,088
Non-current liabilities 47,065 88,272
On December 31, 2015 and 2014, the liabilities for acquisition of Investments had secured accounts as
securities, which consisted of CBD operations in the amounts mentioned below: Parent Company Consolidated 2015 2014 2015 2014 Current securities 17,488 10,415
75,213 35,169
Non-current securities 28,780 38,416 39,534 70,680
Total 46,268 48,831 114,747 105,849
18. Provision for contingencies related to legal proceedings
18.1. Ongoing proceedings with recorded provision for contingencies and legal liabilities related to legal proceedings
The Company and its subsidiaries, during the regular course of their operations, are parties in several legal
proceedings related to tax, social security, labor and civil matters. A provision for contingencies was set up by
management, supported by its legal counsel and analysis of pending judicial proceedings, in an amount considered
sufficient to cover probable losses. The provision amount reflects the best current estimate of the Company’s
Management and its subsidiaries.
The assessment of the probability of loss includes the analysis of available evidence, the hierarchy of laws,
the current jurisprudence, the latest decisions of courts of law on each subject matter, as well as the opinion of
external legal advisers. The assessments are continuously reviewed.
The amount of provisions constituted on December 31, 2015 and 2014 is as follows:
Parent Company Consolidated
2015 2014 2015 2014
Tax 1,323 78 12,965 78
Labor 40,070 9,537 45,466 9,537
Civil 28,999 1,239 32,076 2,903
70,392 10,854 90,507 12,518
The summary of main proceedings in progress is presented below.

(A free translation of the original in Portuguese)
53
Tax In December 2006, Bematech filed for a writ of mandamus against the District Director of the Federal
Revenue Service in Curitiba for the recognition of illegality/unconstitutionality of the inclusion of ICMS amounts in the PIS and COFINS calculation base. The lawsuit is currently in the Regional Federal Appellate Court of the 4th Region until the final decision of the full bench of the Federal Supreme Court on the matter. The updated amount for this lawsuit was R$7,645 on December 31, 2015 (R$7,107 on December 31, 2014).
Other lawsuits classified as probable loss deal with recovering tax dues that the Company considers improper. These lawsuits amount to R$5,320 on December 31, 2015 (R$78 on December 31, 2014).
Labor Labor lawsuits classified as probable losses refer to lawsuits filed by former employees of the Company and
service provider companies, seeking recognition of employment relationship and other labor dues. These lawsuits totaled R$45,466 on December 31, 2015 (R$9,537 on December 31, 2014), there being no
individually significant case.
Civil
Civil lawsuits classified as probable loss refer mainly to lawsuits filed by clients alleging certain problems with the delivery of products and/or services, application of the default increment, grace period in terminated contracts and undue collections.
Notable among the individually significant cases are: (i) Civil lawsuit filed by a client alleging problems resulting from the product implemented, which
would have caused direct and indirect damages to the client. The updated amount on December 31, 2015 is R$5,644. The Company appealed against the merits of the unfavorable decision and the amount involved.
(ii) Action for damages due to alleged pain and suffering and pecuniary loss and filed by client alleging problems in delivery of services. The updated probable amount is R$5,663 on December 31, 2015. The Company appealed against the merits of the unfavorable decision and the amount involved.
Other lawsuits amount to R$20,769 on December 31, 2015 (R$2,903 on December 31, 2014), there being
no other individually significant cases.

(A free translation of the original in Portuguese)
54
a) Changes in provisions
The breakdown of provisions in the year ended December 31, 2015 and 2014 is as follows:
At the end of 2015, the Company complemented its provisions by R$59,022 in General and Administrative Expenses, due to the change in accounting estimate related to the calculation of contingent losses deemed as probable associated to legal proceedings. The additional provision comprised of R$33,351 for labor lawsuits, R$24,386 for civil lawsuits and R$1,285 for tax lawsuits.
These provisions reflect management’s best current estimate, which is based on information, external
counsel’s analyses and outcomes of previous legal proceedings in which the Company was defendant. This estimate is constantly reviewed by TOTVS’s risk monitoring and control.
Parent Company
Tax Labor Civil Total
Balances on December 31, 2013 645 5,546 992 7,183 (+) Additional provision - 4,374 420 4,794 (+) Monetary restatement 30 838 146 1,014 (-) Reversal of provision not used (597) (1,221) (319) (2,137)
Balances on December 31, 2014 78 9,537 1,239 10,854 (+) Additional provision 1,763 35,624 27,047 64,434 (+) Monetary restatement (12) 130 808 926 (-) Payment/Reversal (506) (5,221) (95) (5,822)
Balances on December 31, 2015 1,323 40,070 28,999 70,392
Consolidated
Tax Labor Civil Total
Balances on December 31, 2013 645 5,546 1,114 7,305 (+) Additional provision - 4,374 1,963 6,337 (+) Monetary restatement 30 838 267 1,135 (-) Reversal of provision not used (597) (1,221) (441) (2,259)
Balances on December 31, 2014 78 9,537 2,903 12,518 (+) Acquisition of subsidiary 12,691 5,415 2,943 21,049 (+) Additional provision 1,763 35,637 27,050 64,450 (+) Monetary restatement 134 206 980 1,320 (-) Payment/Reversal (1,701) (5,329) (1,800) (8,830)
Balances on December 31, 2015 12,965 45,466 32,076 90,507

(A free translation of the original in Portuguese)
55
b) Judicial deposits
The judicial deposits bound and not bound to provisioned lawsuits are stated below and are recorded under
non-current assets in the Company’s financial statements:
Parent Company Consolidated
Judicial deposits 2015 2014 2015 2014
Tax 5,557 5,070 13,723 5,070 Labor 17,119 11,625 19,282 11,625 Civil 9,012 5,116 10,402 5,725
31,688 21,811 43,407 22,420
18.2. Other ongoing proceedings (deemed as “possible” losses)
In addition, the Company and its subsidiaries are involved in other lawsuits, in which the risk of loss,
according to external lawyers and management, is possible, for which no provision has been recognized, as
follows:
Parent Company Consolidated
Nature 2015 2014 2015 2014
Tax 79, 204 40,539 97,861 52,142 Labor 69,022 25,534 76,717 29,289 Civil 237,312 147,826 248,788 149,076
385,538 213,899 423,366 230,507
The summary of main proceedings in progress is presented below.
Tax
The Company continued in discussion of a motion to stay the tax enforcement of execution the
unenforceability of NFLD, originally issued against Datasul S.A., whose amount on December 31, 2015 was
R$7,689 (R$9,766 on December 31, 2014). The notification was imposed by the INSS due to alleged irregularities
in outsourcing services. An appeal was filed against the outcome that partially decided that the motion to stay tax
foreclosure is valid.
The Company was issued ISS assessment notices by the Municipality of São Paulo for the period from 1996
to 2000, in the restated amount of R$6,884 (R$6,336 on December 31, 2014). The assessments notices were
maintained at the administrative level, since the Municipality of São Paulo understands that services provided by
the Joinville branch office were actually within the boundaries of São Paulo.
With the beginning of tax foreclosure, the Company offered debt guarantee and filed a motion against it.

(A free translation of the original in Portuguese)
56
In 2012, the Company offset debts with CSLL negative balance, but offsets were fully disallowed. The statement of discontentment is pending judgment in the lower administrative court. The updated amount of this proceeding on December 31, 2015 was R$9,469. On December 31, 2014, the lawsuit was classified as remote loss.
As a result of inspection procedures of the Federal Revenue Service in 2006, the same issued a tax-deficiency
notice for understanding that the company made payments to unidentified beneficiaries, levying the withholding income tax (IRRF) on said amounts, and identified expenses allegedly not proved, adding the respective amounts to taxable income. The tax deficiency notice was challenged and is currently awaiting judgment of voluntary appeal. The updated amount for this lawsuit was R$10,021 on December 31, 2015 (R$11,583 on December 31, 2014).
In 2014, a tax deficiency notice was issued against the Company due to alleged joint liability for payment of
ICMS on untaxed outflows for installing outflow control software at the taxpayer (client). TOTVS was considered jointly liable because the Company installed at the taxpayer a software that controls outflow of goods. The tax deficiency notice was challenged and currently awaits judgment in the lower administrative court. The updated amount for this lawsuit on December 31, 2015 was R$16,638.
The remaining tax cases classified as possible losses deal with recovering debt which the Company considers
improper. These cases totaled R$47,160 on December 31, 2015 (R$24,457 on December 31, 2014).
Labor Labor lawsuits classified as possible losses refer to lawsuits filed by former employees of the Company and
service provider companies, seeking recognition of employment relationship and other labor dues. These lawsuits totaled R$76,717 on December 31, 2015 (R$29,289 on December 31, 2014), there being no
individually significant case.
Civil The civil lawsuits classified as possible losses relate mainly to lawsuits filed by customers alleging problems
in the provision of services offered to clients, application of standard price increase, and application of grace
period in agreements rescinded and improper charges.
Notable among the individually significant cases are: (i) Action for damages due to information filed against agency agreement, in addition to moral and
material damages. The action, which involves the amount of R$52,569, is in the initial stage and was deemed as possible loss on December 31, 2015.
(ii) Action for damages due to alleged problems in delivery of services, for the amount of R$51,835 on
December 31, 2015. The lawsuit is in the initial stage.
The other suits totaled R$144,384 on December 31, 2015 (R$149,076 on December 31, 2014), there being
no other individually significant cases.
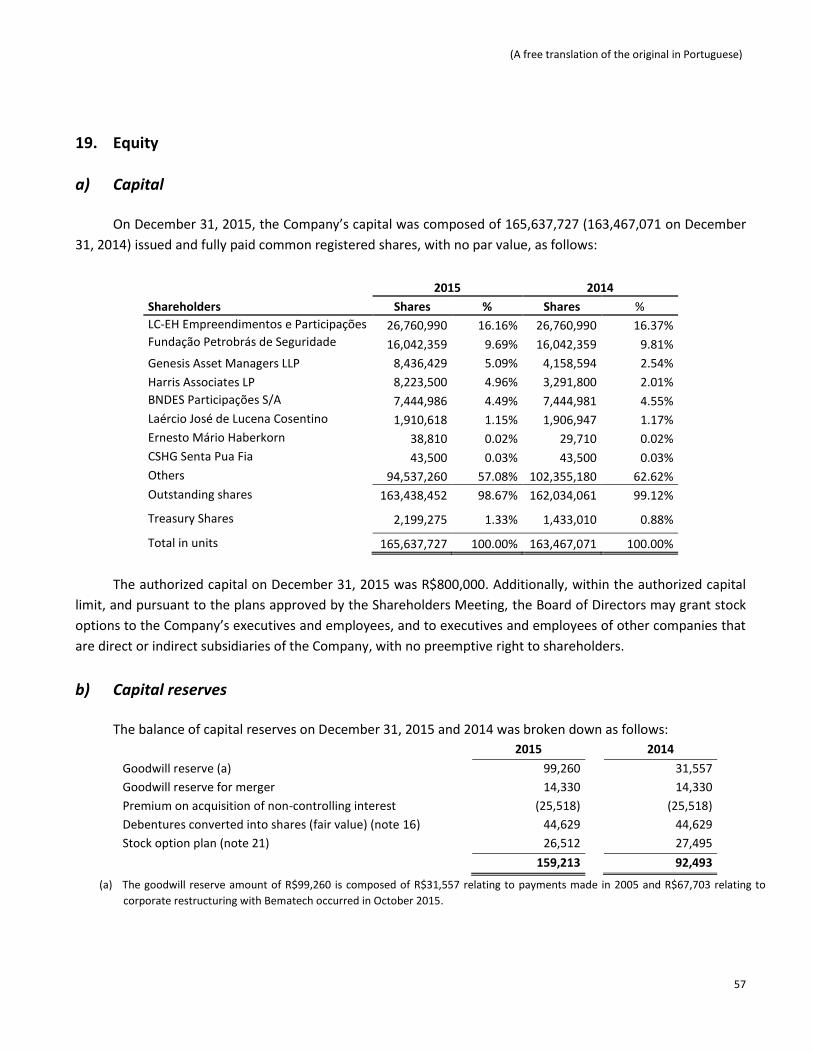
(A free translation of the original in Portuguese)
57
19. Equity
a) Capital
On December 31, 2015, the Company’s capital was composed of 165,637,727 (163,467,071 on December
31, 2014) issued and fully paid common registered shares, with no par value, as follows:
2015 2014
Shareholders Shares % Shares %
LC-EH Empreendimentos e Participações S.A.
26,760,990 16.16% 26,760,990 16.37% Fundação Petrobrás de Seguridade Social - Petros
16,042,359 9.69% 16,042,359 9.81%
Genesis Asset Managers LLP 8,436,429 5.09% 4,158,594 2.54%
Harris Associates LP 8,223,500 4.96% 3,291,800 2.01%
BNDES Participações S/A 7,444,986 4.49% 7,444,981 4.55%
Laércio José de Lucena Cosentino 1,910,618 1.15% 1,906,947 1.17%
Ernesto Mário Haberkorn 38,810 0.02% 29,710 0.02%
CSHG Senta Pua Fia 43,500 0.03% 43,500 0.03%
Others 94,537,260 57.08% 102,355,180 62.62%
Outstanding shares 163,438,452 98.67% 162,034,061 99.12% Treasury Shares 2,199,275 1.33% 1,433,010 0.88% Total in units 165,637,727 100.00% 163,467,071 100.00%
The authorized capital on December 31, 2015 was R$800,000. Additionally, within the authorized capital
limit, and pursuant to the plans approved by the Shareholders Meeting, the Board of Directors may grant stock
options to the Company’s executives and employees, and to executives and employees of other companies that
are direct or indirect subsidiaries of the Company, with no preemptive right to shareholders.
b) Capital reserves
The balance of capital reserves on December 31, 2015 and 2014 was broken down as follows:
2015 2014
Goodwill reserve (a) 99,260 31,557
Goodwill reserve for merger 14,330 14,330
Premium on acquisition of non-controlling interest (25,518) (25,518)
Debentures converted into shares (fair value) (note 16) 44,629 44,629
Stock option plan (note 21) 26,512 27,495
159,213 92,493
(a) The goodwill reserve amount of R$99,260 is composed of R$31,557 relating to payments made in 2005 and R$67,703 relating to
corporate restructuring with Bematech occurred in October 2015.

(A free translation of the original in Portuguese)
58
c) Treasury shares
The Company has a share buyback program for the acquisition of shares issued by it, without capital
reduction, for subsequent cancellation, disposal or to be held in treasury, for the purpose of increasing value for
shareholders.
The acquisitions are made at market prices and the Board of Directors decides on the time and number of
shares to be acquired under the program, whether in a single transaction or a series of transactions, observing
the applicable legal limits and the established maximum number of 1,600,000 common shares.
On December 31, 2015 and 2014, the "Treasury Shares" item was as follows:
Number of shares
(units)
Value (in thousand)
Average price per share (in
reais)
Balance on December 31, 2013 363,364 R$12,960 R$35.67
Acquired 2,170,586 R$79,275 R$36.52
Used (1,100,940) (R$40,023) R$36.35
Balance on December 31, 2014 1,433,010 R$52,212 R$36.44
Acquired 1,600,005 R$48,872 R$30.54
Used (833,740) (R$30,072) R$36.07
Balance on December 31, 2015 2,199,275 R$71,012 R$32.29
During the year ended December 31, 2015, the use of 833,740 treasury shares by the stock options plan
consumed R$4,975 from the capital reserve.
20. Dividends and Interest on Equity
The Annual Shareholders Meeting held on March 30, 2015 decided on the distribution and payment of dividends related to fiscal year 2014, in the amount of R$124,367 paid starting from April 15, 2015.
On July 27, 2015, the Company’s Board of Directors authorized distribution and payment of interest on
equity amounting to R$29,196 relating to the 1st half of 2015 paid as of August 19, 2015.
On December 18, 2015, the Board of Directors authorized the distribution and payment of interest on equity
to the Company’s shareholders, in the amount of R$31,319, to be calculated towards to the minimum mandatory
dividend for the year ended December 31, 2015.

(A free translation of the original in Portuguese)
59
Parent Company
2015 2014
Net income for the year - Company 195,529 262,960
Accrual of legal reserve (article 193 of Law No. 6404) (9,776) (13,148)
Net income after legal reserve allocation 185,753 249,812
Minimum mandatory dividend – 25% 46,438 67,958
Additional dividends proposed by management 80,656 97,704
Dividends proposed by management 127,094 165,662
Payment:
Interest on capital 60,515 41,295
Dividends 66,579 124,367
127,094 165,662
Number of outstanding shares on December 31 163,438,452 162,034,061
Dividends and interest on equity per thousand shares - in reais 0.78 1.02
The balance of dividends and interest on equity payable of R$32,885 on December 31, 2015 (R$47,071 on
December 31, 2014) includes the distribution of the year, as presented above, as well as the residual balance of
previous years.
Interest on equity is a part of dividends, which is deductible for purposes of Brazilian tax law. It is, therefore,
reported in different lines in order to show the income tax effect.
Mandatory minimum dividends are shown in the balance sheet as legal obligations (provisions in current
liabilities), and dividends in excess of this minimum as reserve in a special line in the statement of equity.
The capital budget proposed by the Executive Board of the Company on December 31, 2015 and approved
by the Board of Directors on March 15, 2016, ad referendum the Shareholders Meeting, allocates the total balance
in the reserve account to retained earnings, in the amount of R$448,466 (R$389,807 on December 31, 2014), for
the following:
Investments: 2015 2014
Expansion projects, replacement of assets 437,917 774,804
Total investments 437,917 774,804
Fonts:
Retained earnings at December, 31
Estimated cash to be generated from operating and
financing activities for the next year (unaudited) 448,466 389,804
Total of fonts (10,549) 385,000
437,917 774,804

(A free translation of the original in Portuguese)
60
21. Stock option plan
The Company measures the cost of transactions settled with shares to its employees based on the fair value
of the shares on the grant date.
The Incentive Plan based on Shares of the Company establishes rules for certain employees and directors
of TOTVS or other companies under its control so they can acquire shares of the Company through the grant of
stock options, thereby aligning over the medium and long terms, interests of the beneficiaries and shareholders’
interests, broaden the sense of ownership and commitment of the executives through the concept of investment
and risk, tying the granting of long-term incentives to the short-term results of the Company and the executives,
and introduce the concept of a "Partners Program" which strengthens the power of retention of select strategic
group. The Plan is administered by the Board of Directors of the Company, which establishes grant programs
annually.
The plan approved at the ASM of November 29, 2012, effective in 2015, envisages the following incentive options:
(i) Regular options, whose strike prices will be the market price of the shares at the time of the grant of
options, determined based on the average of the closing prices of the last five trading days preceding the date of grant; and
(ii) Restricted options, where the strike prices will be established after certain obligations have been met,
which consists in the acquisition of Company shares using 100% of the amount received by the beneficiary in the year prior to profit sharing, net of income tax.
The fair value of each option granted is estimated at the grant date based on the Black-Scholes option
pricing model. The main events relating to plans in force, the variables used in the calculations and the results are:
Grant Fair Value Assumptions
Expectation:
Free interest
rate risk Term Maturity
Nº Date Number of
options
Exercise
price in
reais
Fair value of shares
in reais Dividends Volatility
6th 02.13.12 50,000 R$30.47 10.83 1.92% 32.82% 10.00% 3 years 7th 06.01.12 40,000 R$35.00 12.00 1.92% 32.82% 10.00% 3 years 8th 02.20.13 683,423 R$42.63 11.97 1.70% 30.09% 7.25% 3 years 9th 02.20.13 96,791 - 41.60 1.70% 30.09% 7.25% 3 years
10th 02.20.14 276,496 R$33.05 8.93 2.20% 29.51% 10.75% 3 years 11th 02.20.14 29,633 - 29.93 2.20% 29.51% 10.75% 3 years 12ª 02.20.15 225,425 R$35.60 11.36 2.60% 29.61% 12.75% 3 years 13ª 02.20.15 28,161 - 33.27 2.60% 29.61% 12.75% 3 years 14ª 04.02.15 33,751 R$35.60 12.12 2.60% 29.61% 13.00% 3 years 15ª 04.02.15 9,468 - 34.06 2.60% 29.61% 13.00% 3 years
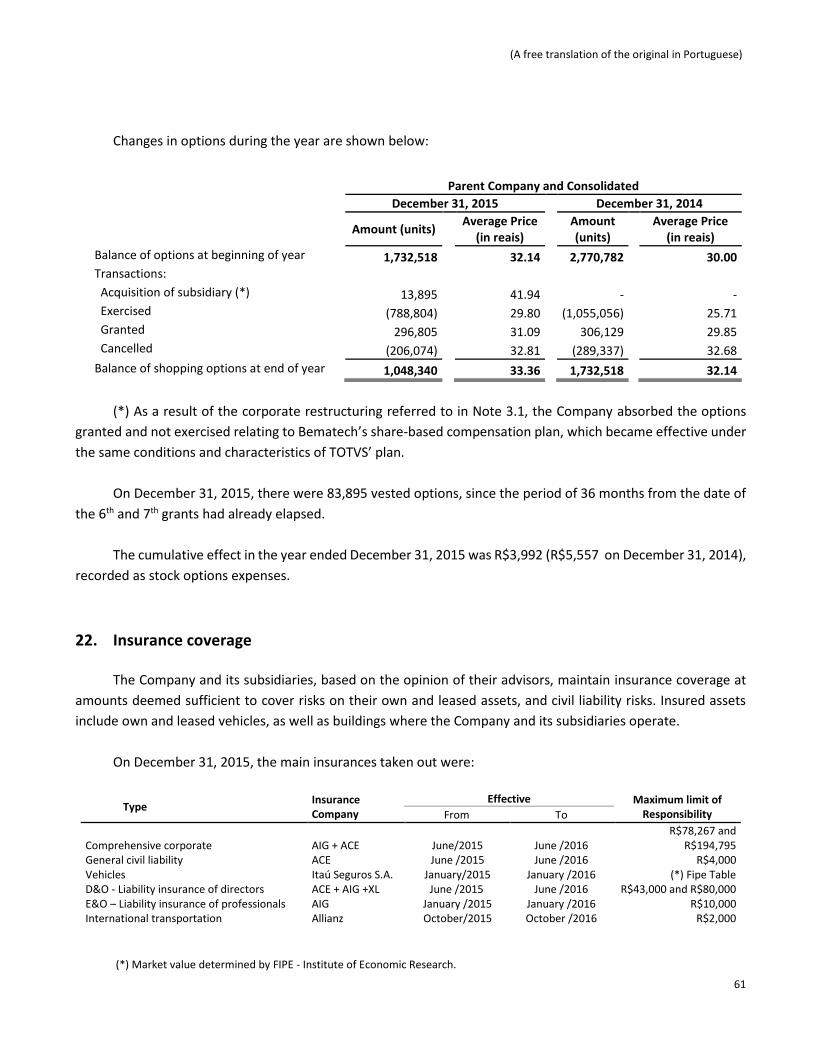
(A free translation of the original in Portuguese)
61
Changes in options during the year are shown below:
Parent Company and Consolidated
December 31, 2015 December 31, 2014
Amount (units)
Average Price (in reais)
Amount (units)
Average Price
(in reais)
Balance of options at beginning of year 1,732,518 32.14 2,770,782 30.00 Transactions: Acquisition of subsidiary (*) 13,895 41.94 - - Exercised (788,804) 29.80 (1,055,056) 25.71 Granted 296,805 31.09 306,129 29.85 Cancelled (206,074) 32.81 (289,337) 32.68
Balance of shopping options at end of year 1,048,340 33.36 1,732,518 32.14
(*) As a result of the corporate restructuring referred to in Note 3.1, the Company absorbed the options
granted and not exercised relating to Bematech’s share-based compensation plan, which became effective under
the same conditions and characteristics of TOTVS’ plan.
On December 31, 2015, there were 83,895 vested options, since the period of 36 months from the date of
the 6th and 7th grants had already elapsed.
The cumulative effect in the year ended December 31, 2015 was R$3,992 (R$5,557 on December 31, 2014),
recorded as stock options expenses.
22. Insurance coverage
The Company and its subsidiaries, based on the opinion of their advisors, maintain insurance coverage at
amounts deemed sufficient to cover risks on their own and leased assets, and civil liability risks. Insured assets
include own and leased vehicles, as well as buildings where the Company and its subsidiaries operate.
On December 31, 2015, the main insurances taken out were:
Type Insurance Company
Effective Maximum limit of Responsibility From To
Comprehensive corporate AIG + ACE June/2015 June /2016 R$78,267 and
R$194,795 General civil liability ACE June /2015 June /2016 R$4,000 Vehicles Itaú Seguros S.A. January/2015 January /2016 (*) Fipe Table D&O - Liability insurance of directors ACE + AIG +XL June /2015 June /2016 R$43,000 and R$80,000 E&O – Liability insurance of professionals AIG January /2015 January /2016 R$10,000 International transportation Allianz October/2015 October /2016 R$2,000
(*) Market value determined by FIPE - Institute of Economic Research.
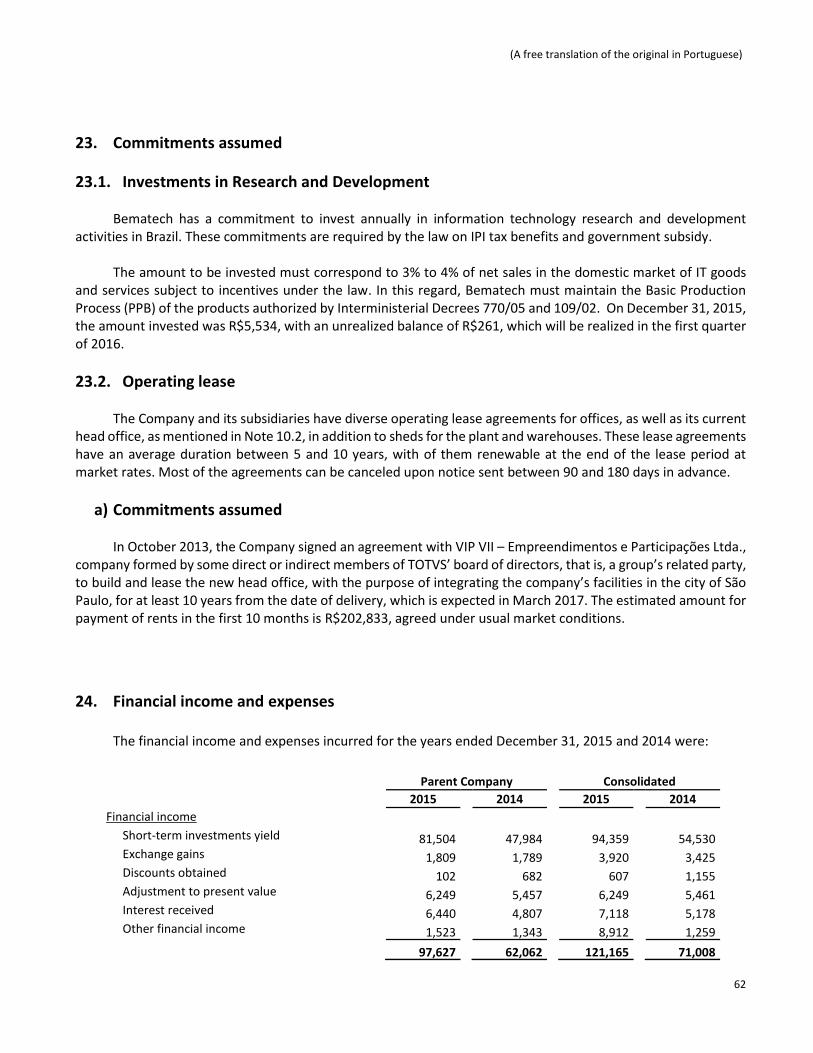
(A free translation of the original in Portuguese)
62
23. Commitments assumed
23.1. Investments in Research and Development Bematech has a commitment to invest annually in information technology research and development
activities in Brazil. These commitments are required by the law on IPI tax benefits and government subsidy. The amount to be invested must correspond to 3% to 4% of net sales in the domestic market of IT goods
and services subject to incentives under the law. In this regard, Bematech must maintain the Basic Production Process (PPB) of the products authorized by Interministerial Decrees 770/05 and 109/02. On December 31, 2015, the amount invested was R$5,534, with an unrealized balance of R$261, which will be realized in the first quarter of 2016.
23.2. Operating lease
The Company and its subsidiaries have diverse operating lease agreements for offices, as well as its current head office, as mentioned in Note 10.2, in addition to sheds for the plant and warehouses. These lease agreements have an average duration between 5 and 10 years, with of them renewable at the end of the lease period at market rates. Most of the agreements can be canceled upon notice sent between 90 and 180 days in advance.
a) Commitments assumed
In October 2013, the Company signed an agreement with VIP VII – Empreendimentos e Participações Ltda., company formed by some direct or indirect members of TOTVS’ board of directors, that is, a group’s related party, to build and lease the new head office, with the purpose of integrating the company’s facilities in the city of São Paulo, for at least 10 years from the date of delivery, which is expected in March 2017. The estimated amount for payment of rents in the first 10 months is R$202,833, agreed under usual market conditions.
24. Financial income and expenses
The financial income and expenses incurred for the years ended December 31, 2015 and 2014 were:
Parent Company Consolidated
2015 2014 2015 2014
Financial income Short-term investments yield 81,504 47,984 94,359 54,530 Exchange gains 1,809 1,789 3,920 3,425 Discounts obtained 102 682 607 1,155 Adjustment to present value 6,249 5,457 6,249 5,461 Interest received 6,440 4,807 7,118 5,178 Other financial income 1,523 1,343 8,912 1,259
97,627 62,062 121,165 71,008

(A free translation of the original in Portuguese)
63
Financial expenses Interest incurred (72,372) (38,288) (79,505) (44,649) Exchange losses (3,918) (14) (5,998) (1,439) Bank commissions and fees (3,751) (2,545) (4,411) (2,856) Discounts granted (714) (4,465) (1,508) (5,473) Other financial expenses (1,352) (2,444) (3,217) (3,409)
(82,107) (47,756) (94,639) (57,826) Net financial income (expenses) 15,520 14,306 26,526 13,182
25. Private pension plan – defined contribution
The Company offers the TOTVS Private Pension Plan, managed by Itaú Vida e Previdência, which receives
contributions from the employees and the Company, described in the Program Membership Agreement. The three
types of contribution are:
Basic Contribution – corresponds to 2% of the employee’s salary; in case of executive officers, the
contribution ranges from 2% to 5%.
Voluntary Contribution – made exclusively by employees, with no matching contribution by the
Company;
Company Contribution – corresponds to 100% of the basic contribution. The Company is allowed to
make extraordinary contributions, in the amounts and with the frequency it chooses.
26. Earnings per share
Basic earnings per share is calculated by dividing net income from the year (attributed to the parent
Company’s common shareholders) by the weighted average number of common shares outstanding in the year.
Diluted earnings per share is calculated by dividing net income attributed to the holders of the Parent
Company’s common shares by the weighted average number of common shares available during the year plus the
weighted average number of common shares that would be issued if all the potentially diluted common shares
are converted into common shares:
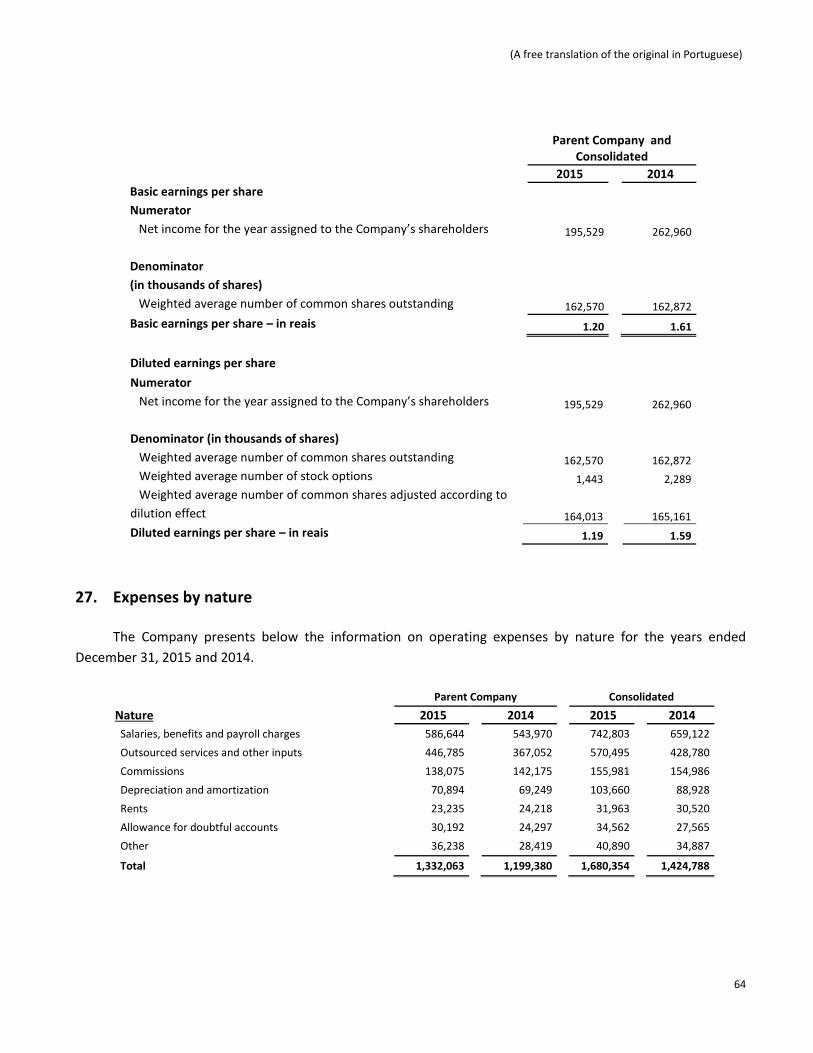
(A free translation of the original in Portuguese)
64
Parent Company and
Consolidated
2015 2014
Basic earnings per share Numerator
Net income for the year assigned to the Company’s shareholders 195,529 262,960 Denominator
(in thousands of shares) Weighted average number of common shares outstanding 162,570 162,872
Basic earnings per share – in reais 1.20 1.61
Diluted earnings per share
Numerator
Net income for the year assigned to the Company’s shareholders 195,529 262,960
Denominator (in thousands of shares) Weighted average number of common shares outstanding 162,570 162,872 Weighted average number of stock options 1,443 2,289 Weighted average number of common shares adjusted according to
dilution effect 164,013 165,161 Diluted earnings per share – in reais 1.19 1.59
27. Expenses by nature
The Company presents below the information on operating expenses by nature for the years ended
December 31, 2015 and 2014.
Parent Company Consolidated
Nature 2015 2014 2015 2014
Salaries, benefits and payroll charges 586,644 543,970 742,803 659,122
Outsourced services and other inputs 446,785 367,052 570,495 428,780
Commissions 138,075 142,175 155,981 154,986
Depreciation and amortization 70,894 69,249 103,660 88,928
Rents 23,235 24,218 31,963 30,520
Allowance for doubtful accounts 30,192 24,297 34,562 27,565
Other 36,238 28,419 40,890 34,887
Total 1,332,063 1,199,380 1,680,354 1,424,788
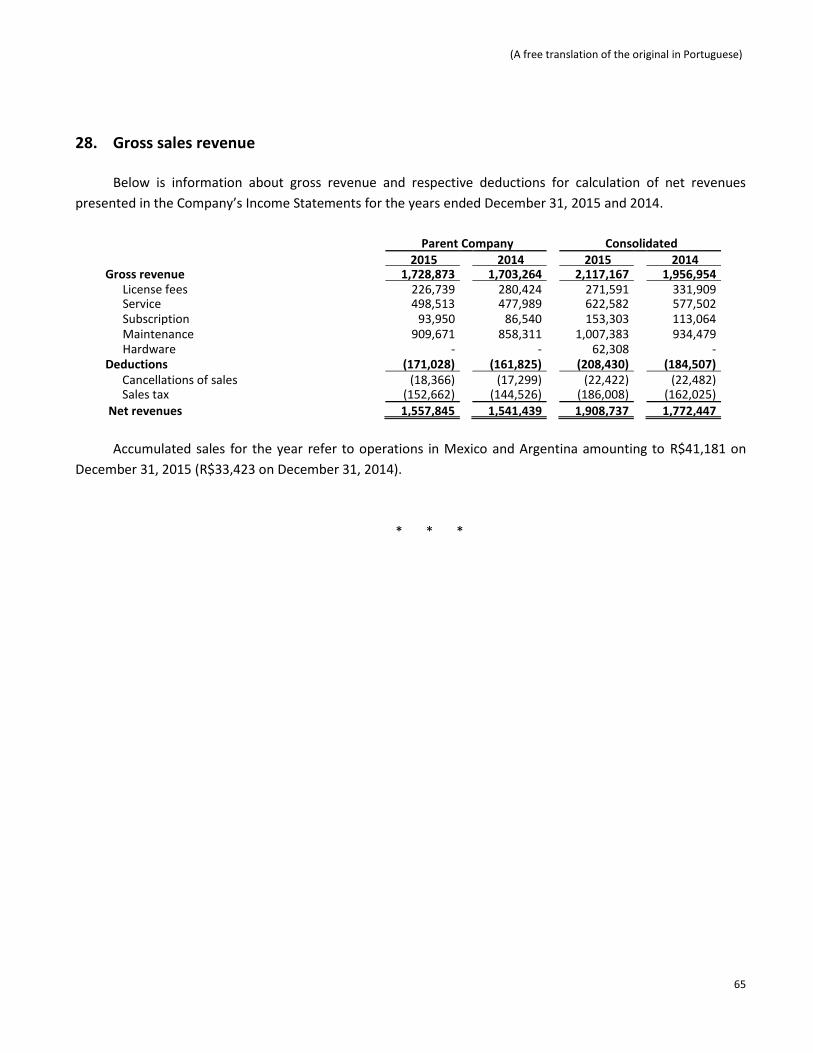
(A free translation of the original in Portuguese)
65
28. Gross sales revenue
Below is information about gross revenue and respective deductions for calculation of net revenues
presented in the Company’s Income Statements for the years ended December 31, 2015 and 2014.
Parent Company Consolidated 2015 2014 2015 2014 Gross revenue 1,728,873 1,703,264 2,117,167 1,956,954
License fees 226,739 280,424 271,591 331,909 Service 498,513 477,989 622,582 577,502 Subscription 93,950 86,540 153,303 113,064 Maintenance 909,671 858,311 1,007,383 934,479 Hardware - - 62,308 -
Deductions (171,028) (161,825) (208,430) (184,507) Cancellations of sales (18,366) (17,299) (22,422) (22,482) Sales tax (152,662) (144,526) (186,008) (162,025)
Net revenues 1,557,845 1,541,439 1,908,737 1,772,447
Accumulated sales for the year refer to operations in Mexico and Argentina amounting to R$41,181 on
December 31, 2015 (R$33,423 on December 31, 2014).
* * *

(A free translation of the original in Portuguese)
66
AUDIT COMMITTEE REPORT
Introduction
In accordance with its charter, the Audit Committee is charged with the processes and management of the internal and external audit, the mechanisms and controls related to risk management and the alignment of the financial policies with the strategic guidelines and risk profile of the business, ensuring the quality and integrity of the Company's financial statements, and making recommendations to the Management regarding the approval of financial reports and any actions to improve the internal controls and to reduce risks.
The Audit Committee is formed by three members (one independent member and two external
independent members), who are currently in the full exercise of their terms of office.
Activities of the Audit Committee
The committee met ordinarily fourteen (14) times during the period from February 2015 and March 2016 and five (5) times extraordinarily. It discussed 120 topics with the officers, directors, internal auditors, independent auditors and external advisors.
In this period, the Audit Committee also held two private meetings with the independent auditor, two meetings with the chairman and one meeting with the CEO to discuss the main topics accompanied during the year.
Topics discussed by the Audit Committee
The Audit Committee held meetings with officers, directors, internal auditors and independent auditors to understand the processes, internal controls, strategic risks, possible deficiencies and any plans for improvement, and to submit its recommendations to the Board of Directors and the Board of Executive Officers. The main topics discussed in these meetings were:
Independent Audit Discussion of the proposal and recommendation on the approval of the rehiring of the independent
auditors; Planning, scope and main findings of the quarterly reviews and report on the financial statements for
fiscal year 2015; Deficiencies and recommendations for improving the internal controls indicated in the report; Findings and recommendations of the report on the effectiveness of the controls for general
information technology (ISAE 3402/15); Updating of the accounting policies, in particular IFRS 15, which addresses revenue recognition; Monitoring of the independence of the external audit form for the performance of its audit work; Main points of concern on the issue of the quarterly and annual report, in addition to the
methodology used by the independent auditor for identifying significant distortions.
(A free translation of the original in Portuguese)
67
Internal Audit Discussion and approval of the annual plan for the internal audit; Accompanying the work of the internal audit at the Company’s various units as well as at its
franchises, to assess the critical points identified by the auditors, the justifications and accompanying the implementation of any action plans by those responsible for the most relevant cases, in face-to-face meetings;
Accompanying the relevant investigations conducted by the internal audit department.
TOTVS Conduct and Ethics Committee Accompanying the activities of the Conduct and Ethics Committee and evaluating any cases of
whistleblowing received and the measures adopted by Management; Face-to-face discussions of the main cases, the approach and the investigation format.
Internal controls, corporate risk management, ombudsman and clients Accompanying the project for mapping key processes, controls and the modernization of
management; Discussion and accompaniment of the Company’s strategic risk management in face-to-face meetings
with the managers of each risk and findings of the risk assessment carried out in the year; Accompaniment of the performance of maintenance and subscription revenue and client churn. Accompaniment of project to revitalize customer service, especially the Atitude Q project to improve
customer satisfaction with the service provided by the Company; Accompaniment of the customer satisfaction indicators (net promoter score - NPS).
Mergers and acquisitions Accompaniment and recommendations to the board of directors regarding M&A opportunities and
details on transactions involving mergers and acquisitions, including valuation, risk assessment and due diligence reports;
Discussion and recommendation of the granting of loans to the investee companies and franchises. Assessment of the risks and guarantees for capital injections;
Accompaniment of the results of the acquired companies.
Financial management and indicators Review of the policy and procedures for credit analysis; Evaluation and recommendation for the approval of proposals for the payment of interest on equity; Review and monitoring of compliance with the Company’s financial and investment policies; Discussion and evaluation of the methodology for recognizing revenue and cost of services; Accompaniment of the estimates for losses from doubtful accounts; Evaluation of the share repurchase program proposed by management; Evaluation of the proposals for stock options and the impacts of Federal Law 12,973/74; Discussion of the key financial and performance indicators and the respective repercussions for the
Company’s business areas and segments; Financial impacts of changes in legislation, especially those arising from the Brasil Maior plan;

(A free translation of the original in Portuguese)
68
Discussion and accompaniment of the Company’s losses map; Proposals by the Company for assuming the guarantees for loans and debentures that are the
responsibility of the acquired company; Understanding the assumptions and challenges for preparing the Company’s annual budget.
Corporate governance and other issues Opinion on Company’s quarterly and annual financial statements; Discussion of the contents of notices to the market, press releases, material fact notices and earnings
presentations to the market, including the reference form; Review and updating of the charter of the audit committee; Monitoring of the treatment by the Company of labor risks and implications; Accompaniment of the adoption of policies and practices by the Company and its employees and
managers to ensure compliance with the anticorruption law; Monitoring of the results of impairment testing; Acknowledgement and assessment of the risks of the executive compensation policy; Accompaniment of the topics and decisions of the Tax Committee; Review of information disclosure and security trading policies, including the treatment of strategic
risk of insider trading; Review and discussion of the company’s crisis management plan; Review of management’s questioning and responses concerning the official letters of regulatory
agencies; Accompaniment of the behavior of TOTVS stock in the market.
Provisions and contingent liabilities and assets Verification of compliance with CVM Resolution 594 regarding provisions and contingent liabilities
and assets; Evaluation and recommendations, following the engagement of expert external advisors, regarding
the processes and controls related to monitoring and managing administrative proceedings and lawsuits and the calculation of provisions;
Discussion and accompaniment of the main lawsuits and the quality of management’s judgment regarding the probabilities of the outcomes.
Information technology, information security and Cloud Discussion and accompaniment of action plans to improve the Company’s controls for access profiles
and the segregation of functions; Awareness and accompaniment up of the results of the information security risk assessment and the
respective action plan for enhancing IT controls.

(A free translation of the original in Portuguese)
69
Report of the Audit Committee
Annual Financial Statements for 2015: The members of the Audit Committee of TOTVS S.A., in the exercise of their legal responsibilities and
powers, in accordance with the Charter of the Audit Committee, examined and analyzed the financial statements, accompanied by report of the independent auditors and the annual report from Management for the fiscal year ended December 31, 2015 (“Annual Financial Statements for 2015”) and, considering the information provided by Management of the Company and by PwC Auditores Independentes, as well as the proposed allocation of the earnings for fiscal year 2015, unanimously concluded that these adequately reflect, in all relevant aspects, the equity and financial position of the Company and its subsidiaries, and recommended that the Board of Directors of the Company approve said documents and submit them to the annual shareholders’ meeting, in accordance with Brazilian Corporation Law.
São Paulo, March 15, 2016
Maria Helena Santana Chair of the Audit Committee and representative of the Board of Directors Charles Barnsley Holland Member of the Audit Committee Gilberto Mifano Member of the Audit Committee