Total Cost of Care vs. Member P & L (PPDR) for State · SFY 2018 PPDR SFY 2018 TCOC PPDR vs. TCOC...
42
Transcript of Total Cost of Care vs. Member P & L (PPDR) for State · SFY 2018 PPDR SFY 2018 TCOC PPDR vs. TCOC...
Total Cost of Care vs. Member P & L (PPDR) for State Fiscal Years 2017 & 2018
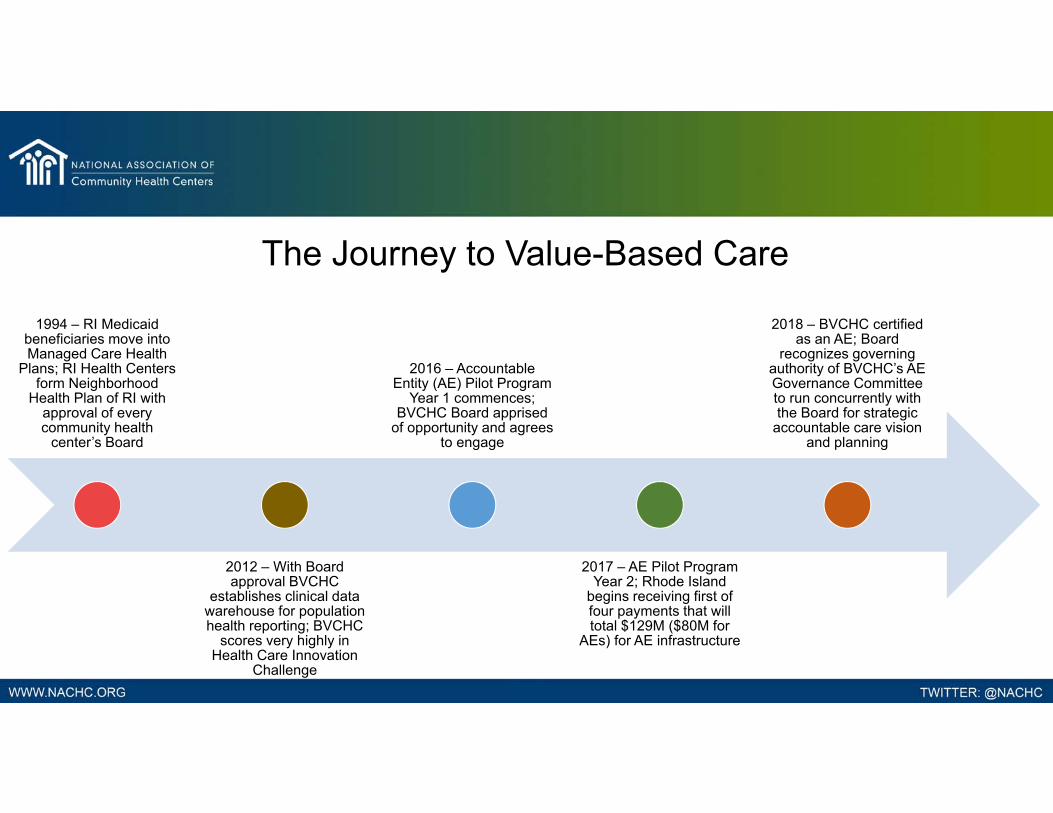
1994 – RI Medicaid beneficiaries move into Managed Care Health
Plans; RI Health Centers form Neighborhood
Health Plan of RI with approval of every community health
center’s Board
2012 – With Board approval BVCHC
establishes clinical data warehouse for population health reporting; BVCHC
scores very highly in Health Care Innovation
Challenge
2016 – Accountable Entity (AE) Pilot Program
Year 1 commences; BVCHC Board apprised
of opportunity and agrees to engage
2017 – AE Pilot Program Year 2; Rhode Island
begins receiving first of four payments that will total $129M ($80M for
AEs) for AE infrastructure
2018 – BVCHC certified as an AE; Board
recognizes governing authority of BVCHC’s AE Governance Committee to run concurrently with the Board for strategic
accountable care vision and planning
The Journey to Value-Based Care
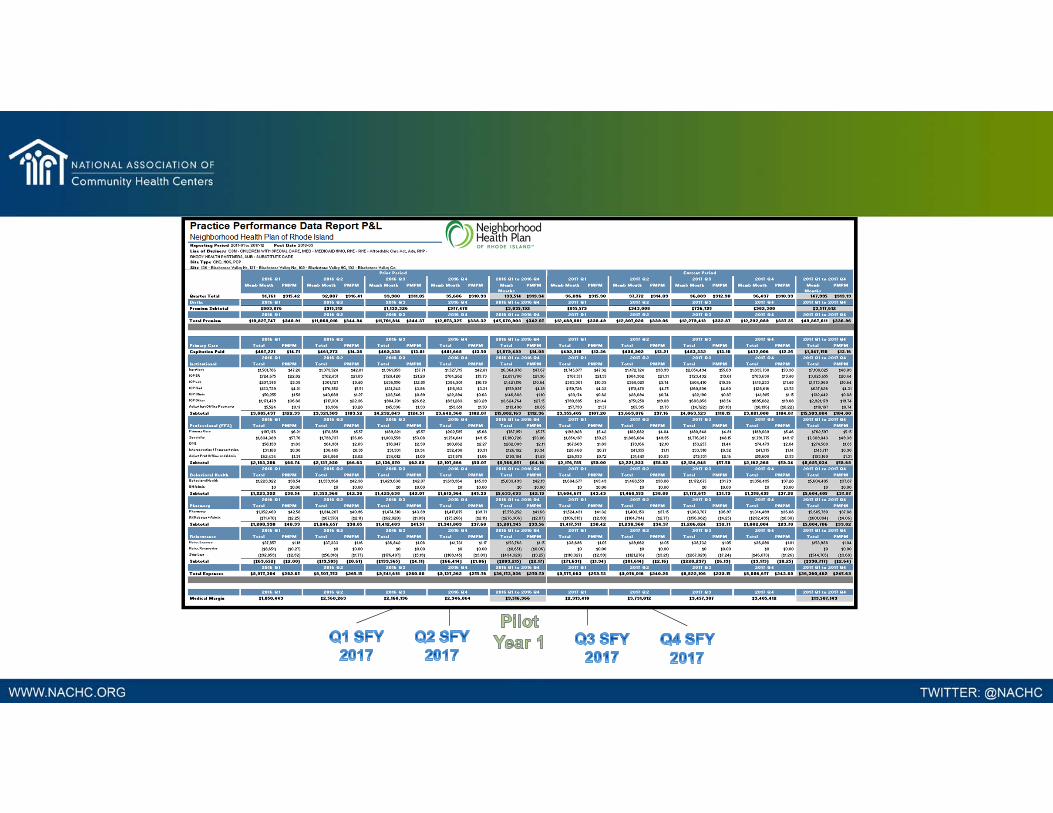

MM PMPM MM PMPM MM PMPM MM PMPM MM PMPM33,980 $311.05 35,686 $310.93 36,896 $315.30 37,772 $314.09 144,334 $312.90
$11,701,814 $344.37 $12,073,325 $338.32 $12,489,081 $338.49 $12,807,028 $339.06 $49,071,248 $339.98
Expenses$469,338 $13.81 $481,668 $13.50 $492,910 $13.36 $498,902 $13.21 $1,942,818 $13.46
$4,232,849 $124.57 $3,642,368 $102.07 $3,955,405 $107.20 $3,669,876 $97.16 $15,500,498 $107.39$2,136,870 $62.89 $2,107,866 $59.07 $2,176,785 $59.00 $2,221,933 $58.82 $8,643,454 $59.89$1,429,638 $42.07 $1,619,964 $45.39 $1,604,677 $43.49 $1,468,559 $38.88 $6,122,838 $42.42$1,412,489 $41.57 $1,341,809 $37.60 $1,417,517 $38.42 $1,298,360 $34.37 $5,470,175 $37.90($139,565) ($4.11) ($66,414) ($1.86) ($71,631) ($1.94) ($81,614) ($2.06) ($359,224) ($2.49)$9,541,619 $280.80 $9,127,261 $255.77 $9,575,663 $259.53 $9,076,016 $240.28 $37,320,559 $258.57$2,160,195 $63.57 $2,946,064 $82.56 $2,913,418 $78.96 $3,731,012 $98.78 $11,750,689 $81.41
Reinsurance SubtotalTotal ExpensesMedical Margin
Pilot Year 1 ‐ SFY 2017Practice Performance Data Report (PPDR)
Quarter TotalBirths ‐ Premium SubtotalTotal Premium
Primary Capitation PaidInstitutional SubtotalProfessional FFS SubtotalBH SubtotalPharmacy Subtotal
$1,132,326 $977,478 $855,579 $943,008 $3,908,391
2016 Q3 2016 Q4 2017 Q1 2017 Q2 SFY 2017
2016 Q3 2017 Q12016 Q4 SFY 20172017 Q2

$0
$2,000,000
$4,000,000
$6,000,000
$8,000,000
$10,000,000
$12,000,000
$14,000,000
BVCHC PPDR Medical Margin
Sum of Premium
Sum of Expenses
2-per. Moving Avg (Premium)
2-per. Moving Avg (Expenses)
Medicaid Expansion Added to PPDR
$0.00
$50.00
$100.00
$150.00
$200.00
$250.00
$300.00
$350.00
$400.00
$0
$500,000
$1,000,000
$1,500,000
$2,000,000
$2,500,000
$3,000,000
$3,500,000
$4,000,000
PMPM
Mar
gin
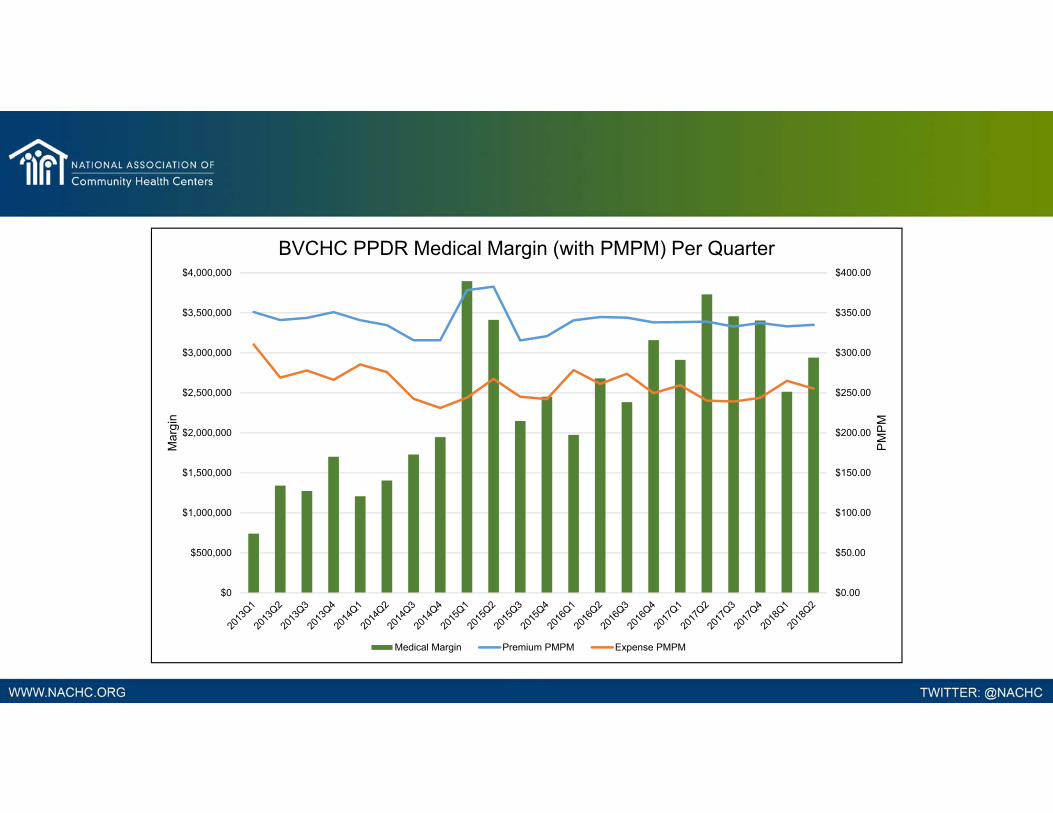
BVCHC PPDR Medical Margin (with PMPM) Per Quarter
Medical Margin Premium PMPM Expense PMPM
$0.00
$50.00
$100.00
$150.00
$200.00
$250.00
$300.00
$350.00
$400.00
$450.00
0
5,000
10,000
15,000
20,000
25,000
30,000
35,000
40,000
PMPM
Mem
ber M
onths
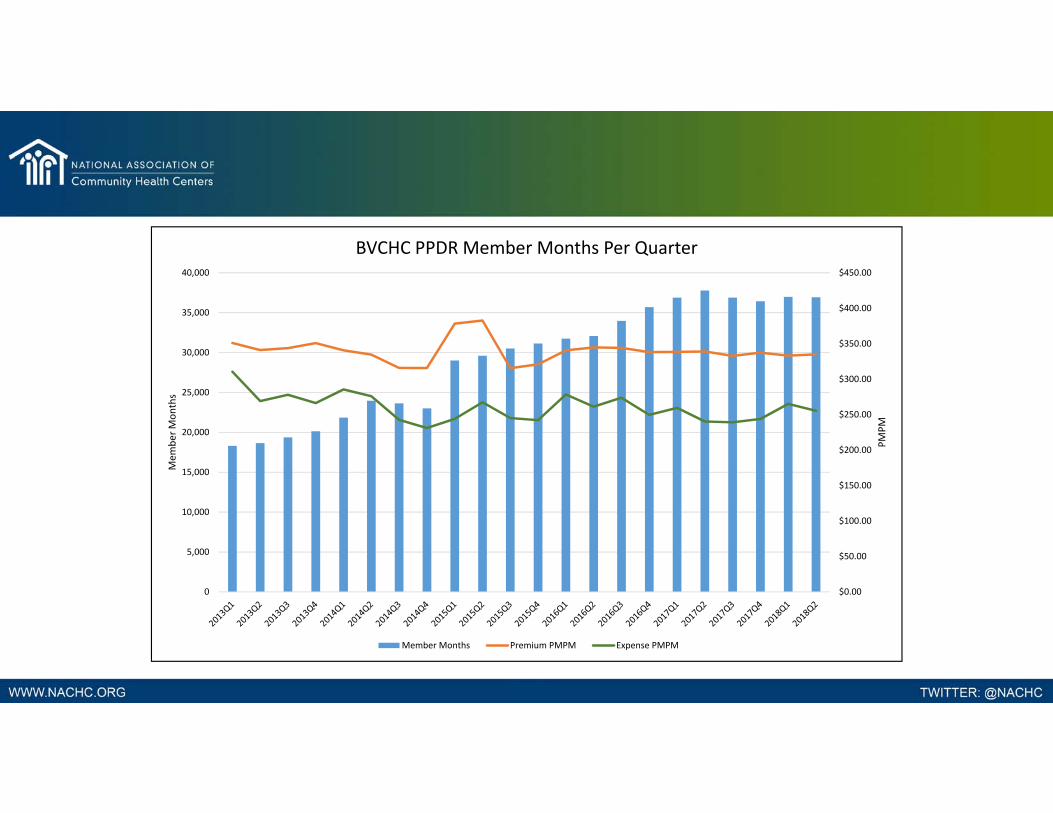
BVCHC PPDR Member Months Per Quarter
Member Months Premium PMPM Expense PMPM
$-
$20.00
$40.00
$60.00
$80.00
$100.00
$120.00
$140.00
$160.00
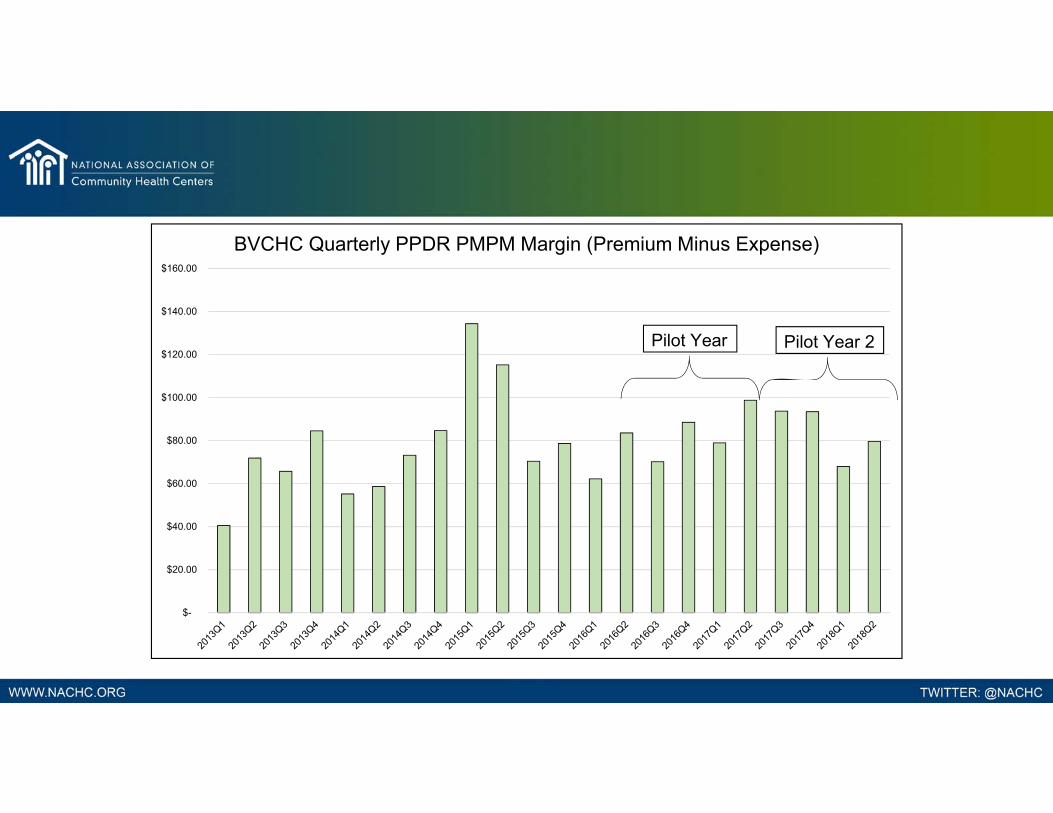
BVCHC Quarterly PPDR PMPM Margin (Premium Minus Expense)
Pilot Year Pilot Year 2

$11,
701,
814
$12,
073,
325
$12,
489,
081
$12,
807,
028
$9,5
41,6
19
$9,1
27,2
61
$9,5
75,6
63
$9,0
76,0
16
33,980 35,686 36,896 37,772
-
5,000
10,000
15,000
20,000
25,000
30,000
35,000
40,000
$-
$2,000,000
$4,000,000
$6,000,000
$8,000,000
$10,000,000
$12,000,000
$14,000,000
2016Q3 2016Q4 2017Q1 2017Q2
Mem
ber M
onth
s
Prem
ium
/Exp
ense
s
BVCHC PPDR Med. Margin (SFY 2017 - Pilot Year 1)
Premium Expenses Member Months

Shared Savings Pool = Predicted Minus Actual Costs104,554 Member Months
$2,140,834 Savings Pool $20.47 PMPM($4.80 PMPM) Claw-Back
$1,638,847 $15.67 PMPM Net Savings Pool
($819,423) ($7.84 PMPM) Share to NHPRI$819,423 $7.84 PMPM Share to BVCHC
($204,856) ($1.96 PMPM) Quality Penalty$614,567 $5.88 BVCHC Shared Savings
$37,320,559
$27,642,818
$11,750,689
$2,140,834
0
20,000
40,000
60,000
80,000
100,000
120,000
140,000
160,000
$-
$10,000,000
$20,000,000
$30,000,000
$40,000,000
$50,000,000
$60,000,000
SFY 2017 PPDR SFY 2017 TCOC
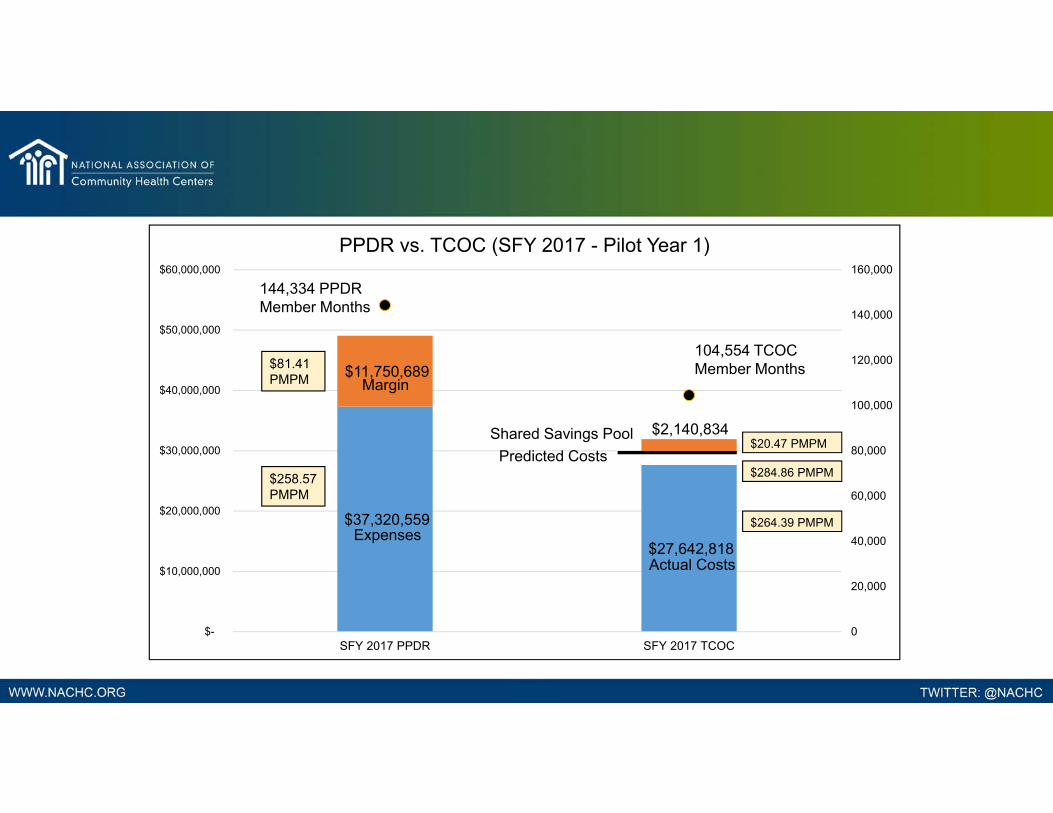
PPDR vs. TCOC (SFY 2017 - Pilot Year 1)
144,334 PPDR Member Months
104,554 TCOC Member Months
$20.47 PMPMShared Savings Pool
$284.86 PMPM
$264.39 PMPM
Predicted Costs
Margin
Expenses
Actual Costs
$81.41 PMPM
$258.57 PMPM

$2,140,834
$1,638,846
$819,423
$614,567
$-
$500,000
$1,000,000
$1,500,000
$2,000,000
$2,500,000
NHP TCOC Model – Pilot Year 1
TCOC Margin
Less: EOHHS Expected Savings
Less: NHP Adjustment (50%)
QualityMultiplier (0.75)
$20.47 PMPM
- $4.80 PMPM
- $7.84 PMPM
$15.67 PMPM
$7.84 PMPM - $1.96 PMPM
$5.88 PMPM
NHPRI BVCHC
PPDR $81.41 $0
TCOC $14.59 $5.88
104,554 Member Months
MM PMPM MM PMPM MM PMPM MM PMPM MM PMPM36,889 $312.90 36,437 $310.39 36,974 $310.59 36,935 $310.84 147,235 $311.18
$12,279,413 $332.87 $12,292,089 $337.35 $12,318,663 $333.17 $12,374,629 $335.04 $49,264,794 $334.60
Expenses$483,332 $13.10 $472,006 $12.95 $465,330 $12.59 $456,744 $12.37 $1,877,412 $12.75
$4,063,523 $110.15 $3,821,080 $104.87 $4,305,178 $116.44 $3,647,315 $98.75 $15,837,096 $107.56$2,124,048 $57.58 $2,162,268 $59.34 $2,239,668 $60.57 $2,274,359 $61.58 $8,800,343 $59.77$1,172,675 $31.79 $1,358,495 $37.28 $1,453,488 $39.31 $1,688,472 $45.71 $5,673,130 $38.53$1,206,824 $32.71 $1,082,004 $29.70 $1,380,849 $37.35 $1,408,799 $38.14 $5,078,476 $34.49($228,297) ($6.19) ($9,175) ($0.25) ($40,622) ($1.10) ($43,018) ($1.16) ($321,112) ($2.18)$8,822,105 $239.15 $8,886,678 $243.89 $9,803,891 $265.16 $9,432,671 $255.39 $36,945,345 $250.93$3,457,308 $93.72 $3,405,411 $93.46 $2,514,772 $68.01 $2,941,958 $79.65 $12,319,449 $83.67
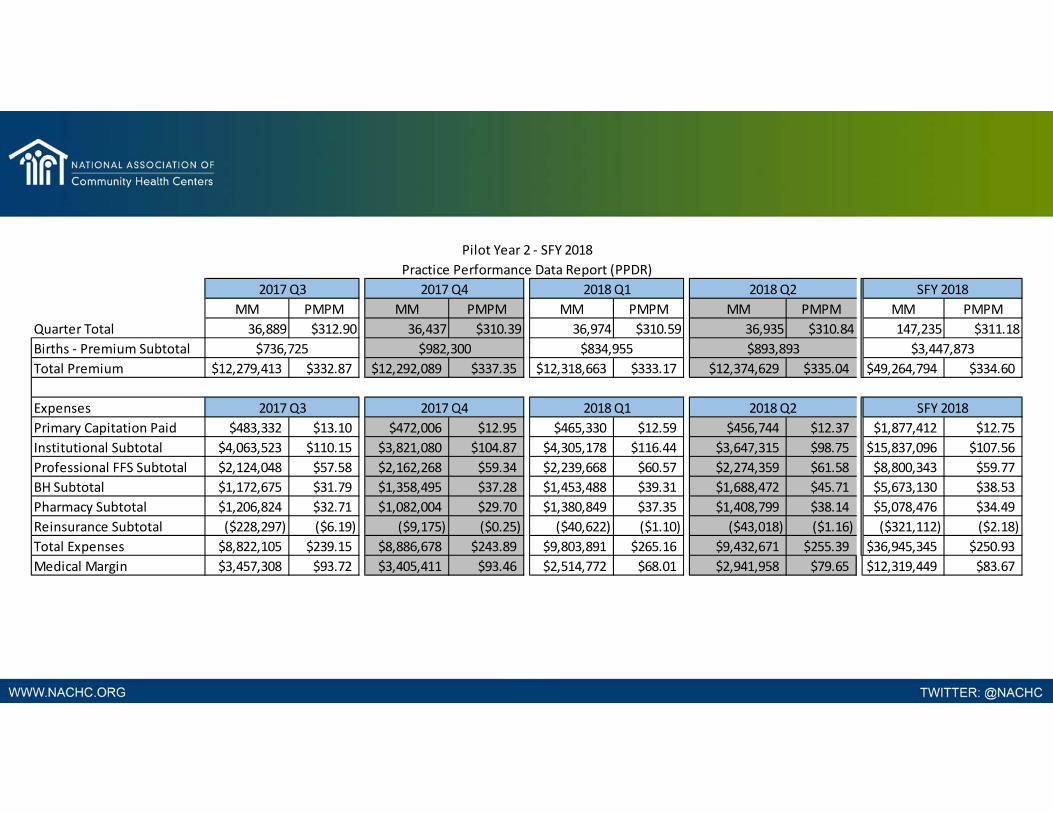
Pilot Year 2 ‐ SFY 2018Practice Performance Data Report (PPDR)
2017 Q3 2017 Q4 2018 Q1 2018 Q2 SFY 2018
Quarter TotalBirths ‐ Premium Subtotal $736,725 $982,300 $834,955 $3,447,873Total Premium
Primary Capitation PaidInstitutional SubtotalProfessional FFS Subtotal
2018 Q1 SFY 20182018 Q2
$893,893
Pharmacy SubtotalReinsurance SubtotalTotal ExpensesMedical Margin
2017 Q42017 Q3
BH Subtotal
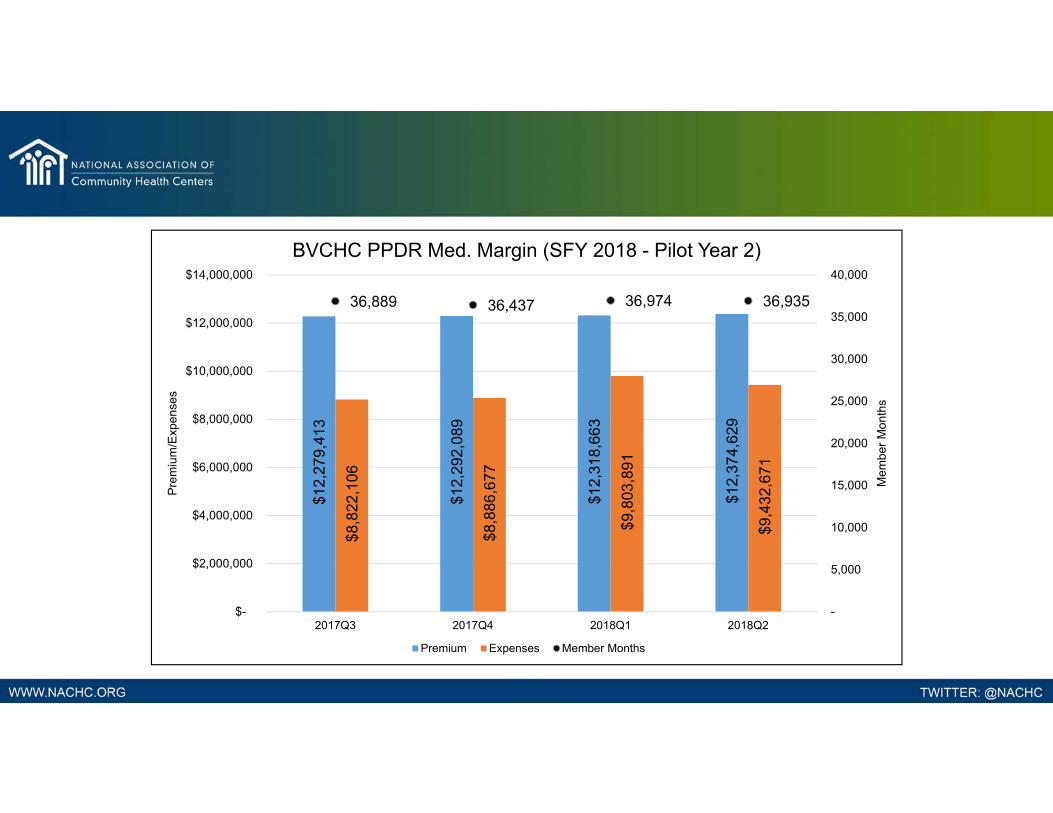
$12,
279,
413
$12,
292,
089
$12,
318,
663
$12,
374,
629
$8,8
22,1
06
$8,8
86,6
77
$9,8
03,8
91
$9,4
32,6
71
36,889 36,437 36,974 36,935
-
5,000
10,000
15,000
20,000
25,000
30,000
35,000
40,000
$-
$2,000,000
$4,000,000
$6,000,000
$8,000,000
$10,000,000
$12,000,000
$14,000,000
2017Q3 2017Q4 2018Q1 2018Q2
Mem
ber M
onth
s
Prem
ium
/Exp
ense
s
BVCHC PPDR Med. Margin (SFY 2018 - Pilot Year 2)
Premium Expenses Member Months
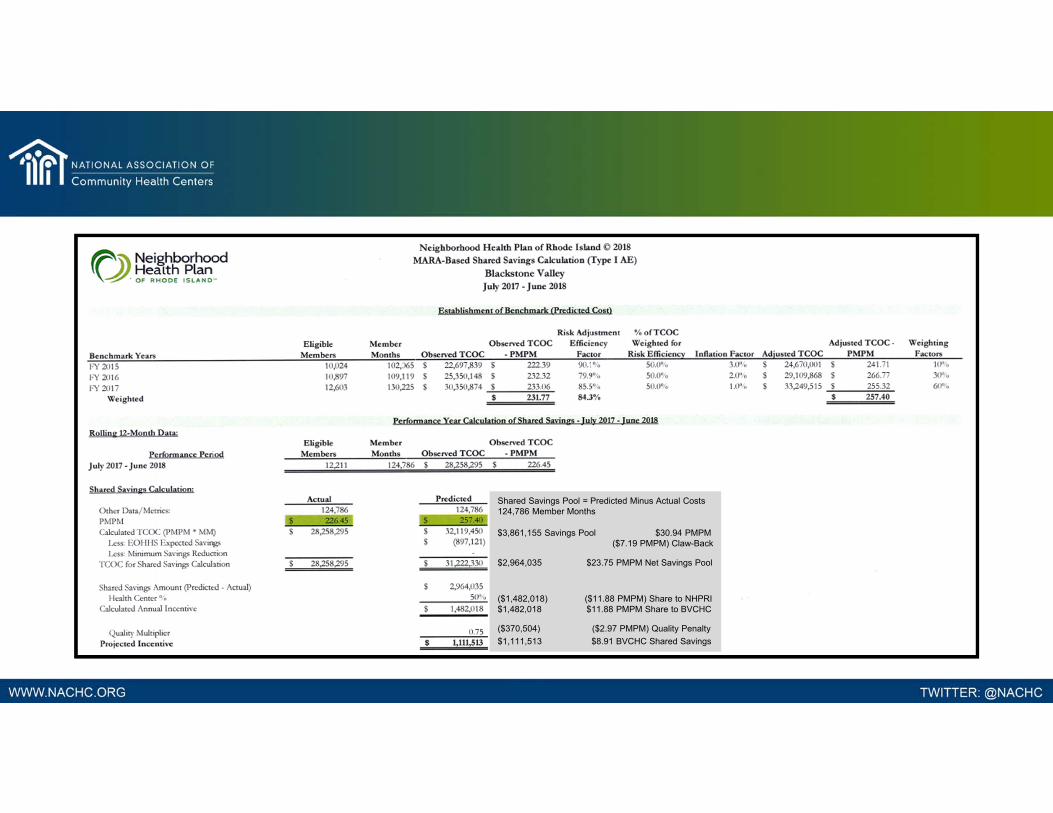
Shared Savings Pool = Predicted Minus Actual Costs124,786 Member Months
$3,861,155 Savings Pool $30.94 PMPM($7.19 PMPM) Claw-Back
$2,964,035 $23.75 PMPM Net Savings Pool
($1,482,018) ($11.88 PMPM) Share to NHPRI$1,482,018 $11.88 PMPM Share to BVCHC
($370,504) ($2.97 PMPM) Quality Penalty$1,111,513 $8.91 BVCHC Shared Savings
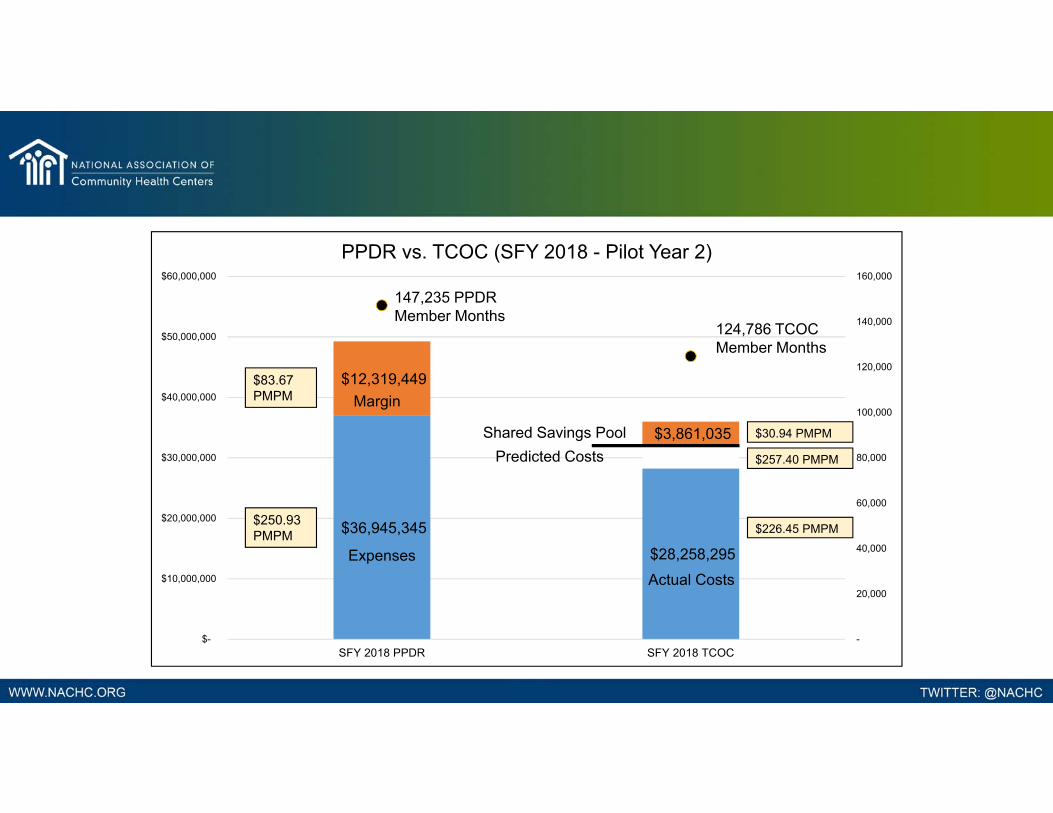
$36,945,345 $28,258,295
$12,319,449
$3,861,035
-
20,000
40,000
60,000
80,000
100,000
120,000
140,000
160,000
$-
$10,000,000
$20,000,000
$30,000,000
$40,000,000
$50,000,000
$60,000,000
SFY 2018 PPDR SFY 2018 TCOC
PPDR vs. TCOC (SFY 2018 - Pilot Year 2)
Shared Savings Pool
147,235 PPDR Member Months
124,786 TCOC Member Months
$83.67 PMPM
$250.93 PMPM
$30.94 PMPM
Predicted Costs
Margin
ExpensesActual Costs
$226.45 PMPM
$257.40 PMPM
$3,861,155
$2,964,035
$1,482,018 $1,111,513
$-
$500,000
$1,000,000
$1,500,000
$2,000,000
$2,500,000
$3,000,000
$3,500,000
$4,000,000
$4,500,000
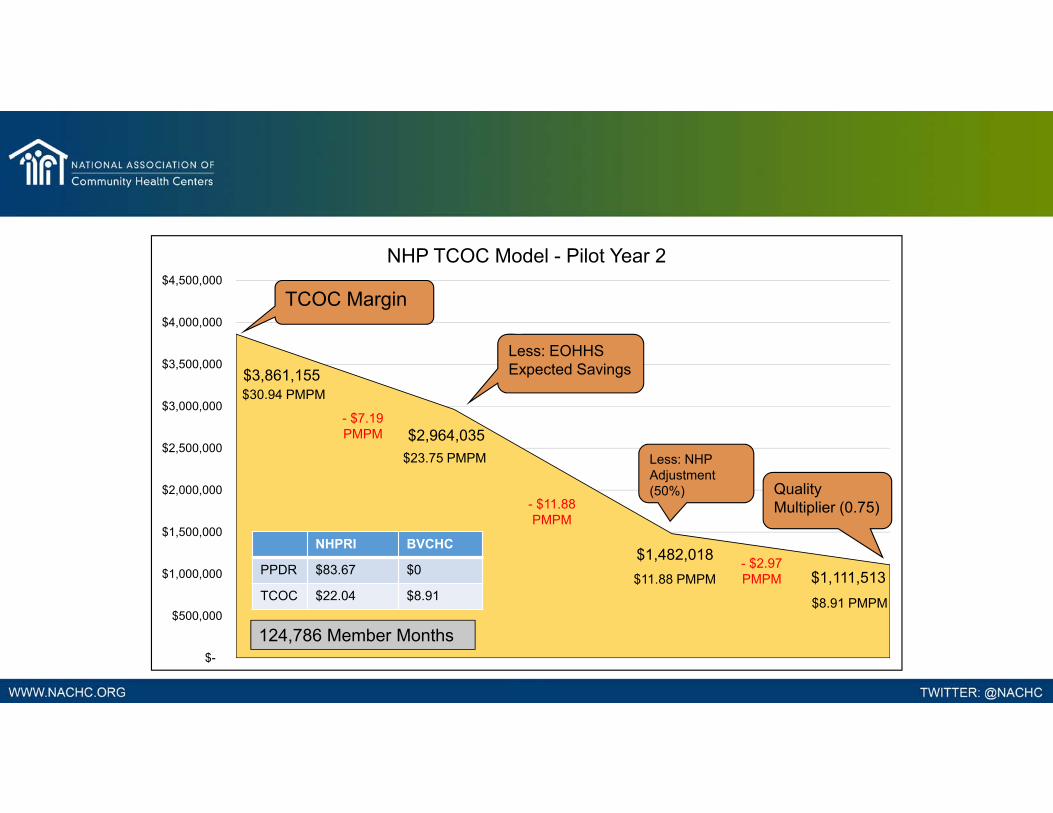
NHP TCOC Model - Pilot Year 2
TCOC Margin
Less: EOHHS Expected Savings
Less: NHP Adjustment (50%) Quality
Multiplier (0.75)
$30.94 PMPM
- $7.19 PMPM
$23.75 PMPM
$11.88 PMPM
$8.91 PMPM
- $2.97 PMPM
- $11.88 PMPM
NHPRI BVCHC
PPDR $83.67 $0
TCOC $22.04 $8.91
124,786 Member Months

At Jessie Trice Community Health System, Inc.
Accountable Care Organizations
A Health Center’s Board Member Perspective

At Jessie Trice Community Health System, Inc.
MISSIONThe Mission of Jessie Trice Community Health System, Inc. is to improve health equality for our diverse South Florida community by providing and increasing access to quality comprehensive primary care services.
At Jessie Trice Community Health System, Inc.
VISIONJessie Trice Community Health System, Inc., is recognized as a health system of excellence and is the choice for health and wellness of our diverse community.
At Jessie Trice Community Health System, Inc.
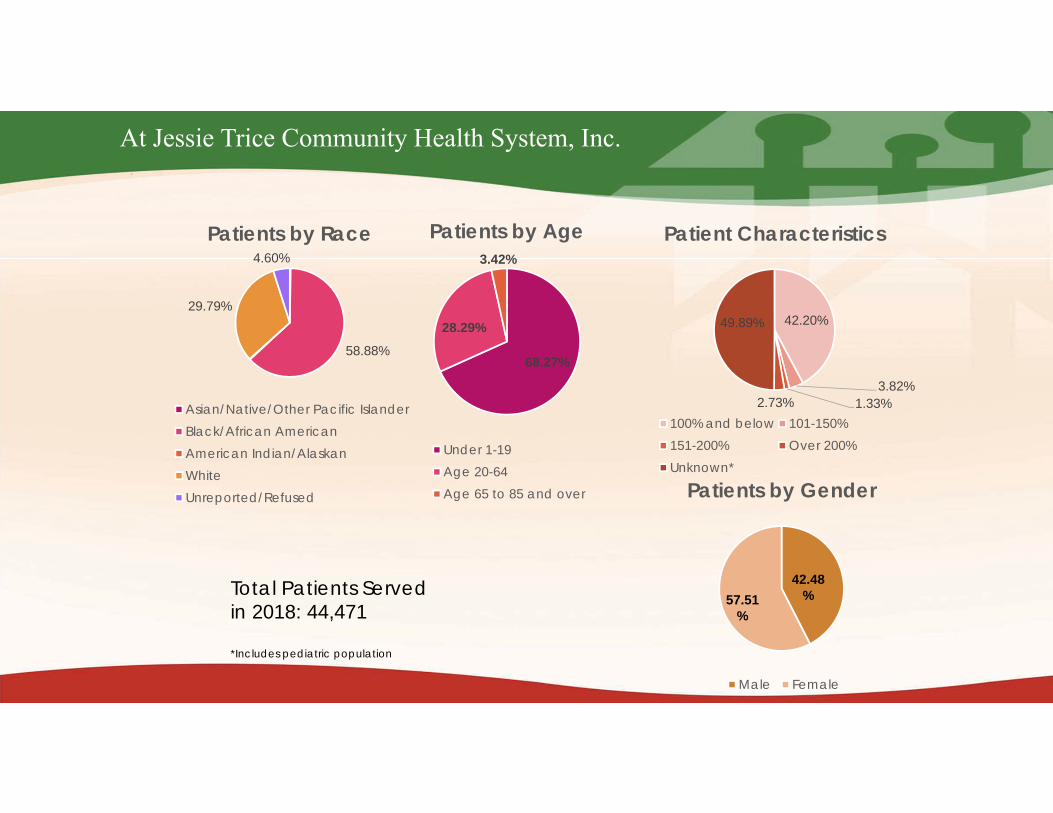
42.48%57.51
%
Patients by Gender
Male Female
68.27%
28.29%
3.42%
Patients by Age
Under 1-19Age 20-64Age 65 to 85 and over
42.20%
3.82%1.33%2.73%
49.89%
Patient Characteristics
100% and below 101-150%151-200% Over 200%Unknown*
Total Patients Served in 2018: 44,471
*Includes pediatric population
58.88%
29.79%
4.60%Patients by Race
Asian/Native/Other Pacific IslanderBlack/African AmericanAmerican Indian/AlaskanWhiteUnreported/Refused

At Jessie Trice Community Health System, Inc.
Why join an ACO? Strong base to draw on for transformation
Care is moving from volume to value
Options on risk
Permits FFS payments
Allows for payment of savings
Ties to Center’s journey to excellence
Supports Quadruple Aim
But, before you do…….

At Jessie Trice Community Health System, Inc.
Obtain full understanding of the ACO model and requirements:
ACO Board requirements Provider Majority - 75%
Member representative
Minimum of 5,000 Attributable
Centers can only participate in 1 ACO
ACO Overview

At Jessie Trice Community Health System, Inc.
Ensure understanding of the ACOmodel in consideration
Risk Shared savings only Commitment to meeting: Financial performance – must achieve minimum
savings rate to receive savings Thresholds for 31 quality measures must be met to
receive achieved savings
ACO Overview
At Jessie Trice Community Health System, Inc.
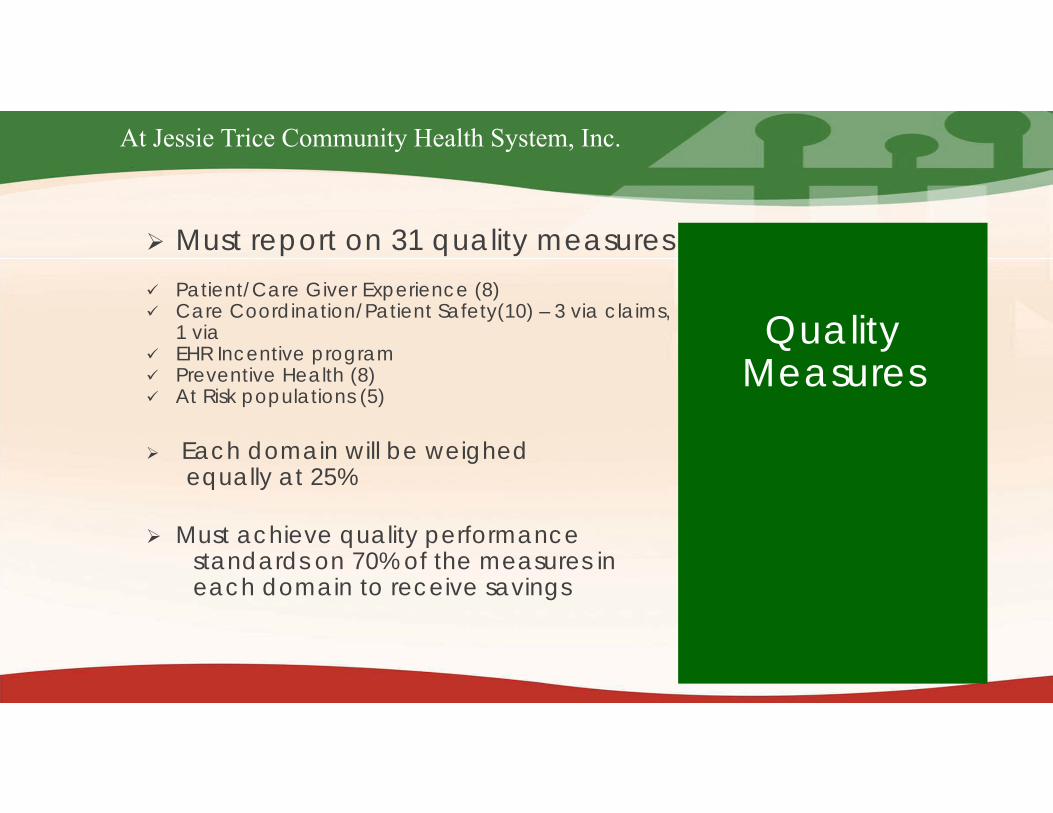
Must report on 31 quality measures Patient/Care Giver Experience (8) Care Coordination/Patient Safety(10) – 3 via claims,
1 via EHR Incentive program Preventive Health (8) At Risk populations (5)
Each domain will be weighed equally at 25%
Must achieve quality performancestandards on 70% of the measures ineach domain to receive savings
QualityMeasures

At Jessie Trice Community Health System, Inc.
1. Participation in ACO’s IT Analytics & QI Program
2. Implementation of care management program
3. Annual Wellness Visits4. Integrating ACO’s management tactics5. Choosing the ACO that is aligned with
Center’s mission6. Center’s level of involvement: Governance /decision making
Financial investment – Capital calls
Level of risk
CenterConsiderations

At Jessie Trice Community Health System, Inc.
Challenges
Assignment of Center Champion/Care Team Buy-in for limited population
Membership: retention and focused/targeted care management
Importance of data: knowing what to monitor and identifying key areas of focus – quality, utilization, determining key strategies
Financial perspective needed to sustain the organization; looking ahead

At Jessie Trice Community Health System, Inc.


Accountable Care for Boards: Learning from Health Center CEOs and
Boards that Have Joined Accountable Care Organizations
Policy & Issues ForumFriday, March 29, 2019
3:30pm – 5:00pm
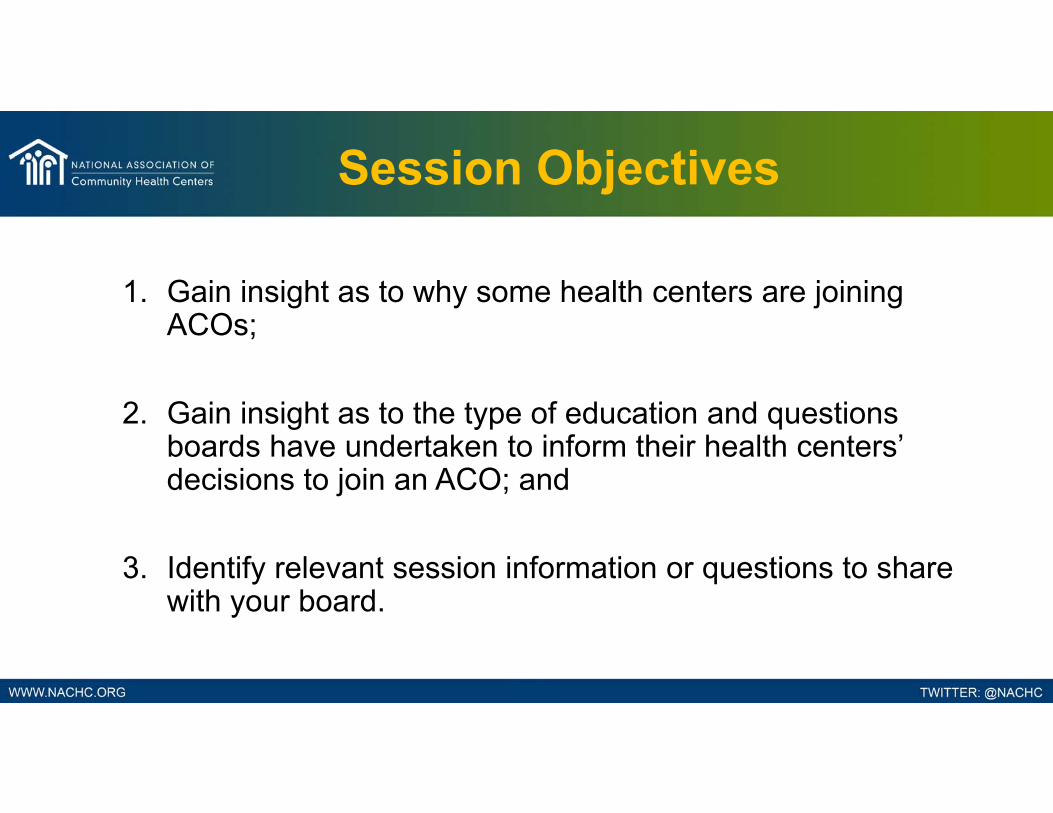
Session Objectives
1. Gain insight as to why some health centers are joining ACOs;
2. Gain insight as to the type of education and questions boards have undertaken to inform their health centers’ decisions to join an ACO; and
3. Identify relevant session information or questions to share with your board.
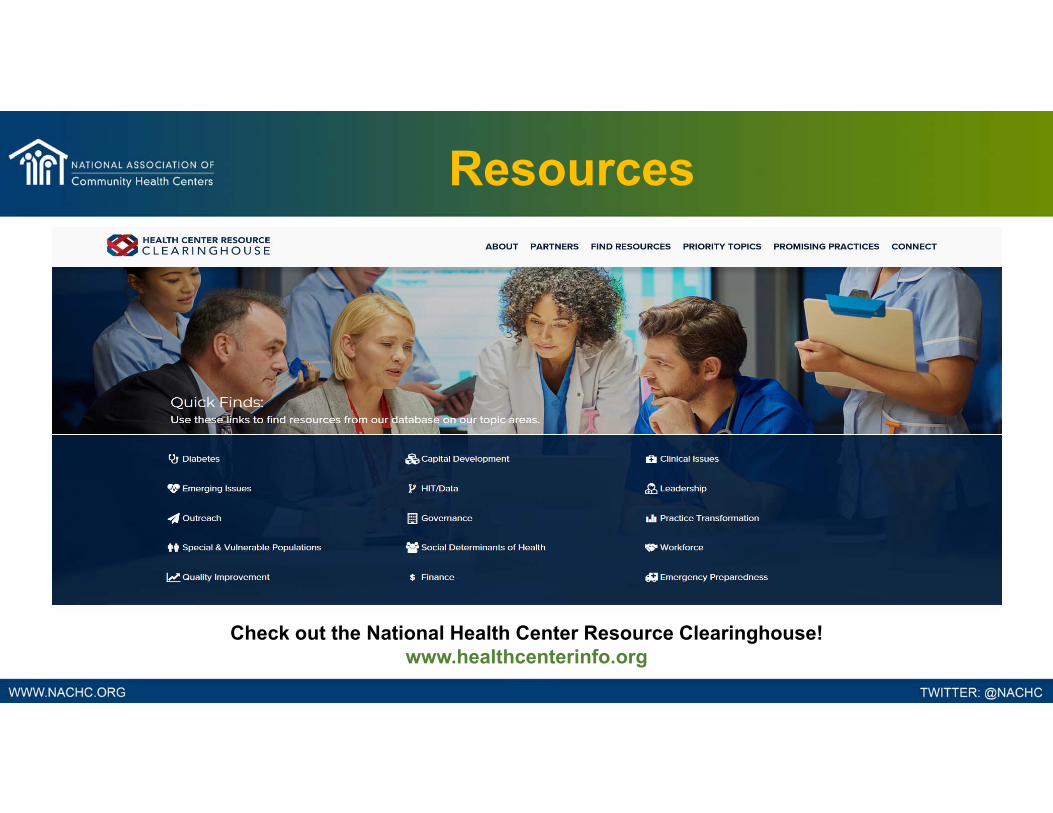
Resources
Check out the National Health Center Resource Clearinghouse! www.healthcenterinfo.org
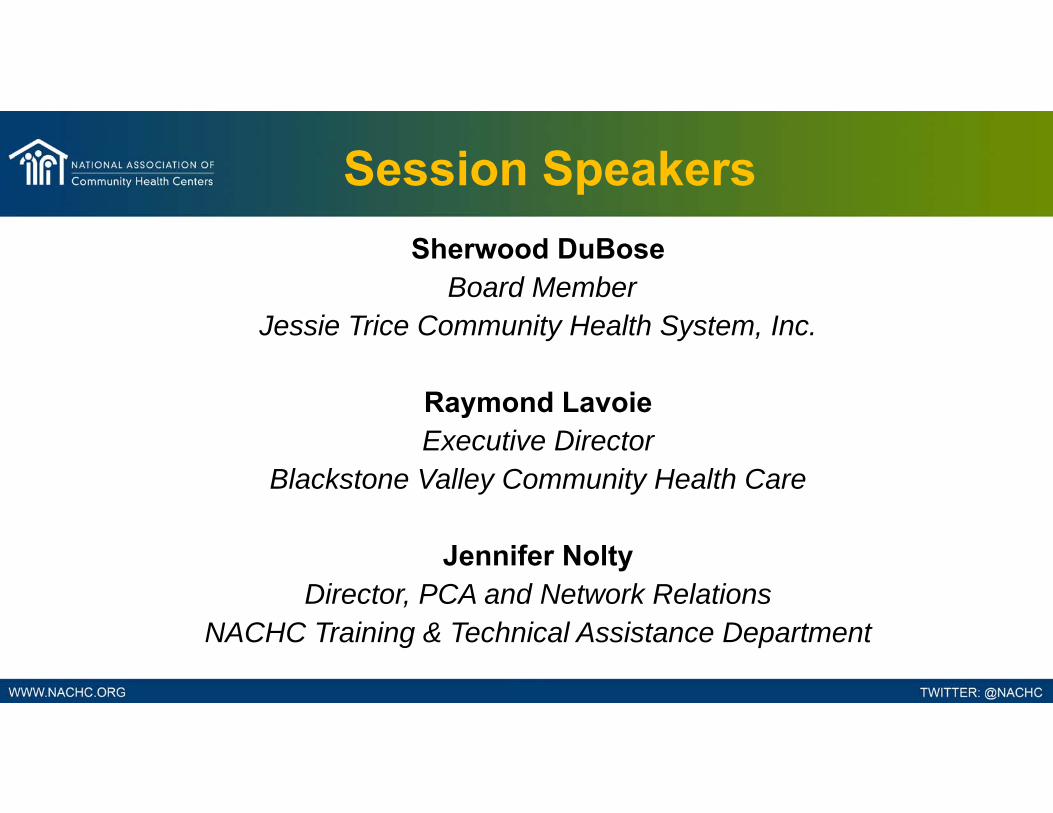
Session SpeakersSherwood DuBose
Board MemberJessie Trice Community Health System, Inc.
Raymond LavoieExecutive Director
Blackstone Valley Community Health Care
Jennifer NoltyDirector, PCA and Network Relations
NACHC Training & Technical Assistance Department

Who Is In the Room?• Do you represent:
• a Health Center?• a Primary Care Association?• a Health Center Controlled Network?
• Time as a Board Member:• less than one year• 5 – 10 years• more than 15 years
• Organization participates in an ACO?• thinking / talking about it• just joined an ACO• have been part of an ACO (or ACOs) for a number of years• no
Setting the Scene• Have you heard of any of the following?
• Value Based Payments
• ACOs
• MSSP ACO
• Attribution
• Risk
Role of the Board• Expectations of the Board in ACOs:
• Fiduciary• having the duty and trust to provide oversight and act for the good of the
health center, rather than personal benefit• protect the health center’s assets
• Understand what is happening in the Community
• Understand what is happening at your Health Center
• Asking Questions / Getting Information / Training• work closely with your CEO

Table DiscussionAt your tables take about 5 minutes to discuss these two questions:
1. Is your health center in an ACO or similar organization?
2. What tips would you share related to board education or critical questions your board asked?

Q & A

Resources
Check out the National Health Center Resource Clearinghouse! www.healthcenterinfo.org
Thank You!Sherwood DuBose
Board MemberJessie Trice Community Health System, Inc.
Raymond LavoieExecutive Director
Blackstone Valley Community Health Care
Jennifer NoltyDirector, PCA and Network Relations
NACHC Training & Technical Assistance Department