Total and Fecal Coliform TMDLs for Hillsborough … Report: Tampa Bay Tributaries Basin,...
45
FINAL FLORIDA DEPARTMENT OF ENVIRONMENTAL PROTECTION Division of Water Resource Management, Bureau of Watershed Management SOUTHWEST DISTRICT • TAMPA BAY TRIBUTARIES BASIN TMDL Report Total and Fecal Coliform TMDLs for Hillsborough River, WBID 1443E Douglas Gilbert, FDEP September 17, 2004
Transcript of Total and Fecal Coliform TMDLs for Hillsborough … Report: Tampa Bay Tributaries Basin,...

FINAL
FLORIDA DEPARTMENT OF ENVIRONMENTAL PROTECTION
Division of Water Resource Management, Bureau of Watershed Management
SOUTHWEST DISTRICT • TAMPA BAY TRIBUTARIES BASIN
TMDL Report
Total and Fecal Coliform TMDLs for Hillsborough River,
WBID 1443E
Douglas Gilbert, FDEP
September 17, 2004

TMDL Report: Tampa Bay Tributaries Basin, Hillsborough River, WBID 1443E, Total/Fecal Coliform
Florida Department of Environmental Protection
ii
Acknowledgments
This study could not have been accomplished without significant contributions from staff in the Department’s Watershed Assessment Section. David Tyler and Barbara Donner provided many of the figures and land use aggregations. Molly Davis with Region 4, U.S. Environmental Protection Agency, provided most of the technical analysis. Editorial assistance was provided by Daryll Joyner, Jan Mandrup-Poulsen, and Linda Lord. For additional information on the watershed management approach and impaired waters in the Tampa Bay Tributaries Basin, contact Tom Singleton Florida Department of Environmental Protection Bureau of Watershed Management Watershed Planning and Coordination Section 2600 Blair Stone Road, Mail Station 3565 Tallahassee, FL 32399-2400 [email protected] Phone: (850) 245-8561; Suncom: 205-8561 Fax: (850) 245-8434 Access to all data used in the development of this report can be obtained by contacting Kevin Petrus Florida Department of Environmental Protection Bureau of Watershed Management Watershed Assessment Section 2600 Blair Stone Road, Mail Station 3555 Tallahassee, FL 32399-2400 [email protected] Phone: (850) 245-8459; Suncom: 205-8459 Fax: (850) 245-8536

TMDL Report: Tampa Bay Tributaries Basin, Hillsborough River, WBID 1443E, Total/Fecal Coliform
Florida Department of Environmental Protection
iii
Contents
Chapter 1: INTRODUCTION___________________________________1
1.1 Purpose of Report ________________________________________________1
1.2 Identification of Waterbody ________________________________________1
1.3 Background _____________________________________________________4
Chapter 2: DESCRIPTION OF WATER QUALITY PROBLEM ________5
2.1 Statutory Requirements and Rulemaking History ______________________5
2.2 Information on Verified Impairment__________________________________5
Chapter 3. DESCRIPTION OF APPLICABLE WATER QUALITY STANDARDS AND TARGETS _______________________6
3.1 Classification of the Waterbody and Criteria Applicable to the TMDL______6
3.2 Applicable Water Quality Standards and Numeric Water Quality Target ___6
Chapter 4: ASSESSMENT OF SOURCES________________________7
4.1 Types of Sources_________________________________________________7
4.2 Potential Sources of Total and Fecal Coliform in WBID 1443E of the Hillsborough River Watershed _________________________________________7
4.2.1 Point Sources _________________________________________________7 4.2.2 Land Uses and Nonpoint Sources _________________________________9
4.4 Source Summary________________________________________________12 4.4.1 Summary of Total Coliform Loadings into WBID 1443E from Various
Sources ____________________________________________________12
Chapter 5: DETERMINATION OF ASSIMILATIVE CAPACITY_______13
5.1 Determination of Assimilative Capacity______________________________13 5.1.1 Data Used in the Determination of the TMDL ________________________13 5.1.2 TMDL Development Process ____________________________________14 5.1.3 Critical Conditions/Seasonality ___________________________________14
Chapter 6: DETERMINATION OF THE TMDL ____________________18
6.1 Expression and Allocation of the TMDL _____________________________18
6.2 Load Allocation _________________________________________________19
6.3 Wasteload Allocation ____________________________________________19 6.3.1 NPDES Wastewater Discharges__________________________________19 6.3.2 NPDES Stormwater Discharges __________________________________19

TMDL Report: Tampa Bay Tributaries Basin, Hillsborough River, WBID 1443E, Total/Fecal Coliform
Florida Department of Environmental Protection
iv
6.4 Margin of Safety_________________________________________________20
Chapter 7: NEXT STEPS: IMPLEMENTATION PLAN DEVELOPMENT AND BEYOND _____________________21
7.1 Basin Management Action Plan____________________________________21
References _______________________________________________22
Appendices _______________________________________________23
Appendix A. Background Information on Federal and State Stormwater Programs__________________________________________________________23
Appendix B. Observed Data for Calculating Percent Reductions for Fecal Coliform for the Hillsborough River, WBID 1443E ________________________24
Appendix C. Observed Data for Calculating Percent Reductions for Total Coliform for the Hillsborough River, WBID 1443E ________________________32
List of Tables
Table 2.1. Summary of Total and Fecal Coliform Data__________________________5 Table 4.1. Flow Data for Lowry Park Zoo ____________________________________8 Table 4.2. Livestock Distribution for Hillsborough County _______________________9 Table 4.3. Classification of Land Use Categories (Level 1) in WBID 1443E ________10 Table 4.4. Average Daily Quantity of Total and Fecal Coliform Loading into
WBID 1443E _____________________________________________12 Table 5.1. Observed Data at Sampling Sites, WBID 1443E_____________________13 Table 5.2. Total and Fecal Coliform Exceedances, by Season___________________15 Table 6.1. TMDL Components for WBID 1443E of the Hillsborough River _________19
List of Figures
Figure 1.1. Florida Department of Environmental Protection’s Southwest District Basin Groups: Hillsborough River in Group 2_______________2
Figure 1.2. Location of WBID 1443E and Major Geopolitical Features in the Hillsborough River Watershed _________________________________3
Figure 4.1. Principal Land Uses and NPDES Facilities in WBID 1443E____________11 Figure 5.1. Historical Monitoring Sites in WBID 1443E ________________________14 Figure 5.2. Total Coliform Exceedances by Season (1=Jan+Feb+Mar, 2=
Apr+May+Jun, 3=Jul+Aug+Sep, 4=Oct+Nov+Dec)________________15 Figure 5.3. Fecal Coliform Exceedances by Season (1=Jan+Feb+ Mar, 2=
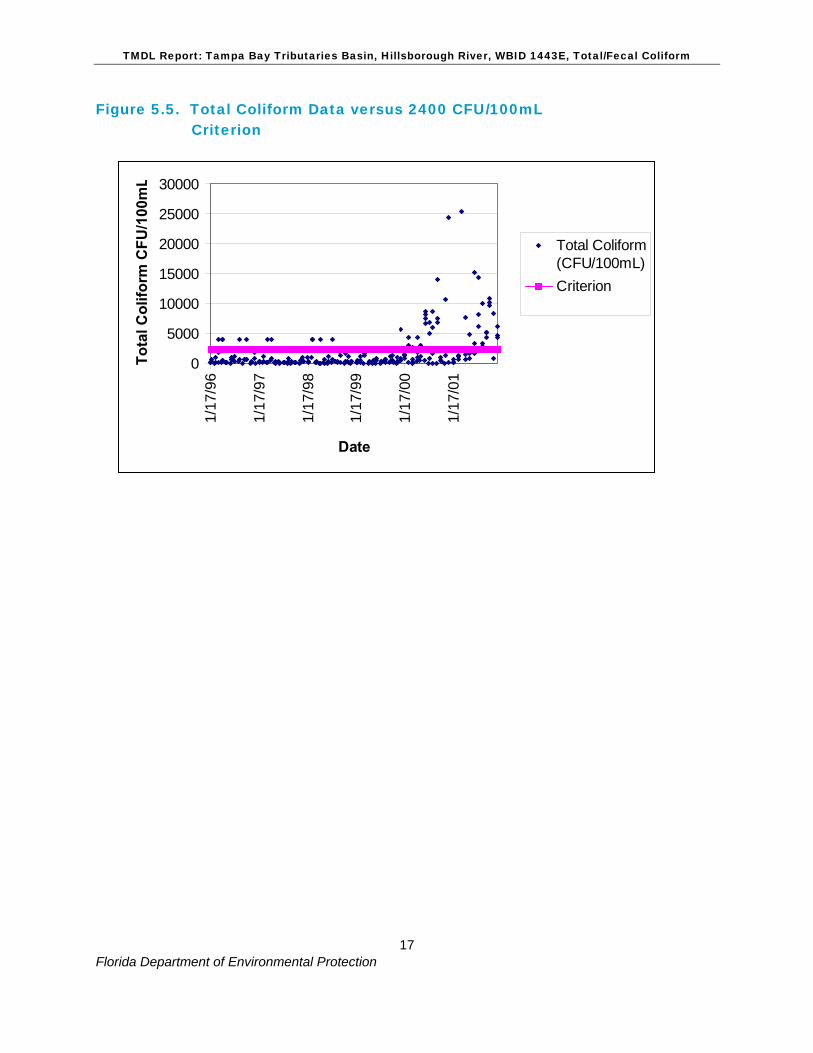
Apr+May+Jun, 3=Jul+Aug+Sep, 4=Oct+Nov+Dec)________________16 Figure 5.4. Fecal Coliform Data versus 400 CFU/100mL Criterion _______________16 Figure 5.5. Total Coliform Data versus 2400 CFU/100mL Criterion_______________17

TMDL Report: Tampa Bay Tributaries Basin, Hillsborough River, WBID 1443E, Total/Fecal Coliform
Florida Department of Environmental Protection
v
Web sites
Florida Department of Environmental Protection, Bureau of Watershed Management
TMDL Program http://www.dep.state.fl.us/water/tmdl/index.htmIdentification of Impaired Surface Waters Rule http://www.dep.state.fl.us/water/tmdl/docs/AmendedIWR.pdfSTORET Program http://www.dep.state.fl.us/water/storet/index.htm2002 305(b) Report http://www.dep.state.fl.us/water/docs/2002_305b.pdfCriteria for Surface Water Quality Classifications http://www.dep.state.fl.us/legal/rules/shared/62-302t.pdfBasin Status Report for the Tampa Bay Tributaries Basin http://www.dep.state.fl.us/water/tmdl/stat_rep.htmWater Quality Assessment Report for the Tampa Bay Tributaries Basin http://www.dep.state.fl.us/water/tmdl/stat_rep.htmAllocation Technical Advisory Committee (ATAC) Report http://www.dep.state.fl.us/water/tmdl/docs/Allocation.pdf
U.S. Environmental Protection Agency
Region 4: Total Maximum Daily Loads in Florida http://www.epa.gov/region4/water/tmdl/florida/ National STORET Program http://www.epa.gov/storet/


TMDL Report: Tampa Bay Tributaries Basin, Hillsborough River, WBID 1443E, Total/Fecal Coliform
Florida Department of Environmental Protection
1
Chapter 1: INTRODUCTION
1.1 Purpose of Report
This report presents the Total Maximum Daily Loads (TMDLs) for both total and fecal coliform for a segment of the Hillsborough River in the Tampa Bay Tributaries Basin. The river segment was verified as impaired for total and fecal coliform, and was included on the Verified List of impaired waters for the Tampa Bay Tributaries Basin that was adopted by Secretarial Order in May 2004. The TMDL establishes the allowable loadings of total and fecal coliform to WBID 1443E of the Hillsborough River that would restore the waterbody so that it meets the applicable water quality criteria.
1.2 Identification of Waterbody
The Hillsborough River, located in the Hillsborough River Planning Unit, extends over parts of three counties, including much of the northeastern quarter of Hillsborough County, a large area of central Pasco County, and a small portion of northwestern Polk County. It is bounded to the north by the Withlacoochee River watershed, to the east by the Peace River watershed, to the south by the Alafia River watershed, and to the west by the north coastal and Tampa Bay watersheds (Southwest Florida Water Management District, 1999) (Figure 1.1). The Hillsborough River Basin (Figure 1.2) begins east-northeast of Zephyrhills in southeastern Pasco and northwestern Polk Counties. Its headwaters originate in the southwestern portion of the Green Swamp, where it also receives overflow from the Withlacoochee River. The river channel is not clearly defined until the river leaves the swamp. From there, it flows southwesterly 54 miles to upper Hillsborough Bay and drains more than 690 square miles. Perennially flowing tributaries to the Hillsborough River are Big Ditch and Flint Creek. Intermittent streams are Indian Creek, New River, Two Hole Branch, Basset Branch, Hollomans Branch, Clay Gully, Trout Creek, Blackwater Creek, and Cypress Creek. High floodwaters are diverted from the Hillsborough River at the confluence of Trout Creek and upstream of the Tampa Reservoir Dam through the Tampa Bypass Canal to McKay Bay. Channelization has extended Sixmile Creek west and north to intersect the Hillsborough River at two points, at the confluence of Trout Creek and near the midpoint of Tampa Reservoir, which supplies drinking water to the city of Tampa. The modified Sixmile Creek was then renamed the Tampa Bypass Canal, which comprises two canals. The Harney Canal (C-136) runs from the Tampa Reservoir to join the second and longer canal, C-135, which connects the Hillsborough River at Trout Creek and Palm River. Both canals control flooding in the city of Tampa. Urban and built-up areas dominate the landscape in the southern quarter of the planning unit, which includes the urban and suburban areas of Tampa, Plant City, and Lakeland. In the upper half of the planning unit, urban and suburban areas appear as an east-west band encompassing Zephyrhills, Wesley Chapel, and Land O’ Lakes. Together, urban and built-up lands comprise 25 percent of the total area. Within the region characterized by expanding population growth and land development, large areas of swamps and forested uplands remain undeveloped along

TMDL Report: Tampa Bay Tributaries Basin, Hillsborough River, WBID 1443E, Total/Fecal Coliform
Florida Department of Environmental Protection
2
portions of the Hillsborough River and its principal tributaries. Other undeveloped lands and natural lands (uplands and wetlands) comprise 39 percent of the planning unit.
Figure 1.1. Florida Department of Environmental Protection’s Southwest District Basin Groups: Hillsborough River in Group 2
WBID 1443E

TMDL Report: Tampa Bay Tributaries Basin, Hillsborough River, WBID 1443E, Total/Fecal Coliform
Florida Department of Environmental Protection
3
Throughout most of the rest of the planning unit, particularly in the upper reaches of its tributaries, land uses are primarily rangeland, pasture, and agriculture, including citrus groves and row crops. The greatest acreages of citrus are around Land O’ Lakes, the Plant City/Dover/Seffner area south and east of Lake Thonotosassa, in the area around Lakeland, and in a wide area north of Zephyrhills. Generally, the northern and central portions of the watershed are rural, while the southern portions are mainly urban and industrial. However, suburban development radiating from major urban areas such as Tampa is spreading into rural areas. Additional information about the river’s hydrology and geology are available in the Basin Status Report for the Tampa Bay Tributaries Basin (Florida Department of Environmental Protection, 2003). For assessment purposes, the Florida Department of Environmental Protection (Department) has divided the Tampa Bay Tributaries Basin into water assessment polygons with a unique waterbody identification (WBID) number for each watershed or stream reach. The Hillsborough River has been divided into WBIDs or segments, and these TMDLs address WBID 1443E (Figure 1.2).
Figure 1.2. Location of WBID 1443E and Major Geopolitical Features in the Hillsborough River Watershed
TAM PA
8 0 8 16 Miles
N
EW
S
#
City of Tampa
#
WBID 1443E
#
Hillsborough River
#
I-75
#
I 275
#
Mouth of Hillsborough River
#
Hillsborough Bay

TMDL Report: Tampa Bay Tributaries Basin, Hillsborough River, WBID 1443E, Total/Fecal Coliform
Florida Department of Environmental Protection
4
1.3 Background
This report was developed as part of the Department’s watershed management approach for restoring and protecting state waters and addressing TMDL Program requirements. The watershed approach, which is implemented using a cyclical management process that rotates through the state’s 52 river basins over a 5-year cycle, provides a framework for implementing the TMDL Program–related requirements of the 1972 federal Clean Water Act and the 1999 Florida Watershed Restoration Act (FWRA, Chapter 99-223, Laws of Florida). A TMDL represents the maximum amount of a given pollutant that a waterbody can assimilate and still meet water quality standards, including its applicable water quality criteria and its designated uses. TMDLs are developed for waterbodies that are verified as not meeting their water quality standards. TMDLs provide important water quality restoration goals that will guide restoration activities. This TMDL Report will be followed by the development and implementation of a Basin Management Action Plan, or BMAP, to reduce the amount of total and fecal coliform that caused the verified impairment of WBID 1443E of the Hillsborough River. These activities will depend heavily on the active participation of the Southwest Florida Water Management District (SWFEMD), local governments, businesses, and other stakeholders. The Department will work with these organizations and individuals to undertake or continue reductions in the discharge of pollutants and achieve the established TMDLs for impaired waterbodies.

TMDL Report: Tampa Bay Tributaries Basin, Hillsborough River, WBID 1443E, Total/Fecal Coliform
Florida Department of Environmental Protection
5
Chapter 2: DESCRIPTION OF WATER QUALITY PROBLEM
2.1 Statutory Requirements and Rulemaking History
Section 303(d) of the federal Clean Water Act requires states to submit to the U.S. Environmental Protection Agency (EPA) a list of surface waters that do not meet applicable water quality standards (impaired waters) and establish a TMDL for each pollutant source in each of these impaired waters on a schedule. The Department has developed such lists, commonly referred to as 303(d) lists, since 1992. The list of impaired waters in each basin, referred to as the Verified List, is also required by the FWRA (Subsection 403.067[4)] Florida Statutes [F.S.]). However, the FWRA (Section 403.067, F.S.) stated that all previous Florida 303(d) lists were for planning purposes only and directed the Department to develop, and adopt by rule, a new science-based methodology to identify impaired waters. After a long rule-making process, the Environmental Regulation Commission adopted the new methodology as Chapter 62-303, Florida Administrative Code (F.A.C.) (Identification of Impaired Surface Waters Rule, or IWR), in April 2001.
2.2 Information on Verified Impairment
The Department used the IWR to assess water quality impairments in the Tampa Bay Tributaries Basin and has verified the impairment for total and fecal coliform in WBID 1443E. Table 2.1 summarizes the assessment results for total and fecal coliform. The assessment period for total coliform was January 1996 through December 2001. For fecal coliform, the period of data was January 1996 through December 2002. As shown in Table 2.1, fecal coliform results ranged above 5,000 colony forming units (CFU). Wet-weather fecal coliform levels over 5,000 CFU/100 milliliters (mL) suggest (but do not prove) that human sources of bacteria could be present in the watershed (Watershed Protection Techniques, April 1999). In this study, the higher total and fecal coliform values do not appear restricted to wet-weather conditions. On the positive side, greater than 96 percent of the total coliform samples and 100 percent of the fecal coliform samples are less than 10,000 CFU/100mL, and 88 percent of the total coliform and 99 percent of the fecal coliform results are less than 5,000 CFU/100mL. Therefore, these higher concentrations are not routine. Table 2.1. Summary of Total and Fecal Coliform Data
Number of Samples
Number of Exceedances
Percent Exceedances
Maximum (CFU/100mL)
Average Exceedance (CFU/100mL)
Average of All Data
(CFU/100mL) Total Coliform 234 53 22.6% 25,400 6,835 1,945
Fecal Coliform 303 50 16.5% 7,700 1,214 315

TMDL Report: Tampa Bay Tributaries Basin, Hillsborough River, WBID 1443E, Total/Fecal Coliform
Florida Department of Environmental Protection
6
Chapter 3. DESCRIPTION OF APPLICABLE WATER QUALITY STANDARDS AND TARGETS
3.1 Classification of the Waterbody and Criteria Applicable to the TMDL
Florida’s surface waters are protected for five designated use classifications, as follows: Class I Potable water supplies Class II Shellfish propagation or harvesting Class III Recreation, propagation, and maintenance of a healthy, well-
balanced population of fish and wildlife Class IV Agricultural water supplies Class V Navigation, utility, and industrial use (there are no state
waters currently in this class)
This portion of the Hillsborough River is a Class III waterbody, with a designated use of recreation, propagation, and maintenance of a healthy, well-balanced population of fish and wildlife.
3.2 Applicable Water Quality Standards and Numeric Water Quality Target
Numeric criteria for bacterial quality are expressed in terms of fecal coliform bacteria and total coliform bacteria concentrations. The water quality criteria for protection of Class III waters, as established by Chapter 62-302, F.A.C., state the following:
Fecal Coliform Bacteria: The most probable number (MPN) or membrane filter (MF) counts per 100 mL of fecal coliform bacteria shall not exceed a monthly average of 200, nor exceed 400 in 10 percent of the samples, nor exceed 800 on any one day. Total Coliform Bacteria: The MPN per 100 mL shall be less than or equal to 1,000 as a monthly average nor exceed 1,000 in more than 20 percent of the samples examined during any month; and less than or equal to 2,400 at any time.
For both parameters, the criteria state that monthly averages shall be expressed as geometric means based on a minimum of 10 samples taken over a 30-day period. During the development of load curves for the impaired stream (as described in subsequent chapters), there were insufficient data (fewer than 10 samples in a given month) available to evaluate the geometric mean criterion for either fecal coliform or total coliform bacteria. Therefore, the criterion selected for the fecal coliform TMDL was not to exceed 400, and for total coliform, not to exceed 2,400 CFU/100mL.

TMDL Report: Tampa Bay Tributaries Basin, Hillsborough River, WBID 1443E, Total/Fecal Coliform
Florida Department of Environmental Protection
7
Chapter 4: ASSESSMENT OF SOURCES
4.1 Types of Sources
An important part of the TMDL analysis is the identification of pollutant source categories, source subcategories, or individual sources of total coliform in WBID 1443E of the Hillsborough River watershed, and the amount of pollutant loading contributed by each of these sources. Sources are broadly classified as either “point sources” or “nonpoint sources.” Historically, the term point sources has meant discharges to surface waters that typically have a continuous flow via a discernable, confined, and discrete conveyance, such as a pipe. Domestic and industrial wastewater treatment facilities (WWTFs) are examples of traditional point sources. In contrast, the term “nonpoint sources” was used to describe intermittent, rainfall driven, diffuse sources of pollution associated with everyday human activities, including runoff from urban land uses, agriculture, silviculture, and mining; discharges from failing septic systems; and atmospheric deposition (U.S. Environmental Protection Agency, 2001). However, the 1987 amendments to the Clean Water Act redefined certain nonpoint sources of pollution as point sources subject to regulation under the EPA’s National Pollutant Discharge Elimination System Program (NPDES). These nonpoint sources included certain urban stormwater discharges, including those from local government master drainage systems, construction sites over 5 acres, and a wide variety of industries (see Appendix A for background information on the federal and state stormwater programs). To be consistent with Clean Water Act definitions, the term “point source” will be used to describe traditional point sources (such as domestic and industrial wastewater discharges) and stormwater systems requiring an NPDES stormwater permit when allocating pollutant load reductions required by a TMDL (see Section 6.1). However, the methodologies used to estimate nonpoint source loads do not distinguish between NPDES stormwater discharges and non-NPDES stormwater discharges, and as such, this source assessment section does not make any distinction between the two types of stormwater.
4.2 Potential Sources of Total and Fecal Coliform in WBID 1443E of the Hillsborough River Watershed
Neither the upstream nor the downstream WBIDs are impaired for total or fecal coliforms. This indicates that the sources of the observed exceedances are likely from within WBID 1443E.
4.2.1 Point Sources
There are two NPDES permitted wastewater treatment facilities within WBID 1443E (Figure 4.1). Of these, only the Lowry Park facility (Lowry Park Zoological Society of Tampa Inc., Permit Number FL0186651-001-IW7C) has the potential to discharge total and fecal coliform loads directly into WBID 1443E of the Hillsborough River. The permit includes the authority to discharge industrial wastewater commingled with stormwater runoff via Outfall D001 to Hamilton

TMDL Report: Tampa Bay Tributaries Basin, Hillsborough River, WBID 1443E, Total/Fecal Coliform
Florida Department of Environmental Protection
8
Creek, which flows to the Hillsborough River within WBID 1443E. The permit has “report only” limits for flow (no limit on flow; therefore no daily load limits in the current permit), and requires monitoring for total and fecal coliforms, with daily maximum concentration limits of 2,400 and 800 CFU/100mL, respectively. Based on the limited flow data below (Table 4.1), the facility has a monthly average discharge of 79,296 gallons per day (gpd) and an average daily maximum flow of 220,270 gpd, or 0.341 cubic feet per second (cfs). Since the bacterial loadings for the TMDL are calculated on a daily basis, the allowable loadings for the facility were set as daily limits. Based on the average daily maximum flow, the facility is allowed to discharge up to 2.00E10 CFU/day of total coliform on a daily basis. Similarly, given the average daily maximum flow, the facility is allowed to discharge up to 3.34E9 CFU/day of fecal coliform on a daily basis.
Table 4.1. Flow Data for Lowry Park Zoo
Date Daily Maximum
Flow Rate (gpd)
Monthly Average Flow Rate
(gpd)
4/30/2002 No Data 5/31/2002 No Data 6/30/2002 No Data 7/31/2002 No Data 8/31/2002 164.3 137.7 9/30/2002 464.3 207.1
10/31/2002 389.5 192.5 11/30/2002 46.5 12.5 12/31/2002 389.5 192.5 1/31/2003 No Data 2/28/2003 318.8 150.9 3/31/2003 1,288.2 207.1 4/30/2003 901.9 222.0 5/31/2003 426.7 207.1 6/30/2003 1,206,720 268,992 7/31/2003 464,832 253,008 8/31/2003 760,896 285,264 9/30/2003 426,672 222,048
Average 220,270 79,296
The other NPDES facility in the WBID is the Tampa Tribune, Permit Number FLRNEE254. It is the Department’s understanding that this facility does not cause or contribute to total or fecal coliform bacterial loadings to the Hillsborough River.

TMDL Report: Tampa Bay Tributaries Basin, Hillsborough River, WBID 1443E, Total/Fecal Coliform
Florida Department of Environmental Protection
9
Municipal Separate Storm Sewer System Permittees WBID 1443E of the Hillsborough River is entirely within the city of Tampa, and the city of Tampa is covered under a Phase 1 individual municipal separate storm sewer system (MS4) permit (Permit Number FLS000008).
4.2.2 Land Uses and Nonpoint Sources
Additional total coliform loadings to WBID 1443E are generated from nonpoint sources in the watershed. Potential nonpoint sources of coliforms include loadings from surface runoff, wildlife, livestock, pets, and leaking septic tanks.
Wildlife Wildlife deposit coliform bacteria along with their feces onto land surfaces, where it can be transported during storm events to nearby streams. Some wildlife (such as otters, beavers, raccoons, and birds) deposit their feces directly into the water. The bacterial load from naturally occurring wildlife is assumed to be background. In addition, any strategy employed to control this source would probably have a negligible impact on attaining water quality standards.
Agricultural Animals This WBID contains only 2.5 acres (0.02 percent) of agricultural land uses. It is therefore unlikely that agricultural sources are a cause of the exceedances observed in WBID 1443E. In general, agricultural animals are the source of several types of coliform loading to streams. The livestock data listed in Table 4.2 are for all of Hillsborough County (U.S. Department of Agriculture, 1997). Table 4.2. Livestock Distribution for Hillsborough County
Livestock Distribution Hillsborough County
Cattle/Calves 62,328 Milk Cow 4,463 Hogs/Pigs 3,567
Poultry layers >13 weeks 1,409,342 Poultry broilers (D) Sheep/Lambs 285
Horses 2,754
Notes: (D) – Data withheld to avoid disclosing data for individual farms.
Land Uses The spatial distribution and acreage of different land use categories were identified using the 1999 land use coverage (scale 1:40,000) contained in the Department’s geographic information

TMDL Report: Tampa Bay Tributaries Basin, Hillsborough River, WBID 1443E, Total/Fecal Coliform
Florida Department of Environmental Protection
10
system (GIS) library. Land use categories in the watershed were aggregated using the simplified Level 1 codes tabulated in Table 4.3. Figure 4.1 shows the acreage of the principal land uses in the watershed. High-density residential is about 60 percent of the WBID area. Urban open is the next largest land use, making up about 30.4 percent of the area. Transportation is next, at 3.7 percent. These three categories make up over 93 percent of the total land use. Table 4.3. Classification of Land Use Categories (Level 1)
in WBID 1443E
Level 1 Count Attribute Perimeter Area
(square meters)
Area (acres)
Area (square miles)
Percentage
1000 126 Urban open 221,469.48 12,252,028.81 3,026.3 4.7270 30.37
1100 3 Residential low
density < 2 dwelling units
3,164.17 140,593.19 34.7 0.0542 0.35
1200 6 Residential medium
density 2->5 dwelling units
7,417.82 351,234.11 86.8 0.1355 0.87
1300 36 Residential high density 185,850.39 24,231,032.93 5,985.1 9.3487 60.07
2000 1 Agriculture 488.95 10,018.85 2.5 0.0039 0.02
4000 10 Forest/rural open 9,533.40 280,564.12 69.3 0.1082 0.70
5000 39 Water 44,772.83 1,311,259.36 323.9 0.5059 3.25
6000 31 Wetlands 12,015.61 271,415.01 67.0 0.1047 0.67
8000 12 Transportation,
communication, and utilities
46,510.25 1,492,799.64 368.7 0.5759 3.70
TOTAL 531,222.90 40,340,946.01 9,964.2 15.5641 100.00

TMDL Report: Tampa Bay Tributaries Basin, Hillsborough River, WBID 1443E, Total/Fecal Coliform
Florida Department of Environmental Protection
11
Figure 4.1. Principal Land Uses and NPDES Facilities in WBID 1443E
$T $T$T $T
$T
$T
$T
$T
$T
$T
$T
$T
$T
$T
$T
$T
$T
$T
$T
$T
$T
$T
$T
$T
$T
$T
$T
$T
$T
$T
$T
$T
$T
$T
$T$T
$T
$T
$T
$T
$T
$T
$T
$T
$T
$T
$T
$T
$T
$T
TAMPA$T
$T
Cit y L imits (po ly)
Wbid 1443e_lu99.shpResident ial L ow Den sit yResident ial M edium Den sit yResident ial Hig h DensityCommercial and ServicesIn dustr ialExtractiveIn stitut ionalRecreationalOpen Lan dCro pland and Past urelan dTree CropsFeed ing Op eratio nsNurseries an d VineyardsSpecialty FarmsOth er Op en Lands <Rural>HerbaceousShrub an d BrushlandMixed RangelandUpland Conif ero us Forest sUpland Hardwo od Fo restsTree P lan tation sStreams and W aterw aysLakesReservoirsBays and E stuar iesMajor S pr ingsSlou gh W at ersOcean s S eas an d Gulf sWetland H ardw ood Forest sWetland C oniferous Fo restsWetland F orest ed M ixedVegetat ed Non-F orest ed Wetland sNon-VegetatedWetland S hrubBeaches Ot her T han Sw imming BeachesSand O ther Than BeachesExposed Ro ckDist urbed LandsRiverine San dbarsTransp ortationCommun icat io nsUtilitiesVegetat io n-Sea Grass
Water BodiesWater
Bound aryFlor ida Count ies w ith S horeline (areas)Water LinesIn terst ates
Wastew at er Facilities from W AF R
$T NPDE S ( National) F acility
$T Stat e o r L ocal F acility
3 0 3 6 Miles
N
EW
S
#
WB ID 1443E
#
Low ry Zoo
#
The Tampa Tribune
Population According to the U.S Census Bureau, the population density in and around WBID 1443E in the year 2000 was at or less than 405 people per square mile (10 persons per square mile is the minimum used by the Census Bureau). The Bureau reports that, in Hillsborough County, which includes all of WBID 1443E, the total population for 2000 was 998,948, with 425,962 housing units.
Septic Tanks Data for septic tanks are based on the 1970 census results, with year-by-year additions based on new septic tank construction. The data do not reflect septic tanks that may have been removed. Hillsborough County has a cumulative registry of 100,483 septic tanks. With 425,962 households in the county, this means that approximately 76 percent of the residences in the county are connected to wastewater treatment plants, with the rest (24 percent) utilizing septic
TMDL Report: Tampa Bay Tributaries Basin, Hillsborough River, WBID 1443E, Total/Fecal Coliform
Florida Department of Environmental Protection
12
tanks (Florida Department of Health Web site, 2004; U.S. Environmental Protection Agency, 2001, contains information regarding the contribution of coliforms from septic tanks.)
4.4 Source Summary
4.4.1 Summary of Total Coliform Loadings into WBID 1443E from Various
Sources
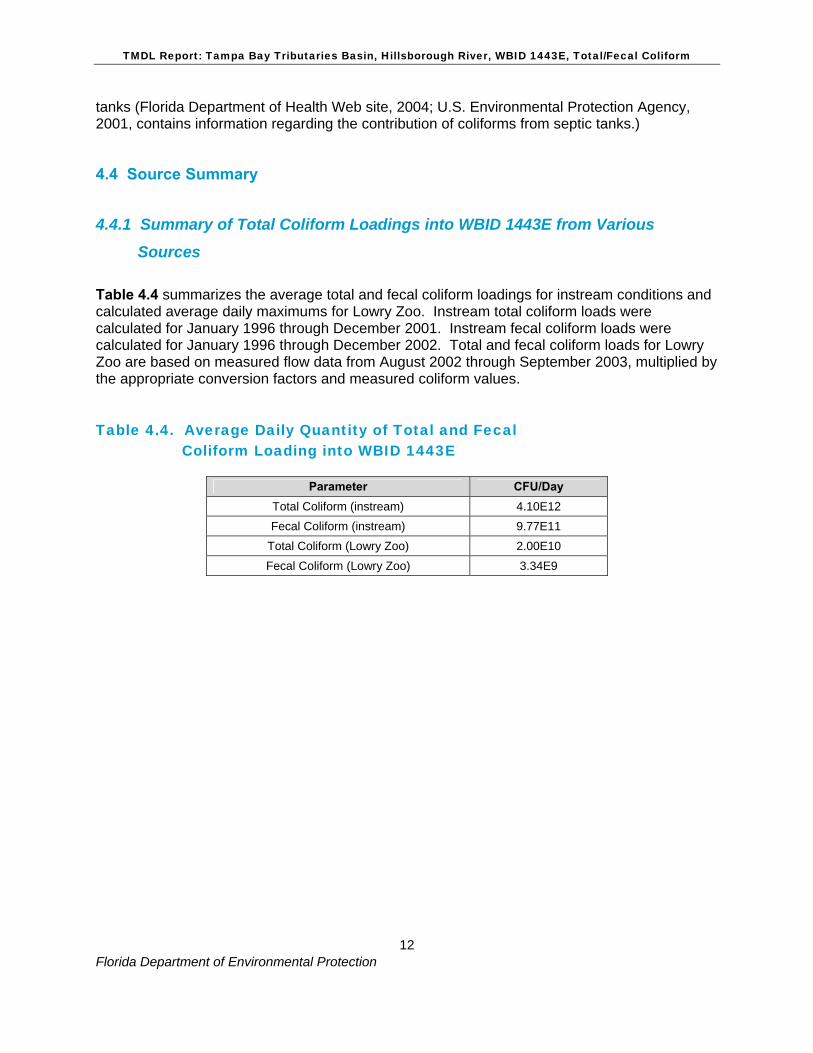
Table 4.4 summarizes the average total and fecal coliform loadings for instream conditions and calculated average daily maximums for Lowry Zoo. Instream total coliform loads were calculated for January 1996 through December 2001. Instream fecal coliform loads were calculated for January 1996 through December 2002. Total and fecal coliform loads for Lowry Zoo are based on measured flow data from August 2002 through September 2003, multiplied by the appropriate conversion factors and measured coliform values.
Table 4.4. Average Daily Quantity of Total and Fecal Coliform Loading into WBID 1443E
Parameter CFU/Day Total Coliform (instream) 4.10E12 Fecal Coliform (instream) 9.77E11
Total Coliform (Lowry Zoo) 2.00E10 Fecal Coliform (Lowry Zoo) 3.34E9

TMDL Report: Tampa Bay Tributaries Basin, Hillsborough River, WBID 1443E, Total/Fecal Coliform
Florida Department of Environmental Protection
13
Chapter 5: DETERMINATION OF ASSIMILATIVE CAPACITY
5.1 Determination of Assimilative Capacity
The load duration method used for many bacterial TMDLs in Florida relies on the availability of river flow data that is concurrent with the measured bacterial concentrations. While the Hillsborough River is gaged at multiple locations, this WBID is downstream of the Hillsborough Reservoir, which is a highly managed reservoir. An examination of the discharge data for the reservoir revealed data gaps that included many of the dates for which exceedances of the bacterial criteria were observed. As a direct comparison could not be made between many of the exceedances and the river flow on the day of the exceedance, the load duration method was not selected for these TMDLs. Instead, the methodology used is the “percent reduction” approach. For this method, the percent reduction needed to meet the applicable criterion is calculated for each value above the criterion, and then the median percent reduction is calculated for the portion of the record with the most exceedances (if the data indicate clustering of exceedances) or over the entire record if exceedances occur throughout.
5.1.1 Data Used in the Determination of the TMDL
Five sampling stations in WBID 1443E were used for developing the total and fecal coliform TMDLs. The station names are listed in Table 5.1 and shown in Figure 5.1. The primary data collector of historical data is the Hillsborough County Environmental Protection Commission. Table 5.1 provides a brief statistical overview of the observed data at these sites.
Table 5.1. Observed Data at Sampling Sites, WBID 1443E
Fecal Coliform Total Coliform Map Symbol (Figure 5.1)
FLGW8499 FLGW8499 S-1 21FLHILL24030011* 21FLHILL24030011* S-2
21FLHILL152 21FLHILL152 S-3 21FLHILL24030049* 21FLHILL24030049* S-4 21FLHILL24030451* 21FLHILL24030451* S-5
* In 1999, Hillsborough County changed the names of several long-term stations. Old
stations 21FLHILL24030451, 21FLHILL24030011, and 21FLHILL24030049 were renamed 21FLHILL002, 21FLHILL105, AND 21FLHILL137, respectively.

TMDL Report: Tampa Bay Tributaries Basin, Hillsborough River, WBID 1443E, Total/Fecal Coliform
Florida Department of Environmental Protection
14
Figure 5.1. Historical Monitoring Sites in WBID 1443E
3 0 3 6 Miles
N
EW
S
S-2
S-3
S-4
S-5
S-1
5.1.2 TMDL Development Process
As described in Section 5.1, the percent reduction was determined for each individual exceedance using the equation below:
[measured exceedance – criterion]*100 measured exceedance
The total and fecal coliform TMDLs were calculated as the median of the percent reductions needed over the data range where exceedances occurred (see Appendices B and C for data).
5.1.3 Critical Conditions/Seasonality
As described in Section 5.1, no reliable flow data existed that could be used to link exceedances to critical periods of flow. To examine whether there were any critical seasons, the data for exceedances were divided into calendar seasons, with Winter (1) defined as January, February, and March; Spring (2) defined as April, May, and June; Summer (3) defined

TMDL Report: Tampa Bay Tributaries Basin, Hillsborough River, WBID 1443E, Total/Fecal Coliform
Florida Department of Environmental Protection
15
as July, August, and September; and Fall (4) defined as October, November and December. By examining Table 5.2 and Figures 5.2, 5.3, 5.4, and 5.5, it can be seen that while exceedances occur in all seasons, values are generally higher in the spring, summer, and fall compared with winter. As exceedances occurred during all seasons, the TMDL will be calculated based on all of the data. Table 5.2. Total and Fecal Coliform Exceedances, by
Season
Season Fecal Coliform Total Coliform Winter (1) 8 9 Spring (2) 14 14
Summer (3) 15 18 Fall (4) 13 12 Total 50 53
Figure 5.2. Total Coliform Exceedances by Season (1=Jan+Feb+Mar, 2= Apr+May+Jun, 3=Jul+Aug+Sep, 4=Oct+Nov+Dec)
Total Coliform Exceedances (CFU/100mL)
0
5000
10000
15000
20000
25000
30000
0 1 2 3 4 5
Seasons (1-4)
Total Coliform(CFU/100mL)

TMDL Report: Tampa Bay Tributaries Basin, Hillsborough River, WBID 1443E, Total/Fecal Coliform
Florida Department of Environmental Protection
16
Figure 5.3. Fecal Coliform Exceedances by Season (1=Jan+Feb+ Mar, 2= Apr+May+Jun, 3=Jul+Aug+Sep, 4=Oct+Nov+Dec)
Fecal Coliform Exceedances (CFU/100mL)
0500
10001500200025003000350040004500
0 1 2 3 4 5
Fecal Coliform(CFU/100mL)
Figure 5.4. Fecal Coliform Data versus 400 CFU/100mL Criterion
0500
10001500200025003000350040004500
1/17
/96
1/17
/97
1/17
/98
1/17
/99
1/17
/00
1/17
/01
1/17
/02
Date
Feca
l Col
iform
CFU
/100
mL
Fecal Coliform(CFU/100mL)Criterion
TMDL Report: Tampa Bay Tributaries Basin, Hillsborough River, WBID 1443E, Total/Fecal Coliform
Florida Department of Environmental Protection
17
Figure 5.5. Total Coliform Data versus 2400 CFU/100mL Criterion
0
5000
10000
15000
20000
25000
30000
1/17
/96
1/17
/97
1/17
/98
1/17
/99
1/17
/00
1/17
/01
Date
Tota
l Col
iform
CFU
/100
mL
Total Coliform(CFU/100mL)Criterion

TMDL Report: Tampa Bay Tributaries Basin, Hillsborough River, WBID 1443E, Total/Fecal Coliform
Florida Department of Environmental Protection
18
Chapter 6: DETERMINATION OF THE TMDL
6.1 Expression and Allocation of the TMDL
The objective of a TMDL is to provide a basis for allocating acceptable loads among all of the known pollutant sources in a watershed so that appropriate control measures can be implemented and water quality standards achieved. A TMDL is expressed as the sum of all point source loads (Waste Load Allocations, or WLAs), nonpoint source loads (Load Allocations, or LAs), and an appropriate margin of safety (MOS), which takes into account any uncertainty concerning the relationship between effluent limitations and water quality:
TMDL = ∑ WLAs + ∑ LAs + MOS
As discussed earlier, the WLA is broken out into separate subcategories for wastewater discharges and stormwater discharges regulated under the NPDES Program:
TMDL ≅ ∑ WLAswastewater + ∑ WLAsNPDES Stormwater + ∑ LAs + MOS
It should be noted that the various components of the revised TMDL equation may not sum up to the value of the TMDL because (a) the WLA for NPDES stormwater is typically based on the percent reduction needed for nonpoint sources and is also accounted for within the LA, and (b) TMDL components can be expressed in different terms (for example, the WLA for stormwater is typically expressed as a percent reduction, and the WLA for wastewater is typically expressed as mass per day). WLAs for stormwater discharges are typically expressed as “percent reduction” because it is very difficult to quantify the loads from MS4s (given the numerous discharge points) and to distinguish loads from MS4s from other nonpoint sources (given the nature of stormwater transport). The permitting of stormwater discharges also differs from the permitting of most wastewater point sources. Because stormwater discharges cannot be centrally collected, monitored, and treated, they are not subject to the same types of effluent limitations as wastewater facilities, and instead are required to meet a performance standard of providing treatment to the “maximum extent practical” through the implementation of best management practices (BMPs). This approach is consistent with federal regulations (40 CFR § 130.2[I]), which state that TMDLs can be expressed in terms of mass per time (e.g., pounds per day), toxicity, or other appropriate measure. The TMDLs for WBID 1443E of the Hillsborough River are expressed in terms of both loading of CFUs for the WLA and a percent reduction for the LA, and represent the maximum daily total and fecal coliform loads the river segment can assimilate and maintain the total and fecal coliform criteria (Table 6.1). It should be noted that, because adequate flow data were not required, the LA was not adjusted to account for the WLA.
TMDL Report: Tampa Bay Tributaries Basin, Hillsborough River, WBID 1443E, Total/Fecal Coliform
Florida Department of Environmental Protection
19
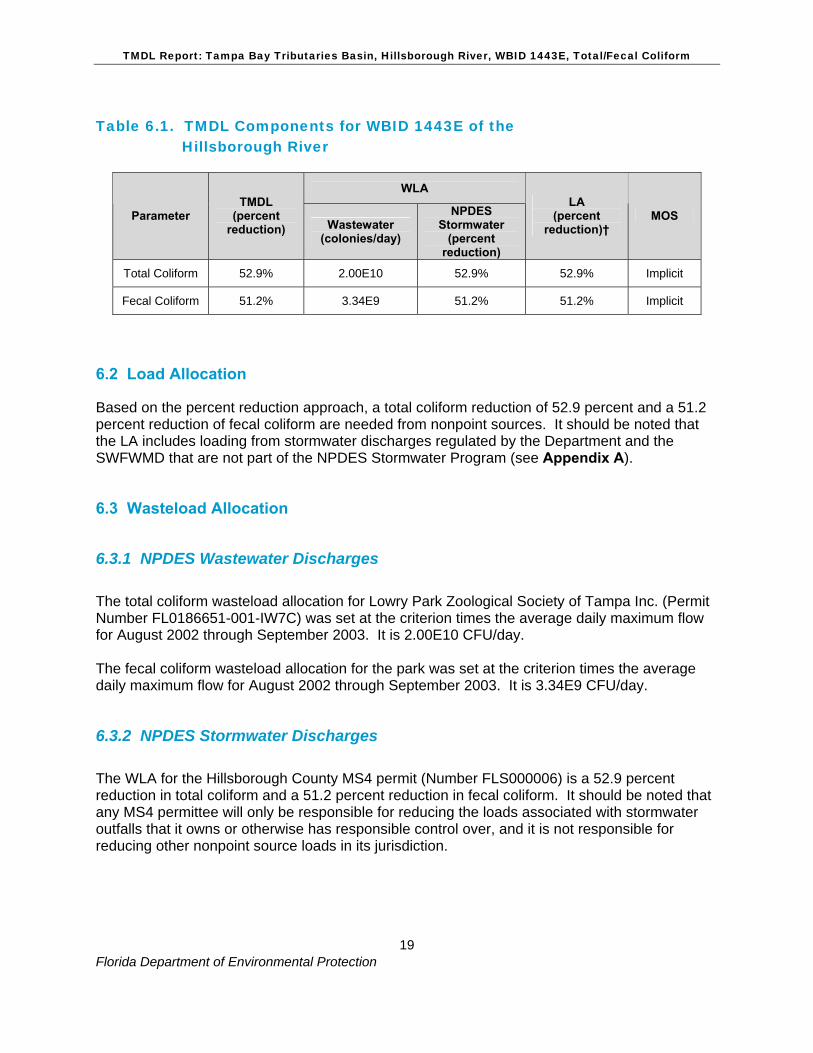
Table 6.1. TMDL Components for WBID 1443E of the
Hillsborough River
WLA
Parameter TMDL
(percent reduction) Wastewater
(colonies/day)
NPDES Stormwater
(percent reduction)
LA (percent
reduction)† MOS
Total Coliform 52.9% 2.00E10 52.9% 52.9% Implicit
Fecal Coliform 51.2% 3.34E9 51.2% 51.2% Implicit
6.2 Load Allocation
Based on the percent reduction approach, a total coliform reduction of 52.9 percent and a 51.2 percent reduction of fecal coliform are needed from nonpoint sources. It should be noted that the LA includes loading from stormwater discharges regulated by the Department and the SWFWMD that are not part of the NPDES Stormwater Program (see Appendix A).
6.3 Wasteload Allocation
6.3.1 NPDES Wastewater Discharges
The total coliform wasteload allocation for Lowry Park Zoological Society of Tampa Inc. (Permit Number FL0186651-001-IW7C) was set at the criterion times the average daily maximum flow for August 2002 through September 2003. It is 2.00E10 CFU/day. The fecal coliform wasteload allocation for the park was set at the criterion times the average daily maximum flow for August 2002 through September 2003. It is 3.34E9 CFU/day.
6.3.2 NPDES Stormwater Discharges
The WLA for the Hillsborough County MS4 permit (Number FLS000006) is a 52.9 percent reduction in total coliform and a 51.2 percent reduction in fecal coliform. It should be noted that any MS4 permittee will only be responsible for reducing the loads associated with stormwater outfalls that it owns or otherwise has responsible control over, and it is not responsible for reducing other nonpoint source loads in its jurisdiction.

TMDL Report: Tampa Bay Tributaries Basin, Hillsborough River, WBID 1443E, Total/Fecal Coliform
Florida Department of Environmental Protection
20
6.4 Margin of Safety
Consistent with the recommendations of the Allocation Technical Advisory Committee (Florida Department of Environmental Protection, February 2001), an implicit margin of safety (MOS) was used in the development of this TMDL. An implicit MOS was included in the TMDL by not allowing any exceedances of the state criterion, even though intermittent natural exceedances of the criterion would be expected and would be taken into account when determining impairment. The implicit MOS is also appropriate because existing loads are based on instream coliform measurements. These measurements include decay processes occurring instream and do not represent the maximum load that can be applied to the land and transported to the stream during a rain event. Additionally, this segment of the Hillsborough River is tidally influenced and characterized as estuarine as opposed to fresh water. As a result, the estuarine nature of the water in this segment will accelerate the coliform die-off and provide added dilution through tidally induced mixing, increasing the implicit margin of safety.
TMDL Report: Tampa Bay Tributaries Basin, Hillsborough River, WBID 1443E, Total/Fecal Coliform
Florida Department of Environmental Protection
21
Chapter 7: NEXT STEPS: IMPLEMENTATION PLAN DEVELOPMENT AND BEYOND
7.1 Basin Management Action Plan
Following the adoption of this TMDL by rule, the next step in the TMDL process is to develop an implementation plan for the TMDL, which will be a component of the Basin Management Action Plan (BMAP) for the Tampa Bay Tributaries Basin. This document will be developed over the next year in cooperation with local stakeholders and will attempt to reach consensus on more detailed allocations and on how load reductions will be accomplished. The BMAP will include the following:
• Appropriate allocations among the affected parties,
• A description of the load reduction activities to be undertaken,
• Timetables for project implementation and completion,
• Funding mechanisms that may be utilized,
• Any applicable signed agreement,
• Local ordinances defining actions to be taken or prohibited,
• Local water quality standards, permits, or load limitation agreements, and
• Monitoring and follow-up measures.

TMDL Report: Tampa Bay Tributaries Basin, Hillsborough River, WBID 1443E, Total/Fecal Coliform
Florida Department of Environmental Protection
22
References
Florida Administrative Code. Chapter 62-302. Surface Water Quality Standards.
Florida Administrative Code. Chapter 62-303. Identification of Impaired Surface Waters.
Florida Department of Environmental Protection. February 2001. A Report to the Governor and the Legislature on the Allocation of Total Maximum Daily Loads in Florida. Tallahassee, Florida: Bureau of Watershed Management.
Florida Department of Environmental Protection. June 2002. Tampa Bay Tributaries Basin Status Report. Tallahassee, Florida. Available at http://www.dep.state.fl.us/water/tmdl/stat_rep.htm
Florida Department of Health Web site. 2004. Available at http://www.doh.state.fl.us/.
Florida Watershed Restoration Act. Chapter 99-223, Laws of Florida.
Roehl, J. W. 1962. Sediment Source Areas, Delivery Ratios, and Influencing Morphological Factors. International Association of Scientific Hydrology. 59: 202-213. Symposium of Bari, October 1-8, 1962.
U. S. Census Bureau. 2004. Available at http://www.census.gov/.
U.S. Department of Agriculture. 1997. Agricultural Census Report. Available at http://usda.mannlib.cornell.edu/reports/census/
U.S. Environmental Protection Agency. 2001. Protocol for Developing Pathogen TMDLs. EPA 841-R-00-002.
Watershed Protection Techniques. April 1999. Vol. 3, No. 1.

TMDL Report: Tampa Bay Tributaries Basin, Hillsborough River, WBID 1443E, Total/Fecal Coliform
Florida Department of Environmental Protection
23
Appendices
Appendix A. Background Information on Federal and State Stormwater Programs
In 1982, Florida became the first state in the country to implement statewide regulations to address the issue of nonpoint source pollution by requiring new development and redevelopment to treat stormwater before it is discharged. The Stormwater Rule, as authorized in Chapter 403, F.S., was established as a technology-based program that relies on the implementation of BMPs that are designed to achieve a specific level of treatment (i.e., performance standards) as set forth in Chapter 62-40, F.A.C. The rule requires the state’s water management districts (WMDs) to establish stormwater pollutant load reduction goals (PLRGs) and adopt them as part of a Surface Water Improvement and Management (SWIM) plan, other watershed plan, or rule. Stormwater PLRGs are a major component of the load allocation part of a TMDL. To date, stormwater PLRGs have been established for Tampa Bay, Lake Thonotosassa, the Winter Haven Chain of Lakes, the Everglades, Lake Okeechobee, and Lake Apopka. No PLRG had been developed for Newnans Lake at the time this report was developed. In 1987, the U.S. Congress established Section 402(p) as part of the federal Clean Water Act Reauthorization. This section of the law amended the scope of the federal NPDES stormwater permitting program to designate certain stormwater discharges as “point sources” of pollution. These stormwater discharges include certain discharges that are associated with industrial activities designated by specific standard industrial classification (SIC) codes, construction sites disturbing 5 or more acres of land, and master drainage systems of local governments with a population above 100,000, which are better known as municipal separate storm sewer systems (MS4s). However, because the master drainage systems of most local governments in Florida are interconnected, the EPA has implemented Phase I of the MS4 permitting program on a countywide basis, which brings in all cities (incorporated areas), Chapter 298 urban water control districts, and the Florida Department of Transportation throughout the 15 counties meeting the population criteria. An important difference between the federal and state stormwater permitting programs is that the federal program covers both new and existing discharges, while the state program focuses on new discharges. Additionally, Phase II of the NPDES Program will expand the need for these permits to construction sites between 1 and 5 acres, and to local governments with as few as 10,000 people. These revised rules require that these additional activities obtain permits by 2003. While these urban stormwater discharges are now technically referred to as “point sources” for the purpose of regulation, they are still diffuse sources of pollution that cannot be easily collected and treated by a central treatment facility, as are other point sources of pollution, such as domestic and industrial wastewater discharges. The Department recently accepted delegation from the EPA for the stormwater part of the NPDES Program. It should be noted that most MS4 permits issued in Florida include a reopener clause that allows permit revisions to implement TMDLs once they are formally adopted by rule.

TMDL Report: Tampa Bay Tributaries Basin, Hillsborough River, WBID 1443E, Total/Fecal Coliform
Florida Department of Environmental Protection
24
Appendix B. Observed Data for Calculating Percent Reductions for Fecal Coliform for the Hillsborough River, WBID 1443E
Fecal Coliform Station Sample Date Sample Time
Fecal Coliform (CFU/100mL)
Percent Reduction
21FLHILL24030451 1/17/1996 905 15 21FLHILL24030049 1/23/1996 800 180 21FLHILL24030011 1/23/1996 1055 20 21FLHILL24030451 2/13/1996 920 10 21FLHILL24030049 2/20/1996 805 140 21FLHILL24030011 2/20/1996 1100 20 21FLHILL24030451 3/13/1996 955 20 21FLHILL24030049 3/19/1996 810 380 21FLHILL24030011 3/19/1996 1055 20 21FLHILL24030451 4/9/1996 952 10 21FLHILL24030049 4/16/1996 815 1,040 61.5 21FLHILL24030011 4/16/1996 1050 40 21FLHILL24030451 5/8/1996 940 40 21FLHILL24030049 5/14/1996 815 20 21FLHILL24030011 5/14/1996 1110 120 21FLHILL24030451 6/11/1996 924 5 21FLHILL24030049 6/18/1996 810 660 39.4 21FLHILL24030011 6/18/1996 1105 820 51.2 21FLHILL24030451 7/9/1996 915 200 21FLHILL24030049 7/16/1996 815 500 20.0 21FLHILL24030011 7/16/1996 1050 140 21FLHILL24030451 8/13/1996 919 225 21FLHILL24030049 8/20/1996 807 4,000 90.0 21FLHILL24030011 8/20/1996 1100 420 4.8 21FLHILL24030451 9/10/1996 915 20 21FLHILL24030049 9/24/1996 815 320 21FLHILL24030011 9/24/1996 1045 200 21FLHILL24030451 10/9/1996 950 320 21FLHILL24030049 10/15/1996 835 180 21FLHILL24030011 10/15/1996 1105 20 21FLHILL24030451 11/13/1996 932 5 21FLHILL24030049 11/19/1996 815 40 21FLHILL24030011 11/19/1996 1045 80 21FLHILL24030049 12/10/1996 810 280 21FLHILL24030011 12/10/1996 1115 540 25.9 21FLHILL24030451 12/17/1996 920 10 21FLHILL24030451 1/14/1997 910 35

TMDL Report: Tampa Bay Tributaries Basin, Hillsborough River, WBID 1443E, Total/Fecal Coliform
Florida Department of Environmental Protection
25
Fecal Coliform Station Sample Date Sample Time
Fecal Coliform (CFU/100mL)
Percent Reduction
21FLHILL24030049 1/21/1997 800 60 21FLHILL24030011 1/21/1997 1045 60 21FLHILL24030451 2/11/1997 915 50 21FLHILL24030049 2/18/1997 810 40 21FLHILL24030011 2/18/1997 1045 340 21FLHILL24030451 3/11/1997 937 5 21FLHILL24030049 3/18/1997 835 60 21FLHILL24030011 3/18/1997 1120 360 21FLHILL24030451 4/8/1997 945 255 21FLHILL24030049 4/15/1997 825 280 21FLHILL24030011 4/15/1997 1041 2,400 83.3 21FLHILL24030451 5/13/1997 920 35 21FLHILL24030049 5/20/1997 815 40 21FLHILL24030011 5/20/1997 1050 80 21FLHILL24030451 6/10/1997 915 105 21FLHILL24030049 6/17/1997 850 20 21FLHILL24030011 6/17/1997 1209 60 21FLHILL24030451 7/15/1997 922 105 21FLHILL24030049 7/22/1997 820 140 21FLHILL24030011 7/22/1997 1130 120 21FLHILL24030451 8/12/1997 945 30 21FLHILL24030049 8/19/1997 815 380 21FLHILL24030011 8/19/1997 1105 80 21FLHILL24030451 9/9/1997 944 25 21FLHILL24030049 9/16/1997 830 160 21FLHILL24030011 9/16/1997 1055 340 21FLHILL24030451 10/7/1997 858 95 21FLHILL24030049 10/14/1997 815 220 21FLHILL24030011 10/14/1997 1105 40 21FLHILL24030451 11/12/1997 942 5 21FLHILL24030049 11/18/1997 825 200 21FLHILL24030011 11/18/1997 1135 120 21FLHILL24030451 12/3/1997 908 300 21FLHILL24030049 12/9/1997 810 120 21FLHILL24030011 12/9/1997 1035 80 21FLHILL24030451 1/13/1998 920 185 21FLHILL24030049 1/20/1998 820 320 21FLHILL24030011 1/20/1998 1025 100 21FLHILL24030451 2/10/1998 910 175 21FLHILL24030049 2/17/1998 805 4,000 90.0 21FLHILL24030011 2/17/1998 1105 1,060 62.3 21FLHILL24030451 3/10/1998 925 205 21FLHILL24030049 3/17/1998 810 40

TMDL Report: Tampa Bay Tributaries Basin, Hillsborough River, WBID 1443E, Total/Fecal Coliform
Florida Department of Environmental Protection
26
Fecal Coliform Station Sample Date Sample Time
Fecal Coliform (CFU/100mL)
Percent Reduction
21FLHILL24030011 3/17/1998 1035 100 21FLHILL24030451 4/14/1998 930 5 21FLHILL24030049 4/21/1998 805 780 48.7 21FLHILL24030011 4/21/1998 1130 20 21FLHILL24030451 5/12/1998 924 70 21FLHILL24030049 5/19/1998 850 40 21FLHILL24030011 5/19/1998 1150 180 21FLHILL24030451 6/9/1998 928 10 21FLHILL24030049 6/16/1998 802 240 21FLHILL24030011 6/16/1998 1035 1,080 63.0 21FLHILL24030451 7/14/1998 900 100 21FLHILL24030049 7/21/1998 805 4,000 90.0 21FLHILL24030011 7/21/1998 1034 560 28.6 21FLHILL24030451 8/11/1998 932 45 21FLHILL24030049 8/25/1998 806 120 21FLHILL24030011 8/25/1998 1038 20 21FLHILL24030451 9/8/1998 930 1,000 60.0 21FLHILL24030049 9/15/1998 820 40 21FLHILL24030011 9/15/1998 1147 20 21FLHILL24030451 10/13/1998 936 15 21FLHILL24030049 10/20/1998 812 1,080 63.0 21FLHILL24030011 10/20/1998 1035 100 21FLHILL24030451 11/9/1998 925 60 21FLHILL24030049 11/17/1998 823 120 21FLHILL24030011 11/17/1998 1058 20 21FLHILL24030451 12/2/1998 927 5 21FLHILL24030049 12/8/1998 810 80 21FLHILL24030011 12/8/1998 1040 40
21FLHILL002 1/12/1999 930 15 21FLHILL137 1/19/1999 815 80 21FLHILL105 1/19/1999 1100 160 21FLHILL002 2/9/1999 935 25 21FLHILL137 2/16/1999 811 20 21FLHILL105 2/16/1999 1110 180 21FLHILL002 3/9/1999 935 10 21FLHILL137 3/16/1999 807 40 21FLHILL105 3/16/1999 1100 140 21FLHILL002 4/13/1999 940 5 21FLHILL137 4/20/1999 812 40 21FLHILL105 4/20/1999 1107 60 21FLHILL002 5/11/1999 940 15 21FLHILL137 5/18/1999 813 120 21FLHILL105 5/18/1999 1115 160

TMDL Report: Tampa Bay Tributaries Basin, Hillsborough River, WBID 1443E, Total/Fecal Coliform
Florida Department of Environmental Protection
27
Fecal Coliform Station Sample Date Sample Time
Fecal Coliform (CFU/100mL)
Percent Reduction
21FLHILL002 6/8/1999 915 5 21FLHILL137 6/15/1999 805 320 21FLHILL105 6/15/1999 1100 320 21FLHILL002 7/13/1999 928 10 21FLHILL137 7/20/1999 808 100 21FLHILL105 7/20/1999 1052 80 21FLHILL002 8/10/1999 934 180 21FLHILL137 8/17/1999 820 100 21FLHILL152 8/17/1999 1130 300 21FLHILL105 8/17/1999 1150 180 21FLHILL002 9/14/1999 901 50 21FLHILL137 9/22/1999 825 140 21FLHILL152 9/22/1999 1110 400 21FLHILL105 9/22/1999 1135 140 21FLHILL137 10/12/1999 810 320 21FLHILL152 10/12/1999 1110 100 21FLHILL105 10/12/1999 1135 80 21FLHILL002 10/19/1999 920 15 21FLHILL002 11/8/1999 1140 5 21FLHILL137 11/16/1999 814 80 21FLHILL152 11/16/1999 1030 300 21FLHILL105 11/16/1999 1050 60 21FLHILL002 12/7/1999 918 85 21FLHILL137 12/14/1999 755 80 21FLHILL152 12/14/1999 1050 300 21FLHILL105 12/14/1999 1120 160 21FLHILL002 1/11/2000 928 105 21FLHILL137 1/18/2000 820 100 21FLHILL152 1/18/2000 1102 100 21FLHILL105 1/18/2000 1120 200 21FLHILL002 2/8/2000 919 10 21FLHILL137 2/15/2000 806 200 21FLHILL152 2/15/2000 1025 100 21FLHILL105 2/15/2000 1045 40 21FLHILL002 3/7/2000 918 5 21FLHILL137 3/14/2000 810 20 21FLHILL152 3/14/2000 1038 100 21FLHILL105 3/14/2000 1105 180 21FLHILL002 4/11/2000 918 5 21FLHILL137 4/18/2000 803 40 21FLHILL152 4/18/2000 1022 100 21FLHILL105 4/18/2000 1042 80 21FLHILL002 5/9/2000 1000 5

TMDL Report: Tampa Bay Tributaries Basin, Hillsborough River, WBID 1443E, Total/Fecal Coliform
Florida Department of Environmental Protection
28
Fecal Coliform Station Sample Date Sample Time
Fecal Coliform (CFU/100mL)
Percent Reduction
21FLHILL137 5/16/2000 810 20 21FLHILL152 5/16/2000 1107 100 21FLHILL105 5/16/2000 1145 20 21FLHILL002 6/13/2000 922 95 21FLHILL137 6/20/2000 815 740 45.9
21FLGW 8499 6/20/2000 930 1,000 60.0 21FLGW 8499 6/20/2000 930 1,000 60.0 21FLHILL152 6/20/2000 1110 360 21FLHILL105 6/20/2000 1140 680 41.2 21FLHILL002 7/11/2000 940 5 21FLHILL137 7/18/2000 805 40 21FLHILL152 7/18/2000 1100 440 9.1 21FLHILL105 7/18/2000 1125 180 21FLHILL002 8/9/2000 935 5 21FLHILL137 8/15/2000 800 100 21FLHILL152 8/15/2000 1045 780 48.7 21FLHILL105 8/15/2000 1115 260 21FLHILL002 9/12/2000 930 5 21FLHILL137 9/19/2000 810 800 50.0 21FLHILL152 9/19/2000 1115 760 47.4 21FLHILL105 9/19/2000 1140 3,420 88.3 21FLHILL137 10/10/2000 820 80 21FLHILL152 10/10/2000 1100 200 21FLHILL105 10/10/2000 1130 20 21FLHILL002 10/17/2000 950 15 21FLHILL002 11/7/2000 905 5 21FLHILL137 11/14/2000 820 20 21FLHILL152 11/14/2000 1100 60 21FLHILL105 11/14/2000 1120 240 21FLHILL002 12/6/2000 940 5 21FLHILL137 12/12/2000 810 760 47.4 21FLHILL152 12/12/2000 1030 860 53.5 21FLHILL002 1/9/2001 910 52 21FLHILL137 1/16/2001 800 20 21FLHILL152 1/16/2001 1037 100 21FLHILL105 1/16/2001 1100 120 21FLHILL002 2/13/2001 909 10 21FLHILL137 2/20/2001 814 20 21FLHILL152 2/20/2001 1105 100 21FLHILL105 2/20/2001 1111 60 21FLHILL002 3/14/2001 911 72 21FLHILL137 3/20/2001 803 840 52.4 21FLHILL152 3/20/2001 1028 2,280 82.5

TMDL Report: Tampa Bay Tributaries Basin, Hillsborough River, WBID 1443E, Total/Fecal Coliform
Florida Department of Environmental Protection
29
Fecal Coliform Station Sample Date Sample Time
Fecal Coliform (CFU/100mL)
Percent Reduction
21FLHILL105 3/20/2001 1105 1,840 78.3 21FLHILL002 4/10/2001 932 14 21FLHILL137 4/17/2001 825 40 21FLHILL152 4/17/2001 1121 20 21FLHILL105 4/17/2001 1145 200 21FLHILL002 5/8/2001 929 2 21FLHILL137 5/15/2001 823 20 21FLHILL152 5/15/2001 1050 60 21FLHILL105 5/15/2001 1110 100 21FLHILL002 6/12/2001 930 2 21FLHILL137 6/19/2001 820 60 21FLHILL152 6/19/2001 1132 20 21FLHILL105 6/19/2001 1205 660 39.4 21FLHILL002 7/17/2001 857 86 21FLHILL137 7/24/2001 805 660 39.4 21FLHILL152 7/24/2001 1050 380 21FLHILL105 7/24/2001 1114 640 37.5 21FLHILL002 8/14/2001 925 2 21FLHILL137 8/21/2001 812 820 51.2 21FLHILL152 8/21/2001 1100 220 21FLHILL105 8/21/2001 1112 60 21FLHILL002 9/11/2001 909 54 21FLHILL137 9/18/2001 816 80 21FLHILL152 9/18/2001 1059 80 21FLHILL105 9/18/2001 1124 200 21FLHILL002 10/10/2001 920 48 21FLHILL137 10/16/2001 807 820 51.2 21FLHILL152 10/16/2001 1038 460 13.0 21FLHILL105 10/16/2001 1101 760 47.4 21FLHILL137 11/13/2001 814 40 21FLHILL152 11/13/2001 1101 120 21FLHILL105 11/13/2001 1123 80 21FLHILL002 11/19/2001 940 24 21FLHILL002 12/5/2001 915 80 21FLHILL137 12/11/2001 819 480 16.7 21FLHILL152 12/11/2001 1104 280 21FLHILL105 12/11/2001 1127 240 21FLHILL002 1/8/2002 932 14 21FLHILL137 1/15/2002 810 550 27.3 21FLHILL152 1/15/2002 1127 220 21FLHILL105 1/15/2002 1148 620 35.5 21FLHILL105 1/15/2002 1148 620 35.5 21FLHILL002 2/13/2002 913 4

TMDL Report: Tampa Bay Tributaries Basin, Hillsborough River, WBID 1443E, Total/Fecal Coliform
Florida Department of Environmental Protection
30
Fecal Coliform Station Sample Date Sample Time
Fecal Coliform (CFU/100mL)
Percent Reduction
21FLHILL137 2/19/2002 824 100 21FLHILL152 2/19/2002 1122 50 21FLHILL105 2/19/2002 1141 200 21FLHILL002 3/12/2002 922 4 21FLHILL137 3/19/2002 812 40 21FLHILL152 3/19/2002 1122 50 21FLHILL105 3/19/2002 1200 100 21FLHILL002 4/9/2002 858 12 21FLHILL137 4/16/2002 813 190 21FLHILL152 4/16/2002 1045 40 21FLHILL105 4/16/2002 1108 180 21FLHILL002 5/7/2002 915 2 21FLHILL002 5/7/2002 915 2 21FLHILL137 5/14/2002 800 20 21FLHILL152 5/14/2002 1038 20 21FLHILL105 5/14/2002 1059 40 21FLHILL002 6/11/2002 924 2 21FLHILL002 6/11/2002 924 2 21FLHILL137 6/18/2002 812 2,000 80.0 21FLHILL152 6/18/2002 1048 2,000 80.0 21FLHILL105 6/18/2002 1108 2,000 80.0 21FLHILL002 7/16/2002 856 2 21FLHILL002 7/16/2002 856 2 21FLHILL137 7/23/2002 803 90 21FLHILL152 7/23/2002 1050 240 21FLHILL105 7/23/2002 1116 160 21FLHILL002 8/13/2002 901 4 21FLHILL002 8/13/2002 901 4 21FLHILL137 8/20/2002 813 1,340 70.1 21FLHILL152 8/20/2002 1035 350 21FLHILL105 8/20/2002 1054 310 21FLHILL002 9/10/2002 931 226 21FLHILL002 9/10/2002 931 226 21FLHILL137 9/17/2002 805 1,730 76.9 21FLHILL152 9/17/2002 1102 330 21FLHILL105 9/17/2002 1125 370 21FLHILL002 10/8/2002 1024 46 21FLHILL002 10/8/2002 1024 46 21FLHILL137 10/15/2002 805 360 21FLHILL152 10/15/2002 1045 410 2.4 21FLHILL105 10/15/2002 1105 270 21FLHILL002 11/12/2002 948 12 21FLHILL002 11/12/2002 948 12

TMDL Report: Tampa Bay Tributaries Basin, Hillsborough River, WBID 1443E, Total/Fecal Coliform
Florida Department of Environmental Protection
31
Fecal Coliform Station Sample Date Sample Time
Fecal Coliform (CFU/100mL)
Percent Reduction
21FLHILL137 11/19/2002 740 120 21FLHILL152 11/19/2002 1025 170 21FLHILL105 11/19/2002 1048 170 21FLHILL002 12/4/2002 915 2 21FLHILL002 12/4/2002 915 2 21FLHILL137 12/10/2002 808 2,000 80.0 21FLHILL152 12/10/2002 1051 1,170 65.8 21FLHILL105 12/10/2002 1113 820 51.2
Median Percent Reduction 51.2
TMDL Report: Tampa Bay Tributaries Basin, Hillsborough River, WBID 1443E, Total/Fecal Coliform
Florida Department of Environmental Protection
32
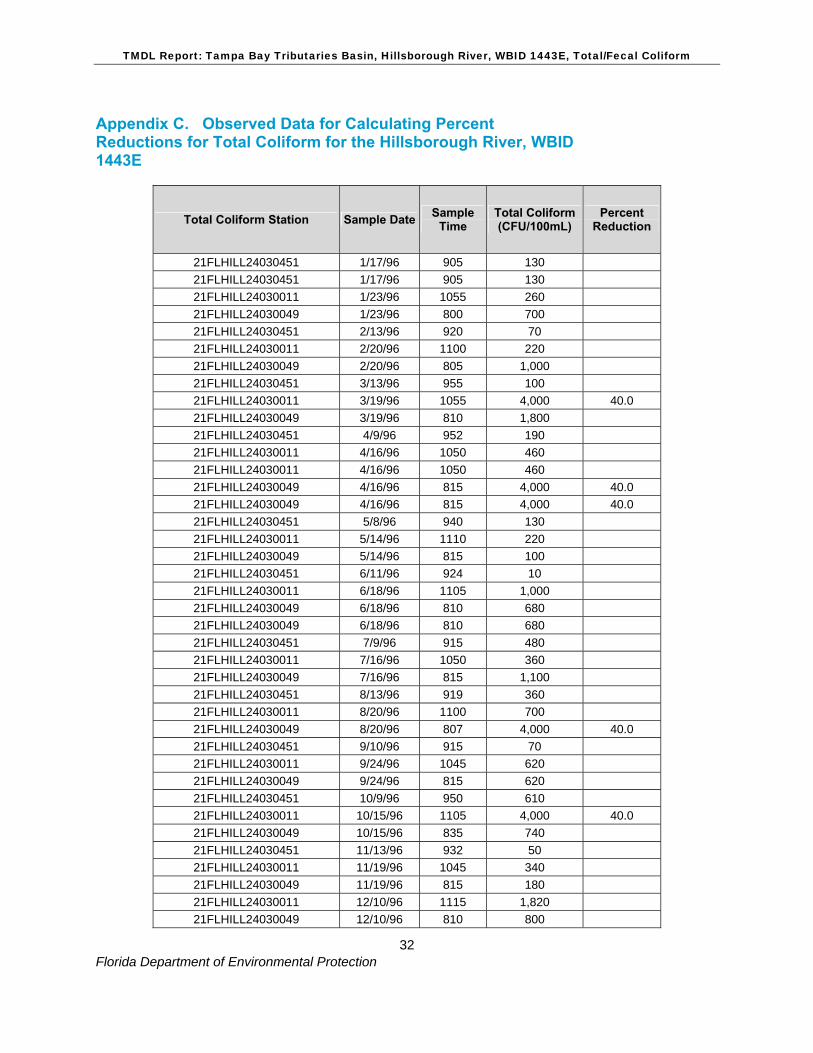
Appendix C. Observed Data for Calculating Percent Reductions for Total Coliform for the Hillsborough River, WBID 1443E
Total Coliform Station Sample Date Sample Time
Total Coliform (CFU/100mL)
Percent Reduction
21FLHILL24030451 1/17/96 905 130 21FLHILL24030451 1/17/96 905 130 21FLHILL24030011 1/23/96 1055 260 21FLHILL24030049 1/23/96 800 700 21FLHILL24030451 2/13/96 920 70 21FLHILL24030011 2/20/96 1100 220 21FLHILL24030049 2/20/96 805 1,000 21FLHILL24030451 3/13/96 955 100 21FLHILL24030011 3/19/96 1055 4,000 40.0 21FLHILL24030049 3/19/96 810 1,800 21FLHILL24030451 4/9/96 952 190 21FLHILL24030011 4/16/96 1050 460 21FLHILL24030011 4/16/96 1050 460 21FLHILL24030049 4/16/96 815 4,000 40.0 21FLHILL24030049 4/16/96 815 4,000 40.0 21FLHILL24030451 5/8/96 940 130 21FLHILL24030011 5/14/96 1110 220 21FLHILL24030049 5/14/96 815 100 21FLHILL24030451 6/11/96 924 10 21FLHILL24030011 6/18/96 1105 1,000 21FLHILL24030049 6/18/96 810 680 21FLHILL24030049 6/18/96 810 680 21FLHILL24030451 7/9/96 915 480 21FLHILL24030011 7/16/96 1050 360 21FLHILL24030049 7/16/96 815 1,100 21FLHILL24030451 8/13/96 919 360 21FLHILL24030011 8/20/96 1100 700 21FLHILL24030049 8/20/96 807 4,000 40.0 21FLHILL24030451 9/10/96 915 70 21FLHILL24030011 9/24/96 1045 620 21FLHILL24030049 9/24/96 815 620 21FLHILL24030451 10/9/96 950 610 21FLHILL24030011 10/15/96 1105 4,000 40.0 21FLHILL24030049 10/15/96 835 740 21FLHILL24030451 11/13/96 932 50 21FLHILL24030011 11/19/96 1045 340 21FLHILL24030049 11/19/96 815 180 21FLHILL24030011 12/10/96 1115 1,820 21FLHILL24030049 12/10/96 810 800

TMDL Report: Tampa Bay Tributaries Basin, Hillsborough River, WBID 1443E, Total/Fecal Coliform
Florida Department of Environmental Protection
33
Total Coliform Station Sample Date Sample Time
Total Coliform (CFU/100mL)
Percent Reduction
21FLHILL24030451 12/17/96 920 30 21FLHILL24030451 1/14/97 910 340 21FLHILL24030011 1/21/97 1045 340 21FLHILL24030049 1/21/97 800 160 21FLHILL24030451 2/11/97 915 210 21FLHILL24030011 2/18/97 1045 1,180 21FLHILL24030049 2/18/97 810 280 21FLHILL24030451 3/11/97 937 120 21FLHILL24030011 3/18/97 1120 4,000 40.0 21FLHILL24030049 3/18/97 835 220 21FLHILL24030451 4/8/97 945 530 21FLHILL24030011 4/15/97 1041 4,000 40.0 21FLHILL24030049 4/15/97 825 860 21FLHILL24030451 5/13/97 920 150 21FLHILL24030011 5/20/97 1050 300 21FLHILL24030049 5/20/97 815 80 21FLHILL24030451 6/10/97 915 300 21FLHILL24030011 6/17/97 1209 140 21FLHILL24030049 6/17/97 850 20 21FLHILL24030451 7/15/97 922 110 21FLHILL24030011 7/22/97 1130 180 21FLHILL24030049 7/22/97 820 140 21FLHILL24030451 8/12/97 945 60 21FLHILL24030011 8/19/97 1105 300 21FLHILL24030049 8/19/97 815 800 21FLHILL24030451 9/9/97 944 30 21FLHILL24030011 9/16/97 1055 340 21FLHILL24030049 9/16/97 830 180 21FLHILL24030451 10/7/97 858 200 21FLHILL24030011 10/14/97 1105 180 21FLHILL24030049 10/14/97 815 220 21FLHILL24030451 11/12/97 942 80 21FLHILL24030011 11/18/97 1135 200 21FLHILL24030049 11/18/97 825 420 21FLHILL24030451 12/3/97 908 990 21FLHILL24030011 12/9/97 1035 280 21FLHILL24030049 12/9/97 810 360 21FLHILL24030451 1/13/98 920 1,080 21FLHILL24030011 1/20/98 1025 200 21FLHILL24030049 1/20/98 820 320 21FLHILL24030451 2/10/98 910 930 21FLHILL24030011 2/17/98 1105 4,000 40.0 21FLHILL24030049 2/17/98 805 4,000 40.0 21FLHILL24030451 3/10/98 925 150

TMDL Report: Tampa Bay Tributaries Basin, Hillsborough River, WBID 1443E, Total/Fecal Coliform
Florida Department of Environmental Protection
34
Total Coliform Station Sample Date Sample Time
Total Coliform (CFU/100mL)
Percent Reduction
21FLHILL24030011 3/17/98 1035 120 21FLHILL24030049 3/17/98 810 360 21FLHILL24030451 4/14/98 930 60 21FLHILL24030011 4/21/98 1130 80 21FLHILL24030049 4/21/98 805 4,000 40.0 21FLHILL24030451 5/12/98 924 90 21FLHILL24030011 5/19/98 1150 680 21FLHILL24030049 5/19/98 850 60 21FLHILL24030451 6/9/98 928 20 21FLHILL24030011 6/16/98 1035 1,240 21FLHILL24030049 6/16/98 802 260 21FLHILL24030451 7/14/98 900 110 21FLHILL24030011 7/21/98 1034 660 21FLHILL24030049 7/21/98 805 4,000 40.0 21FLHILL24030451 8/11/98 932 270 21FLHILL24030011 8/25/98 1038 240 21FLHILL24030049 8/25/98 806 400 21FLHILL24030451 9/8/98 930 2,000 21FLHILL24030011 9/15/98 1147 120 21FLHILL24030049 9/15/98 820 1,360 21FLHILL24030451 10/13/98 936 80 21FLHILL24030011 10/20/98 1035 380 21FLHILL24030049 10/20/98 812 1,720 21FLHILL24030451 11/9/98 925 280 21FLHILL24030011 11/17/98 1058 220 21FLHILL24030049 11/17/98 823 1,240 21FLHILL24030451 12/2/98 927 30 21FLHILL24030011 12/8/98 1040 400 21FLHILL24030049 12/8/98 810 320
21FLHILL002 1/12/99 930 90 21FLHILL105 1/19/99 1100 540 21FLHILL137 1/19/99 815 120 21FLHILL002 2/9/99 935 110 21FLHILL105 2/16/99 1110 560 21FLHILL137 2/16/99 811 1,200 21FLHILL002 3/9/99 935 50 21FLHILL105 3/16/99 1100 1,600 21FLHILL137 3/16/99 807 1,300 21FLHILL002 4/13/99 940 10 21FLHILL105 4/20/99 1107 340 21FLHILL137 4/20/99 812 140 21FLHILL002 5/11/99 940 60 21FLHILL105 5/18/99 1115 380 21FLHILL137 5/18/99 813 500
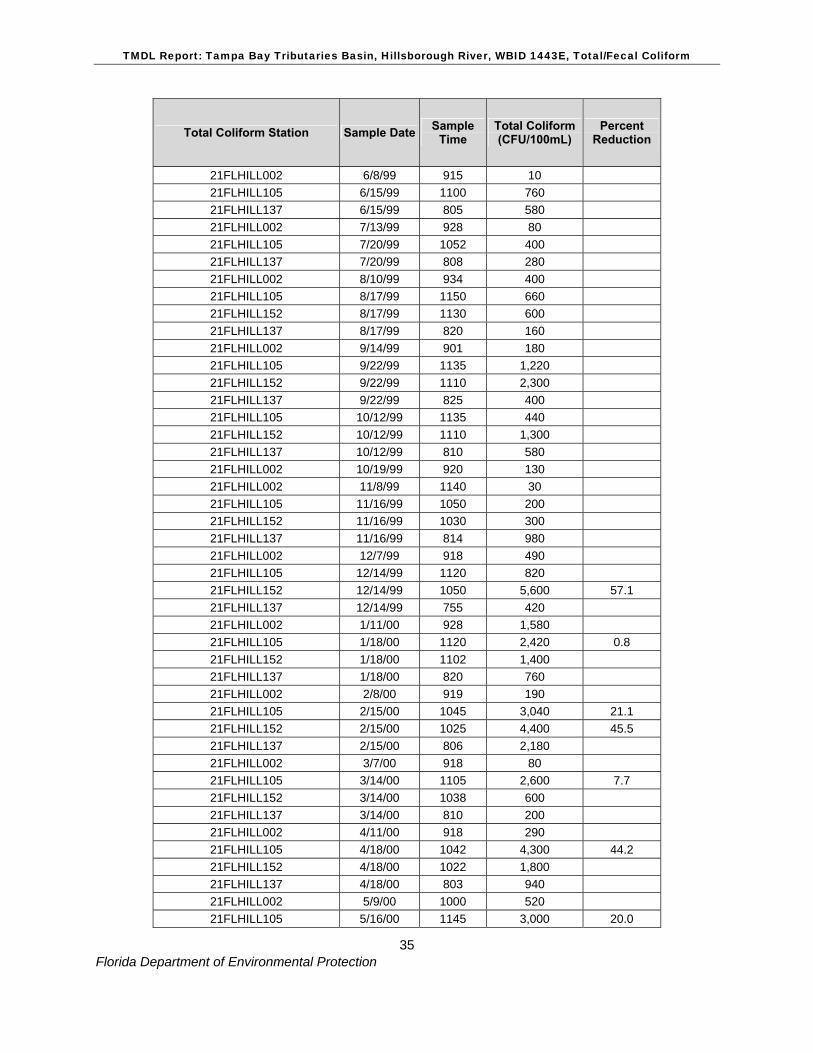
TMDL Report: Tampa Bay Tributaries Basin, Hillsborough River, WBID 1443E, Total/Fecal Coliform
Florida Department of Environmental Protection
35
Total Coliform Station Sample Date Sample Time
Total Coliform (CFU/100mL)
Percent Reduction
21FLHILL002 6/8/99 915 10 21FLHILL105 6/15/99 1100 760 21FLHILL137 6/15/99 805 580 21FLHILL002 7/13/99 928 80 21FLHILL105 7/20/99 1052 400 21FLHILL137 7/20/99 808 280 21FLHILL002 8/10/99 934 400 21FLHILL105 8/17/99 1150 660 21FLHILL152 8/17/99 1130 600 21FLHILL137 8/17/99 820 160 21FLHILL002 9/14/99 901 180 21FLHILL105 9/22/99 1135 1,220 21FLHILL152 9/22/99 1110 2,300 21FLHILL137 9/22/99 825 400 21FLHILL105 10/12/99 1135 440 21FLHILL152 10/12/99 1110 1,300 21FLHILL137 10/12/99 810 580 21FLHILL002 10/19/99 920 130 21FLHILL002 11/8/99 1140 30 21FLHILL105 11/16/99 1050 200 21FLHILL152 11/16/99 1030 300 21FLHILL137 11/16/99 814 980 21FLHILL002 12/7/99 918 490 21FLHILL105 12/14/99 1120 820 21FLHILL152 12/14/99 1050 5,600 57.1 21FLHILL137 12/14/99 755 420 21FLHILL002 1/11/00 928 1,580 21FLHILL105 1/18/00 1120 2,420 0.8 21FLHILL152 1/18/00 1102 1,400 21FLHILL137 1/18/00 820 760 21FLHILL002 2/8/00 919 190 21FLHILL105 2/15/00 1045 3,040 21.1 21FLHILL152 2/15/00 1025 4,400 45.5 21FLHILL137 2/15/00 806 2,180 21FLHILL002 3/7/00 918 80 21FLHILL105 3/14/00 1105 2,600 7.7 21FLHILL152 3/14/00 1038 600 21FLHILL137 3/14/00 810 200 21FLHILL002 4/11/00 918 290 21FLHILL105 4/18/00 1042 4,300 44.2 21FLHILL152 4/18/00 1022 1,800 21FLHILL137 4/18/00 803 940 21FLHILL002 5/9/00 1000 520 21FLHILL105 5/16/00 1145 3,000 20.0

TMDL Report: Tampa Bay Tributaries Basin, Hillsborough River, WBID 1443E, Total/Fecal Coliform
Florida Department of Environmental Protection
36
Total Coliform Station Sample Date Sample Time
Total Coliform (CFU/100mL)
Percent Reduction
21FLHILL152 5/16/00 1107 2,100 21FLHILL137 5/16/00 810 1,180 21FLHILL002 6/13/00 922 540 21FLHILL105 6/20/00 1140 6,600 63.6 21FLHILL152 6/20/00 1110 8,200 70.7
21FLGW 8499 6/20/00 930 7,500 68.0 21FLHILL137 6/20/00 815 8,600 72.1 21FLHILL002 7/11/00 940 20 21FLHILL105 7/18/00 1125 6,800 64.7 21FLHILL152 7/18/00 1100 5,000 52.0 21FLHILL137 7/18/00 805 800 21FLHILL002 8/9/00 935 80 21FLHILL105 8/15/00 1115 6,000 60.0 21FLHILL152 8/15/00 1045 8,600 72.1 21FLHILL137 8/15/00 800 1,600 21FLHILL002 9/12/00 930 60 21FLHILL105 9/19/00 1140 14,000 82.9 21FLHILL152 9/19/00 1115 6,800 64.7 21FLHILL137 9/19/00 810 7,500 68.0 21FLHILL105 10/10/00 1130 1,000 21FLHILL152 10/10/00 1100 2,500 4.0 21FLHILL137 10/10/00 820 500 21FLHILL002 10/17/00 950 330 21FLHILL002 11/7/00 905 80 21FLHILL105 11/14/00 1120 10,600 77.4 21FLHILL152 11/14/00 1100 2,000 21FLHILL137 11/14/00 820 1,300 21FLHILL002 12/6/00 940 250 21FLHILL152 12/12/00 1030 24,300 90.1 21FLHILL105 1/16/01 1100 600 21FLHILL152 1/16/01 1037 100 21FLHILL137 1/16/01 800 100 21FLHILL105 2/20/01 1111 1,200 21FLHILL152 2/20/01 1105 1,400 21FLHILL137 2/20/01 814 700 21FLHILL137 3/20/01 803 25,400 90.6 21FLHILL105 4/17/01 1145 7,700 68.8 21FLHILL152 4/17/01 1121 700 21FLHILL137 4/17/01 825 1,500 21FLHILL105 5/15/01 1110 4,900 51.0 21FLHILL152 5/15/01 1050 1,600 21FLHILL137 5/15/01 823 800 21FLHILL105 6/19/01 1205 15,200 84.2 21FLHILL152 6/19/01 1132 3,300 27.3

TMDL Report: Tampa Bay Tributaries Basin, Hillsborough River, WBID 1443E, Total/Fecal Coliform
Florida Department of Environmental Protection
37
Total Coliform Station Sample Date Sample Time
Total Coliform (CFU/100mL)
Percent Reduction
21FLHILL137 6/19/01 820 1,700 21FLHILL105 7/24/01 1114 14,400 83.3 21FLHILL152 7/24/01 1050 6,100 60.7 21FLHILL137 7/24/01 805 8,200 70.7 21FLHILL105 8/21/01 1112 2,800 14.3 21FLHILL152 8/21/01 1100 3,300 27.3 21FLHILL137 8/21/01 812 10,000 76.0 21FLHILL105 9/18/01 1124 5,200 53.8 21FLHILL152 9/18/01 1059 5,100 52.9 21FLHILL137 9/18/01 816 4,400 45.5 21FLHILL105 10/16/01 1101 10,100 76.2 21FLHILL152 10/16/01 1038 9,700 75.3 21FLHILL137 10/16/01 807 10,800 77.8 21FLHILL105 11/13/01 1123 8,300 71.1 21FLHILL152 11/13/01 1101 2,100 21FLHILL137 11/13/01 814 800 21FLHILL105 12/11/01 1127 6,100 60.7 21FLHILL152 12/11/01 1104 4,600 47.8 21FLHILL137 12/11/01 819 4,300 44.2 Median Percent Reduction 52.9


Florida Department of Environmental Protection Division of Water Resource Management
Bureau of Watershed Management 2600 Blair Stone Road, Mail Station 3565
Tallahassee, Florida 32399-2400 (850) 245-8561
www2.dep.state.fl.us/water/